1. Introduction
The transport sector has been one of the main emitters of greenhouse gases (GHG) that cause global warming, accounting for 25% of the overall emissions in Europe in 2017 [
1]. A high proportion of GHG emissions is attributed to road transport, which is responsible for 71% of the sector’s GHG emissions [
1]. In order to mitigate climate change, there are mandatory CO
2 emission targets for both light-duty [
2] and heavy-duty vehicles (HDVs) [
3]. The targets aim for an initial transition to low-carbon transport and subsequently to zero-carbon transport, with one of the means to this aim being the electrification of the fleet. There has been a trend towards this type of powertrain in light-duty vehicles, with 6.6% of the total sales in 2021 being hybrid, 9% plug-in hybrid, and 9.2% electric vehicles [
4].
However, the uptake in electric and hybrid vehicles in the heavy-duty sector has been slower, with lower fleet shares [
5]. Nevertheless, there has been a surge recently, with new registrations of electric lorries increasing fivefold by a notable 408.5%, 47.1% for electric buses, in the first quarter of 2023 [
6]. Overall fleet shares stand at 1.1% for electric lorries, 14.4% for electric buses, and 14.5% for hybrid buses [
6], indicating a substantial shift towards electrified powertrains. This was expected as targets for 2030 define that emissions must decrease by 30% compared to the reference period of July 2019–June 2020. This has raised an interest in the impact of electrified powertrains on heavy-duty vehicles and their capability to reduce CO
2 emissions.
The current study focused on hybrid lorries (N3 category) and city buses (M3 category) in Europe by investigating their performance with a simulation approach utilising the Vehicle Energy Consumption Calculation Tool (VECTO), which is the official tool of the European Commission for simulating CO
2 emissions from heavy-duty vehicles [
7]. The tool has been extended to hybrid powertrains by including various architectures, e.g., serial and parallel hybrids, energy management strategies, and electrified auxiliaries [
8]. The latter is essential, as many components that are powered by the internal combustion engine in conventional powertrains need to be electrified in hybrids. However, the most significant aspect of hybrid powertrains is the energy management strategy that defines the engagement of the internal combustion engine and the electric motor based on the power demands and battery state of charge. The tool’s accuracy has been validated and found to have a maximum error of 2.5% and 1.5% for fuel and electrical energy consumption, respectively [
9].
In this study, the primary objective was to evaluate the impact of incorporating hybrid technology into the powertrain of heavy-duty vehicles on CO
2 emissions. Specifically, the analysis focused on two categories of N3 lorries—HDV classes 4 and 5—as well as city buses of classes 31b1 and 35a, as classified in reference [
10]. The HDV classes under investigation include vehicles with a gross vehicle weight exceeding 16 tonnes and a 4 × 2 axle configuration. The rigid lorries fall under class 4, while tractor–trailers are classified as class 5. The city bus class 31b1 corresponds to a low-floor, single-deck vehicle, while 35a corresponds to an articulated version with similar chassis characteristics.
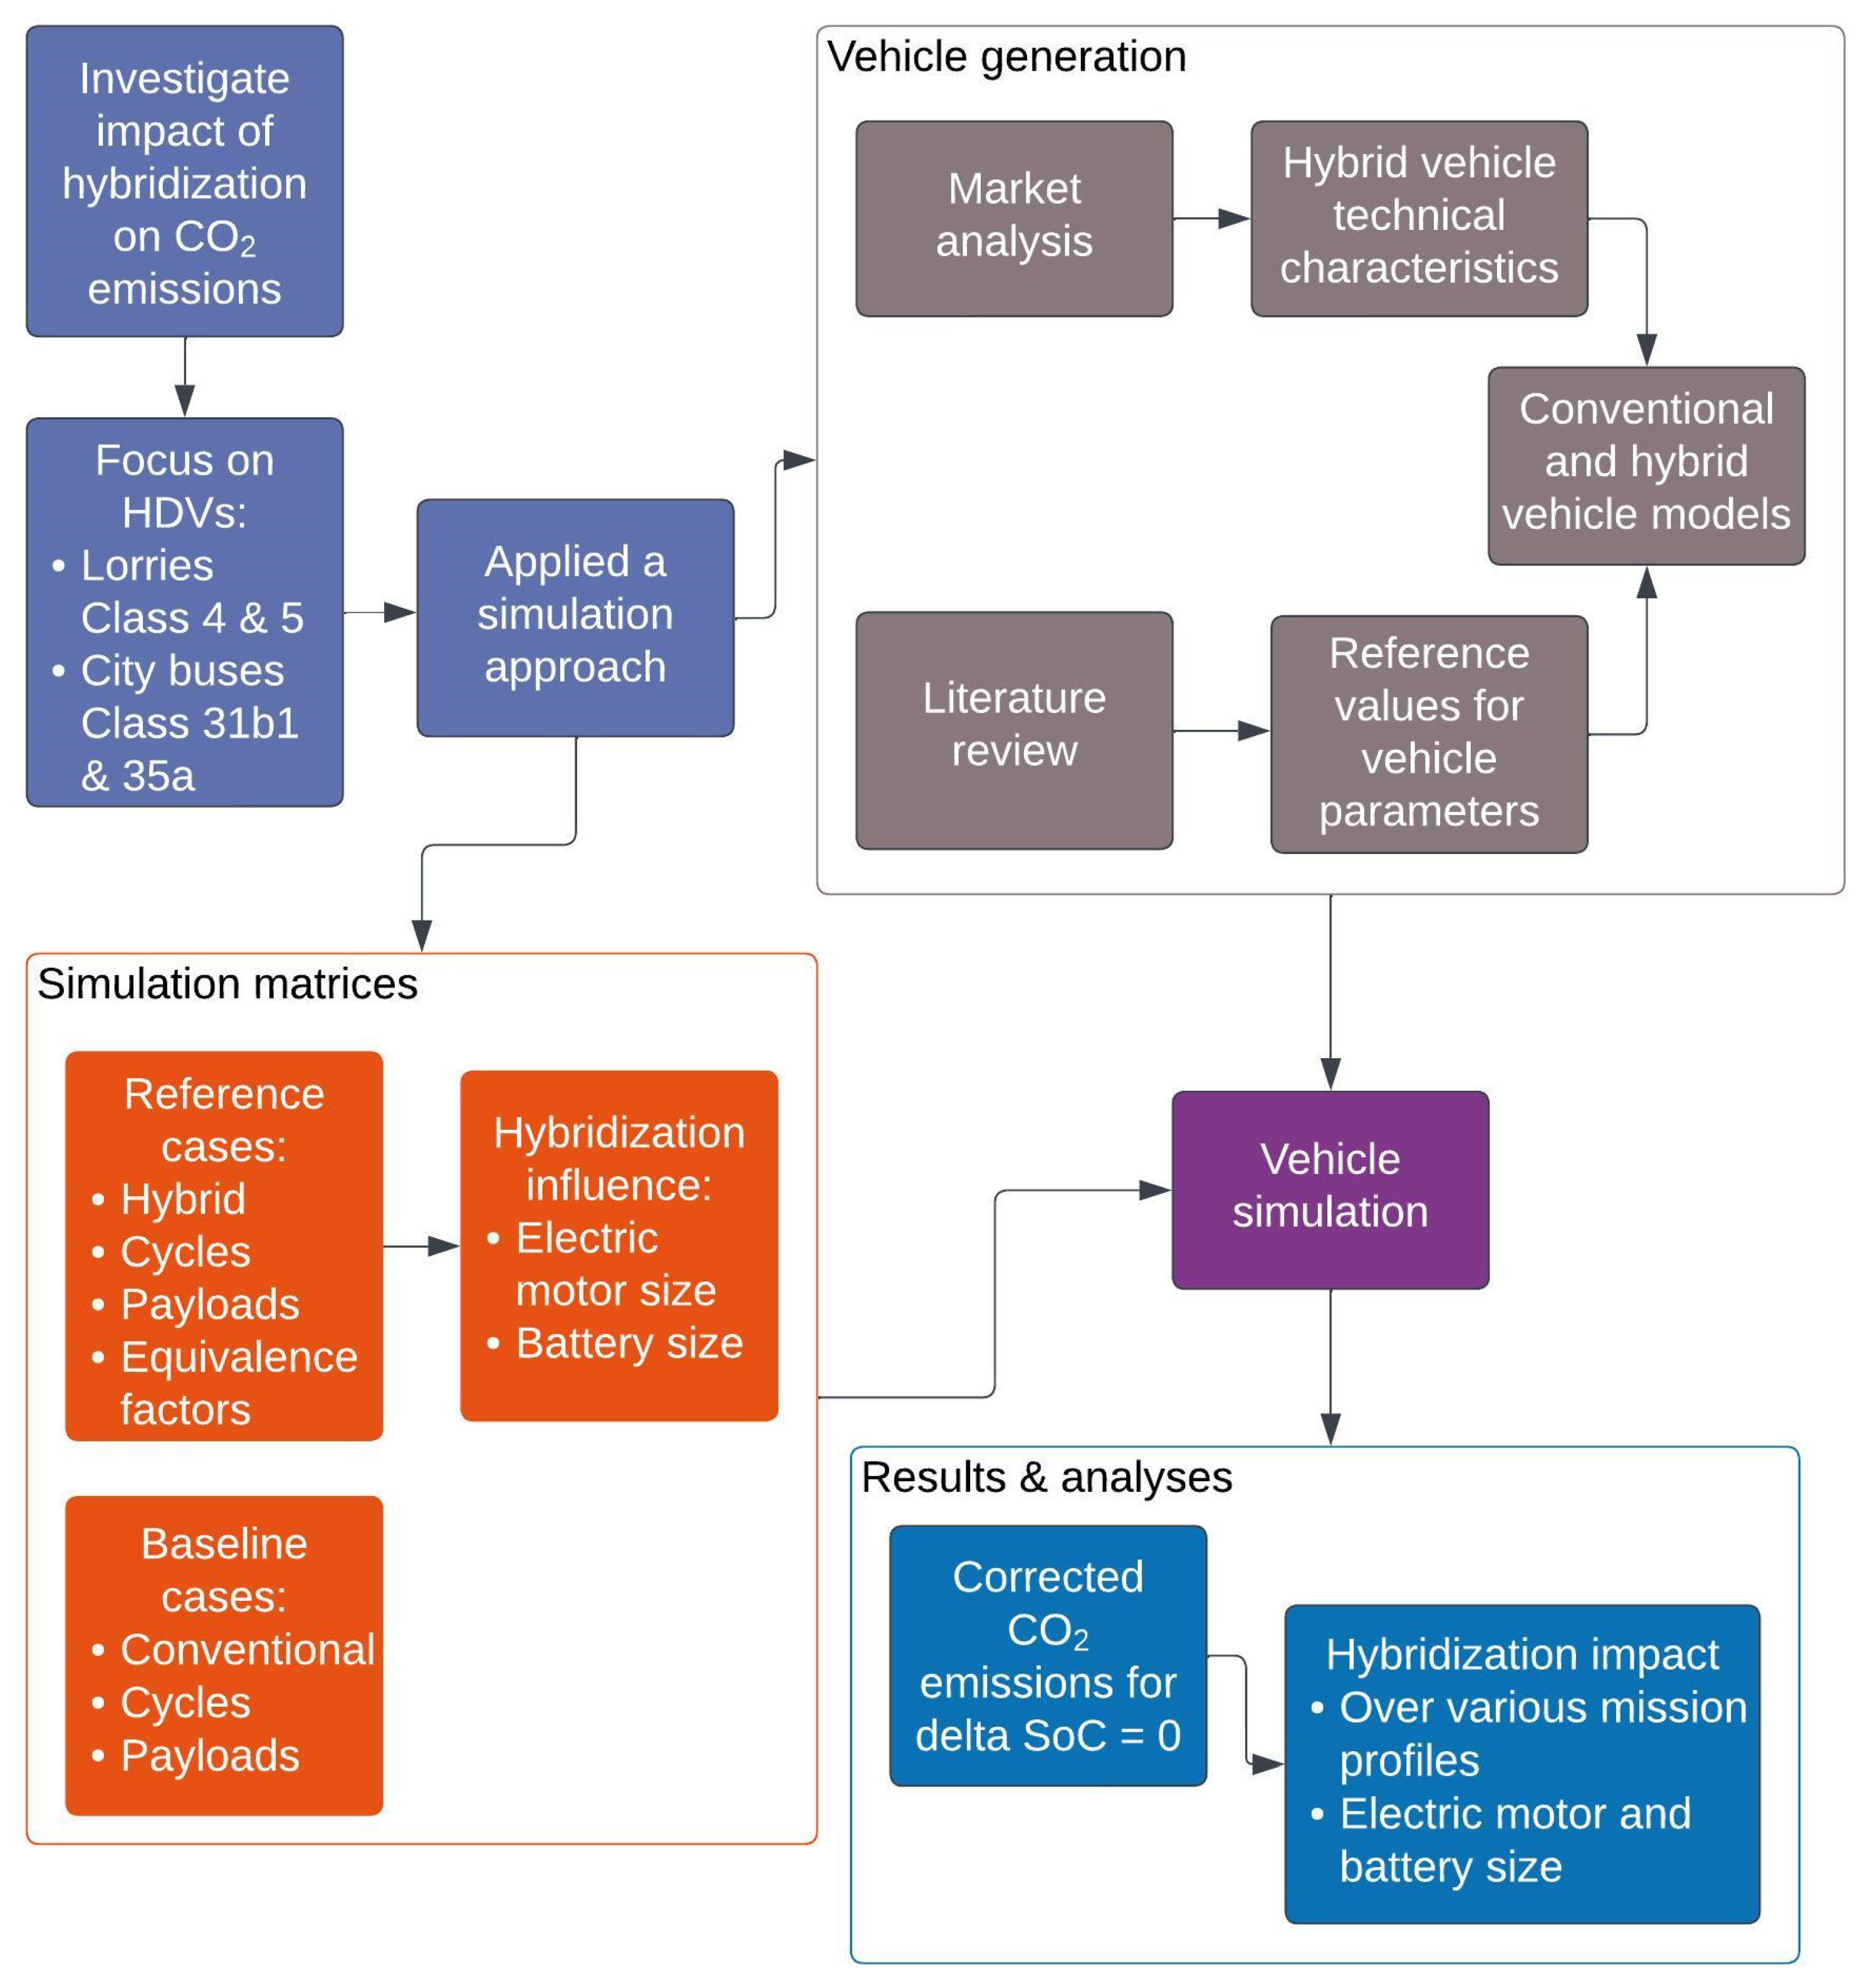
Regarding the hybridisation type, the focus was on vehicles without grid charging, i.e., plug-in hybrid vehicles were not included. The first step of the investigation was to obtain the technical characteristics of actual vehicles by realising a market analysis. Subsequently, the market analysis provided the basis for creating the reference vehicle models in the simulation tool, which comprised the reference cases. It was important for the simulated vehicle models to have characteristics that addressed the same needs as those of actual vehicles. Considering this, both conventional and hybrid versions of the vehicle models were created; the conventional versions were needed to establish a baseline. These steps established the base cases, which were used to perform further analyses on hybridisation.
The analyses on hybridisation investigated the impact of different parameters such as battery capacity, electric motor power, payload, and driving cycle on CO2 emissions. The aim was to identify potential changes that could deliver improved results. For this reason, a simulation matrix with different combinations of component properties was created to cover a wide range of cases.
Figure 1 presents an overview of the methodology, along with the performed analyses.
The following paragraphs present (a) the representative vehicle characteristics based on the findings of the vehicle market analysis, (b) the model creation approach in VECTO, (c) simulation case matrices, and (d) applied analyses and results. Unless noted otherwise, for the needs of the current study, the term “base case” refers to the conventional vehicle counterparts, whereas “reference case” refers to the hybrid vehicles that are representative of the actual vehicle market.
2. Materials and Methods
2.1. Market Analysis and Proposed Vehicle Characteristics
The market analysis identified the technical characteristics that are representative of commercially available hybrid vehicles; detailed analysis is presented in
Appendix A.1. Taking this into consideration, a series of simulation models were generated with representative internal combustion engine (ICE) and electric motor (EM) power and battery capacities.
Table 1 presents the simulation cases for lorries and city buses along with the hybrid technical characteristics. It should be noted that these cases do not correspond to the actual vehicles. Only their powertrain characteristics are representative of the actual vehicle, whereas other vehicle properties are based on fleet average values, e.g., rolling resistance (RRC) and aerodynamic drag area (CdA) are representative values of the vehicle fleet [
11]. Moreover, there are several parameters without publicly available data such as the electric motor and gearbox efficiency. For these parameters, their values were determined based on the provisions of the respective regulation [
10]—if available—or from the scientific literature.
Regarding the architecture, parallel hybrid models had a P2 topology, meaning that the EM was connected between the clutch and the gearbox. Since all models deployed this topology, they are referred to simply as “parallel” from now on.
In the context of HDVs, the classification is based on the primary characteristics of their chassis, including factors like the number of axles and the gross vehicle mass. However, a more detailed categorisation is also employed, taking into account additional parameters such as engine power and cabin size. This subgroup classification is crucial as it addresses the variation in vehicle usage within the same HDV class. For instance, two vehicles classified under HDV class 4 may have distinct purposes; one might be a more powerful vehicle used for long-haul trips, while the other could be less powerful and primarily deployed for urban delivery tasks. Despite sharing the same HDV class, these vehicles serve different functions and, consequently, their emission profiles may vary significantly.
To address this variability and accurately assess CO
2 emissions, regulation [
10] outlines a standardised approach. All vehicles within a particular HDV class undergo simulations over identical mission profiles. Following the simulations, a weighted CO
2 emission value is assigned to the vehicles, with the respective weights being determined based on the vehicle’s subgroup classification [
3,
12]. This ensures that each vehicle’s emissions are appropriately represented, accounting for their unique characteristics and usage scenarios.
Table 1 presents the hybrid powertrain cases that were investigated, but it was required to set a conventional powertrain baseline to perform comparisons. For this reason, a conventional counterpart was created for each simulation case. The conventional counterpart had the same ICE power as the hybrid version, while the same gearbox as that in the parallel architectures was selected. Serial vehicles deployed a single gear.
2.2. Simulation Model Creation
2.2.1. Simulation Input Description
The simulation model development took place by generating the required VECTO inputs, which are separated into three main categories. In the Vehicle category, the main vehicle characteristics are described, such as curb mass, wheel radius, tyre rolling resistance, and aerodynamic drag coefficient. In the case of hybrid and electric vehicles, this category also contains information about the electrified powertrain, such as electric motor and battery sizes. The second category, Engine, contains all the information for the ICE. Gearbox, the third category, describes the drivetrain parameters such as transmission type, gear ratios, and efficiency.
Several other parameters are used in the simulation and are described in separate fields beyond the aforementioned categories. Several of those parameters could retain default values as they are considered representative of conditions in Europe, such as the vehicle acceleration curve indicating the driving style. Other parameters, such as auxiliary usage, need to be adjusted to properly reflect the simulation cases. In this context, the simulation also requires a mission profile—a term denoting the driving cycle with an allocated payload—and auxiliary power consumption.
The target speed profile and road grade describe the simulated driving cycles as a function of travelled distance. VECTO contains the official driving cycles for each vehicle category that represent vehicle use in Europe. For the lorries considered in this study, there are the Urban Delivery, Regional Delivery, and Long-Haul cycles, while for the buses, there are the Urban, Suburban, and Heavy Urban cycles. The mission profile is completed with the allocation of the payload with two official values, low and reference, which are determined based on the vehicle type.
Figure 2 and
Figure 3 present the speed and grade profiles by driving cycle for lorries and buses, respectively.
The vehicles were simulated over all the mission profiles, and the average weighted CO
2 emissions were calculated utilising the respective weighting factors from Regulation (EU) 2019/1242 for lorries [
3] and the European Commission’s proposal for buses [
12].
Table A4 in
Appendix A provides the respective mission profile weights.
The selection of inputs corresponded to average European values, e.g., average curb vehicle weight and rolling resistance coefficient values. Some of the parameters, such as the engine capacity and power, are publicly available; however, others are not disclosed for confidentiality reasons, e.g., engine fuel maps. For these cases, alternative approaches were needed to obtain these data.
Section 2.2.2 describes the approaches used to define the input values for the vehicle’s chassis, drivetrain, and conventional powertrain parameters. On the other hand,
Section 2.2.3 focuses on hybrid components and their inputs.
2.2.2. Vehicle and Conventional Powertrain Components
The components corresponding to the Vehicle category correspond to average European vehicles, and the respective inputs were retrieved from the literature, or calculated if needed. For the lorries, there was plenty of information as the manufacturers were required to report vehicle sales and CO
2 emissions for a period between June 2019 and July 2020 to set reference values. In this way, utilising the respective report from the Joint Research Centre [
11], several values were derived as average or weighted average, e.g., curb mass and rolling resistance coefficients. For the buses, the generic VECTO city buses were utilised as a basis to structure the simulation cases further. Regarding the Engine category, the respective parameters were based on the market analysis findings. Additional data such as fuel maps and full load curves were calculated whenever required.
Table 2 presents the inputs for each category, which, for lorries, were derived from the literature, and, for city buses, from the VECTO generic values. All of the vehicles deployed an Automated Manual Transmission (AMT) gearbox type, as this is solely used in the European Union [
11]. Although the battery and EM size affect the vehicle mass, the presented values correspond to reference vehicles. In cases where the battery and the EM change, the vehicle mass is adjusted accordingly.
Some of the parameters belonging to the Engine and Gearbox categories were calculated based on a series of component models [
13]. The authors applied this methodology mainly to lorries, but another study also applied it to buses, where the divergence in measurement data was between −1.6 and 3.2% [
14]. The component models make use of limited data to produce the required VECTO input, which in this case was the engine fuel map, fuel load curve, and gearbox efficiency maps.
2.2.3. Hybrid Components
The main hybrid components are the electric motor and the battery. These components are described with the use of efficiency maps and performance curves in a similar way as other components. Depending on the vehicle architecture, i.e., serial or parallel, there are additional parameters that need adjustment. For the parallel hybrids, the equivalence factor (EF) sets an approximation of the energy management strategy by controlling battery charge and discharge. It is important to attribute an EF value that would deliver a delta battery state of charge (SoC) equal to 0 at the end of the cycle [
8]. If there is a delta SoC ≠ 0, VECTO applies an ex-post correction, which was evaluated in a previous study [
9]. The same applies to serial hybrids, although vehicle propulsion comes solely from the electric motor without any contribution from the ICE, rendering the EF value less relevant. In this architecture, a generator set (GenSet) was added, which is a combination of the ICE and a secondary electric motor—not the one used in vehicle propulsion—for producing electricity. Subsequently, the generator charges the battery that, in turn, powers the EM. In this way, the GenSet runs at an optimum speed, which results in high efficiency and lower emissions, generating electricity that charges the battery and propels the vehicle [
8].
The following paragraphs describe the approaches to characterise these components.
2.3. Electric Motor
The EM is described similarly to the ICE: an efficiency map and an operation limit curve. The efficiency map—in this case, the electric power consumption map—is a grid of operating points in an engine speed and torque cartesian system in which each point has an electric energy consumption value. The EM operation limits were set with the max drive and max generation torque curves as the full load curve is in an ICE. In addition, the drag torque curve indicates the motor drag when it is not producing power but is set in rotation due to the vehicle speed, such as when under motoring conditions.
Figure 4 presents the VECTO interface of the inputs for the electric motor, along with an example of an energy consumption map and max drive torque curves.
The EM energy consumption map was created based on the provisions for a generic map from Regulation (EU) 2022/1379 [
10], which requires EM-rated power and speed. The regulation deploys an approach where a normalised grid of operating points is denormalised according to the specific EM characteristics. In this way, energy consumption maps were created for each simulation case based on the rated power values as they are indicated in
Table 1. The rated speed was considered the same as in the VECTO generic EM and was equal to 1100 RPM. The drag torque is produced similarly according to the regulation [
10].
The max drive torque curve was generated by normalising the VECTO generic curve as shown in Equation (1), which results in a normalised curve.
x: parameter, either speed (RPM) or power (kW);
xi: parameter value (RPM or kW);
xrated: parameter rated value (RPM or kW);
xnorm: parameter normalised value (-).
Subsequently, the values are denormalised for each specific EM case by multiplying the normalised curve values with the EM-rated power and speed.
For the mass adjustment for different EM power values, the EM power values of the vehicles presented in
Table 1 were considered to constitute a reference mass for the specific vehicle. In the cases where these vehicles deployed different EMs, the vehicle mass was adjusted based on Equation (2) according to [
8].
Mem: additional mass of the EM;
Pem: actual EM power (kW);
Pem_ref: power of the reference EM (kW).
2.4. Battery
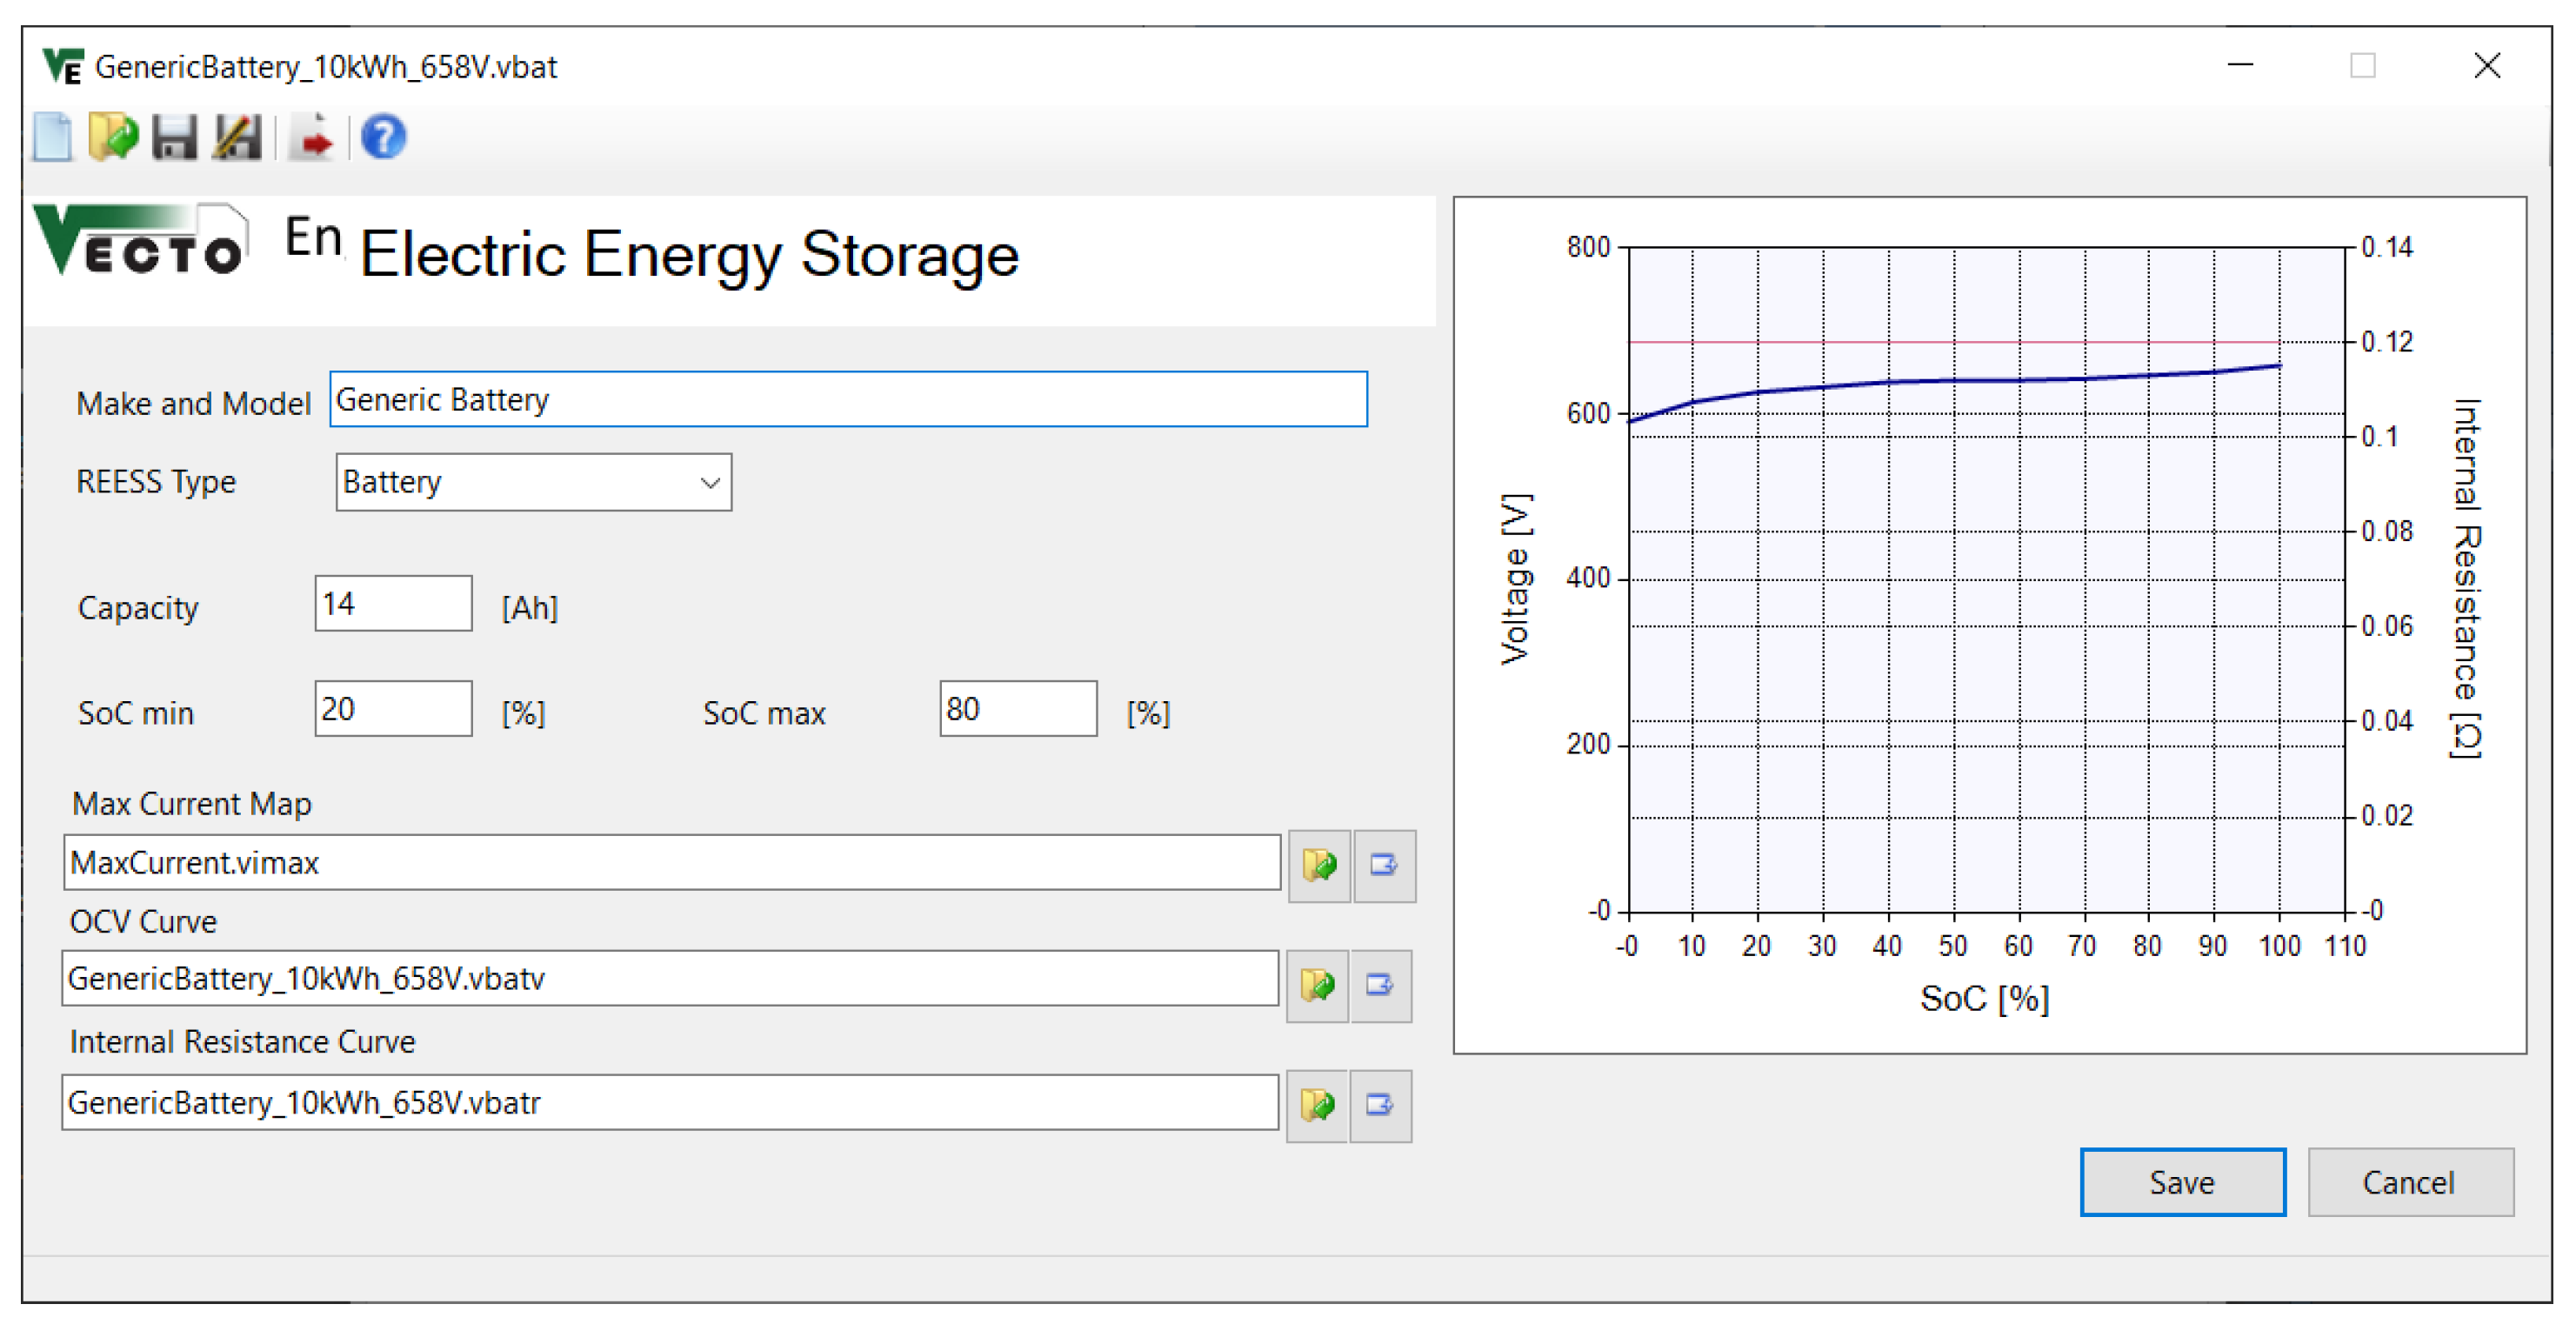
The VECTO battery inputs require capacity, a minimum and maximum SoC, a max current map, the Open Circuit Voltage (OCV), and internal resistance curves.
Figure 5 presents an example of the generic battery inputs in VECTO. The VECTO generic battery was used to generate the battery cases. Most of the generic parameters were retained, but some needed to be scaled to represent the different battery capacities properly.
The first parameter to be adjusted was the capacity, which was required in Ah. The conversion from kWh to Ah was carried out for each case by dividing the capacity in kWh with the voltage for SoC equal to 50% from the OCV curve. Subsequently, the second parameter was the internal resistance curve, which was linearly scaled to the new battery capacity. It should be noted that the state of health of the battery was 100% without any deterioration; therefore, actual capacity equalled the nominal value.
The battery capacity affects its mass and it is also one of the limiting factors of electrification. For this reason, as in the EMs, we needed to adjust the vehicle mass depending on the capacity in each case by applying Equation (3) as described in [
8].
Mbat: additional mass of the battery;
Cbat: actual battery capacity (kWh);
Cbat_ref: capacity of the reference battery (kWh).
2.5. Serial and Parallel Architecture
The two architectures require different handling, as the serial deploys a GenSet input, while parallel powertrains need an EF value to define the energy management strategy.
In the serial architecture, vehicle propulsion comes solely from the EM powered by a battery, which is charged by a GenSet. The GenSet comprises an ICE coupled to an EM that produces the current for charging the battery. For these cases, the ICE inputs are described in
Section 2.2.2, while the EM inputs were generated according to regulation [
10] as in the EM used in propulsion. However, in these cases, the EM-rated speed was matched to the rated speed of the ICE to ensure that the two components optimally function together.
Parallel hybrids utilise both the ICE and the EM to propel the vehicle. The overall interaction is quite complex in cases where the vehicle is propelled solely by one or both, while the ICE could simultaneously charge the battery. The process of deciding the best practice in actual vehicle operation is handled by the energy management strategy, which was determined by the manufacturer. VECTO is required to assess an energy management strategy to perform hybrid vehicle simulations successfully. Regarding this issue, the solution was to utilise the battery SoC as a decision parameter for powertrain utilisation and an equivalence factor to opt for battery charge and discharge. Depending on those parameters, the battery SoC at the end of the simulation could be different than at the beginning of the simulation, indicating an energy gap. For this reason, VECTO applies a correction for delta SoC equal to 0%. Bitsanis et al. [
9] proposed a starting EF value of 2.5 and provided a detailed description of the correction in a relative publication, which has been integrated into VECTO. Although the ex-post correction has been evaluated [
8], in the current exercise, we performed a brief investigation to demonstrate the effect of different EF values.
Figure 6 presents the development of the SoC for the investigated EF range in hybrid lorries.
The HDV class 4 vehicles showed behaviour more consistent with that of the delta SoC, ranging between −10% and 10% for all cycles and payloads. However, the HDV class 5 showed a wider range, from −30% to about 15%, while in some cases, the EF range could not deliver a delta SoC equal to 0%.
Despite the difference in delta SoC, the resulting difference in CO2 was in the order of 1% when compared to the EF value that delivers delta SoC = 0. VECTO applied the correction on the CO2 emission values and the analysis confirmed that the VECTO correction is quite effective in balancing out the energy provided by the battery. Regardless of the VECTO correction, all the results presented for parallel hybrids in the current exercise were calculated based on the EF value that delivers delta SoC equal to zero. There was a case where the EF did not reach 0 and needed different charge and discharge factors instead of a single EF value. However, the VECTO fuel consumption correction was found to deliver accurate results as with a single EF. For this reason, it was not considered significant to include this analysis in the current work.
2.6. Simulation Matrices
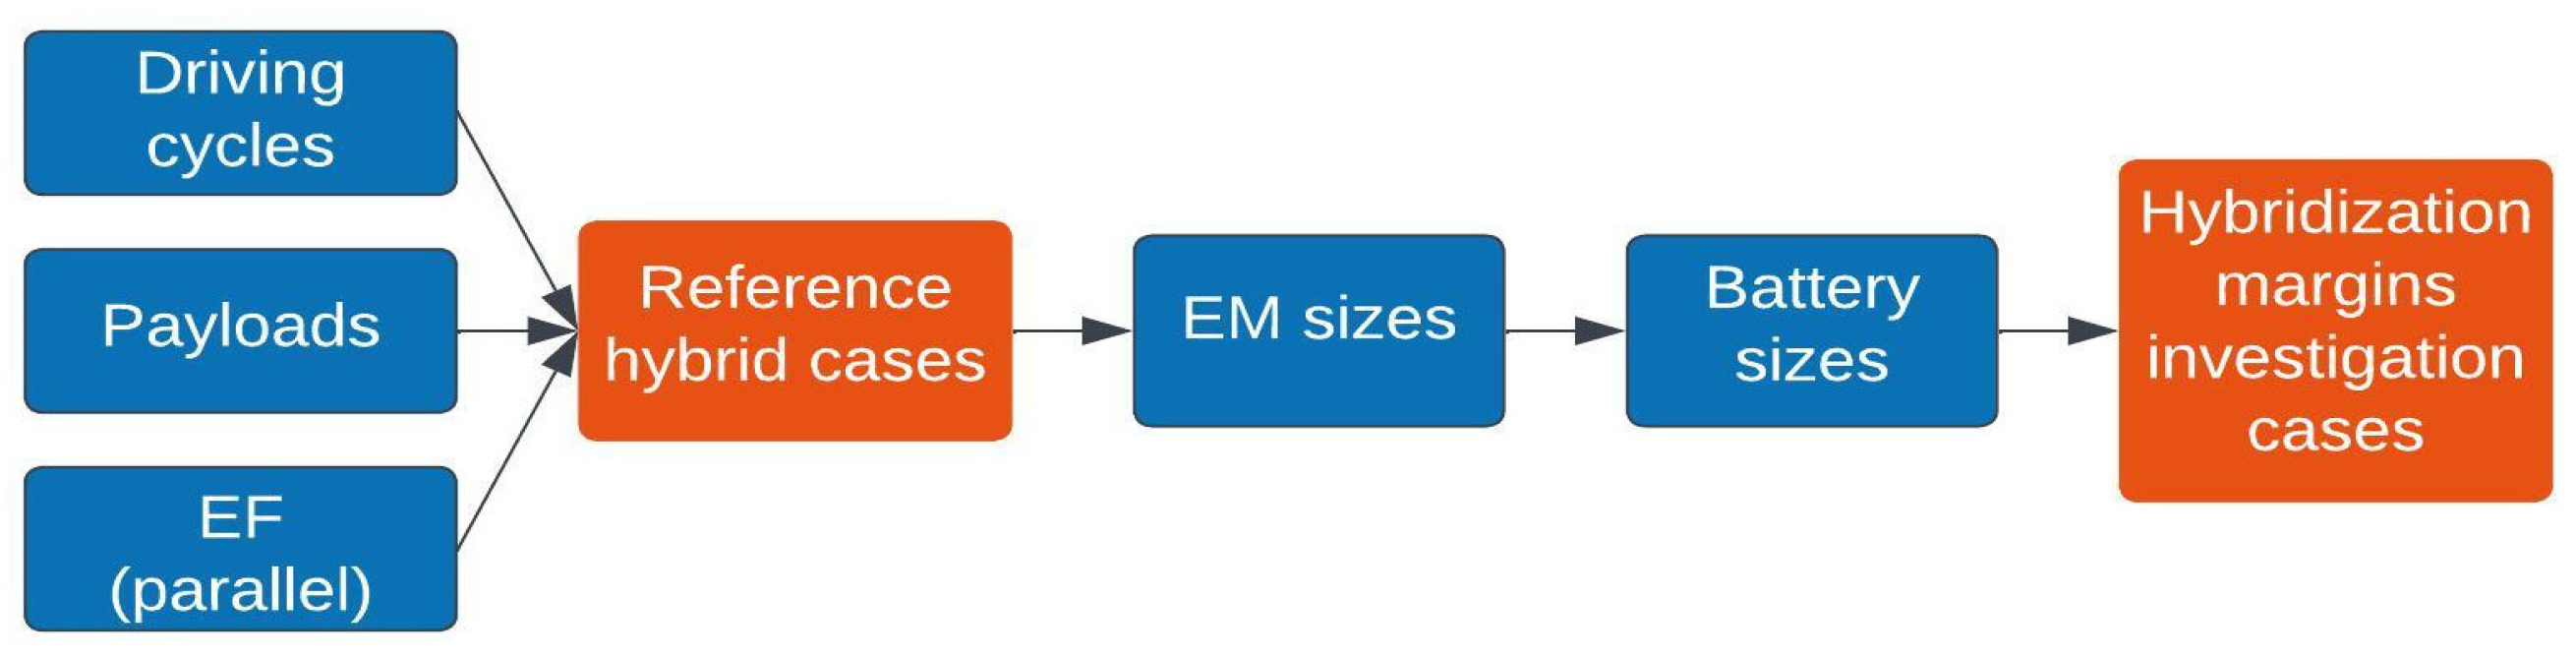
The simulation cases focused initially on the variations in payloads by mission profile, while the parallel hybrids also included EF. This initial plan provided a reference behaviour of hybrid vehicles that share representative characteristics with market-available vehicles. Subsequently, the effect of different EM and battery sizes was investigated by further expanding the simulation matrix.
Figure 7 presents a flowchart of the simulation case generation, which was applied to each vehicle.
To summarise, the following values were used for the base cases:
Driving cycles;
Lorries: Urban Delivery, Regional Delivery, Long-Haul;
Buses: Urban, Suburban, Heavy Urban;
Payloads: low and reference, exact payload values depending on vehicle type, and mission profile as shown in
Table A3 in
Appendix A.2 [
3];
EF values for parallel architecture cases: 2.0, 2.5, 3.0, 3.5, 4.0.
For the investigation of the hybridisation margin, a series of cases were produced by adjusting a series of parameters on top of the base cases. The relative parameters were as follows:
Based on the simulation matrix, there were 30 reference cases for each lorry, which rose to 180 when the EM and battery sizes were taken into account. Subsequently, for the buses, there were 6 reference cases for serial architectures and 30 for parallel architectures. These expanded further to 54 and 270, respectively, when considering EM and battery sizes cases.
2.7. Hybrid Powertrain Performance Analyses
The initial analyses in the reference cases focused on the effect of the EF in parallel hybrids. However, as it was found, the impact was negligible due to the applied VECTO correction; no further analyses were performed on the EF. Despite the effect being insignificant, all the CO2 emission values were adjusted for the EF value that delivers delta SoC = 0. All the presented values regarding parallel hybrids were corrected in this way.
The next analysis was the comparison of hybrid vehicle performance with their conventional counterparts; the baseline cases. This analysis was important to highlight cases where the hybrid effect was more prominent and where it was reduced. Subsequently, the EM and battery size sensitivity analysis indicated for which cases there is still the potential for further reductions in CO2 emissions. Further analyses on the energy distribution in the vehicle contributed to this end. In addition, buses deployed both serial and parallel architectures that offered an opportunity to compare the performance and powertrain efficiency of the two architectures.
3. Results
3.1. Reference Case Analyses
The analysis’s initial phase involved comparing hybrid vehicles and their conventional counterparts. The results showed a significant reduction in CO
2 emissions, but the extent of the reductions varied among the different vehicle subgroups, as shown in
Figure 8. As mentioned earlier, the presented emission values for each vehicle subgroup represent the weighted average of the VECTO mission profiles.
The analysis showed notable emission reduction benefits for different applications within HDV class 4 and class 5 categories. Among HDV class 4 vehicles, the Urban Delivery (4-UD) application showed the highest improvement, achieving a 15.9% reduction in emissions. Next, the Regional Delivery (4-RD) application exhibited a reduction, albeit at a lower rate of 4.8%. Conversely, the Long-Haul application (4-LH) demonstrated the lowest improvement, with emissions reduced by a limited 2.7%.
Moving on to HDV class 5, the trends in emission reductions were similar. The Regional Delivery (5-RD) application resulted in an overall improvement of 4.5%. Comparatively, the Long-Haul application (5-LH) achieved a moderate reduction, with emissions lowered by 1.6%.
The observed difference can be attributed to Urban Delivery, which is characterised by its high level of transience, including frequent acceleration and deceleration, as well as elevated road grade values. These factors created more opportunities for energy recuperation, contributing to a reduction in CO
2 emissions.
Figure 9 illustrates the relationship between the share of deceleration time and the extent of CO
2 emission reduction, with a higher deceleration time share resulting in a more significant impact on emission reduction. The weighting factor of the Urban Delivery cycle for 4-UD was 0.5 for both payloads, while it was 0 for the other subgroups.
Figure 10 illustrates the influence of hybridisation on buses, showcasing the higher impact of serial architecture compared to parallel. Among the serial buses, the average improvement in CO
2 emissions was found to be 36% for HDV class 31b1 and 35.2% for HDV class 35a. On the other hand, the parallel architecture also demonstrated significant reductions in CO
2 emissions, reaching 20.6% and 13.1% for HDV class 31b1 and 35a, respectively. The results highlight the potential benefits of hybridisation for both serial and parallel buses, with the serial architecture exhibiting greater emission reductions.
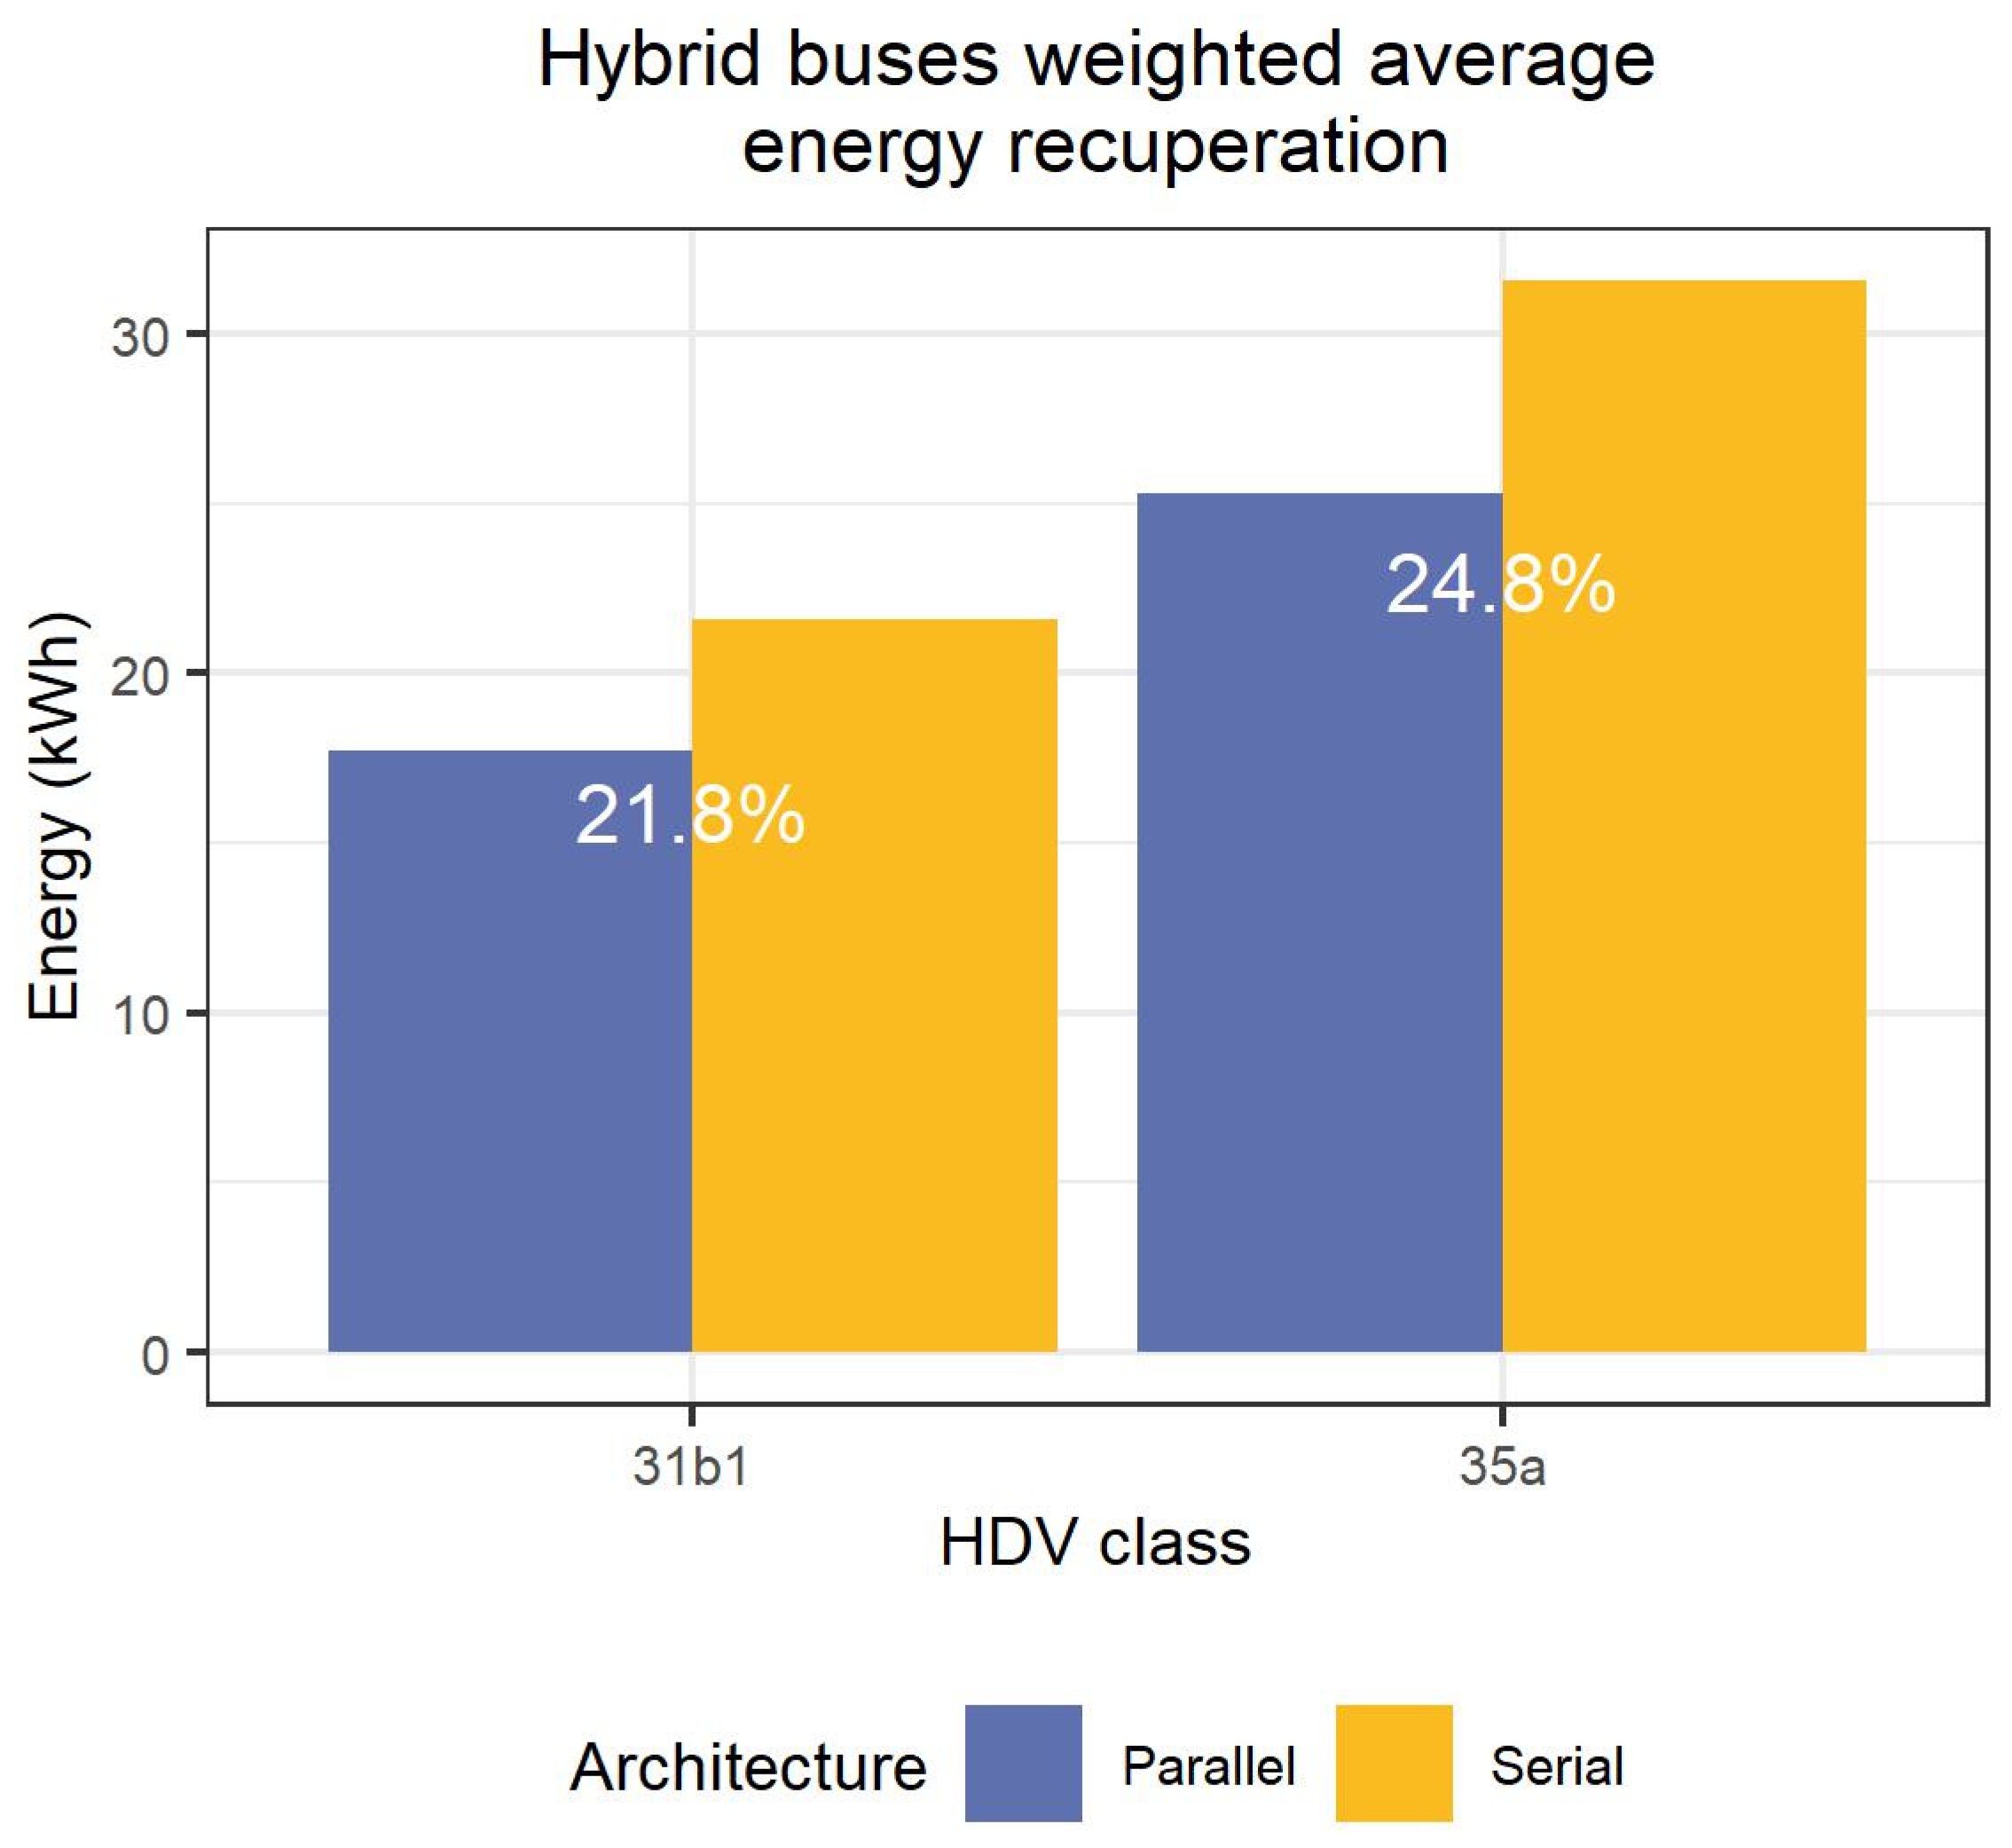
The performance of serial hybrids was better, resulting in lower CO
2 emissions, which relies on improved energy recuperation. To better visualise this parameter,
Figure 11 presents a comparison of the energy recuperation by architecture, where the energy values were weighed as in the calculations with the CO
2 emissions. On average, HDV class 31b1 vehicles with serial architecture exhibited 21.8% more energy recuperation compared to those with parallel architecture, whereas for HDV class 35a, the difference was greater, reaching 24.8%.
The hybridisation effect was significantly higher for buses than for lorries over all cycles. Despite all bus cycles being transient, with many starts and stops, not all exhibited the same improvements. This could be attributed to the cycle speed profile with cycles that exhibit higher speeds, i.e., the Suburban cycle, with lower improvements compared to cycles with lower speeds. In these cases, conventional powertrains have higher ICE efficiency and produce lower CO
2 emissions. In this way, when compared with hybrid powertrains, the effect of the latter could be reduced, although still significant.
Figure 12 presents a boxplot distribution of EM and ICE efficiencies by vehicle speed bins for a serial and a parallel hybrid bus.
The boxplot analysis conducted on the parallel architecture revealed distinct patterns in the distribution of efficiency for both the EM and the ICE across different speed bins. For the speed bin of 0–15 km/h, the EM efficiency showed minimal fluctuations, with a mean efficiency of 0.88 for HDV class 31b1 and 0.87 for HDV class 35a. As the speed increased, the mean efficiency of the EM remained stable at around 0.91 for both HDV classes, while the fluctuations decreased significantly, reaching 0.01.
In contrast, the ICE efficiency exhibited lower values compared to the EM and showed higher fluctuations. In the speed bin of 0–15 km/h, the mean efficiency of the ICE was observed to be 0.32 for HDV class 31b1 and 0.27 for HDV class 35a. However, as the speed increased, the mean efficiency of the ICE gradually improved, reaching 0.42 for HDV class 31b1 and 0.38 for HDV class 35a. Most importantly, the standard deviation of ICE efficiency decreased significantly with increasing speed, becoming as low as 0.001 for HDV class 31b1 and 0.023 for HDV class 35a.
On the other hand, the serial architecture displayed an interesting pattern, with the ICE maintaining a relatively stable operating efficiency across different vehicle speeds, while the efficiency of the EM used for propulsion tended to decrease at higher speeds. Specifically, in the speed bin of 0–15 km/h, the average EM efficiency was 0.85 for HDV class 31b1 and 0.87 for HDV class 35a, gradually declining to an average of 0.73 and 0.76, respectively, in the 60–75 speed bin. However, it is worth noting that the standard deviation of EM efficiency remained relatively low, ranging from 0.03 to 0.07 across all speed bins. This observed performance aligns with expectations, as the EM operates at higher speeds, where it may exhibit lower efficiency compared to that at lower speeds.
3.2. Hybridisation Influence on CO2 Emissions
The first step of the hybridisation influence investigation calculated the CO
2 emissions of hybrid vehicles that are representative of the vehicle market. Subsequently, the effect of modifying the hybridisation parameters, i.e., EM and battery size, was examined.
Figure 13 presents the effect of EM and battery size on the CO
2 emissions of lorries compared to the baseline vehicles. The general trend was that more powerful motors deliver higher CO
2 emission reductions, whereas battery size was shown to have a less significant effect. It should be noted that the runs were always in charge-sustaining mode—since the investigated vehicles were solely hybrid—which could affect battery usage.
The impact of hybridisation was more pronounced in vehicle subgroups that featured transient cycles, offering greater opportunities for energy recuperation, especially when the baseline vehicle’s CO2 emissions were considerably high. The use of larger motors enabled higher energy recuperation, although the addition of batteries had an adverse effect on CO2 emissions, likely due to the increased mass they introduced. Interestingly, a battery capacity of 30 kWh consistently delivered the highest improvements in all cases.
For HDV class 4, the 4-UD vehicle exhibited the highest decrease in CO2 emissions, reaching 17.5% with a 160 kW EM. The 4-RD vehicle followed closely with a 4.9% decrease, also employing a 160 kW EM, while the effect was more limited for the 4-LH vehicle, showing a reduction of 2.7% with a significantly smaller 75 kW EM.
Similarly, the increased hybridisation in HDV class 5 vehicles showed a positive impact, with the 5-RD vehicle exhibiting a higher reduction of 6% for a 230 kW EM. There were also gains for the 5-LH vehicle, reaching 3.4% with the same 230 kW EM. Interestingly, the gains in the long-haul application for HDV class 5 were slightly higher than those for HDV class 4, but this improvement required using a larger motor. Conversely, in HDV class 4, the EM needed to be smaller to achieve the highest benefits. This observation indicates that, in certain scenarios, the electrification component can become more of a “dead weight” in terms of CO2 emission reduction, providing fewer benefits due to the increased mass it adds to the vehicle.
The analysis of buses, similar to lorries, demonstrates consistent trends in the impact of batteries on CO
2 emission reduction. Interestingly, the effect of the battery had an inverse relationship with the reduction in CO
2 emissions, as illustrated in
Figure 14. In the majority of cases, an increase in battery size resulted in higher CO
2 emissions. This finding is noteworthy, as it may seem counterintuitive to assume that larger batteries, which are generally associated with improved energy storage and efficiency, would lead to higher emissions.
The analysis revealed that parallel hybrids exhibited smaller improvements compared to serial ones. Specifically, the HDV class 31b1 parallel hybrid demonstrated the lowest CO2 emissions when equipped with a 230 kW EM and a 5 kWh battery. This configuration reduced CO2 emissions by 21.9%, which was slightly lower than the reference case of the same HDV class. Similarly, the HDV class 35a parallel hybrid displayed a similar trend, with the highest reduction achieved with the same EM and battery configuration, leading to a reduction of 14.8%. Once again, this improvement was comparable to that in the reference scenario.
On the other hand, the serial hybrids exhibited significantly higher reductions in CO2 emissions, although the reference cases were marginally more effective. For instance, the reference cases featuring an EM of 120 kW for the HDV class 31b1 and 160 kW for the 35a, both equipped with an 11 kWh battery, demonstrated the highest reductions in CO2 emissions.
Interestingly, battery capacity deteriorates vehicle performance, with the underlying reason for this counterintuitive observation lying in the trade-off between battery weight and energy consumption. As battery capacity increases, the battery also becomes heavier, and this additional mass can lead to increased energy consumption, especially during the acceleration and deceleration phases of the vehicle’s operation. The increased kinetic energy—due to the battery mass—could not be fully recuperated due to EM efficiency, which signifies increased absolute losses for higher mass. While larger batteries may provide extended driving ranges and greater electric power capacity, the added weight can offset the benefits of electrification, leading to higher overall CO2 emissions during the vehicle’s lifetime.
This phenomenon is especially pronounced in scenarios where the driving conditions and mission profiles do not favour frequent energy recuperation. In such cases, the increased battery capacity does not contribute significantly to energy savings, and the additional weight becomes a hindrance to fuel efficiency, outweighing the benefits of electric power usage.
Moreover, the optimal battery size for emission reduction varies across different vehicle subgroups and mission profiles. For some subgroups, a certain battery capacity may lead to more favourable emission reduction outcomes compared to others. Therefore, it becomes crucial to carefully evaluate the specific application and usage patterns of the buses to determine the most appropriate battery size that optimises emission reduction while considering other factors such as range requirements, payload capacity, and overall vehicle efficiency.
3.3. Hybridisation Impact on Energy Distribution
Hybridisation affects the energy distribution by recuperating some of the energy that would be otherwise lost during braking. In addition, it enables the ICE to operate at more optimum conditions in parallel hybrids and store the excess energy. One representative vehicle was chosen for each architecture to investigate the influence of EM and battery size on energy distribution, and their relative energy losses were calculated. In order to gain a better understanding of the hybridisation impact, the analysis focused on the separate driving cycles with reference load. Subsequently, the hybridisation impact was assessed by comparing the development of braking losses, which indicate the share of recuperated energy.
Figure 15 presents the relative energy distribution for a parallel architecture vehicle for Vehicle 1, which was chosen as the HDV subgroup 4-UD. It covers all driving cycles, making it ideal for a comprehensive comparison. This revealed that the highest impact is in the Urban Delivery cycle, where a larger motor results in lower friction braking losses, while this effect diminishes in Regional Delivery and Long-Haul cycles. This effect could be attributed to the Urban Delivery cycle being more transient, with regular starts and stops that add many braking events. It should be highlighted that all the other losses remain relatively unchanged.
For the serial hybrid architecture case, Vehicle ID 2, an articulated bus, was chosen to provide clearer insights, considering its potentially higher energy demands. As illustrated in
Figure 16, the hybridisation effect is influenced by the EM size.
The observed decrease in braking losses with increasing EM size can be attributed to enhanced energy recuperation; a larger EM allows for more effective energy recovery during braking, contributing to reduced losses and improved overall efficiency.
The figure also highlights that the reference vehicles are already well optimised. At the reference EM size of 160 kW, the trend inclination decreased significantly, indicating that the benefits of further increasing the EM size might be limited for these specific vehicles.
4. Discussion
The reference cases indicate, in most cases, significant improvements for hybrid powertrains compared with their baseline conventional counterparts. For the lorries, which comprise solely a parallel architecture, higher improvements are observed for mission profiles with lower speeds and payload. Under these conditions, the electrified powertrain can deliver improved efficiency, while a conventional vehicle would have a lower ICE efficiency. On the other hand, at higher speeds, the ICE operates at optimal conditions, which is beneficial for both conventional and parallel hybrid powertrains, resulting in a convergence of CO
2 emissions. Nonetheless, hybrid lorries still exhibit lower CO
2 emissions as they benefit from energy recuperation. It was identified that there is a correlation between the deceleration time share of the cycle and the reduction in CO
2 emissions, resulting in higher benefits for cycles with transient conditions. A correlation with the deceleration value, i.e., m/s
2, would not be so useful, as acceleration and deceleration values are determined from driver models, which are consistent regardless of the driving cycle. Sun et al. [
15] measured conventional and hybrid buses and identified a correlation between vehicle-specific power (VSP) and fuel savings. For VSP values higher than 5 kW/t that are exhibited during urban driving, the fuel consumption rate of hybrid powertrains is lower by 14–25%. However, the authors reported insignificant gains for lower VSP values that are encountered during highway driving.
The buses with a serial architecture showed significant improvements, reaching up to ~36% for both HDV bus classes. The parallel architecture showed potential compared with conventional baseline vehicles, but their effect was reduced compared to that of serial hybrids. For HDV class 31b1, the reduction was 20.6%, and for the heavier, more articulated HDV class 35a, it was 13.1%. A study comparing a serial hybrid bus with a conventional baseline over the Houston cycle, which has similar characteristics to the Heavy Urban cycle, with transient conditions and an average speed of 18.5 km/h, measured a 12% reduction in CO
2 emissions [
16]. Another study found a 30% reduction for a serial hybrid bus and noted that parallel hybrids performed well, with only a 2% lower performance compared to serial hybrids [
17]. Kivekäs et al. [
17] explored various bus powertrains and hybrid architectures and observed a 5% lower energy consumption for serial architectures compared with parallel architectures. However, even in this case, the parallel hybrid exhibited a 30% lower energy consumption by compared with its conventional diesel counterpart. Although not purely serial, a study demonstrated a 3.2% improvement in fuel efficiency for a serial–parallel architecture compared to the parallel hybrid [
18]. However, the authors investigated also a third possibility, the power-split architecture, achieving an 8.2% improvement over parallel hybrids.
The findings of the current study also indicate that improvements using parallel hybrids are lower than improvements using serial ones. It was also highlighted that the efficiency of the EM decreased from 0.86 at low-speed bins to 0.65 at higher-speed bins, while the ICE efficiency remained stable as shown in
Figure 12. This lower performance for high-speed cycles could be attributed mainly to the EM. Introducing a gearbox to allow the EM to operate within a more efficient range could potentially further improve the performance of serial hybrid buses and could be investigated further.
The variability in the route in terms of speed and grade was also found to significantly affect fuel consumption, with one study indicating an improvement in fuel consumption, but it was unable to quantify it due to route variability [
19].
The performance of parallel hybrid buses vary across different studies. In some cases, they show no actual improvements on any of the cycles, while in other cases, there was an average increase of about 3.2%. One study reported an increased fuel consumption of 11.8% for hybrid vehicles compared to their conventional counterparts [
20]. However, another study observed a decrease of 29%, although this benefit was lost when the average speed decreased from 25 km/h to 15 km/h, resulting in an actual increase of 50% [
21]. Interestingly, a study found that life cycle CO
2 emissions decrease by 40% in hybrid powertrains and 60% for electric vehicles compared to diesel vehicles [
22]. Another study measured conventional diesel and concentrated gas vehicles along with a gas hybrid vehicle [
23]. They found that the hybrid vehicles emitted less CO
2 by 73% compared with the gas vehicle and by between 41% and 61% to the diesel counterparts.
The negative impact of auxiliary usage, such as A/C, was found to contribute to increased fuel consumption. Another study reported that the use of A/C in parallel hybrid buses increased CO
2 emissions by 30% [
16]. The current study utilised an auxiliary load of 7.5 kW for buses derived from the official values considered to satisfy the vehicle’s energy demands and passenger comfort needs. Despite the overall decrease in CO
2 emissions, there have been occasions with a low payload that the hybridisation effect diminished compared with conventional powertrains. For this reason, it is also important to consider the expected payload and/or number of passengers.
Regarding the hybridisation margins, the analysis of different lorry classes revealed important findings regarding the impact of EM and battery size on their performance and CO2 emissions. The trend was more or less consistent within the HDV subgroups. In vehicle subgroup 4-UD, increased hybridisation showed significant gains for a battery capacity of 30 kWh (at ~17%). For Regional Delivery profiles such as 4-RD and 5-RD, there were much lower gains in the order of 5%, making it apparent that hybridisation provides benefits at transient mission profiles where recuperation is possible. However, the Long-Haul profiles of 4-LH and 5-LH delivered some improvements in the order of 2.5%, which could be substantial in absolute terms considering that the overall CO2 emissions of lorries are considerably high.
In a study, a lorry employing an ICE of 317 kW, an EM of 200 kW, and a 20 kWh battery storage was compared with its conventional counterpart, which had the same ICE power [
24]. The findings revealed fuel savings of 8.1% for a highspeed cycle, which increased significantly to 41.7% for the transient cycle. Another study reported a similar figure of up to 6% for routes with relatively constant speed [
25], while Gao et al. observed a reduction between 5% and 7% for long-haul applications [
26].
Interestingly, the hybridisation effect decreased due to battery size, likely due to the increased vehicle mass. Zhao et al. [
27] explored various combinations of EM and battery sizes, identifying 16% savings compared to a conventional powertrain, with the optimal combination being a 120 kW EM paired with a 15 kWh battery. However, larger batteries could have an impact on plug-in hybrid vehicles as they rely more on electric driving—an issue to be addressed in future research. Regarding EM, larger sizes resulted in a decreasing trend in CO
2 emissions. The energy audit also showed that the braking losses were reduced with increased EM size, while energy demand for other components remained stable. This indicated higher recuperation for all lorries, with the effect being more prominent in transient mission profiles. The influence of the battery size was more or less consistent regardless of the vehicle type and architecture. Since the serial and parallel architectures exhibited similar trends, it is indicated that battery size has a low impact on energy management strategy.
The analysis of buses in the study revealed interesting findings regarding the impact of hybrid technologies on emissions. Parallel hybrid buses showed a similar trend to that of the lorries. However, the hybridisation effect was quite higher, as the bus driving cycles are quite transient, considering that they mainly operate in urban environments. This effect could be diminished for other bus types, such as coaches that are mainly deployed for interurban travel and could perform similarly to long-haul lorries. This could be a topic for future research.
Table 3 presents the hybridisation margins for lorries and buses for each HDV subclass along with the expected maximum CO
2 emissions reduction.
The lowest reduction corresponds to the Long-Haul profile, and the highest to the Urban Delivery profile. Overall, larger EMs deliver more benefits compared to larger batteries, as they offer improved energy recuperation. Larger motors could prove to be even more effective for the reference payload, but there are limitations in EM regarding (a) the currently available market EM models and (b) price. City buses were already reasonably optimised for serial architecture, which the market investigation showed to be quite common. Parallel hybrids, on the other hand, could improve further, but there is no need to invest in larger batteries, as they increase the weight. To this end, a vehicle manufacturer has even utilised a supercapacitor, as shown in
Table A2 in
Appendix A.1. In this case, the weight could be reduced, but the supercapacitor’s limited capacity of 0.4 kWh could essentially recover braking and provide assistance during vehicle acceleration, without further contributing to vehicle propulsion. However, the use of supercapacitors could be further investigated in future research.
5. Conclusions
The findings from this study highlight the importance of carefully considering the specific characteristics and configurations of hybrid systems in HDVs to achieve meaningful CO2 emission reductions in both lorries and city buses, particularly as a transitional phase towards fully electrified powertrains. Optimising the size and performance of the EM proves to be a key factor in achieving these emission reductions. Increasing the EM size in lorries results in improvements up to a certain point, with a 160 kW EM achieving 17.5% in Urban Delivery cycles for an HDV class 4. There are also improvements of 4.9% in the Regional Delivery cycles for the same EM size, but interestingly, the most suitable solution for the Long-Haul application was a 75 kW EM, where benefits of 2.7% were observed. For HDV class 5, the most suitable EM size for all applications was 230 kW, resulting in 6% and 3.4% improvements in the Regional Delivery and Long-Haul profiles, respectively. However, the battery capacity seems to have an adverse effect, and a storage of 30 kWh seems sufficient for all the foreseen uses.
Regarding city buses, there seems to be a trend towards deploying serial architectures that can achieve up to a 36% reduction with EM sizes of 120 and 160 for classes 31b1 and 35a, respectively, and a battery capacity of 11 kWh. On the other hand, parallel architectures required a larger EM of 230 kW but smaller batteries with 5 kWh storage to deliver an improvement of 21.9% for class 31b1 and 14.8% for class 35a. The market analysis and the literature findings indicated hybrid buses as a transitional phase to fully electric vehicles, but certain cases may still warrant the use of hybrid powertrains.
Further research in the field of parallel hybrid buses could explore the potential of supercapacitors, while for serial buses, investigating the incorporation of a gearbox in the EM could address the observed decrease in efficiency at higher vehicle speeds. It is essential to explore all avenues to maximise efficiency and emission reductions in both lorries and buses, as even seemingly small improvements can contribute significantly to climate change mitigation efforts.
Moreover, hybrid HDVs could prove to be a valuable solution in long-haul and interurban travel, where their performance may initially appear lower compared to other powertrains. However, any reduction in CO2 emissions achieved in these applications could notably impact overall greenhouse gas emissions, provided that battery and EM life cycle emissions remain slow. Therefore, further research in the sector should focus on interurban travel with coaches and explore the potential for hybridisation to address specific emission challenges in these contexts. By identifying the most suitable applications for hybrid powertrains and optimising their configurations, the HDV sector can take meaningful steps towards achieving more sustainable and environmentally friendly transportation.


