Article

Pathways to Clean Energy Transition in Indonesia’s Electricity Sector with Open-Source Energy Modelling System Modelling (OSeMOSYS)

1
Centre for Environmental Policy, Imperial College London, London SW7 1NE, UK
2
Sustainable Transitions: Energy, Environment and Resilience Centre, Department of Geography, School of Social Science, Loughborough University, Loughborough LE11 3TU, UK
*
Author to whom correspondence should be addressed.
Energies 2024, 17(1), 75; https://doi.org/10.3390/en17010075
Submission received: 22 October 2023 / Revised: 8 December 2023 / Accepted: 14 December 2023 / Published: 22 December 2023
(This article belongs to the Collection Energy Transition towards Carbon Neutrality)

Abstract

:
Responding to the Paris Agreement and climate change mitigation, Indonesia aims to reach net zero by 2060 or sooner. Due to Indonesia’s dependence on coal and growing consumption, alternative sources of clean energy are imperative for meeting its rising energy needs and reducing energy-related greenhouse gas emissions to achieve the energy transition. This project aims to examine Indonesia’s opportunities and potential to achieve low carbon ambition in the energy sector and identify alternative pathways for the energy transition in Indonesia. In this study, the open-source energy modelling system (OSeMOSYS), which is a long-term energy system modelling tool, is employed to compare electricity generation, investment, and carbon dioxide emissions between business-as-usual and five alternative scenarios. Six scenarios, including business as usual, least-cost, two coal-phrase out and two net zero aligned with national climate targets and optimal scenarios, were simulated across different target years. The results show that the net zero (NZ) scenario is more cost-effective and emits fewer greenhouse gases than the other scenarios in meeting Indonesia’s future energy demand. However, achieving net zero by 2050 (NZ50) results in significantly lower CO2 emissions (10,134 MtCO2), which is less than half of the emissions in the net zero by 2060 (NZ60) scenario (16,849 MtCO2) at a similar cost (6229 and 6177 billion USD, respectively). This paper’s insights emphasise that large-scale renewable energy deployment and coal retirement are critical pathways to reaching carbon neutrality and achieving the energy mix transition.

1. Introduction

Globally, human activities associated with energy consumption constitute one of the largest sources of greenhouse gas emissions. Ref. [1] stated that the energy transition aims to reduce energy-related CO2 emissions and limit climate change by transitioning the energy sector from CO2 emitters to zero-carbon technologies.
The energy sector in Indonesia is the second contributor to CO2 emissions [2]. Indonesia relies heavily on coal as the country is one of the world’s largest coal producers and consumers. The Indonesian coal market plays a prominent role globally, particularly as a regional supplier. Over a quarter of the country’s total CO2 emissions were generated by coal-fired power plants (CFPPs), accounting for 79% of the country’s power sector’s CO2 emissions in 2019 [3]. In addition, Indonesia’s primary energy consumption increased by 16% between 2010 and 2020 [2]. It is also estimated that Indonesia’s energy consumption will increase by another 80% by 2030, making it critical for the country to meet its future energy needs and transition to renewable energy [4].
Indonesia has shown substantial commitment to aligning with the Paris Agreement and achieving net zero and energy transition through research, policies, and nationally determined contributions (NDCs). Ref. [5] stated that Indonesia signed the Global Coal to Clean Power Transition declaration at the 26th Conference of the Parties (COP26). With its reliance on coal and consumption growing, alternative sources of clean energy are imperative for Indonesia to meet its rising energy needs and reduce energy-related CO2 emissions to achieve the energy transition. It is possible to reduce carbon emissions by 90% through renewable energy and energy efficiency measures as Indonesia has an abundance of potential renewable energy sources [1].
However, one of Indonesia’s significant challenges is the inconsistencies and discrepancies in current electricity sector policies and regulations. Ref. [6] highlighted that several of Indonesia’s energy policy plans rely on unrealistic data input assumptions and provide contradictory and impossible goals, making clean energy less desirable [6]. Additionally, there is a lack of consistent and incentivising policy that encourages the development of renewable energy projects. Indonesia possesses considerable potential for achieving an energy transition, given the abundance of renewable sources; nevertheless, these resources have not been fully harnessed [7]. A lack of policies and unbalanced risk-allocated contracts make Indonesian renewable energy projects the most expensive region in Asia [6].
Energy planning modelling has provided insights into energy access, resource use and sustainable development, which help support the energy transition. In the energy transition context, energy models are crucial to planning long-term investments and sustainable development [8]. Models serve as a tool for decision-making and a method for analysing the impact of future technologies on the energy system [9]. Recently, there have been efforts to increase the role of society in energy planning and to strengthen the science–policy interface. The role of energy systems models has become more relevant as stringent climate policy, security and economic development concerns become more prevalent [10].
The open-source energy modelling system (OSeMOSYS) energy model is a bottle-up long-term energy system model (ESM), offering the least-cost optimisation and the impact of various policy measures on electricity generation, investment patterns, and carbon emissions [11]. One significant advantage of OSeMOSYS is its open-source software, which includes an extensive collection of over 59 publicly available national state datasets, calibrated models, and a wide range of inputs, making it easier for users to access and use for their analyses [12]. It is designed to offer adaptability and customizability, providing a robust modelling tool for users to simulate, assess and analyse the outcomes of different energy policies or scenarios [8]. This study only utilises the existing OSeMOSYS model with Indonesia’s starter data kit [12] as the primary database to conduct a comprehensive examination of different pathways. The objective of Indonesia’s starter data kit is to lower the data access barriers for developing national energy system models, making OSeMOSYS suitable and accessible to a broader community, including researchers, policymakers, and practitioners.
OSeMOSYS is widely adopted to study the impacts of scenarios and policy decisions on an energy system with several objectives [13]. For instance, OSeMOSYS has been employed to model energy policy and develop least-cost scenarios in Indonesia, including the nationwide [14], Sumatra Island [15], Sulawesi region [16], and Java-Bali power systems [17]. The model has also been utilised for analysing energy transition pathways in other developing countries, such as, in Dominican Republic [18], Bangladesh [19], Ethiopia [20] and Egypt [21]. Additionally, OSeMOSYS is adept at simulating broader specific objectives, such as projecting the consequences of phasing out coal from the energy mix in Mauritius [22]. This flexibility makes OSeMOSYS a valuable tool for decision-makers aiming to design effective and sustainable energy policies, which can potentially support Indonesia’s future energy strategies and investment outlooks to achieve the energy transition.
As with any model, OSeMOSYS operates based on certain assumptions and simplifications. These assumptions may not always perfectly capture the complexity of real-world energy systems, potentially leading to deviations between model predictions and actual outcomes [11]. OSeMOSYS also have limitations in terms of spatial, timeframe boundary and renewables integration. Unlike other model tools, the accuracy and reliability of the OSeMOSYS results are heavily dependent on the quality of input data. This research has enhanced the temporal resolution and validated input data to improve overall data quality.
This paper offers an extensive analysis and comparison of six scenarios categorised according to their electricity production and installed capacity, costs, and carbon dioxide emissions. The scenarios are based on Indonesia’s target and policy, aiming to identify the most effective scenario and policy for clean energy transition, focusing only on the electricity sector. The study starts with Indonesia’s energy context, opportunities, challenges, and current energy transition policies. This is followed by the material and methods used. Then, the result section presents the modelling outcomes, along with discussion and policy implications. Finally, conclusions are drawn and opportunities for future work are described.

1.1. Indonesia’s Energy System and Renewable Energy Opportunities

Indonesia’s Ministry of Energy and Mineral Resources (MEMR) is primarily responsible for its energy and mining assets [6]. The sources of power plant production include a state-owned company, Perusahaan Listrik Negara (PLN), and purchased production from independent power producers and private power utilities [23]. Indonesia has installed a generation capacity from both on- and off-grid power plants, accounting for 74.5 gigawatts (GW) [2]. Ref. [23] estimates that the most dominant technologies out of installed capacity were steam power plants (coal, oil, gas, and co-firing) at around 37 GW or 51%, followed by combined cycle (17%) and hydro (9.1%). In 2021, 88% of the electricity generation in Indonesia was produced by CO2-emitting technologies, and only 22% was produced by renewable energy [1].
On the other hand, renewable sources in Indonesia are underutilised, which is detrimental to energy development and CO2 emissions reduction. The installed capacity of renewable energies, except hydropower plants, was lower than average [23]. Ref. [23] estimated the potential for 443.2 GW of renewable energy within the next decade, but only 10.5 GW has been deployed. Overall, Indonesia has an abundance of potential renewable energy with solar energy as the most abundant resource. Ref. [23] estimated that its potential capacity is around 208 GW, while only 0.2 GW of solar energy has been installed. Following behind solar, hydroelectric power represents another substantial renewable resource in Indonesia. Indonesia has a hydropower potential of approximately 94.5 gigawatts but it only uses about 7% of its potential [6]. While the nation possesses a significant wind energy potential of up to 60.6 GW, only a minimal 0.2 GW is currently utilised [23]. Additionally, Indonesia is the world’s second-largest producer of geothermal electric power, which has strong potential for Indonesia to reach the clean energy target [6].
Additionally, there is an excellent opportunity for the energy transition in Indonesia, as it is now becoming more economically viable. Ref. [3] pointed out that coal power is losing its economic competitiveness, as global markets for renewable energy and solar energy production have lower their prices than most conventional energy sources. By 2023 or sooner, building new solar PV power plants will be cheaper than building new coal-fired ones [3].

1.2. Energy Transition Policies and Long-Term Energy Modelling in Indonesia

To accommodate the energy transition toward net-zero emissions, Indonesia’s government has released several policies to increase renewables deployment and reduce CO2 emitting technologies. The government aims to enhance renewable energy capacity and generation, with a focus on solar, wind energy, hydropower, and geothermal power, by 2025 [2]. This objective is pursued through the facilitation of regulations, the implementation of new development policies, and the provision of incentives for utility, commercial, and industrial usage [2].
The Ministry of Energy and Mineral Resources (MEMR) has set a target to use 23% renewable energy by 2025 and 31% by 2050 [4]. Also, ref. [24] reported that Indonesia’s government and state electricity company, Perusahaan Listrik Negara (PLN), pledged to stop building new CFPPs and consider accelerating the coal retirement programme by 2030. PLN has committed to stop building coal plants in 2023 after being able to complete 35 gigawatts of projects and will deploy only renewable energy in the future, to become carbon neutral by 2050 [24].
Long-term energy modelling is one of the accepted methods by Indonesia’s government and several non-governmental organisations to develop energy transition strategies. The Indonesian government reported the new NDCs for a low-carbon and climate-resilient future and set new energy goals to reduce emissions in 2021 [25]. This includes a national baseline scenario (business as usual) and mitigation scenarios. In the mitigation plan, renewable energy will make up to 31% of the energy supply by 2050, while oil, gas, and coal supply will be reduced to 20%, 24%, and 25%, respectively [25].
The government of Indonesia and PLN also issued the National Electricity Supply Business Plan (RUPTL) 2021–2030 [26]. Over the next ten years, several plans have been outlined for Indonesia’s future power development, using long-term energy modelling. The RUPTL presents two energy-mix scenarios: an optimal scenario that adopts the least-cost principle and a low-carbon scenario that incorporates more renewables. RUPLT 2021–2030 investigated net zero can be achieved by 2060 with an increase of the total share of new renewable energy (NRE) in the energy mix to 24.8% by 2030 [26].
In response to the net-zero announcement, MEMR and PLN also released the report entitled Intelligent Strategies Power and Utility Sector to Achieve Indonesia’s Carbon Neutral by 2050 [5]. It modelled the net-zero pathway in the 2045, 2050, and 2060 scenarios. The findings show that the goal can be achieved by implementing a coal phaseout in 2026 and increasing renewable energy by one-third in the energy sector before 2040.
Other collaborating efforts have been made to develop energy transition pathways, using long-term energy modelling. The Minister for Environment and Forestry (MEF) and the British Embassy partnership, Mentari, published an update on coal phaseout modelling, using PLEXOS (the energy analytics and decision platform for all systems) to estimate feasibility, investment, and emissions in three coal phaseout scenarios until 2040, varying the target retirement year between 2046, 2056, and 2066 [27]. Ref. [27] stated that the assumptions comprise no new coal power construction, increasing a minimum renewable share and introducing a carbon tax ($2/tCO2). Based on the results, gas will replace coal as the primary energy source, followed by solar and hydropower.
Similarly, the Institute for Essential Services Reform (IESR) and the University of Maryland have conducted another study, Financing Indonesia’s coal phase-out: A just and accelerated retirement pathway to net zero, to develop a feasible plan for retiring Indonesia’s CFPPs [3]. In this study, the scenarios are developed using the global change analysis model (GCAM5). Their clean energy transition scenario showed that there will be 18 plants retiring by 2030, 39 plants retiring between 2031 and 2040, and 15 plants continuing to operate beyond 2040 at a low utilisation level before retiring before 2045 with international help [3].
The relevance of past studies [3,5,25,26,27] lies in the shared objective of examining the pathways to energy transition in Indonesia with distinct approaches to energy system modelling. While prior research has utilised energy system models like PLEXOS, and GCAM5 to explore Indonesia’s energy transition, OSeMOSYS is rooted in its open-source nature, extensive national state datasets, and calibrated models for this study. The unique features of OSeMOSYS, such as its adaptability and suitability for diverse circumstances, enhance the comprehensiveness of the analysis and outcomes.
OSeMOSYS has also been employed by several researchers to identify energy transition pathways in both the entire nation and small-scale areas within Indonesia. For instance, ref. [14] investigated the least-cost scenario and different renewable energy policy scenarios from the base year 2010 to 2050 across the entire nation, employing OSeMOSYS and the low emissions analysis platform (LEAP). The findings suggest that a minimum of 40% renewable energy share must be deployed by 2050 to achieve an 81% reduction in CO2 emissions, compared to their coal dependence scenario [14]. In addition, ref. [15] explores four cost-optimal pathways for renewable energy development in Sumartra, using the LEAP and OSeMOSYS. The research emphasizes that the mitigation scenario, involving the escalation of bioenergy, solar, and wind deployment to 37% by 2028, aligns with the Indonesian government’s targets by reducing Sumatra’s dependence on coal resources [15]. Another research has been done in the Sulawesi region to identify an optimal scenario for renewable energy generation expansion [16]. Ref. [16] indicate that promoting strong policies to support investments in various renewable energy sources, especially hydro and wind energy, can reduce around 35% of CO2 emissions compared to the non-renewable energy scenarios (BAU).

2. Materials and Methods

This section focuses on the methodology for developing long-term scenarios for the energy sector in Indonesia. A scenario is predicted by OSeMOSYS software, providing an in-depth analysis of technology insights, electricity capacity, costs, and CO2 emissions. An Indonesia starter data kit [28] was used as primary data to develop OSeMOSYS modelling results. This study used the ‘Indonesia Base SAND’ [29] model from the ‘Indonesia Starter Data kit’ [28] as the foundational assumption for constructing and further constraining the scenarios.

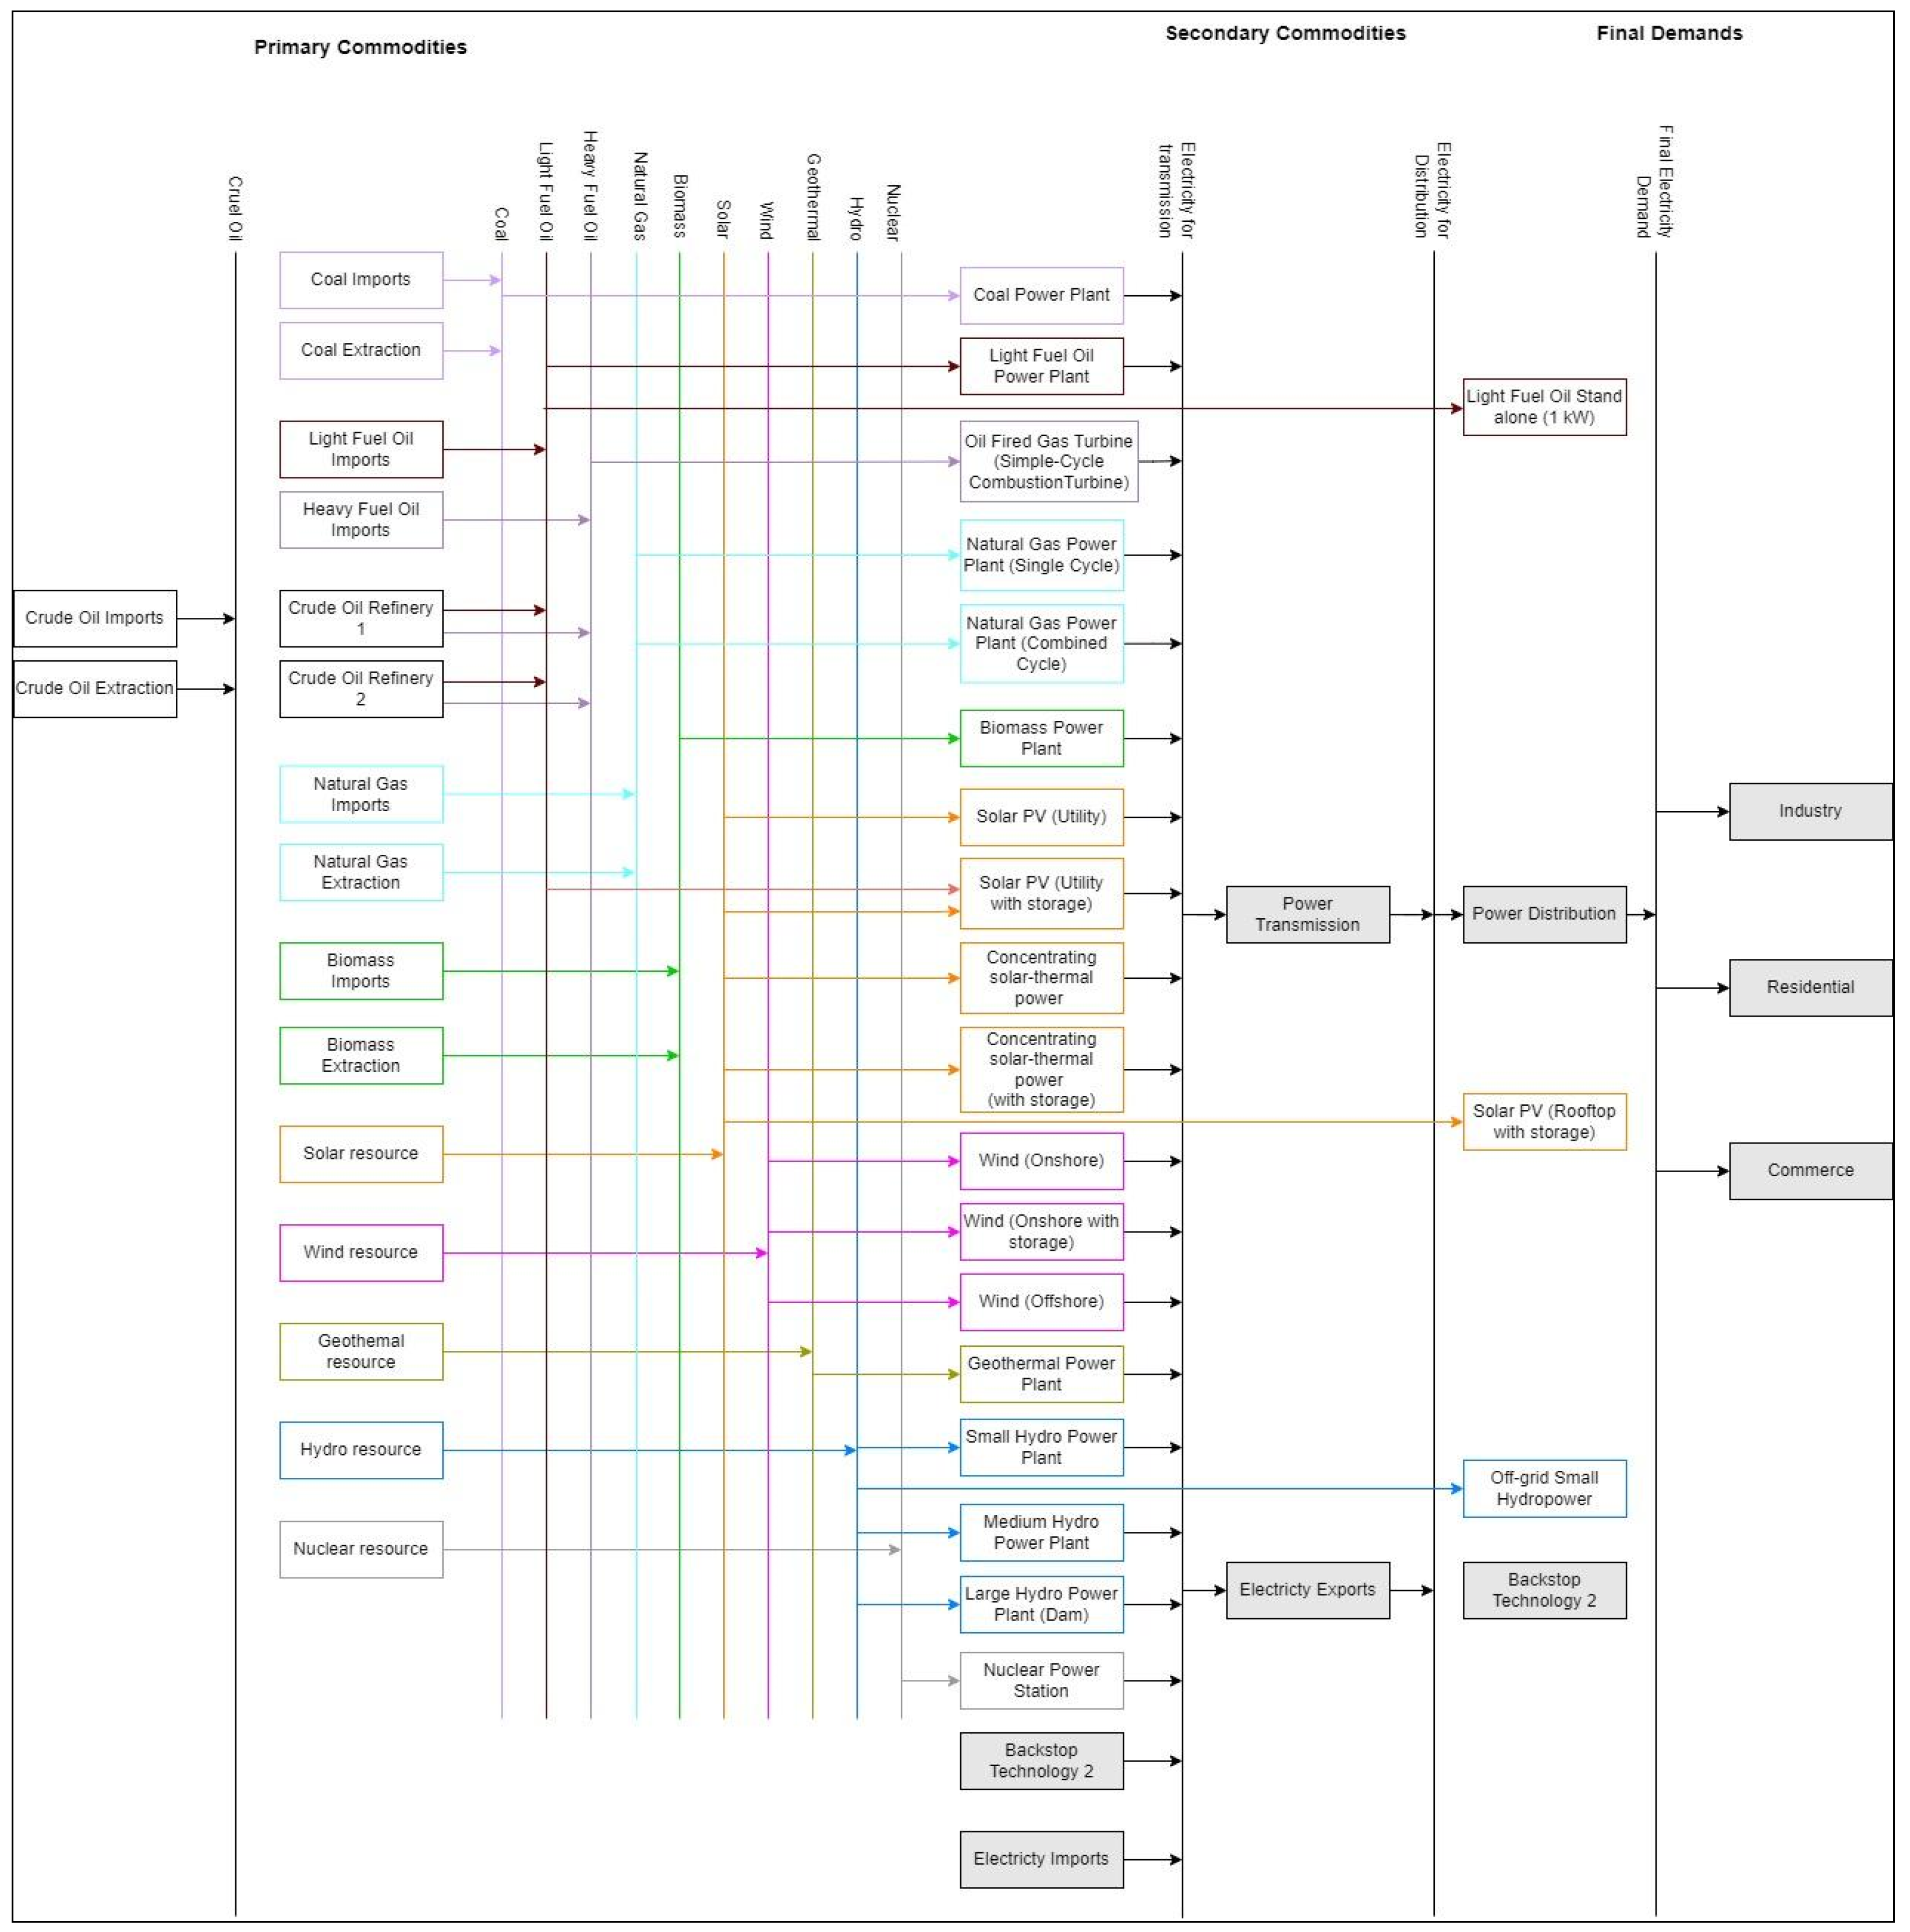
2.1. OSeMOSYS and Reference Energy System

This study used the OSeMOSYS software version 2015 [30]. OSeMOSYS is a least-cost model chosen for its ability to create pathways over extended periods up to 2070 [11]. OSeMOSYS model is also accessible through the clicSAND for OSeMOSYS spreadsheet-based interface [7]. OSeMOSYS and its clicSAND interface offer the advantage of allowing a wide range of scenarios to be developed for free, which will be essential for future policymaking. It represents the electricity supply system with importing and extracting technologies, converting technologies, power plants, transmission and distribution network systems, and final energy demands based on the various fuels available [28]. OSeMOSYS provides a complete one-step analysis of the country’s energy system and facilitates the exploration of various scenarios, allowing us to model different pathways and transitions in the Indonesian energy sector. Ref. [13] stated that OSeMOSYS provides a flexible platform that allows for the customisation of models to suit specific research objectives and informs further insights into energy investment outlooks, policy plans, and the evolution of power systems [11]. To calculate the minimum net present value cost of an energy system to fulfil the demands for energy service, the algebraic formulation can be described as Equation (1) [11], which y = year modelled, t = power plant and r = region.
M i n i m i z e y , t , r T o t a l D i s c o u n t e d C o s t y , t , r
where
y , t , r T o t a l D i s c o u n t e d C o s t y , t , r                                                       = D i s c o u n t e d O p e r a t i n g C o s t y . t . r                                                                           + D i s c o u n t e d C a p a c i t y I n v e s t m e n t y . t . r                                                                                                         + D i s c o u n t e d T e c h n o l o g y E m i s s i o n s P e n a l t y y . t . r                                                       D i s c o u n t e d S a l v a g e V a l u e y . t . r
A fundamental element of an energy modelling framework is the reference energy system (RES), representing whole energy systems, including commodities and technologies, from primary energy resources to final energy demand (Figure 1). Ref. [11] identified that an RES represents all existing and potential new technologies used in energy supply chains in a simplified graphical form. Additionally, the model incorporates the final energy requirements according to sector and exogenously supplied fuels.

2.2. Starter Data Kit

The primary data used in this study is based on ‘Indonesia’s Starter Data Kit’ [28], an Indonesian energy system data set published by CCG [29]. This dataset was designed to be incorporated as input data for the OSeMOSYS model, aiming to reduce the data barrier for developing a simple zero-order energy system model for Indonesia. The data kit offers a standardised and consistent dataset specifically designed for Indonesia. The data sources of this state data kit were obtained through public databases, existing modelling studies and international organisations, including the PLEXOS dataset [30,31], the Asia Pacific Economic Cooperation (APEC) [32], the International Energy Agency (IEA) [33,34], the International Renewable Energy Agency (IRENA) [35,36,37,38], the Intergovernmental Panel on Climate Change (IPCC) [39], and the United Nation [40]. This ensures that the information input into OSeMOSYS is based on credible sources and aligns with the local context, providing accurate and relevant insights into the outcomes.
Ref. [28] stated that a starter data kit consists of existing electricity supply systems, technical data for electricity generation technologies, power transmission and distribution, refineries, fuel prices, emission factors, renewable and fossil fuel reserves, and electricity demand projections. This data set was gathered and designed to serve as a basis input and assumption for developing energy models and examining scenario analyses.

2.3. Model Assumptions

The principal model assumptions in this study are based on the default setting [7] and the ‘Indonesia Base SAND’ [29] model from the ‘Indonesia Starter Data kit’ [28]. Ref. [28] explained that the ‘Indonesia Starter Data kit’ contains full energy data input and model assumptions for OSeMOSYS to develop an energy system model for Indonesia. However, the specific improvements in assumptions, are based on the default OSeMOSYS setting [7] and differing from the ‘Indonesia Starter Data Kit’ [28]. The adapting assumptions, which serve as input parameters for the model’s simulation, ensure that the simulated scenarios accurately reflect the real-world conditions in Indonesia. The base data kit often undergoes calibration processes to align with realities such as current policies and local data sources [28]. Adapting assumptions derived from the base dataset ensures that the model reflects the most accurate and up-to-date information available, contributing to the overall robustness of the simulation [12]. This accuracy is vital for generating meaningful insights and reliable projections regarding the country’s energy transition.
The adapted assumptions are categorised into three groups outlined below.

2.3.1. Supply-Side Assumptions

Ref. [28] provided various power generation technology options to explore, including the coal light fuel oil gas power plant (CCGT) and gas power plant (SCGT), natural gas, on-grid and off-grid solar PV (with and without storage), solar CSP (with and without storage), on-grid and off-grid hydropower, onshore and offshore wind, geothermal, and biomass power plant. However, Indonesia’s nuclear power plant has been excluded from this project due to its high costs. According to [7], variable renewables are constrained to ensure the system operates under high renewable shares and meets the maximum share of total demand, as in Table 1.

2.3.2. Demand-Side Assumptions

A medium and a high energy efficiency technology are modelled in each sector. The demand-side technologies in the starter data kit were split by sector based on the proportions of demand in cooking and heating. Transport demand is not considered in this study. The OSeMOSYS model uses petajoules as the default unit of measurement, so the capacity-to-activity ratio is used for converting technology units from GW to PJ [7]. In this project, the capacity-to-activity ratio was changed to 31.536. Also, there are constraints imposed on variable energy demand of energy efficiency technology as outlined in Table 2.

2.3.3. Time Representation and Discount Rate

In this project, the result was modelled from 2020 to 2070 with 8-time slices as it represents hourly energy demand throughout one calendar year. According to [28], each model year is divided into four seasons, each with two 12 h day parts. The first part of the day starts at 6:00 and ends at 18:00. The second part of the day starts at 18:00 and ends at 6:00. Season one runs from December to February, season two runs from March to May, season three runs from June to August, and season four runs from September to November. The PLEXOS dataset contains raw demand and PV, wind and hydropower demand profiles that have not been manipulated according to this time slice approach [28]. Additionally, the selected discount rate in this study is 10%.

2.4. Scenarios

These six scenarios are developed to determine Indonesia’s energy section’s alternative pathways, using the ‘Indonesia Base SAND’ [29] model as a foundation for the constraining model in each scenario. Business as usual (BAU) scenarios, based on the first Indonesia nationally determined contributions (NDCs) in 2016 [25], are a reference scenario, serving as a benchmark for evaluation and comparison with other alternative policy scenarios. Ref. [41] emphasises that it is crucial to consider the reference scenario when performing counterfactual analyses, which increases the credibility of future energy system analyses. The least cost (LC) scenario is a cost-optimal solution, which is automatically generated by OSeMOSYS. In addition, other four alternative scenarios are investigated, focusing on national policies, energy transition targets, and opportunities for renewable integration. These scenarios aim to reduce dependence on coal (CP) and achieve net zero (NZ), each with a distinct timeframe target. Table 3 shows the name, references, and assumptions of each model scenario.

3. Results

This project explores the outcomes of the six scenarios, BAU, LC, CP45, CP56, NZ50, and NZ60, which have been examined, with a focus on three criteria: power generation and installed capacity, total system costs, and CO2 emissions. A comprehensive comparison is undertaken between the outcomes of the business as usual (BAU) and other alternative scenarios.

3.1. Power Generation and Installed Capacity

Figure 2 and Figure 3 illustrate the electricity production and annual installed capacity by scenarios. BAU is a business-as-usual scenario which is the national baseline scenario in Nationally determined contributions (NDCs) and this study. This scenario focuses only on fossil-based technologies without any renewables. So, a large portion of the electricity generated in the BAU and LC scenarios comes from coal, with a maximum of 5600 PJ in 2070 (Figure 2). Similarly, in Figure 3, CFPPs capacity is predicted to be the highest-used technology in BAU and LC scenarios accounting for 247 GW and 180 GW respectively. In the BAU scenario, the largest share of investments is coal, while clean power plants account for a small portion. In contrast, there is a significant proportion of renewables in the LC scenario, including solar (163 GW), wind (144 GW), and solar with storage (93 GW) (Figure 3).
On the other hand, clean electricity production is predominant in the CP45, CP56, NZ50 and NZ60 scenarios as shown in Figure 2. Solar and solar with storage are expected to be the most widely used technology in both the CP scenarios, while NZ scenarios rely on solar and onshore wind power plants. Although there is an 11-year gap between the CP45 and CP56 scenarios, they have similar installed capacity and supply generations. As a result of retiring coal plants, they rely heavily on renewable energy, especially biomass. Biomass power plants are the primary power generation in CP45 and CP56 scenarios, with a total generation of 52,716.89 and 47,740.50 PJ, respectively (Figure 2). However, the proportion of natural gas increased after coal was retired, decreasing the share of renewable energy in both scenarios (Figure 4). Additionally, gas-fired power plants are becoming more popular because they are more abundant, cheaper, and easier to access than renewable energy sources. According to Figure 3, natural gas increases to meet the rising demand, which can go up to 86 GW in the CP45 and 67 GW in the CP56 scenario by the end of their period.
According to the results, renewable technologies account for a similar share of electricity production and installed capacity in both the NZ50 and NZ60 scenarios, forecasted to grow from around 80% in 2030 to 100% in the 2070 NZ50 and NZ60 scenarios (Figure 4). Solar power plays a vital role in both scenarios for supplying electricity and with regard to installed capacity, resulting in higher power generation and capacity. The NZ50 scenario invests in solar and onshore wind energy, with a small proportion of coal, natural, CCGT gas and SCGT gas remaining until 2050 (Figure 2 and Figure 3). By 2050, NZ50 will have 100% renewable energy in its energy mix. Similarly, solar PV (utility), and onshore wind dominate its energy mix in the NZ60 scenario, but coal, natural gas, CCGT gas, and SCGT gas capacity will remain a small portion until 2060. A possible reason for the outstanding installed capacity in the NZ scenarios (Figure 3) is that the main energy source, CCFPs, is hardly constrained throughout a timeframe. So, the models seek alternative energy sources, especially renewables such as solar power plants and offshore wind.

3.2. Costs

Figure 5 compares the discounted costs of six scenarios in a million USD from 2020 to 2070, separating the total costs into three categories: capital, fixed, and variable costs. This paper used a 10% discount rate, which is a typical value, to set a benchmark for considering risks in a future investment [1]. The electricity generation in the BAU scenarios heavily relies on coal. There are a few clean energy sources, while the CFPP investment is eight times higher than the investment in geothermal power plants. So, BAU has the highest variable cost relative to the other scenarios due to fuels from the high fossil-based activity and new investments. However, BAU also uses fewer new technologies, resulting in lower fixed and capital costs. The LC scenario is developed to find the cheapest pathway to meet future demand. With a cost of only 4300 billion USD, this represents the lowest energy expenditure for Indonesia to meet its energy needs. In this scenario, renewable energy has more room to grow, even though it costs 1700 billion USD less than BAU (Figure 5). Thus, deploying renewable power plants can reduce the investment needed in the energy sector.
Comparatively, the cost of CP45 and CP56 scenarios do not differ according to their share of renewables. Overall, the coal phase-out scenarios still have higher variable chaos due to the presence of other CO2-emitting technologies such as oil and gas sectors. According to the results, renewables and solar power play a significant role in NZ50 and NZ60 scenarios for supplying electricity and investing in installed capacity (Figure 5). Consequently, fixed, and variable costs differ according to the selected power plants in these scenarios. However, the total price does not differ significantly.
The modelling findings indicate that all scenarios can provide electricity to Indonesia’s energy sector, but not all pathways are effective in terms of costs, environmental impact, and implementation period. When the NZ scenarios are implemented with the same initial budget as BAU, they will have a substantial advantage in long-term savings due to lower fuel variable costs.

3.3. Annual Carbon Dioxide Emissions

Undoubtedly, the BAU scenario will emit more CO2 than any other scenario over the modelling period (Figure 6). Consequently, it is expected to increase significantly. BAU consists only of fossil-based technologies that release much more carbon dioxide into the atmosphere. This scenario generates some renewable energy, but the capacity is too small to impact the energy mix significantly. In this study, the BAU scenario is chiefly considered a reference scenario, as it will not achieve an energy transition. In Figure 6 and Figure 7, the CO2 emissions in the LC scenario are less than in the BAU scenario but do not achieve carbon neutrality. Similarly, the leading electricity generators also come from CO2-emitting technologies. Although the model estimates that renewable energy will account for 70% of 2070, it saves only 30% of carbon emissions (Figure 8). Therefore, the LC scenario is not considered the best option for the energy transition. The sharp decline in the LC scenario is caused by the ending of the time frame and can be amended by shortening the ended year.
Both CP45 and CP56 produce similar outcomes because they have the same constraints; the only difference is the target year to achieve the coal phaseout ultimately. However, the delay in the coal phaseout has resulted in CP56 emitting nearly 3000 MtCO2 more than CP45, making the cumulative carbon dioxide emissions of CP56 slightly higher than CP45 (Figure 6). Biomass and solar production are both used in the production of electricity in CP45 and CP56. Despite the absence of new CFPPs and no coal activity after the targeted year, a small proportion of other fossil-based power generations still contribute carbon dioxide to the atmosphere. Compared to the BAU scenario (Figure 8), CP45 and CP56 can reduce CO2 emissions by 70% and 65%, respectively. However, neither scenario results in zero carbon. In Indonesia’s energy mix, the coal phaseout scenario can reduce CO2 emissions significantly but not enough to create a complete energy transition.
Alternatively, achieving the energy transition through net-zero scenarios is possible. This project focuses on achieving net zero by 2050 and 2060. The result illustrates that NZ50 releases the least carbon dioxide with only around 10,100 MtCO2 or 86% carbon savings compared to the BAU as renewable technologies dominate the energy mix (Figure 8). In the same way, the NZ60 scenario emits CO2 of only around 17,000 MtCO2, which is a 76% reduction over the BAU, second only to the NZ50 scenario (Figure 8). There is a significant difference between the NZ60 and NZ50 in CO2 emissions, although NZ60 has almost the same share of renewable shares as NZ50. One of the possible reasons is that a ten-year gap between 2050 and 2060 allows fossil-based power plants in the NZ60 scenario to generate an extra 2500 MtCO2 in the intervening years (Figure 7).

4. Discussion

The Discussion section delves into a comprehensive analysis of the six explored scenarios: BAU, LC, CP45, CP56, NZ50, and NZ60. A thorough comparison is undertaken between the outcomes of these scenarios and previous long-term energy modelling. Next, this section provides an in-depth exploration of policy recommendations derived from the modelling results, offering an understanding of the implications and potential strategies for energy transition development in Indonesia.

4.1. Long-Term Energy Modelling Comparison

This section compares scenarios based on current policy and existing energy models with optimal scenarios. The BAU and NZ60 scenarios refer to the first NDCs in 2016 and Indonesia’s commitment, while CP56 corresponds to PLN’s announcement in 2021. In comparison, LC is the most economical way to meet future energy demand, while CP45 and NZ50 scenarios are optimal goals to achieve.
The updated NDCs include a goal of using 31% renewable energy, as well as a minimum 25% reduction in coal, oil, and gas usage by 2050 [26]. In contrast, this study suggests that Indonesia has a much higher potential to expand at least 47% renewable capacity growth in LC and at most 100% in NZ50 by 2050. One possible reason is that NDCs scenarios may focus on enhancing energy efficiency, introducing renewable energy to electricity, and using alternative fuels for transportation rather than CO2-emitting technologies.
The RUPTL 2021–2030 is another energy strategy plan aiming to accelerate investment in clean energy in Indonesia to achieve net-zero emissions by 2060. Ref. [27] mention that the RUPTL 2021–2030 aimed to scale up the total share of NRE in the energy mix to 24.8% before 2030 to achieve the target. However, the modelled outcomes of this study illustrated that the proportion of clean energy capacity in 2030 of the CP45, CP56, NZ50 and NZ60 scenarios is higher than the (RUPTL) 2021–2030 prediction, accounting for 73%, 66%, 87% and 87%, respectively.
To achieve the PLN’s coal retirement target, ref. [25] reported that the energy mix requires about 5400 PJ of renewable-generated electricity by 2050. Even though the PLN’s coal phaseout scenario cannot result in zero carbon emissions, new renewable energy installations are essential for the country to step closer to its national targets. According to the coal phaseout results, clean energy in the CP45 scenario can produce an average of 3510 PJ, while the CP56 can generate 3046 PJ by 2050. The predicted number is lower than PLN’s prediction. Another study on a coal phaseout scenario—financing Indonesia’s coal phase-out, a report published by IESR—showed that the accelerated coal phaseout scenario is feasible by 2045 with international help [3]. Also, this study corresponds and confirms that CP45 is feasible by gradually reducing all coal activities, ultimately leading to a 70% reduction in CO2 emissions compared to the BAU scenario.
This study is also in alignment with earlier research that employed OSeMOSYS to explore energy transition pathways. Consistent with [14], this study concludes that elevating the large share of renewables in the energy mix is essential to reach the energy transition and carbon mitigation in Indonesia. The distinction between this study and [14] is that, despite the renewable energy share in CP45, CP56, NZ50, and NZ60 potentially exceed over 40% since 2030, CO2 emissions experience an 80% reduction from their coal-dependence scenario by 2050 only occurring in CP45 and NZ50. The difference in numerical values and years between this study and [14] could be attributed to variations in datasets and software tools used as [14] integrated OSeMOSYS with LEAP. This potentially influences the modelling outcomes, resulting in differences in the reported figures and timelines.
Similar to [15], this paper corresponds that it is significant to deploy bioenergy, solar, and wind to meet Sumatra’s energy requirements after coal dependence reduction. This result suggests that deploying bioenergy and solar PV in CP45 and CP56, along with solar PV and wind energy in NZ50 and NZ60, represents a more cost-effective strategy for realizing energy transition in Indonesia. Consistent with the findings in [16], this project underscores that escalating renewable energy deployment could lead to a nearly 30% reduction by 2030 and an 85% reduction by 2070 in the NZ50 scenario. Additionally, the study emphasises the pivotal role of investing in wind energy for an effective energy transition, particularly in net zero scenarios. However, it is noteworthy that this result suggests a comparatively smaller role for hydropower in achieving energy transition in Indonesia compared to other renewables, deviating from the outcomes in [16]. These variations in results may be attributed to the disparity in scale between the Suwalasi region and the entire nation.
In general, the modelling results mostly align with the Indonesia national energy plan [25,26,27], previous energy transition project [3] and past research related to OSeMOSYS [14,15,16]. However, the numerical results may differ depending on the model, the calculation, and the dataset used in the model.

4.2. Policy Recommendation

This study could serve as a guide for policymakers. NZ50 represents Indonesia’s most cost-effective pathway to the energy transition, considering electricity production, investment and carbon dioxide emissions. Although CO2 emissions in Indonesia can also be significantly reduced in CP45 and CP56, merely phasing out coal activities cannot lead to zero carbon emissions. The level of carbon dioxide in CP45 and CP56 scenarios cannot fall to zero due to the existence of other fossil-based power plants and the rise of natural gas. Therefore, the only pathways that can reach carbon neutrality are NZ50 and NZ60. Although NZ50 has similar costs to NZ60, NZ50 has fewer CO2 emissions than NZ60.
A vital component of the energy transition is reducing CO2 emissions from energy-related sources to limit climate change. Accordingly, neither reducing carbon emissions only from coal technologies nor deploying new renewables is sufficient to achieve the Net-zero goal; both these actions need to be taken simultaneously. Thus, Indonesia’s power sector will only achieve energy transition through NZ50 and NZ60 scenarios. By 2050, the goal of becoming carbon neutral would save more funds and reduce CO2 emissions more effectively than any other scenario. According to NZ50, Indonesia must adopt and deploy 87% renewable energy before 2030 and meet 100% renewables in 2070. While deploying more renewable energy, the government needs to quickly phase out CFPPs and other CO2-emitting technologies in the next few years to achieve the transition to a carbon-free energy system and reach net zero by 2060 or sooner.

5. Conclusions

This study shows reasonable pathways to reach energy transition in Indonesia. based on OSeMOSYS modelling. All presented scenarios are possible to meet Indonesia’s future energy demand at their lowest implementing cost; however, some scenarios are more cost-effective than others in terms of costs, environmental impact, and implementation period. Although CO2 emissions in Indonesia can also be significantly reduced in CP45 and CP56, merely phasing out coal activities cannot lead to an energy transition due to the existence of other fossil-based power plants and the rise of natural gas. Also, it is evident from previous research and this study that a coal phase-out by 2045 cannot be achieved without international support [9]. CP45 reduces CO2 emissions significantly and costs less than NZ50 but may not be feasible for Indonesia since coal is still heavily used in their energy mix. So, the only appropriate pathways that can reach carbon neutrality are NZ50 and NZ60. NZ50 has a lower CO2 footprint than NZ60 despite having almost the same cost. Therefore, it can be concluded that NZ50 is the most cost-effective pathway to energy transition in Indonesia, considering readiness, feasibility, and environmental benefits.
The paper emphasises that phasing out carbon-emitting technologies and new renewable energy (NRE) is imperative to the energy transition’s success. Indonesia has an excellent opportunity to reduce its energy sector’s climate impact through superior renewable technologies and the phaseout of fossil-based technologies. According to the NZ50 model, increasing solar PV capacity is essential to meet future energy demands, which will become more feasible and worthwhile as solar prices decline. As shown in NZ50, phasing out all fossil-based activities and increasing NRE deployment can dramatically reduce climate change-causing CO2 emissions, and it will finally be possible to transition to carbon neutrality in the energy sector.

Future Work

This project presents a holistic energy analysis of Indonesia’s energy section, but there are some limitations in scenario development and model application. The assumptions and results are based on a future-oriented analysis, which makes them uncertain. Inconsistent data and unpredictable events, such as natural disasters, make it impossible to predict the exact outcome in advance. So, it would be beneficial to conduct a further in-depth detailed analysis of the cost, flexibility implications and alternative technologies.
The assumptions and results in this project are based on a modelled analysis, so in-depth cost analyses are advised to develop the results regarding financial implications. In addition, further flexibility and sensitivity analysis can be performed to improve the results. For example, policy flexibility and external factors can be examined to evaluate the model’s response to variations in policy instruments and their effectiveness. This includes assessing the influence of investment budget and infrastructure constraints on the achievement of energy transition goals. Scenario, technology, and temporal sensitivity analysis are also recommended to observe the corresponding impact on the model’s outputs when altering technologies or timeframe goals. Better estimations will allow policymakers to make better decisions and update plans for future policies and investments.
Exploring alternative scenarios involving optional clean technologies is a valuable insight as these newer technologies may lead to more sustainable and efficient solutions for the country’s energy transition. For example, carbon capture and storage (CCS) applications must be considered in the energy transition to provide the most accurate scenarios and results, as such technologies will be crucial to carbon neutrality and decarbonisation planning. However, CCS is not included in this study due to limitations in OSeMOSYS. The CCS application is still under investigation to provide the most accurate scenarios and results.

Author Contributions

Writing—original draft, P.P.; Writing—review & editing, S.P.; Supervision, G.O., M.H., R.Y. and C.C. All authors have read and agreed to the published version of the manuscript.

Funding

This research was funded by the Loughborough University Climate Compatible Growth programme, grant number GT123, for £ 6000.

Data Availability Statement

Data are contained within the article.

Acknowledgments

This material has been produced under the Climate Compatible Growth (CCG) programme, which brings together leading research organizations and is led out of the STEER centre, Loughborough University. CCG is funded by FCDO from the UK government. However, the views expressed herein do not necessarily reflect the UK government’s official policies. This work was developed with the Energy Transition Council (ETC), which assisted in identifying needed research areas and connected to relevant stakeholders for a discussion on essential aspects of research. This paper was reviewed and edited by Simon Patterson (CCG, Loughborough University).

Conflicts of Interest

The authors declare no conflict of interest.

Abbreviations

ADBAsian Development Bank
CCGClimate Compatible Growth
CCSCarbon Capture and Storage
CFPPsCoal-Fired Power Plants
COP 26The 26th Conference of The Parties
ESMEnergy System Model
ETMEnergy Transition Mechanism
GHGsGreenhouse gases
IEAInternational Energy Agency
IESRInstitute for Essential Services Reform
IPCCInternational Panel on Climate Change
IRENAInternational Renewable Energy Agency
LEAPLow Emissions Analysis Platform
LTS-LCCR2050 Low Carbon and Climate Resilience 2050
MEFMinister for Environment and Forestry
MEMRMinistry of Energy and Mineral Resources
NDCsNationally Determined Contributions
NREnew renewable energy
OSeMOSYSOpen-Source Energy Modelling System
PLNPerusahaan Listrik Negara
RESReference Energy System
RUENThe National Energy Plan
RUKNThe National Electricity Master Plan
RUPTLThe National Electricity Supply Business Plan

References

  1. IRENA. Energy Transition. Available online: https://www.irena.org/energytransition (accessed on 10 August 2022).
  2. Minister of Environment and Forestry. INDONESIA Long-Term Strategy for Low Carbon and Climate Resilience 2050. 2021. Available online: https://unfccc.int/sites/default/files/resource/Indonesia_LTS-LCCR_2021.pdf (accessed on 15 August 2022).
  3. Cui, R.; Tumiwa, F.; Zhao, A.; Arinaldo, D.; Wiranegara, R.; Cui, D.; Dahl, C.; Myllyvirta, L.; Squire, C.; Simamora, P.; et al. Financing Indonesia’s Coal Phaseout: A just and Accelerated Retirement Pathway to Net-Zero Financing Indonesia’s Coal Phaseout: A Just and Accelerated Retirement Pathway to Net-Zero, Center for Global Sustainability; University of Maryland: College Park, MD, USA; Institute for Essential Services Reform: Jakarta, Indonesia, 2022. [Google Scholar]
  4. IRENA. Renewable Energy Prospects: A Renewable Energy Roadmap; IRENA: Masdar City, United Arab Emirates, 2017. [Google Scholar]
  5. Suharsono, A.; Lontoh, L. Indonesia’s Energy Policy Briefing; International Institute for Sustainable Development: Winnipeg, MB, Canada, 2022. [Google Scholar]
  6. Asian Development Bank. Indonesia Energy Sector Assessment, Strategy and Road Map Updates; Asian Development Bank: Mandaluyong, Philippines, 2021. [Google Scholar] [CrossRef]
  7. Moksnes, N.; Welsch, M.; Gardumi, F.; Shivakumar, A.; Broad, O.; Howells, M.; Taliotis, C.; Sridharan, V. Working Paper Series 2015 OSeMOSYS User Manual; Royal Institute of Technology: Stockholm, Sweden, 2015. [Google Scholar]
  8. Howells, M.; Quiros-Tortos, J.; Morrison, R.; Rogner, H.; Niet, T.; Petrarulo, L.; Usher, W.; Blyth, W.; Godínez, G.; Victor, L.F.; et al. Energy System Analytics and Good Governance -U4RIA Goals of Energy Modelling for Policy Support. Res. Sq. 2021, preprint. [Google Scholar] [CrossRef]
  9. Gaur, A.S.; Das, P.; Jain, A.; Bhakar, R.; Mathur, J. Long-Term Energy System Planning Considering Short-Term Operational Constraints. Energy Strategy Rev. 2019, 26, 100383. [Google Scholar] [CrossRef]
  10. Prina, M.G.; Manzolini, G.; Moser, D.; Nastasi, B.; Sparber, W. Classification and challenges of bottom-up energy system models—A review. Renew. Sustain. Energy Rev. 2020, 129, 109917. [Google Scholar] [CrossRef]
  11. Howells, M.; Rogner, H.; Strachan, N.; Heaps, C.; Huntington, H.; Kypreos, S.; Hughes, A.; Silveira, S.; DeCarolis, J.; Bazillian, M.; et al. OSeMOSYS: The Open Source Energy Modeling System. Energy Policy 2011, 39, 5850–5870. [Google Scholar] [CrossRef]
  12. Allington, L.; Cannone, C.; Pappis, I.; Cervantes Barron, K.; Usher, W.; Pye, S.; Brown, E.; Howells, M.; Zachau Walker, M.; Ahsan, A.; et al. Selected “Starter Kit” Energy System Modelling Data for Selected Countries in Africa, East Asia, and South America (#CCG, 2021). Data Brief 2022, 42, 108021. [Google Scholar] [CrossRef]
  13. Lavigne, D. OSeMOSYS Energy Modeling Using an Extended UTOPIA Model. Univers. J. Educ. Res. 2017, 5, 162–169. [Google Scholar] [CrossRef]
  14. Kumar, S. Assessment of Renewables for Energy Security and Carbon Mitigation in Southeast Asia: The Case of Indonesia and Thailand. Appl. Energy 2016, 163, 63–70. [Google Scholar] [CrossRef]
  15. Sani, L.; Khatiwada, D.; Harahap, F.; Silveira, S. Decarbonization Pathways for the Power Sector in Sumatra, Indonesia. Renew. Sustain. Energy Rev. 2021, 150, 111507. [Google Scholar] [CrossRef]
  16. Sarjiya; Putranto, L.M.; Tumiran; Budi, R.F.S.; Novitasari, D.; Deendarlianto. Generation Expansion Planning with a Renewable Energy Target and Interconnection Option: A Case Study of the Sulawesi Region, Indonesia. Renew. Sustain. Energy Rev. 2023, 183, 113489. [Google Scholar] [CrossRef]
  17. Sarjiya; Putranto, L.M.; Budi, R.F.S.; Novitasari, D.; Deendarlianto; Tumiran. Role of the Energy-Carbon-Economy Nexus and CO2 Abatement Cost in Supporting Energy Policy Analysis: A Multi-Scenario Analysis of the Java-Bali System. Renew. Sustain. Energy Rev. 2023, 187, 113708. [Google Scholar] [CrossRef]
  18. Quevedo, J.; Moya, I.H. Modeling of the Dominican Republic Energy Systems with OSeMOSYS to Assess Alternative Scenarios for the Expansion of Renewable Energy Sources. Energy Nexus 2022, 6, 100075. [Google Scholar] [CrossRef]
  19. Olsson, J.M.; Gardumi, F. Modelling Least Cost Electricity System Scenarios for Bangladesh Using OSeMOSYS. Energy Strategy Rev. 2021, 38, 100705. [Google Scholar] [CrossRef]
  20. Gebremeskel, D.H.; Ahlgren, E.O.; Beyene, G.B. Long-Term Electricity Supply Modelling in the Context of Developing Countries: The OSeMOSYS-LEAP Soft-Linking Approach for Ethiopia. Energy Strategy Rev. 2023, 45, 101045. [Google Scholar] [CrossRef]
  21. Dallmann, C.; Schmidt, M.; Möst, D. Between Path Dependencies and Renewable Energy Potentials: A Case Study of the Egyptian Power System. Energy Strategy Rev. 2022, 41, 100848. [Google Scholar] [CrossRef]
  22. Hassen, B.N.; Surroop, D.; Praene, J.P. Phasing-out of Coal from the Energy System in Mauritius. Energy Strategy Rev. 2023, 46, 101068. [Google Scholar] [CrossRef]
  23. Ministry of Energy and Mineral Resources. Handbook of Energy and Economic Statistics of Indonesia. Available online: https://www.esdm.go.id/assets/media/content/content-handbook-of-energy-and-economic-statistics-of-indonesia-2021.pdf (accessed on 15 August 2022).
  24. Yeap, J. Indonesia’s PLN to Stop Building Coal Plants by 2023. Available online: https://www.pinsentmasons.com/out-law/news/indonesias-pln-to-stop-building-coal-plants-by-2023 (accessed on 20 August 2022).
  25. Ministry of Environment and Forestry. Updated Nationally Determined Contribution Republic of Indonesia. 2022. Available online: https://unfccc.int/sites/default/files/NDC/2022-06/Updated%20NDC%20Indonesia%202021%20-%20corrected%20version.pdf (accessed on 20 August 2022).
  26. Bissett, N.; Soraya, N.; Kurniawan, F.; Sungkono, K.; Hock Ang, K. PLN’s New 2021–2030 Business Plan: High Hopes and ‘Greener’ Projects. Available online: https://insightplus.bakermckenzie.com/bm/attachment_dw.action?attkey=FRbANEucS95NMLRN47z%2BeeOgEFCt8EGQJsWJiCH2WAUTleh6%2BAJHrupJMOqEcbrp&nav=FRbANEucS95NMLRN47z%2BeeOgEFCt8EGQbuwypnpZjc4%3D&attdocparam=pB7HEsg%2FZ312Bk8OIuOIH1c%2BY4beLEAeghVfJ1aYVlM%3D&fromContentView=1 (accessed on 20 August 2022).
  27. Mentari. Update on Coal Phaseout Modelling; British Embassy Jakarta: Jakarta, Indonesia, 2022. [Google Scholar]
  28. Allington, L.; Cannone, C.; Pappis, I.; Barron, K.C.; Usher, W.; Pye, S.; Brown, E.; Howells, M.; Niet, T.; Walker, M.Z.; et al. Selected “Starter Kit” Energy System Modelling Data for Indonesia (#CCG). Res. Sq. 2021, preprint. [Google Scholar] [CrossRef]
  29. Allington, L.; Cannone, C.; Pappis, I.; Cervantes Barron, K.; Usher, W.; Pye, S.; Howells, M.; Niet, T.; Zachau Walker, M.; Ahsan, A.; et al. CCG Starter Data Kit: Indonesia (Version v1.0.0) [Data set]. Zenodo 2021. [Google Scholar] [CrossRef]
  30. Brinkerink, M.; Gallachóir, B.; Deane, P. Building and Calibrating a Country-Level Detailed Global Electricity Model Based on Public Data. Energy Strategy Rev. 2021, 33, 100592. [Google Scholar] [CrossRef]
  31. Byers, L.; Friedrich, J.; Hennig, R.; Kressig, A.; Li, X.; McCormick, C.; Malaguzzi Valeri, L. A Global Database of Power Plants; World Resources Institute: Washington, DC, USA, 2018; Available online: https://www.wri.org/publication/global-power-plant-database (accessed on 22 August 2022).
  32. Asia-Pacific Economic Cooperation. APEC Energy Demand and Supply Outlook 7th Edition. 2019. Available online: https://aperc.or.jp/publications/reports/outlook.php (accessed on 22 August 2022).
  33. IEA. IEA Sankey Diagram. International Energy Agency. 2019. Available online: https://www.iea.org/sankey/ (accessed on 30 August 2022).
  34. International Energy Agency and Index Mundi. Electric Power Transmission and Distribution Losses (% of Output)—Country Ranking—Asia. 2018. Available online: https://www.indexmundi.com/facts/indicators/EG.ELC.LOSS.ZS/rankings/asia (accessed on 16 August 2022).
  35. IRENA and the ACE. Renewable Energy Outlook for ASEAN. 2016. Available online: https://www.irena.org/-/media/Files/IRENA/Agency/Publication/2016/IRENA_REmap_ASEAN_2016_report.pdf (accessed on 15 August 2022).
  36. IRENA. Renewable Energy Statistics 2020; The International Renewable Energy Agency: Masdar City, United Arab Emirates, 2020. [Google Scholar]
  37. IRENA. Renewable Power Generation Costs in 2019, International Renewable Energy Agency, Abu Dhabi. 2020. Available online: https://www.irena.org/-/media/Files/IRENA/Agency/Publication/2020/Jun/IRENA_Power_Generation_Costs_2019.pdf (accessed on 20 June 2022).
  38. IRENA. Planning and Prospects for Renewable Power: Eastern and Southern Africa. The International Renewable Energy Agency, Abu Dhabi. 2021. Available online: https://www.irena.org/-/media/Files/IRENA/Agency/Publication/2021/Apr/IRENA_Planning_Prospects_Africa_2021.pdf (accessed on 22 August 2022).
  39. Intergovernmental Panel on Climate Change. Emissions Factor Database. Available online: https://www.ipcc-nggip.iges.or.jp/EFDB/main.php (accessed on 8 August 2022).
  40. United Nations Development Programme Asia-Pacific Regional Centre. Achieving Sustainable Energy for All in the Asia-Pacific. 2013. Available online: https://www.asia-pacific.undp.org/content/rbap/en/home/library/climate-and-disaster-resilience/APRC-EE-2013-SE4ALL.html (accessed on 10 August 2022).
  41. Binsted, M.; Iyer, G.; Cui, R.; Khan, Z.; Dorheim, K.; Clarke, L. Evaluating Long-Term Model-Based Scenarios of the Energy System. Energy Strategy Rev. 2020, 32, 100551. [Google Scholar] [CrossRef]
  42. Christian Breyer, A.; Gulagi, A.; Oyewo, D.; Bogdanov Morris, C.; Energiewende, A. Deep Decarbonisation of Indonesia’s Energy System A Pathway to Zero Emissions by 2050 in Cooperation with. Available online: https://static.agora-energiewende.de/fileadmin/Partnerpublikationen/2021/IESR_Deep_Decarbonization_Indonesia.pdf (accessed on 11 June 2022).
Figure 1. Full reference energy system (RES).
Energies 17 00075 g001
Figure 2. Electricity generation in different scenarios between 2020 to 2070.
Energies 17 00075 g002
Figure 3. Installed capacity in different scenarios between 2020 to 2070.
Energies 17 00075 g003
Figure 4. Electricity generation and Installed capacity of renewables share in different scenarios between 2020 to 2070.
Energies 17 00075 g004
Figure 5. Capital, Fixed, Variable, and total discounted cost by categories.
Energies 17 00075 g005
Figure 6. Accumulative CO2 emissions between 2020 to 2070.
Energies 17 00075 g006
Figure 7. Annual CO2 emissions between 2020 to 2070.
Energies 17 00075 g007
Figure 8. Total CO2 emissions saving compared to BAU between 2021 and 2070.
Energies 17 00075 g008
Table 1. Renewable technologies permit demand.
TechnologiesPermitted Electricity Demand
Offshore Wind10% of the demand
Utility-Scale PV, Decentralised PV, Utility-Scale PV With Storage and Onshore Wind15% of the demand
Onshore Wind with Storage25% of the demand
Biomass30% of the demand
Table 2. Energy efficiency performance permit.
ParameterDescriptionPermitted Electricity Demand
InputActivityRatioThe rate at which fuel is consumed1
OutputActivityRatiosThe rate of fuel provided1.1 and 1.3
CapacityToActivityUnitConverting technical data into activity it can generate
when one unit of capacity is fully used in one year
1
Table 3. Scenario references, assumptions, and constraints.
ScenarioReferencesAssumptions and Constraints
Business as usual, BAUThe scenario is based on the first NDCs in 2016 [25], referred to as a baseline scenario.Coal-fired power plants (CFPPs) are the primary electricity source. Renewable power plants, including geothermal, hydropower, solar PV, wind turbine, biomass and biofuel, are prohibited from investing in new facilities.
Least Cost, LCCost-optimal solutions are automatically determined and generated by OSeMOSYS. Energy efficiency and demand-side fuel (stoves, heating technologies) face gradual investment constraints, which limit annual investment to 5% of capacity without demand-side investment constraints by 2050.
Coal phaseout 2045, CP45Perusahaan Listrik Negara (PLN) plans to initiate coal retirement plans by 2030 and stop building new coal-fired plants after 2023 [25]. Ref. [3] stated that Indonesia could phase out coal in 2045 with international help.No new CFPPs will be built after 2023. Coal activities will decrease steadily until there is no coal activity after 2045. Various renewables are restricted to meet the maximum share of total demand. Future energy demands will be met with alternative technologies, especially renewables, instead of coal.
Coal phaseout 2056, CP56PLN plans to initiate coal retirement plans by 2030 and stop building new coal-fired plants after 2023 [24]. According to RUPTL 2021–2030, Indonesia wants to phase out coal and gradually reduce coal activities by constraining imported coal and CFPPs by 2056 [26].No new CFPPs will be built after 2023. Coal activities will decrease steadily until there is no coal activity after 2056. Various renewables are restricted to meet the maximum share of total demand. Future energy demands will be met with alternative technologies, especially renewables, instead of coal.
Net zero 2050, NZ50RUPTL 2021–2030 target is to achieve Net zero by 2050 [42].CO2 emissions are constrained by gradually reducing carbon-emitting technologies from 2021 to 2050 to reach carbon neutrality in 2050.Solar investment and capacity are constrained to gradually meet total demand.
Net zero 2060, NZ60According to RUPTL 2021–2030, the government aims to reach net zero by 2060 or sooner [26].CO2 emissions are constrained by gradually reducing carbon-emitting technologies from 2021 to 2060 to reach carbon neutrality in 2060.
Disclaimer/Publisher’s Note: The statements, opinions and data contained in all publications are solely those of the individual author(s) and contributor(s) and not of MDPI and/or the editor(s). MDPI and/or the editor(s) disclaim responsibility for any injury to people or property resulting from any ideas, methods, instructions or products referred to in the content.

