
Compression Ignition Internal Combustion Engine’s Energy Parameter Research Using Variable (HVO) Biodiesel and Biobutanol Fuel Blends

 ,
,  , , and
Abstract
:1. Introduction
2. Materials and Methods

| Parameter | Diesel | HVO | Biobutanol | Castor Oil |
|---|---|---|---|---|
| Density at 15 °C, kg/m3 | 835.2 | 779.1 | 810.0 | 964.4 |
| Element composition: (% mass): Carbon | 86.50 | 84.80 | 65.00 | 73.80 |
| Hydrogen | 13.40 | 15.30 | 13.55 | 11.50 |
| Oxygen | 0.0 | 0.0 | 21.50 | 14.85 |
| Stoichiometric AFR | 14.79 | 15.18 | 11.30 | 11.91 |
| Cetane number | 51 | 70 | 18 | 28 |
| Lower heating value, MJ/kg | 43.09 | 44.9 | 33.3 | 43.1 |
| Lower heating value, MJ/L | 36.90 | 34.10 | 26.71 | 39.81 |
| Purity, % | N/A | N/A | 99.5 | 100 |
| Manufacturer, City, Country | Orlean Lietuva, Juodeikiai, Lithuania | Neste, Espoo, Finland | Carl Roth GmbH, Karlsruhe, Germany | Biochemlit, Kaunas, Lithuania |
| Properties | HVOB5 | HVOB10 | HVOB20 |
|---|---|---|---|
| Density at 15 °C, kg/m3 | 780.5 | 782.4 | 786.4 |
| Element composition: (% mass): Carbon | 83.45 | 82.55 | 80.58 |
| Hydrogen | 15.32 | 15.25 | 15.03 |
| Oxygen | 1.11 | 2.21 | 4.41 |
| Stoichiometric AFR | 14.99 | 14.77 | 14.38 |
| Cetane number | 67.3 | 64.7 | 59.3 |
| Lower heating value, MJ/kg | 43.55 | 42.98 | 41.88 |
| Lower heating value, MJ/L | 33.98 | 33.64 | 32.93 |
3. Results
4. Discussion
5. Conclusions
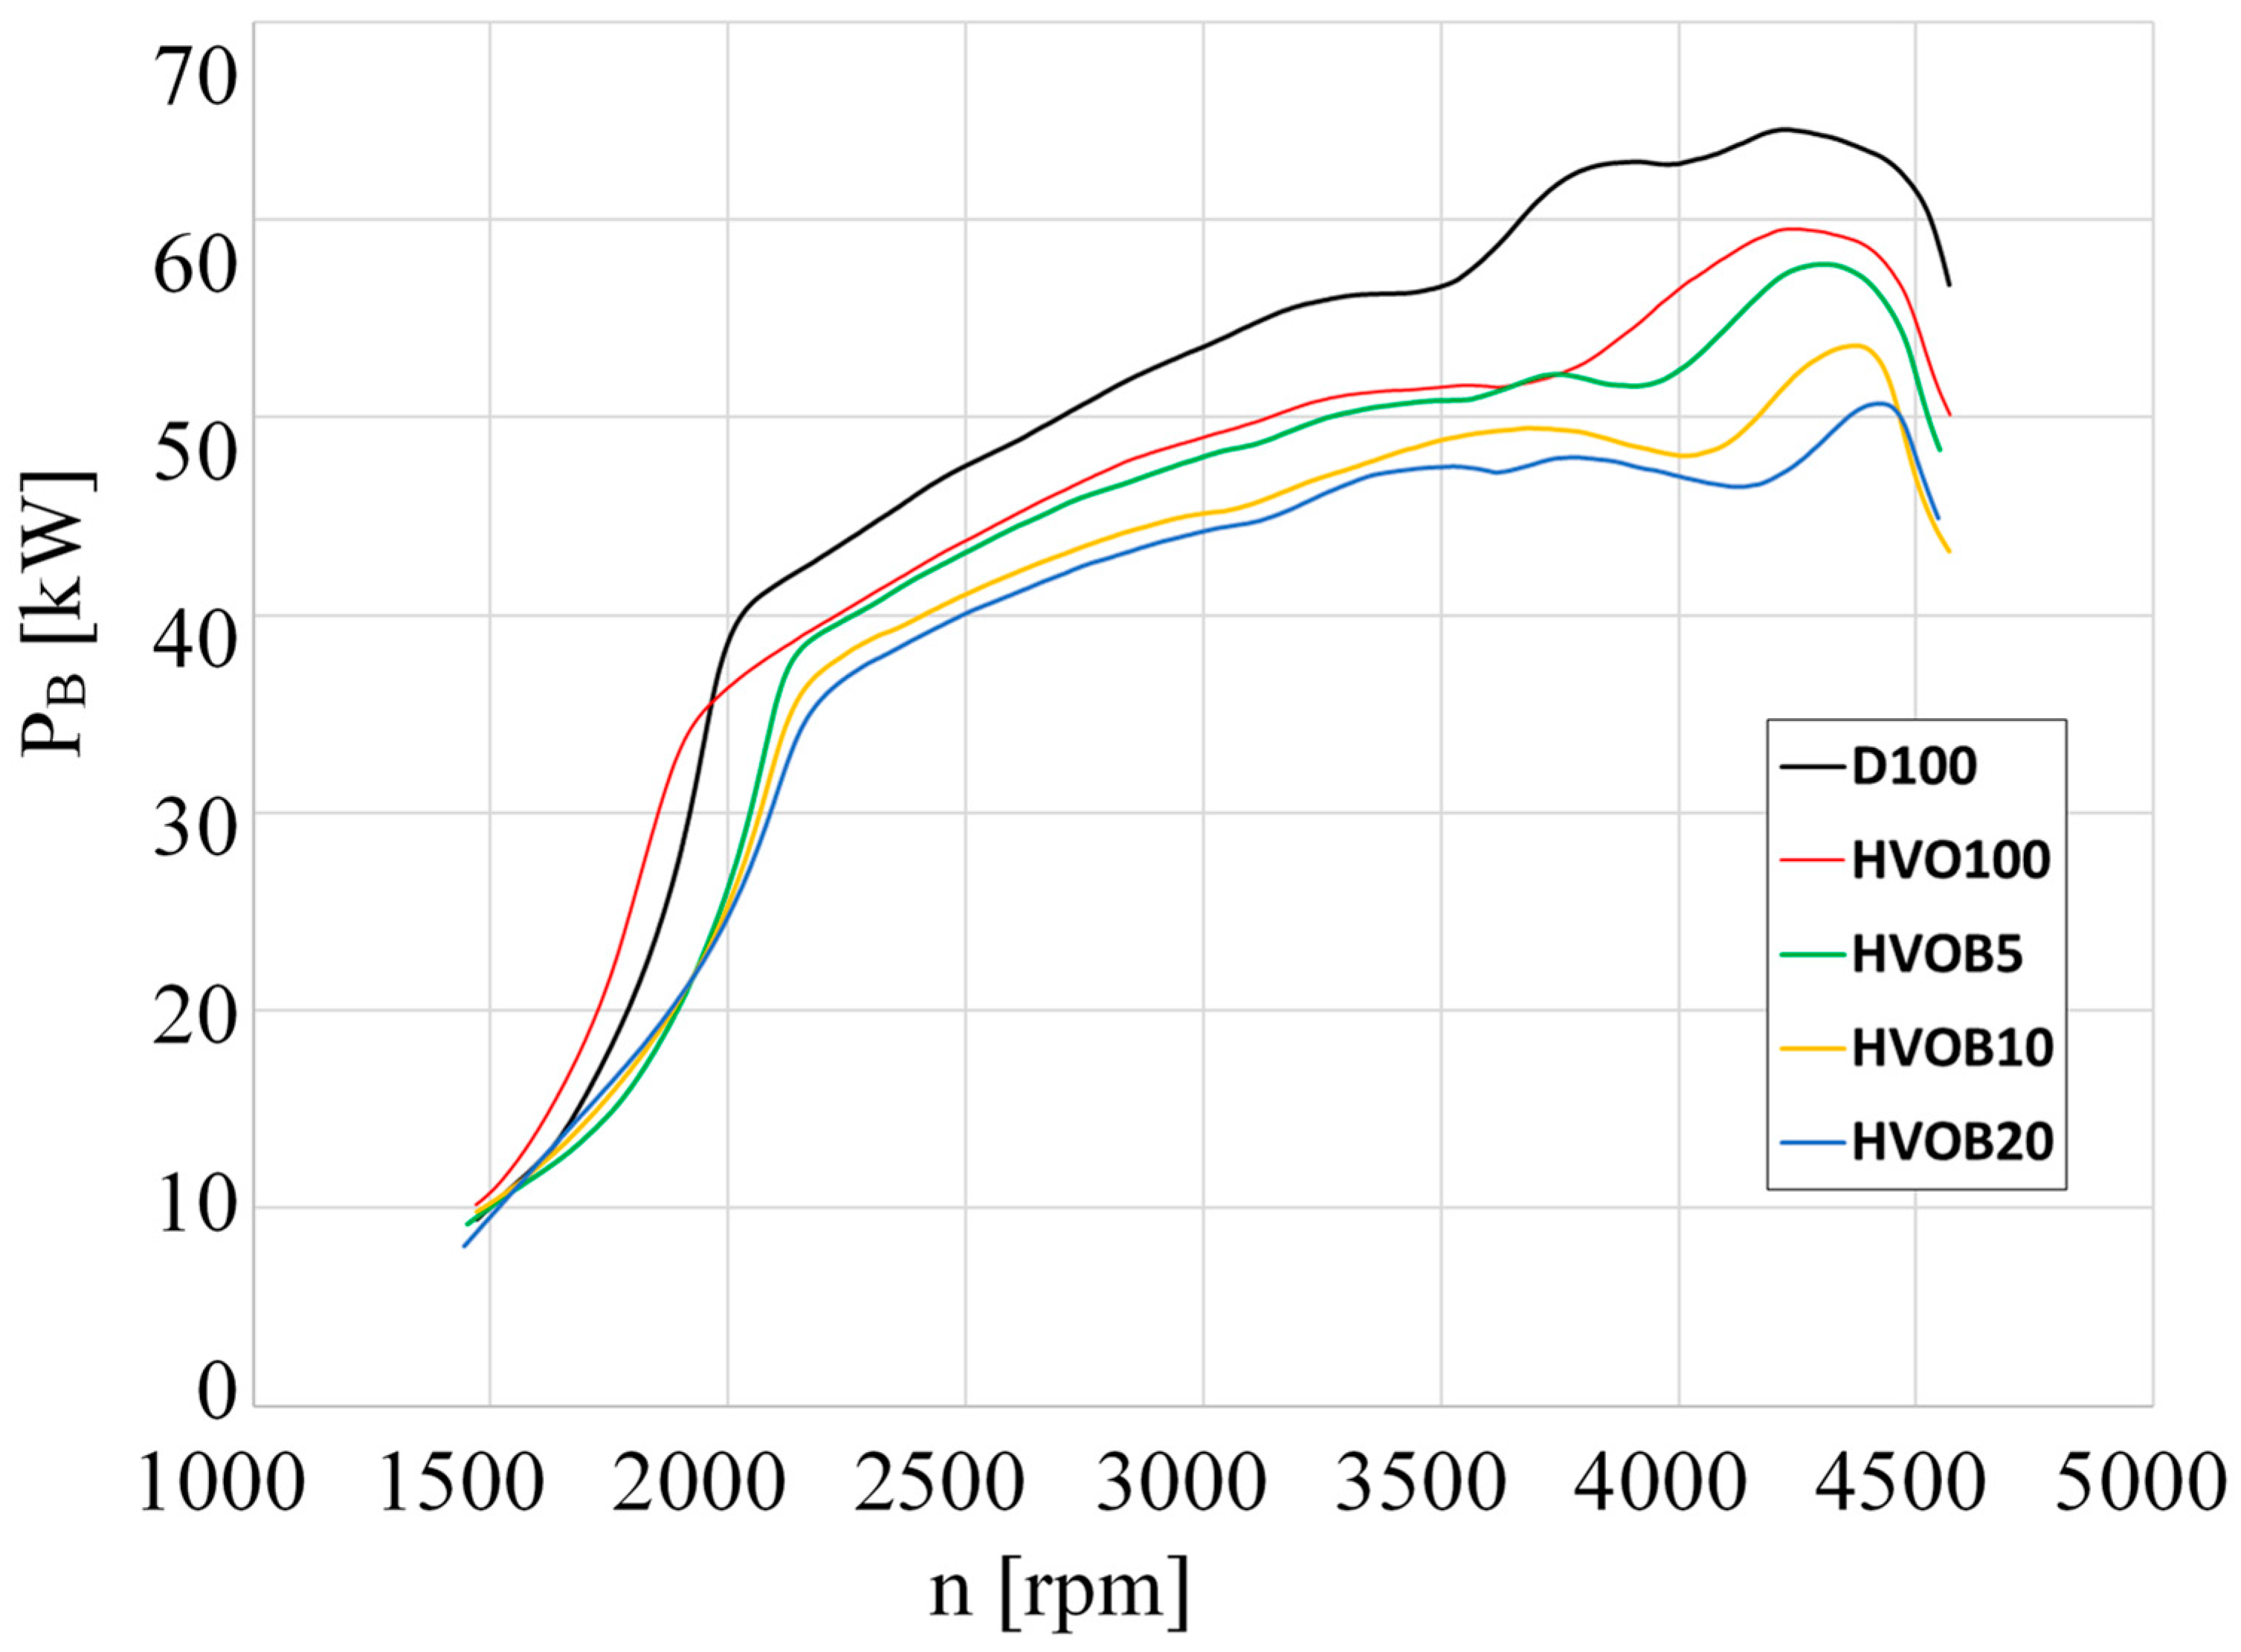
- The maximum power output of D100 gasoline is 64.5 kW. However, when using HVO100 fuel, there is an 8% loss in power output. Similarly, HVOB5 fuel results in an 11% decrease, HVOB10 fuel leads to a 17% decrease, and HVOB20 fuel causes a 22% decrease in power output.
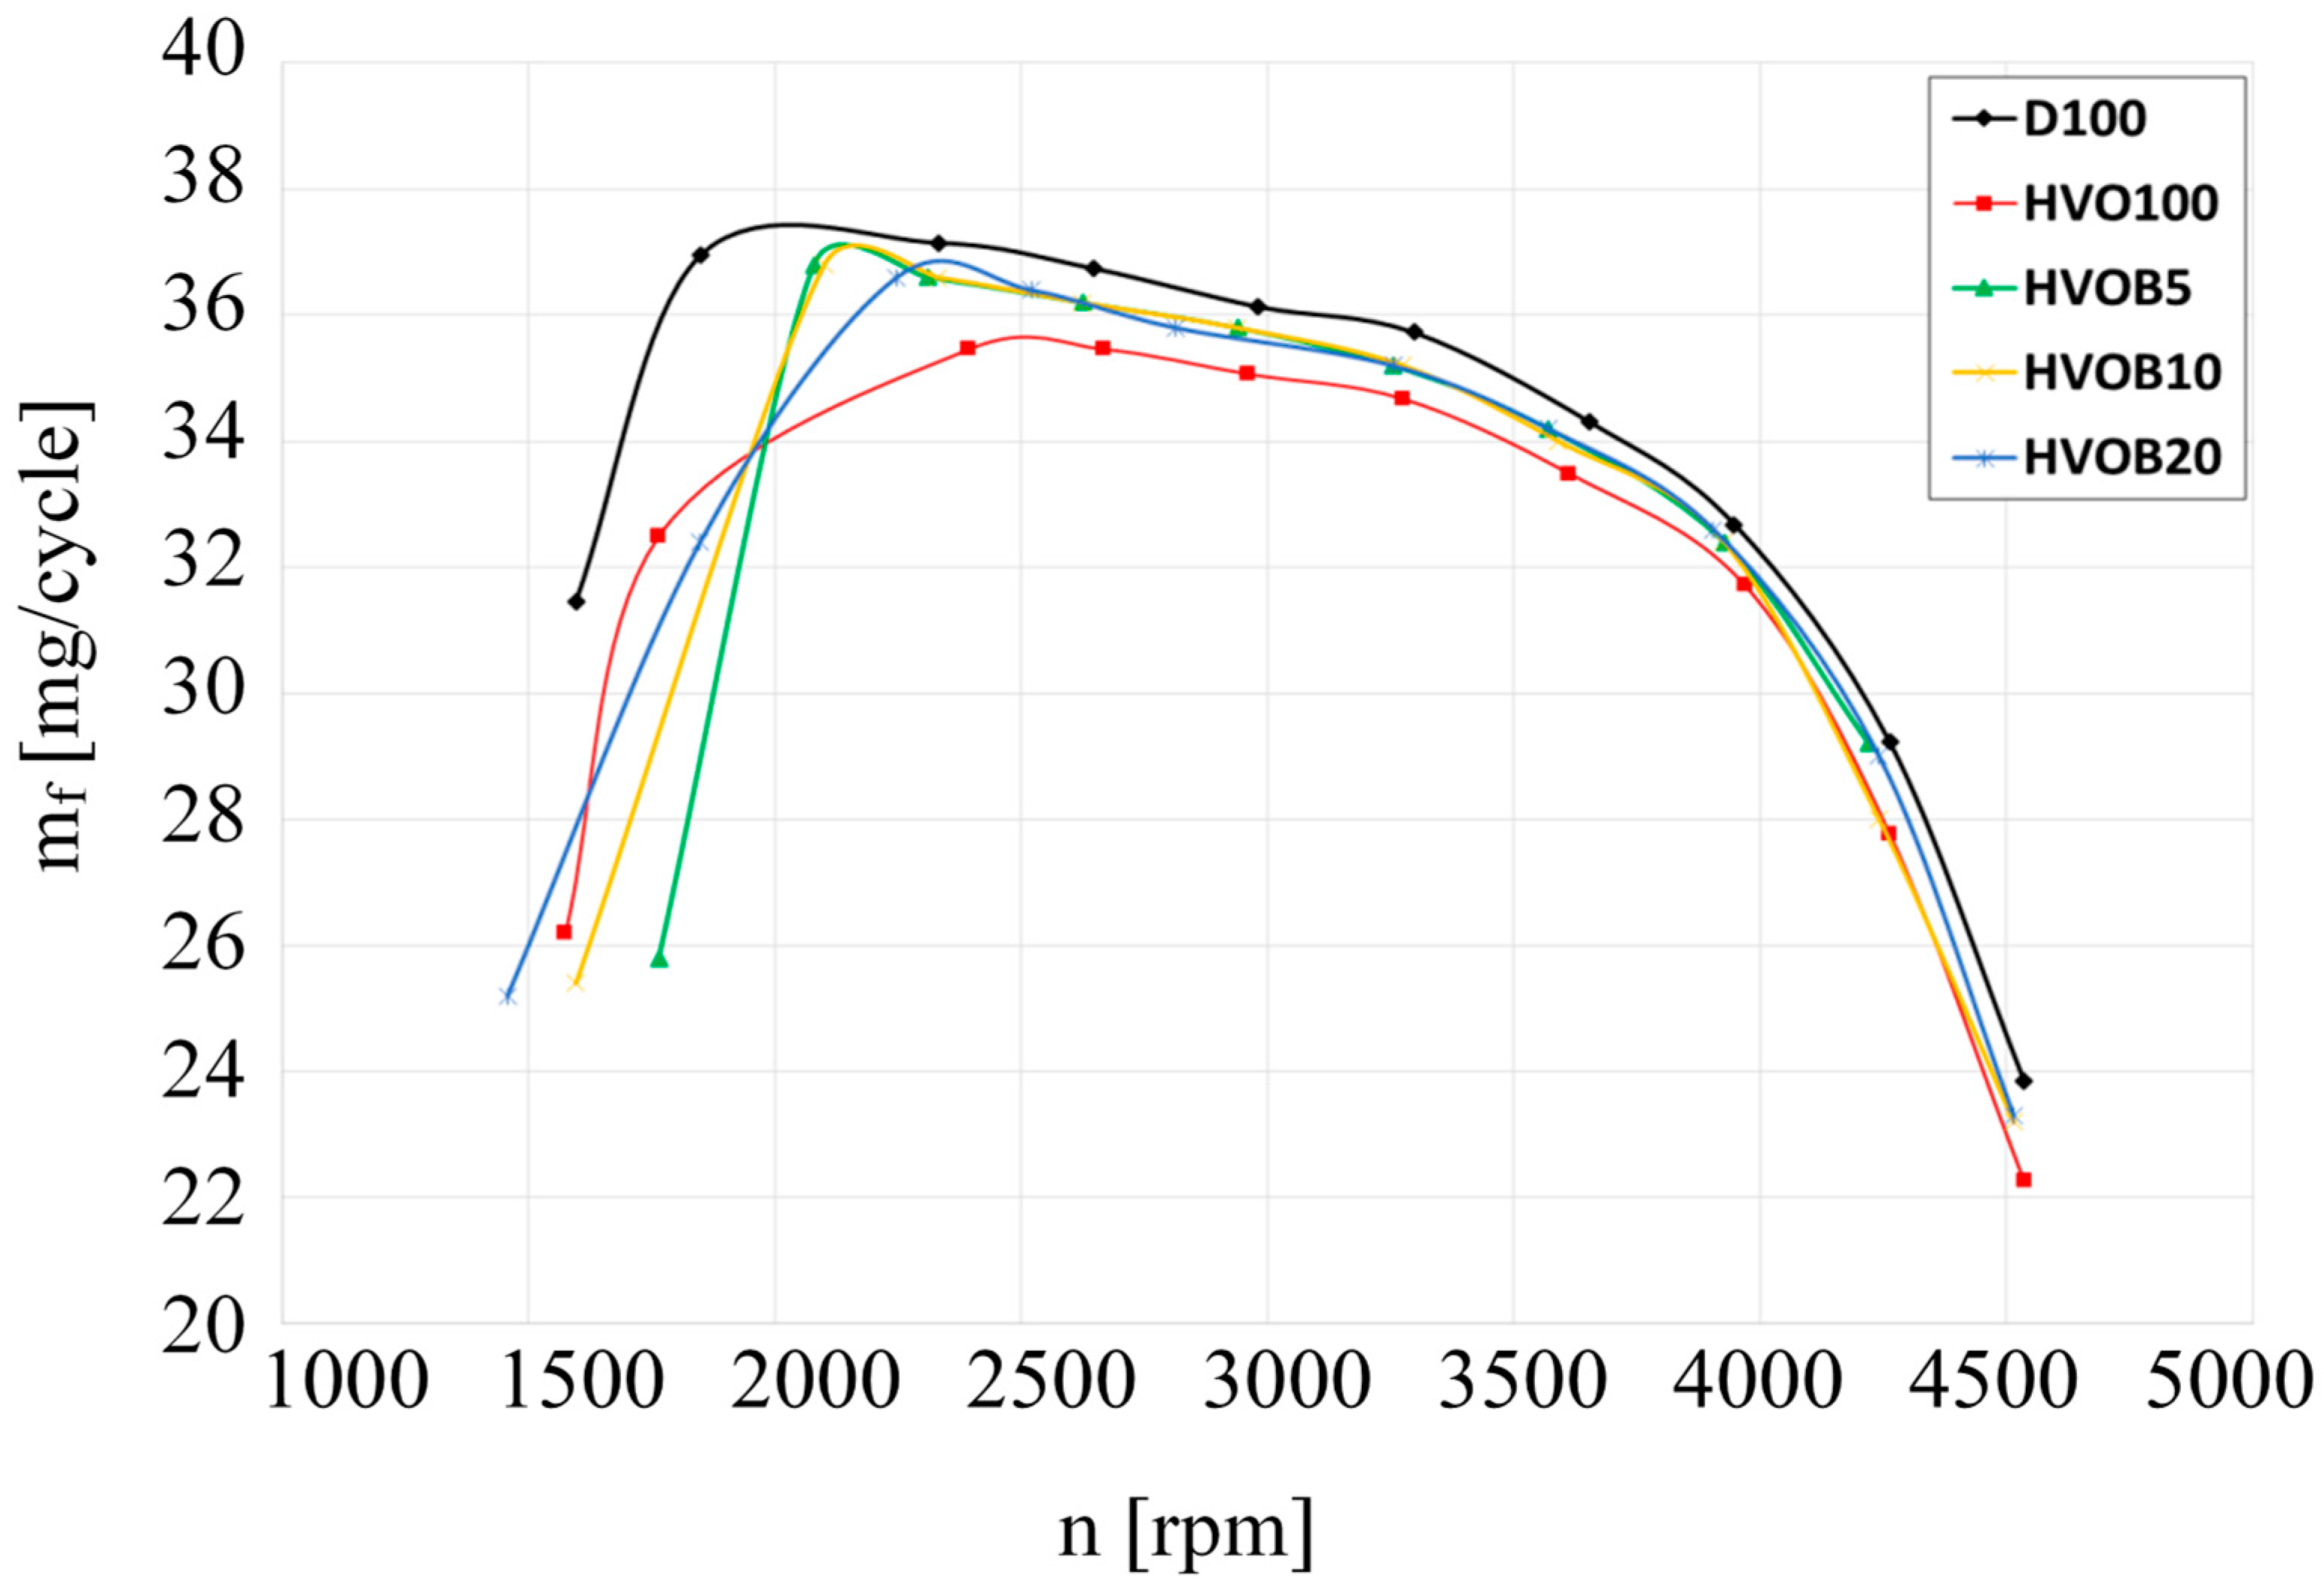
- The research conducted revealed that the mass fraction (mf) of HVO100 fuel experiences a reduction of 17% when blended with biobutanol as the engine speed hits 4500 rpm. Additionally, a little alteration in the observed trend is observed at this specific engine speed.
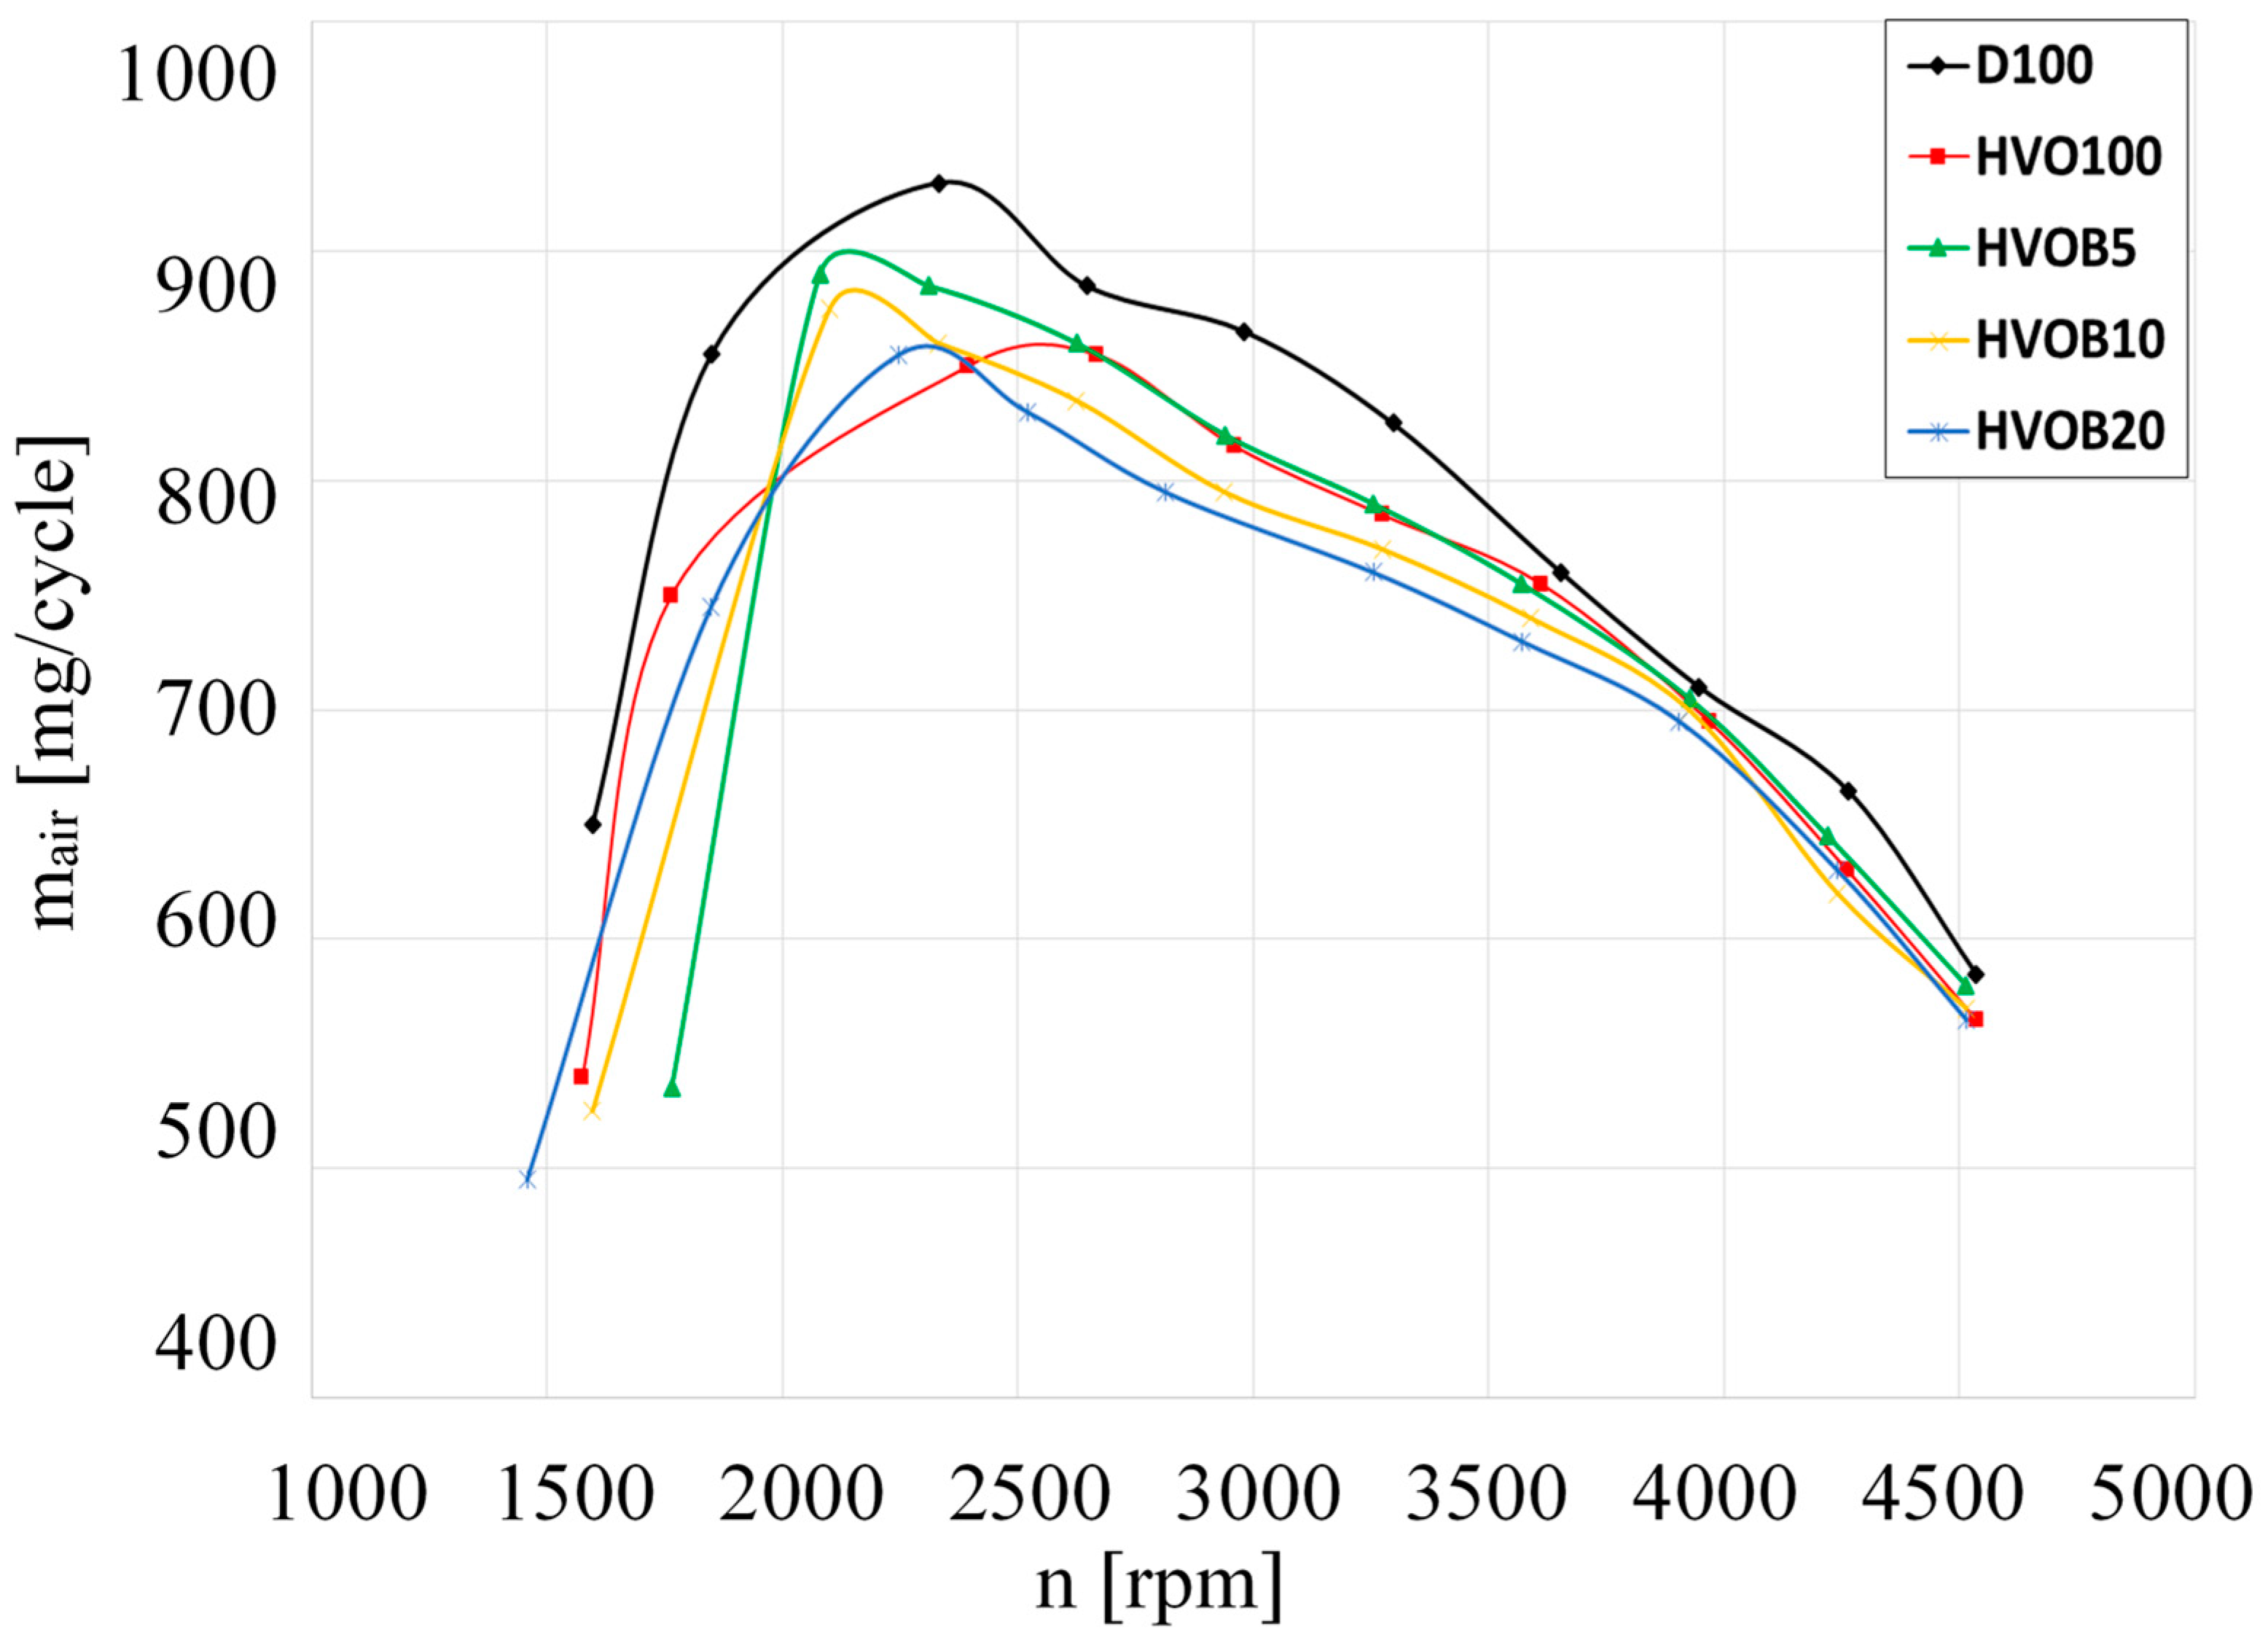
- The use of D100 fuel resulted in the attainment of the highest air mass at an engine speed of 1500 revolutions per minute (rpm). However, the subsequent switch to HVO100 fuel led to a reduction of approximately 17% in the aforementioned air mass. The values of HVOB5, HVOB10, and HVOB20 dropped as the concentration of biobutanol grew from 5% to 20%.
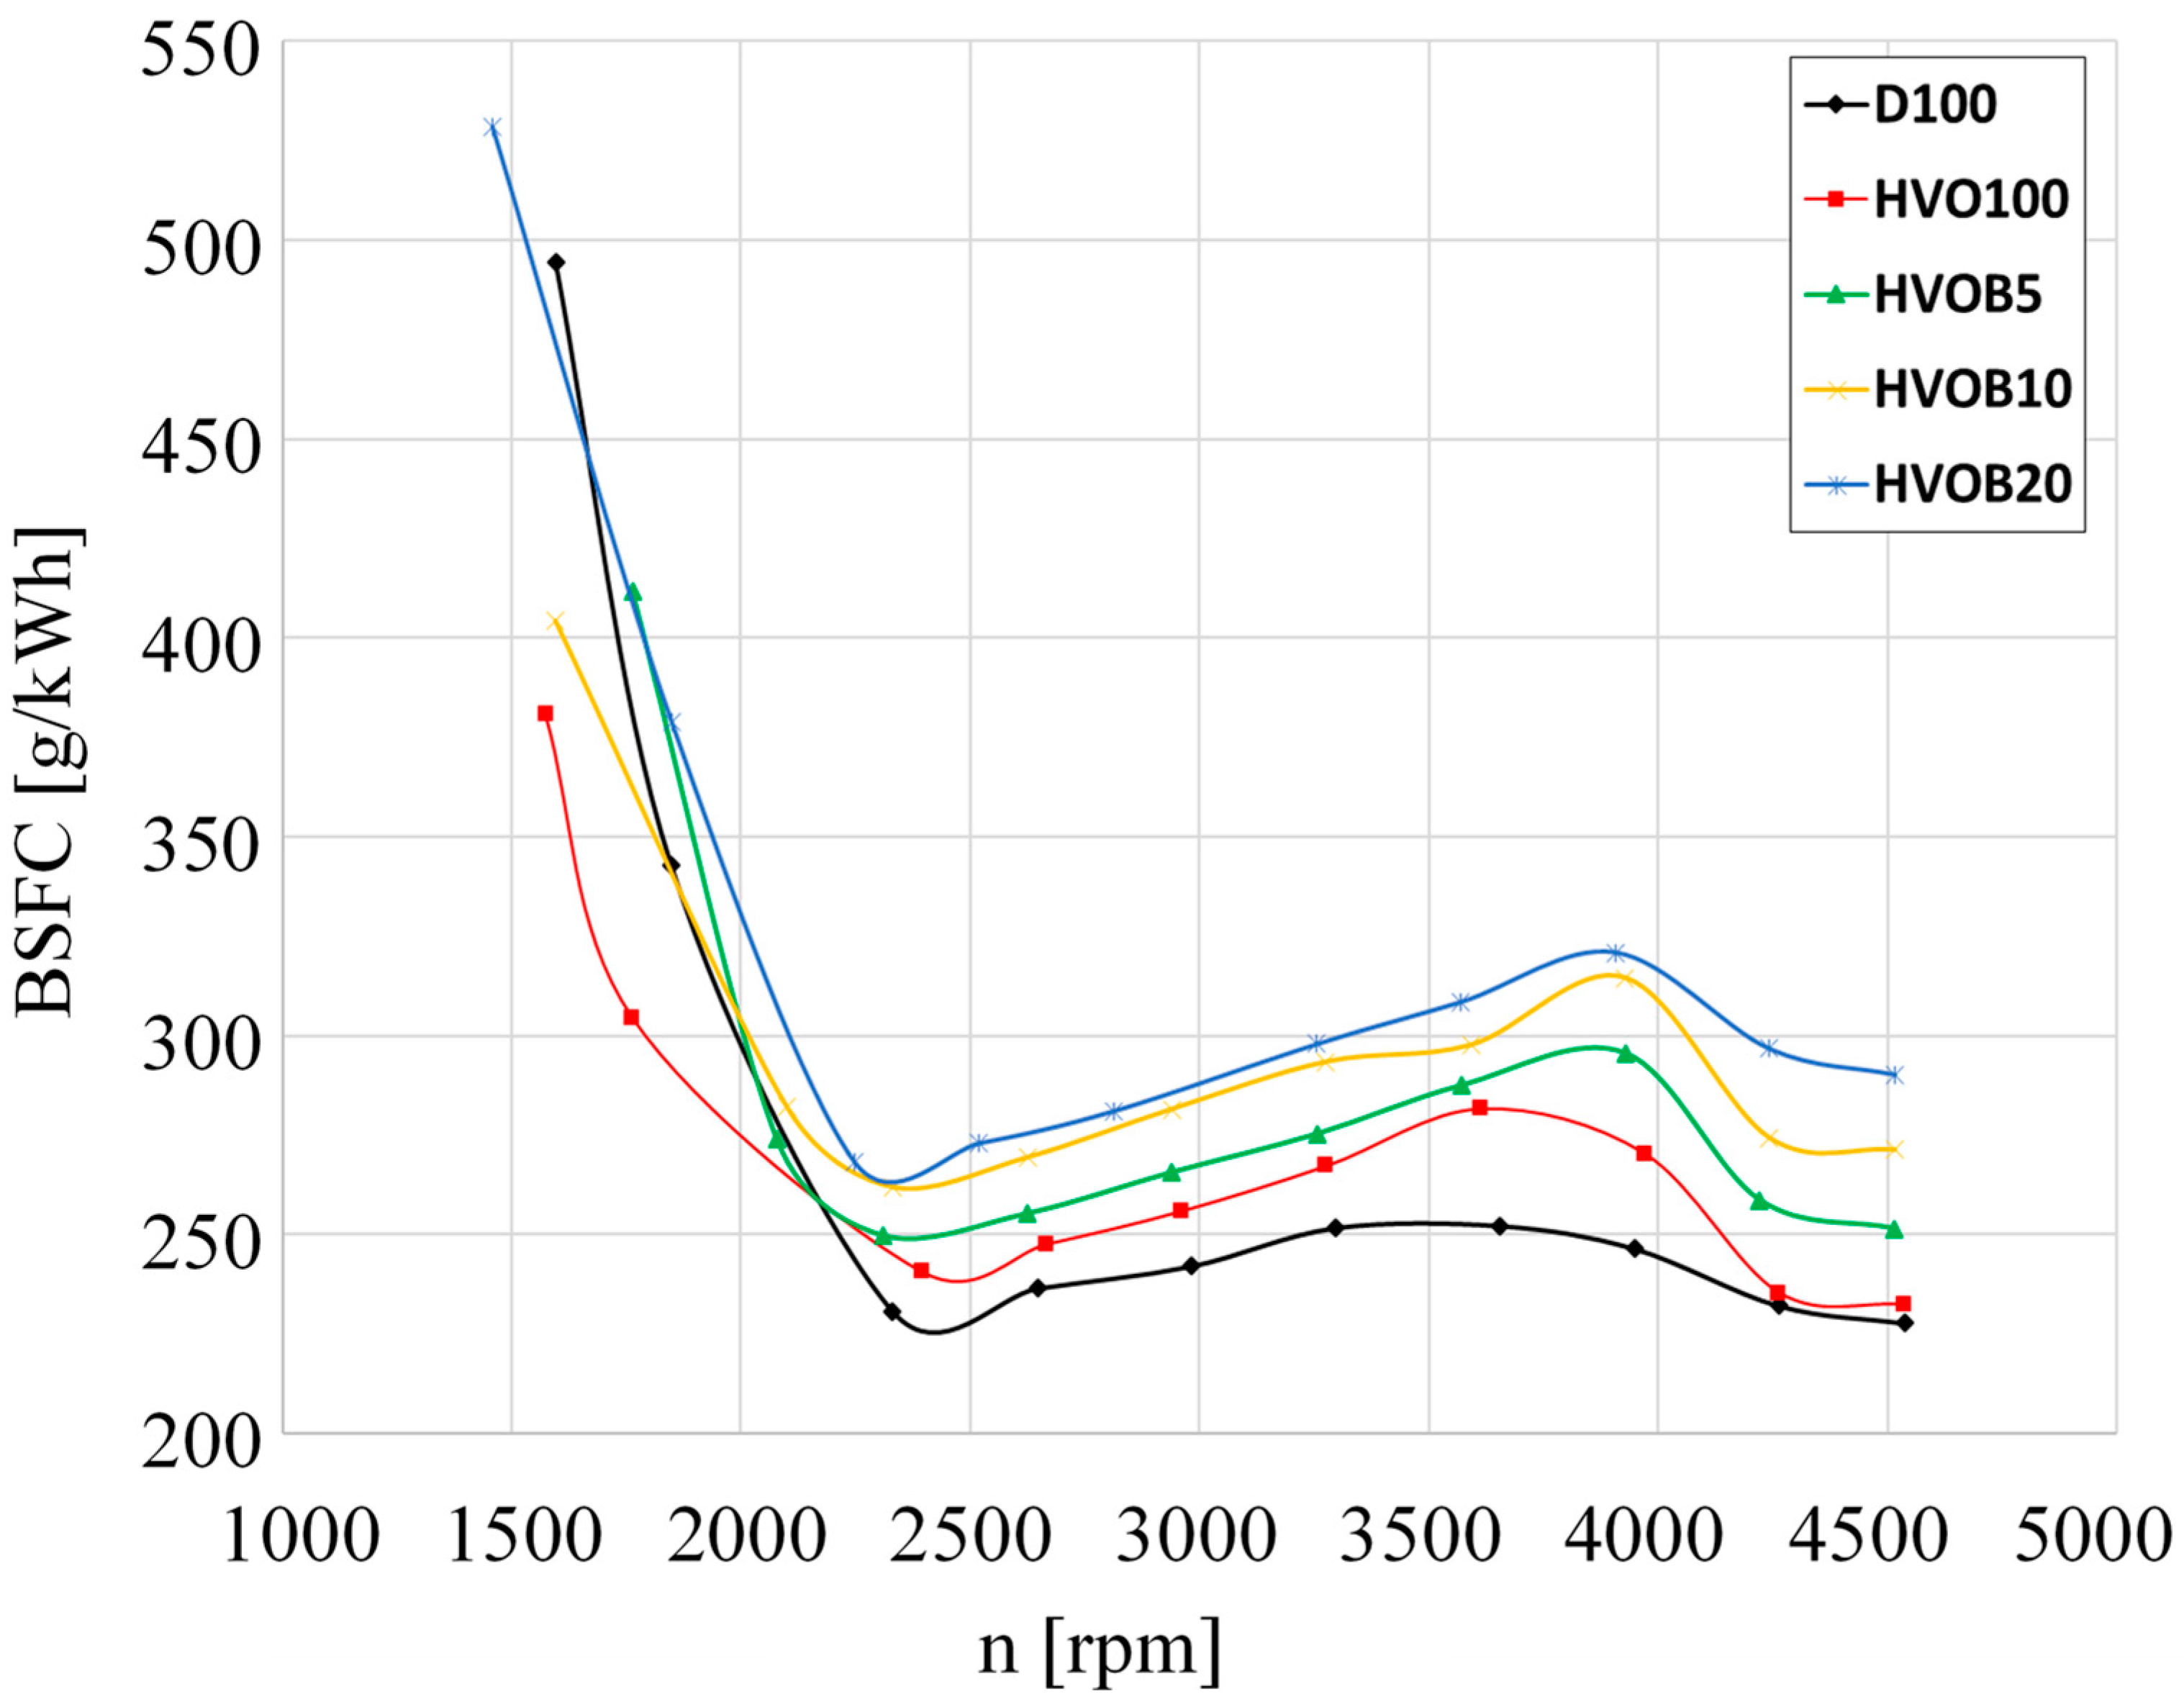
- The brake-specific fuel consumption (BSFC) of HVO fuel and various blends of HVO and biobutanol consistently demonstrates superior performance compared to D100, exhibiting a range of values that consistently surpass D100 by 1.7% to 28%.
- The brake thermal efficiency of the D100 had a decline of 4.4% at an engine speed of 4500 rpm. Furthermore, augmenting the concentration of biobutanol in HVO led to a reduction in the brake thermal efficiency value.
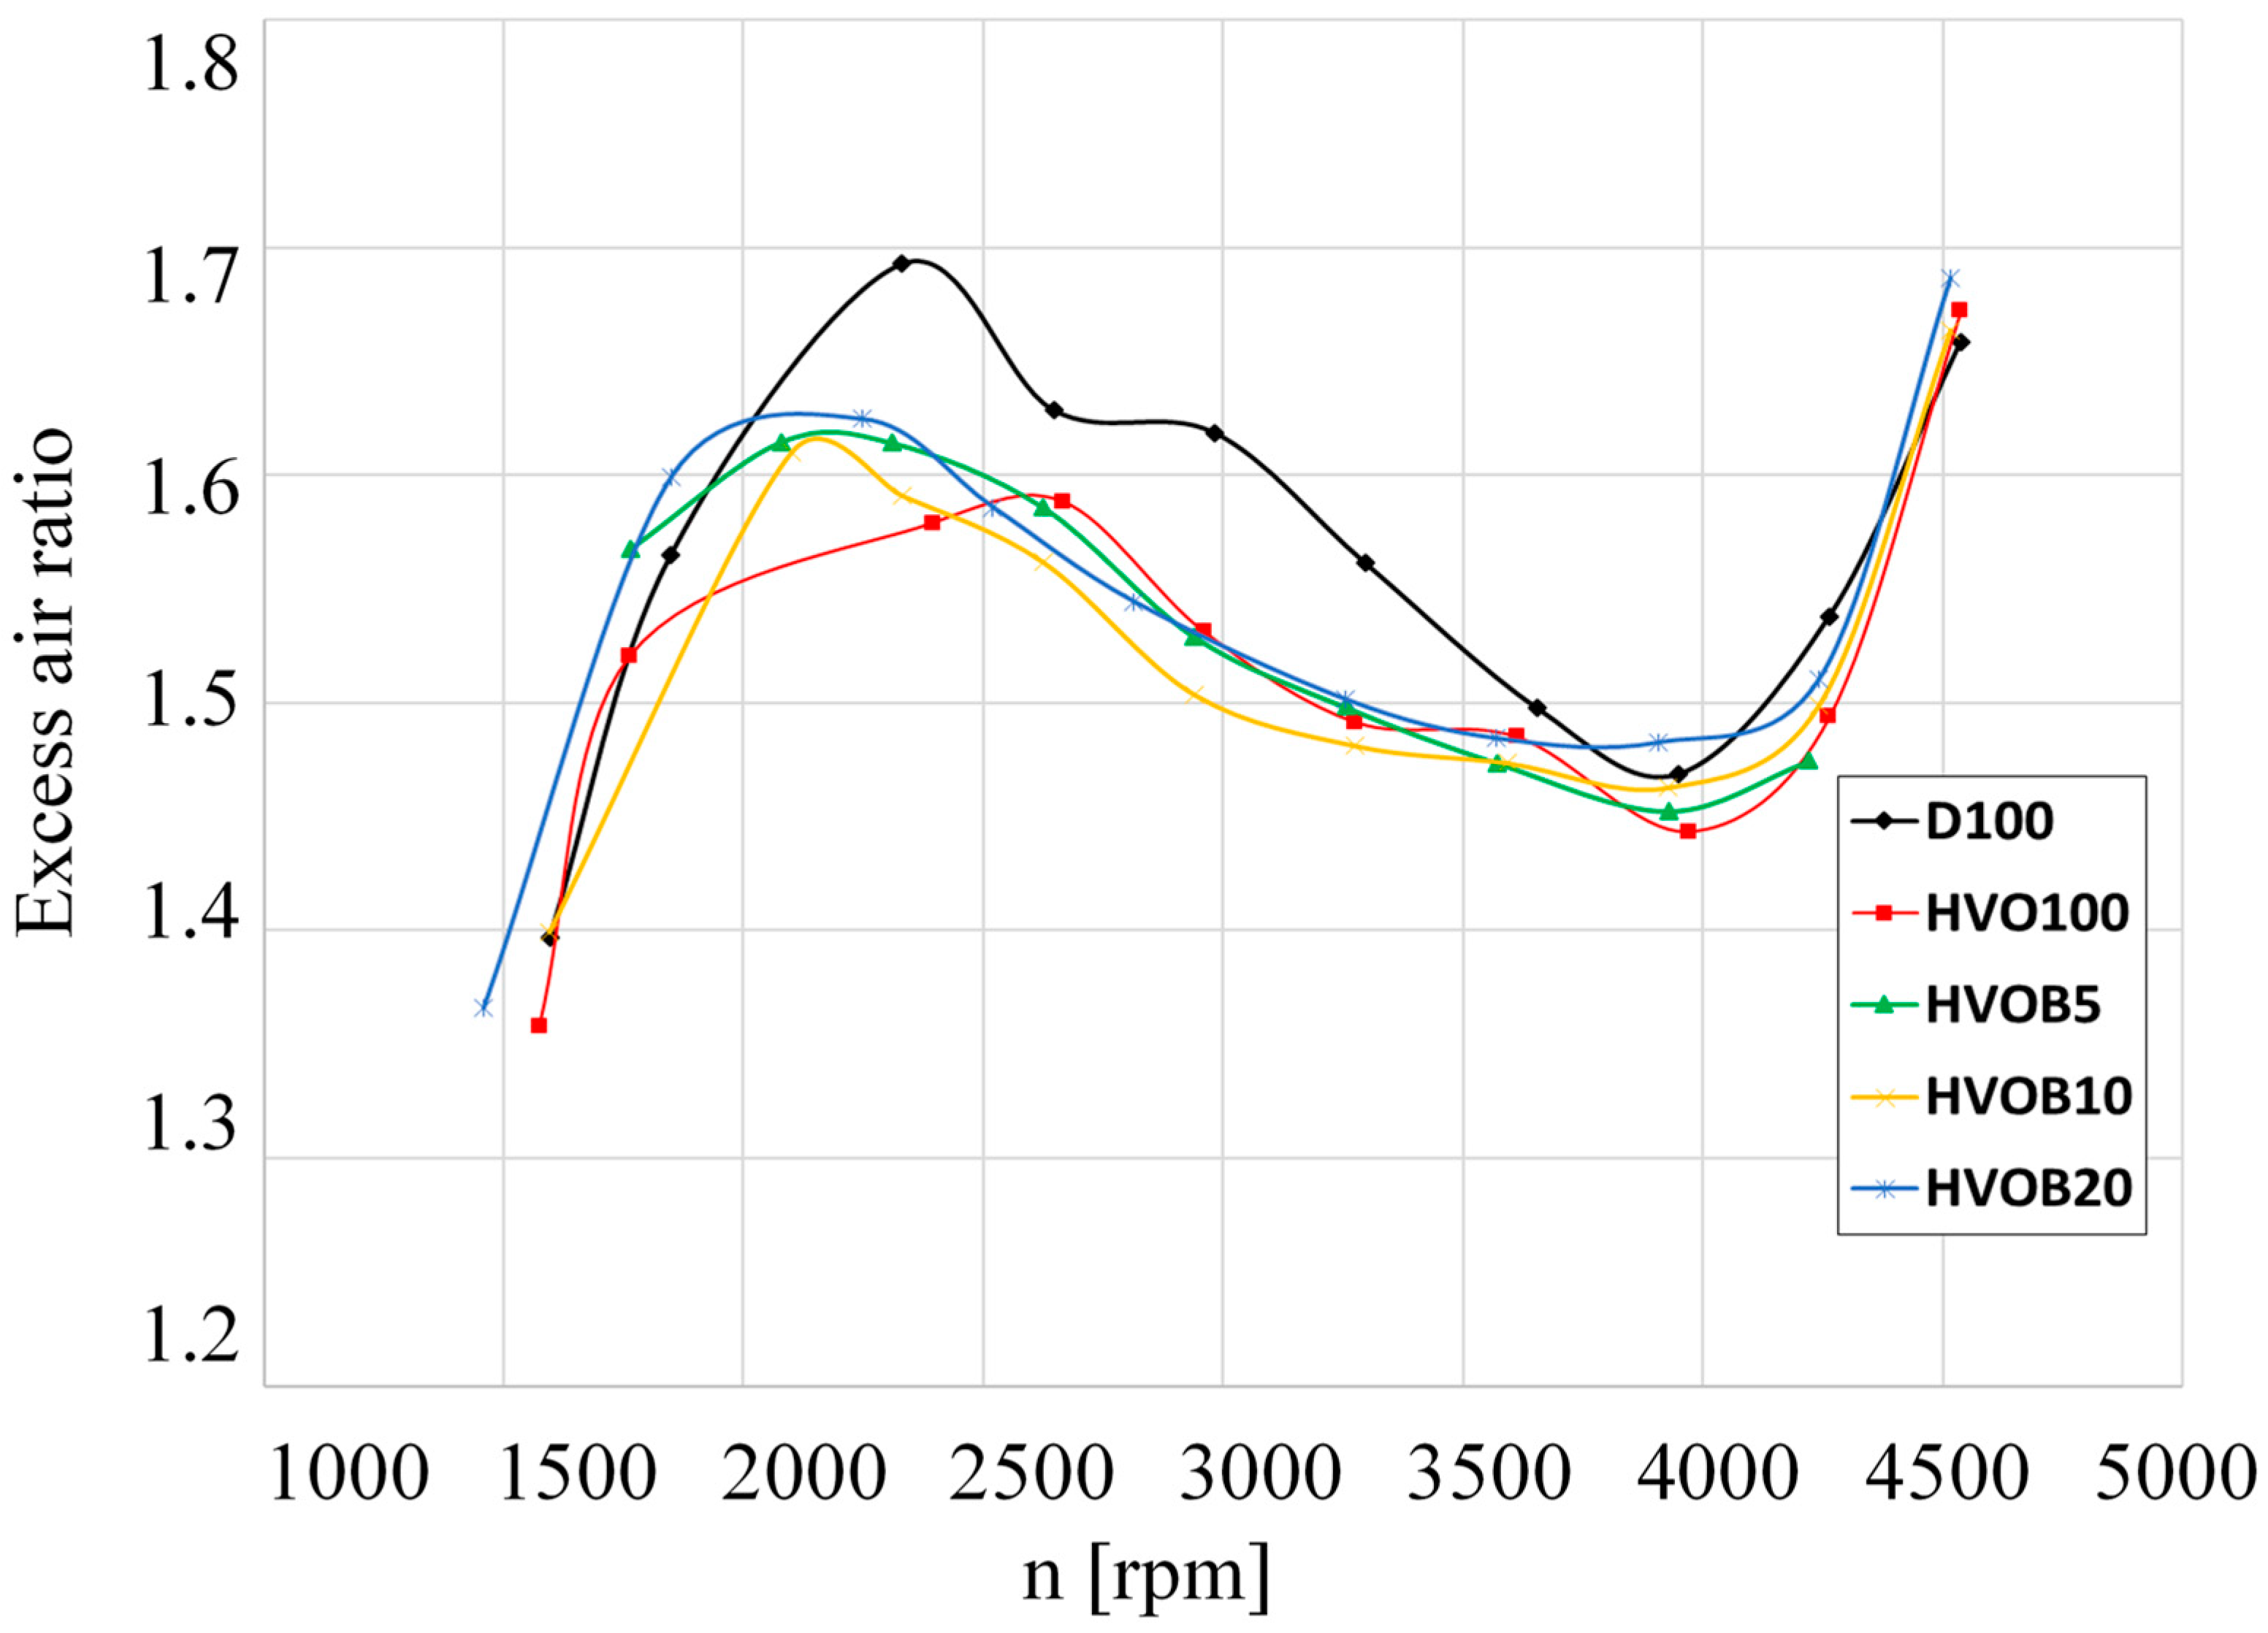
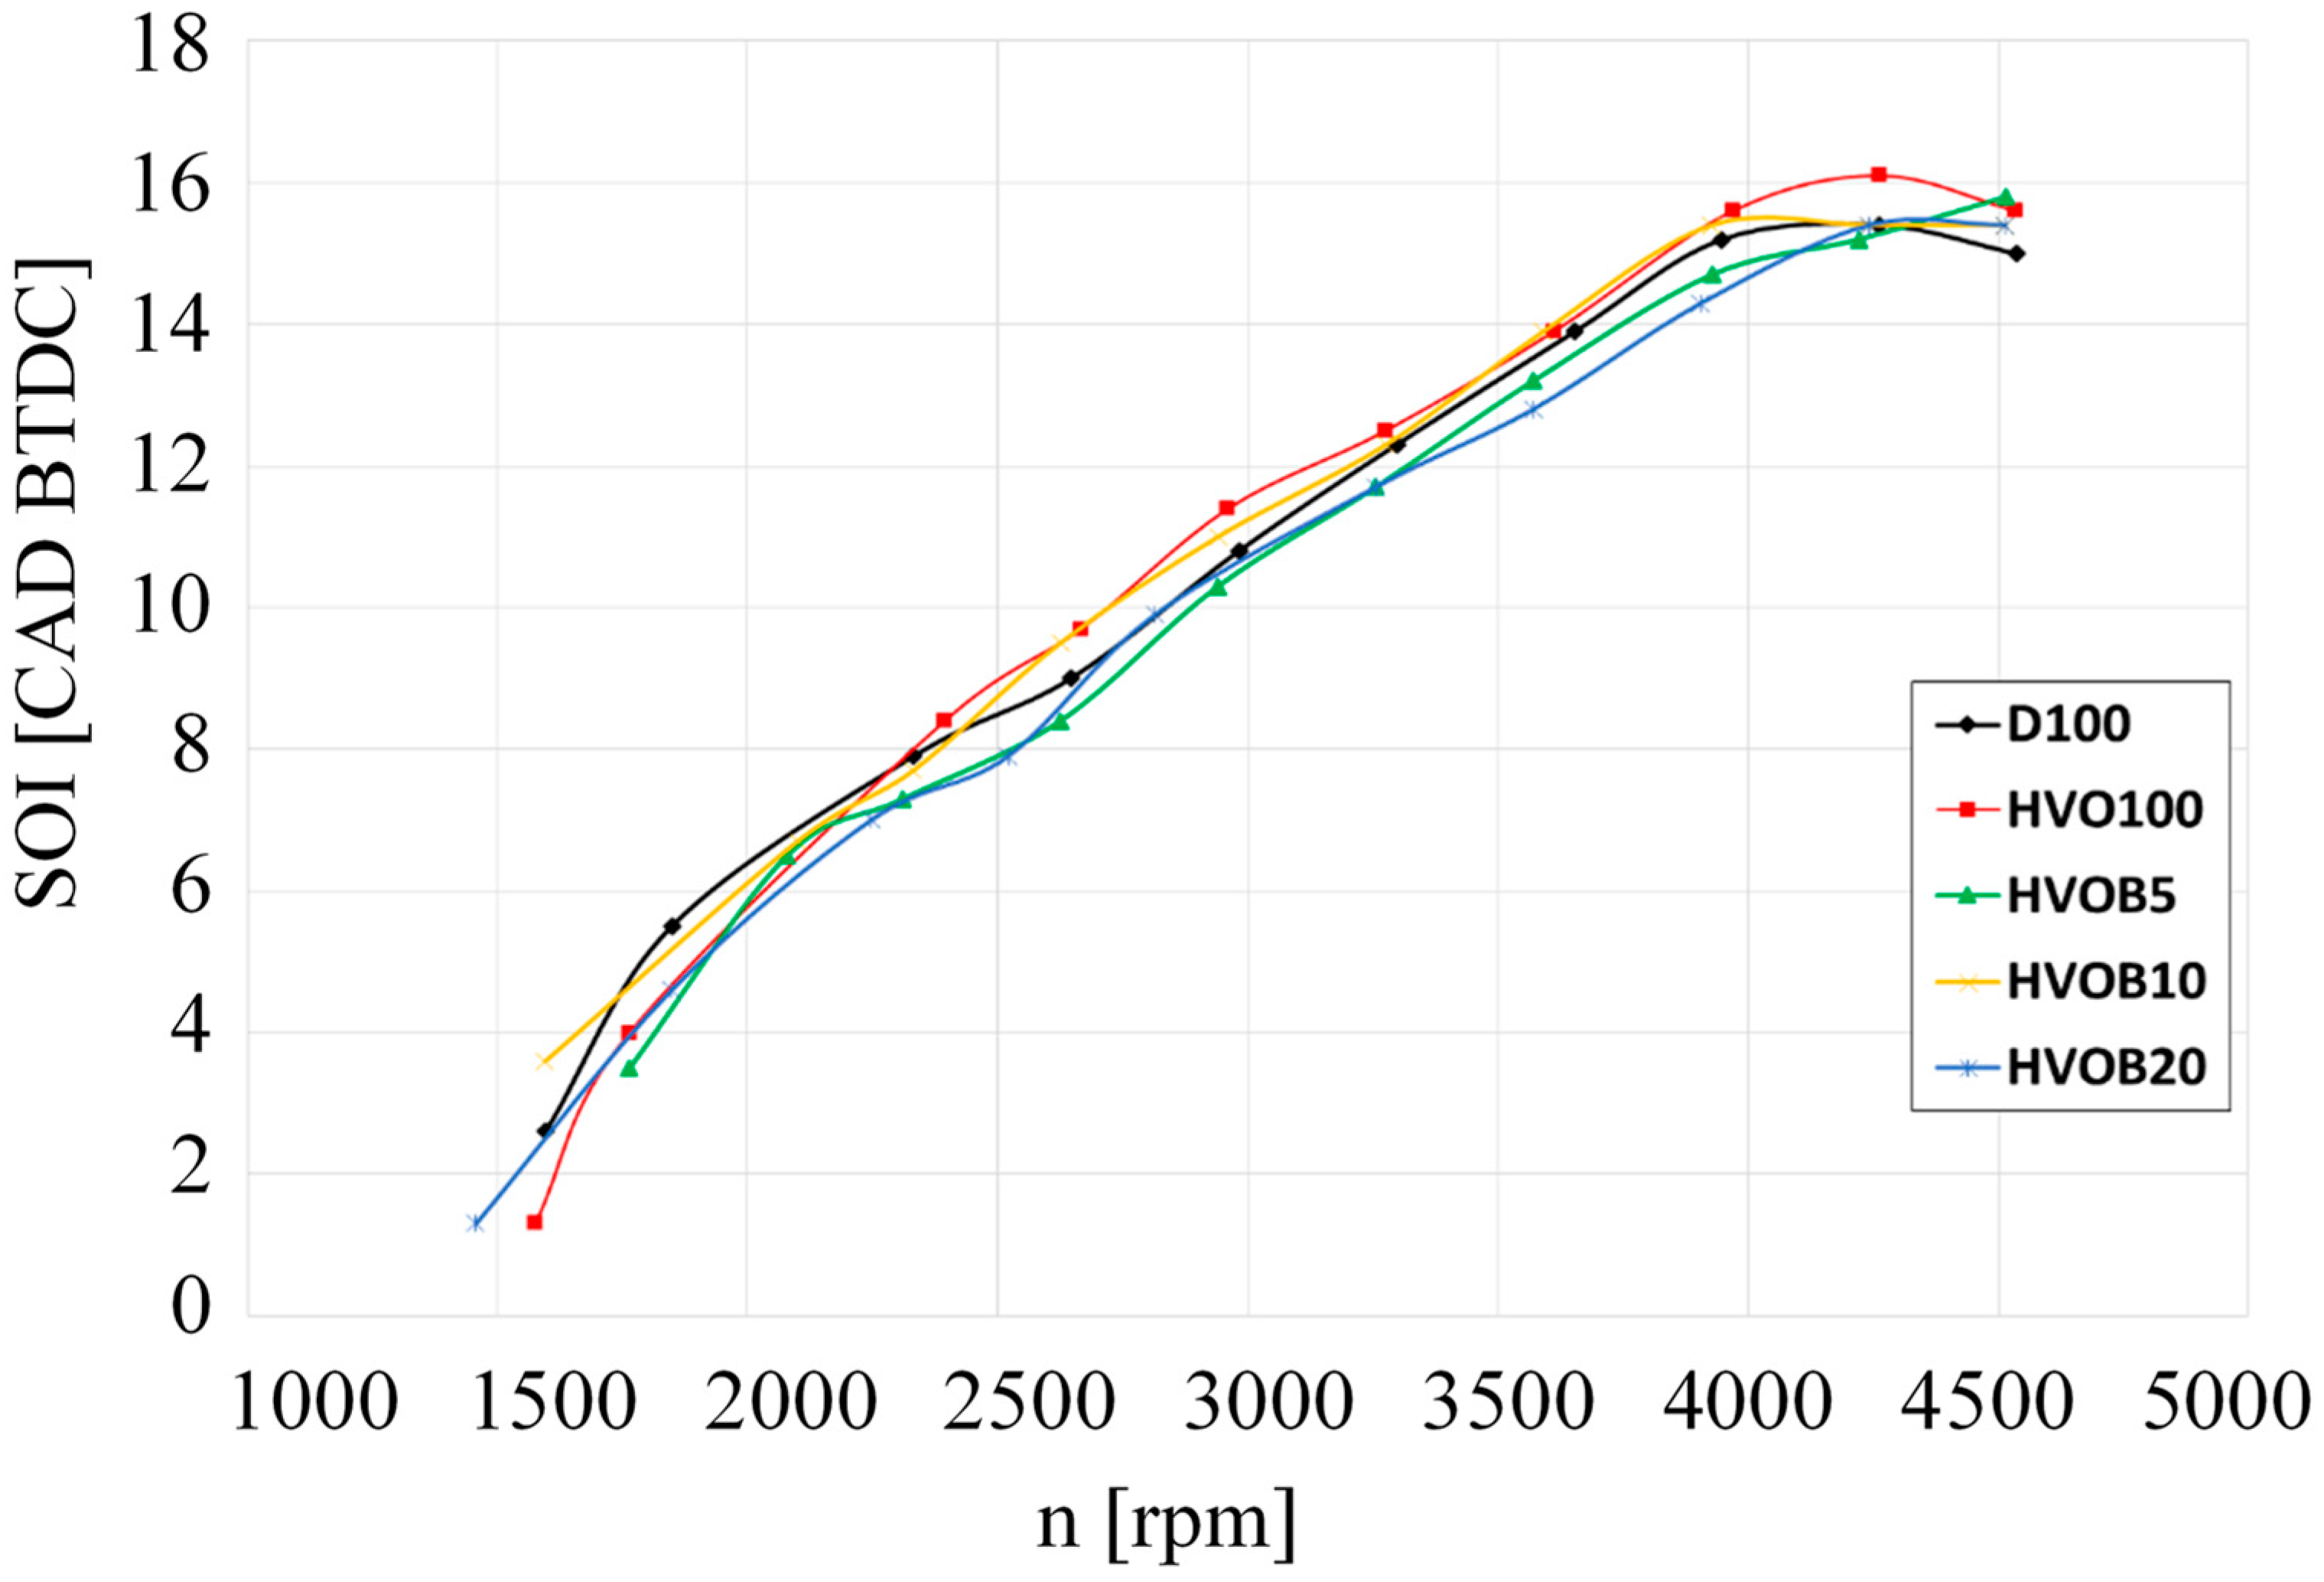
- The Start of Injection (SOI) values exhibit variations across different fuels and mixtures during engine operation at 1500 rpm. The timings for Before Top Dead Center (BTDC) for HVOB5, HVOB10, and HVOB20 exhibit variations of 3.5 CAD, 3.6 CAD, and 1.3 CAD, respectively. Notably, the timing for HVOB20 demonstrates a delay of 1.3 CAD.
Author Contributions
Funding
Data Availability Statement
Conflicts of Interest
References
- Rakov, V. Determination of optimal characteristics of braking energy recovery system in vehicles operating in urban conditions. Transp. Res. Procedia 2020, 50, 566–573. [Google Scholar] [CrossRef]
- Krzywonos, M.; Skudlarski, J.; Kupczyk, A.; Wojdalski, J.; Tucki, K. Forecast for transport biofuels in Poland in 2020–2030. Przem. Chem. 2015, 94, 2218–2222. [Google Scholar] [CrossRef]
- Robaina, M.; Neves, A. Complete decomposition analysis of CO2 emissions intensity in the transport sector in Europe. Res. Transp. Econ. 2021, 90, 101074. [Google Scholar] [CrossRef]
- Sarkan, B.; Skrucany, T.; Semanova, S.; Madlenak, R.; Kuranc, A.; Sejkorova, M.; Caban, J. Vehicle coast-down method as a tool for calculating total resistance for the purposes of type-approval fuel consumption. Sci. J. Silesian Univ. Technol. -Ser. Transp. 2018, 98, 161–172. [Google Scholar]
- CO2 Emissions from Cars: Facts and Figures (Infographics). Available online: https://www.europarl.europa.eu/news/en/headlines/society/20190313STO31218/co2-emissions-from-cars-facts-and-figures-infographics (accessed on 8 October 2023).
- Fact Sheets on the European Union. Energy Policy: General Principles. Available online: https://www.europarl.europa.eu/factsheets/en/sheet/68/energy-policy-general-principles (accessed on 8 October 2023).
- Presno, M.J.; Landajo, M.; González, P.F. GHG emissions in the EU-28. A multilevel club convergence study of the Emission Trading System and Effort Sharing Decision mechanisms. Sustain. Prod. Consum. 2021, 27, 998–1009. [Google Scholar] [CrossRef]
- Jäger-Waldau, A.; Kougias, I.; Taylor, N.; Thiel, C. How photovoltaics can contribute to GHG emission reductions of 55% in the EU by 2030. Renew. Sustain. Energy Rev. 2020, 126, 109836. [Google Scholar] [CrossRef]
- Tucki, K.; Krzywonos, M.; Orynycz, O.; Kupczyk, A.; Bączyk, A.; Wielewska, I. Analysis of the Possibility of Fulfilling the Paris Agreement by the Visegrad Group Countries. Sustainability 2021, 13, 8826. [Google Scholar] [CrossRef]
- Clean Energy for All Europeans Package. Available online: https://energy.ec.europa.eu/topics/energy-strategy/clean-energy-all-europeans-package_en (accessed on 8 October 2023).
- Neves, S.A.; Marques, A.C.; Patrício, M. Determinants of CO2 emissions in European Union countries: Does environmental regulation reduce environmental pollution? Econ. Anal. Policy 2020, 68, 114–125. [Google Scholar] [CrossRef]
- Hooftman, N.; Messagie, M.; Van Mierlo, J.; Coosemans, T. A review of the European passenger car regulations—Real driving emissions vs local air quality. Renew. Sustain. Energy Rev. 2018, 86, 1–21. [Google Scholar] [CrossRef]
- Cha, J.; Lee, J.; Chon, M.S. Evaluation of real driving emissions for Euro 6 light-duty diesel vehicles equipped with LNT and SCR on domestic sales in Korea. Atmos. Environ. 2019, 196, 133–142. [Google Scholar] [CrossRef]
- Tucki, K.; Orynycz, O.; Wasiak, A.; Świć, A.; Mruk, R.; Botwińska, K. Estimation of Carbon Dioxide Emissions from a Diesel Engine Powered by Lignocellulose Derived Fuel for Better Management of Fuel Production. Energies 2020, 13, 561. [Google Scholar] [CrossRef]
- Chen, L.; Wang, Z.; Liu, S.; Qu, L. Using a chassis dynamometer to determine the influencing factors for the emissions of Euro VI vehicles. Transp. Res. Part D Transp. Environ. 2018, 65, 564–573. [Google Scholar] [CrossRef]
- Mera, Z.; Fonseca, N.; López, J.M.; Casanova, J. Analysis of the high instantaneous NOx emissions from Euro 6 diesel passenger cars under real driving conditions. Appl. Energy 2019, 242, 1074–1089. [Google Scholar] [CrossRef]
- Triantafyllopoulos, G.; Dimaratos, A.; Ntziachristos, L.; Bernard, Y.; Dornoff, J.; Samaras, Z. A study on the CO2 and NOx emissions performance of Euro 6 diesel vehicles under various chassis dynamometer and on-road conditions including latest regulatory provisions. Sci. Total Environ. 2019, 666, 337–346. [Google Scholar] [CrossRef] [PubMed]
- May, J.; Favre, C.; Bosteels, D.; Andersson, J.; Clarke, D.; Heaney, M. On-Road Testing and PEMS Data Analysis for Two Euro 6 Diesel Vehicles. Available online: http://www.aecc.eu/wp-content/uploads/2016/08/140918-AECC-paper-on-RDE-TAP-Conference-Graz.pdf (accessed on 8 October 2023).
- Olabi, A.G.; Maizak, D.; Wilberforce, T. Review of the regulations and techniques to eliminate toxic emissions from diesel engine cars. Sci. Total Environ. 2020, 748, 141249. [Google Scholar] [CrossRef] [PubMed]
- Note on the Application of Regulation (EU) 2017/1151 as Amended by Regulation (EU) 2018/1832. Available online: https://circabc.europa.eu/sd/a/a0a73d43-321f-4f01-aef3-88ef2342f7e0/Final%20joint%20Note%20to%20TCMV%20on%20RDE4-WLTP2_April_2019%20nw.pdf (accessed on 8 October 2023).
- EU. Emission Standards. Available online: https://dieselnet.com/standards/eu/ld.php (accessed on 8 October 2023).
- Average CO2 Emissions from New Cars and New Vans Increased again in 2019. Available online: https://www.eea.europa.eu/highlights/average-co2-emissions-from-new-cars-vans-2019 (accessed on 8 October 2023).
- Dimaratos, A.; Tsokolis, D.; Fontaras, G.; Tsiakmakis, S.; Ciuffo, B.; Samaras, Z. Comparative Evaluation of the Effect of Various Technologies on Light-duty Vehicle CO2 Emissions over NEDC and WLTP. Transp. Res. Procedia 2016, 14, 3169–3178. [Google Scholar] [CrossRef]
- Tucki, K. A Computer Tool for Modelling CO2 Emissions in Driving Tests for Vehicles with Diesel Engines. Energies 2021, 14, 266. [Google Scholar] [CrossRef]
- Ko, J.; Jin, D.; Jang, W.; Myung, C.L.; Kwon, S.; Park, S. Comparative investigation of NOx emission characteristics from a Euro 6-compliant diesel passenger car over the NEDC and WLTC at various ambient temperatures. Appl. Energy 2017, 187, 652–662. [Google Scholar] [CrossRef]
- Tucki, K. A Computer Tool for Modelling CO2 Emissions in Driving Cycles for Spark Ignition Engines Powered by Biofuels. Energies 2021, 14, 1400. [Google Scholar] [CrossRef]
- Blanco-Rodriguez, D.; Vagnoni, G.; Holderbaum, B. EU6 C-Segment Diesel vehicles, a challenging segment to meet RDE and WLTP requirements. IFAC-Pap. 2016, 49, 649–656. [Google Scholar] [CrossRef]
- Wang, Y.; Ge, Y.; Wang, J.; Wang, X.; Yin, H.; Hao, L.; Tan, J. Impact of altitude on the real driving emission (RDE) results calculated in accordance to moving averaging window (MAW) method. Fuel 2020, 277, 117929. [Google Scholar] [CrossRef]
- Viesi, D.; Crema, L.; Testi, M. The Italian hydrogen mobility scenario implementing the European directive on alternative fuels infrastructure (DAFI 2014/94/EU). Int. J. Hydrog. Energy 2017, 42, 27354–27373. [Google Scholar] [CrossRef]
- Ananthi, V.; Raja, R.; Carvalho, I.S.; Brindhadevi, K.; Pugazhendhi, A.; Arun, A. A realistic scenario on microalgae based biodiesel production: Third generation biofuel. Fuel 2021, 284, 118965. [Google Scholar] [CrossRef]
- Alves-Fortunato, M.; Ayoub, E.; Bacha, K.; Mouret, A.; Dalmazzone, C. Fatty Acids Methyl Esters (FAME) autoxidation: New insights on insoluble deposit formation process in biofuels. Fuel 2020, 268, 117074. [Google Scholar] [CrossRef]
- Puricelli, S.; Cardellini, G.; Casadei, S.; Faedo, D.; Van den Oever, A.E.M.; Grosso, M. A review on biofuels for light-duty vehicles in Europe. Renew. Sustain. Energy Rev. 2020, 137, 110398. [Google Scholar] [CrossRef]
- Supporting Policy with Scientific Evidence. Biofuel. Available online: https://knowledge4policy.ec.europa.eu/glossary-item/biofuel_en (accessed on 8 October 2023).
- Cadillo-Benalcazar, J.J.; Bukkens, S.G.F.; Ripa, M.; Giampietro, M. Why does the European Union produce biofuels? Examining consistency and plausibility in prevailing narratives with quantitative storytelling. Energy Res. Soc. Sci. 2021, 71, 101810. [Google Scholar] [CrossRef]
- Dafnomilis, I.; Hoefnagels, R.; Pratama, Y.W.; Schott, D.L.; Lodewijks, G.; Junginger, M. Review of solid and liquid biofuel demand and supply in Northwest Europe towards 2030—A comparison of national and regional projections. Renew. Sustain. Energy Rev. 2017, 78, 31–45. [Google Scholar] [CrossRef]
- Stattman, S.L.; Gupta, A.; Partzsch, L.; Oosterveer, P. Toward Sustainable Biofuels in the European Union? Lessons from a Decade of Hybrid Biofuel Governance. Sustainability 2018, 10, 4111. [Google Scholar] [CrossRef]
- Bemani, A.; Xiong, Q.; Baghban, A.; Habibzadeh, S.; Mohammadi, A.H.; Doranehgard, M.H. Modeling of cetane number of biodiesel from fatty acid methyl ester (FAME) information using GA-, PSO-, and HGAPSO- LSSVM models. Renew. Energy 2020, 150, 924–934. [Google Scholar] [CrossRef]
- Verevkin, S.P.; Pimerzin, A.A.; Glotov, A.P.; Vutolkina, A.V. Biofuels energetics: Reconciliation of calorific values of fatty acids methyl esters with help of complementary measurements and structure–property relationships. Fuel 2022, 329, 125460. [Google Scholar] [CrossRef]
- Ngige, G.A.; Ovuoraye, P.E.; Igwegbe, C.A.; Fetahi, E.; Okeke, J.A.; Yakubu, A.D.; Onyechi, P.C. RSM optimization and yield prediction for biodiesel produced from alkali-catalytic transesterification of pawpaw seed extract: Thermodynamics, kinetics, and Multiple Linear Regression analysis. Digit. Chem. Eng. 2023, 6, 100066. [Google Scholar] [CrossRef]
- Bolonio, D.; García-Martínez, M.J.; Ortega, M.F.; Lapuerta, M.; Rodríguez-Fernández, J.; Canoira, L. Fatty acid ethyl esters (FAEEs) obtained from grapeseed oil: A fully renewable biofuel. Renew. Energy 2019, 132, 278–283. [Google Scholar] [CrossRef]
- Suarez-Bertoa, R.; Kousoulidou, M.; Clairotte, M.; Giechaskiel, B.; Nuottimäki, J.; Sarjovaara, T.; Lonza, L. Impact of HVO blends on modern diesel passenger cars emissions during real world operation. Fuel 2019, 235, 1427–1435. [Google Scholar] [CrossRef]
- McCaffery, C.; Zhu, H.; Ahmed, C.M.S.; Canchola, A.; Chen, J.Y.; Li, C.; Johnson, K.C.; Durbin, T.D.; Lin, Y.H.; Karavalakis, G. Effects of hydrogenated vegetable oil (HVO) and HVO/biodiesel blends on the physicochemical and toxicological properties of emissions from an off-road heavy-duty diesel engine. Fuel 2022, 323, 124283. [Google Scholar] [CrossRef]
- Dimitriadis, A.; Natsios, I.; Dimaratos, A.; Katsaounis, D.; Samaras, Z. Hydrotreated Vegetable Oil (HVO) and Effects on Emissions of a Passenger Car Diesel Engine. Front. Mech. Eng. 2018, 4, 7. [Google Scholar] [CrossRef]
- Rajak, U.; Nashine, P.; Verma, T.N.; Pugazhendhi, A. Performance and emission analysis of a diesel engine using hydrogen enriched n-butanol, diethyl ester and Spirulina microalgae biodiesel. Fuel 2020, 271, 117645. [Google Scholar] [CrossRef]
- Maroušek, J.; Strunecký, O.; Bartoš, V.; Vochozka, M. Revisiting competitiveness of hydrogen and algae biodiesel. Fuel 2022, 328, 125317. [Google Scholar] [CrossRef]
- Liao, Y.; Tozluoğlu, C.; Sprei, F.; Yeh, S.; Dhamal, S. Impacts of charging behavior on BEV charging infrastructure needs and energy use. Transp. Res. Part D Transp. Environ. 2023, 116, 103645. [Google Scholar] [CrossRef]
- Zhou, W.; Cleaver, C.J.; Dunant, C.F.; Allwood, J.M.; Lin, J. Cost, range anxiety and future electricity supply: A review of how today’s technology trends may influence the future uptake of BEVs. Renew. Sustain. Energy Rev. 2023, 173, 113074. [Google Scholar] [CrossRef]
- Suhel, A.; Abdul Rahim, N.; Abdul Rahman, M.R.; Bin Ahmad, K.A. Engine’s Behaviour on Magnetite Nanoparticles as Additive and Hydrogen Addition of Chicken Fat Methyl Ester Fuelled DICI Engine: A Dual Fuel Approach. Int. J. Hydrogen Energy 2021, 46, 14824–14843. [Google Scholar] [CrossRef]
- Syed, A.; Quadri, S.A.P.; Rao, G.A.P.; Mohd, W. Experimental investigations on DI (direct injection) diesel engine operated on dual fuel mode with hydrogen and mahua oil methyl ester (MOME) as injected fuels and effects of injection opening pressure. Appl. Therm. Eng. 2017, 114, 118–129. [Google Scholar] [CrossRef]
- Karagöz, Y. Analysis of the impact of gasoline, biogas and biogas + hydrogen fuels on emissions and vehicle performance in the WLTC and NEDC. Int. J. Hydrogen Energy 2019, 44, 31621–31632. [Google Scholar] [CrossRef]
- Deng, B.; Chen, Z.; Sun, C.; Zhang, S.; Yu, W.; Huang, M.; Hou, K.; Ran, J.; Zhou, L.; Chen, C.; et al. Key design and layout factors influencing performance of three-way catalytic converters: Experimental and semidecoupled numerical study under real-life driving conditions. J. Clean. Prod. 2023, 425, 138993. [Google Scholar] [CrossRef]
- Rumbo Morales, J.Y.; Ortiz-Torres, G.; García, R.O.D.; Cantero, C.A.T.; Rodriguez, M.C.; Sarmiento-Bustos, E.; Oceguera-Contreras, E.; Hernández, A.A.F.; Cerda, J.C.R.; Molina, Y.A.; et al. Review of the Pressure Swing Adsorption Process for the Production of Biofuels and Medical Oxygen: Separation and Purification Technology. Adsorpt. Sci. Technol. 2022, 2022, 3030519. [Google Scholar] [CrossRef]
- Tucki, K.; Orynycz, O.; Wasiak, A.; Świć, A.; Wichłacz, J. The Impact of Fuel Type on the Output Parameters of a New Biofuel Burner. Energies 2019, 12, 1383. [Google Scholar] [CrossRef]
- Kosowski, K.; Tucki, K.; Kosowski, A. Application of Artificial Neural Networks in Investigations of Steam Turbine Cascades. J. Turbomach. -Trans. ASME 2010, 132, 014501–014505. [Google Scholar] [CrossRef]
- Valeika, G.; Matijošius, J.; Orynycz, O.; Rimkus, A.; Świć, A.; Tucki, K. Smoke Formation during Combustion of Biofuel Blends in the Internal Combustion Compression Ignition Engine. Energies 2023, 16, 3682. [Google Scholar] [CrossRef]
- Shepel, O.; Matijošius, J.; Rimkus, A.; Orynycz, O.; Tucki, K.; Świć, A. Combustion, Ecological, and Energetic Indicators for Mixtures of Hydrotreated Vegetable Oil (HVO) with Duck Fat Applied as Fuel in a Compression Ignition Engine. Energies 2022, 15, 7892. [Google Scholar] [CrossRef]
- Rudbahs, R.; Smigins, R. Experimental research on biodiesel compatibility with fuel system elastomers. In Proceedings of the 13th International Scientific Conference Engineering for Rural Development, Jelgava, Latvia, 29–30 May 2014; Volume 13, pp. 278–282. [Google Scholar]
- Duan, X.; Feng, L.; Liu, H.; Jiang, P.; Chen, C.; Sun, Z. Experimental investigation on exhaust emissions of a heavy-duty vehicle powered by a methanol-fuelled spark ignition engine under world Harmonized Transient Cycle and actual on-road driving conditions. Energy 2023, 282, 128869. [Google Scholar] [CrossRef]
- Sarkan, B.; Stopka, O.; Gnap, J.; Caban, J. Investigation of Exhaust Emissions of Vehicles with the Spark Ignition Engine within Emission Control. In Proceedings of the 10th International Scientific Conference on Transportation Science and Technology (TRANSBALTICA), Vilnius, Lithuania, 4–5 May 2017; Volume 187, pp. 775–782. [Google Scholar] [CrossRef]
- Martínez García, M.; Rumbo Morales, J.Y.; Torres, G.O.; Rodríguez Paredes, S.A.; Vázquez Reyes, S.; Sorcia Vázquez, F.d.J.; Pérez Vidal, A.F.; Valdez Martínez, J.S.; Pérez Zúñiga, R.; Renteria Vargas, E.M. Simulation and State Feedback Control of a Pressure Swing Adsorption Process to Produce Hydrogen. Mathematics 2022, 10, 1762. [Google Scholar] [CrossRef]
- López Núñez, A.R.; Rumbo Morales, J.Y.; Salas Villalobos, A.U.; De La Cruz-Soto, J.; Ortiz Torres, G.; Rodríguez Cerda, J.C.; Calixto-Rodriguez, M.; Brizuela Mendoza, J.A.; Aguilar Molina, Y.; Zatarain Durán, O.A.; et al. Optimization and Recovery of a Pressure Swing Adsorption Process for the Purification and Production of Bioethanol. Fermentation 2022, 8, 293. [Google Scholar] [CrossRef]
- Abed, K.A.; El Morsi, A.K.; Sayed, M.M.; El Shaib, A.A.; Gad, M.S. Effect of waste cooking-oil biodiesel on performance and exhaust emissions of a diesel engine. Egypt. J. Pet. 2018, 27, 985–989. [Google Scholar] [CrossRef]
- Kanthasamy, P.; Selvan, V.A.M.; Shanmugam, P. Investigation on the performance, emissions and combustion characteristics of CRDI engine fuelled with tallow methyl ester biodiesel blends with exhaust gas recirculation. J. Therm. Anal. Calorim. 2020, 141, 2325–2333. [Google Scholar] [CrossRef]
- Emiroglu, A.O.; Keskin, A.; Sen, M. Experimental investigation of the effects of turkey rendering fat biodiesel on combustion, performance and exhaust emissions of a diesel engine. Fuel 2018, 216, 266–273. [Google Scholar] [CrossRef]
- Specifications for Skoda Octavia 1.9 TDI Generation 1Z. Available online: https://www.car.info/en-se/skoda/octavia/1z-19-tdi-dct6-24107173/specs (accessed on 8 October 2023).
- Emission, Function and Performance Dynamometers. Available online: https://www.maha.ru/upload/iblock/a8e/a8e11397fb2b2f09876572eb316514b5.pdf (accessed on 8 October 2023).
- OBDI/OBDII Diagnostic Interfaces. Available online: https://smartmoto.pl/pol_m_Diagnostyka_Interfejsy-diagnostyczne_Interfejsy-OBDI-OBDII-1561535.html (accessed on 8 October 2023).
- ECU Explained. Available online: https://www.ecutesting.com/categories/ecu-explained/ (accessed on 8 October 2023).
- ROSS-TECH VCDS. Available online: https://www.ross-tech.com/vcds/tour/logging.php (accessed on 8 October 2023).
- Wang, T.; Lin, B. Fuel consumption in road transport: A comparative study of China and OECD countries. J. Clean. Prod. 2019, 206, 156–170. [Google Scholar] [CrossRef]
- Kordylewski, W. Combustion and Fuels, 5th ed.; Oficyna Wydawnicza Politechniki Wrocławskiej: Wrocław, Poland, 2008; pp. 10–470. ISBN 978-83-7493-378-0. [Google Scholar]
- Baczewski, K.; Kałdoński, T. Fuels For Compression-Ignition Engines, 2nd ed.; Wydawnictwa Komunikacji i Łączności: Warszawa, Poland, 2017; pp. 50–210. [Google Scholar]


| Parameter | Value |
|---|---|
| Engine type—number of cylinders | Inline 4 |
| Engine code | ALH |
| Fuel type | Diesel |
| Engine alignment | Transverse |
| Engine displacement | 1896 cm3 |
| Bore x Stroke | 79.5 × 95.5 mm |
| Number of valves | 8 Valves |
| Aspiration | Turbo |
| Maximum power | 66 kW (4000 rpm) |
| Maximum torque | 210 Nm (1900 rpm) |
| Drive wheels | FWD |
| Piston diameter, mm | 79.5 mm |
| Piston stroke, mm | 95.5 mm |
| Compression ratio | 19.5 |
| Displacement | 1896 cm3 |
| Number of cylinders | 4/OHC |
| Fuel injection | Direct (single) |
| Nozzle type | Hole-type |
| Nozzle opening pressure | 190 bar |
| Nozzle and holder assembly | Two spring |
| Cooling system type | Liquid cooling |
| Transmission gearbox—number of speeds | 5 speed Manual |
| Parameter | Value |
|---|---|
| Load eqiupment | Electromagnetic brake |
| Rate adjustment limits | 260 |
| Maximum measuring load | 6 kN (attractive force) |
| Maximum break power, kW | 260 |
| Measurement error | ±2% |
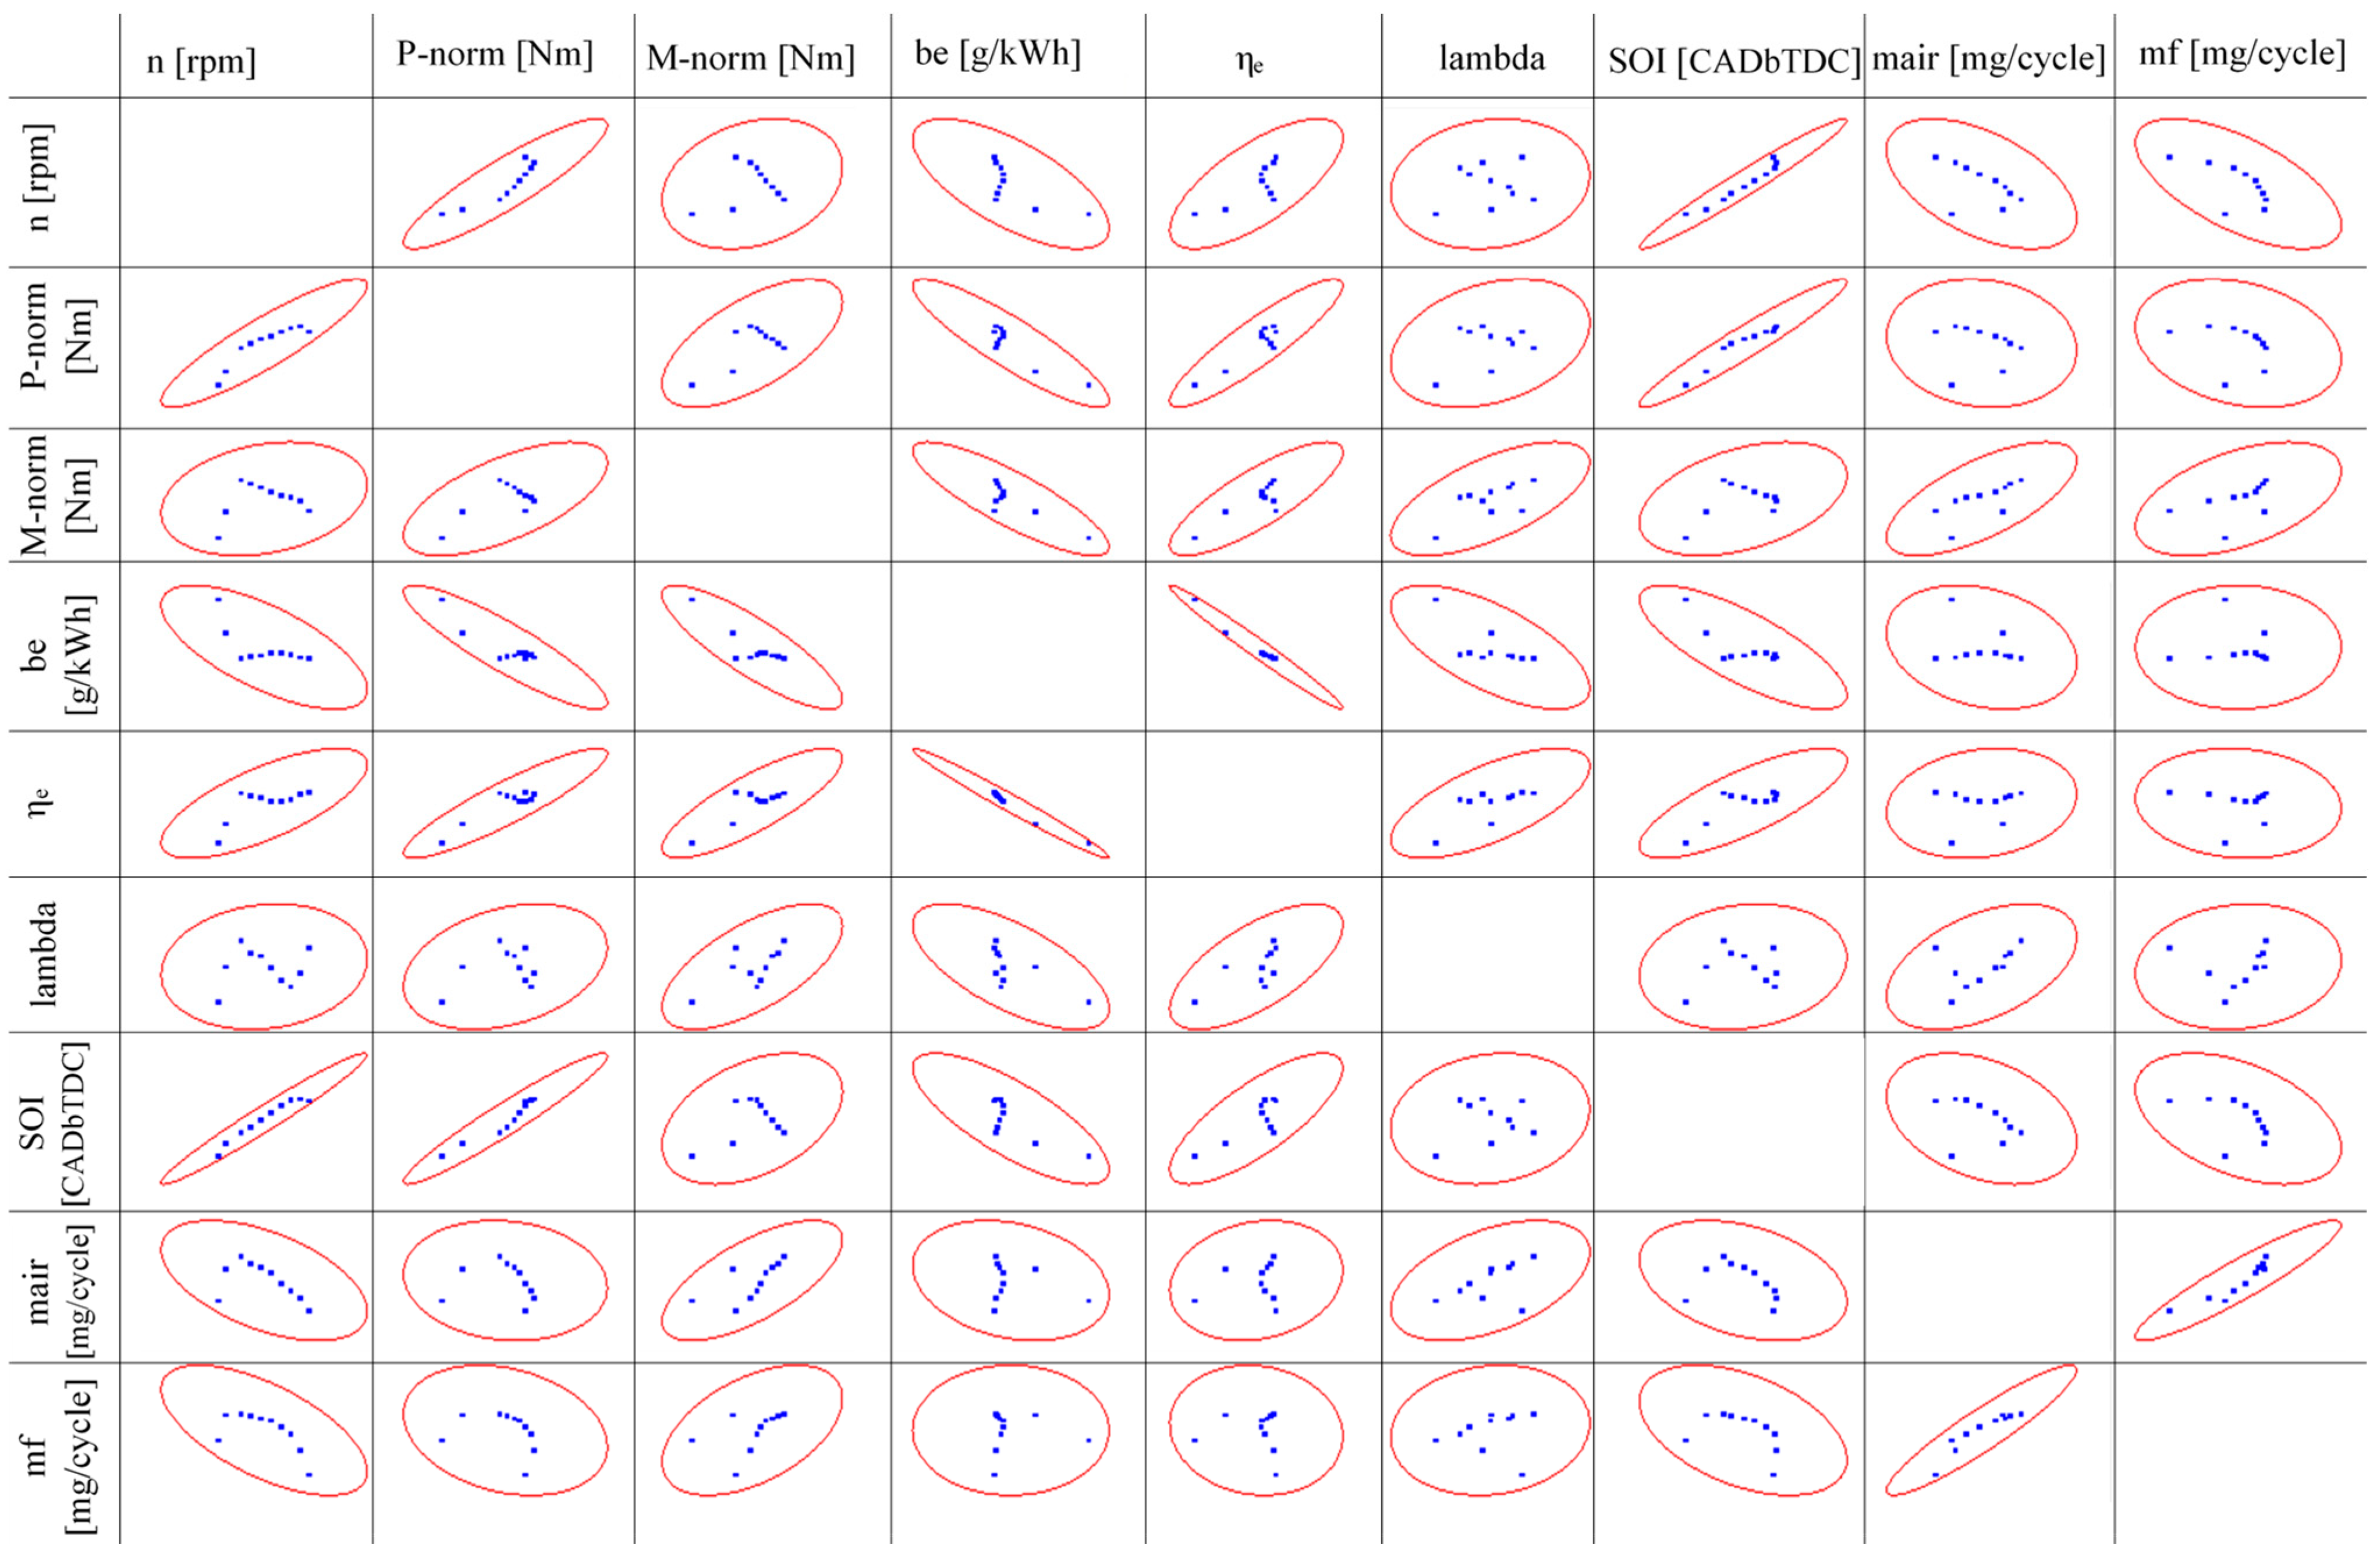
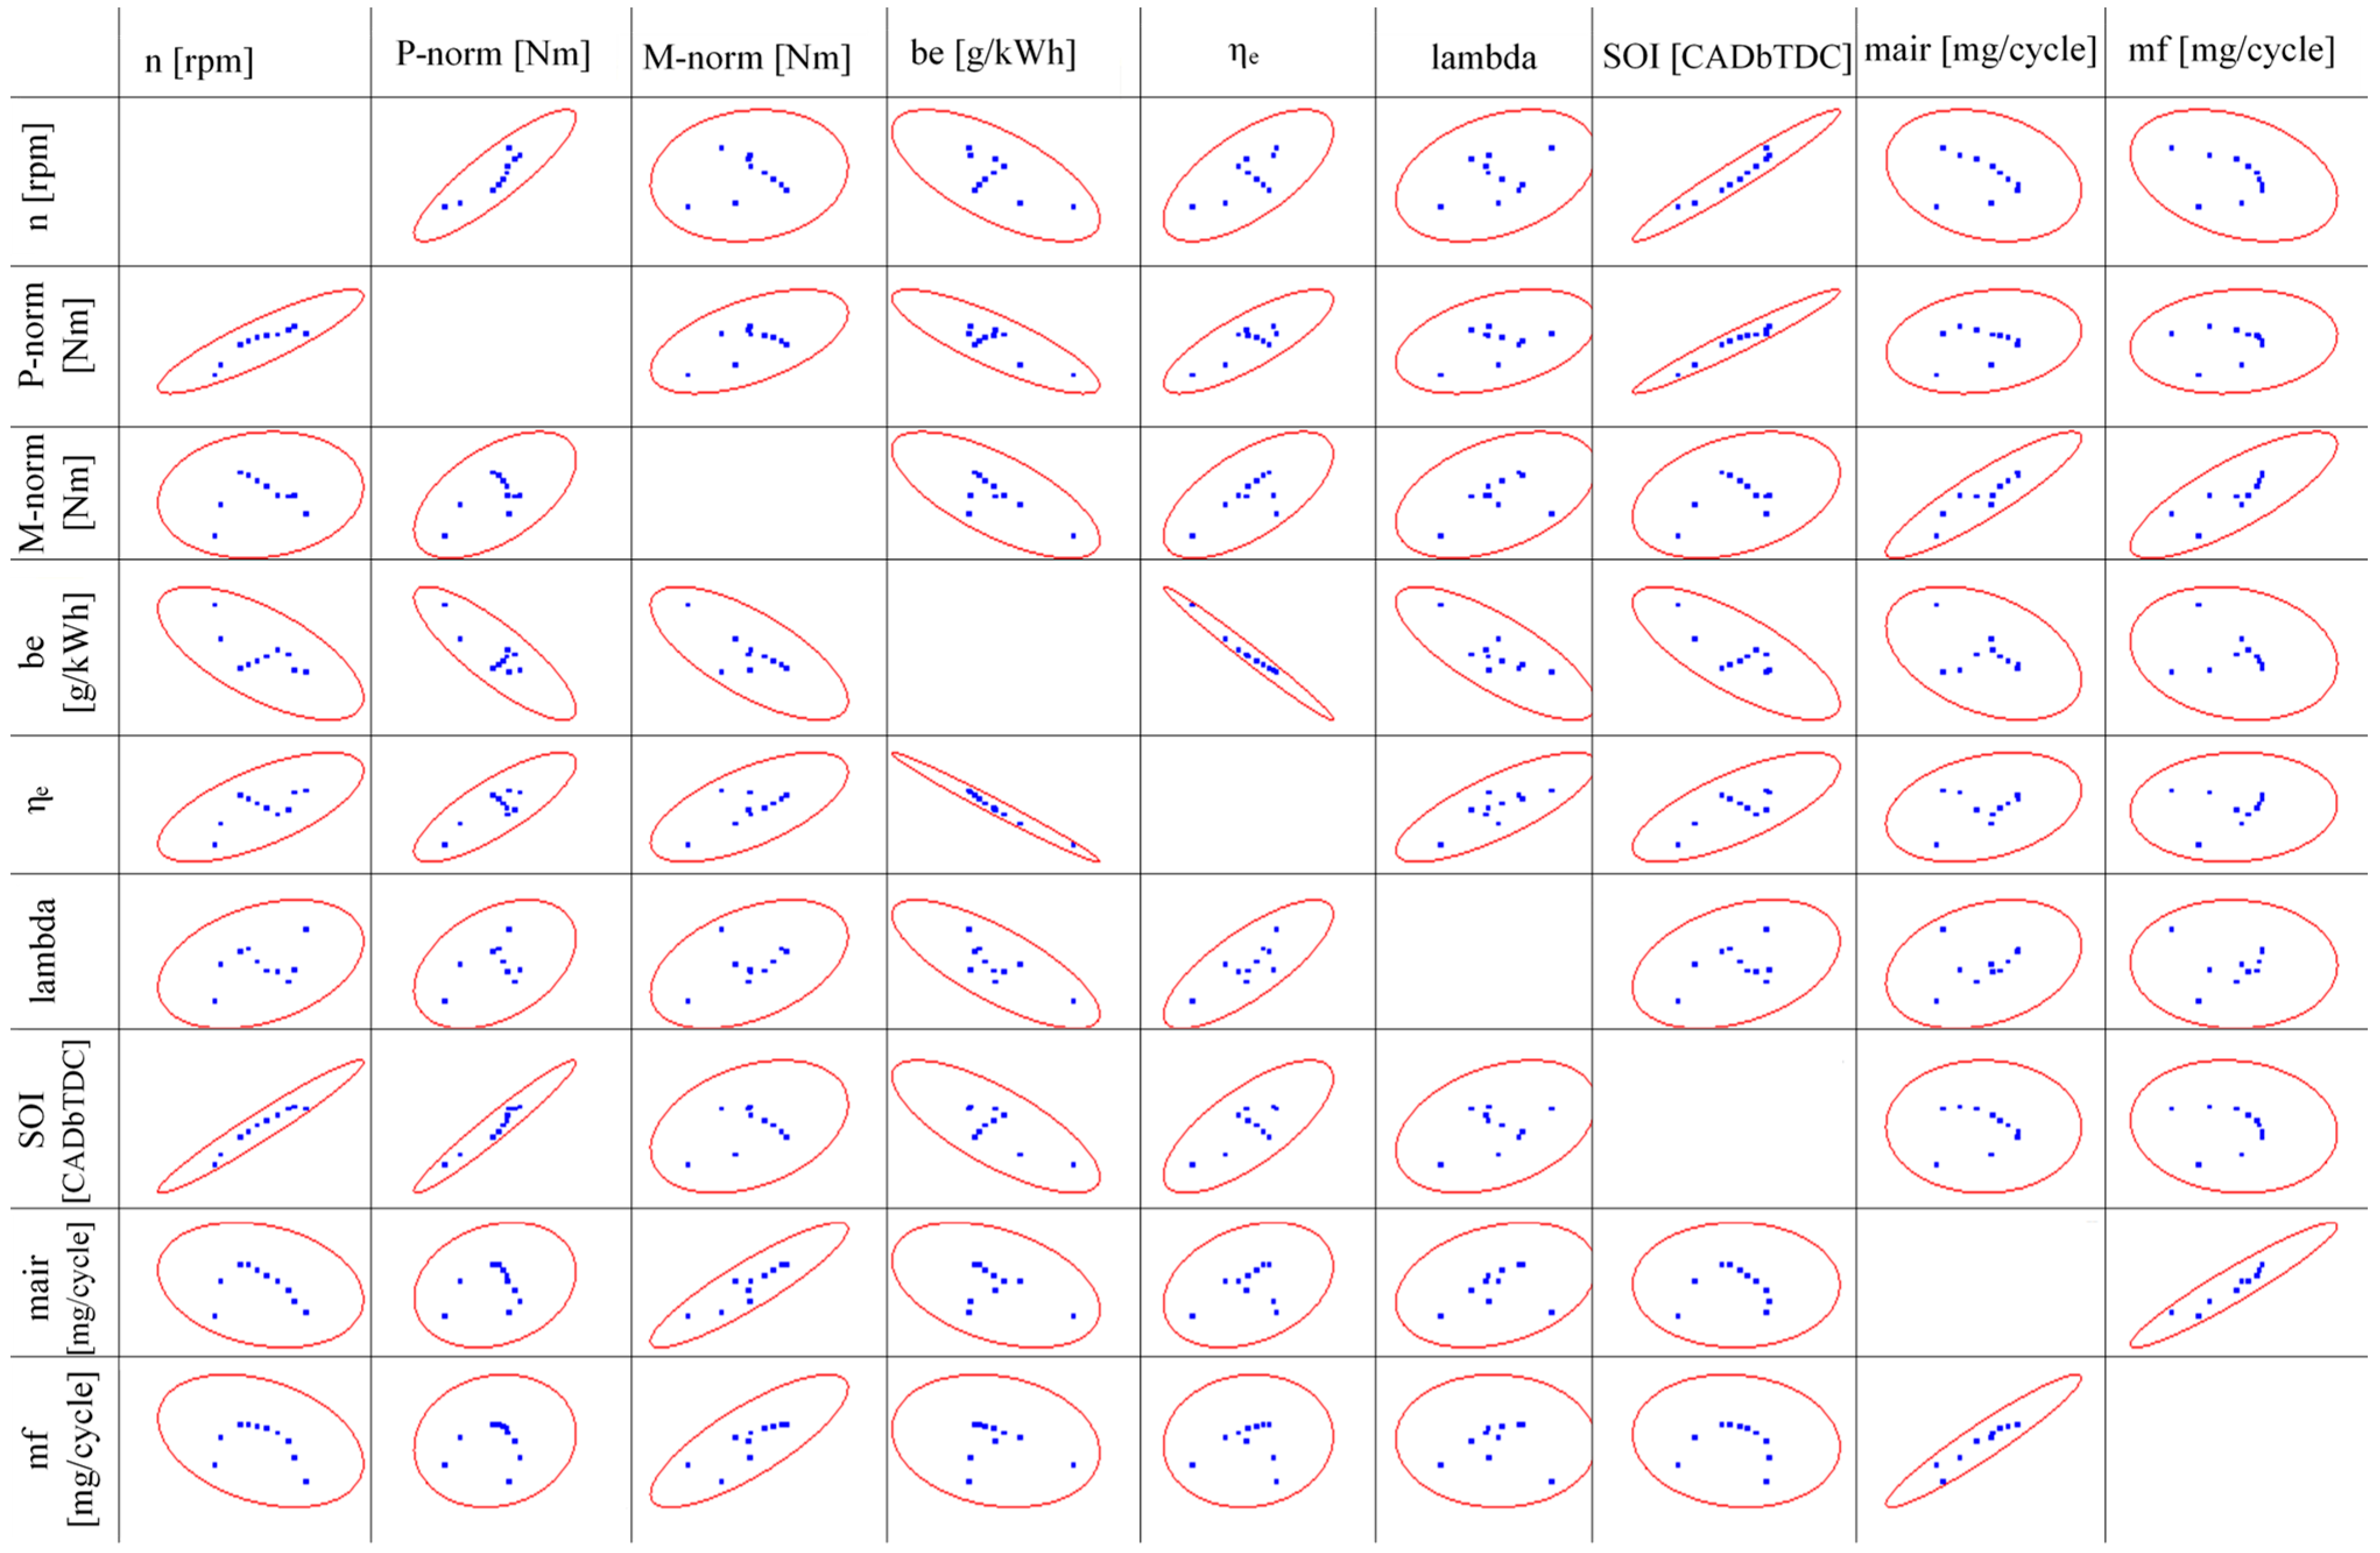
| Engine’s Parameter | n [rpm] | P-Norm [kW] | M-Norm [Nm] | be [g/kWh] | ηe | Lambda | SOI [CAD BTDC] | mair [mg/cycle] | mf [mg/cycle] |
|---|---|---|---|---|---|---|---|---|---|
| D100 | |||||||||
| n [rpm] | 1.000 | 0.898 | 0.249 | −0.684 | 0.712 | 0.126 | 0.974 | −0.519 | −0.632 |
| P-norm [kW] | 0.898 | 1.000 | 0.638 | −0.894 | 0.903 | 0.313 | 0.959 | −0.112 | −0.254 |
| M-norm [Nm] | 0.249 | 0.638 | 1.000 | −0.848 | 0.819 | 0.646 | 0.411 | 0.677 | 0.491 |
| be [g/kWh] | −0.684 | −0.894 | −0.848 | 1.000 | −0.984 | −0.665 | −0.774 | −0.243 | 0.002 |
| ηe | 0.712 | 0.903 | 0.819 | −0.984 | 1.000 | 0.669 | 0.778 | 0.167 | −0.094 |
| lambda | 0.126 | 0.313 | 0.646 | −0.665 | 0.669 | 1.000 | 0.145 | 0.471 | 0.109 |
| SOI [CAD BTDC] | 0.974 | 0.959 | 0.411 | −0.774 | 0.778 | 0.145 | 1.000 | −0.347 | −0.445 |
| mair [mg/cycle] | −0.519 | −0.112 | 0.677 | −0.243 | 0.167 | 0.471 | −0.347 | 1.000 | 0.928 |
| mf [mg/cycle] | −0.632 | −0.254 | 0.491 | 0.002 | −0.094 | 0.109 | −0.445 | 0.928 | 1.000 |
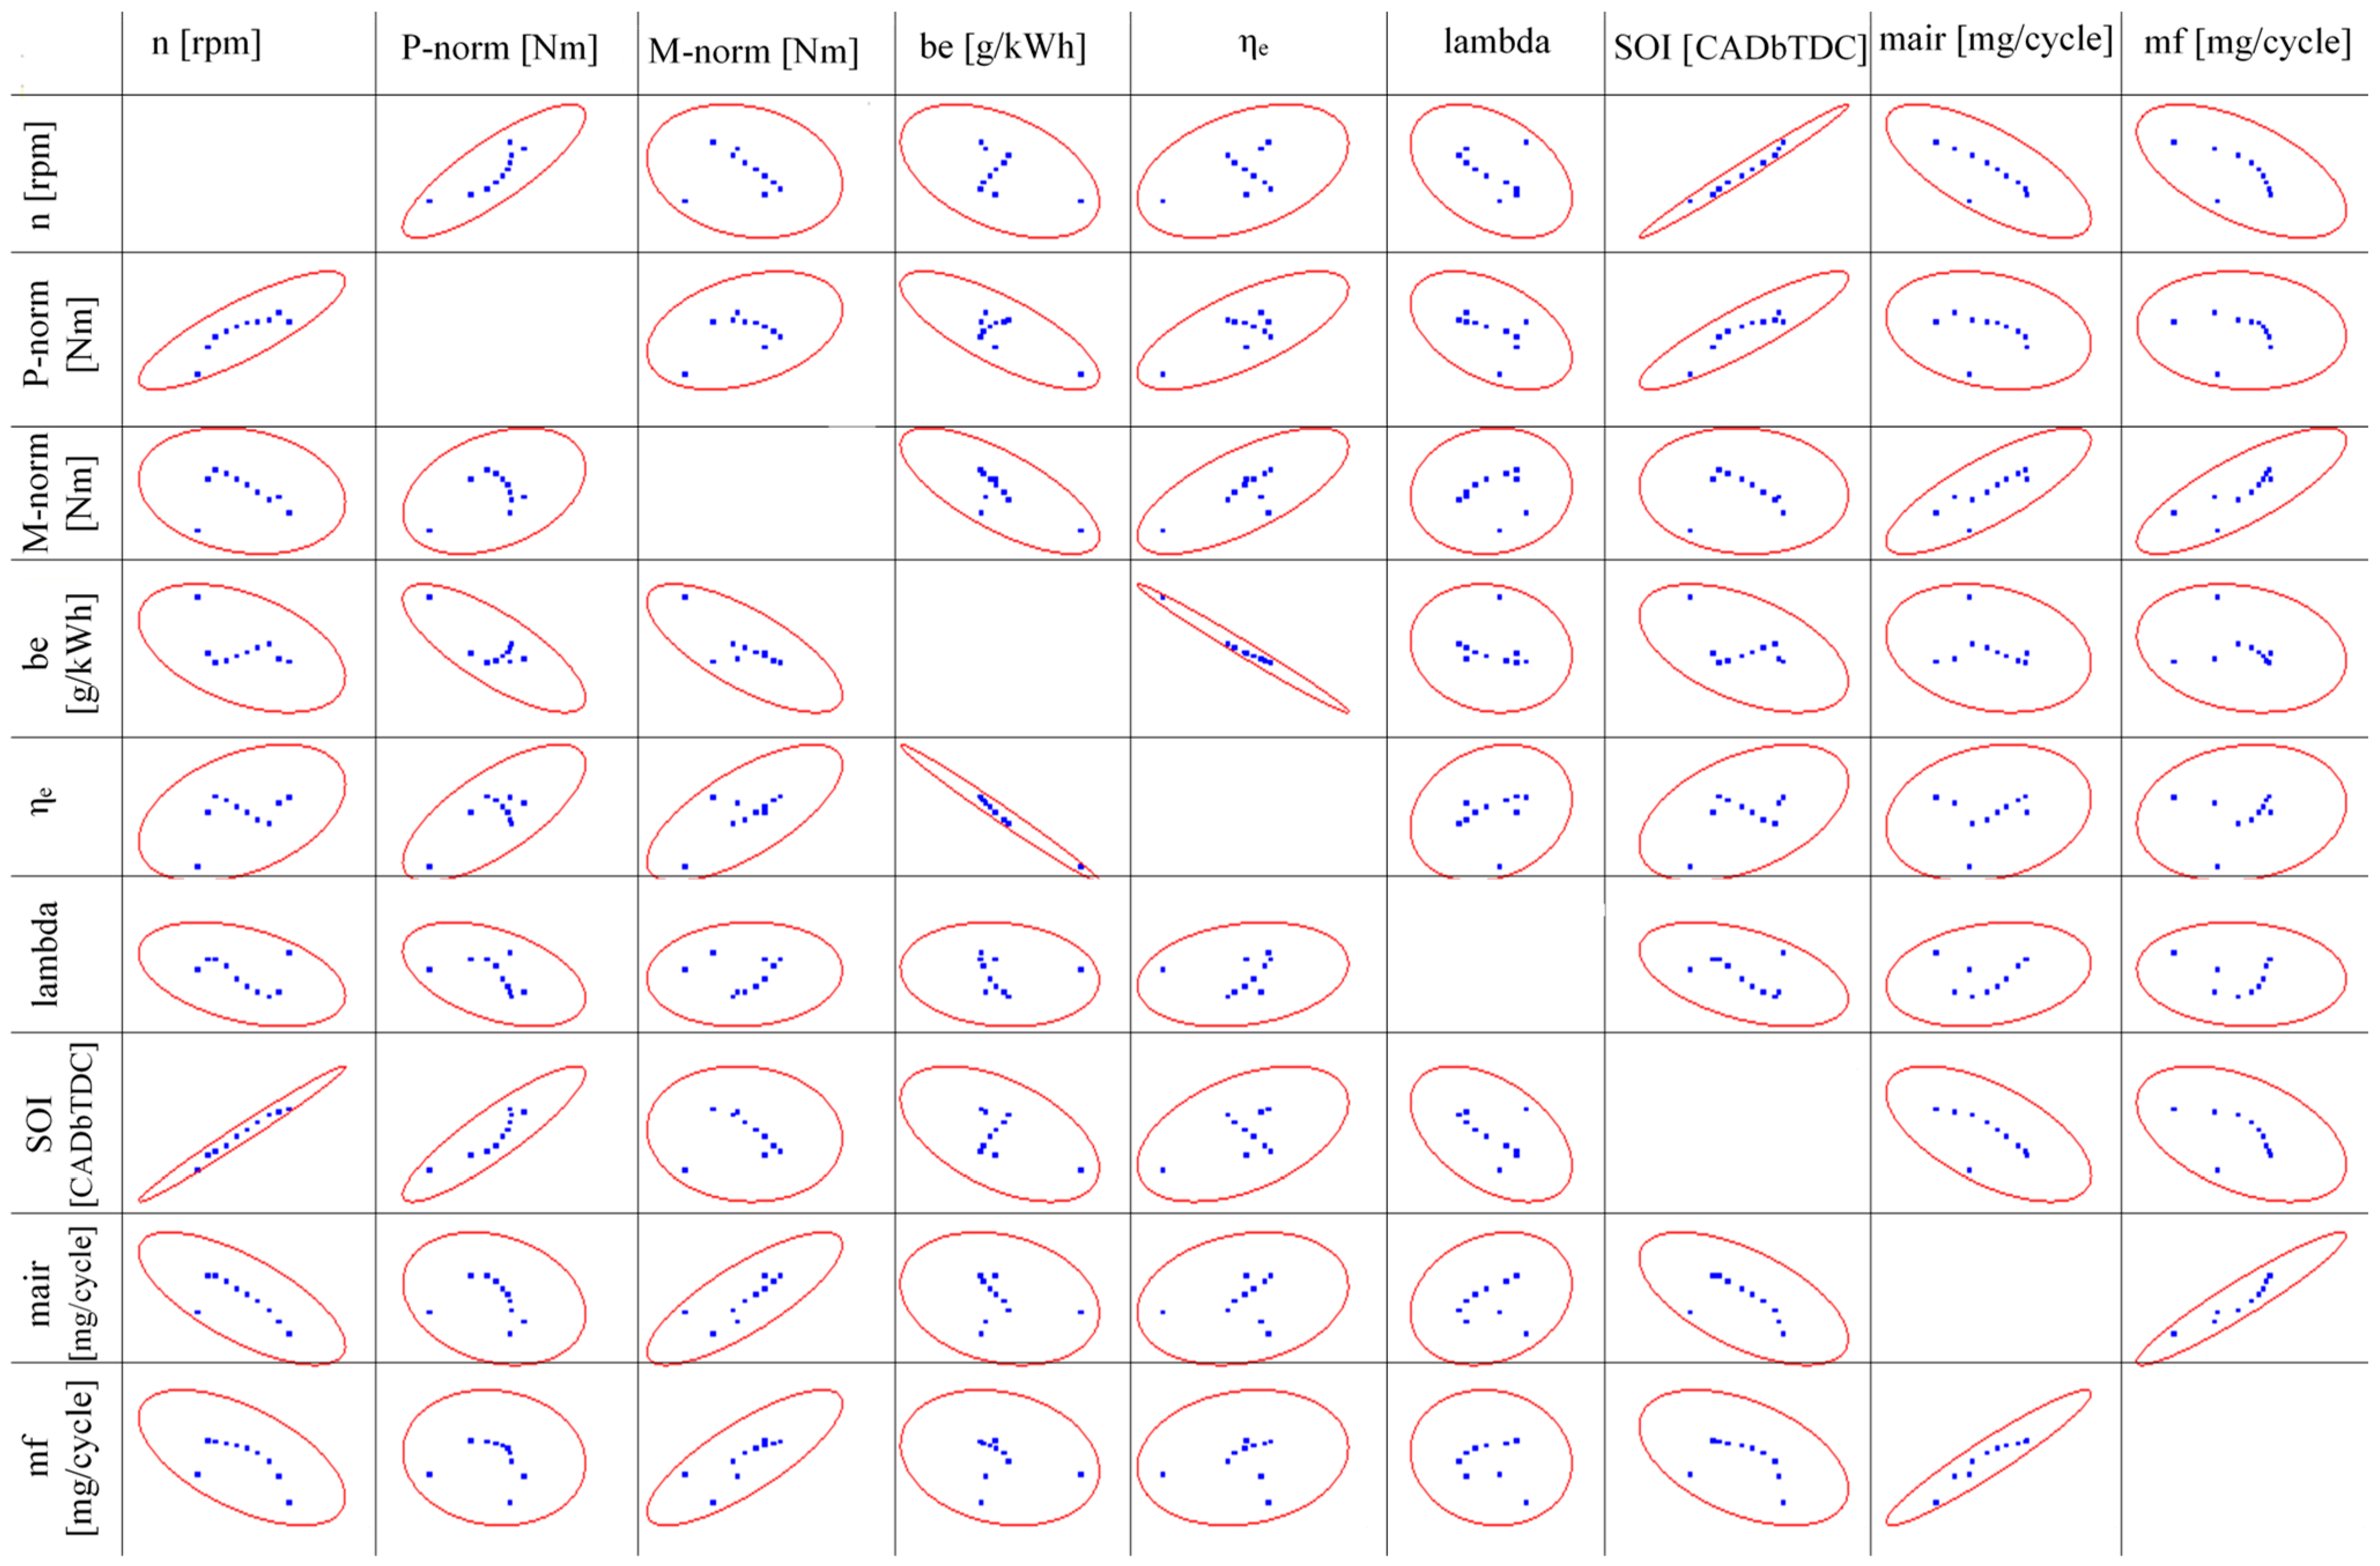
| HVO100 | |||||||||
| n [rpm] | 1.000 | 0.885 | 0.121 | −0.667 | 0.668 | 0.355 | 0.969 | −0.234 | −0.334 |
| P-norm [kW] | 0.885 | 1.000 | 0.555 | −0.840 | 0.809 | 0.399 | 0.969 | 0.212 | 0.114 |
| M-norm [Nm] | 0.121 | 0.555 | 1.000 | −0.711 | 0.646 | 0.436 | 0.344 | 0.903 | 0.802 |
| be [g/kWh] | −0.667 | −0.840 | −0.711 | 1.000 | −0.987 | −0.773 | −0.757 | −0.397 | −0.174 |
| ηe | 0.668 | 0.809 | 0.646 | −0.987 | 1.000 | 0.786 | 0.733 | 0.303 | 0.068 |
| lambda | 0.355 | 0.399 | 0.436 | −0.773 | 0.786 | 1.000 | 0.358 | 0.286 | −0.023 |
| SOI [CAD BTDC] | 0.969 | 0.969 | 0.344 | −0.757 | 0.733 | 0.358 | 1.000 | −0.004 | −0.094 |
| mair [mg/cycle] | −0.234 | 0.212 | 0.903 | −0.397 | 0.303 | 0.286 | −0.004 | 1.000 | 0.951 |
| mf [mg/cycle] | −0.334 | 0.114 | 0.802 | −0.174 | 0.068 | −0.023 | −0.094 | 0.951 | 1.000 |
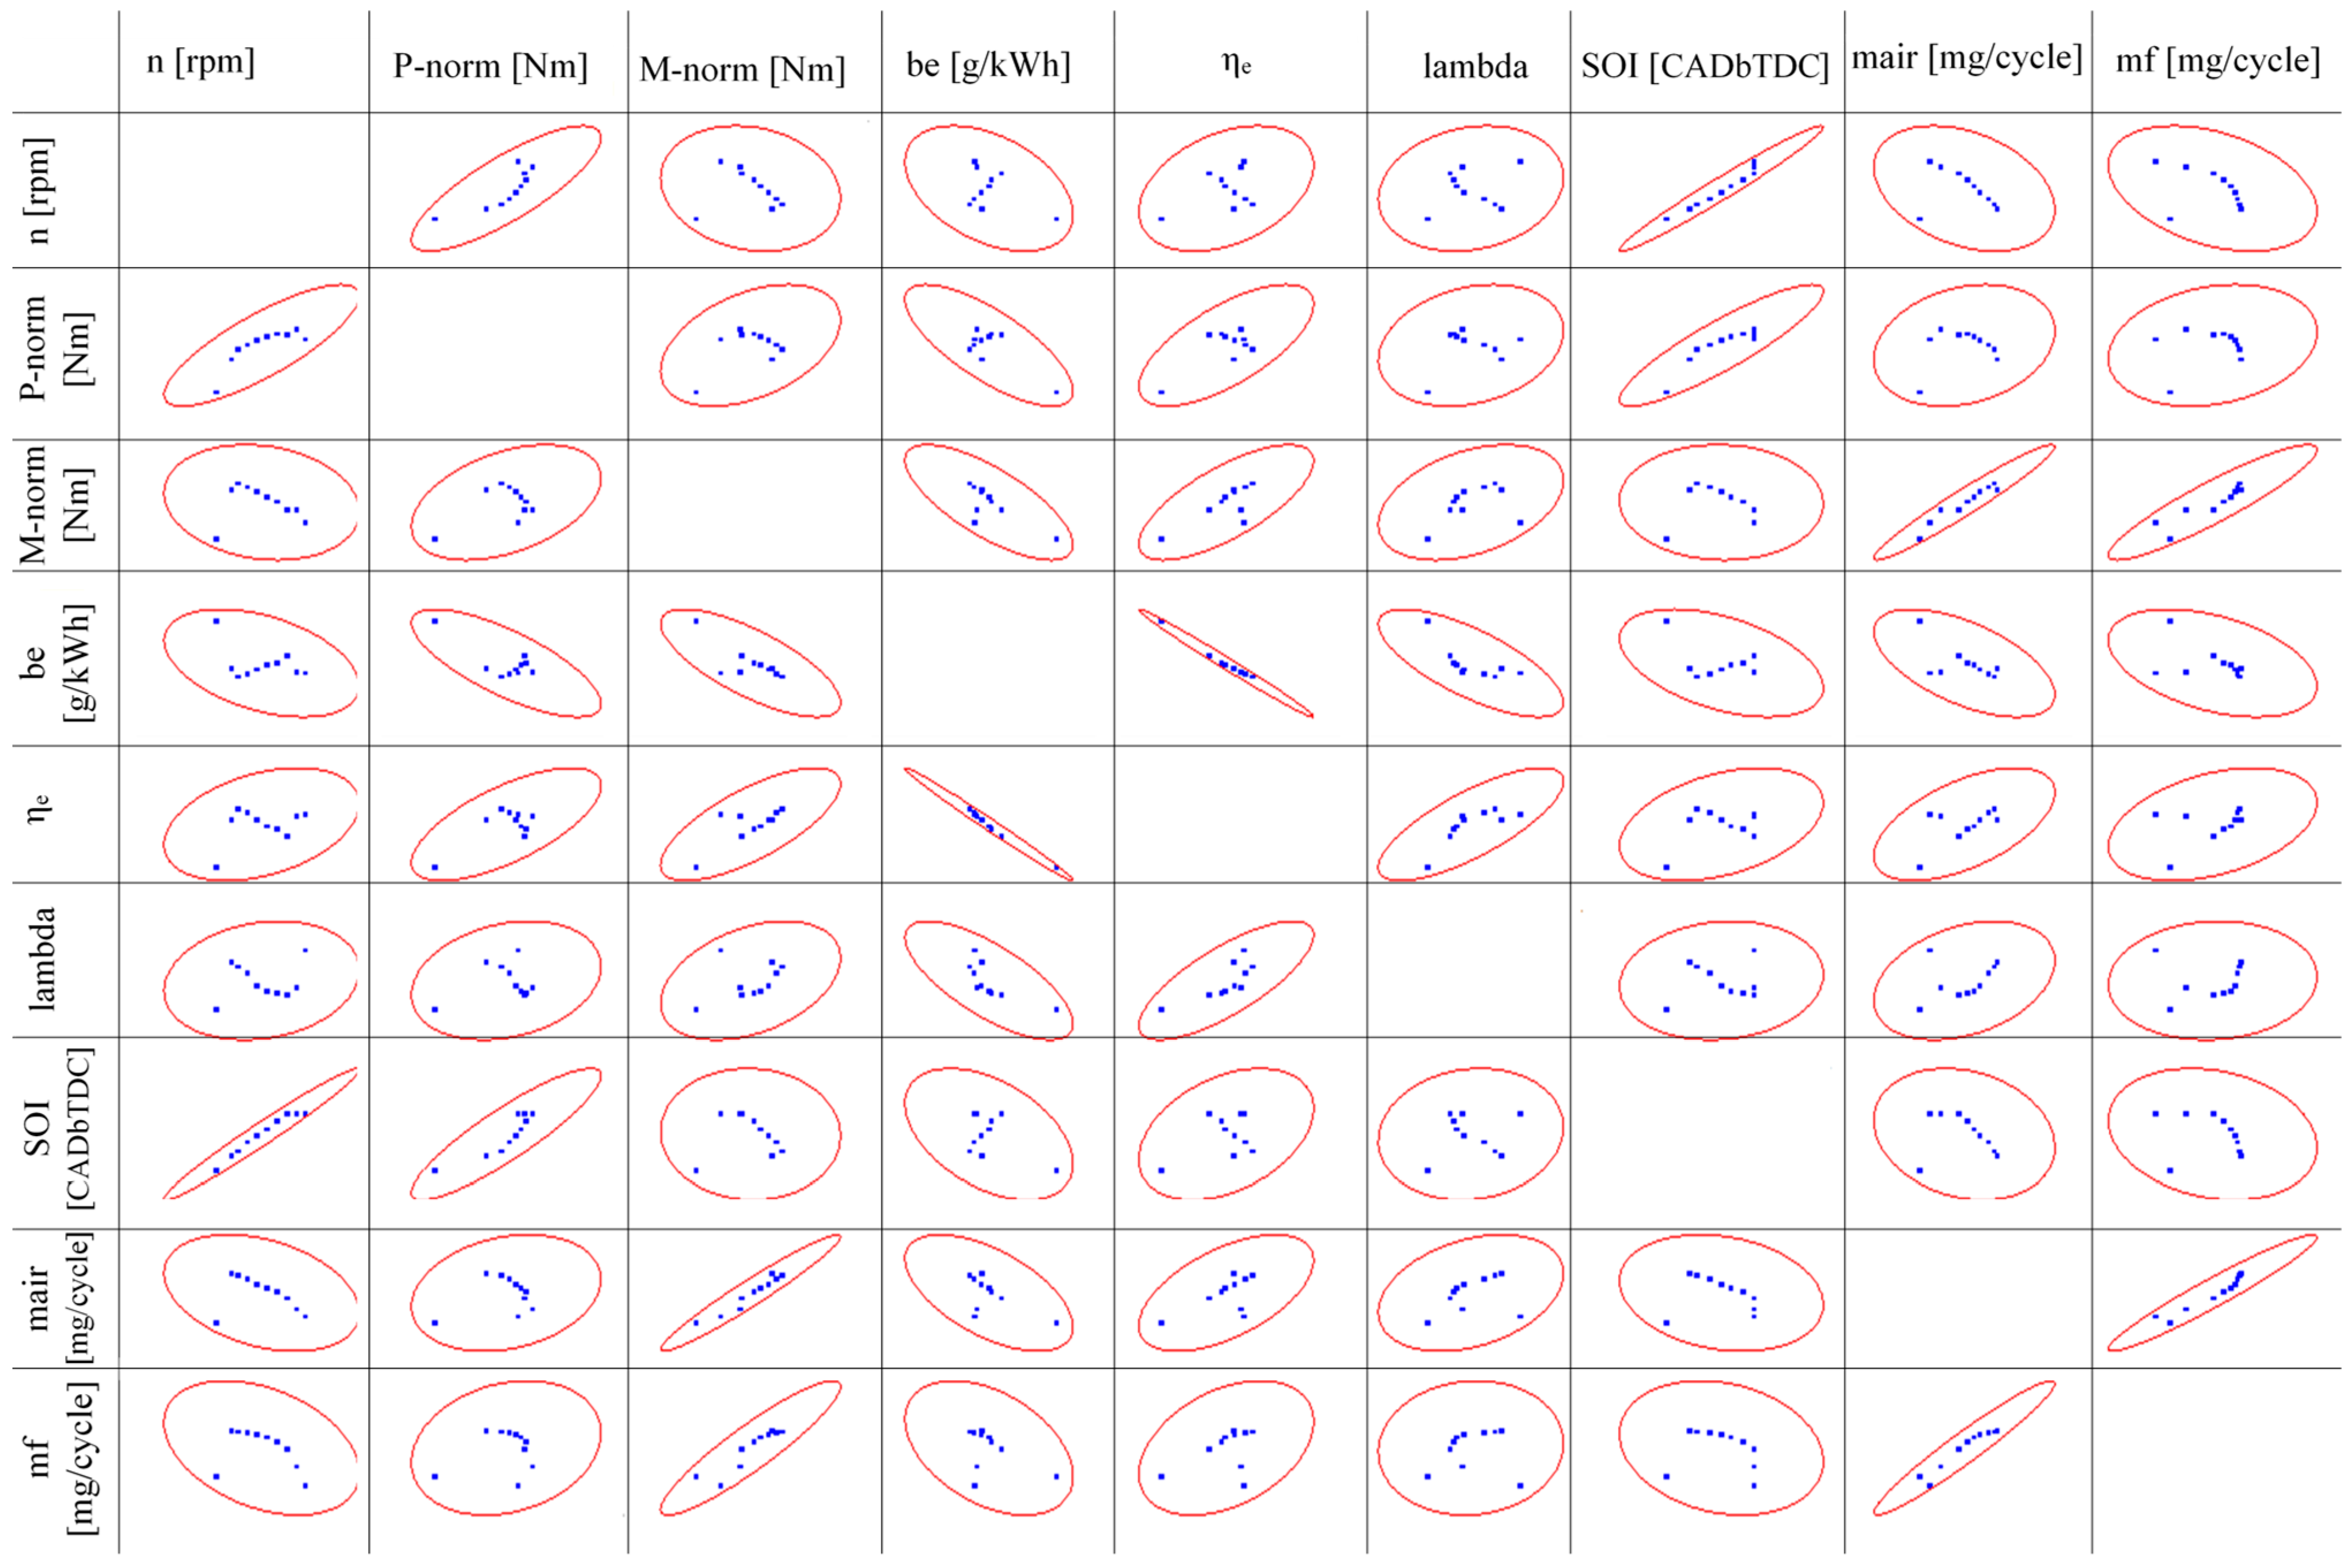
| HVOB5 | |||||||||
| n [rpm] | 1.000 | 0.840 | −0.188 | −0.448 | 0.413 | −0.405 | 0.988 | −0.709 | −0.588 |
| P-norm [kW] | 0.840 | 1.000 | 0.357 | −0.771 | 0.718 | −0.454 | 0.897 | −0.231 | −0.084 |
| M-norm [Nm] | −0.188 | 0.357 | 1.000 | −0.729 | 0.705 | 0.076 | −0.071 | 0.808 | 0.803 |
| be [g/kWh] | −0.448 | −0.771 | −0.729 | 1.000 | −0.990 | −0.113 | −0.513 | −0.220 | −0.194 |
| ηe | 0.413 | 0.718 | 0.705 | −0.990 | 1.000 | 0.210 | 0.462 | 0.204 | 0.146 |
| lambda | −0.405 | −0.454 | 0.076 | −0.113 | 0.210 | 1.000 | −0.469 | 0.221 | −0.091 |
| SOI [CAD BTDC] | 0.988 | 0.897 | −0.071 | −0.513 | 0.462 | −0.469 | 1.000 | −0.607 | −0.462 |
| mair [mg/cycle] | −0.709 | −0.231 | 0.808 | −0.220 | 0.204 | 0.221 | −0.607 | 1.000 | 0.951 |
| mf [mg/cycle] | −0.588 | −0.084 | 0.803 | −0.194 | 0.146 | −0.091 | −0.462 | 0.951 | 1.000 |
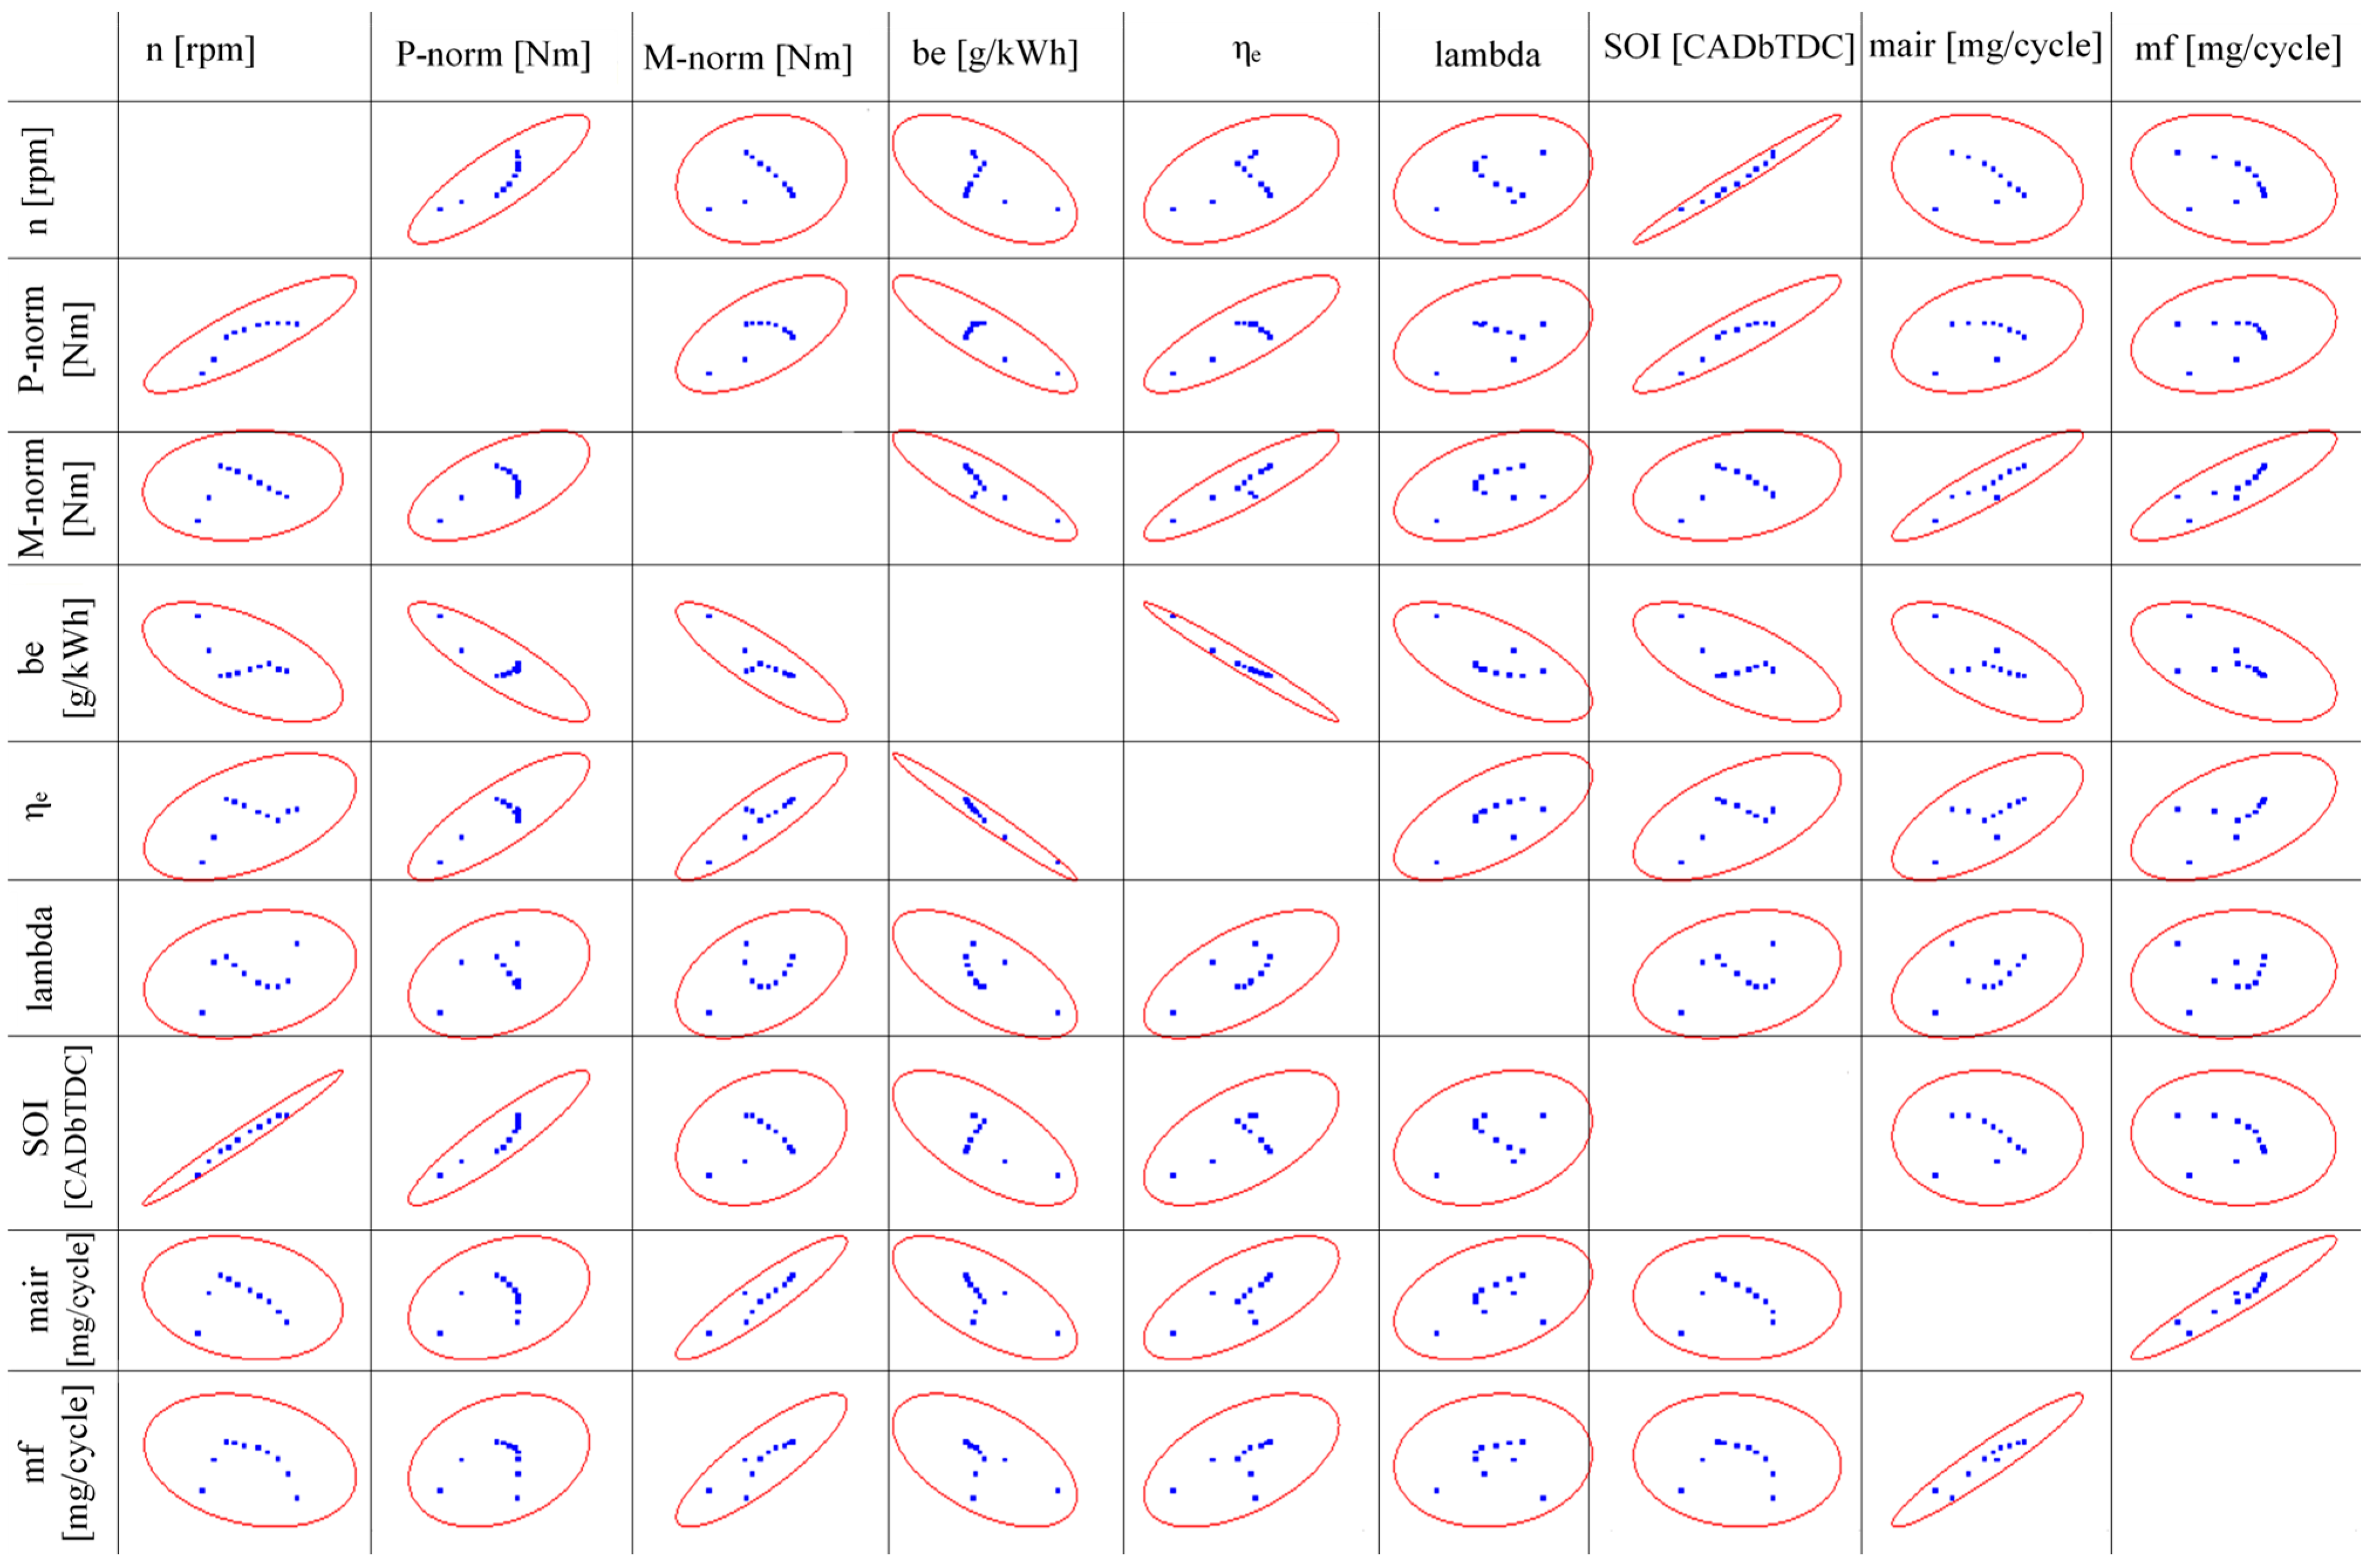
| HVOB10 | |||||||||
| n [rpm] | 1.000 | 0.814 | −0.161 | −0.423 | 0.367 | 0.176 | 0.979 | −0.340 | −0.373 |
| P-norm [kW] | 0.814 | 1.000 | 0.421 | −0.751 | 0.683 | 0.241 | 0.889 | 0.235 | 0.218 |
| M-norm [Nm] | −0.161 | 0.421 | 1.000 | −0.737 | 0.722 | 0.382 | −0.031 | 0.966 | 0.917 |
| be [g/kWh] | −0.423 | −0.751 | −0.737 | 1.000 | −0.992 | −0.729 | −0.459 | −0.584 | −0.425 |
| ηe | 0.367 | 0.683 | 0.722 | −0.992 | 1.000 | 0.765 | 0.388 | 0.565 | 0.391 |
| lambda | 0.176 | 0.241 | 0.382 | −0.729 | 0.765 | 1.000 | 0.103 | 0.333 | 0.064 |
| SOI [CAD BTDC] | 0.979 | 0.889 | −0.031 | −0.459 | 0.388 | 0.103 | 1.000 | −0.204 | −0.204 |
| mair [mg/cycle] | −0.340 | 0.235 | 0.966 | −0.584 | 0.565 | 0.333 | −0.204 | 1.000 | 0.961 |
| mf [mg/cycle] | −0.373 | 0.218 | 0.917 | −0.425 | 0.391 | 0.064 | −0.204 | 0.961 | 1.000 |
| HVOB20 | |||||||||
| n [rpm] | 1.000 | 0.850 | 0.125 | −0.560 | 0.494 | 0.246 | 0.985 | −0.186 | −0.241 |
| P-norm [kW] | 0.850 | 1.000 | 0.616 | −0.861 | 0.823 | 0.335 | 0.917 | 0.321 | 0.276 |
| M-norm [Nm] | 0.125 | 0.616 | 1.000 | −0.860 | 0.884 | 0.452 | 0.267 | 0.915 | 0.849 |
| be [g/kWh] | −0.560 | −0.861 | −0.860 | 1.000 | −0.982 | −0.656 | −0.661 | −0.667 | −0.527 |
| ηe | 0.494 | 0.823 | 0.884 | −0.982 | 1.000 | 0.643 | 0.590 | 0.666 | 0.524 |
| lambda | 0.246 | 0.335 | 0.452 | −0.656 | 0.643 | 1.000 | 0.260 | 0.389 | 0.091 |
| SOI [CAD BTDC] | 0.985 | 0.917 | 0.267 | −0.661 | 0.590 | 0.260 | 1.000 | −0.031 | −0.076 |
| mair [mg/cycle] | −0.186 | 0.321 | 0.915 | −0.667 | 0.666 | 0.389 | −0.031 | 1.000 | 0.951 |
| mf [mg/cycle] | −0.241 | 0.276 | 0.849 | −0.527 | 0.524 | 0.091 | −0.076 | 0.951 | 1.000 |
Disclaimer/Publisher’s Note: The statements, opinions and data contained in all publications are solely those of the individual author(s) and contributor(s) and not of MDPI and/or the editor(s). MDPI and/or the editor(s) disclaim responsibility for any injury to people or property resulting from any ideas, methods, instructions or products referred to in the content. |
© 2024 by the authors. Licensee MDPI, Basel, Switzerland. This article is an open access article distributed under the terms and conditions of the Creative Commons Attribution (CC BY) license (https://creativecommons.org/licenses/by/4.0/).
Share and Cite
Valeika, G.; Matijošius, J.; Orynycz, O.; Rimkus, A.; Kilikevičius, A.; Tucki, K. Compression Ignition Internal Combustion Engine’s Energy Parameter Research Using Variable (HVO) Biodiesel and Biobutanol Fuel Blends. Energies 2024, 17, 262. https://doi.org/10.3390/en17010262
Valeika G, Matijošius J, Orynycz O, Rimkus A, Kilikevičius A, Tucki K. Compression Ignition Internal Combustion Engine’s Energy Parameter Research Using Variable (HVO) Biodiesel and Biobutanol Fuel Blends. Energies. 2024; 17(1):262. https://doi.org/10.3390/en17010262
Chicago/Turabian StyleValeika, Gintaras, Jonas Matijošius, Olga Orynycz, Alfredas Rimkus, Artūras Kilikevičius, and Karol Tucki. 2024. "Compression Ignition Internal Combustion Engine’s Energy Parameter Research Using Variable (HVO) Biodiesel and Biobutanol Fuel Blends" Energies 17, no. 1: 262. https://doi.org/10.3390/en17010262