
Life Cycle Assessment of District Heating Infrastructures: A Comparison of Pipe Typologies in France

 , ,
, ,  and
and
Abstract
:1. Introduction
2. Material and Methods
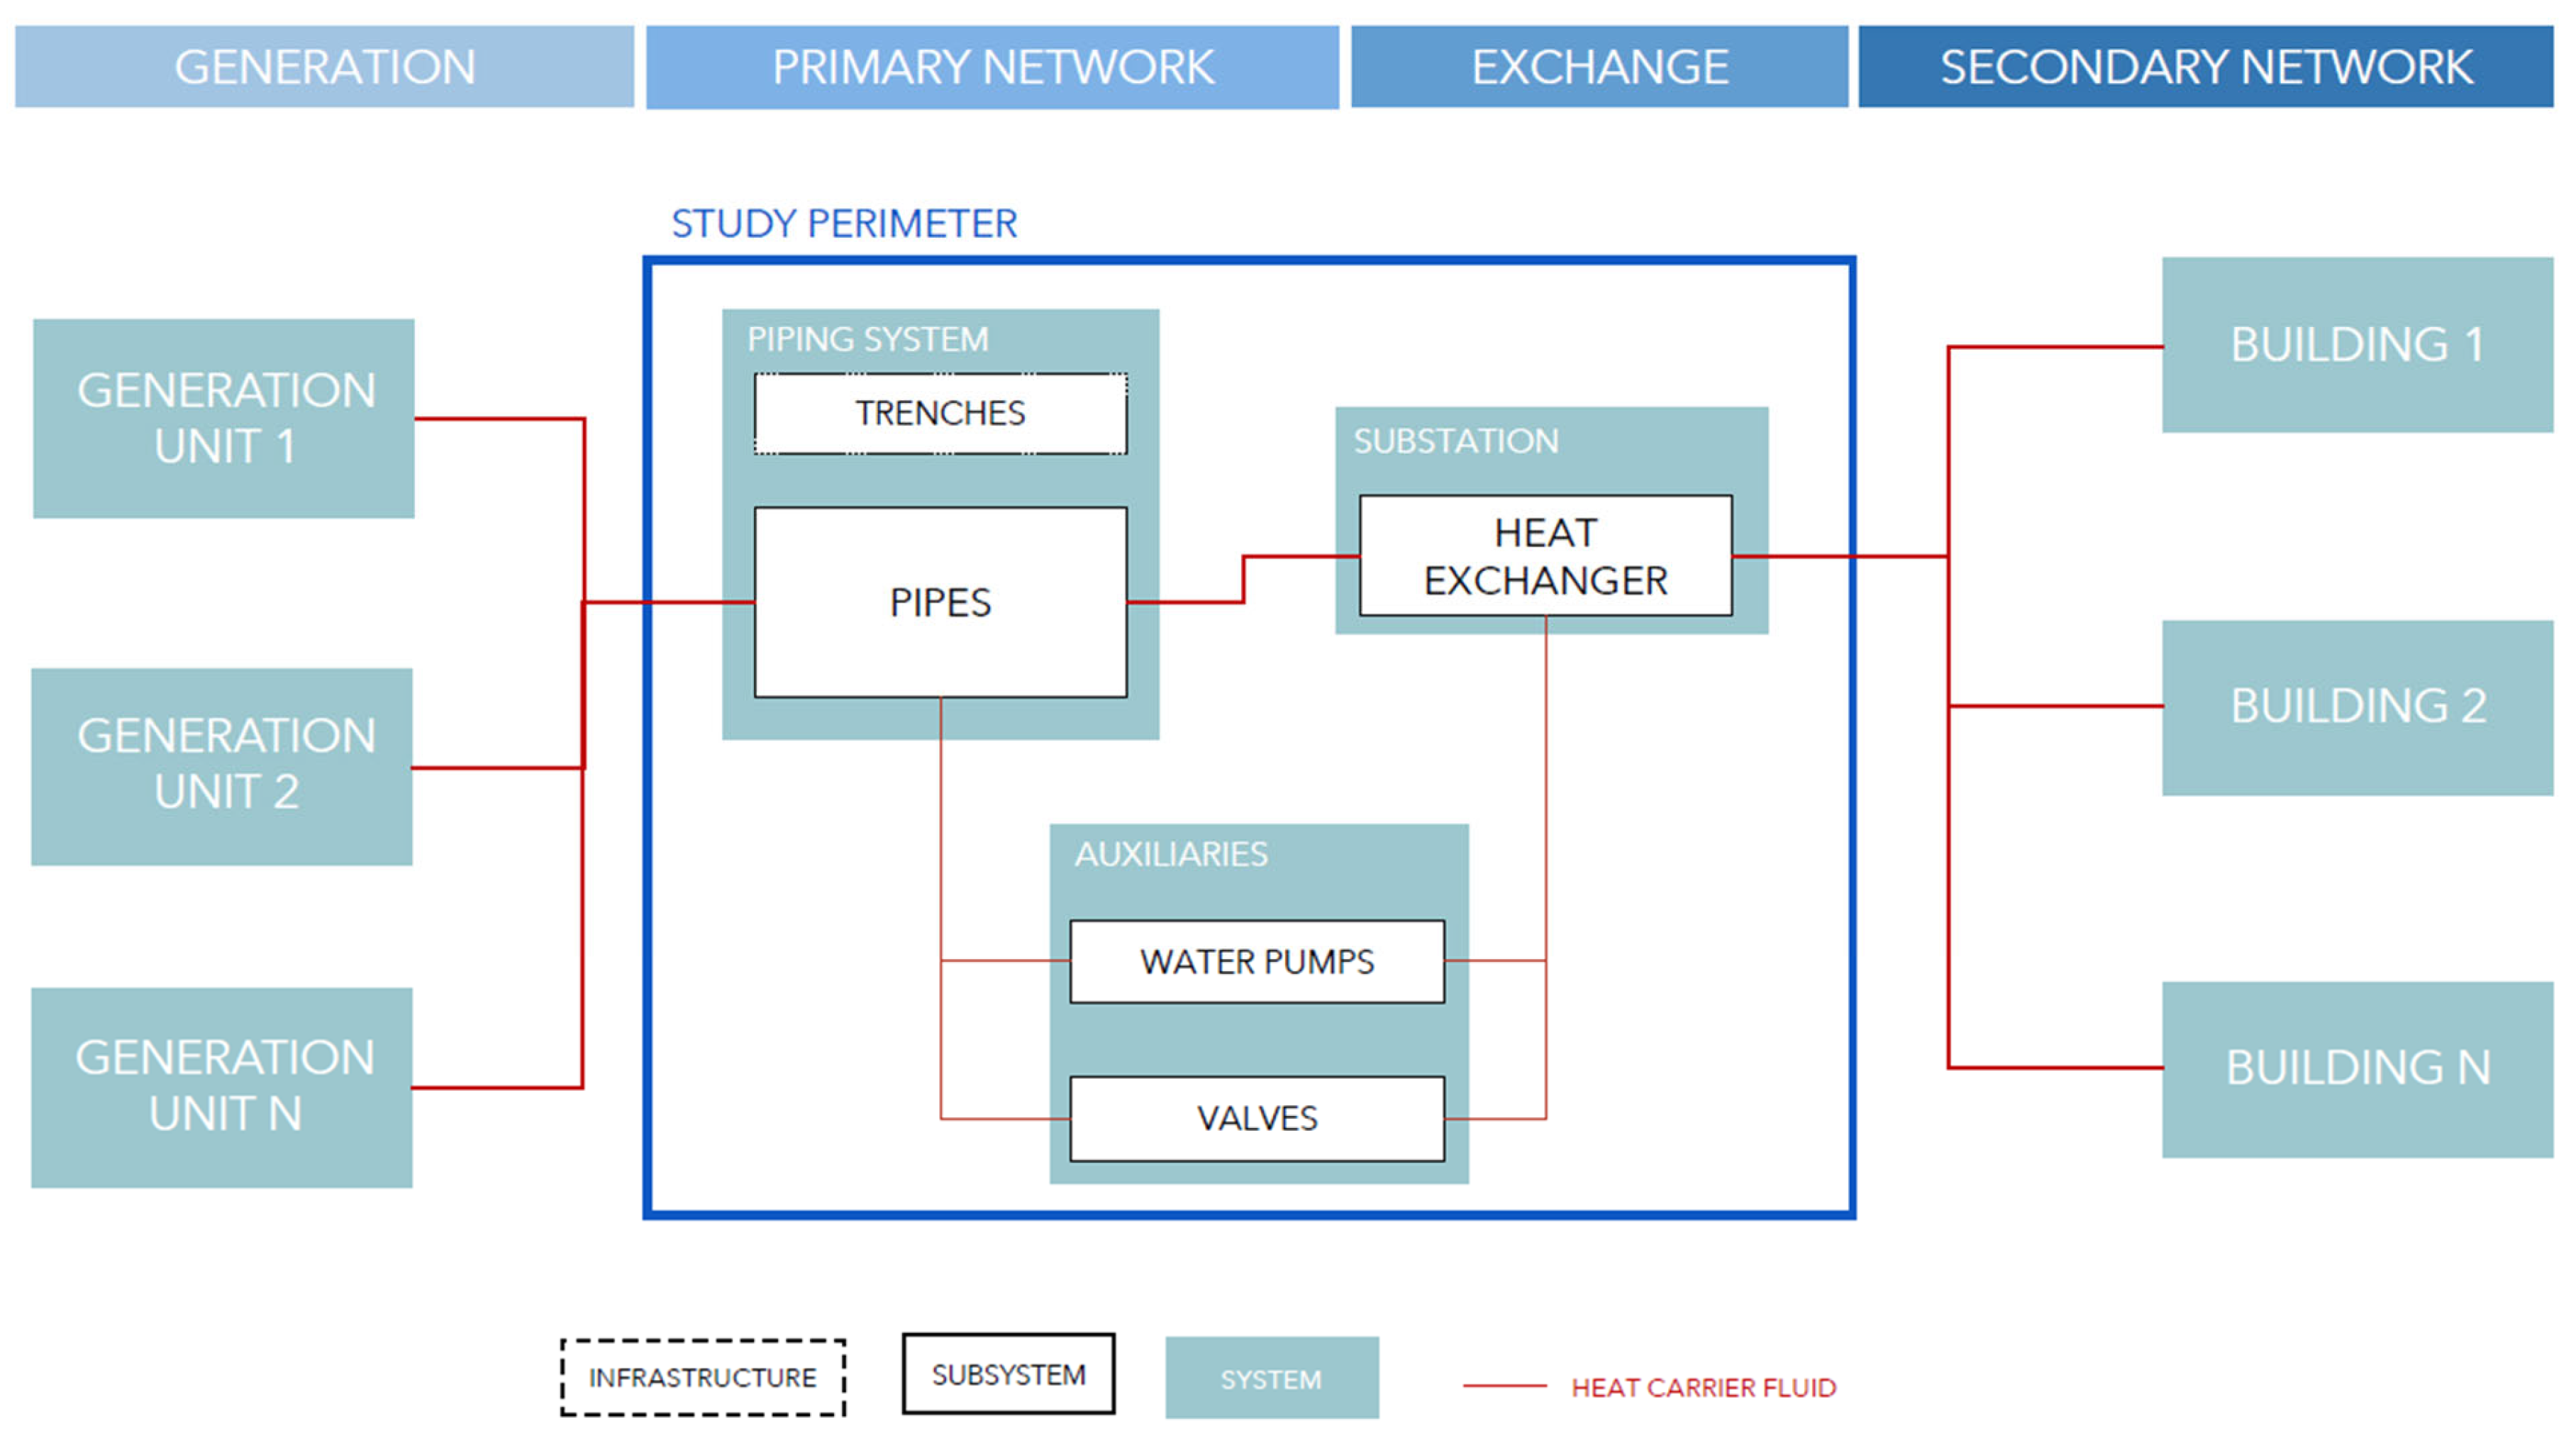
2.1. Product Systems
- the primary network was modeled, considering service pipes, trench works, and heat carrier fluid—in this case, water and water pumps;
- the substations were modeled, considering a heat exchanger and regulating valves—more precisely, a motorized regulating valve and a differential pressure regulator valve per substation. This type of valve was chosen by designers for reasons related to internal pressure management of the entire system [31].
2.2. System Boundaries
- is the number of replacements of the product, component, or element (i);
- ReqSL is the required service life of the product, component, or element;
- is the estimated service life of the component (i).
2.3. Functional Unit
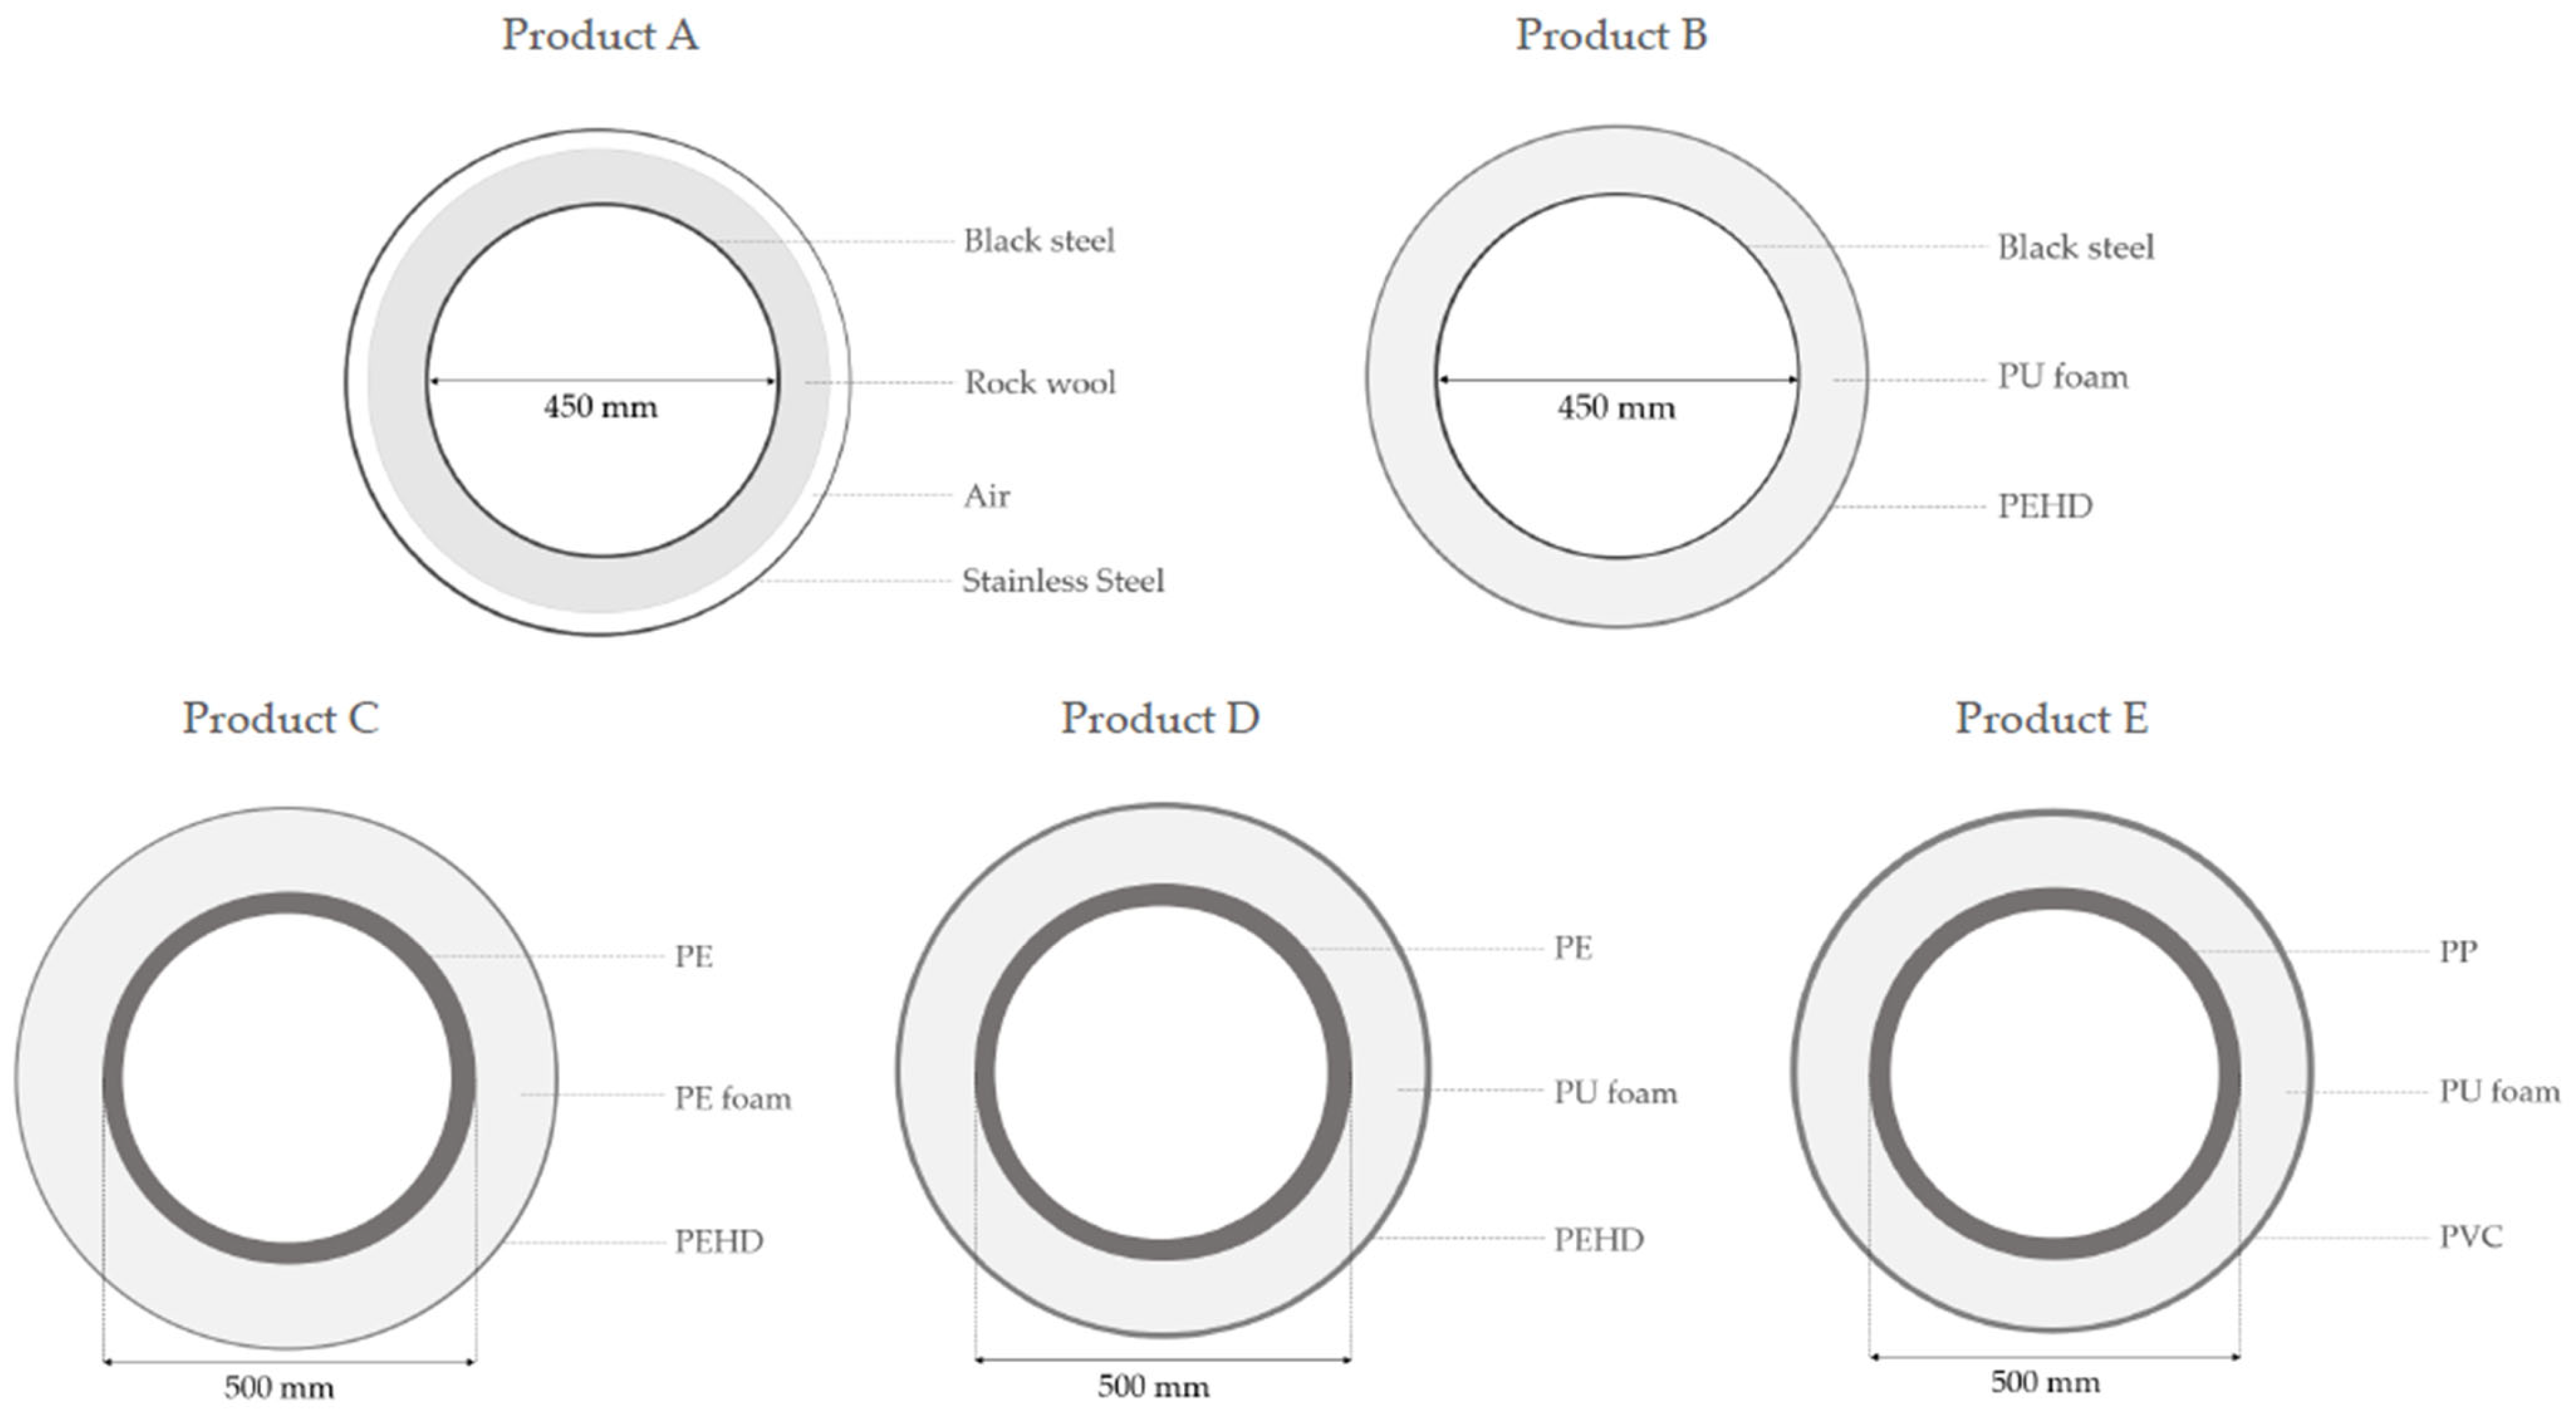
- rigid infrastructures providing a supply temperature above 80–100 °C (not exceeding 140 °C) and thermal performance (U-value) of 0.331 W/(m2K), with a ND of 450 mm. Generally used for third-generation DHN;
- flexible infrastructure providing a supply temperature up to 50–70 °C (not exceeding 80 °C) and thermal performance (U-value) of 0.267 W/(m2K), with a ND of 500 mm. Generally used for fourth-generation DHN (though not for fifth-generation DHNs because they do not have thermal insulation around the pipes).
2.4. Life Cycle Impacts Assessment Method
3. Life Cycle Inventory Analysis—Case Study
3.1. Network Modeling and Sizing
3.2. Optimal Nominal Diameter
3.3. Pipe Typologies
3.4. Life Cycle Inventory Analysis
4. Results
4.1. Rigid Infrastructure Comparison
4.2. Flexible Infrastructure Comparison
- for products D and E, the insulation represented the most significant contributor for all the impact categories shown in the table;
- for product C, the most important contributor was the external layer (except for Air Pollution).
4.3. One at a Time Sensitivity Analysis
- excavation and refilling of the soil with the use of diesel work engines, which was designated as ‘excavation’;
- extraction and transport of filler material (e.g., sand and gravel) to fill the trenches after the pipes were installed, which was designated as ‘filler material’;
- destruction and relaying of a bitumen pavement if the network is in a district area with a pre-existing pavement, which was designated ‘pavement replacement’.
- scenario 1 (baseline)—trenches are filled using a layer of filler material imported from off-site locations.
- scenario 2—in total, 50% of trenches are built via reusing the excavated soil mass, while the rest are constructed using imported filler material.
5. Discussion
6. Conclusions
- two rigid infrastructures composed of (i) steel pipes, (ii) rock wool or polyurethane rigid foam as insulation, and (iii) an external layer in steel or high-density polyethylene. To supply temperatures above 80–100 °C (not exceeding 140 °C) and thermal performance, these infrastructures are generally used for third generation district heating networks;
- three flexible infrastructures composed of (i) polymeric pipes in high- or low-density polyethylene, polypropylene, or polyvinyl chloride; (ii) low-density polyethylene linear or polyurethane rigid foam as insulation; and (iii) an external layer in polyethylene high density, low density-polyethylene linear, or polyvinyl chloride. To supply temperature up to 50–70 °C (not exceeding 80 °C), these infrastructures are generally used for fourth generation district heating networks.
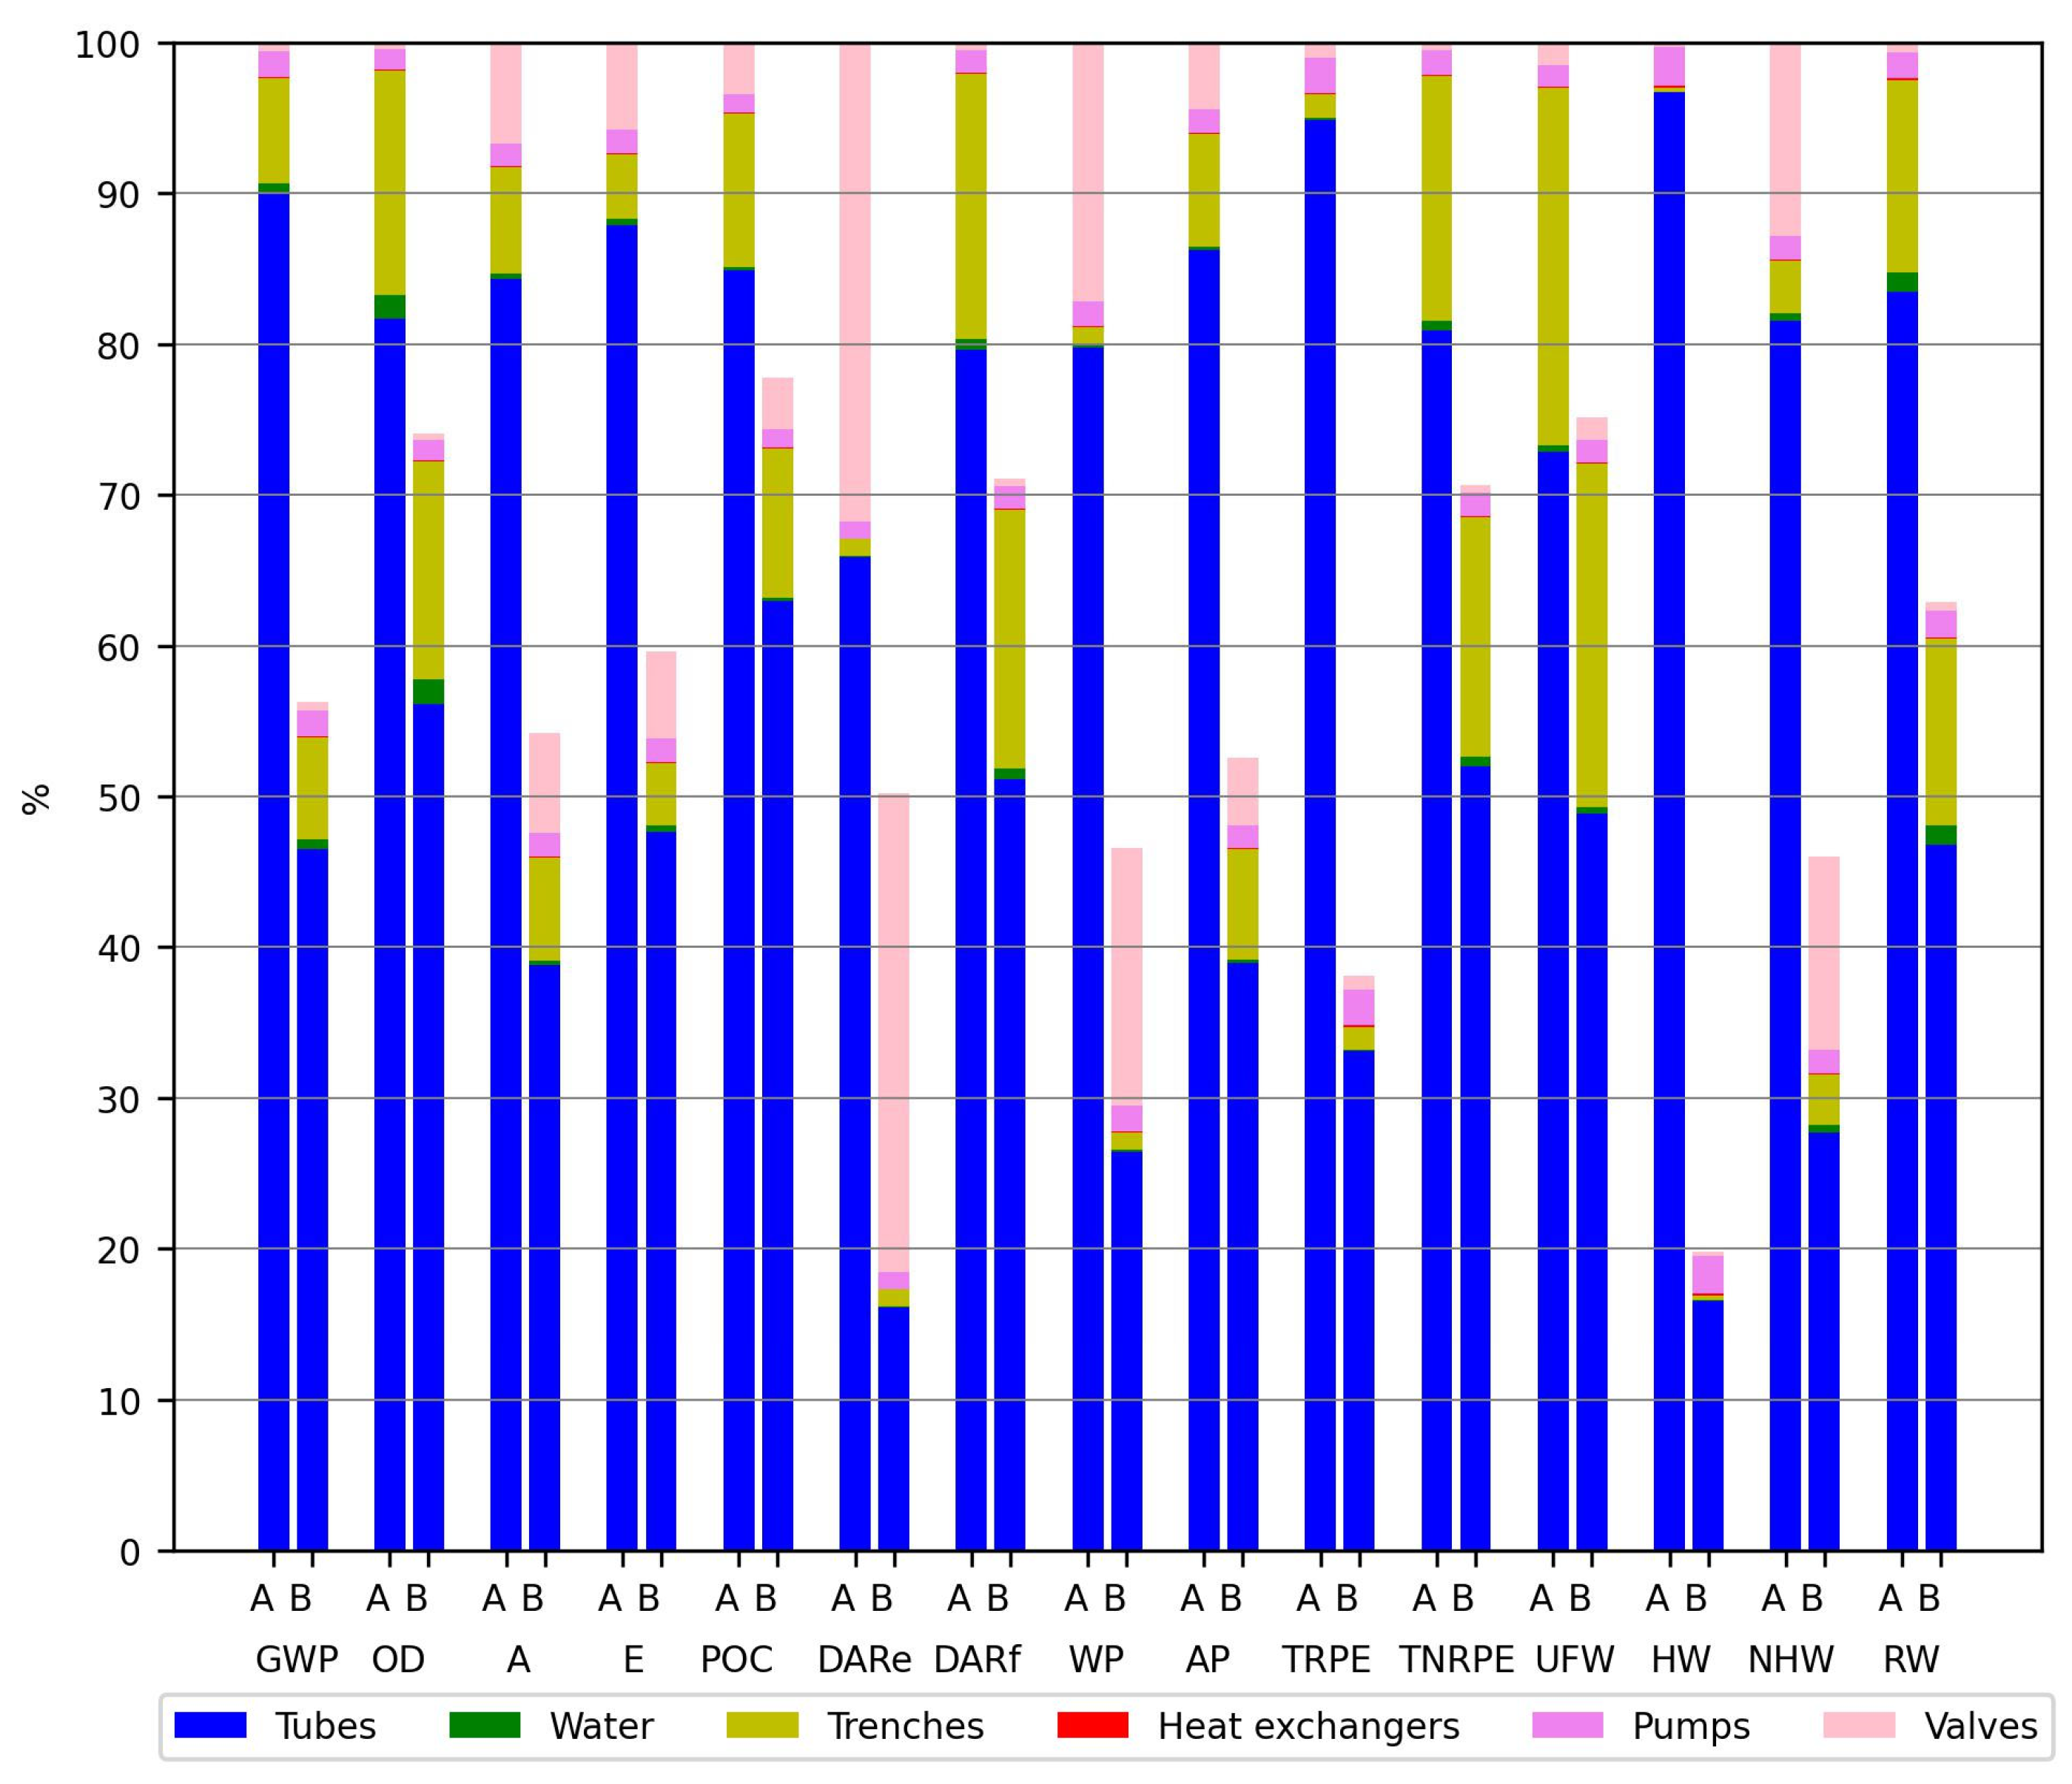
- the most important life cycle phases are Modules A1–3 (production stage) and Module B4 (replacement) for both infrastructure typologies (rigid and flexible);
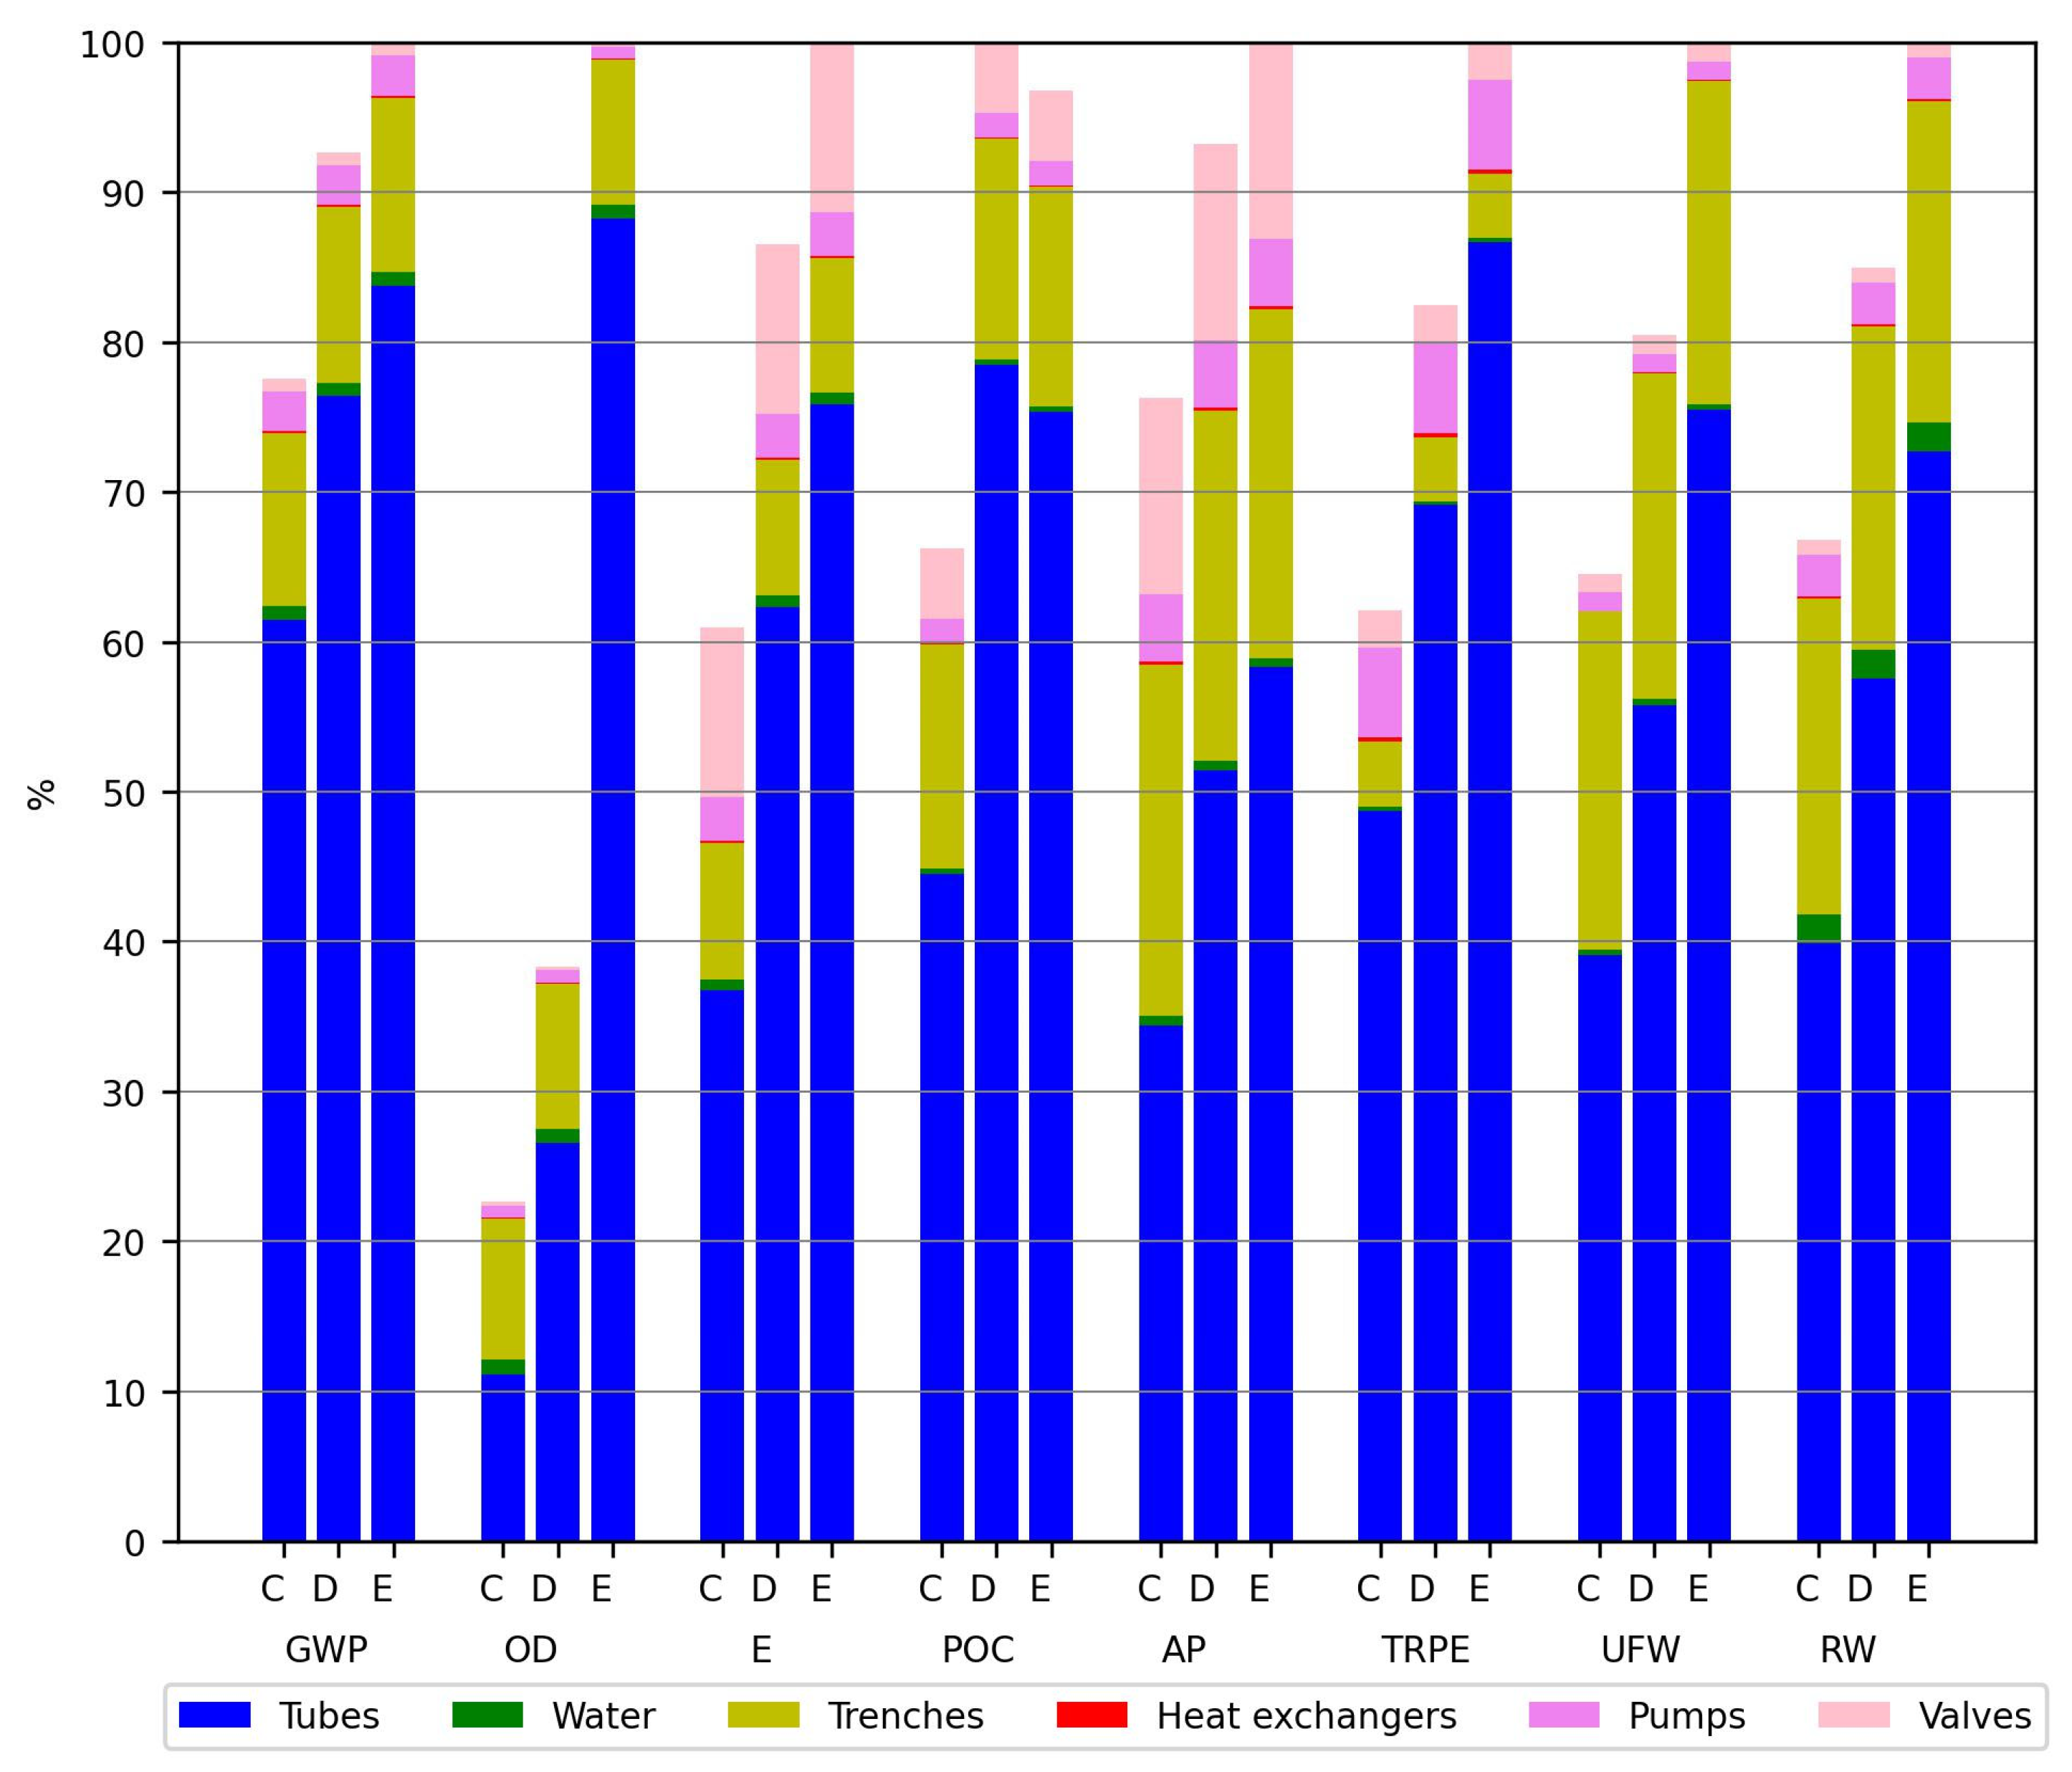
- the pipes are the main contributor, followed by the trench works or valves. Water and pumps are relatively less significant. The heat exchanger is an irrelevant contributor in comparison.
Supplementary Materials
Author Contributions
Funding
Institutional Review Board Statement
Informed Consent Statement
Data Availability Statement
Acknowledgments
Conflicts of Interest
Abbreviations
| Nomenclature | |
| th | Thermal |
| elec | Electric |
| g | Gas |
| Subscripts | |
| A | Acidification for Soil and Water |
| AP | Air Pollution |
| CRU | Components for Re-Use |
| DARe | Depletion of Abiotic Resources—Elements |
| DARf | Depletion of Abiotic Resources—Fossils |
| DHN | District Heating Network |
| DHCNs | District Heating and Cooling Networks |
| DHW | Domestic Hot Water |
| E | Eutrophication |
| EC | European Commission |
| EEelec | Exported Energy—Electricity |
| EEth | Exported Energy—Thermal |
| EEg | Exported Energy—Gas |
| ESL | Estimated Service Life |
| EPD | Environmental Product Declaration |
| GHG | Greenhouse Gas |
| GWP | Global Warming Potential |
| HDD | Heating Degree Days |
| HHV | High Heating Value |
| HW | Hazardous Waste Disposed |
| LCA | Life Cycle Assessment |
| LCI | Life Cycle Inventory |
| MER | Materialsfor Energy Recovery |
| MR | Materials for Recycling |
| ND | Nominal Diameter |
| NHW | Non-Hazardous Waste Disposed |
| NR | Number of Replacements |
| NRPE | Non-Renewable Primary Energy excl. Raw Materials |
| NRPERM | Non-Renewable Primary Energy Used as Raw Materials |
| OD | Ozone Depletion |
| OAT-SA | One-at-a-Time Sensitivity Analysis |
| PCM | Phase Change Material |
| PE | PolyEthylene |
| PEHD | PolyEthylene High Density |
| POC | Photochemical Ozone Creation |
| PP | PolyPropylene |
| PU | Polyurethane |
| PVC | PolyVinyl Chloride |
| RE | Réglementation Environnementale |
| RPE | Renewable Primary Energy excl. Raw Materials |
| RPERM | Renewable Primary Energy used as Raw Materials |
| RW | Radioactive Waste disposed |
| ReqSL | Required Service Life |
| RSP | Reference Study Period |
| SH | Space Heating |
| TNRPE | Total Non-Renewable Primary Energy |
| TRPE | Total Renewable Primary Energy |
| UFW | Net Use of Fresh Water |
| UNRSF | Use of Non Renewable Secondary Fuels |
| URSF | Use of Renewable Secondary Fuels |
| USM | Use of Secondary Material |
| WP | Water Pollution |
Appendix A

| Impact Category | Product | Unit | TOTAL | A1–3 | A4–5 | B4 | C | D |
|---|---|---|---|---|---|---|---|---|
| GWP | A | kg CO2 eq | 1.94 × 10⁵ | 53.4% | 2.5% | 44.2% | 0.01% | −0.1% |
| B | 1.09 × 10⁵ | 51.7% | 3.7% | 44.9% | 0.02% | −0.2% | ||
| OD | A | kg CFC-11 eq | 1.31 × 10⁻² | 51.4% | 6.6% | 42.0% | 0.01% | −0.1% |
| B | 9.73 × 10⁻³ | 51.6% | 7.5% | 41.0% | 0.02% | −0.1% | ||
| A | A | kg SO2 eq | 9.99 × 10² | 47.5% | 6.0% | 46.6% | 0.01% | −0.1% |
| B | 5.42 × 10² | 46.5% | 7.6% | 46.2% | 0.03% | −0.2% | ||
| E | A | kg PO4− eq | 3.46 × 10² | 51.4% | 2.2% | 46.4% | 0.12% | −0.1% |
| B | 2.06 × 10² | 48.9% | 2.6% | 48.4% | 0.21% | −0.2% | ||
| POC | A | kg C2H4 eq | 8.09 × 101 | 48.5% | 7.7% | 43.9% | 0.01% | −0.1% |
| B | 6.29 × 101 | 46.6% | 8.4% | 45.2% | 0.01% | −0.1% | ||
| DARe | A | kg Sb eq | 7.30 × 100 | 43.6% | 0.4% | 56.1% | 0.00% | −0.1% |
| B | 3.67 × 100 | 35.5% | 0.8% | 63.9% | 0.01% | −0.2% | ||
| DARf | A | MJ, HHV | 2.40 × 10⁶ | 57.5% | 3.0% | 39.6% | 0.01% | −0.1% |
| B | 1.71 × 10⁶ | 59.3% | 3.5% | 37.4% | 0.01% | −0.2% | ||
| WP | A | m3 | 1.12 × 10⁶ | 48.2% | 0.2% | 51.8% | 0.02% | −0.2% |
| B | 5.23 × 10⁵ | 42.7% | 0.4% | 57.2% | 0.04% | −0.3% | ||
| AP | A | m3 | 4.90 × 10⁷ | 49.6% | 5.1% | 45.4% | 0.01% | −0.1% |
| B | 2.58 × 10⁷ | 45.5% | 9.1% | 45.7% | 0.01% | −0.3% | ||
| RPE | A | MJ, HHV | 3.64 × 10⁵ | 51.8% | 0.2% | 48.2% | 0.01% | −0.2% |
| B | 1.39 × 10⁵ | 52.2% | 0.4% | 47.8% | 0.02% | −0.5% | ||
| TRPE | A | MJ, HHV | 3.64 × 10⁵ | 51.8% | 0.2% | 48.2% | 0.01% | −0.2% |
| B | 1.39 × 10⁵ | 52.2% | 0.5% | 47.8% | 0.02% | −0.5% | ||
| NRPE | A | MJ, HHV | 2.52 × 10⁶ | 53.3% | 2.9% | 43.9% | 0.01% | −0.1% |
| B | 1.72 × 10⁶ | 53.6% | 3.6% | 43.0% | 0.01% | −0.2% | ||
| TNRPE | A | MJ, HHV | 2.74 × 10⁶ | 57.0% | 2.7% | 40.4% | 0.01% | −0.1% |
| B | 1.93 × 10⁶ | 58.7% | 3.2% | 38.3% | 0.01% | −0.2% | ||
| UFW | A | m3 | 2.08 × 10³ | 64.2% | 0.4% | 37.1% | −1.48% | −0.1% |
| B | 1.56 × 10³ | 67.0% | 0.4% | 34.7% | −1.97% | −0.1% | ||
| HW | A | kg | 9.84 × 10⁴ | 52.2% | 0.1% | 48.0% | 0.00% | −0.3% |
| B | 1.95 × 10⁴ | 54.3% | 0.2% | 46.8% | 0.01% | −1.3% | ||
| NHW | A | kg | 2.01 × 10⁵ | 48.7% | 1.3% | 50.0% | 0.04% | −0.1% |
| B | 9.24 × 10⁴ | 44.9% | 2.7% | 52.6% | 0.10% | −0.3% | ||
| RW | A | kg | 9.40 × 100 | 51.0% | 5.3% | 43.8% | 0.01% | −0.1% |
| B | 5.92 × 100 | 51.7% | 7.0% | 41.4% | 0.02% | −0.1% |
| Impact Category | Product | Unit | TOTAL | A1–A3 | A4–5 | B4 | C1–4 | D |
|---|---|---|---|---|---|---|---|---|
| GWP | C | kg CO2 eq | 9.59 × 10⁴ | 43.6% | 3.8% | 52.9% | 0.02% | −0.3% |
| D | 1.15 × 10⁵ | 43.3% | 3.8% | 53.1% | 0.02% | −0.2% | ||
| E | 1.24 × 10⁵ | 43.8% | 3.7% | 52.7% | 0.02% | −0.2% | ||
| OD | C | kg CFC-11 eq | 4.86 × 10⁻³ | 52.6% | 13.6% | 34.0% | 0.04% | −0.2% |
| D | 8.22 × 10⁻³ | 50.3% | 9.6% | 40.2% | 0.02% | −0.1% | ||
| E | 2.14 × 10⁻² | 50.9% | 3.9% | 45.2% | 0.01% | −0.1% | ||
| E | C | kg PO4− eq | 1.08 × 10² | 45.6% | 5.0% | 49.5% | 0.38% | −0.4% |
| D | 1.54 × 10² | 44.0% | 3.9% | 52.1% | 0.27% | −0.3% | ||
| E | 1.78 × 10² | 44.4% | 3.7% | 51.8% | 0.23% | −0.2% | ||
| POC | C | kg C2H4 eq | 3.93 × 101 | 40.0% | 14.3% | 45.9% | 0.02% | −0.2% |
| D | 5.92 × 101 | 43.0% | 9.7% | 47.4% | 0.01% | −0.1% | ||
| E | 5.73 × 101 | 41.9% | 10.5% | 47.7% | 0.01% | −0.1% | ||
| AP | C | m3 | 1.27 × 10⁷ | 31.7% | 19.5% | 49.3% | 0.03% | −0.6% |
| D | 1.55 × 10⁷ | 34.7% | 16.3% | 49.4% | 0.02% | −0.5% | ||
| E | 1.66 × 10⁷ | 35.3% | 15.4% | 49.8% | 0.02% | −0.4% | ||
| RPE | C | MJ. HHV | 8.82 × 10⁴ | 50.8% | 0.6% | 49.4% | 0.02% | −0.8% |
| D | 1.17 × 10⁵ | 50.4% | 0.6% | 49.6% | 0.02% | −0.6% | ||
| E | 1.42 × 10⁵ | 50.2% | 0.5% | 49.8% | 0.01% | −0.5% | ||
| TRPE | C | MJ. HHV | 8.83 × 10⁴ | 50.7% | 0.7% | 49.4% | 0.02% | −0.8% |
| D | 1.17 × 10⁵ | 50.3% | 0.6% | 49.6% | 0.02% | −0.6% | ||
| E | 1.42 × 10⁵ | 50.2% | 0.5% | 49.8% | 0.01% | −0.5% | ||
| UFW | C | m3 | 1.59 × 10³ | 68.6% | 0.3% | 33.1% | −1.86% | −0.1% |
| D | 1.98 × 10³ | 64.2% | 0.4% | 37.1% | −1.49% | −0.1% | ||
| E | 2.46 × 10³ | 56.4% | 0.3% | 44.6% | −1.20% | −0.1% | ||
| RW | C | kg | 3.96 × 100 | 54.8% | 9.5% | 35.9% | 0.03% | −0.2% |
| D | 5.04 × 100 | 52.5% | 8.9% | 38.8% | 0.02% | −0.2% | ||
| E | 5.93 × 100 | 51.6% | 7.9% | 40.6% | 0.02% | −0.1% |
Appendix B
| `Impact Category | Unit | Total | Excavation | Filler Material | Pavement Replacement |
|---|---|---|---|---|---|
| GWP | kg CO2 eq | 1.35 × 10⁴ | 2% | 44% | 54% |
| OD | kg CFC-11 eq | 1.95 × 10⁻³ | 3% | 38% | 59% |
| A | kg SO2 eq | 7.06 × 101 | 3% | 48% | 49% |
| E | kg PO4− eq | 1.49 × 101 | 4% | 63% | 33% |
| POC | kg C2H4 eq | 8.22 × 100 | 2% | 32% | 66% |
| DARe | kg Sb eq | 8.23 × 10⁻² | 0% | 61% | 39% |
| DARf | MJ. HHV | 4.23 × 10⁵ | 1% | 19% | 80% |
| WP | m3 | 1.35 × 10⁴ | 1% | 78% | 21% |
| AP | m3 | 3.67 × 10⁶ | 1% | 24% | 75% |
| RPE | MJ. HHV | 5.60 × 10³ | 0% | 71% | 29% |
| RPERM | MJ. HHV | 5.71 × 101 | 0% | 0% | 100% |
| TRPE | MJ. HHV | 5.66 × 10³ | 0% | 70% | 29% |
| NRPE | MJ. HHV | 2.28 × 10⁵ | 2% | 38% | 60% |
| NRPERM | MJ. HHV | 2.17 × 10⁵ | 0% | 0% | 100% |
| TNRPE | MJ. HHV | 4.44 × 10⁵ | 1% | 19% | 80% |
| USM | kg | 1.19 × 10⁴ | 0% | 0% | 100% |
| URSF | MJ. HHV | 0.00 × 100 | 0% | 0% | 0% |
| UNRSF | MJ. HHV | 0.00 × 100 | 0% | 0% | 0% |
| UFW | m3 | 4.92 × 10² | 0% | 94% | 6% |
| HW | kg | 2.98 × 10² | 1% | 67% | 31% |
| NHW | kg | 6.95 × 10³ | 0% | 61% | 40% |
| RW | kg | 1.20 × 100 | 2% | 41% | 56% |
| CRU | kg | 0.00 × 100 | 0% | 0% | 0% |
| MR | kg | 4.00 × 101 | 0% | 0% | 100% |
| MER | kg | 0.00 × 100 | 0% | 0% | 0% |
| EEelec | MJ | 0.00 × 100 | 0% | 0% | 0% |
| EEth | MJ | 0.00 × 100 | 0% | 0% | 0% |
| EEg | MJ | 0.00 × 100 | 0% | 0% | 0% |
Appendix C
| Material | EoL Scenario | Values (%) | Recycling and Specific Energy from Incineration | Substitution Ratio | Avoided Burdens |
|---|---|---|---|---|---|
| Steel | Recycling | 90.0% | 81.45% for steel | 1:1 steel | Primary production of low-alloyed steel. |
| Incineration | 0.0% | ||||
| Landfill | 10.0% | ||||
| Stainless steel | Recycling | 90.0% | 81.45% for steel | 1:1 steel | Primary production of chromium steel. |
| Incineration | 0.0% | ||||
| Landfill | 10.0% | ||||
| Brass | Recycling | 0.0% | - | 1:1 brass | - |
| Incineration | 0.0% | ||||
| Landfill | 100.0% | ||||
| Cast iron | Recycling | 90.0% | 81.45% for iron | 1:1 iron | Primary production of cast iron. |
| Incineration | 0.0% | ||||
| Landfill | 10.0% | ||||
| PVC | Recycling | 32.0% | 55.71% for PVC 2.28 for electricity [kWh/kg] 4.66 for heat [kWh/kg] | 1:1 polymer | Primary production of PVC granules. Electricity from the national grid and heat production from a natural gas boiler. |
| Incineration | 43.0% | ||||
| Landfill | 25.0% | ||||
| PP | Recycling | 27.0% | 55.71% for PP 3.47 for electricity [kWh/kg] 5.55 for heat [kWh/kg] | 1:1 polymer | Primary production of PP granules. Electricity from the national grid and heat production from a natural gas boiler. |
| Incineration | 43.0% | ||||
| Landfill | 30.0% | ||||
| PEHD | Recycling | 22.5% | 55.71% for PEHD 3.47 for electricity [kWh/kg] 5.55 for heat [kWh/kg] | 1:1 polymer | Primary production of PEHD granules. Electricity from the national grid and heat production from a natural gas boiler. |
| Incineration | 43.0% | ||||
| Landfill | 34.5% | ||||
| PE foam | Recycling | 0.0% | 55.71% for PE foam 3.47 for electricity [kWh/kg] 5.55 for heat [kWh/kg] | 1:1 polymer foam | Primary production of PELD granules. Electricity from the national grid and heat production from a natural gas boiler. |
| Incineration | 43.0% | ||||
| Landfill | 57.0% | ||||
| PU foam | Recycling | 0.0% | 55.71% for PU foam 7.69 for electricity [kWh/kg] 3.95 for heat [kWh/kg] | 1:1 polymer foam | Primary production of PU rigid foam. Electricity from the national grid and heat production from a natural gas boiler. |
| Incineration | 64.0% | ||||
| Landfill | 36.0% | ||||
| Rock wool | Recycling | 25.0% | 25.00% for rock wool 2.85 for electricity [kWh/kg] 1.39 for heat [kWh/kg] | 1:1 mineral foam | Primary production of stone wool. Electricity from the national grid and heat production from a natural gas boiler. |
| Incineration | 0.0% | ||||
| Landfill | 36.0% | ||||
| Glass wool | Recycling | 0.0% | 2.85 for electricity [kWh/kg] 1.39 for heat [kWh/kg] | 1:1 mineral foam | Electricity from the national grid and heat production from a natural gas boiler. |
| Incineration | 64.0% | ||||
| Landfill | 36.0% | ||||
| Foam glass | Recycling | 0.0% | 2.85 for electricity [kWh/kg] 1.39 for heat [kWh/kg] | 1:1 mineral foam | Electricity from the national grid and heat production from a natural gas boiler. |
| Incineration | 64.0% | ||||
| Landfill | 36.0% | ||||
| Packaging cardboard | Recycling | 0.0% | 86.11%% for cardboard 7.69 for electricity [kWh/kg] 3.95 for heat [kWh/kg] | 1:1 cardboard | Primary production of corrugated board. Electricity from the national grid and heat production from a natural gas boiler. |
| Incineration | 64.0% | ||||
| Landfill | 36.0% |
References
- United Nations Habitat III New Urban Agenda; United Nations: New York, NY, USA, 2017. Available online: https://unhabitat.org/about-us/new-urban-agenda (accessed on 18 April 2023).
- European Parliament and the Council Revised Renewable Energy Directive 2018/2001/EU. Available online: https://eur-lex.europa.eu/legal-content/EN/TXT/?uri=uriserv:OJ.L_.2018.328.01.0082.01.ENG (accessed on 18 April 2023).
- Buffa, S.; Cozzini, M.; D’Antoni, M.; Baratieri, M.; Fedrizzi, R. 5th Generation District Heating and Cooling Systems: A Review of Existing Cases in Europe. Renew. Sustain. Energy Rev. 2019, 104, 504–522. [Google Scholar] [CrossRef]
- Famiglietti, J.; Gerevini, L.; Spirito, G.; Pozzi, M.; Dénarié, A.; Scoccia, R.; Motta, M. Environmental Life Cycle Assessment Scenarios for a District Heating Network. An Italian Case Study. Energy Rep. 2021, 7, 368–379. [Google Scholar] [CrossRef]
- Ciacci, L.; Passarini, F. Life Cycle Assessment (LCA) of Environmental and Energy Systems. Energies 2020, 13, 5892. [Google Scholar] [CrossRef]
- Ministère de la Transition Ecologique de France Journal Officiel de La République Française—N° 189 Du 15 Août 2021; Ministère de la Transition Ecologique de France: Paris, France, 2021.
- UN Environment Programme Global Status Report for Buildings and Construction; United Nations: New York, NY, USA, 2021.
- Bartolozzi, I.; Rizzi, F.; Frey, M. Are District Heating Systems and Renewable Energy Sources Always an Environmental Win-Win Solution? A Life Cycle Assessment Case Study in Tuscany, Italy. Renew. Sustain. Energy Rev. 2017, 80, 408–420. [Google Scholar] [CrossRef]
- Jeandaux, C.; Videau, J.-B.; Prieur-Vernat, A. Life Cycle Assessment of District Heating Systems in Europe: Case Study and Recommendations. Sustainability 2021, 13, 11256. [Google Scholar] [CrossRef]
- Kar, S.; Billen, P.; Björnebo, L.; Katz, B.; Yang, S.; Volk, T.A.; Spatari, S. Effects of Greenhouse Gas Emissions Timing on Alternative Biomass and Fossil Energy Sources for District Heating. GCB Bioenergy 2021, 13, 1785–1799. [Google Scholar] [CrossRef]
- Mahon, C.; Mediboyina, M.K.; Gartland, D.; Murphy, F. Life Cycle Assessment of Irish District Heating Systems: A Comparison of Waste Heat Pump, Biomass-Based and Conventional Gas Boiler. Clean Technol. Env. Policy 2022, 24, 1437–1451. [Google Scholar] [CrossRef]
- Guillén-Lambea, S.; Carvalho, M.; Delgado, M.; Lazaro, A. Sustainable Enhancement of District Heating and Cooling Configurations by Combining Thermal Energy Storage and Life Cycle Assessment. Clean Technol. Env. Policy 2021, 23, 857–867. [Google Scholar] [CrossRef]
- Feofilovs, M.; Pakere, I.; Romagnoli, F. Life Cycle Assessment of Different Low-Temperature District Heating Development Scenarios: A Case Study of Municipality in Latvia. Environ. Clim. Technol. 2019, 23, 272–290. [Google Scholar] [CrossRef]
- Rehman, H.u.; Hirvonen, J.; Sirén, K. Performance Comparison between Optimized Design of a Centralized and Semi-Decentralized Community Size Solar District Heating System. Appl. Energy 2018, 229, 1072–1094. [Google Scholar] [CrossRef]
- Abokersh, M.H.; Vallès, M.; Cabeza, L.F.; Boer, D. A Framework for the Optimal Integration of Solar Assisted District Heating in Different Urban Sized Communities: A Robust Machine Learning Approach Incorporating Global Sensitivity Analysis. Appl. Energy 2020, 267, 114903. [Google Scholar] [CrossRef]
- Neirotti, F.; Noussan, M.; Simonetti, M. Evaluating the Emissions of the Heat Supplied by District Heating Networks through A Life Cycle Perspective. Clean Technol. 2020, 2, 392–405. [Google Scholar] [CrossRef]
- Turski, M.; Jachura, A. Life Cycle Assessment of Dispersed Phase Change Material Heat Accumulators for Cooperation with Buildings in the District Heating System. Energies 2022, 15, 5771. [Google Scholar] [CrossRef]
- Turski, M.; Nogaj, K.; Sekret, R. The Use of a PCM Heat Accumulator to Improve the Efficiency of the District Heating Substation. Energy 2019, 187, 115885. [Google Scholar] [CrossRef]
- Diaz, F.; Pakere, I.; Romagnoli, F. Life Cycle Assessment of Low Temperature District Heating System in Gulbene Region. Environ. Clim. Technol. 2020, 24, 285–299. [Google Scholar] [CrossRef]
- Turski, M.; Sekret, R. Buildings and a District Heating Network as Thermal Energy Storages in the District Heating System. Energy Build. 2018, 179, 49–56. [Google Scholar] [CrossRef]
- Oliver-Solà, J.; Gabarrell, X.; Rieradevall, J. Environmental Impacts of the Infrastructure for District Heating in Urban Neighbourhoods. Energy Policy 2009, 37, 4711–4719. [Google Scholar] [CrossRef]
- Fröling, M.; Holmgren, C.; Svanström, M. Life Cycle Assessment of the District Heat Distribution System. Part 1: Pipe Production. Int. J. Life Cycle Assess. 2004, 9, 130–136. [Google Scholar] [CrossRef]
- Fröling, M.; Svanström, M. Life Cycle Assessment of the District Heat Distribution System. Part 2: Network Construction. Int. J. Life Cycle Assess. 2005, 11, 425–435. [Google Scholar] [CrossRef]
- Efficacity UrbanPrint. Available online: https://efficacity.com/quartiers-bas-carbone/nos-logiciels/urbanprint/ (accessed on 31 March 2023).
- CEN EN 15804:2012+A2:2019; Sustainability of Construction Works—Environmental Product Declarations—Core Rules for the Product Category of Con-struction Products. CEN/CENELEC: Brussels, Belgium, 2012; ISBN 9780539190427.
- CEN EN 15804:2012+A1:2013; Sustainability of Construction Works—Environmental Product Declarations—Core Rules for the Product Category of Construction Products. CEN/CENELEC: Brussels, Belgium, 2013; ISBN 9780580822322.
- CEN EN 14040:2006+A1:2020; Environmental Management—Life Cycle Assessment—Principles and Framework. CEN/CENELEC: Brussels, Belgium, 2020.
- CEN EN 14044:2006+A2:2020; Environmental Management—Life Cycle Assessment—Requirements and Guidelines. CEN/CENELEC: Brussels, Belgium, 2020; ISBN 9780539013498.
- CEN EN 15978:2011; Sustainability of Construction Works—Assessment of Environmental Performance of Buildings—Calculation Method. CEN/CENELEC: Brussels, Belgium, 2011; ISBN 9780580774034.
- Wernet, G.; Bauer, C.; Steubing, B.; Reinhard, J.; Moreno-Ruiz, E.; Weidema, B. The Ecoinvent Database Version 3 (Part I): Overview and Methodology. Int. J. Life Cycle Assess. 2016, 21, 1218–1230. [Google Scholar] [CrossRef]
- Wilo Réseaux de Chaleur et de Froid Urbains; Wilo SE: Dortmund, Germany, 2022.
- ADEME; SOLINNEN; ENGIE LAB CRIGEN. Tractebel Analyse Du Cycle de Vie de Systèmes Renouvelables de Production de Chaleur et de Froid de Grande Puissance; ADEME: Angers, France, 2020. [Google Scholar]
- ADEME; CSTB; Efficacity. Elioth Méthode Quartier Energie Carbone; ADEME: Angers, France, 2022. [Google Scholar]
- CEN EN 253:2019; District Heating Pipes—Bonded Single Pipe Systems for Directly Buried Hot Water Networks—Factory Made Pipe Assembly of Steel Service Pipe, Polyurethane Thermal Insulation and a Casing of Polyethylene. CEN/CENELEC: Brussels, Belgium, 2019; ISBN 9780580996979.
- Hauschild, M.Z.; Rosenbaum, R.K.; Olsen, S.I. Life Cycle Assessment. Theory and Practice; Springer: New York, NY, USA, 2018. [Google Scholar]
- Klöpffer, W. Birgit Grahl Life Cycle Assessment (LCA): A Guide to Best Practice. Int. J. Life Cycle Assess. 2016, 21, 1063–1066. [Google Scholar] [CrossRef]
- Norme Française XP P01-064/CN; Contribution Des Ouvrages de Construction Au Développement Durable—Déclarations Environnementales Sur Les Produits—Règles Régissant Les Catégories de Produits de Construction—Complément National à La NF EN 15804+A1. Afnor Editions: La Plaine Saint-Denis, France, 2014.
- Euroméditerranée Les Fabriques. Available online: https://www.lesfabriques.fr/ (accessed on 13 March 2023).
- Dalkia Smart Building. Les Fabriques Communiqué de Presse—XXL Marseille Choisit Massielo Pour Les Fabriques; Dalkia: Paris, France, 2020. [Google Scholar]
- Alfa Laval Shop Alfa Laval. Available online: https://shop.alfalaval.com (accessed on 25 February 2023).
- Caleffi Régulateur de Pression Différentielle. Vanne d’arrêt et de Préréglage. Available online: https://www.caleffi.com/france/fr/catalog#heating/ (accessed on 18 April 2023).
- Danfoss Vanne d’équilibrage Automatique Régulateur de Différence de Pression Avec Limiteur de Débit Intégré AB-PM DN 40-100 Fiche Technique. Available online: Ficheh-ttps://www.danfoss.com/fr-fr/products/dhs/valves/hydronic-balancing-and-control/automatic-balancing-valves/ab-pm-automatic-balancing-valves/ (accessed on 18 April 2023).
- Achour, B.; Amara, L. New Formulation of the Darcy-Weisbach Friction Factor. LARHYSS J. 2020, 43, 90–100. [Google Scholar]
- Grundfos Product Grundfos. Available online: https://product-selection.grundfos.com (accessed on 25 February 2023).
- REHAU Pour Une Distribution Optimisée et Maîtrisée de l’énergie; REHAU: Muri bei Bern, Switzerland, 2018.
- A2A SpA. Available online: https://www.a2acaloreservizi.eu/ (accessed on 17 April 2023).
- Wannitube. Available online: http://wannitube.fr/ (accessed on 18 April 2023).
- Inpal. Available online: http://www.inpal.com/fr/ (accessed on 18 April 2023).
- Uponor. Available online: https://www.uponor.com/fr-fr (accessed on 18 April 2023).
- REHAU. Available online: https://www.rehau.com/fr-fr (accessed on 18 April 2023).
- ELPLAST+. Available online: https://elplastplus.pl/en/main-page/ (accessed on 18 April 2023).
- Interplast. Available online: https://www.interplast.gr/en (accessed on 18 April 2023).
- Saltelli, A.; Annoni, P. How to Avoid a Perfunctory Sensitivity Analysis. Environ. Model. Softw. 2010, 25, 1508–1517. [Google Scholar] [CrossRef]
- Famiglietti, J.; Aprile, M.; Spirito, G.; Motta, M. Net-Zero Climate Emissions Districts: Potentials and Constraints for Social Housing in Milan. Energies 2023, 16, 1504. [Google Scholar] [CrossRef]
- European Commission European Platform on LCA. Available online: https://eplca.jrc.ec.europa.eu/ (accessed on 30 March 2023).


| Component | ESL [Years] | NR | Source |
|---|---|---|---|
| Pipes | 30 | 1 | CEN 2019 [34] |
| Water | 30 | 1 | CEN 2019 [34] |
| Trench | 50 | 0 | ADEME et al., 2020 [32] |
| Pumps | 10 | 4 | ADEME et al., 2020 [32] |
| Valves | 15 | 4 | Bartolozzi et al., 2017 [8] |
| Types of Parameters | Impact Category | Acronyms | Unit | Source |
|---|---|---|---|---|
| Parameters describing environmental impacts | Global warming potential | GWP | kg CO2 eq | EN 15804+A1 |
| Ozone depletion | OD | kg CFC-11 eq | ||
| Acidification for soil and water | A | kg SO2 eq | ||
| Eutrophication | E | kg PO4− eq | ||
| Photochemical ozone creation | POC | kg C2H4 eq | ||
| Depletion of abiotic resources -elements | DARe | kg Sb eq | ||
| Depletion of abiotic resources -fossil | DARf | MJ, High Heating Value (HHV) | ||
| Additional national parameters | Water pollution | WP | m3 | XP P01-064/CN |
| Air pollution | AP | m3 | ||
| Parameters describing resource use | Renewable primary energy excl. raw materials (RM) | RPE | MJ, HHV | EN 15804+A1 |
| Renewable primary energy used as RM | RPERM | MJ, HHV | ||
| Total renewable primary energy | TRPE | MJ, HHV | ||
| Non-renewable primary energy excl. RM | NRPE | MJ, HHV | ||
| Non-renewable primary energy used as RM | NRPERM | MJ, HHV | ||
| Total non-renewable primary energy | TNRPE | MJ, HHV | ||
| Use of secondary material | USM | kg | ||
| Use of renewable secondary fuels | URSF | MJ, HHV | ||
| Use of non-renewable secondary fuels | UNRSF | MJ, HHV | ||
| Net use of fresh water | UFW | m3 | ||
| Environmental information describing waste categories | Hazardous waste disposed | HW | kg | EN 15804+A1 |
| Non-hazardous waste disposed | NHW | kg | ||
| Radioactive waste disposed | RW | kg | ||
| Environmental information describing output flows | Components for re-use | CRU | kg | EN 15804+A1 |
| Materials for recycling | MR | kg | ||
| Materials for energy recovery | MER | kg | ||
| Exported energy—electricity | EEelec | MJ | ||
| Exported energy—thermal | EEth | MJ | ||
| Exported energy—gas | EEg | MJ |
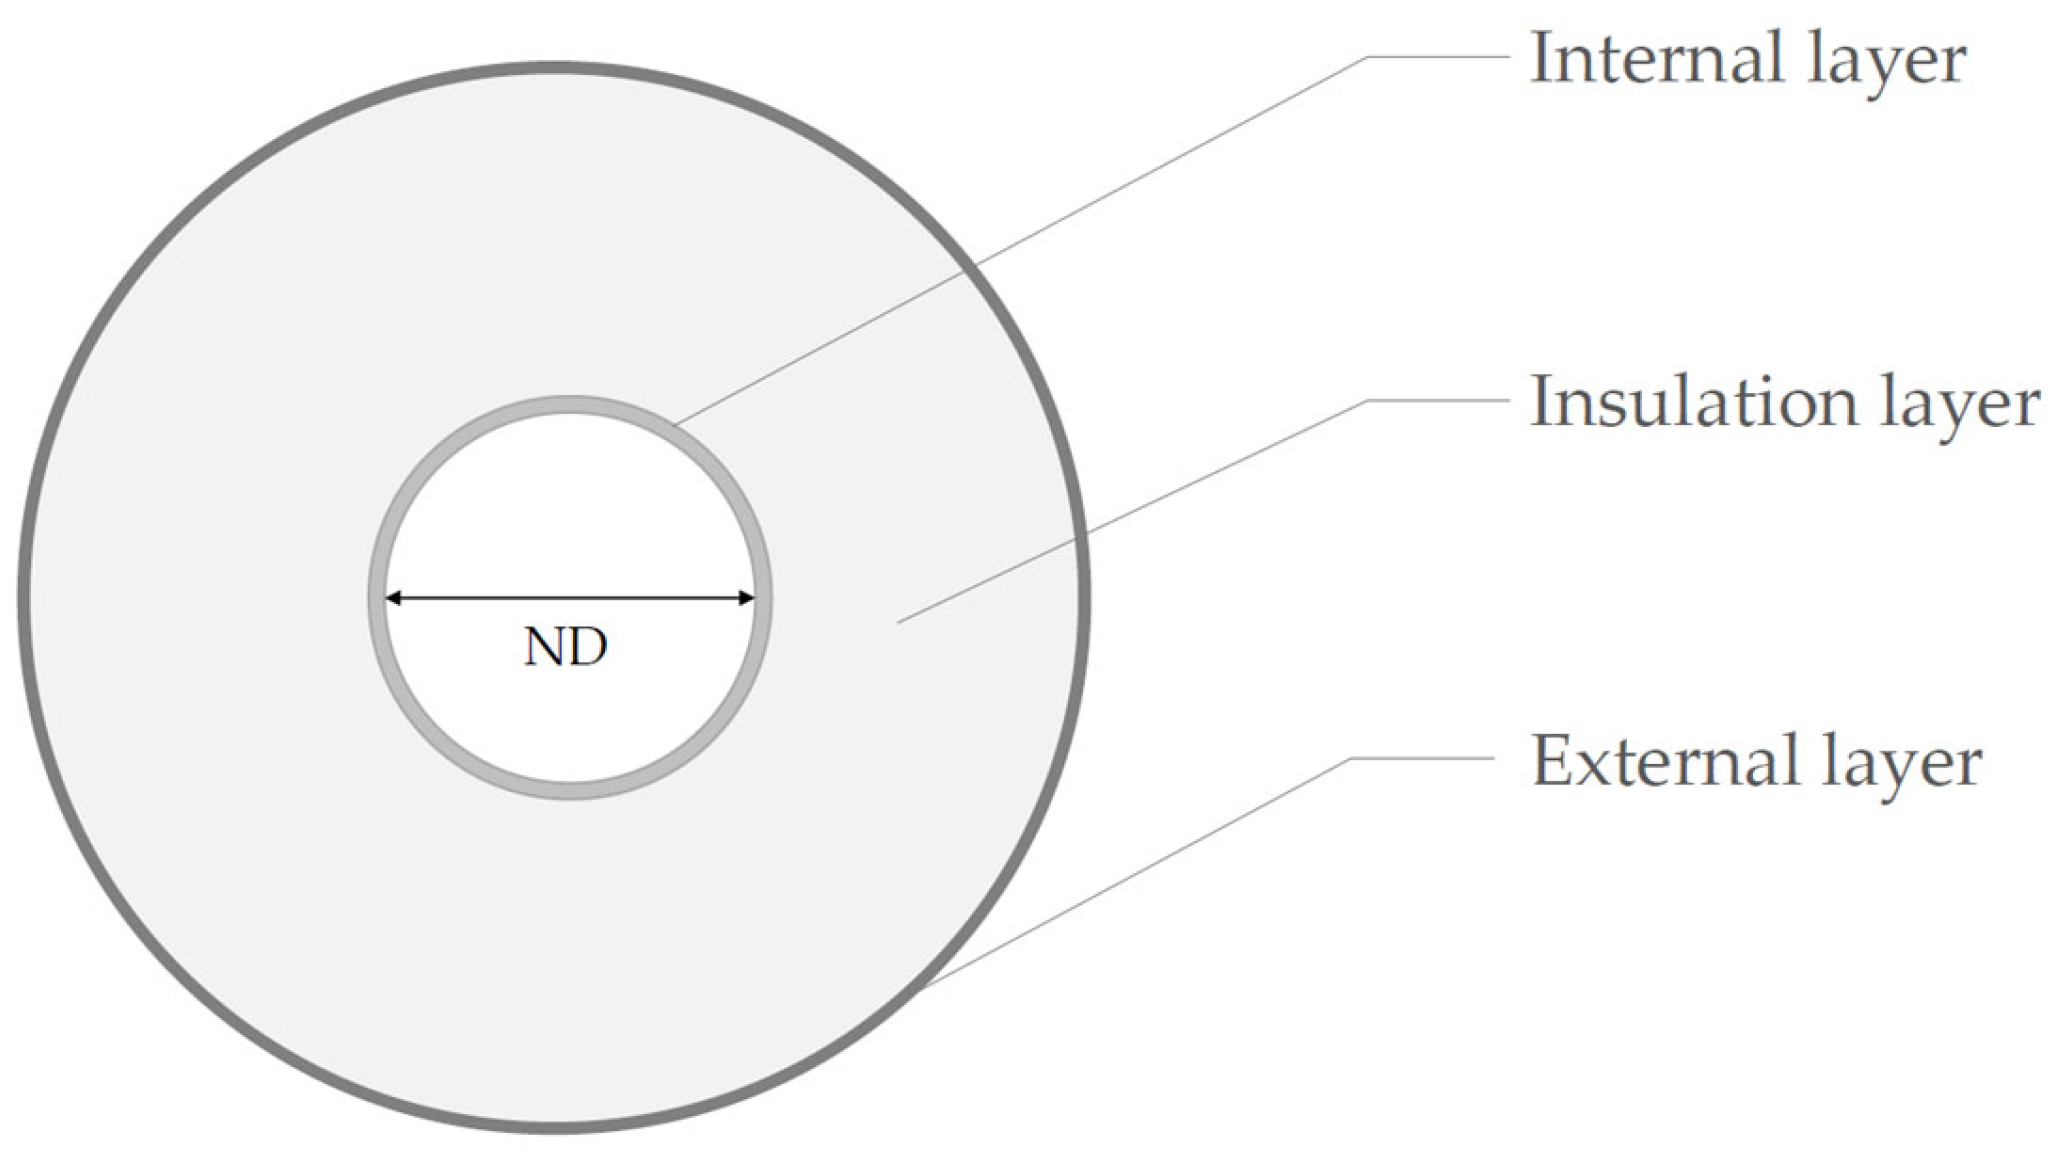
| Characteristics | Steel (Rigid Systems) | Polymer (Flexible Systems) | |||
|---|---|---|---|---|---|
| Product A | Product B | Product C | Product D | Product E | |
| Internal radius [m] | 0.225 | 0.225 | 0.2204 | 0.2203 | 0.220 |
| Heat carrier layer | Black steel | Black steel | Polyethylene (PE) | PE | PP |
| Thickness [mm] | 5 | 4 | 29.6 | 29.7 | 30 |
| Insulation | Rock wool | PU foam | PE foam | PU foam | PU foam |
| Thickness [mm] | 70 | 82 | 110.5 | 97.1 | 93 |
| Air layer | Yes | No | No | No | No |
| Thickness [mm] | 25 | 0 | 0 | 0 | 0 |
| External layer | Stainless steel | PEHD | PEHD | PEHD | PVC |
| Thickness [mm] | 2 | 4 | 8 | 7.9 | 9.5 |
| External radius [m] | 0.352 | 0.340 | 0.3685 | 0.355 | 0.3525 |
| Utotal [W/(m2K)] | 0.331 | 0.331 | 0.267 | 0.267 | 0.267 |
| Component | Element | Material | Amount | Unit |
| Product A Distribution pipe | Internal layer | Steel, low alloyed, hot rolled sheet | 1.10 × 10⁴ | kg |
| Isolation | Rock wool | 1.74 × 10³ | kg | |
| External layer | Chromium steel | 6.43 × 10³ | kg | |
| Product B Distribution pipe | Internal layer | Steel, low alloyed, hot rolled sheet | 8.83 × 10³ | kg |
| Isolation | PU, rigid foam | 1.54 × 10³ | kg | |
| External layer | PEHD, granulate | 1.51 × 10³ | kg | |
| Heat carrier fluid | Water supply and return (leakages included equal to 8%) | Tap water, underground | 3.43 × 10⁴ | kg |
| Trenches for product A | Destruction of existing pavement | - | 2.21 × 10² | m2 |
| Excavation and refilling | Excavation, skid-steer loader | 6.53 × 10² | m3 | |
| Refilling material | Gravel, crushed | 1.92 × 10⁵ | kg | |
| Sand | 3.66 × 10⁵ | kg | ||
| Installation of new road | Bitumen pavement production | 2.21 × 10² | m2 | |
| Trenches for product B | Destruction of existing pavement | - | 2.16 × 10² | m2 |
| Excavation and refilling | Excavation, skid-steer loader | 6.30 × 10² | m3 | |
| Refilling material | Gravel, crushed | 1.85 × 10⁵ | kg | |
| Sand | 3.53 × 10⁵ | kg | ||
| Installation of new road | Bitumen pavement production | 2.16 × 10² | m2 | |
| Substation | Water pumps | Chromium steel | 1.19 × 10² | kg |
| Valves | Brass | 4.71 × 101 | kg | |
| Gasketed plate heat exchanger | Chromium steel | 2.97 × 101 | kg |
| Component | Element | Material | Amount | Unit |
|---|---|---|---|---|
| Product C Distribution pipe | Internal layer | PEHD, granulate | 8.13 × 10³ | kg |
| Isolation | PE linear low density | 1.08 × 10³ | kg | |
| External layer | PEHD, granulate | 3.50 × 10³ | kg | |
| Heat carrier fluid supply and return (leakages included equal to 8%) | Tap water, underground | 3.30 × 10⁴ | kg | |
| Product D Distribution pipe | Internal layer | PEHD, granulate | 8.16 × 10³ | kg |
| Isolation | PU, rigid foam | 2.01 × 10³ | kg | |
| External layer | PEHD, granulate | 3.33 × 10³ | kg | |
| Heat carrier fluid supply and return (leakages included equal to 8%) | Tap water, underground | 3.29 × 10⁴ | kg | |
| Product E Distribution pipe | Internal layer | PP, granulate | 7.80 × 10³ | kg |
| Isolation | PU, rigid foam | 1.92 × 10³ | kg | |
| External layer | PVC, suspension polymerized | 6.18 × 10³ | kg | |
| Heat carrier fluid supply and return (leakages included equal to 8%) | Tap water, underground | 3.28 × 10⁴ | kg | |
| Trenches for product C | Destruction of existing pavement | - | 2.37 × 10² | m2 |
| Excavation and refilling | Excavation, skid-steer loader | 7.35 × 10² | m3 | |
| Refilling material | Gravel, crushed | 2.18 × 10⁵ | kg | |
| Sand | 4.15 × 10⁵ | kg | ||
| Installation of new road | Bitumen pavement production | 2.37 × 10² | m2 | |
| Trenches for product D | Destruction of existing pavement | - | 2.32 × 10² | m2 |
| Excavation and refilling | Excavation, skid-steer loader | 7.07 × 10² | m3 | |
| Refilling material | Gravel, crushed | 2.09 × 10⁵ | kg | |
| Sand | 3.98 × 10⁵ | kg | ||
| Installation of new road | Bitumen pavement production | 2.32 × 10² | m2 | |
| Trenches for product E | Destruction of existing pavement | - | 2.31 × 10² | m2 |
| Excavation and refilling | Excavation, skid-steer loader | 7.02 × 10² | m3 | |
| Refilling material | Gravel, crushed | 2.08 × 10⁵ | kg | |
| Sand | 3.95 × 10⁵ | kg | ||
| Installation of new road | Bitumen pavement production | 2.31 × 10² | m2 | |
| Substation | Water pumps | Chromium steel | 1.19 × 10² | kg |
| Valves | Brass | 4.71 × 101 | kg | |
| Gasketed plate heat exchanger | Chromium steel | 2.97 × 101 | kg |
| Stage | Transport Mode | Distance [km] |
|---|---|---|
| Valves | Train | 3000 |
| Truck EURO 6, lorry 16–32 metric ton | 100 | |
| Heat exchangers | Truck EURO 6, lorry 16–32 metric ton | 1000 |
| Network pipes | Container ship, freight | 10,000 |
| Truck EURO 6, lorry 16–32 metric ton | 100 | |
| Others | Truck EURO 6, lorry 16–32 metric ton | 100 |
| End of life | Truck EURO 6, lorry 16–32 metric ton | 100 |
| Impact Category | Unit | Pipe Component | Rigid Infrastructure | Flexible Infrastructure | |||
|---|---|---|---|---|---|---|---|
| A | B | C | D | E | |||
| Global Warming | kg CO2 eq | Internal layer | 7.42 × 10⁴ | 5.93 × 10⁴ | 4.66 × 10⁴ | 4.68 × 10⁴ | 4.37 × 10⁴ |
| Insulation | 4.82 × 10³ | 2.07 × 10⁴ | 7.67 × 10³ | 2.70 × 10⁴ | 2.58 × 10⁴ | ||
| External layer | 9.39 × 10⁴ | 8.63 × 10³ | 2.01 × 10⁴ | 1.91 × 10⁴ | 3.26 × 10⁴ | ||
| Other | 1.54 × 10³ | 1.50 × 10³ | 1.60 × 10³ | 1.56 × 10³ | 1.55 × 10³ | ||
| Ozone Depletion | kg CFC-11 eq | Internal layer | 5.05 × 10⁻³ | 4.03 × 10⁻³ | 1.20 × 10⁻³ | 1.20 × 10⁻³ | 9.50 × 10⁻⁴ |
| Insulation | 3.10 × 10⁻⁴ | 2.84 × 10⁻³ | 3.61 × 10⁻⁴ | 3.69 × 10⁻³ | 3.52 × 10⁻³ | ||
| External layer | 5.08 × 10⁻³ | 2.22 × 10⁻⁴ | 5.15 × 10⁻⁴ | 4.90 × 10⁻⁴ | 1.41 × 10⁻² | ||
| Other | 2.92 × 10⁻⁴ | 2.85 × 10⁻⁴ | 3.14 × 10⁻⁴ | 3.06 × 10⁻⁴ | 3.04 × 10⁻⁴ | ||
| Acidification for soil and water | kg SO2 eq | Internal layer | 3.13 × 10² | 2.50 × 10² | - | - | - |
| Insulation | 4.20 × 101 | 1.01 × 10² | - | - | - | ||
| External layer | 4.80 × 10² | 2.91 × 101 | - | - | - | ||
| Other | 7.90 × 100 | 7.70 × 100 | - | - | - | ||
| Eutrophication | kg PO4− eq | Internal layer | 1.43 × 10² | 1.14 × 10² | 3.88 × 101 | 3.89 × 101 | 3.48 × 101 |
| Insulation | 7.49 × 100 | 4.17 × 101 | 8.08 × 100 | 5.43 × 101 | 5.18 × 101 | ||
| External layer | 1.52 × 10² | 7.18 × 100 | 1.67 × 101 | 1.59 × 101 | 4.65 × 101 | ||
| Other | 1.64 × 100 | 1.60 × 100 | 1.64 × 100 | 1.59 × 100 | 1.58 × 100 | ||
| Photochemical ozone creation | kg C2H4 eq | Internal layer | 3.42 × 101 | 2.73 × 101 | 1.42 × 101 | 1.43 × 101 | 1.03 × 101 |
| Insulation | 2.64 × 100 | 1.73 × 101 | 2.06 × 100 | 2.25 × 101 | 2.15 × 101 | ||
| External layer | 2.81 × 101 | 2.63 × 100 | 6.11 × 100 | 5.81 × 100 | 8.94 × 100 | ||
| Other | 3.74 × 100 | 3.66 × 100 | 4.00 × 100 | 3.91 × 100 | 3.89 × 100 | ||
| Depletion of abiotic resources -elements | kg Sb eq | Internal layer | 1.05 × 100 | 8.41 × 10⁻¹ | - | - | - |
| Insulation | 5.74 × 10⁻² | 2.61 × 10⁻¹ | - | - | - | ||
| External layer | 3.68 × 100 | 5.13 × 10⁻² | - | - | - | ||
| Other | 2.46 × 10⁻² | 2.41 × 10⁻² | - | - | - | ||
| Depletion of abiotic resources -fossil | MJ, HHV | Internal layer | 8.12 × 10⁵ | 6.49 × 10⁵ | - | - | - |
| Insulation | 5.58 × 10⁴ | 3.45 × 10⁵ | - | - | - | ||
| External layer | 1.02 × 10⁶ | 2.10 × 10⁵ | - | - | - | ||
| Other | 2.48 × 10⁴ | 2.42 × 10⁴ | - | - | - | ||
| Water pollution | m3 | Internal layer | 2.88 × 10⁵ | 2.30 × 10⁵ | - | - | - |
| Insulation | 9.60 × 10³ | 5.42 × 10⁴ | - | - | - | ||
| External layer | 5.97 × 10⁵ | 1.16 × 10⁴ | - | - | - | ||
| Other | 8.89 × 10² | 8.74 × 10² | - | - | - | ||
| Air pollution | m3 | Internal layer | 1.77 × 10⁷ | 1.41 × 10⁷ | 2.19 × 10⁶ | 2.19 × 10⁶ | 2.04 × 10⁶ |
| Insulation | 7.48 × 10⁵ | 2.55 × 10⁶ | 4.01 × 10⁵ | 3.32 × 10⁶ | 3.17 × 10⁶ | ||
| External layer | 2.18 × 10⁷ | 4.05 × 10⁵ | 9.40 × 10⁵ | 8.94 × 10⁵ | 2.36 × 10⁶ | ||
| Other | 2.08 × 10⁶ | 2.03 × 10⁶ | 2.21 × 10⁶ | 2.16 × 10⁶ | 2.15 × 10⁶ | ||
| Total renewable primary energy | MJ, HHV | Internal layer | 1.03 × 10⁵ | 8.25 × 10⁴ | 4.21 × 10⁴ | 4.22 × 10⁴ | 3.81 × 10⁴ |
| Insulation | 2.66 × 10³ | 2.97 × 10⁴ | 8.88 × 10³ | 3.87 × 10⁴ | 3.69 × 10⁴ | ||
| External layer | 2.39 × 10⁵ | 7.78 × 10³ | 1.81 × 10⁴ | 1.72 × 10⁴ | 4.81 × 10⁴ | ||
| Other | 3.51 × 10² | 3.45 × 10² | 1.96 × 10² | 1.91 × 10² | 1.90 × 10² | ||
| Total non-renewable primary energy | MJ, HHV | Internal layer | 9.54 × 10⁵ | 7.63 × 10⁵ | - | - | - |
| Insulation | 5.68 × 10⁴ | 4.09 × 10⁵ | - | - | - | ||
| External layer | 1.18 × 10⁶ | 2.26 × 10⁵ | - | - | - | ||
| Other | 2.53 × 10⁴ | 2.47 × 10⁴ | - | - | - | ||
| Net use of fresh water | m3 | Internal layer | 5.99 × 10² | 4.78 × 10² | 4.21 × 10⁴ | 4.22 × 10⁴ | 3.81 × 10⁴ |
| Insulation | 2.81 × 101 | 4.28 × 10² | 8.88 × 10³ | 3.87 × 10⁴ | 3.69 × 10⁴ | ||
| External layer | 8.86 × 10² | 1.06 × 10² | 1.81 × 10⁴ | 1.72 × 10⁴ | 4.81 × 10⁴ | ||
| Other | 3.89 × 100 | 3.83 × 100 | 2.57 × 10² | 2.51 × 10² | 2.50 × 10² | ||
| Hazardous waste disposed | kg | Internal layer | 1.93 × 10⁴ | 1.54 × 10⁴ | - | - | - |
| Insulation | 1.10 × 10² | 7.10 × 10² | - | - | - | ||
| External layer | 7.58 × 10⁴ | 1.47 × 10² | - | - | - | ||
| Other | 3.30 × 101 | 3.26 × 101 | - | - | - | ||
| Non-hazardous waste disposed | kg | Internal layer | 5.56 × 10⁴ | 4.45 × 10⁴ | - | - | - |
| Insulation | 5.45 × 10³ | 8.12 × 10³ | - | - | - | ||
| External layer | 1.01 × 10⁵ | 1.81 × 10³ | - | - | - | ||
| Other | 1.22 × 10³ | 1.19 × 10³ | - | - | - | ||
| Radioactive waste disposed | kg | Internal layer | 3.65 × 100 | 2.91 × 100 | 5.74 × 10² | 5.76 × 10² | 5.08 × 10² |
| Insulation | 9.24 × 10⁻² | 1.08 × 100 | 1.36 × 10² | 5.57 × 10² | 5.31 × 10² | ||
| External layer | 3.95 × 100 | 2.40 × 10⁻¹ | 2.47 × 10² | 2.35 × 10² | 8.11 × 10² | ||
| Other | 1.66 × 10⁻¹ | 1.62 × 10⁻¹ | 2.80 × 100 | 2.74 × 100 | 2.72 × 100 | ||
| Impact Category | Unit | Total Variation | Trench Variation |
|---|---|---|---|
| Global warming | kg CO2 eq | 1.5% | 22% |
| Ozone depletion | kg CFC-11 eq | 2.8% | 19% |
| Acidification for soil and water | kg SO2 eq | 1.7% | 24% |
| Eutrophication | kg PO4− eq | 1.3% | 31% |
| Photochemical ozone creation | kg C2H4 eq | 1.6% | 16% |
| Depletion of abiotic resources—elements | kg Sb eq | 0.3% | 30% |
| Depletion of abiotic resources—fossil | MJ, HHV | 1.6% | 9% |
| Water pollution | m3 | 0.5% | 39% |
| Air pollution | m3 | 0.9% | 12% |
| Renewable primary energy excl. RM | MJ, HHV | 0.5% | 35% |
| Renewable primary energy used as RM | MJ, HHV | 0.0% | 0% |
| Total renewable primary energy | MJ, HHV | 0.5% | 35% |
| Non-renewable primary energy excl. RM | MJ, HHV | 1.7% | 19% |
| Non-renewable primary energy used as RM | MJ, HHV | 0.0% | 0% |
| Total non-renewable primary energy | MJ, HHV | 1.5% | 10% |
| Use of secondary material | kg | 0.0% | 0% |
| Use of renewable secondary fuels | MJ, HHV | 0.0% | 0% |
| Use of non-renewable secondary fuels | MJ, HHV | 0.0% | 0% |
| Net use of fresh water | m3 | 11.0% | 47% |
| Hazardous waste disposed | kg | 0.1% | 33% |
| Non-hazardous waste disposed | kg | 1.0% | 30% |
| Radioactive waste disposed | kg | 2.6% | 20% |
| Components for re-use | kg | 0.0% | 0% |
| Materials for recycling | kg | 0.0% | 0% |
| Materials for energy recovery | kg | 0.0% | 0% |
| Exported energy—electricity | MJ | 0.0% | 0% |
| Exported energy—thermal | MJ | 0.0% | 0% |
| Exported energy—gas | MJ | 0.0% | 0% |
Disclaimer/Publisher’s Note: The statements, opinions and data contained in all publications are solely those of the individual author(s) and contributor(s) and not of MDPI and/or the editor(s). MDPI and/or the editor(s) disclaim responsibility for any injury to people or property resulting from any ideas, methods, instructions or products referred to in the content. |
© 2023 by the authors. Licensee MDPI, Basel, Switzerland. This article is an open access article distributed under the terms and conditions of the Creative Commons Attribution (CC BY) license (https://creativecommons.org/licenses/by/4.0/).
Share and Cite
Vauchez, M.; Famiglietti, J.; Autelitano, K.; Colombert, M.; Scoccia, R.; Motta, M. Life Cycle Assessment of District Heating Infrastructures: A Comparison of Pipe Typologies in France. Energies 2023, 16, 3912. https://doi.org/10.3390/en16093912
Vauchez M, Famiglietti J, Autelitano K, Colombert M, Scoccia R, Motta M. Life Cycle Assessment of District Heating Infrastructures: A Comparison of Pipe Typologies in France. Energies. 2023; 16(9):3912. https://doi.org/10.3390/en16093912
Chicago/Turabian StyleVauchez, Mahaut, Jacopo Famiglietti, Kevin Autelitano, Morgane Colombert, Rossano Scoccia, and Mario Motta. 2023. "Life Cycle Assessment of District Heating Infrastructures: A Comparison of Pipe Typologies in France" Energies 16, no. 9: 3912. https://doi.org/10.3390/en16093912