1. Introduction
Climate change and emissions reduction policies have been at the forefront of Australian politics for a long time. The Australian Government has ratified the Kyoto protocol and has introduced the renewable energy target and emissions reduction targets in response to the global warming issues [
1]. To design an environmental policy that is supported by the citizens, it is helpful to know their attitudes towards the environment and their willingness to pay (WTP) for such policies. The attitude–behaviour framework links beliefs to attitudes, attitudes to intentions, and intentions to behaviours [
2]. However, in practice, it is hard to connect specific attitudes to behaviour. For example, Hadler et al. [
3] noted that there were many definitions of environmental attitudes with many authors emphasised the multidimensional nature of environmental attitudes ([
4,
5]). Jorgensen et al. [
6] suggested that WTP could be affected by various attitudes and beliefs which were difficult to explicitly separate into categories due to their interdependence. Although many researchers found a positive correlation between environmental attitudes and actions (e.g., [
7,
8]), others concluded that the link between them was weak [
9]. For example, Rhead et al. [
10], using the
UK Survey of Public Attitudes and Behaviour towards the Environment, found evidence that greater environmental concern led to the higher probability of being engaged in pro-environmental behaviour. This finding was supported by Liu et al. [
11], who explored attitudes to climate change risk using the UK Household longitudinal study for 2012 and 2020. Liu et al. [
11] identified the temporal stability of cluster structure between two surveys in 2012 and 2020 in the UK, noting the shift towards the
Concerned cluster. They found that the perception that climate change was a low risk was a barrier to mitigation efforts, emphasising that understanding public attitudes towards climate change was important for policy makers in order to design policy to reduce emissions. Similarly, Paço and Lavrador [
9] used a survey of university students in Portugal to identify the link between environmental knowledge, attitudes, and behaviours towards energy consumption. They noted the lack of significant relationship between knowledge and attitudes towards energy while the relationship between attitudes and behaviour were found to be weak.
Furthermore, perceptions and attitudes can change over time, making the evaluation of environmental policy support more challenging. This paper explores the links between the attitudes and stated WTP with the focus on emissions reduction and climate change in more detail. To elicit support for environmental policies non-market valuation techniques, including contingent valuation (CV), can be used. Typically, models eliciting WTP for environmental protection use socio-demographic explanatory variables but ignore the role of complex psychological and sociological variables, such as environmental attitudes and beliefs [
12]. This paper addresses this gap by assessing the effects of not only traditional socioeconomic and demographic variables on WTP over time but also investigating significance and magnitude of effect of attitudinal variables on WTP. The study focuses on two main questions. First, it tests whether the responses to perceptions, attitudes, and actions questions differ over a long time frame, such as 10 years. The first survey was performed when the environmental issues were at the forefront of the Australian election. The second survey was conducted when most climate change policy initiatives were dismissed. Second, the study examines whether attitudes are significant in predicting WTP. It is investigated using logistic regression. Overall, this paper widens the knowledge on the subject of citizens’ attitudes towards climate change and their WTP for the emissions reduction, and it helps to determine the optimal directions of environmental policy.
The rest of the paper is structured as follows.
Section 2 outlines relevant literature.
Section 3 discusses changes in perceptions, attitudes, and actions towards the climate change in Australia.
Section 4 outlines a case study.
Section 5 describes differences in perceptions, attitudes, and actions towards climate change.
Section 6 discusses the results of the comparison of WTP estimates and
Section 7 provides a summary and conclusions.
2. Literature Review
There is mixed evidence with regard to attitudes and intentions to pay for emissions reduction and to use renewable energy to reduce emissions. For example, Duan and Yan [
13] investigated Chinese public’s WTP for emissions reduction and found that climate change awareness, but not environmental awareness, was a positive factor affecting WTP. Mehedi et al. [
14], while investigating WTP for the carbon emissions offsets in Malaysia, found that knowledge about climate change but not attitudes towards climate change had a positive and significant effect on WTP. Adaman et al. [
15] determined households’ WTP in Turkey for emission reduction and found that environmental perception, attitudes, and behaviour had a positive impact on WTP. However, Shahzad et al. [
16] found that attitudes were not significant in the model assessing WTP for the environmental protection in Pakistan.
Similarly, the evidence is mixed with relation to the use of renewable energy. For example, Lin and Syrgabayeva [
17] conducted an attitudinal survey in Kazakhstan regarding the impact of environmental concerns, beliefs, and knowledge about renewable energy on respondents’ WTP for renewable energy. They found that consumers’ concerns regarding renewable energy, their beliefs, and their knowledge had positively affected their attitudes and increased their WTP for renewable energy. However, their results showed that there were no significant relationships between environmental concern and knowledge about renewable energy and between knowledge about renewable energy and attitudes towards renewable energy. Halder et al. (2016) examined the effect of attitudes on university students’ intentions to use bioenergy in Finland and India surveys. They found differences across countries with attitudes, subjective norms, and perceived behavioural control being significant among Finnish students but only subjective norms were significant predictors of students’ intentions to use bioenergy among Indian students. Interestingly, Halder et al. [
18] found that attitudes were the strongest predictors of Finnish respondents’ intentions to use bioenergy. Rezaei and Ghofranfarid [
19] investigated the intentions of using renewable energy in the rural area of Iran. They found that while social norms did not have a significant effect on intentions, awareness, perceived behavioural control, relative advantage, and moral norms were all significant predictors of intention to use renewable energy. Rezaei and Ghofranfarid [
19] estimated that awareness of renewable energy had the highest effect on the intentions to use renewable energy.
Feng [
20] examined how attitudes towards renewable energy, subjective norms, acceptance of innovation, and socio-economic variables affect usage of renewable energy technologies in Taiwan. They found that attitudes and acceptance of innovation, as well as subjective norms, had significant effects on behavioural intention to use renewable energy technologies. Irfan et al. [
21] examined the links between consumers’ intention and WTP for renewable energy technologies in Pakistan. They found that attitudes, subjective norms, and perceived behavioural control had a positive impact on WTP, while the cost of renewable energy technologies had a negative effect. Interestingly, the environmental concern did not have a significant effect on consumers WTP for renewable energy. Irfan et al. [
21] explained it by the lack of governmental efforts to increase awareness of ecological problems in Pakistan.
Stigka et al. [
22] provided an overview of studies on preferences and attitudes of communities towards investments in renewable energy projects and their perceptions of those technologies. Stigka et al. [
22] confirmed correlations between WTP and socioeconomic variables, such as education, interest in environmental issues, and knowledge of renewable energy technologies. They noted that environmental attitudes represented a complex concept which included environmental knowledge, environmental values, and environmental behavioural intentions and were difficult to measure. However, Stigka et al. [
22] agreed that actions followed attitudinal perceptions.
Although the degree of influence of attitudes on stated intention with regard to emissions reduction and renewable energy has been explored in great detail globally, less attention was given to Australia specifically. Choi and Ritchie [
23] estimated WTP to reduce carbon dioxide by voluntary carbon offsets in Australia. They found a positive relationship between attitudes and WTP for reducing emissions. Kragt et al. [
24] investigated public WTP for reducing Australian greenhouse gas emissions. They found that respondents who believed that climate change was induced by humans had a higher WTP than those respondents who did not hold such beliefs. Similarly, Ahmed et al. [
25] examined the influence of social norms and attitudes towards green energy on purchasing intentions for Australian consumers. They found that purchase intention towards green energy was guided by social influence and green attitudes. Paladino and Pandit [
26] looked at the motivation of Australian households towards purchases green energy and found that environmental concern, subjective norms, and environmental involvement have significant positive effects on green energy attitudes and intention to purchase green energy.
There is an established literature on importance of understanding public attitudes towards climate change for the emissions reduction using non-market valuation, such as the CV method. The CV question can be seen as a stated intention of WTP explained by the characteristics of the good and beliefs/perceptions and attitudes towards the good [
27]. Whitehead and Hoban [
28] suggested that true WTP should be positively correlated with stated WTP. Generally, there is a consensus that positive attitudes towards green energy determine consumers’ purchases of renewable energy [
29,
30]. For example, those respondents who were more aware about environmental issues were more likely to pay more for the proposed change in environmental quality [
31,
32]. Furthermore, perceptions of consequences of climate change could be important variables explaining WTP to protect the environment [
33].
Oerlemans et al. [
34] reported the results from a literature review on the use of CV for measuring WTP for electricity generated from renewable energy between 2000 and 2011. They found 29 papers using attitudes towards the environment or renewable energy where those attitudes had a positive statistically significant relationship with WTP, and only 2 of those papers where the prior experience with the renewable energy played a significant but negative role in respondents WTP.
Viscusi and Zeckhauser [
35] used a convenience sample of students to assess the effect of perceptions towards climate change on students’ WTP for avoidance of risk of climate change in the USA. They investigated whether stronger beliefs that climate change was a serious risk led to a stronger support of climate change policies. Viscusi and Zeckhauser [
35] found that respondents’ risk perceptions and attitudes towards environmental policies were important determinants of their WTP for risk reduction.
Several studies showed a correlation between WTP and socio-economic variables, knowledge about environmental issues and concern about climate change [
22,
36,
37,
38]. For example, WTP had been found to be positively correlated with being male, having a higher income and educational level [
38,
39,
40]. Zahedi et al. [
41] using a CV survey examined public willingness to reduce air pollution and greenhouse gas emissions from road transport in Spain. They found that younger respondents with higher income level tend to state higher WTP. Zahedi et al. [
41] noted that attitudes and perceived behavioural control had the strongest effect on the intention to pay for emissions reduction.
Akter and Bennett [
42] investigated respondents’ perceptions of climate change impact on Australia in 2008. They found that most respondents believed that there would be a decrease in water supply (84% of respondents), more droughts (81% of respondents), damage to the Great Barrier Reef (77% of respondents), and more natural disasters (75% of respondents). They found a statistically significant relationship between respondents’ perceptions of the impacts of climate change on Australia and their support of the Carbon Pollution Reduction Scheme.
Whitehead and Hoban [
28] found that attitudes towards environment can be influenced by demographic variables and time. Whitehead and Hoban [
28] examined temporal reliability in CV while controlling for attitudes towards environment. They found that while attitudes have changed over the five-year period between CV surveys, WTP values were not affected by this change.
These studies highlighted the importance of perceptions and attitudes in respondents support of environmental change or policies. It is, therefore, important to investigate changes in perceptions and attitudes towards climate change over time, as well as their effect on support for such policy.
3. Changes in Perceptions, Attitudes, and Actions towards the Climate Change in Australia
The topic of climate change became prominent in media coverage and policies in recent years. However, media coverage of climate change not only differed by the country [
43] and over time [
44,
45,
46], it was also heterogenous within the country [
47]. For example, in 2008, Australia had the highest monthly average climate change-related articles per newspaper issue among 41 developed and developing countries (3.9 articles, 2.10 standard deviation compared to the world average of 1.2 articles, 1.43 standard deviation) [
48]. Lidberg [
49] compared media coverage of two major climate change summits in Copenhagen in 2009 and Paris in 2015 in Australia and concluded that while media coverage was heterogenous between two major Australian newspapers, there was an exponentially growing willingness to invest in renewable energy.
Hytten [
50] noted that climate change was introduced as a key election issue in the 2007, 2010, and 2019 elections in Australia, which implied substantial media coverage of climate change issues before elections. Hudson [
51] noted that, in terms of energy and climate policy, Australia experienced dramatic changes between 2006 and 2018. For example, the carbon pollution reduction scheme was at the forefront of the debates in 2009 election. However, by 2018, most of the climate change policy initiatives were abolished [
51].
It is interesting to note the change in population segments identified by their attitudes in Australia. Morrison et al. [
52] using Maibach et al. [
53] types of questions investigated how beliefs and attitudes towards climate change affect WTP of households for various policies applying attitudinal surveys in 2011 and 2016. They found that out of six Australian household segments between two periods there was an increase in the
Cautious and
Disengaged segments and a decline in
Doubtful and
Dismissive segments, indicating a greater concern with respect to climate change. However, Morrison et al. [
52] noted the evidence of the issue fatigue with less respondents thinking about or discussing climate change with friends or engage in climate friendly behaviour in 2016 compared to a 2011 survey.
Pietsch and McAllister [
54] showed a growing concern regarding climate change in Australia with most people declaring WTP more for environmental protection. Similarly, Leviston et al. [
55] stated that about 80% of respondents in an Australia-wide survey of more than 5000 respondents indicated that they think climate change was happening, while 38.6% of respondents stated that they thought that climate change was a natural phenomenon, and 46% indicated that they thought that humans largely caused climate change. Capstick et al. [
56], on the other hand, noted that public perceptions of climate change fluctuated over time. They found that respondents in Australia across 2008–2011 were more sceptical than other countries regarding climate change and that there was a tendency for survey respondents to view climate change as exaggerated or denigrate policies addressing climate change.
In a more recent report, Quicke and Venketasubramanian [
57], confirmed the findings of Capstick et al. [
56] regarding strong concerns amongst Australians about climate change impacts, although about a third of respondents believed that the seriousness of climate change was exaggerated, with about half of respondents believing that too many conflicting opinions were presented to the public.
McAllister et al. [
58], in an Australian-wide survey, found that
Environment was selected as the most important non-economic election issues in 2019 (11%) after health (22%), compared to 8% in 2007 nationally. McAllister et al. [
58] found that more respondents stated that
Global Warming was a serious threat in 2019 (68%) compared to 2010 (55%). A 2019 poll commissioned by Roy Morgan Research survey in Australia, found that 46% of respondents in 2019 considered the environment as the most important issue facing the world today (compared to 22% in 2009). However, the percentage of respondents that considered the environment as the most important issue facing Australia (22%) had not changed between those years [
59].
Given the heterogenous coverage in media and acute attention from the policy makers towards climate change, there was a possibility that perception and attitudes towards climate changes, as well as the choice of actions towards reducing the risks of climate change, have changed among respondents between 2009 and 2018. The change in attitudes could lead to changes in WTP for emissions reduction policies ([
21,
60,
61]. While the Australian Government exhibited strong commitment to emissions reductions [
62,
63], with a constant exposure to media coverage on climate change, over time the issue of climate change could have become trivialised (issue fatigue) [
52,
64]. Therefore, for this analysis, it was hypothesized that perceptions, attitudes, actions, and WTP were different in 2009 and 2018 surveys.
4. Survey Description
Respondents’ perceptions, attitudes, and actions were first elicited in CV study in 2009 and then in 2018. Surveys in both years were administered by the same marketing company to the online panel of Queensland residents. The online panels were different in two surveys.
The surveys consisted of three parts. In the first part, questions regarding the potential impacts of climate change for Australia, and climate change-related statements were provided to respondents. The questions were the same in both years. In both surveys, respondents were asked to rank the importance of economy, law and order, climate change, health, and education, and about their perceptions and attitudes regarding climate change (e.g., level of agreement with rising sea levels, harsher weather, increase in economic costs) [
65,
66]. Respondents were also asked about past actions related to climate change they have performed (e.g., purchase of green energy).
The second part of both surveys covered valuation questions. The results from non-market valuation questions were reported in [
67,
68,
69]. (Williams and Rolfe [
67] analysed data from choice experiments with the focus on labels and uncertainty. Williams [
68] examined temporal stability of WTP estimates using contingent valuation. Williams [
69] further investigated temporal stability of WTP estimates in choice experiments.). The CV part of the non-market valuation asked whether the respondents would be willing to pay to support a certain emissions reduction target. The amount of a bid presented to respondents was randomised to compute WTP estimates. Finally, the socio-demographic questions, such as gender, education, income, and age were asked in the third part of the survey.
In total there were 1113 respondents in 2009 survey and 407 respondents in 2018 survey. Gender ratio in both years was the same (50%). Around 30% of respondents had a higher degree in both years. The chi-square and Student t-tests were used to assess the differences between characteristics of respondents of two surveys. The results showed that there were no significant differences between 2009 and 2018 years in gender and education with the exception that 2018 respondents were significantly older and earnt higher income than 2009 respondents (Williams, 2022a [
68]).
5. Differences in Perceptions/Attitudes and Actions towards Climate Change between 2009 and 2018 Surveys
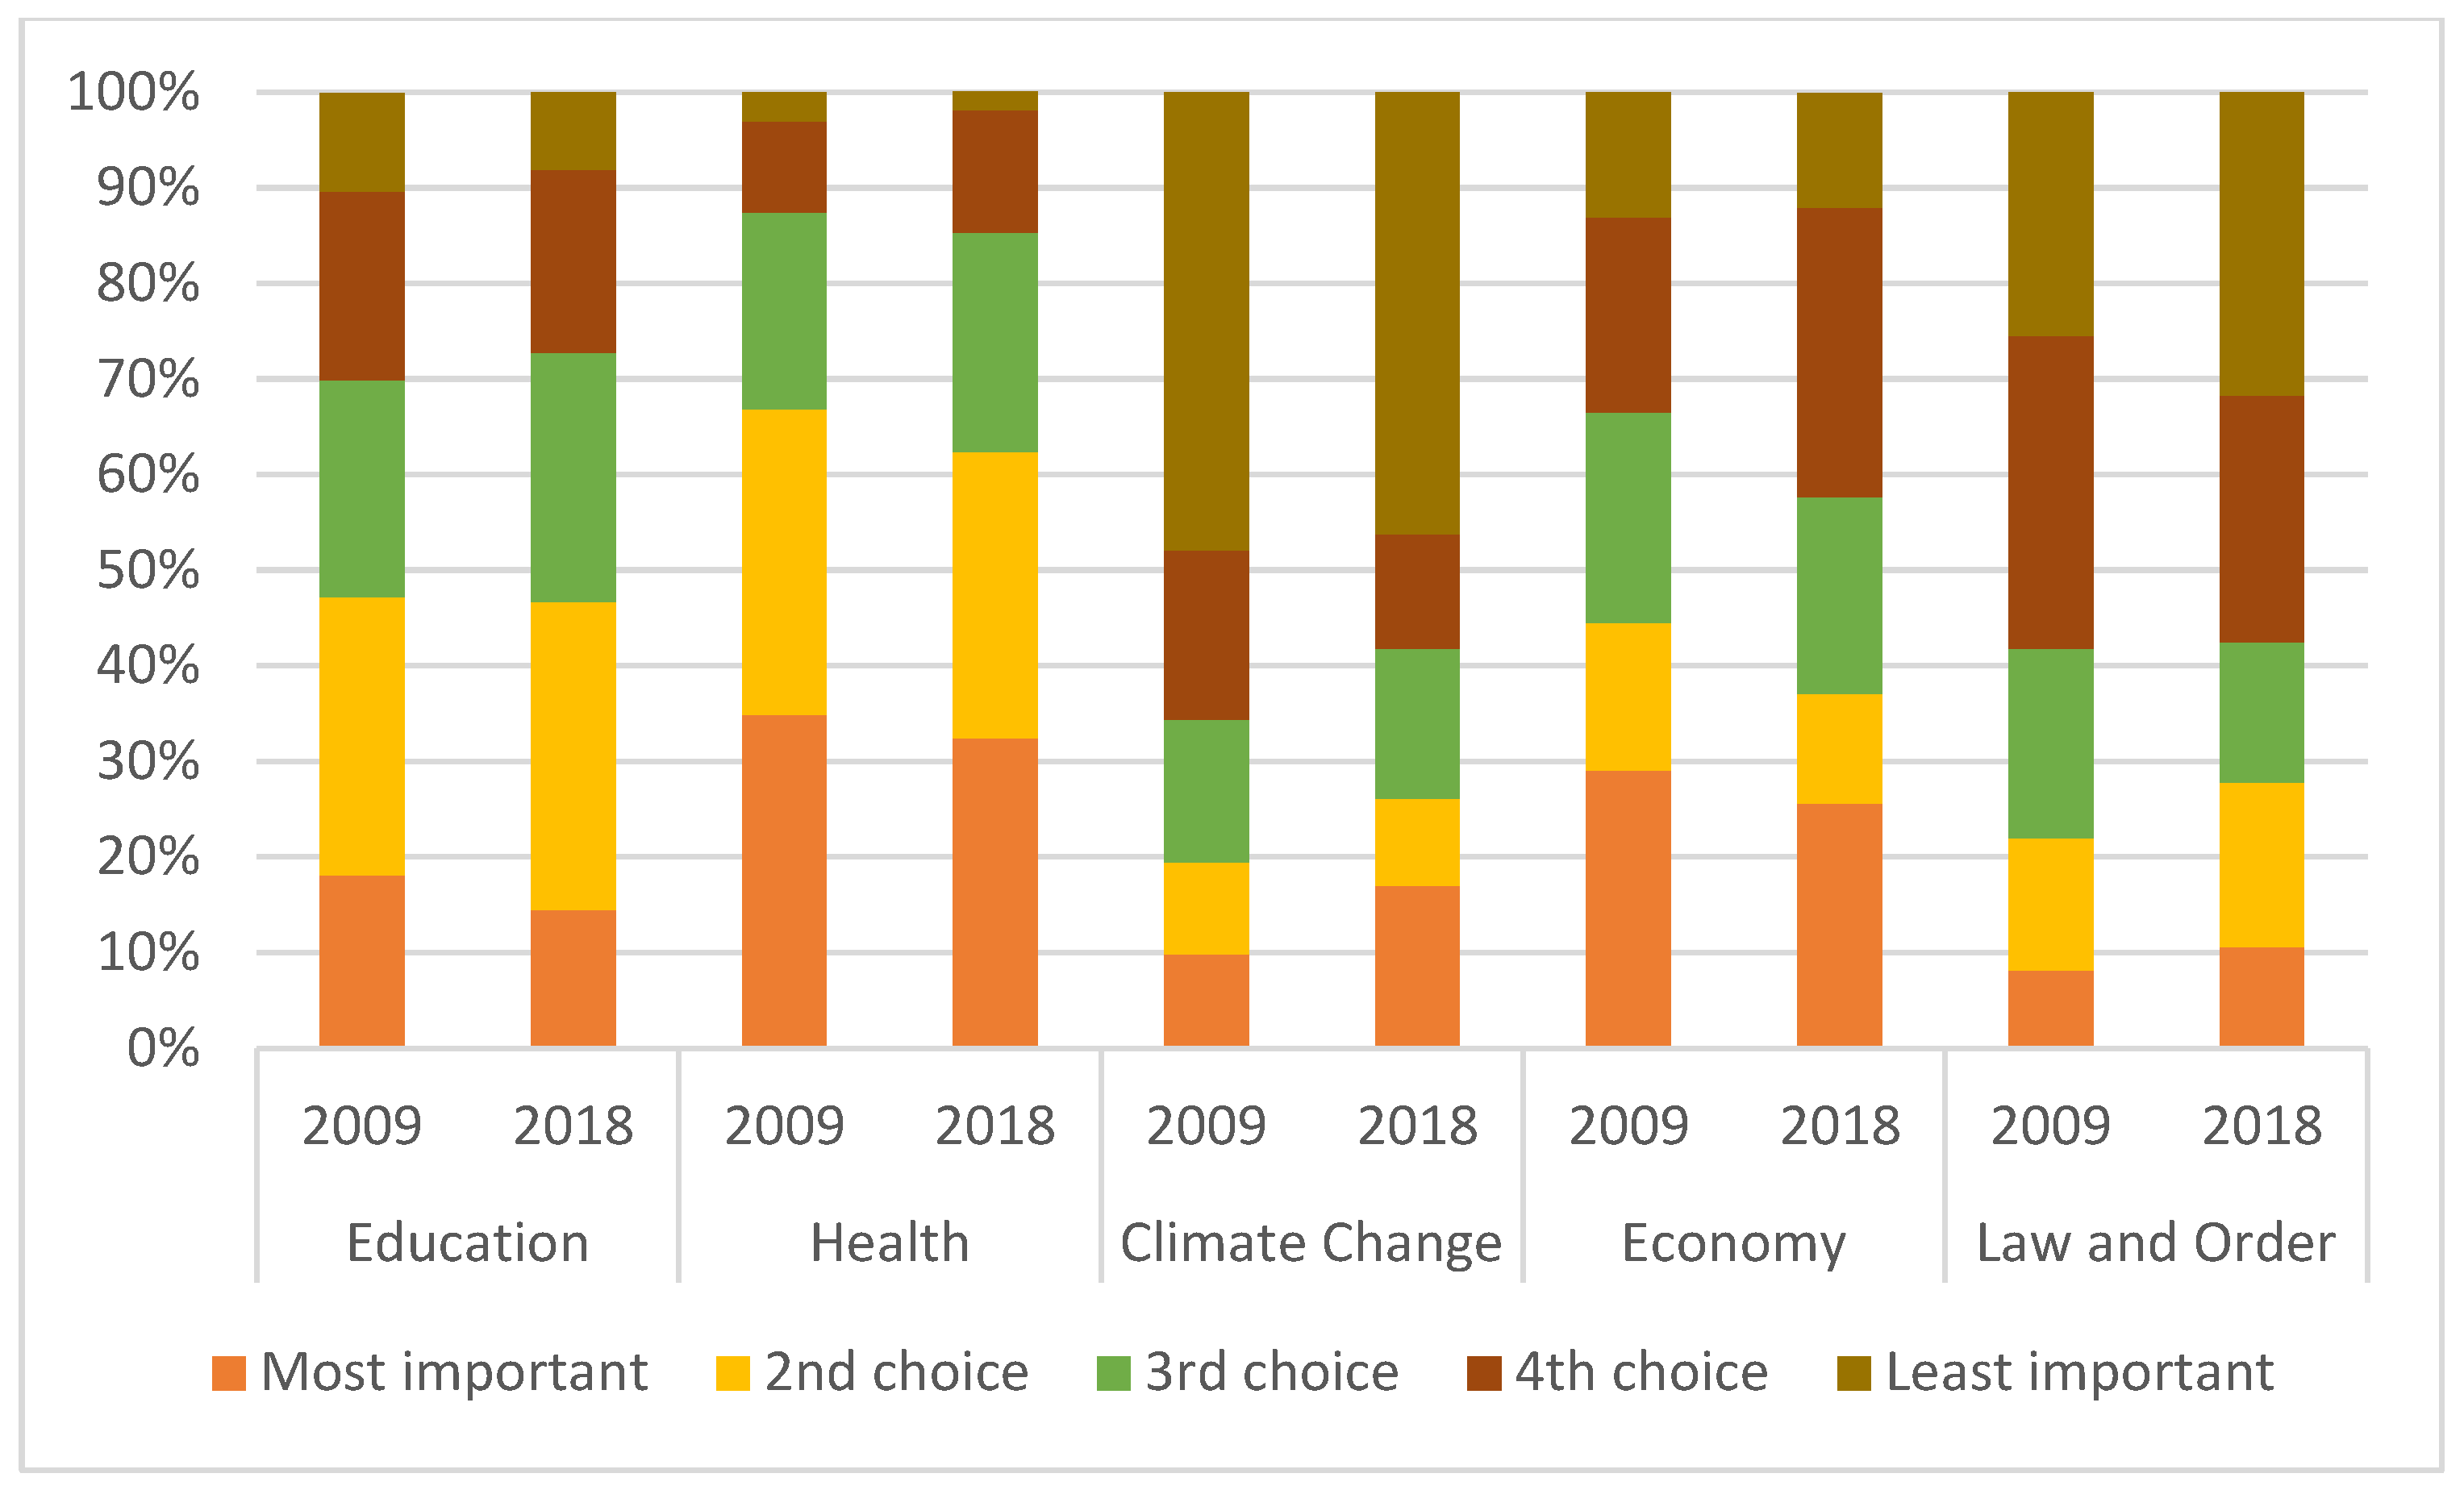
Respondents were asked to rank several issues, such as education, health, climate change, and economy, in terms of their relative importance in Australia (
Figure 1). While the most important issues, such as
Health and
Economy, remained the same for respondents in both years, the relative importance of issues attracted different ranking across the surveys. In both years,
Climate Change was chosen by the majority of respondents as the least important issue, followed by
Law and Order. The distribution of ranking of
Climate Change and
Economy had changed significantly between 2009 and 2018 surveys with more respondents choosing
Climate Change as the most important issue in 2018 (17%) compared to 2009 (9.8%). The results were consistent with the previous research (e.g., McAllister et al., 2022 [
58]).
More than a third of respondents in each survey indicated that
Health was the most important policy issue, while
Economy was considered the most important issue by less than a third of respondents in 2009 and only by a quarter of respondents in 2018 surveys (
Table 1). The importance of
Education was ranked consistently second (if the first and second choices are taken into account) after
Health and ahead of
Economy issues.
A range of perception questions regarding climate change was presented to respondents in 2009 and 2018 surveys. Respondents were asked about their opinions about the scale of climate change impacts on Australia, such as increase in sea levels, more drought, and damage to the Great Barrier Reef. Respondents were able to choose from “will not occur”, “very small”, “small”, “medium”, “large”, or “very large”. They also had an option of “not sure”. The “not sure” and missing responses were deleted from the analysis. To investigate changes in perceptions towards climate change impacts each individual question was analysed. Using Mann–Whitney U test (
Table 2, more details are in
Appendix A,
Table A1) compared the answers to the question “
In your opinion how large might be the following potential impacts of climate change for Australia?”. The results showed that only some issues attracted significantly different responses between 2009 and 2018 surveys.
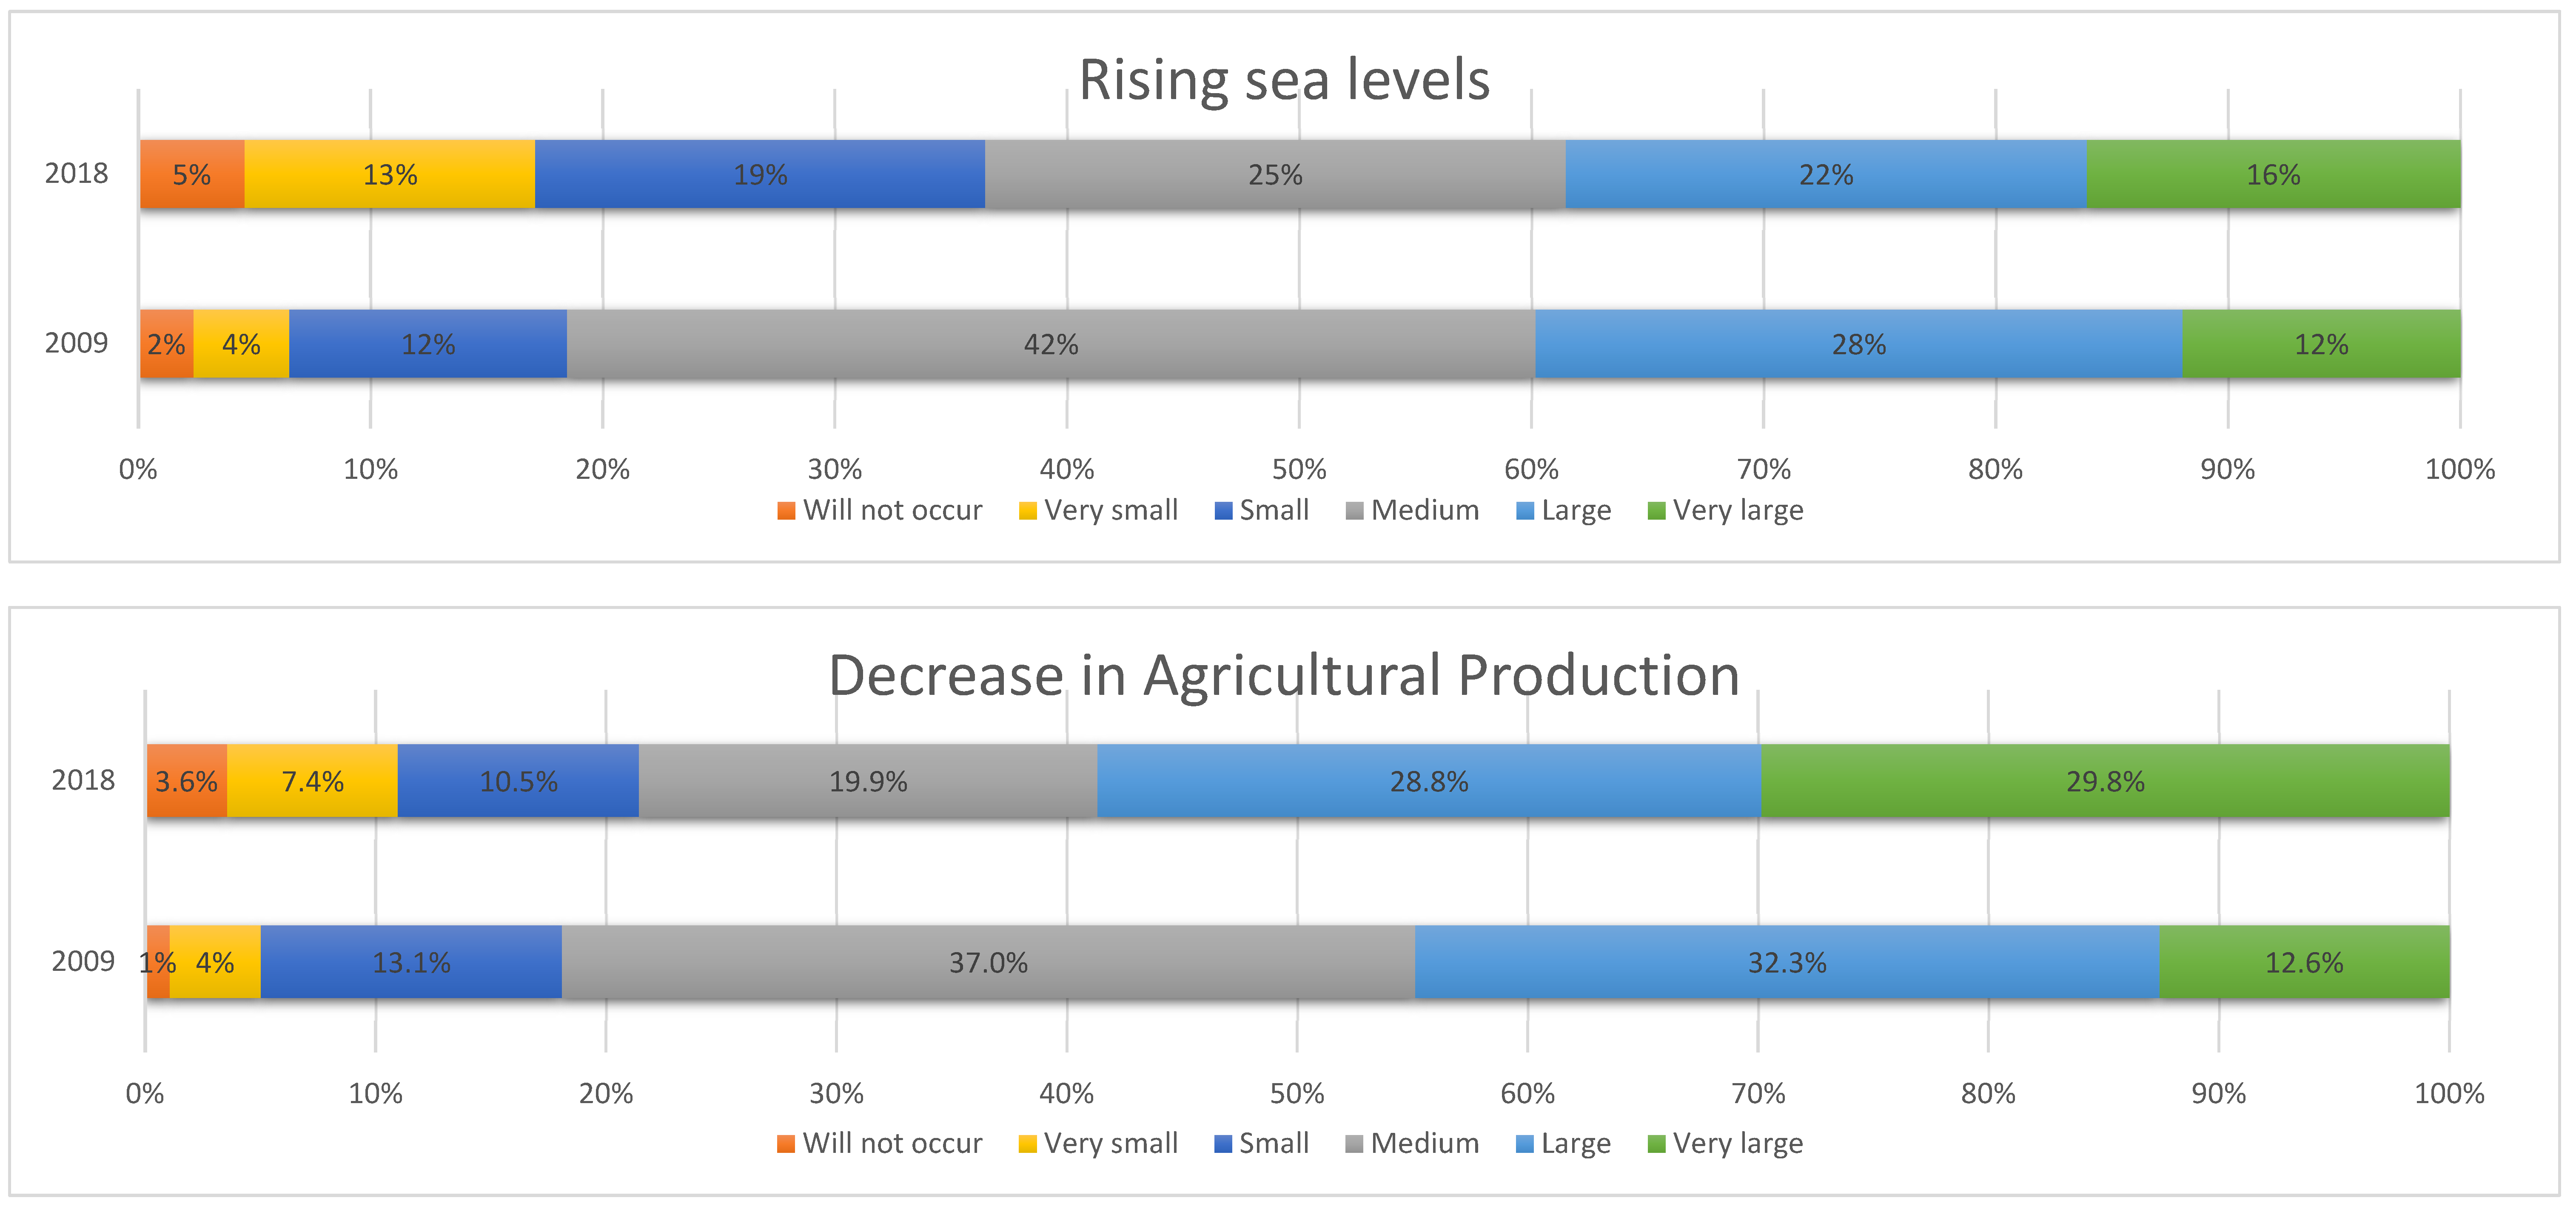
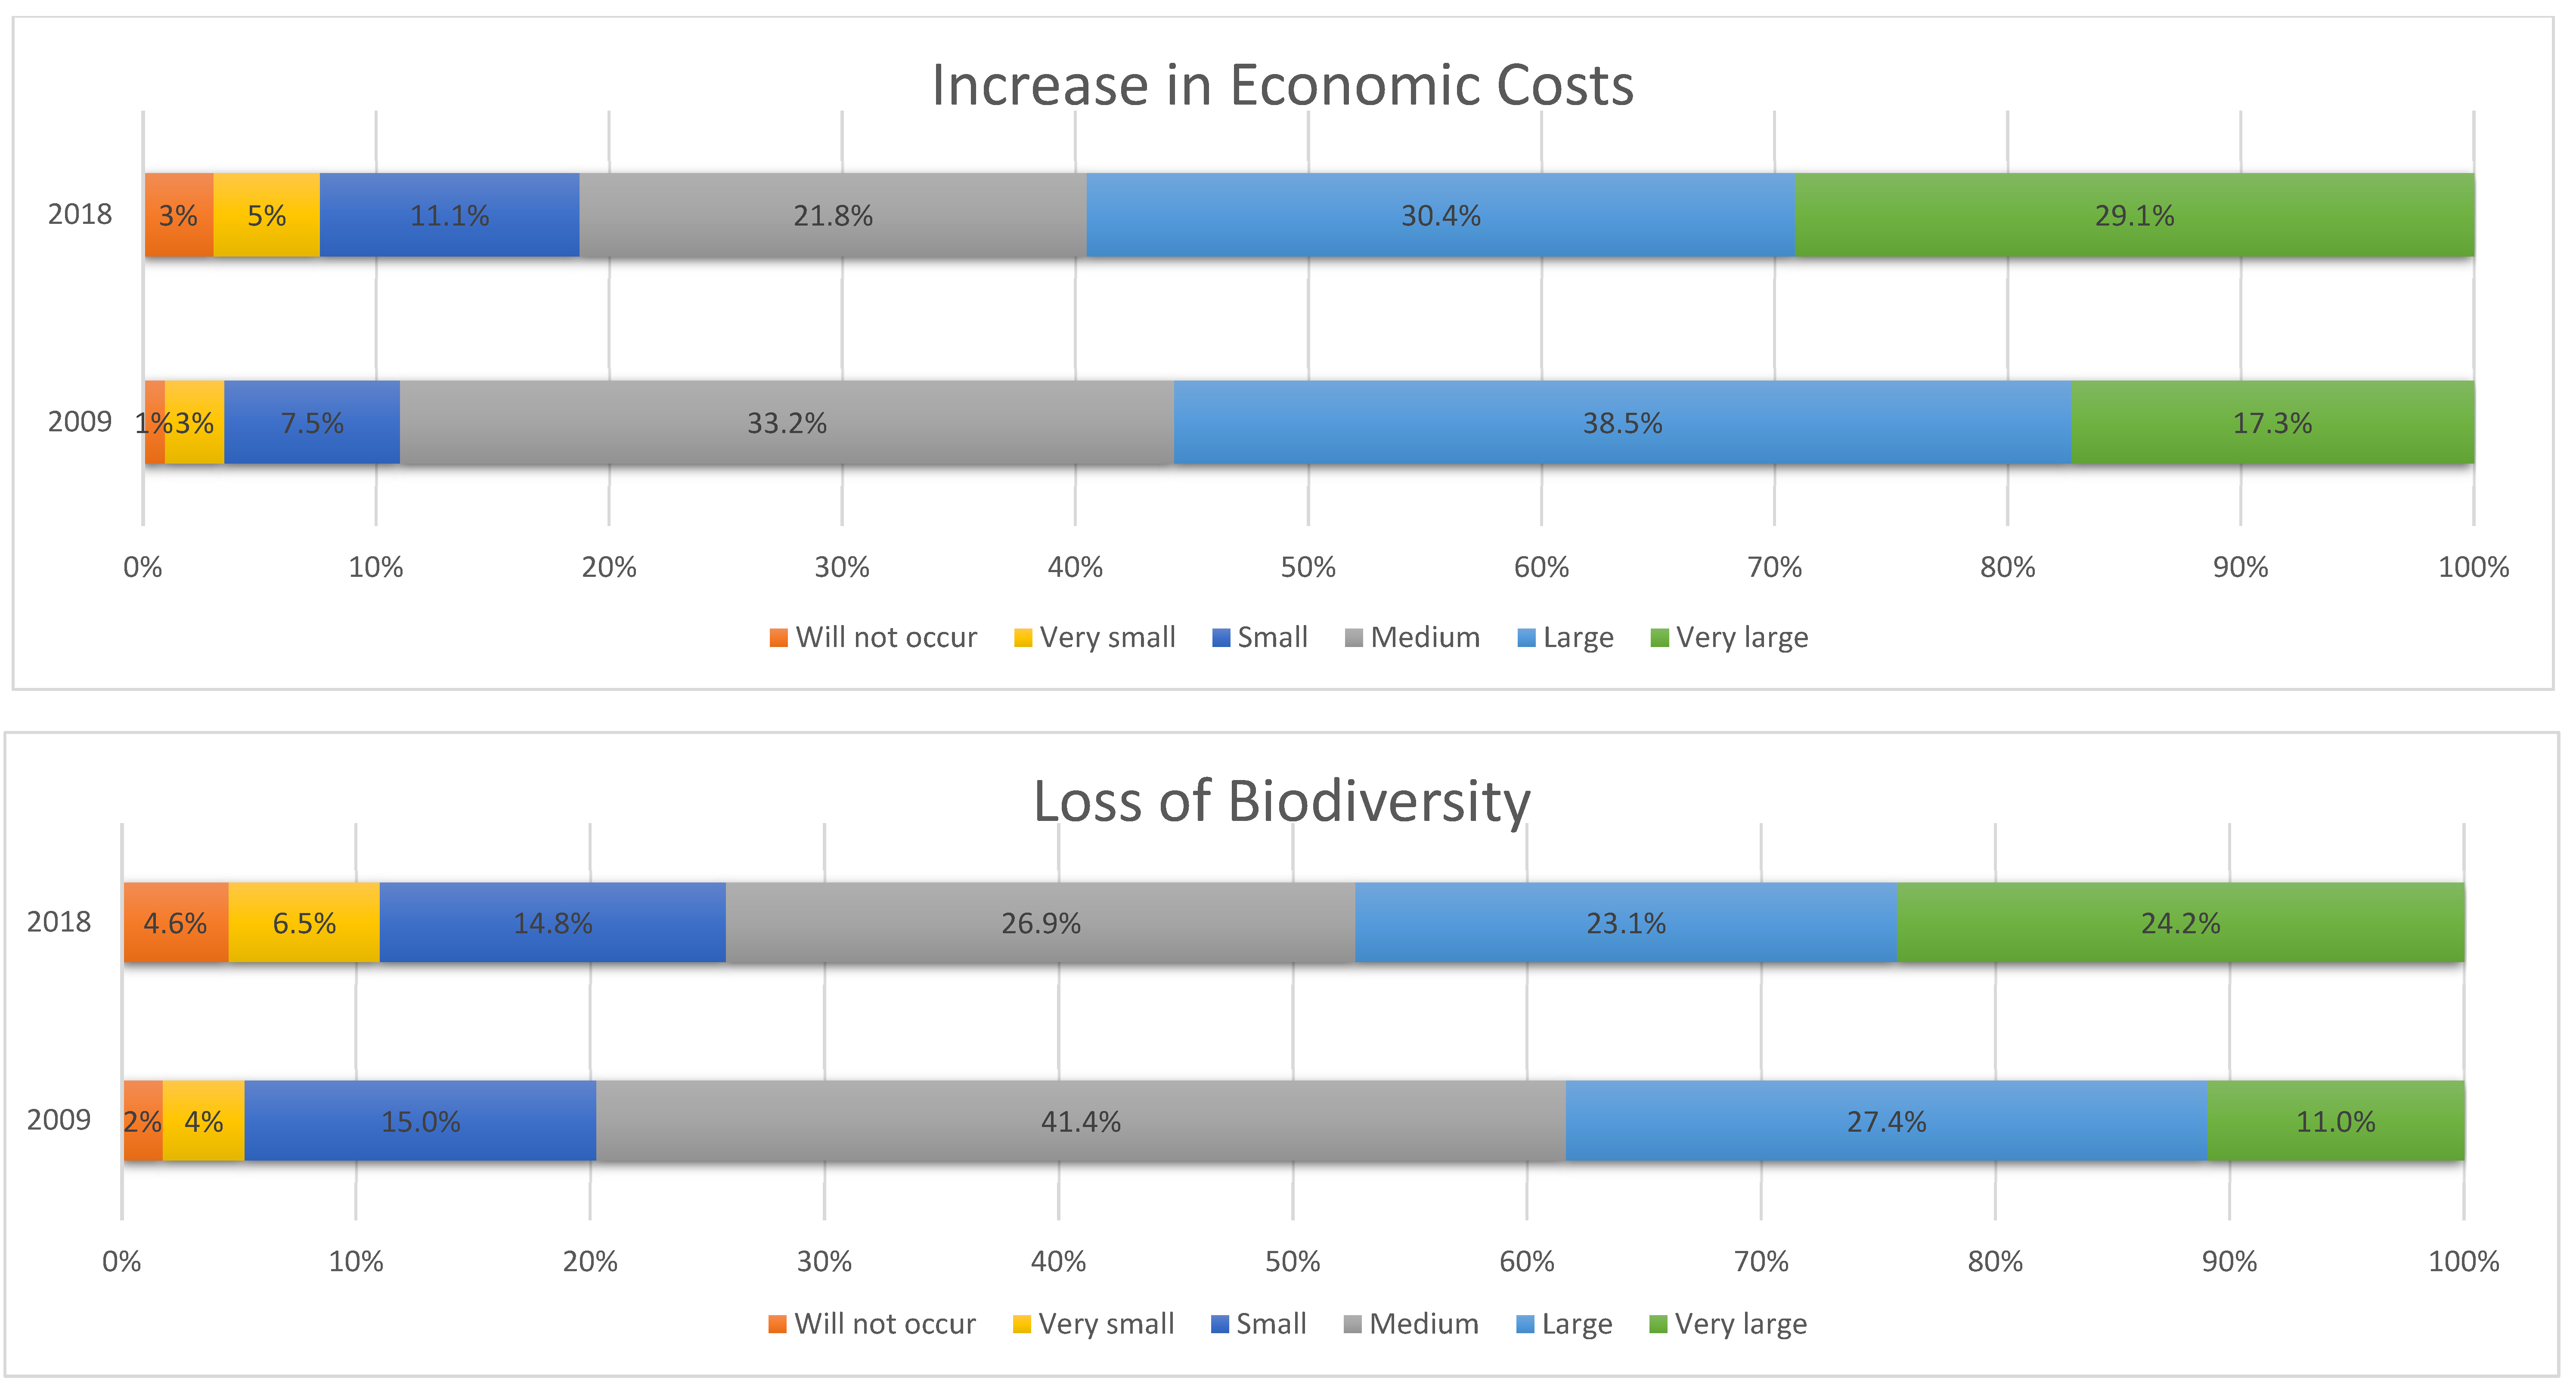
There were significant differences in responses to the questions related to the rise in sea levels, decrease in agricultural production, an increase in economic cost, and loss of biodiversity. While respondents were less likely to state that there would be medium impacts from climate change on rising sea levels, they were more concerned about specific issues. Respondents in 2018, more frequently than the respondents in 2009, stated that they expected very large negative impacts from the climate change. For example, more respondents in 2018 stated that there would be a very large effect of climate change on the decrease in agricultural production (13.5% in 2009 compared to 30% in 2018,
Figure 2). More respondents in 2018 stated that there would be a very large effect on increase in economic cost (29% in 2009 compared to 17% in 2018). More respondents in 2018 stated that there would be a very large effect of climate change on loss of biodiversity (24% in 2018 compared to 11% in 2009).
Next, some of the basic attitudes that respondents had about climate change were examined [
34]. Differences in attitudinal questions are shown in
Table 3 (more details in
Appendix A,
Table A2). The choices were “strongly agree”, “agree”, “neither agree nor disagree”, “strongly disagree”, and “not sure”. The missing and “not sure” responses were omitted from the analysis. More respondents in 2018 (60%) than in 2009 (46%) stated that they agreed and strongly agreed that emissions reduction would not stop climate change in Australia within our lifetime. More respondents in 2018 (59%) than in 2009 (53%) stated that they agreed and strongly agreed that climate change was an important issue because it affected our standards of living. Similarly, more respondents in 2018 (40%) than in 2009 (28%) stated that they agreed and strongly agreed with the statement indicating the perceived decline in their families’ standards of living due to climate change.
The null hypothesis that there were no differences in the perceptions and attitudes towards climate change between 2009 and 2018 surveys was rejected. Furthermore, the results showed significant differences at 1% level in actions related to the reduction in the risk of climate change between 2009 and 2018 surveys. The choices were either “Yes” or “No” to a range of actions, such as purchase of green energy. For example, in the 2018 survey, 23.5% more respondents stated that they purchased green energy compared to 2009 survey. However, about 5% more respondents indicated that they installed solar/wind energy in 2009 compared to the 2018 survey.
6. Effect of Changes in Perceptions/Attitudes and Actions on WTP
While attitudes could be important in citizens’ support of environmental policies, economic literature is scarce for applications using perceptions and attitudes in non-market valuation, such as CV, particularly with relation to the renewable energy and emissions reduction policies. Hafer and Ran [
22] noted that citizens’ perceptions of environmental goods were difficult to evaluate. This study used a form of stated-preference method—a CV survey—to explore how perceptions and attitudes affect the stated WTP of respondents for an emissions reduction policy over time.
To test the difference between WTP in two surveys, the dichotomous WTP variable was used as a dependent variable. Respondents were asked whether they would be willing to pay extra per year for the next ten years for an emissions reduction target in Australia. The bids, ranged from AUD 50 to AUD 2000 in the 2018 survey (AUD 100 to AUD 1000 in 2009), were randomly assigned across respondents. Responses to the question about WTP for emissions reduction was not significantly different between the years. In 2009, about 42% stated that they would be willing to pay for emissions reduction compared to 46% in 2018.
The independent variables were year, bid, perceptions, attitudes, action, and socio-demographics, such as age, gender, and income. The effect of time was measured with a dummy variable (Year), which was equal to 1 for 2009 and 0 for 2018. Four models were estimated. Model 1: base model (socio-demographics variables only), Model 2: composite scale attitudinal model, Model 3: Model 2 with a variable reflecting an importance of climate change, and Model 4: Model 3 with all attitudinal and perception variables as categorical.
The results of binomial logistic regression using SPSS Statistics 28 showed that there were significant differences in WTP responses when accounting for the perceptions/attitudes and action questions (
Table 4).
Questions regarding perceptions, attitudes, and actions were used to elicit responses to WTP question. The simple composite scale for each variable was constructed which then was used in the binary logistic regression using SPSS28. For example, the higher value for the composite perception variable indicated that respondents thought that climate change would have a larger impact on Australia. Cronbach’s Alpha was greater than 0.9 for
Perception and
Attitude composite scales, indicating that the scales had relatively good internal reliability. Cronbach’s alpha is a measure of internal consistency and determines whether items in the scale are measuring the same underlying theoretical construct [
70]. Model accuracy improved when perceptions, attitudes, and action variables were included in the model. Model 2 shows a better fit (R
2 = 0.317 compared to R
2 = 0.144) than Model 1.
In all models, all socio-economic variables except age were significant in predicting respondents’ choices. For example, in Model 1, the odds that respondents in 2018 would answer “
Yes” to the suggested bid to pay for emissions reduction were almost 1.4 times that of the same response in 2009. Model 2 showed that perceptions, attitudes, and actions were significant predictors of the WTP of respondents. The odds that respondents chose “
Yes” to the WTP question were 1.014 higher if respondents perceived a larger effect from the climate change on the economy, health, and the environment compared to respondents who perceived that the effect would be smaller. The results confirmed that those respondents who have performed actions related to climate change in the past were more likely to answer “
Yes” to the WTP question. The importance of perceptions, attitudes, and actions described above was consistent with the results of other CV studies [
36].
Model 3 included the ranking of importance of climate change in the Australia variable. It showed that the less respondents thought it was an important issue the less were the odds that they would answer “Yes” to the valuation question.
Although perception, attitude, and action variables were significant predictors of the likelihood of respondents answering “
Yes” to the WTP question, coefficients for perceptions and attitudes had small effects on the odds of the “
Yes” answer. It is, therefore, instructive to investigate the differences in WTP by categories of responses to perceptions and attitudinal questions.
Table 5 shows that responses to the following questions were significant predictors of respondents’ choices to pay for emissions reduction (full model is shown in
Appendix A,
Table A4). The questions were Q2_3 “Decrease in water supply/more drought”, Q2_6 “Increase in economic costs”, Q5_1 “Climate change is NOT occurring”, Q5_9 “Climate change is an important issue because it will affect future generations”, Q5_11 “Australia makes a large contribution to the total global greenhouse gas emissions”, Q5_14 “Consumers should be paying for greenhouse gas emissions reduction”, Q6_1 “Purchased green energy”, and Q6_2 “Installed Solar/Wind”.
To check for multicollinearity, the VIF test was conducted. All values were between 1 and 5, indicating only a moderate correlation between a predictor variable and other predictor variables in the model. It was, however, not severe to investigate further [
71].
As expected, the higher bid amount negatively affected WTP. The year of the survey did not have a significant impact on respondents WTP, confirming findings by Williams [
68]. If respondents perceived that there would be a decrease in water supply, they were more likely to state that they were willing to pay more for emissions reduction. Similarly, those respondents who perceived that climate change would bring an increase in economic costs were more likely to state that they were willing to pay the presented bid amount. For example, the odds of those respondents (who selected “very large” in response to the question that climate change would have an effect on the decrease in water supply and more drought) to choose “
Yes” in response to WTP question were almost 14 times higher compared to respondents who selected “will not occur” in response to the question on water supply and drought.
Those respondents who disagreed with the statement that climate change was not occurring and perceived that it would affect future generations stated that they were willing to pay for emission reduction. Those respondents who strongly disagreed with the statement that “Australia makes a large contribution to the total global GHG emission” had odds less than 0.3 times of those who strongly agreed with this statement to choose “Yes” to the WTP question. Respondents who believed that consumers should be paying for emissions reduction were more likely to accept the proposed bid amount. Respondents who strongly disagreed with the statement that “Consumers should pay for emissions reduction” had odds only 0.1 times of those who strongly agreed with this statement to choose “Yes” to the WTP question.
Actions related to climate change, such as purchasing green energy, positively affected respondents’ WTP the proposed bid amount to reduce emissions. For example, respondents who purchased green energy had higher odds (1.7 times) to choose “Yes” to WTP question compared to those respondents who did not make such purchases in the past.
It is interesting to note that some attitudes and perceptions of climate change that changed significantly between 2009 and 2018 surveys were significant predictors of respondents WTP for renewable energy policy. These results indicate that when incorporating perceptions, attitudes, and past actions into non-market valuation models, care is needed to be taken when eliciting specific issues as respondents are more likely to relate to the change in environmental quality.
7. Summary and Conclusions
While emissions reductions and climate change policies have been in the focus of media for a long time, perceptions and attitudes of citizens could change, thus resulting in changes in the support of environmental policies. Most of the studies on links between attitudes, perceptions, and actions are general in nature, rather than focused on a specific product. Studies concerning emissions reduction and the adoption of renewable energy are less numerous. The focus of this study has been on examining the temporal stability of attitudes over time and their effect on respondents’ WTP for emissions reduction policies in Australia.
Given that the topic of climate change has been given considerable attention over the years, it was expected that respondents would have different attitudes towards climate change issues and the actions towards activities related to climate change would be different in 2018 compared to 2009. Supporting the findings of Capstick et al. [
56] this study found that the consumers’ perceptions, attitudes, and actions related to climate change had changed from 2009 to 2018. For example, the perception of increase in economic costs due to climate change grew larger in 2018 compared to the 2009 survey.
This study confirmed the findings by Pietsch and McAllister [
54] and Leviston et al. [
55]. More respondents perceived large impacts from climate change in 2018 compared to the 2009 survey. The results showed that
Climate Change was the least important issue for respondents in both years of the surveys, which was in contrast with findings by Roy Morgan [
59]. However, analysis indicated that
Climate Change became significantly more important in 2018 compared to the 2009 survey, the finding that was aligned with results from McAllister et al. [
58].
Understanding the factors that affect citizens’ support of emissions reduction policies is important in designing efficient environmental policies. Most analyses when using stated preference methods included demographic characteristics but rarely explored attitudes [
8]. This study explored the effects of attitudes on WTP for emissions reduction policy over time. While some perceptions and attitudes changed over time significantly, most perceptions and attitudes that affected WTP exhibit temporal stability during this time period (see
Table 1). This study partially confirmed Whitehead and Hoban [
28] results, finding that while the change in attitudes were significant over the 10-year period between surveys, WTP values were not affected to the same extent. Although some perceptions did not change (such as regarding the effect of climate change on drought) they were significant predictors of the WTP of respondents for emissions reduction. Additionally, believing in occurrence and importance of climate change, as well as agreeing with consumers’ responsibility to reduce GHG emissions did not change over the 10 years between surveys, but all were significant predictors of WTP.
This study supported literature connecting environmental concerns and WTP for emissions reduction, renewable energy, or support environmental policy. It confirmed relationships between WTP and some socio-economic variables, such as income, gender, and education. An important part of the analysis was to quantify the impact of variables on WTP. The results showed significant impacts of education, perceptions, attitudes, and actions on respondents WTP for emissions reduction. However, it showed that past actions related to climate change had a stronger effect on the stated WTP compared to the respondents’ perceptions and attitudes. Further analysis revealed the relative strength of these impacts on WTP, highlighting that the intensity of perceptions and attitudes towards climate change influenced respondents’ WTP. These findings have important implications for the policy design. It is important to increase public awareness and education with respect to climate change, so that the public has more knowledge and relies less on subjective attitudes and perceptions. Furthermore, findings showed that respondents’ perceptions and attitudes towards several issues, including more droughts and potential impacts on future generations, did not change but had a strong effect on their WTP. Therefore, the identification of public concerns regarding various effects of climate change is important in designing a successful environmental policy.
The findings emphasised the complexity of the relationship amongst perceptions, attitudes, actions, and stated WTP for environmental policies. Limitations of this study include the focus on one Australian state. Respondents in other states might have different attitudes and perceptions towards climate change and, therefore, different WTP for emissions reduction. Furthermore, the survey was taken 10 years apart without continuous monitoring changes in attitudes and perceptions towards climate change. Future research can explore more in-depth respondents’ attitudes and perceptions while categorising them in different groups in relation to their attitudes and perceptions towards climate change and WTP for emissions reduction and adoption of renewable energy.


