
IoT-Based Low-Cost Photovoltaic Monitoring for a Greenhouse Farm in an Arid Region


Abstract
:1. Introduction
- -
- Wi-Fi module 8266 is the most used device to upload and visualize data into a platform
- -
- The main collected data are DC current, DC voltage, module temperature, and solar irradiance
- -
- Most developed IoT-based monitoring systems are cost effective, where the cost ranges between 39–300 USD.
- -
- Arduino is the most employed microcontroller to develop the monitoring code.
- -
- Based on the previous literature review, the research gaps can be summarized as follows:
- -
- Most available IoT-based PV monitoring systems lack of fault detection and diagnosis procedure and mainly used to only monitor data.
- -
- Existing IoT-based monitoring systems are not evaluated under climatic conditions characterized by severe sandstorms.
- -
- The mostly used communication technology are the Wi-Fi, Zigbee, and GPS. Each of them has a different performance in power consumption, distance covering, and cost.
- -
- Develop a low-cost, portable IoT-based PV monitoring system that can be easily extended to other applications in control and PV systems characterization.
- -
- Integrate a PV fault diagnosis procedure in order to detect failures that may occur in the PV module.
- -
- Study and verify the feasibility of providing electricity to a mini greenhouse farm at isolated arid area (Sahara of Algeria) under high temperature in summer and sandstorms phenomena.
2. Materials and Methods
2.1. Photovoltaic System Description
2.2. Greenhouse System Description
| Algorithm 1: Setting a suitable temperature |
| Step #1: Measure air temperature (Tm) Step #2: Compare the measured (Tm) with the reference temperature (Tref), ΔT = Tm-Tref If not (−2 °C < ΔT < 2 °C) then If T > 2 then Open relay #1, open heating system with a delay of 3 min else open relay #2, open cooling system with a delay of 5 min endif endif Step#3: Display the results |
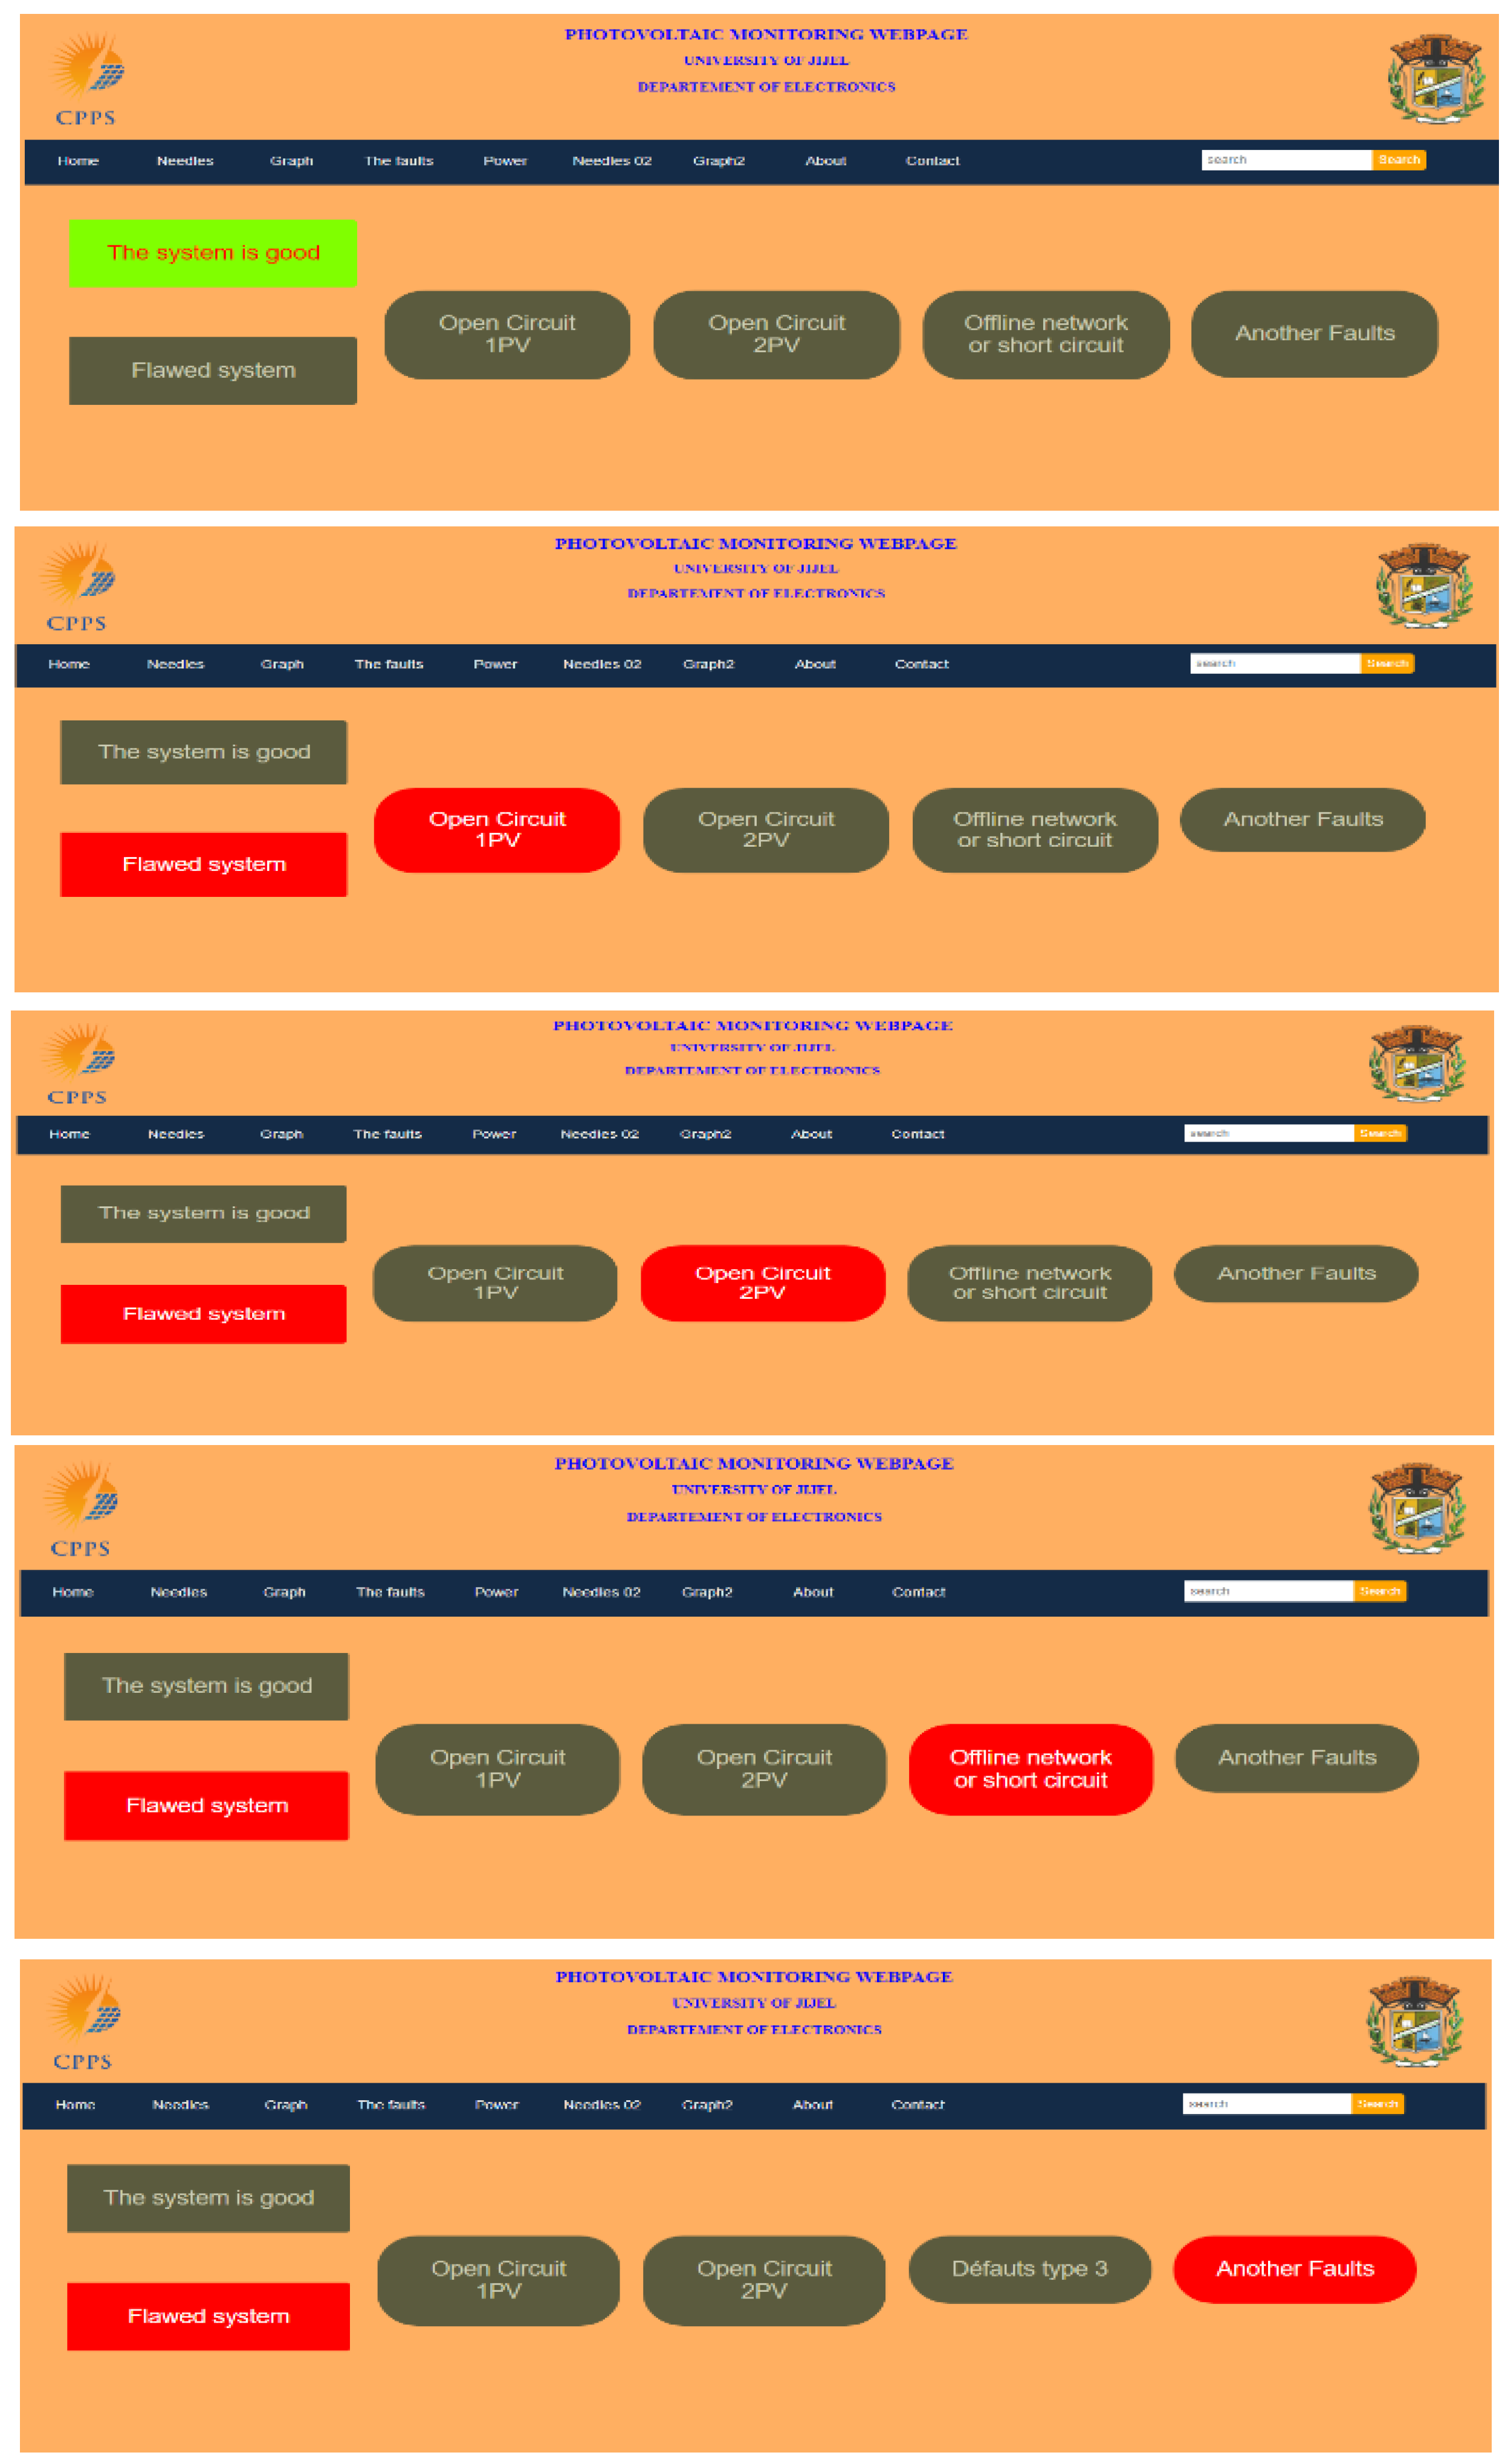
2.3. IoT-Based PV Monitoring System Description
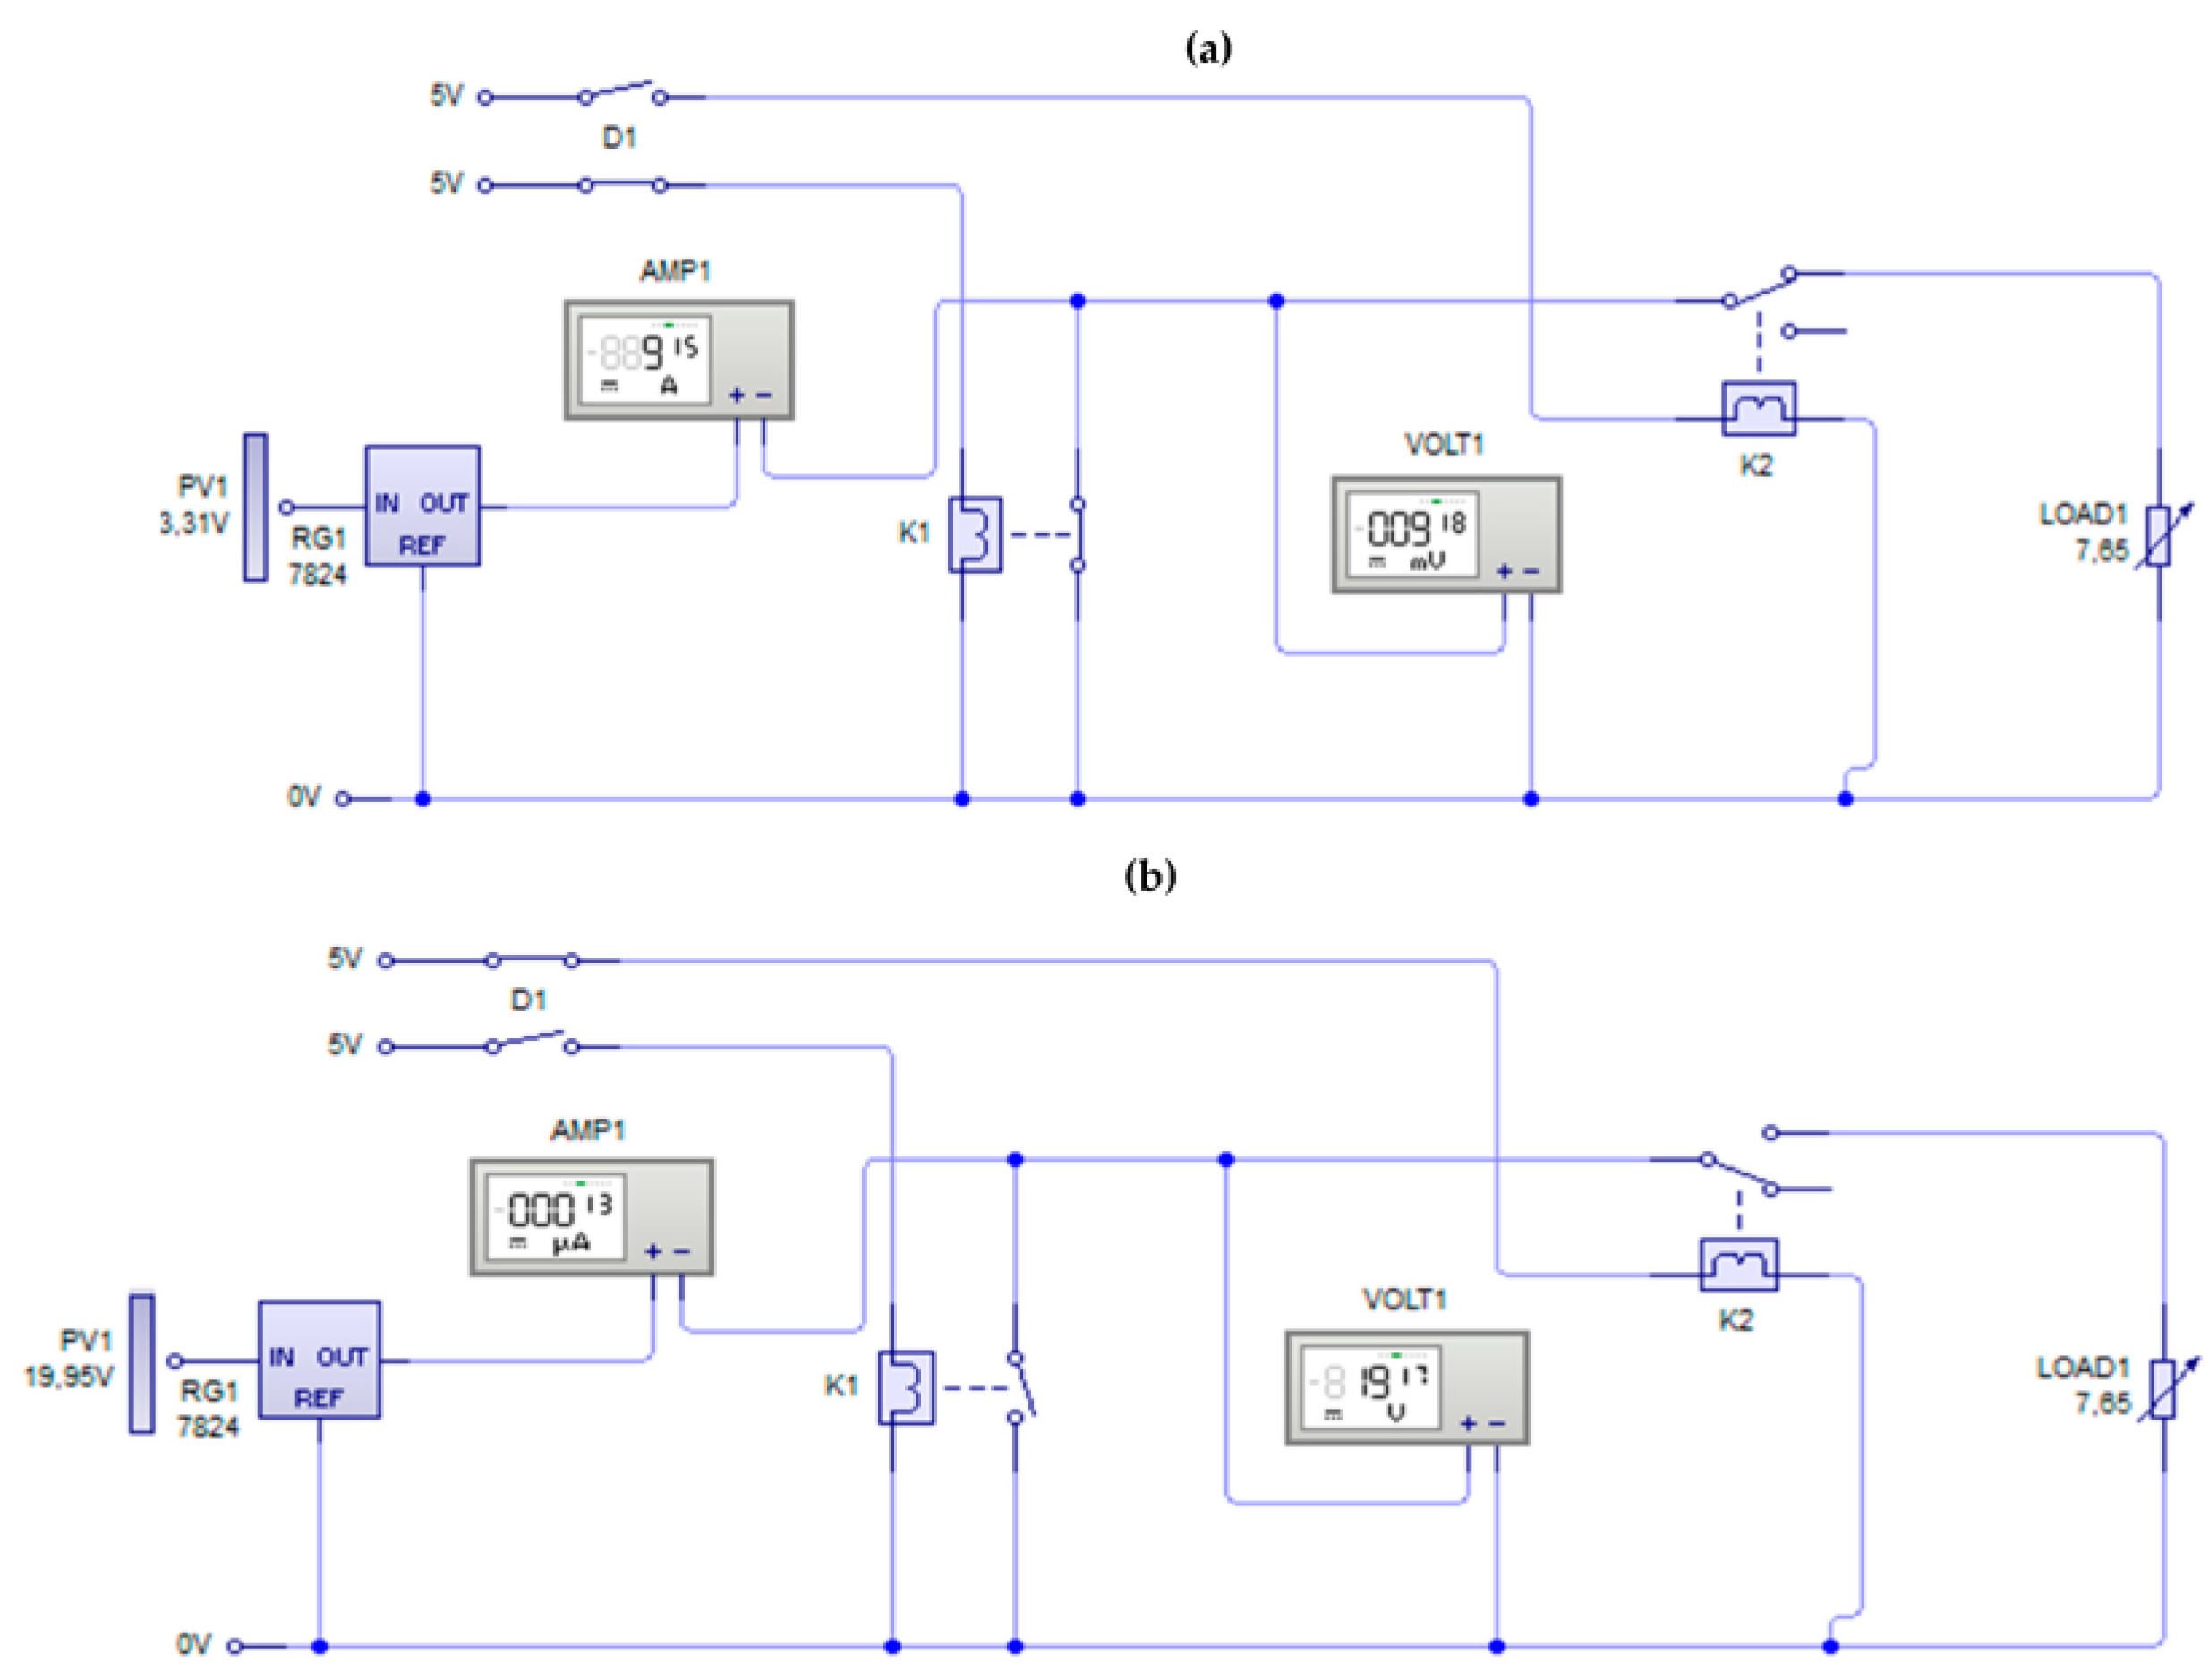
2.4. Fault Detection Procedure
| Algorithm 2: The developed fault detection and diagnosis procedure |
| Step #1: Read solar irradiance, cell temperature, Ipv, and Vpv Step #2: Compare the measured power Pm= Ipv*Vpv with the one estimated based on one diode model Pe, (∆P = Pm-Pe), if ∆P > = Thp then move to step #3 else move to step #1. endif Step #3: Open relay K2 and measure the Vocm Step #4: Compare the measured Vocm with the one calculated Voce, if (∆Voc > Thv) then if ∆Voc = Thv then send SMS (Shading effect: dust or sand accumulate), else send SMS (Short-circuited or all PV modules are disconnected) endif else open relay K1 and measure Iscm calculated ∆Isc = Iscm-Isce if 0.45 < ∆Isc < 0.55 then send SMS (PV module disconnected) else send SMS (short circuited) endif endif |
3. Results and Discussion
3.1. Experimental Results
3.2. Discussion
| Algorithm 3: The errors detection procedure |
| ∆P = Pmax_m − Pmax_e If ∆P > Thp then default = true else default = false endif |
3.3. Advantages and Limits of the Designed IoT-Based Monitoring System
4. Conclusions and Perspectives
Author Contributions
Funding
Data Availability Statement
Acknowledgments
Conflicts of Interest
Appendix A

| Components | Specifications | Cost (€) |
|---|---|---|
| Current sensor (ACS 711) |
| 5 |
| Voltage sensor |
| 3 |
| Temperature sensor (AM2302) |
| 3 |
| Reference solar cell Si-V-1.5TC |
| 15 |
| Microcontroller Atmega2560 |
| 12 |
| Wi-Fi module Esp8266 |
| 6 |
| GSM Module sim800l |
| 10 |
| Relay | Maxtor (30 A;12 V), Module 4 relay 5 V, 10 A | 7 |
| LCD | LCD16 × 4 | 6 |
| Electronics components | Diode, resistor, capacitor, transistor | 5 |
| Total | 73 | |
References
- Available online: https://www.iea.org/reports/sdg7-data-and-projections/access-to-electricity (accessed on 15 May 2022).
- Available online: https://iea-pvps.org/snapshot-reports/snapshot-2022/ (accessed on 22 April 2022).
- Available online: https://www.iea.org/reports/africa-energy-outlook-2022 (accessed on 15 June 2022).
- Zhao, Y.; De Palma, J.F.; Mosesian, J.; Lyons, R.; Lehman, B. Line–line fault analysis and protection challenges in solar photovoltaic arrays. IEEE Trans. Ind. Electron. 2012, 60, 3784–3795. [Google Scholar] [CrossRef]
- Cancelliere, P. PV electrical plants fire risk assessment and mitigation according to the Italian national fire services guidelines. Fire Mater. 2016, 40, 355–367. [Google Scholar] [CrossRef]
- Firth, S.K.; Lomas, K.J.; Rees, S.J. A simple model of PV system performance and its use in fault detection. Solar Energy 2010, 84, 624–635. [Google Scholar] [CrossRef]
- Lundqvist, M.; Helmke, C.; Ossenbrink, H.A. ESTI-LOG PV plant monitoring system. Sol. Energy Mater. Sol. Cells 1997, 47, 289–294. [Google Scholar] [CrossRef]
- Benghanem, M.; Maafi, A. Data acquisition system for photovoltaic systems performance monitoring. IEEE Trans. Instrum. Meas. 1998, 47, 30–33. [Google Scholar] [CrossRef]
- Koutroulis, E.; Kalaitzakis, K. Development of an integrated data-acquisition system for renewable energy sources systems monitoring. Renew. Energy 2003, 28, 139–152. [Google Scholar] [CrossRef]
- Kalaitzakis, K.; Koutroulis, E.; Vlachos, V. Development of a data acquisition system for remote monitoring of renewable energy systems. Measurement 2003, 34, 75–83. [Google Scholar] [CrossRef]
- Tina, G.M.; Grasso, A.D. Remote monitoring system for stand-alone photovoltaic power plants: The case study of a PV-powered outdoor refrigerator. Energy Convers. Manag. 2014, 78, 862–871. [Google Scholar] [CrossRef]
- López-Vargas, A.; Fuentes, M.; García, M.V.; Muñoz-Rodríguez, F.J. Low-Cost datalogger intended for remote monitoring of solar photovoltaic standalone systems based on ArduinoTM. IEEE Sens. J. 2019, 19, 4308–4320. [Google Scholar] [CrossRef]
- Benghanem, M.; Mellit, A.; Emad, M.; Aljohani, A. Monitoring of Solar Still Desalination System Using the Internet of Things Technique. Energies 2021, 14, 6892. [Google Scholar] [CrossRef]
- Mellit, A.; Benghanem, M.; Herrak, O.; Messalaoui, A. Design of a Novel Remote Monitoring System for Smart Greenhouses Using the Internet of Things and Deep Convolutional Neural Networks. Energies 2021, 14, 5045. [Google Scholar] [CrossRef]
- Sutikno, T.; Purnama, H.S.; Pamungkas, A.; Fadlil, A.; Alsofyani, I.M.; Jopri, M.H. Internet of things-based photovoltaics parameter monitoring system using NodeMCU ESP8266. Int. J. Electr. Comput. Eng. 2021, 11, 62088–68708. [Google Scholar] [CrossRef]
- Prasetyo, H. On-grid photovoltaic system power monitoring based on open source and low-cost internet of things platform. J. Nov. Carbon Resour. Sci. Green Asia Strategy 2021, 8, 98–106. [Google Scholar] [CrossRef]
- Zago, R.M.; Fruett, F. A low-cost solar generation monitoring system suitable for internet of things. In Proceedings of the 2017 2nd International Symposium on Instrumentation Systems, Circuits and Transducers (INSCIT), Fortaleza, Brazil, 28 August–1 September 2017; pp. 1–6. [Google Scholar] [CrossRef]
- Paredes-Parra, J.M.; García-Sánchez, A.J.; Mateo-Aroca, A.; Molina-García, Á. An alternative internet-of-things solution based on LoRa for PV power plants: Data monitoring and management. Energies 2019, 12, 881. [Google Scholar] [CrossRef]
- Qureshi, F.A.; Uddin, Z.; Satti, M.B.; Ali, M. ICA-based solar photovoltaic fault diagnosis. Int. Trans. Electr. Energy Syst. 2020, 30, 12456. [Google Scholar] [CrossRef]
- Gupta, V.; Sharma, M.; Pachauri, R.K.; Babu, K.D. A low-cost real-time IoT enabled data acquisition system for monitoring of PV system. Energy Sources Part A: Recovery Util. Environ. Eff. 2021, 43, 2529–2543. [Google Scholar] [CrossRef]
- Kim, M.S.; Kim, D.H.; Kim, H.J.; Prabakar, K. A Novel Strategy for Monitoring a PV Junction Box Based on LoRa in a 3 kW Residential PV System. Electronics 2022, 11, 709. [Google Scholar] [CrossRef]
- Kaly, M.S.; Kilic, B.; Mellit, A.; Oral, B.; Saglam, S. IoT-based data acquisition and remote monitoring system for large-scale photovoltaic plants. In Proceedings of the IoT-Based Data Acquisition and Remote Monitoring System for Large-Scale Photovoltaic Plants, Saidia, Mrorocco, 20–22 May 2022. [Google Scholar]
- Ahsan, L.; Baig, M.J.; Iqbal, M.T. Low-Cost, Open-Source, Emoncms-Based SCADA System for a Large Grid-Connected PV System. Sensors 2022, 22, 6733. [Google Scholar] [CrossRef]
- Emamian, M.; Eskandari, A.; Aghaei, M.; Nedaei, A.; Sizkouhi, A.M.; Milimonfared, J. Cloud Computing and IoT Based Intelligent Monitoring System for Photovoltaic Plants Using Machine Learning Techniques. Energies 2022, 15, 3014. [Google Scholar] [CrossRef]
- Kalay, M.Ş.; Kılıç, B.; Sağlam, Ş. Systematic review of the data acquisition and monitoring systems of photovoltaic panels and arrays. Solar Energy 2022, 244, 47–64. [Google Scholar] [CrossRef]
- Wiesinger, F.; Sutter, F.; Fernández-García, A.; Wette, J.; Hanrieder, N. Sandstorm erosion on solar reflectors: A field study on height and orientation dependence. Energy 2021, 217, 119351. [Google Scholar] [CrossRef]
- Alshawaf, M.; Poudineh, R.; Alhajeri, N.S. Solar PV in Kuwait: The effect of ambient temperature and sandstorms on output variability and uncertainty. Renew. Sustain. Energy Rev. 2020, 134, 110346. [Google Scholar] [CrossRef]
- Available online: https://www.nomaddesertsolar.com/the-desert-solar-challenge.html (accessed on 22 April 2022).
- Zaghba, L.; Khennane, M.; Fezzani, A.; Borni, A.; Mahammed, I.H. Experimental outdoor performance evaluation of photovoltaic plant in a Sahara environment (Algerian desert). Int. J. Ambient. Energy 2022, 43, 314–324. [Google Scholar] [CrossRef]
- Alghamdi, A.S.; Bahaj, A.S.; Blunden, L.S.; Wu, Y. Dust removal from solar PV modules by automated cleaning systems. Energies 2019, 12, 2923. [Google Scholar] [CrossRef]
- Mostefaoui, M.; Ziane, A.; Bouraiou, A.; Khelifi, S. Effect of sand dust accumulation on photovoltaic performance in the Saharan environment: Southern Algeria (Adrar). Environ. Sci. Pollut. Res. 2019, 26, 259–268. [Google Scholar] [CrossRef] [PubMed]
- Mellit, A.; Kalogirou, S. Artificial intelligence and internet of things to improve efficacy of diagnosis and remote sensing of solar photovoltaic systems: Challenges, recommendations and future directions. Renew. Sustain. Energy Rev. 2021, 143, 110889. [Google Scholar] [CrossRef]
- Hamied, A.; Mellit, A.; Zoulid, M.A.; Birouk, R. IoT-based experimental prototype for monitoring of photovoltaic arrays. In Proceedings of the International Conference on Applied Smart Systems (ICASS), Medea, Algeria, 24–25 November 2018; Volume 24, pp. 1–5. [Google Scholar] [CrossRef]
- Mellit, A.; Hamied, A.; Lughi, V.; Pavan, A.M. A low-cost monitoring and fault detection system for stand-alone photovoltaic systems using IoT technique. In ELECTRIMACS; Springer: Cham, Switzerland, 2020; pp. 349–358. [Google Scholar] [CrossRef]
- Hamied, A.; Boubidi, A.; Rouibah, N.; Chine, W.; Mellit, A. IoT-based smart photovoltaic arrays for remote sensing and fault identification. In International Conference in Artificial Intelligence in Renewable Energetic Systems; Springer: Cham, Switzerland, 2019; pp. 478–486. [Google Scholar] [CrossRef]
- Khan, M.S.; Sharma, H.; Haque, A. IoT enabled real-time energy monitoring for photovoltaic systems. In Proceedings of the 2019 International Conference on Machine Learning, Big Data, Cloud and Parallel Computing (COMITCon), Greater Noida, India, 18–19 October 2019; Volume 14, pp. 323–327. [Google Scholar]
- Xia, K.; Ni, J.; Ye, Y.; Xu, P.; Wang, Y. A real-time monitoring system based on ZigBee and 4G communications for photovoltaic generation. CSEE J. Power Energy Syst. 2020, 6, 52–63. [Google Scholar]
- Ul Mehmood, M.; Ulasyar, A.; Ali, W.; Zeb, K.; Zad, H.S.; Uddin, W.; Kim, H.J. A New Cloud-Based IoT Solution for Soiling Ratio Measurement of PV Systems Using Artificial Neural Network. Energies 2023, 16, 996. [Google Scholar] [CrossRef]
- Pavan, A.M.; Vergura, S.; Mellit, A.; Lughi, V. Explicit empirical model for photovoltaic devices. Experimental validation. Solar Energy 2017, 155, 647–653. [Google Scholar] [CrossRef]


| Ref./Year | System/Monitored Parameters | The Used Devices | Platform/Type of Network | Cost or Complexity | Power Consumed Wh/Day | Region |
|---|---|---|---|---|---|---|
| [33] 2018 | PV module Air temperature, DC current, DC voltage and light intensity | Arduino Mega | Webpage locally hosted Wi-Fi module 8266 | € 75 Easy | N/A | North of Algeria |
| [18] 2019 | Grid-connected PV Air temperature, DC current, DC voltage, solar irradiance and DC power | Raspberry PI | - LoRa | 39.26 EUR easy | N/A | South of Spain |
| [36] 2019 | PV module Current and voltage at the maximum power | Arduino Uno | ThingSpeak IoT Wi-Fi module 8266 | Easy and low-cost | N/A | North of India |
| [34] 2020 | PV module Air temperature, cell temperature, DC current, DC voltage and solar irradiance | Arduino Mega | ThingSpeak IoT Wi-Fi module 8266 | 80 EUR Relatively easy | N/A | North of Algeria |
| [37] 2020 | Grid-connected PV DC power | N/A | Web visual interface in HTML ZigBee module 4G getway | N/A | N/A | East of China |
| [20] 2021 | PV module Air temperature, relative humidity, dust density, wind speed and solar irradiance | N/A | Blynk App NodMCU ESP8266 | 300 USD | N/A | North of India |
| [22] 2022 | PV module Air temperature, DC current, DC voltage and solar irradiance | Arduino Nano | LoRa | Low power and low cost 18.72 USD | 6.11 | North of Turkey |
| [38] 2023 | PV string Air temperature, intensity light, DC current and DC voltage | Arduino Mega | NodMCU ESP8266 | Low-cost Relatively complex | N/A | North pf Pakistan |
| Module type | 100 P (36) |
| Maximal power | 100 W |
| Tolerance | ±3% |
| Voltage at Pmax (Vmp) | 17.45 V |
| Current at Pmax (Imp) | 5.73 A |
| Open-circuit voltage (Voc) | 21.87 V |
| Short-circuit current (Isc) | 5.98 A |
| Components | Specifications | Cost (€) |
|---|---|---|
| Cooling and heating circuit | Peltier Plate Module 12706 Thermoelectric Cooler | 5 |
| Half-cycle electric motor | Motor 180° 12 VDC | 10 |
| Exhaust fan | Fan 12 VDC | 4 |
| Linear drive | Motor 12 VDC | 5 |
| Aluminum angle tube | Tube 10*10*600 | 6 |
| Total | 30 | |
| Sensors/Component | Current Drawn (mA) | Time of Use | Consumed Energy per Hour (Wh) | Consumed Energy per Day Wh/day |
|---|---|---|---|---|
| Voltage sensor | 8 | 10 h | 0.048 | 0.48 |
| Current sensor | 10 | 10 h | 0.050 | 0.50 |
| Temperature sensor | 2.5 | 10 h | 0.085 | 0.85 |
| Wi-Fi module ESP8266 | 80 | 10 s per min | 0.25 | 3.75 |
| Arduino Mega | 79 | 10 h | 0.45 | 4.50 |
| Solar irradiance | - | - | - | - |
| GSM module sim800l | 80 | One per 10 h | 0.50 | 0.50 |
| LCD4 × 16 | 20 | 10 s per min | 0.15 | 2.25 |
| Relay | 90 | twice per 10 h | 0.65 | 0.65 |
| Total | 13.48 | |||
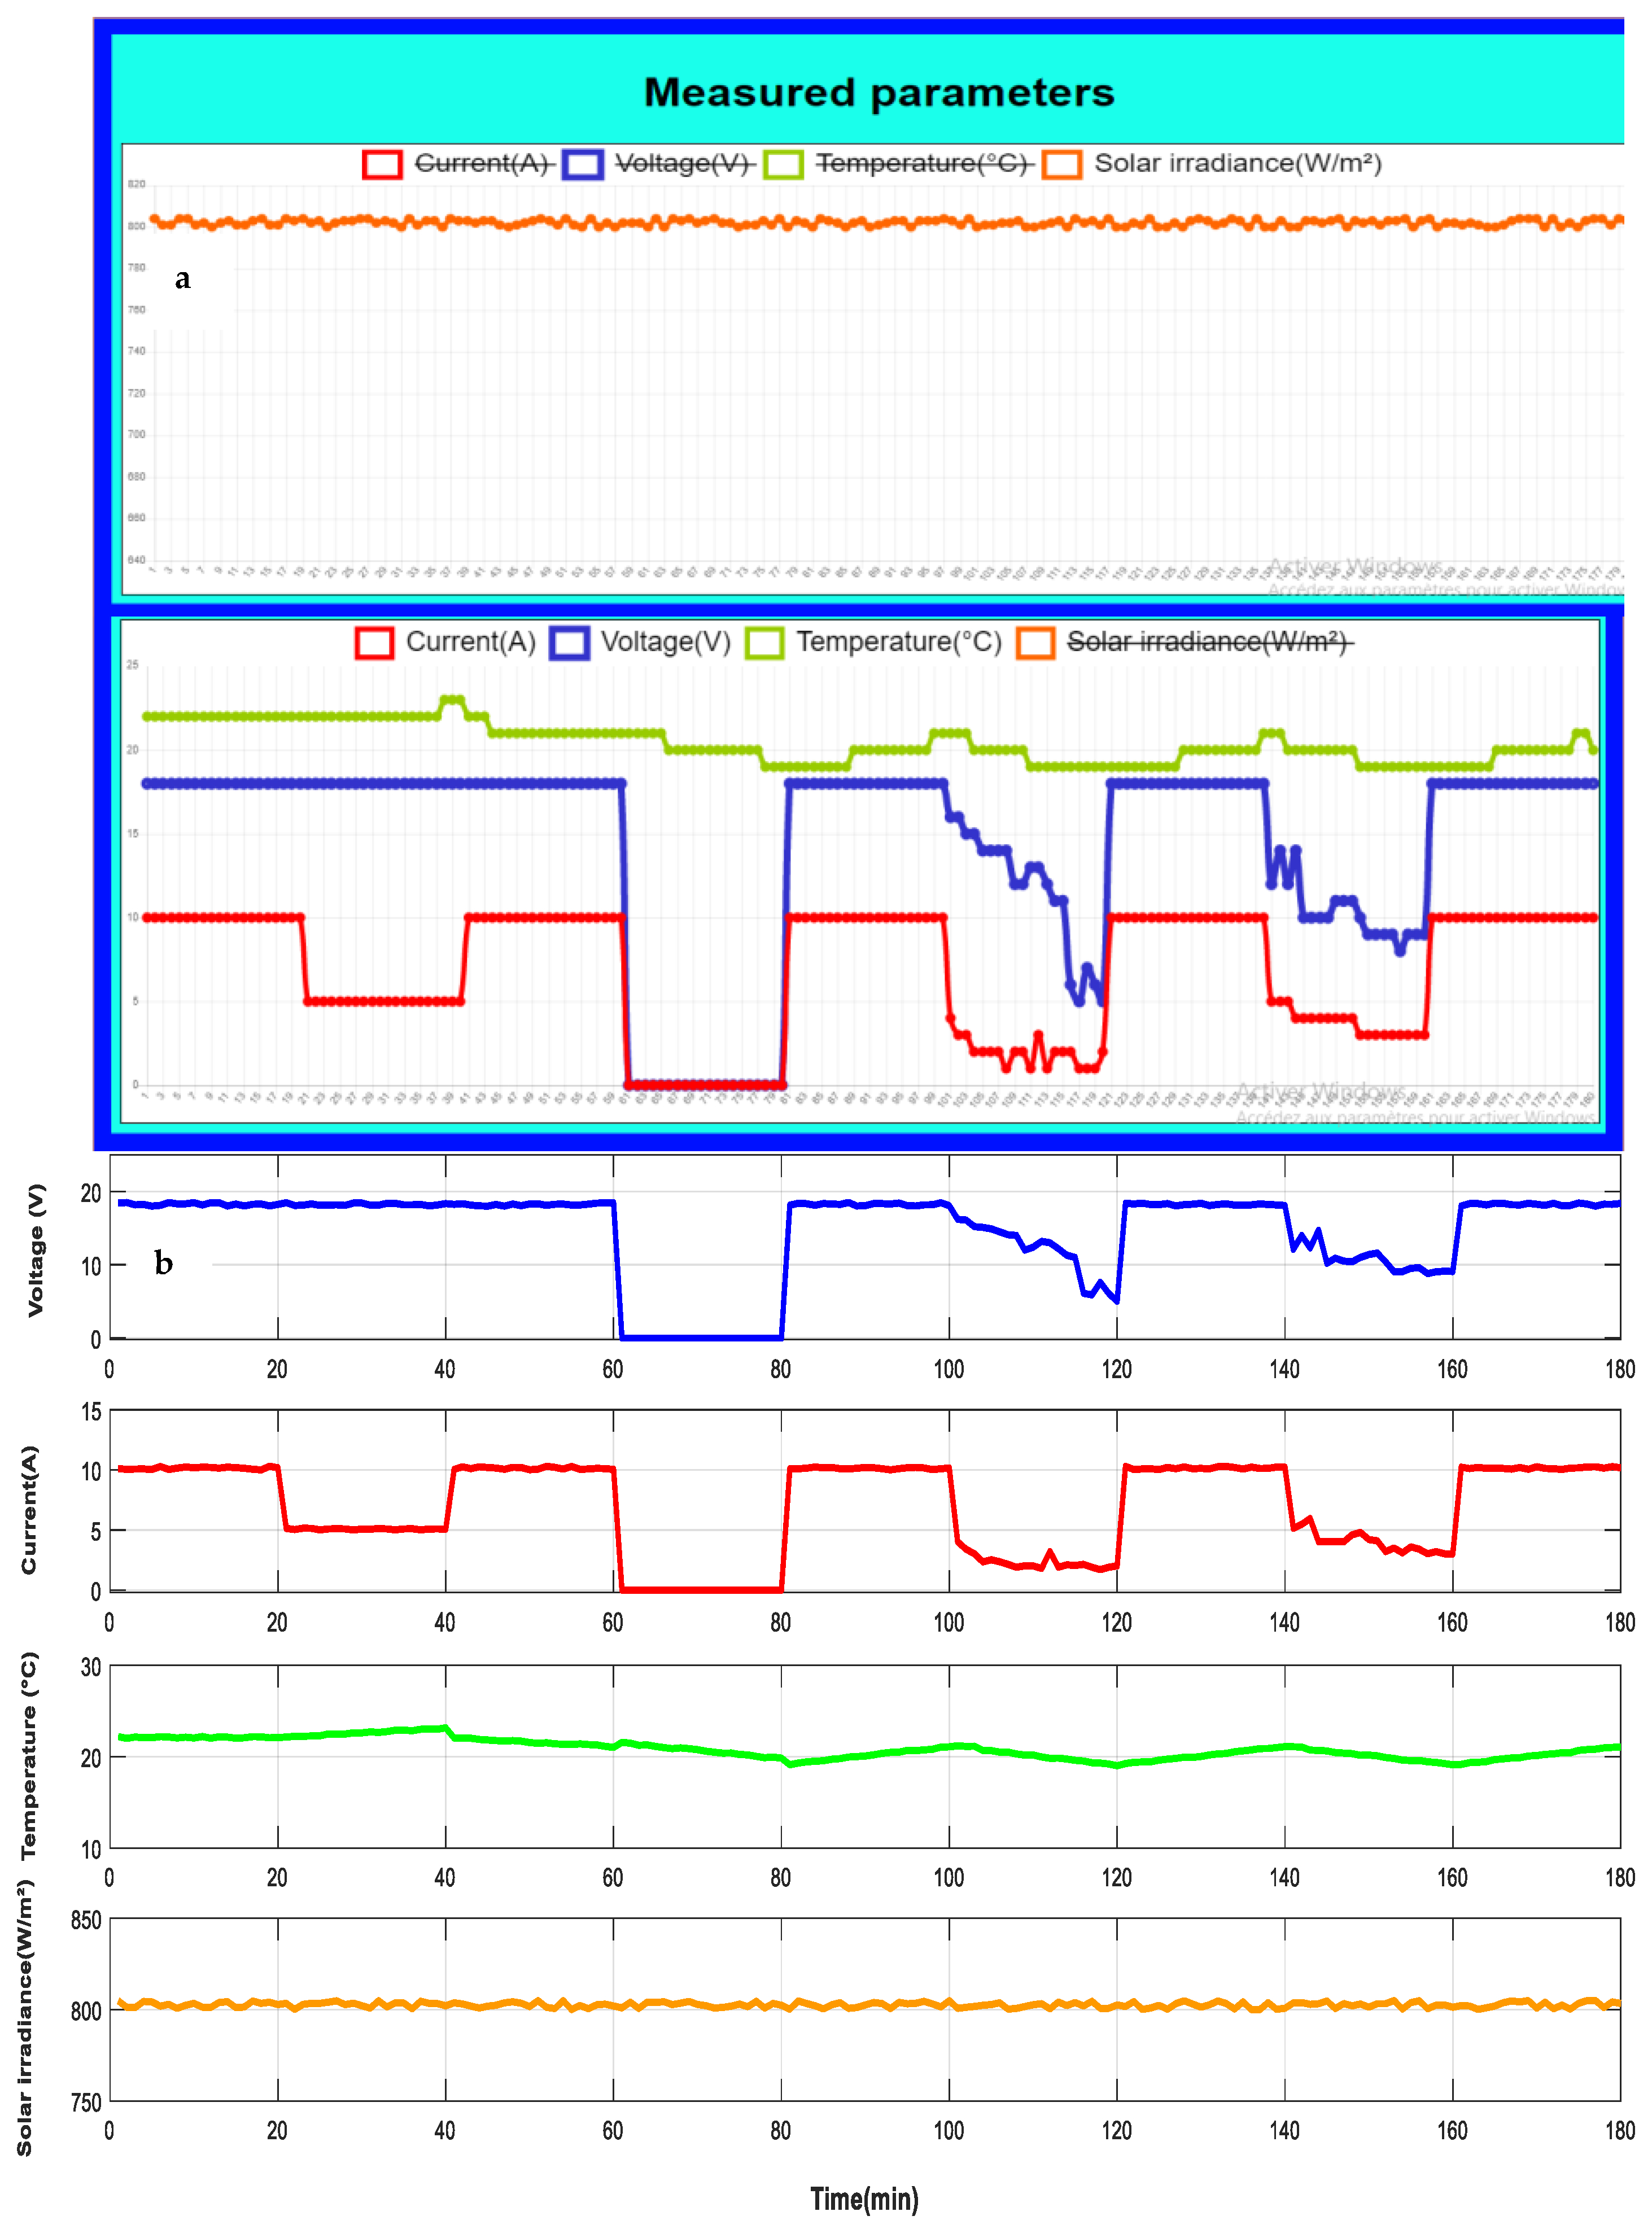
| Zone | Time (min) | System Status |
|---|---|---|
| Z1 | 0–20 | It works normally |
| Z2 | 20–40 | Defective system (a single PV module separated) |
| Z3 | 40–60 | It works normally |
| Z4 | 60–80 | Defective system (total separation of PV panels) |
| Z5 | 80–100 | It works normally |
| Z6 | 100–120 | Faulty system (a significant part of the PV panels is covered, despite the clear weather) |
| Z7 | 120–140 | It works normally |
| Z8 | 140–160 | Faulty system (sand deposit on the surface of the PV panels) |
| Z9 | 160–180 | It works normally |
| Advantages | Limits |
|---|---|
|
|
Disclaimer/Publisher’s Note: The statements, opinions and data contained in all publications are solely those of the individual author(s) and contributor(s) and not of MDPI and/or the editor(s). MDPI and/or the editor(s) disclaim responsibility for any injury to people or property resulting from any ideas, methods, instructions or products referred to in the content. |
© 2023 by the authors. Licensee MDPI, Basel, Switzerland. This article is an open access article distributed under the terms and conditions of the Creative Commons Attribution (CC BY) license (https://creativecommons.org/licenses/by/4.0/).
Share and Cite
Hamied, A.; Mellit, A.; Benghanem, M.; Boubaker, S. IoT-Based Low-Cost Photovoltaic Monitoring for a Greenhouse Farm in an Arid Region. Energies 2023, 16, 3860. https://doi.org/10.3390/en16093860
Hamied A, Mellit A, Benghanem M, Boubaker S. IoT-Based Low-Cost Photovoltaic Monitoring for a Greenhouse Farm in an Arid Region. Energies. 2023; 16(9):3860. https://doi.org/10.3390/en16093860
Chicago/Turabian StyleHamied, Amor, Adel Mellit, Mohamed Benghanem, and Sahbi Boubaker. 2023. "IoT-Based Low-Cost Photovoltaic Monitoring for a Greenhouse Farm in an Arid Region" Energies 16, no. 9: 3860. https://doi.org/10.3390/en16093860