
Flow Characteristics and Parameter Influence of the Under-Expansion Jet on Circulation Control Airfoil

Abstract
:1. Introduction
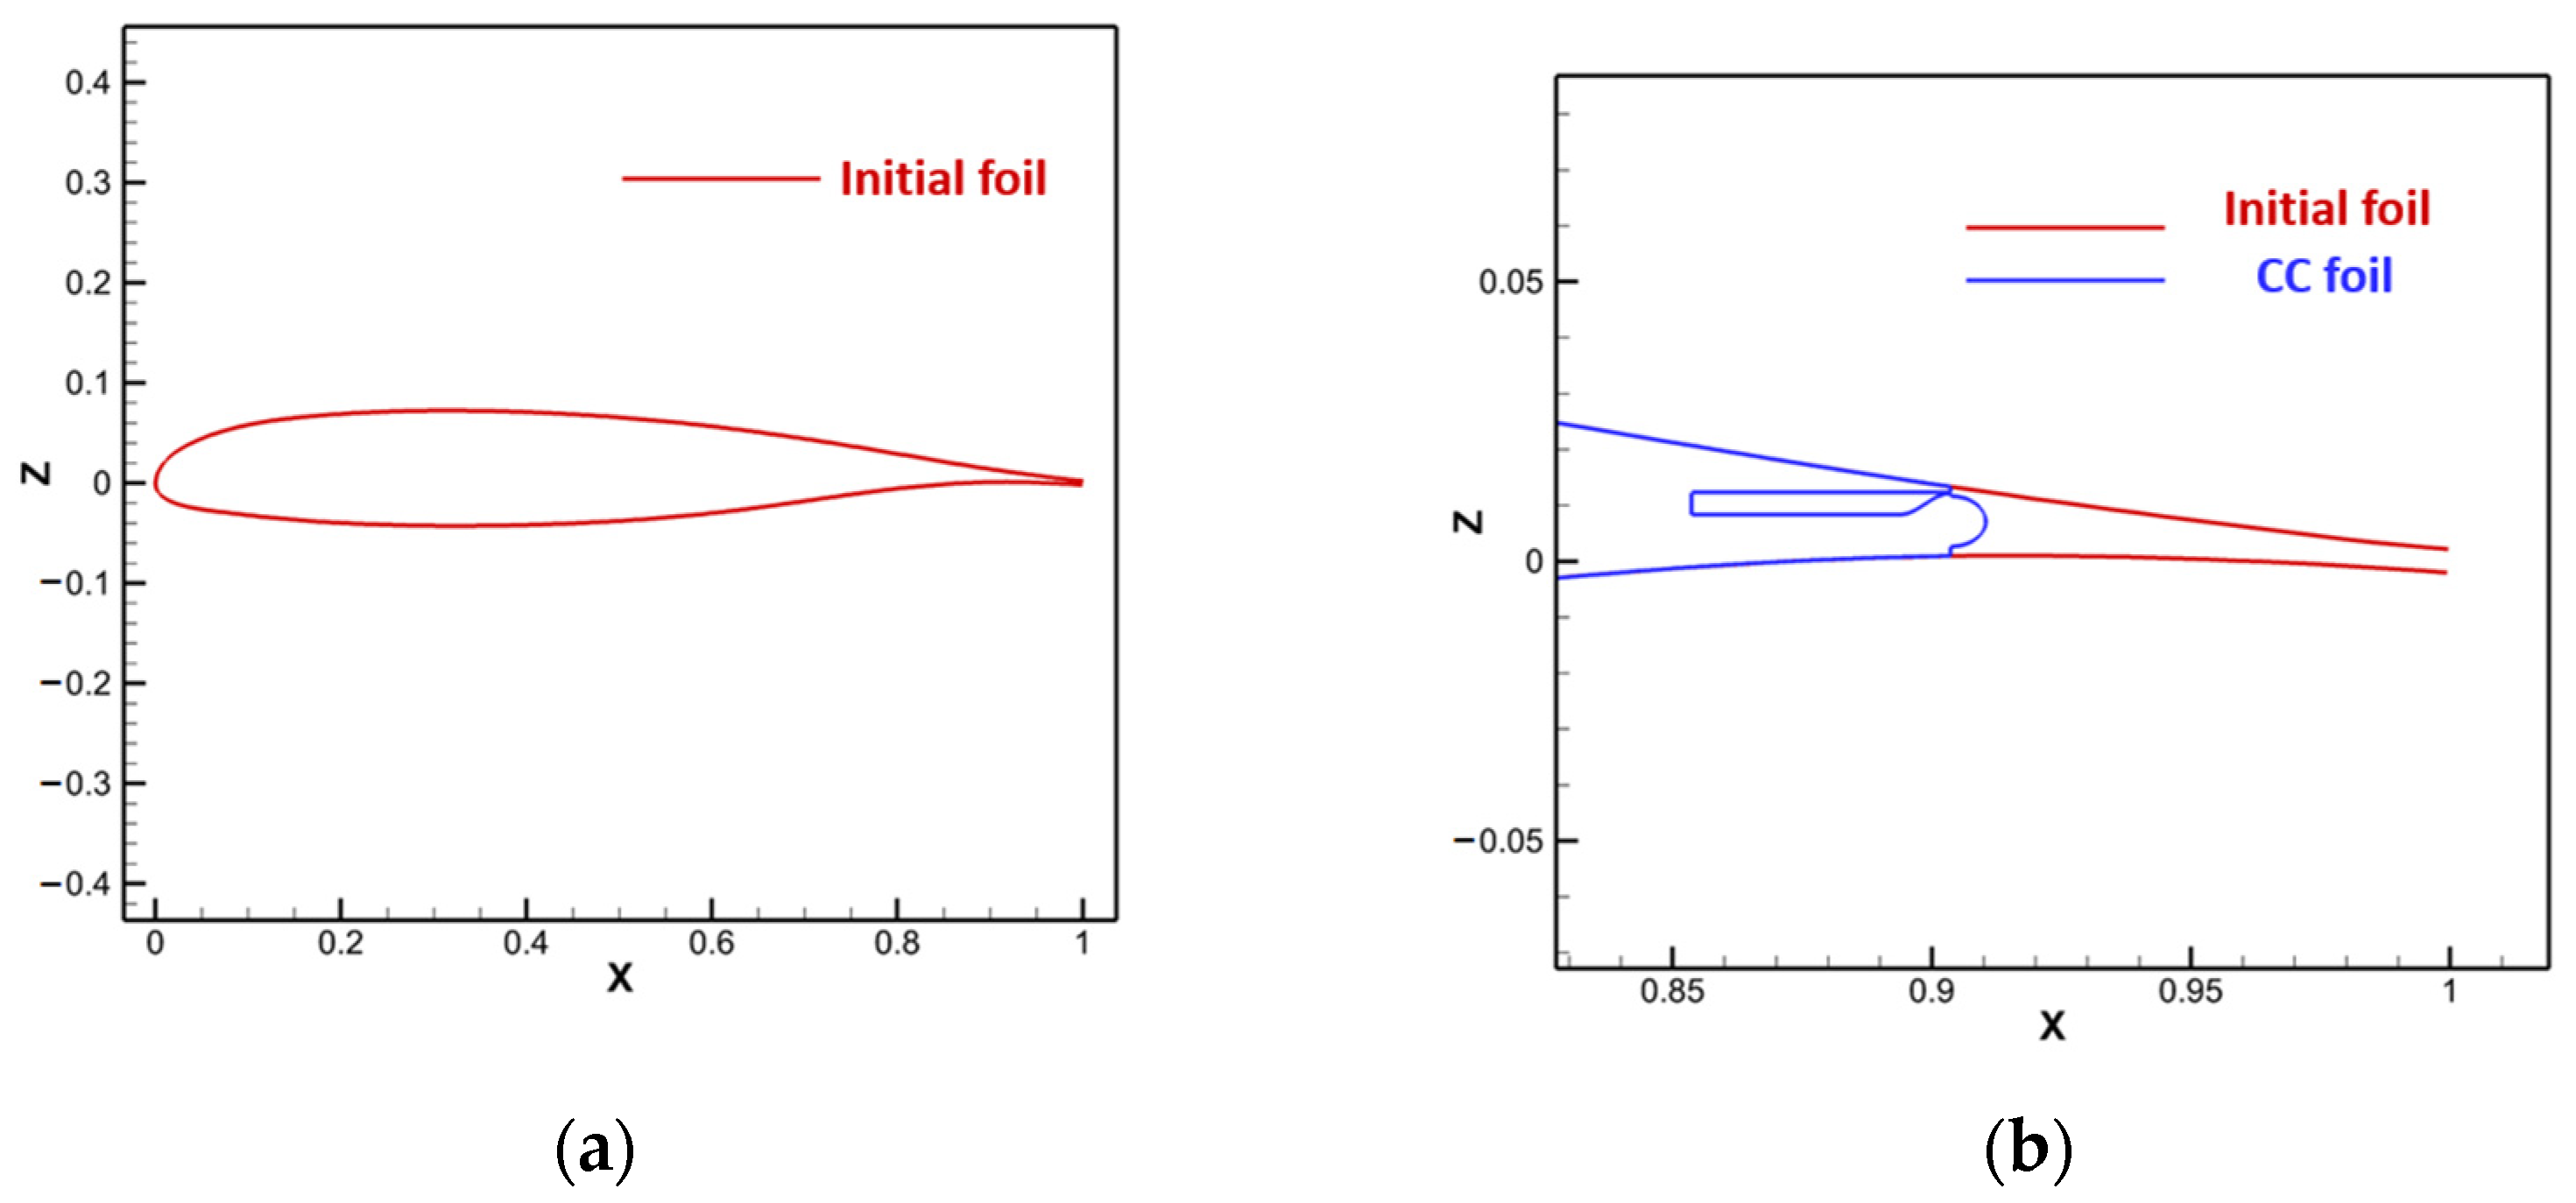
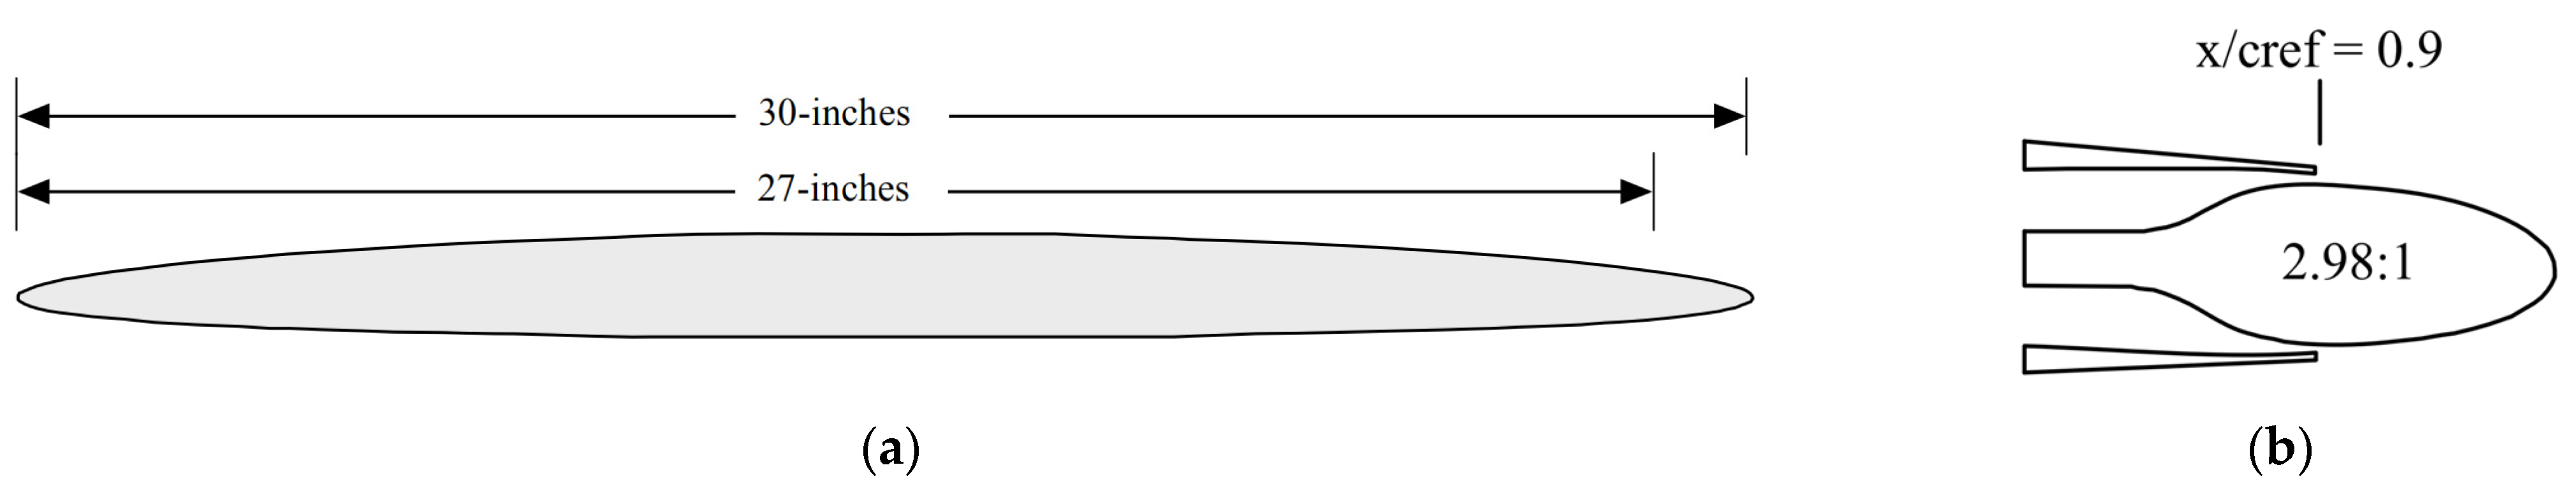
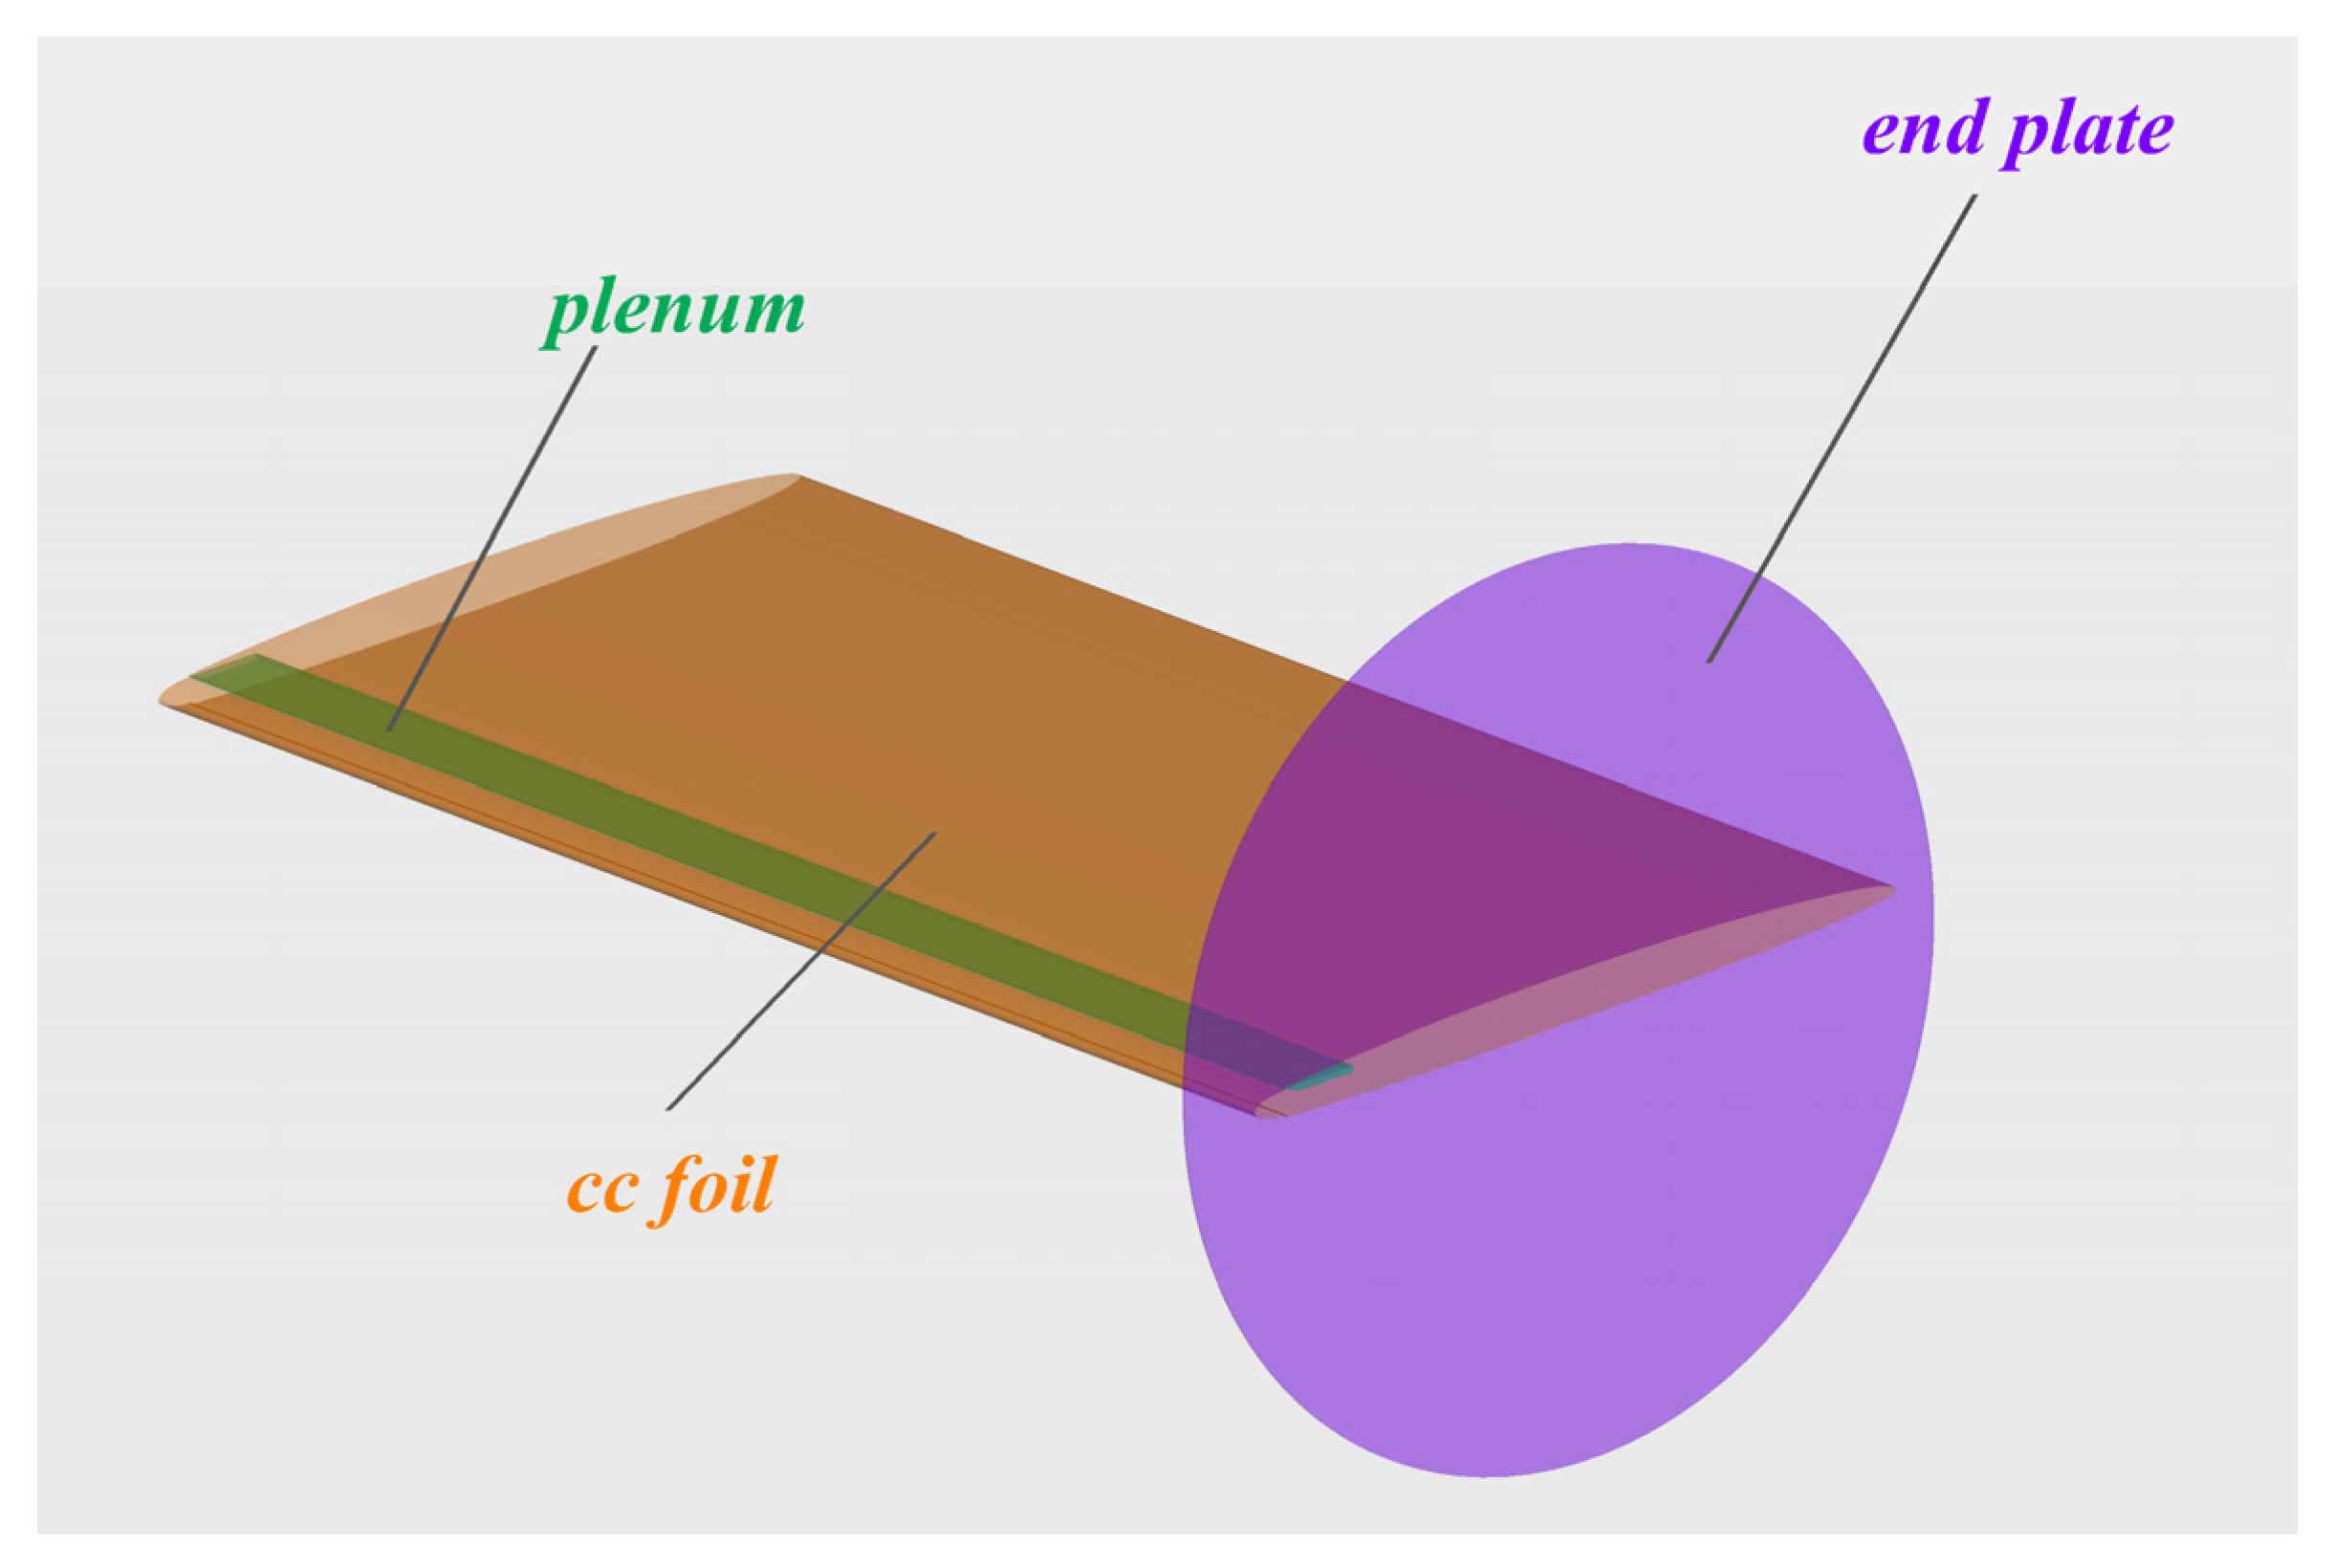
2. CC Airfoil
3. Numerical Solution Method
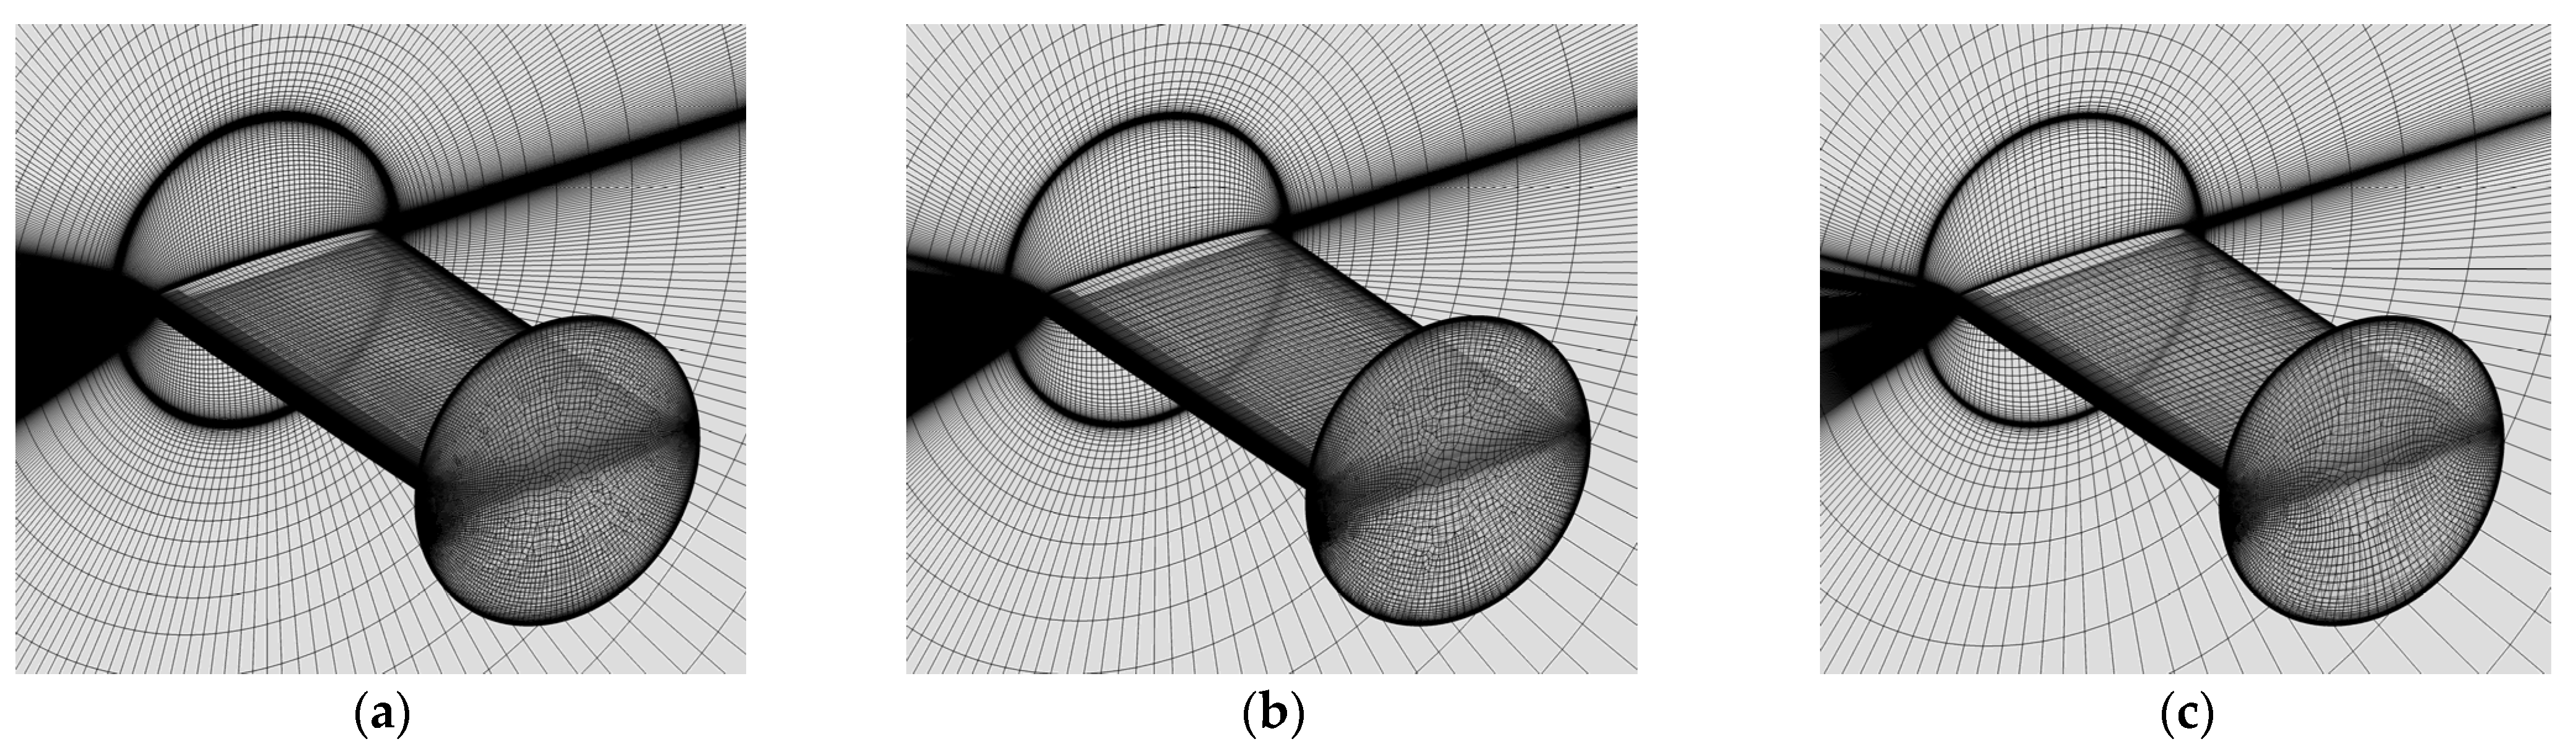
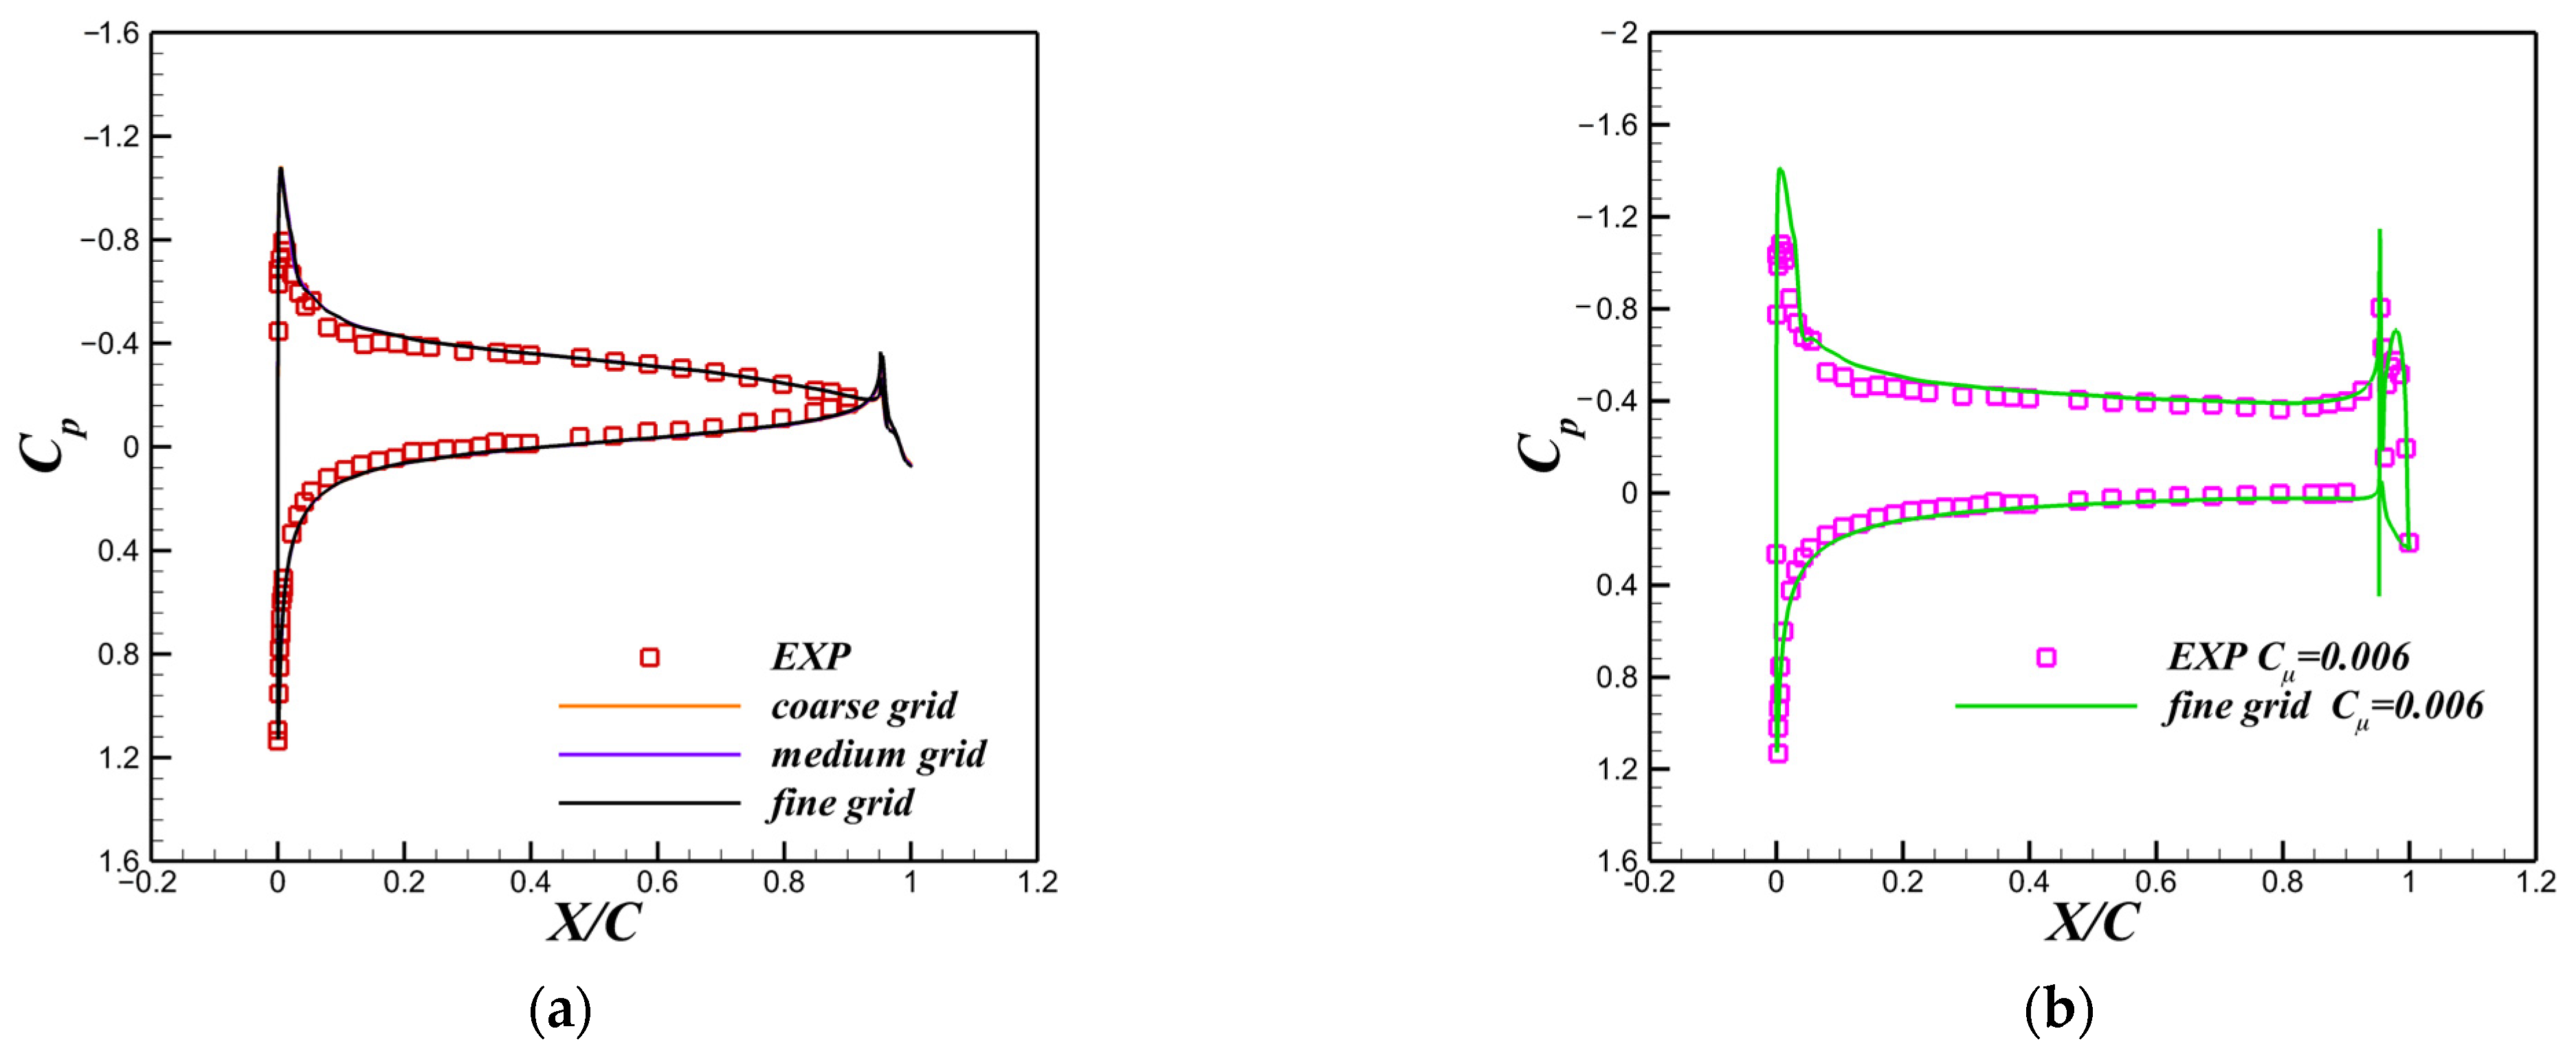
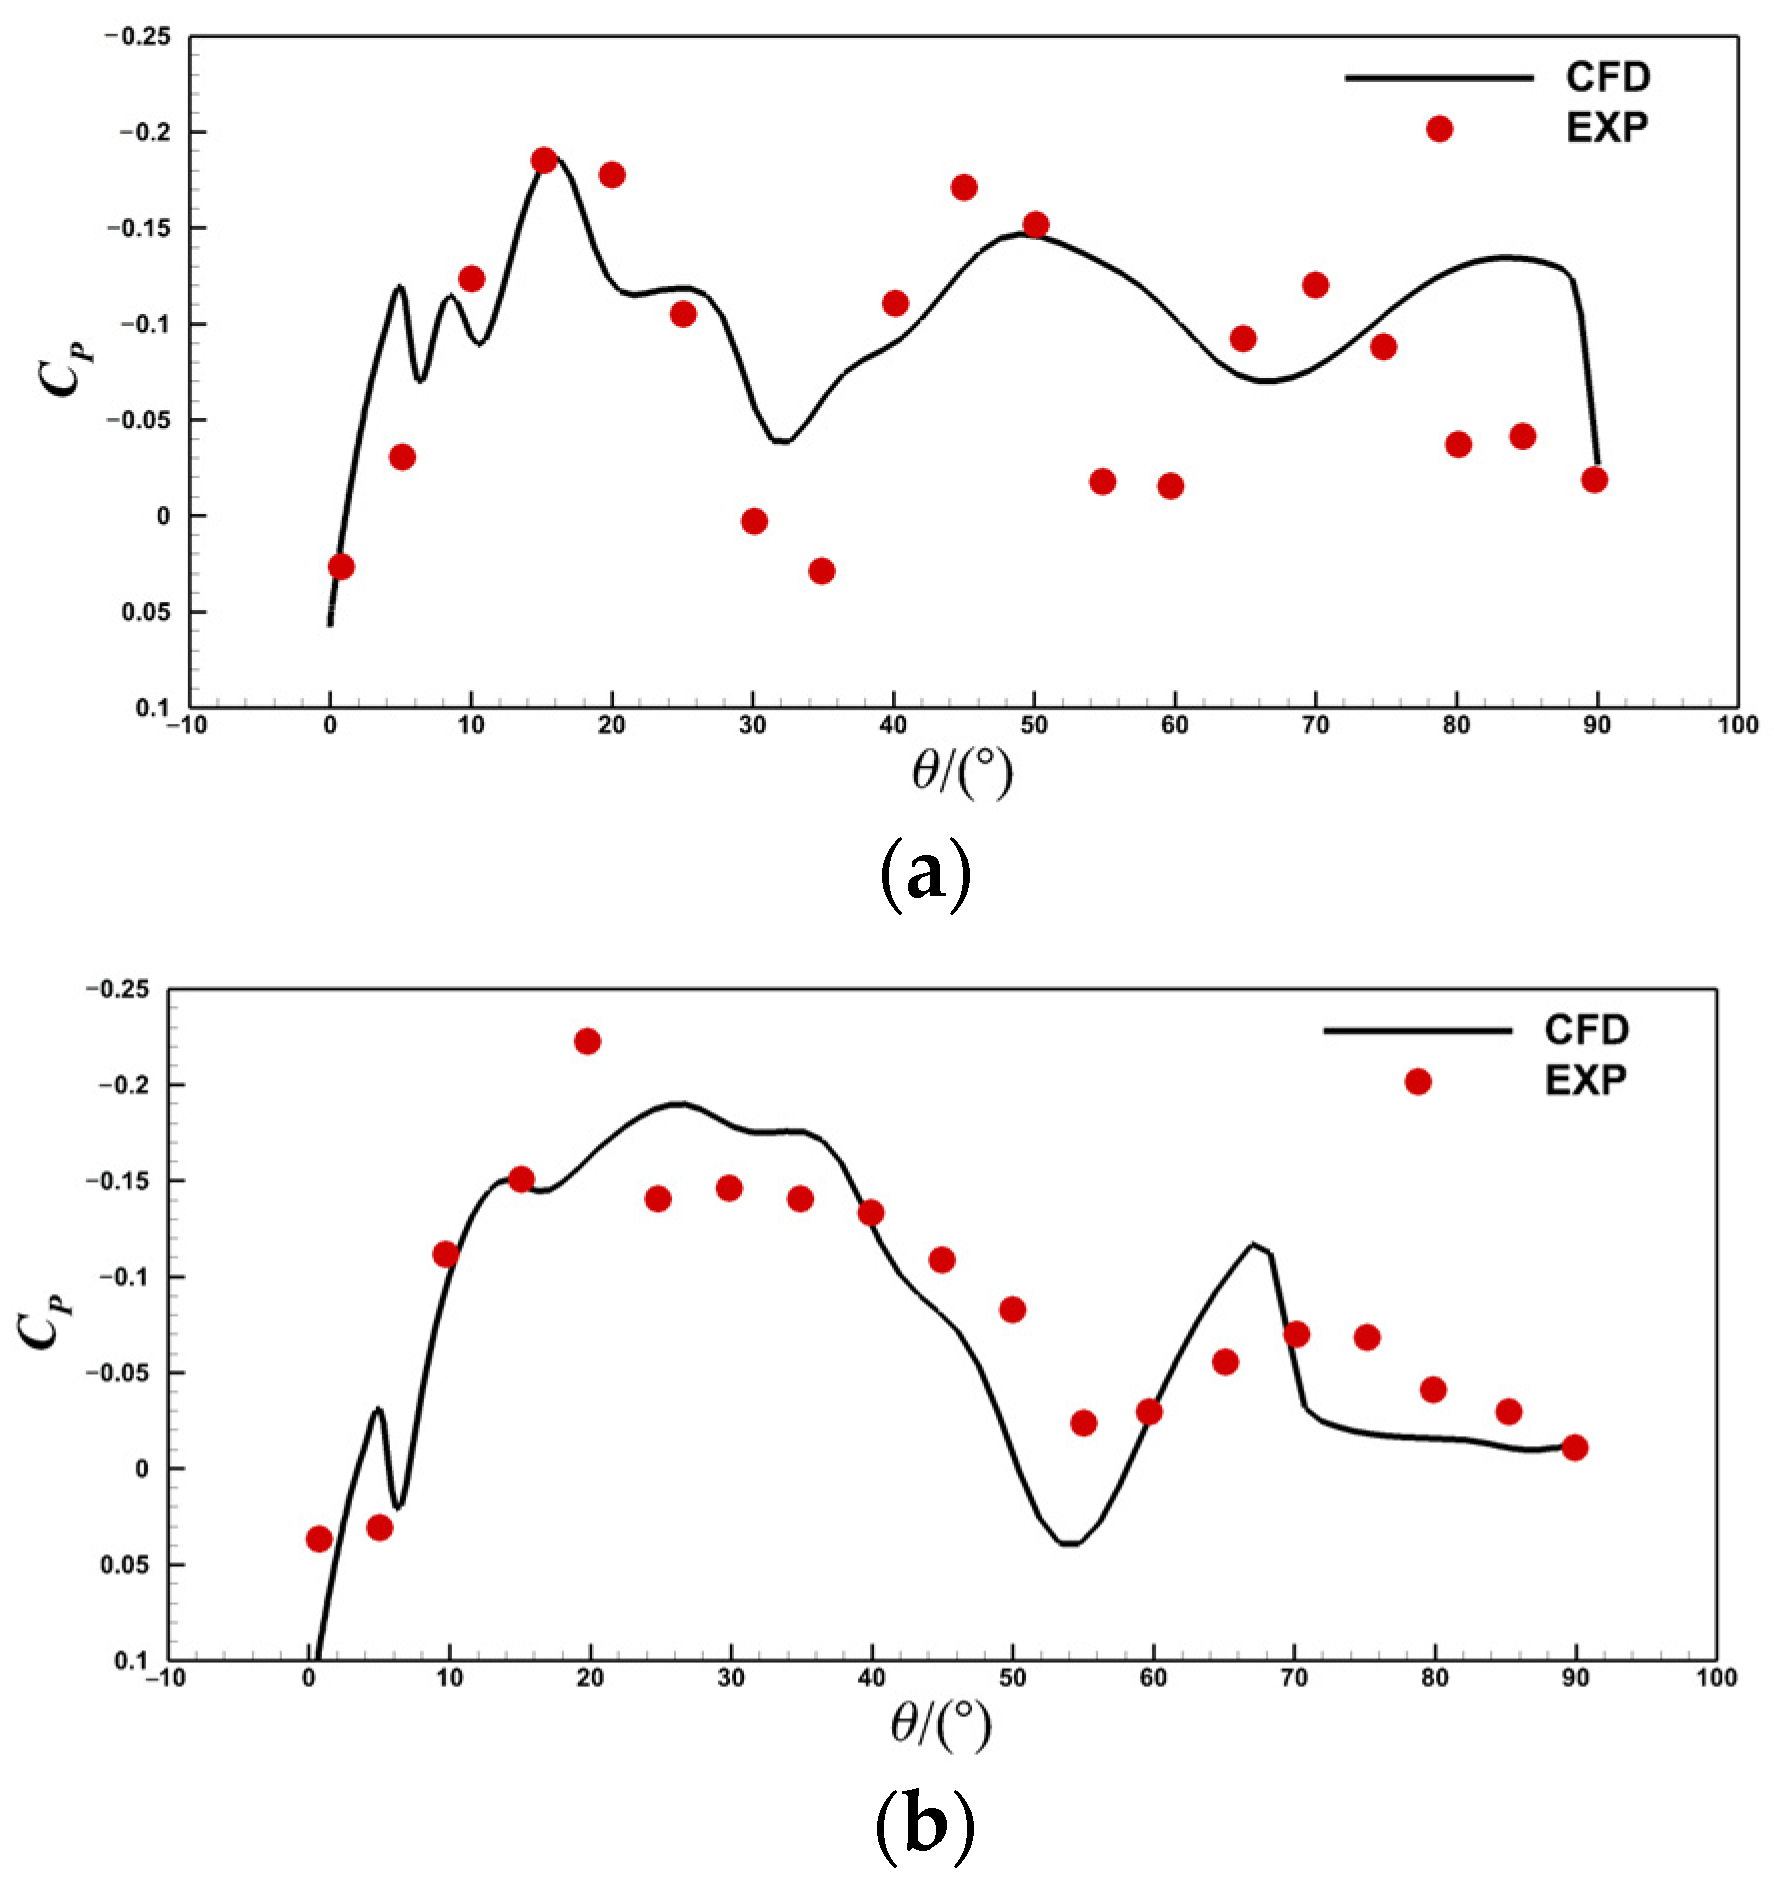
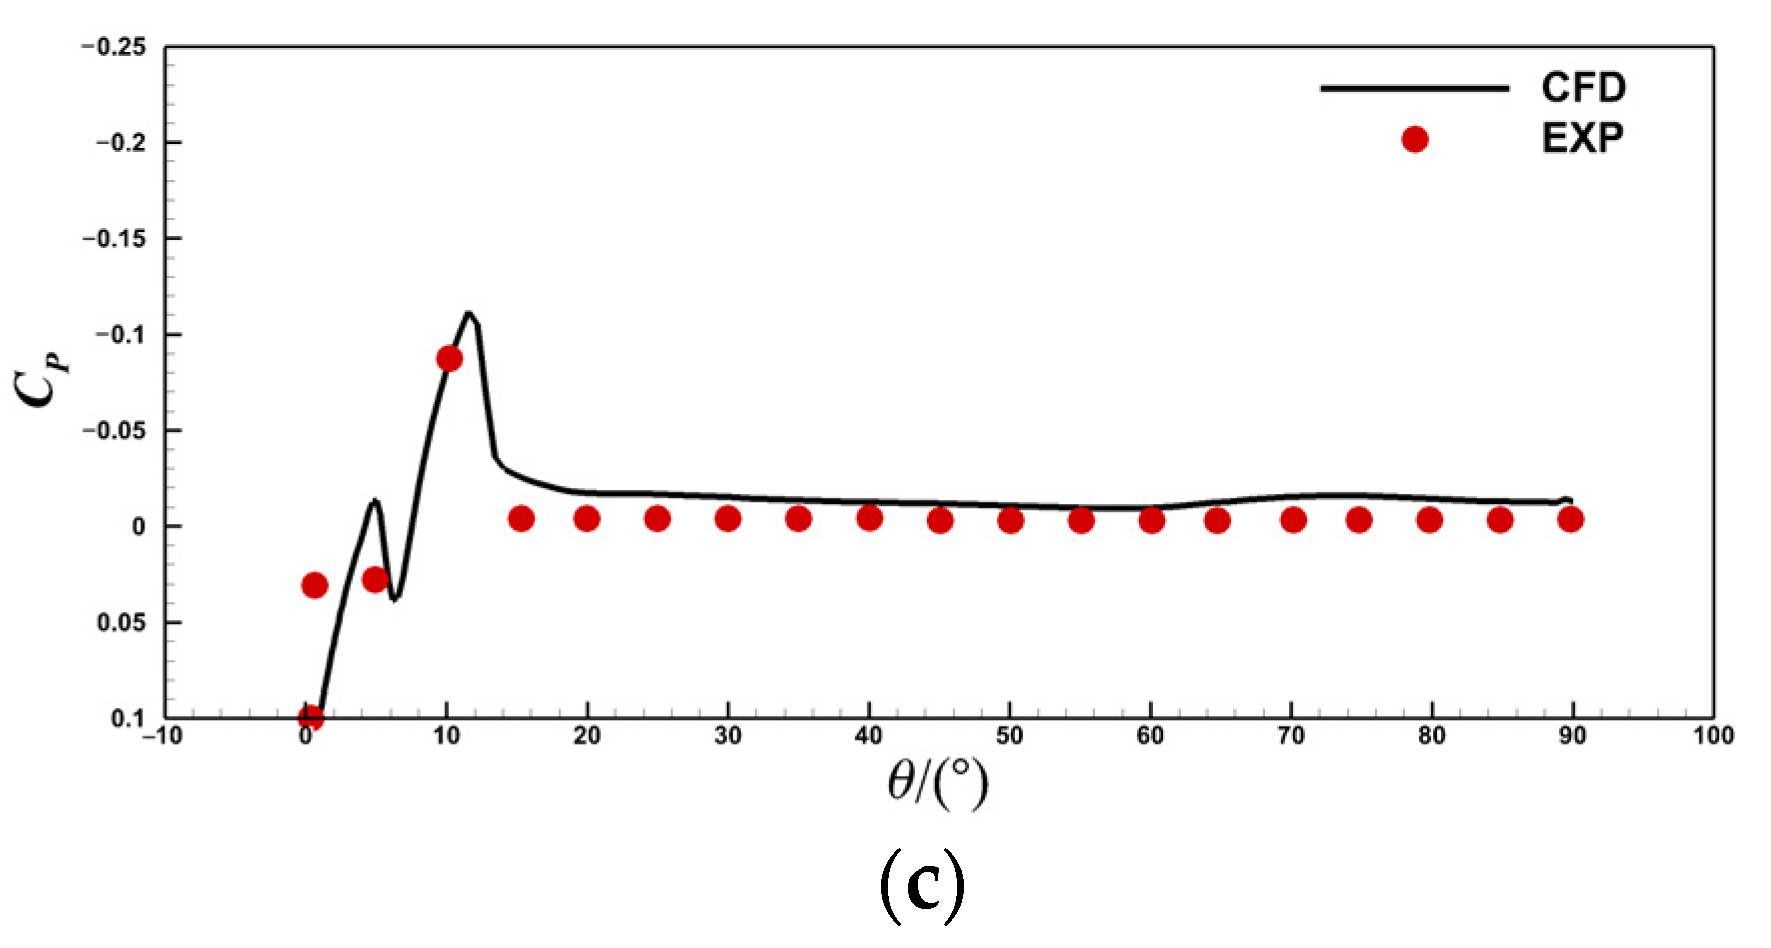
3.1. Verification of Calculation Accuracy of CC Airfoil
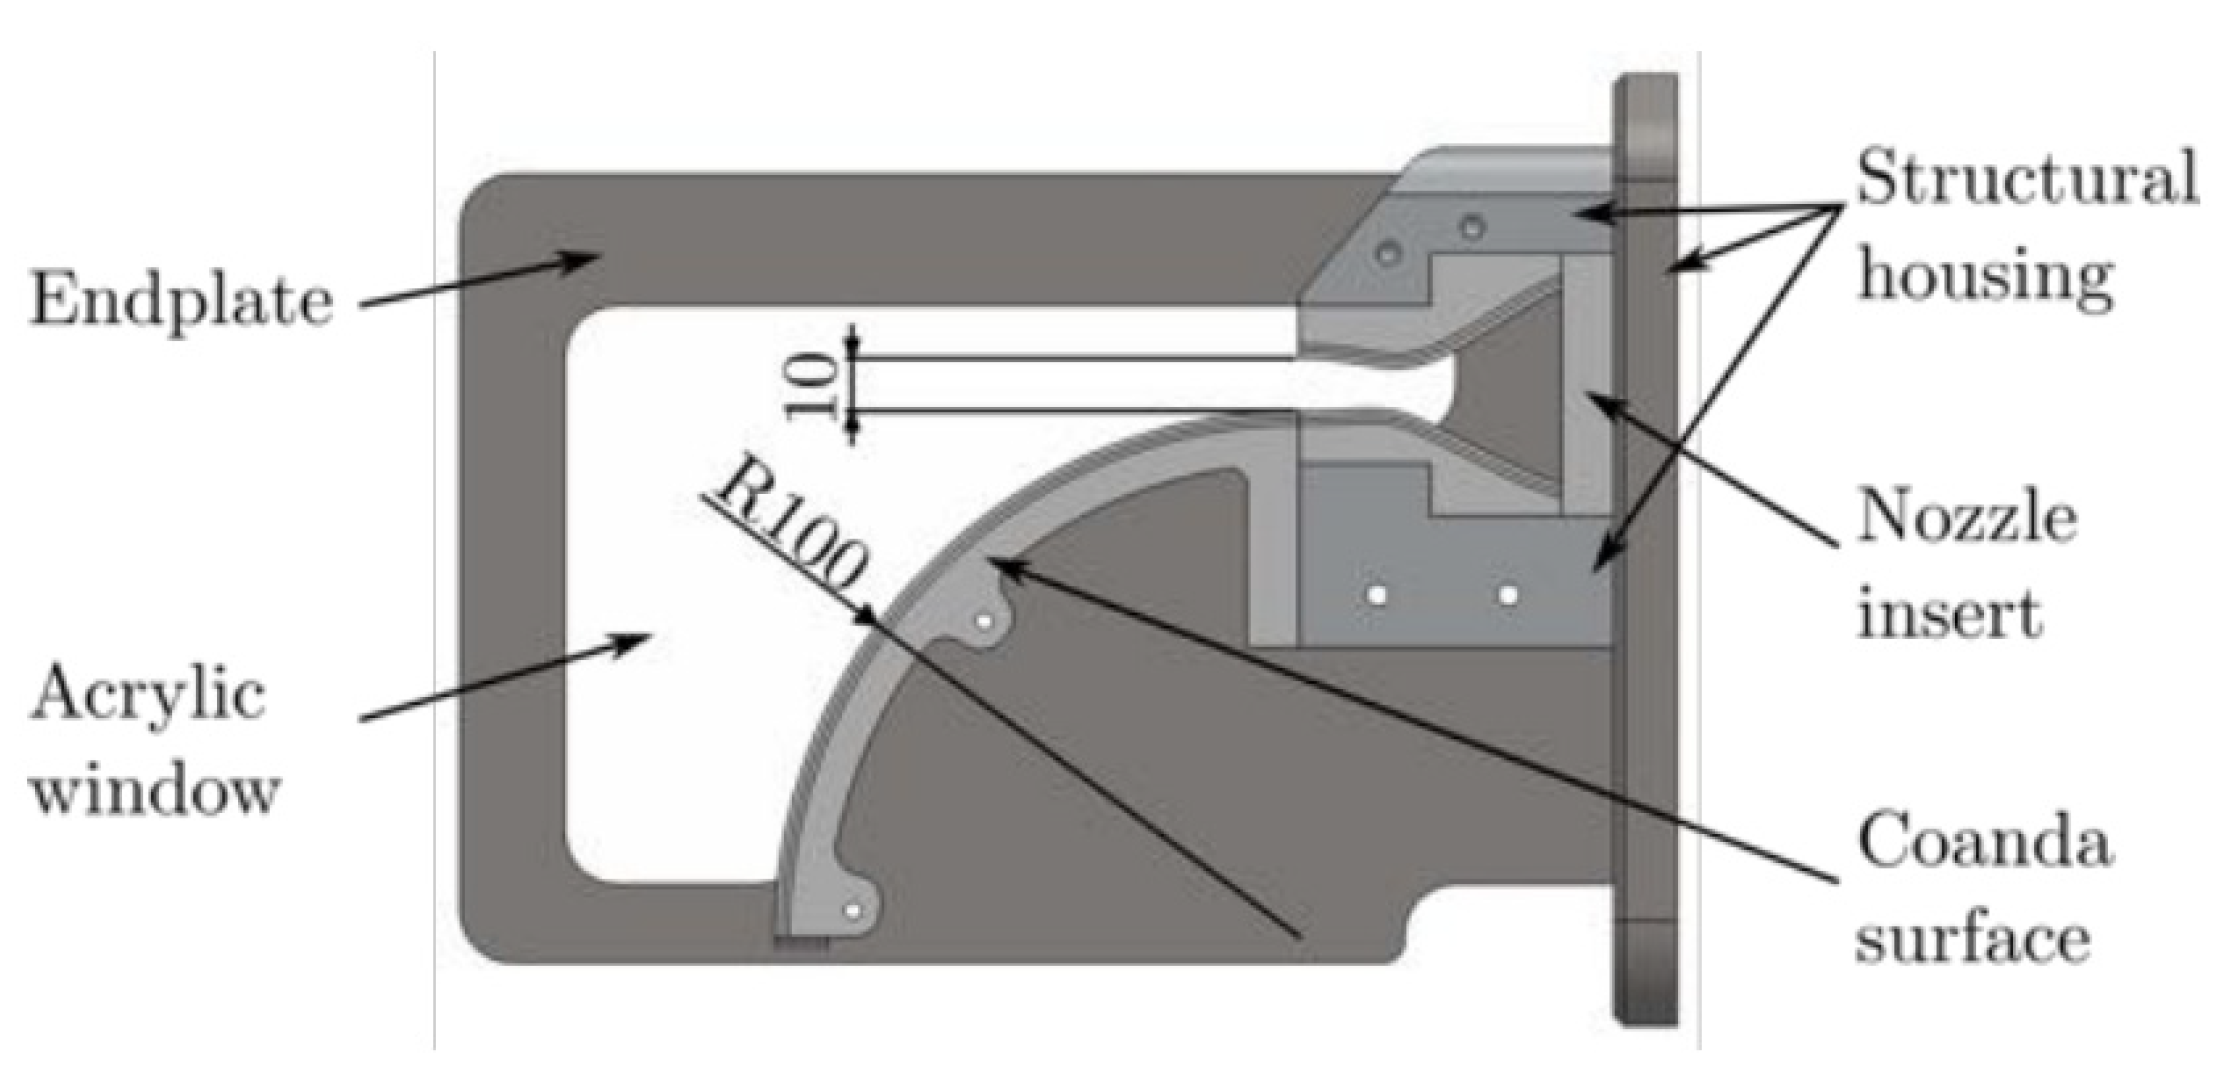
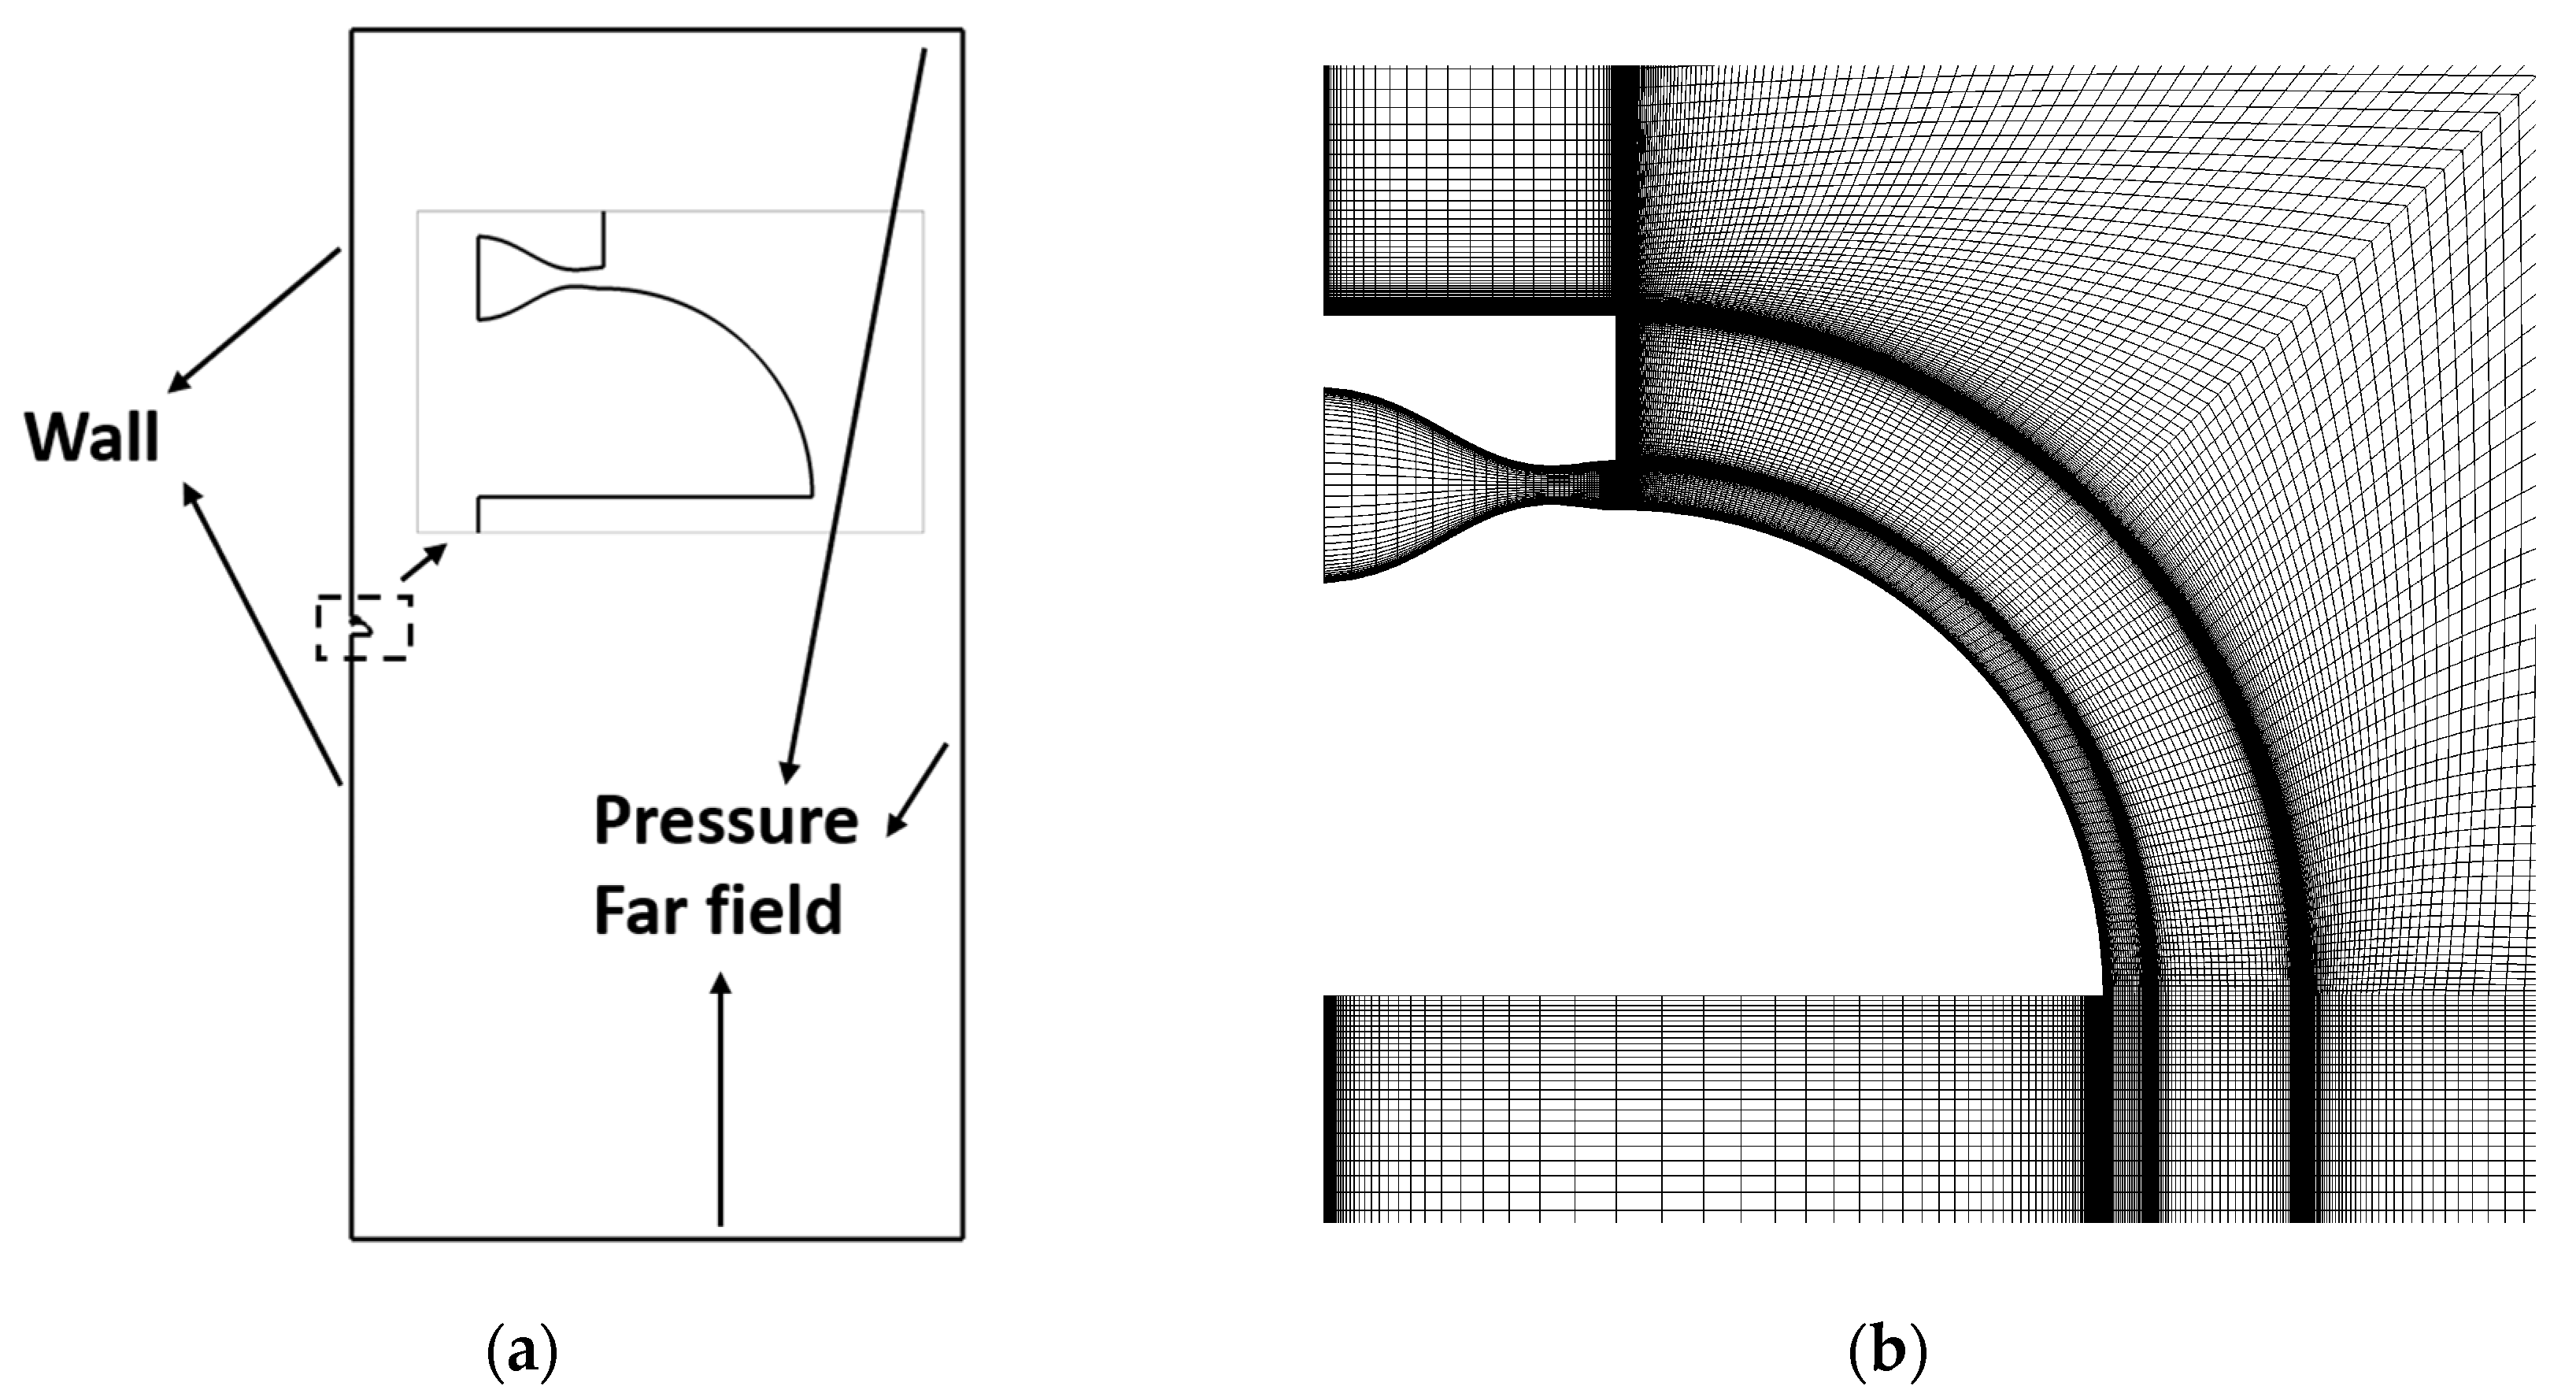
3.2. Verification of Calculation Accuracy of Supersonic Coanda Jet
4. Analysis of Flow Characteristics of the Under-Expansion Jet
4.1. Analysis of Flow Field Structure under Different Jet Pressure Ratios
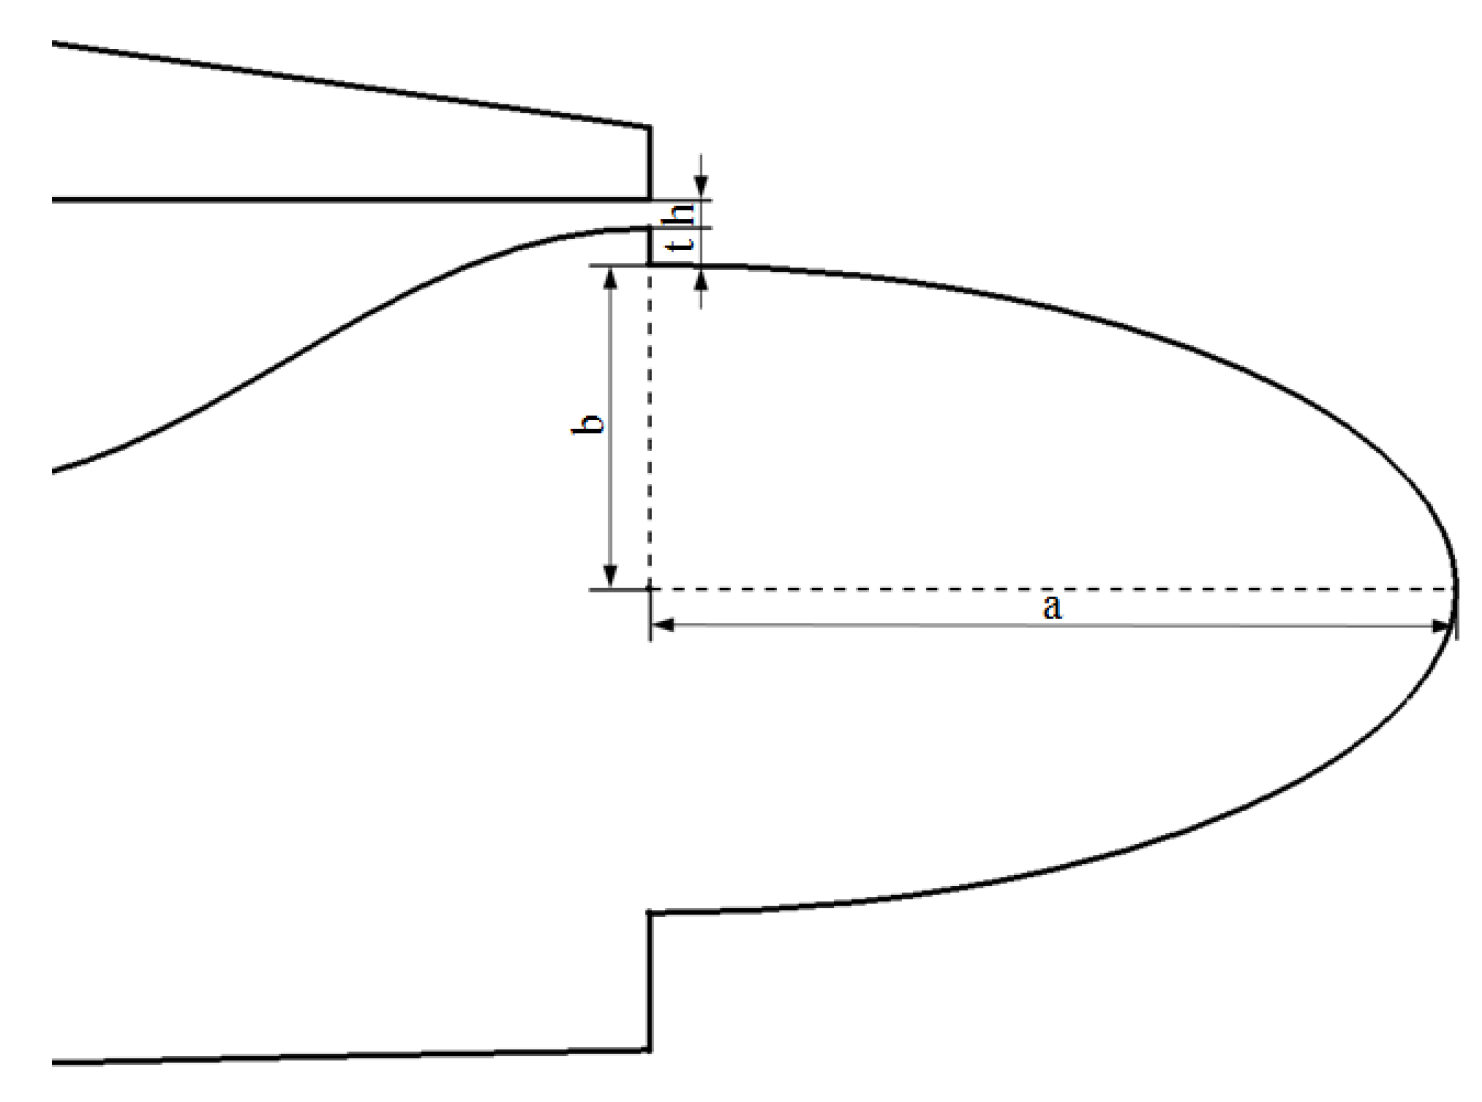
4.2. Impact Analysis of Ellipticity
4.3. Impact Analysis of Nozzle Height
5. Conclusions
- A converging nozzle and step structure provides expansion space for the under-expansion jet of CC airfoil and changes the shock–boundary layer interaction form. The combination design of proper ellipticity and the back-facing step contributes to forming a closed low-pressure vortex area behind the step, promoting jet attachment and improving the jet attachment pressure ratio effectively.
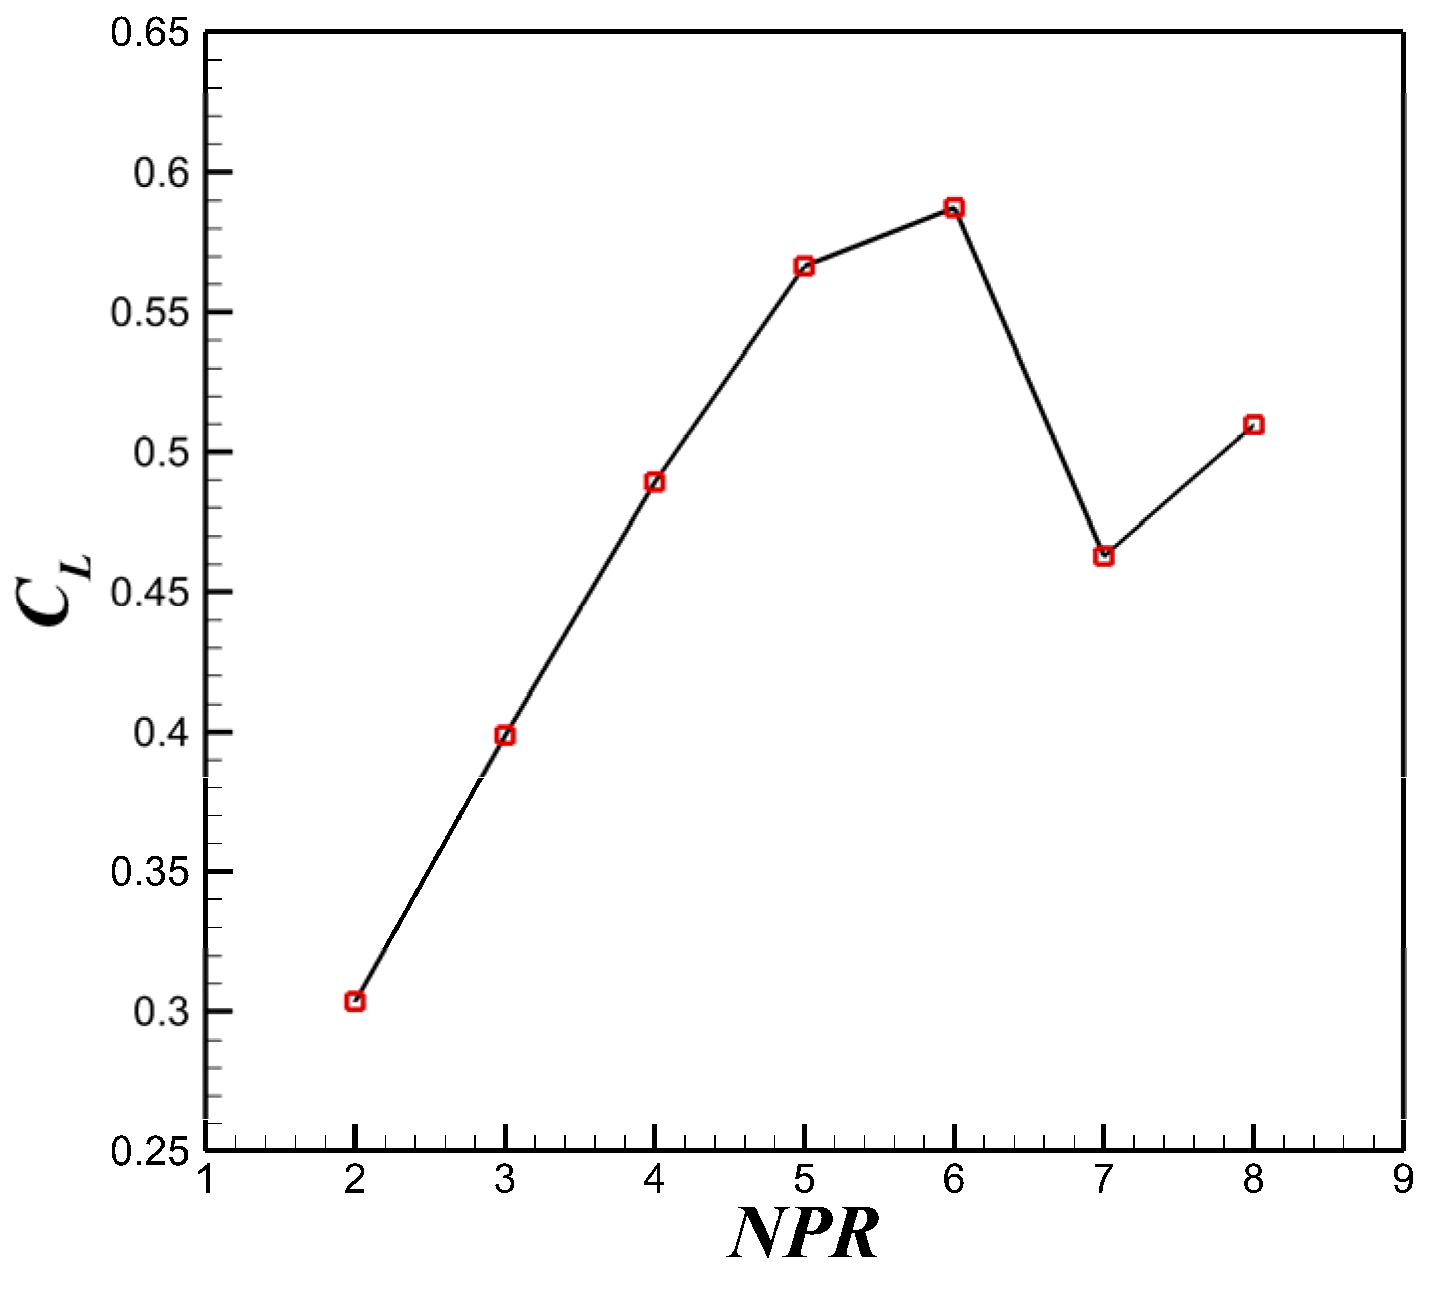
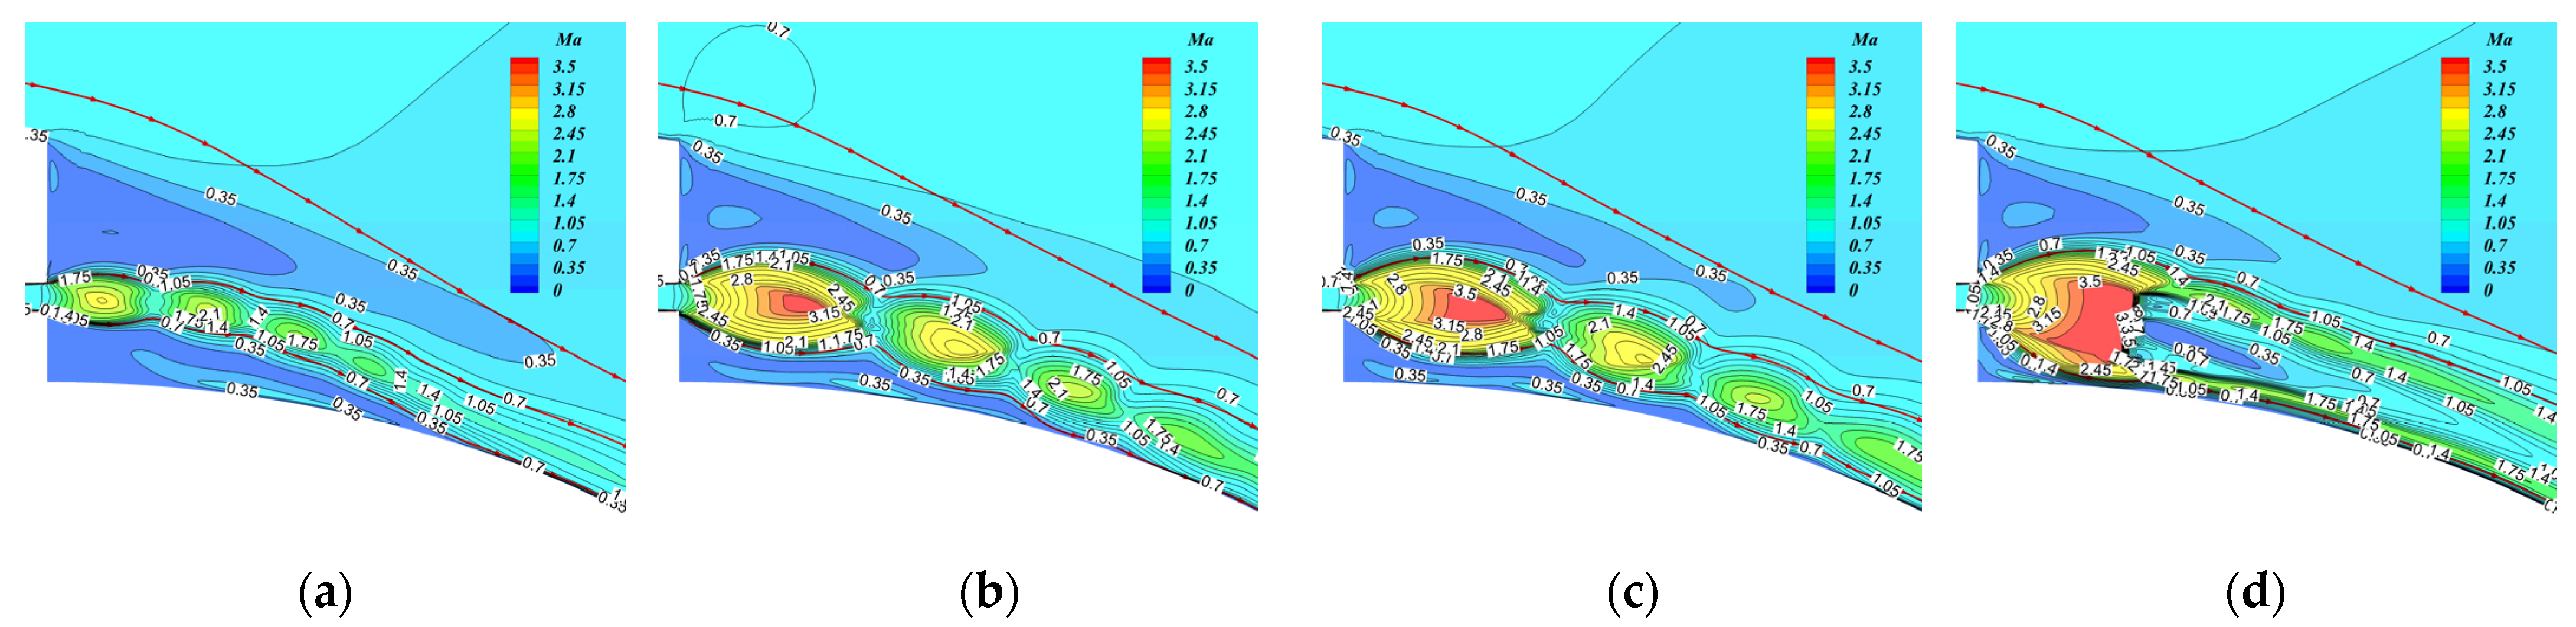
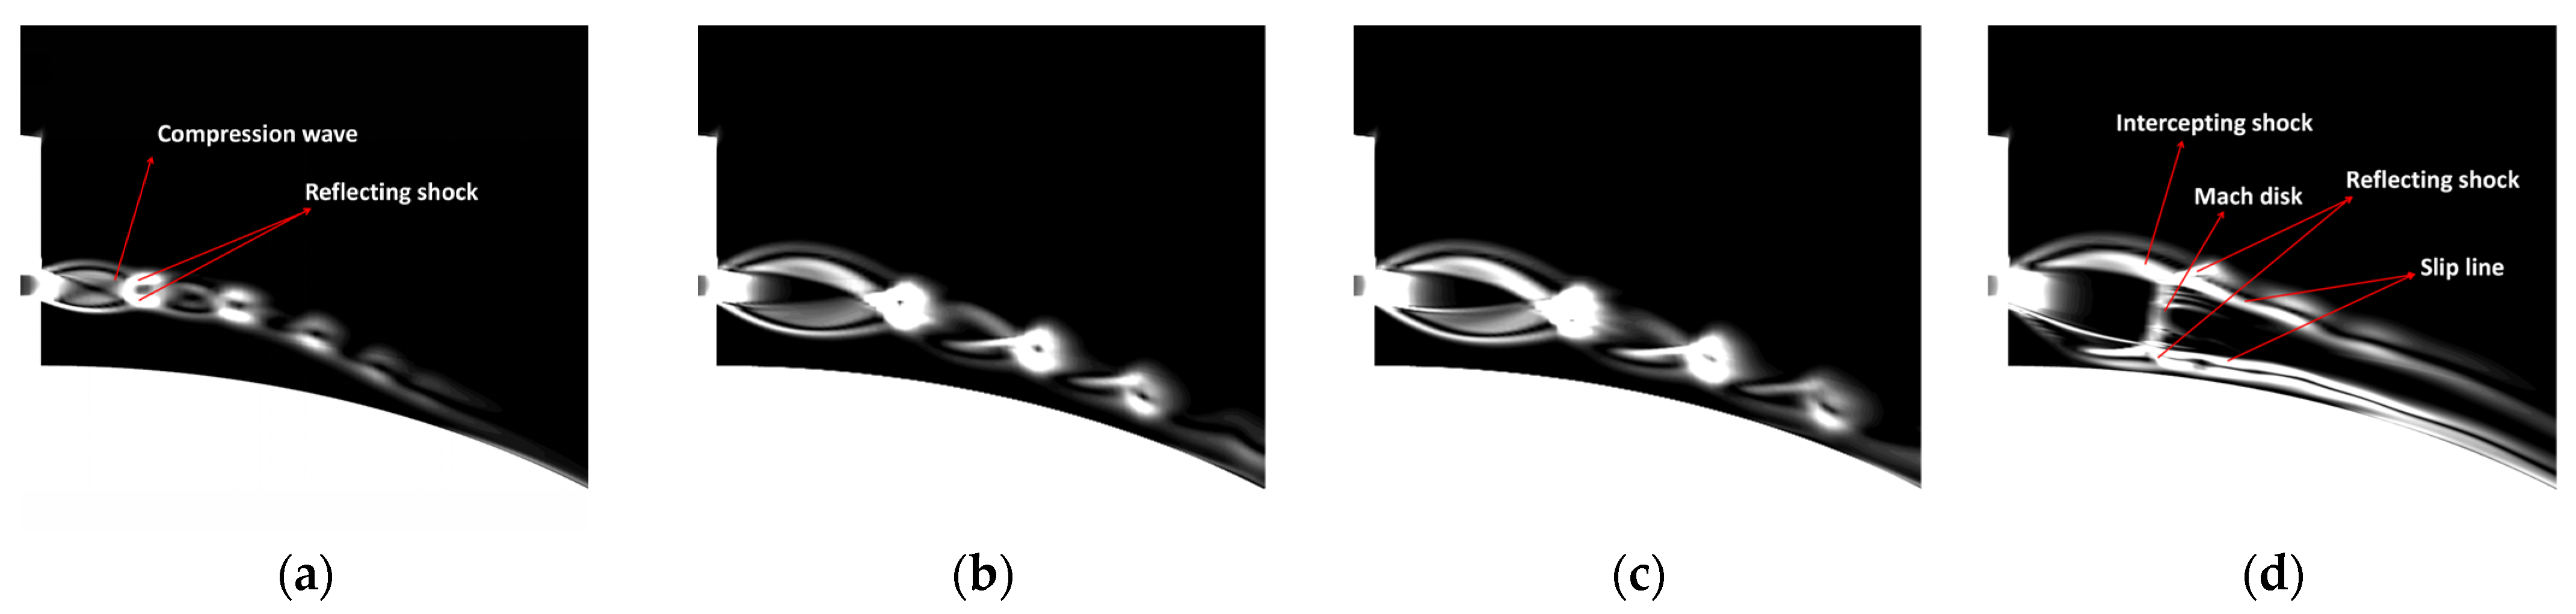
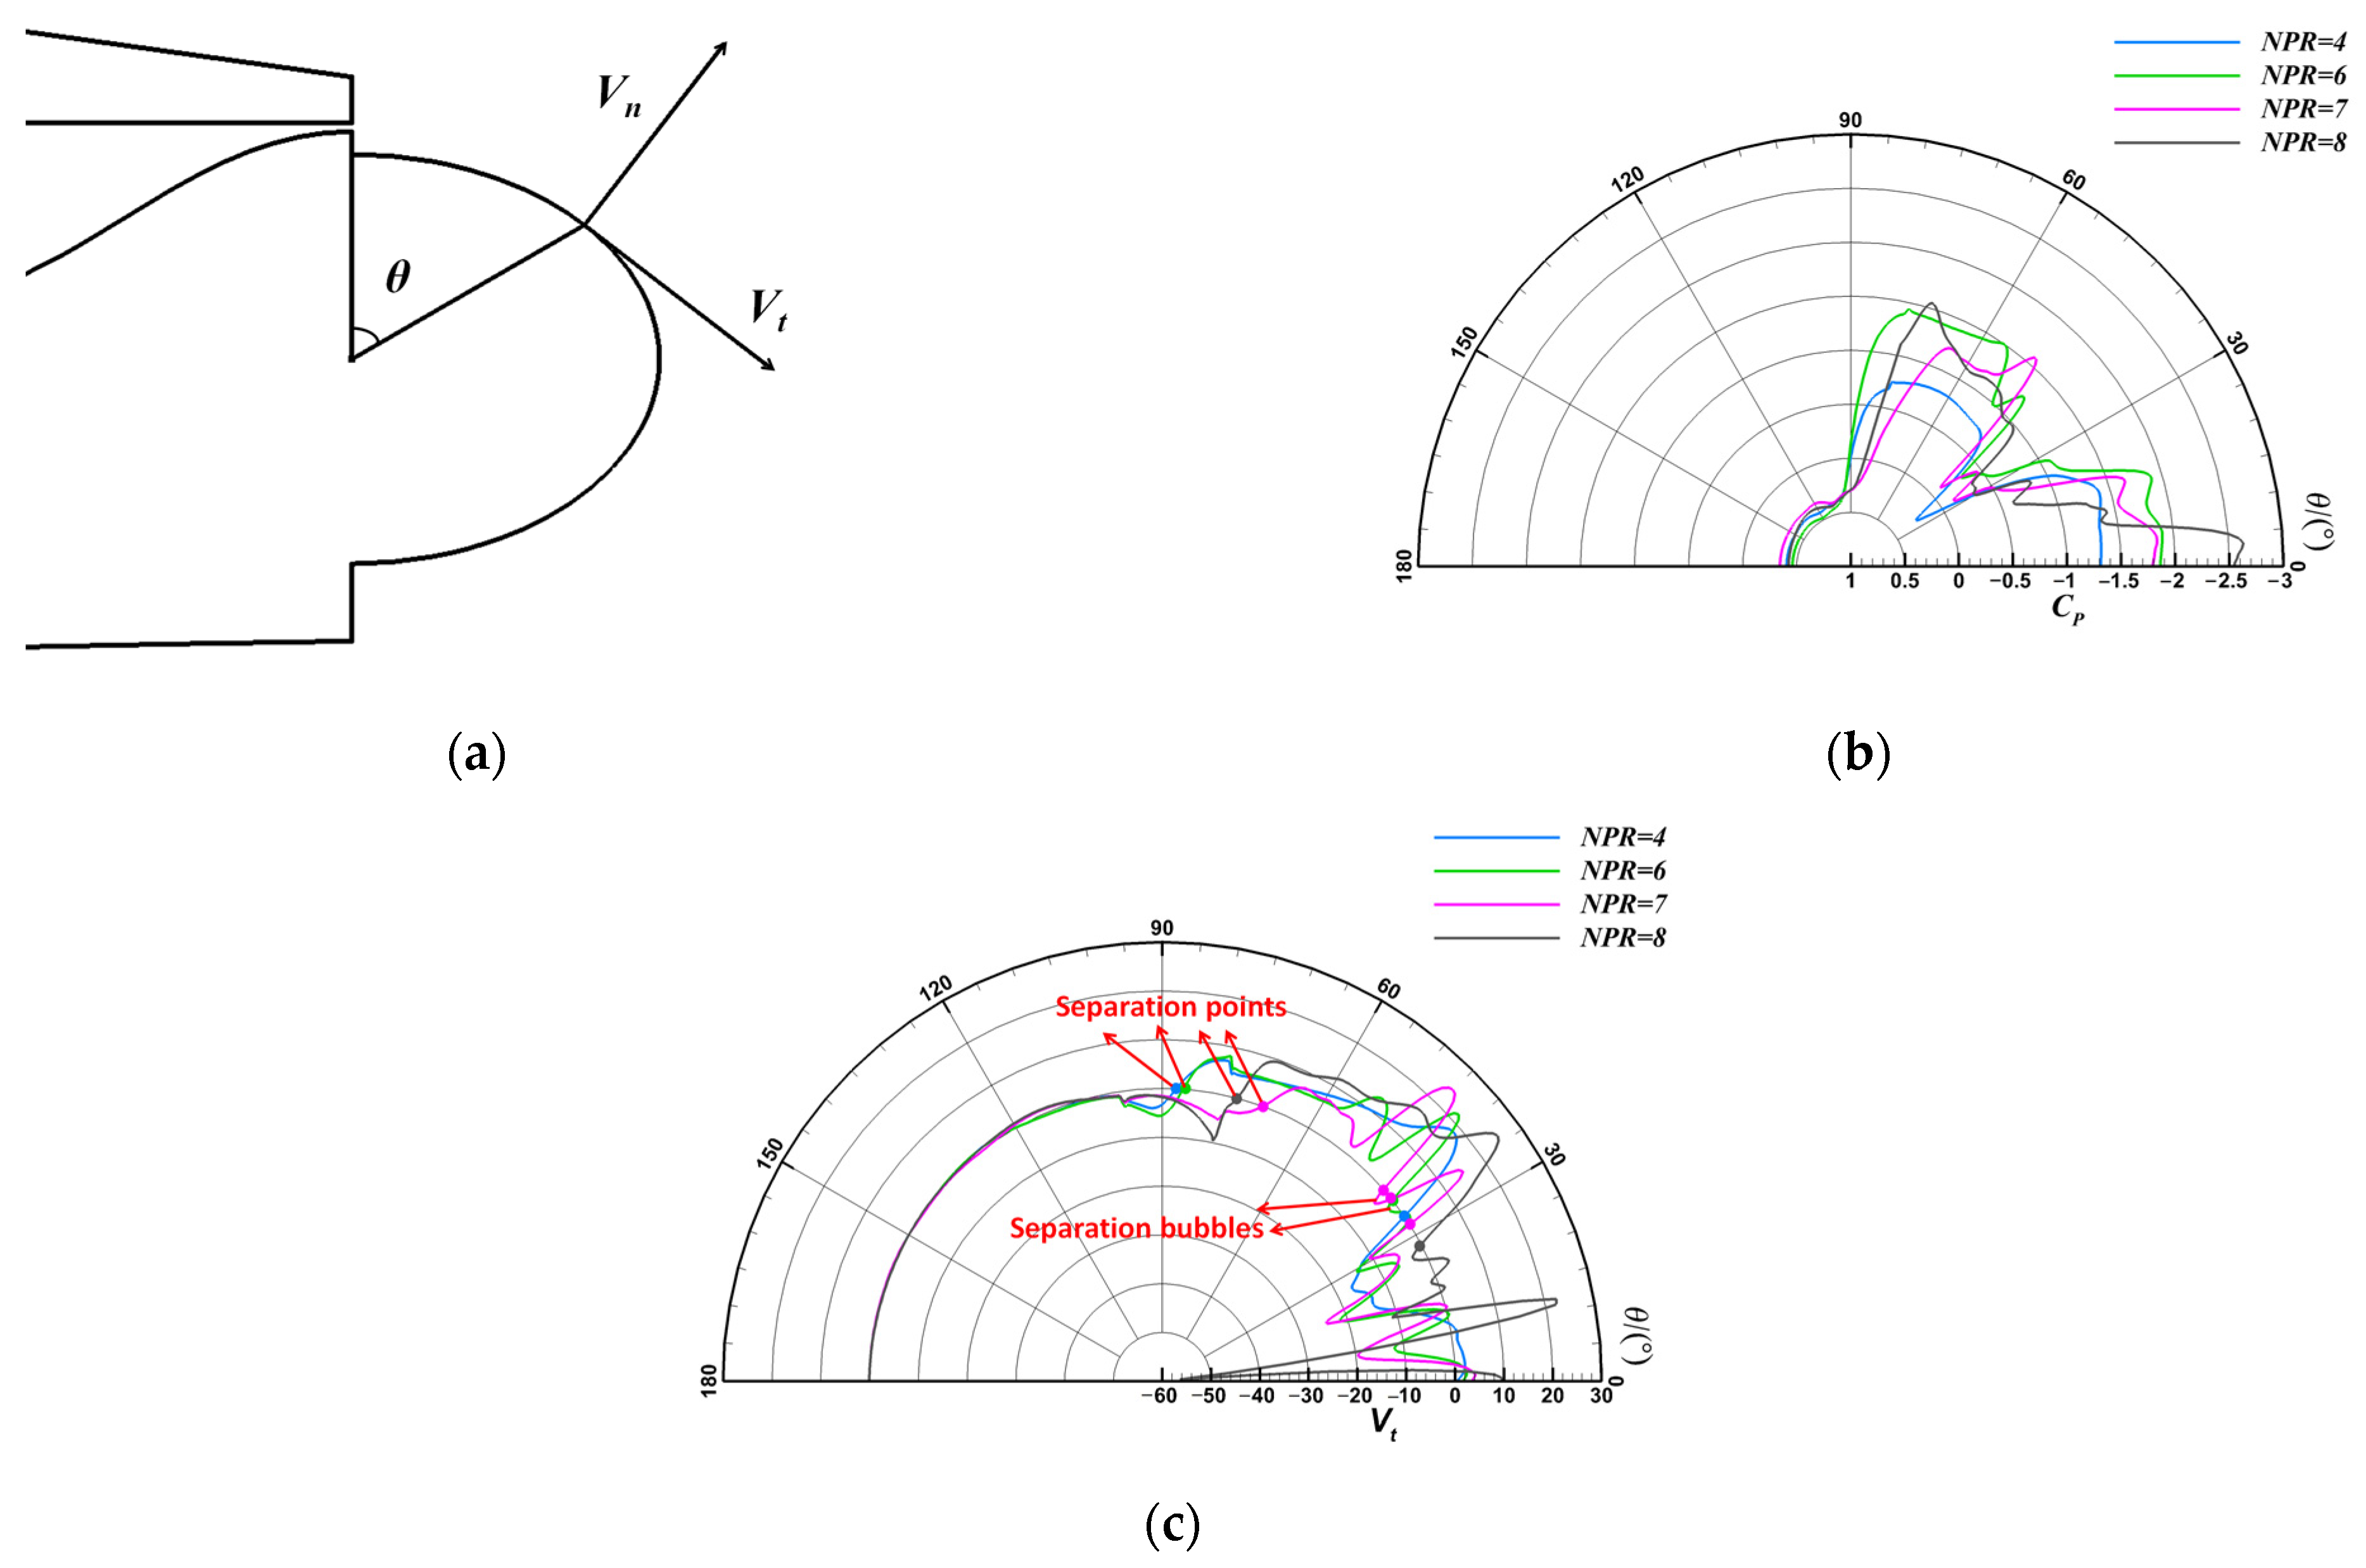
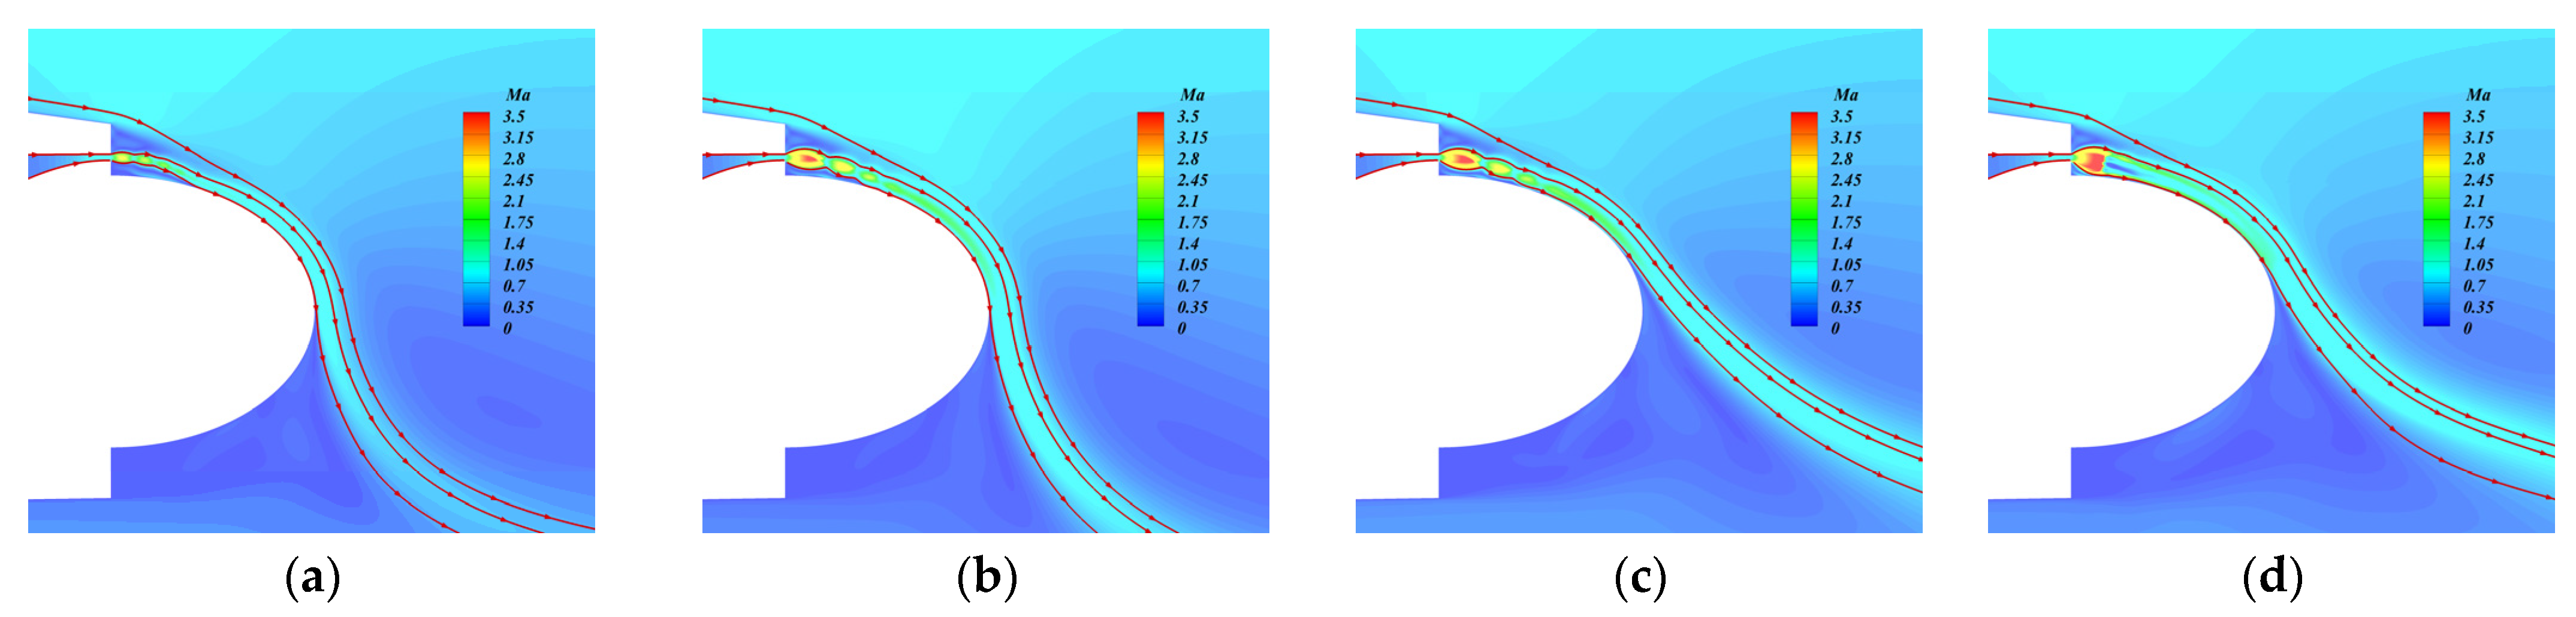
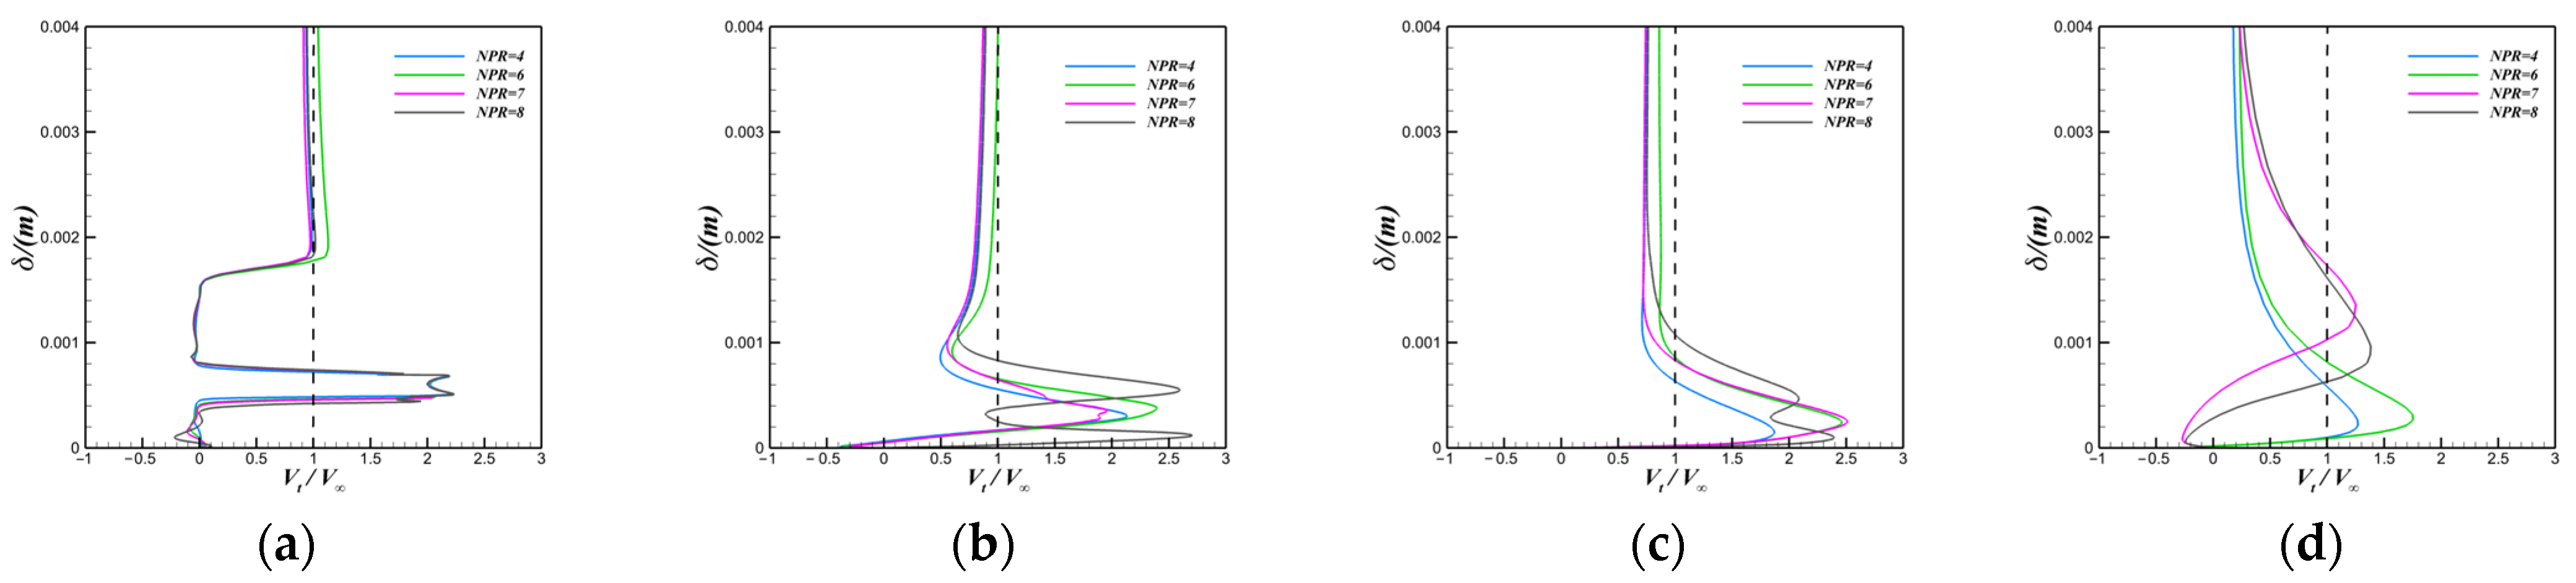
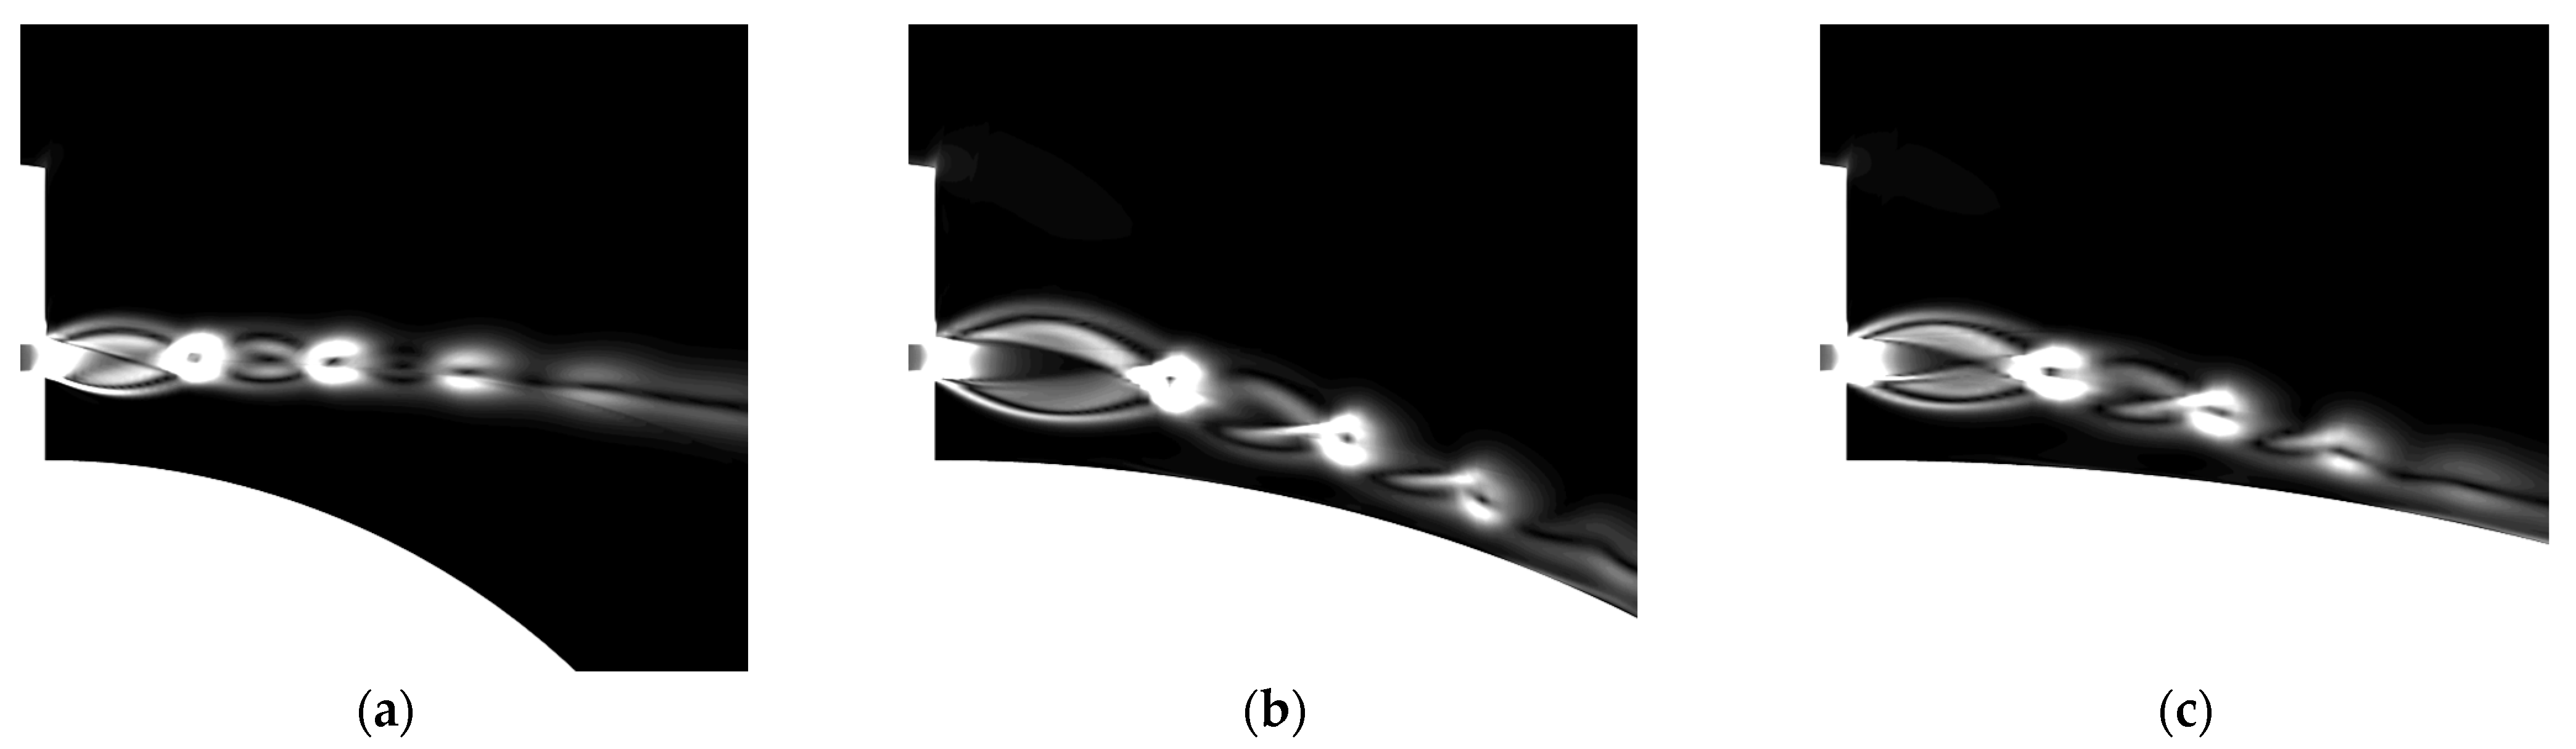
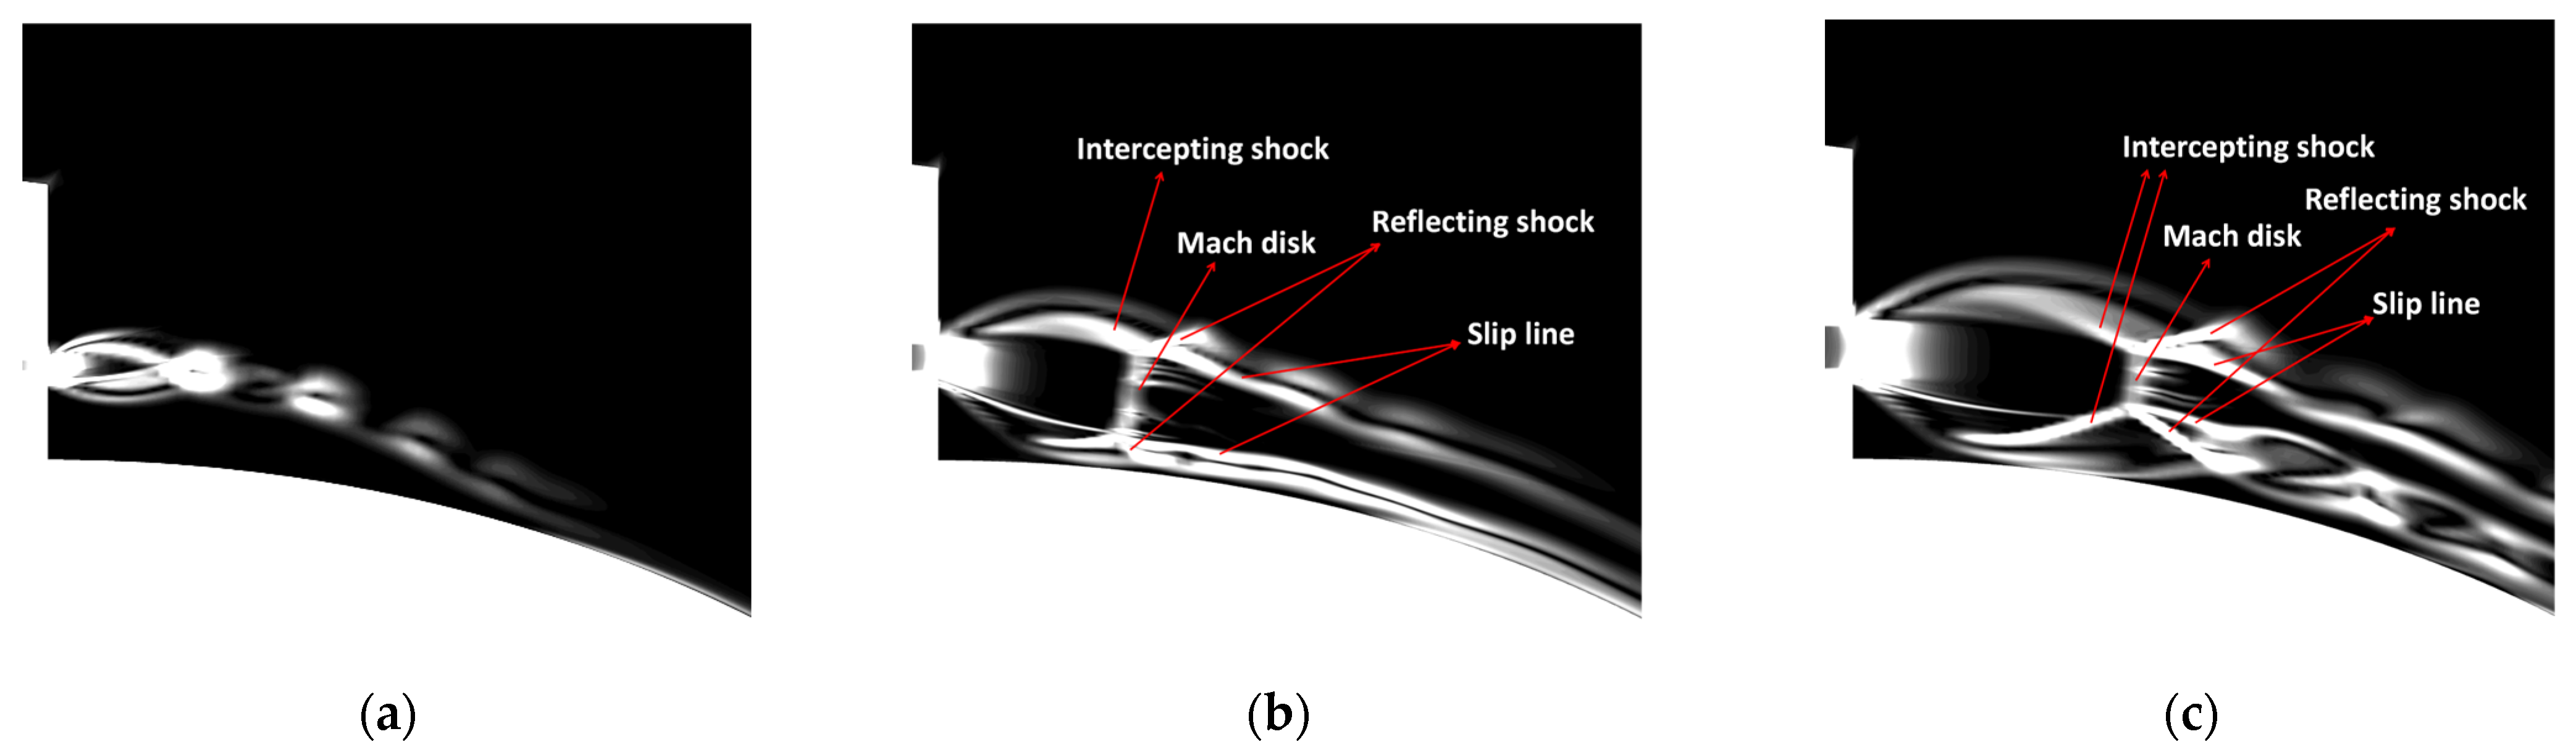
- As the jet pressure ratio increases, the entrainment effect of the jet on the upper airfoil and the blocking effect of the jet on the lower airfoil are enhanced, and the lift coefficient increases. When the critical stall pressure ratio is exceeded, the size of the shock cell at the exit is larger, the adhesion capability of the jet is reduced, and the lift coefficient decreases. When the jet pressure ratio increases again, the intercepting shocks on both sides meet and generate Mach reflection. After jet stratification, the adhesion capability of the jet is improved and the lift coefficient is slightly increased.
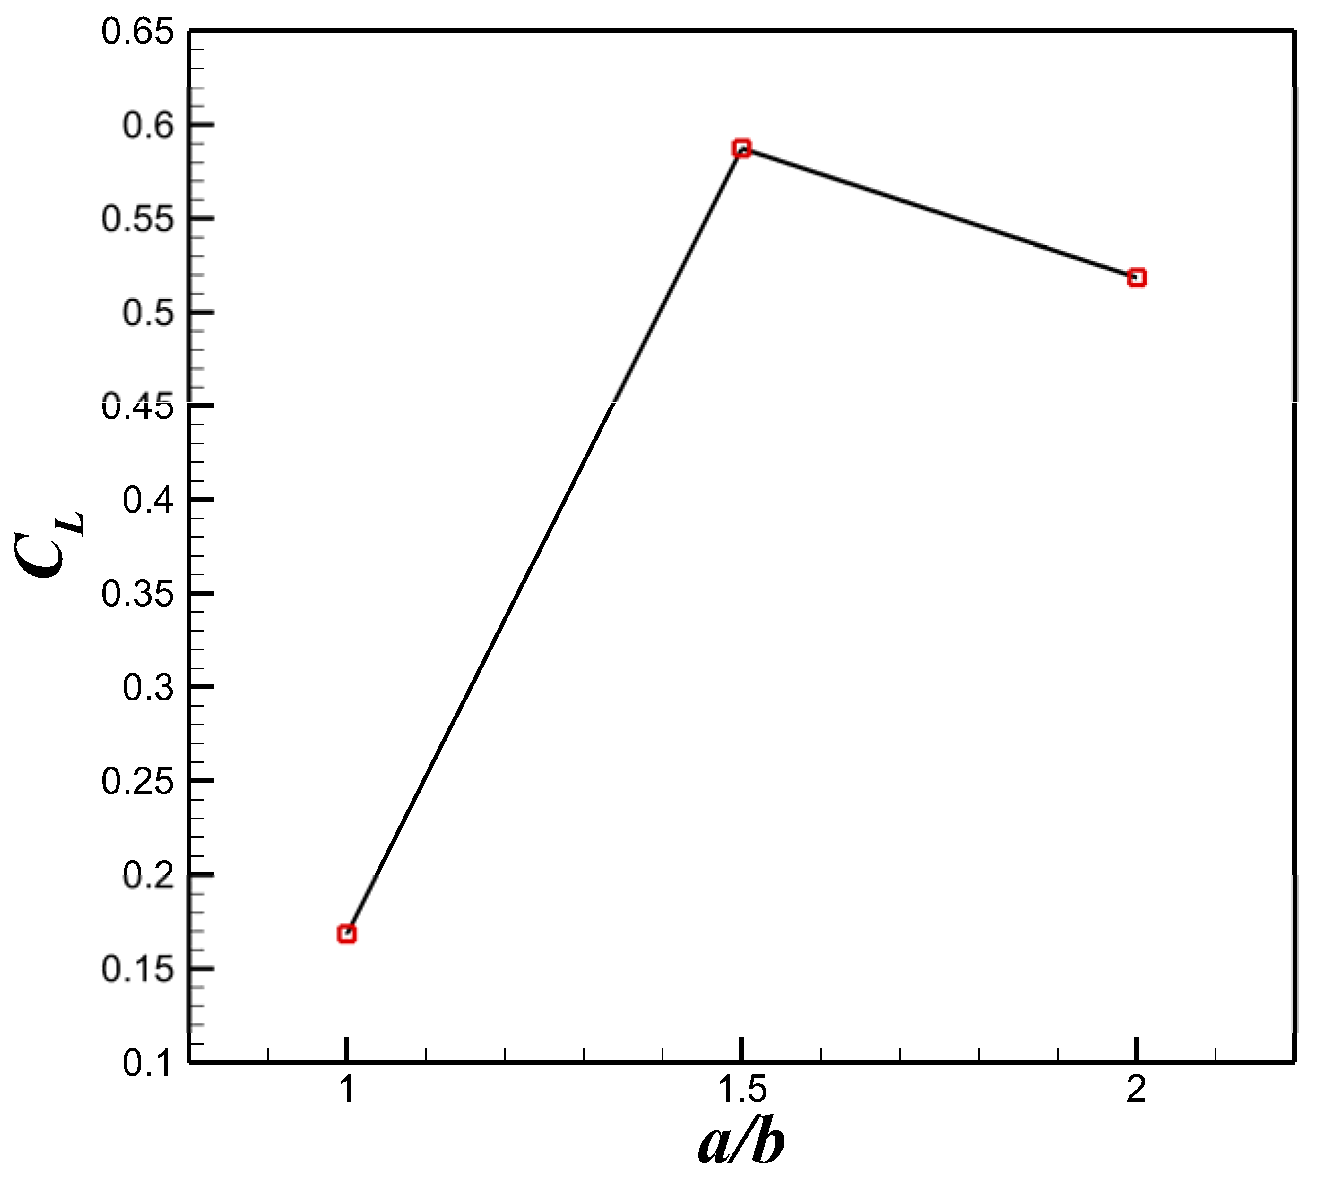
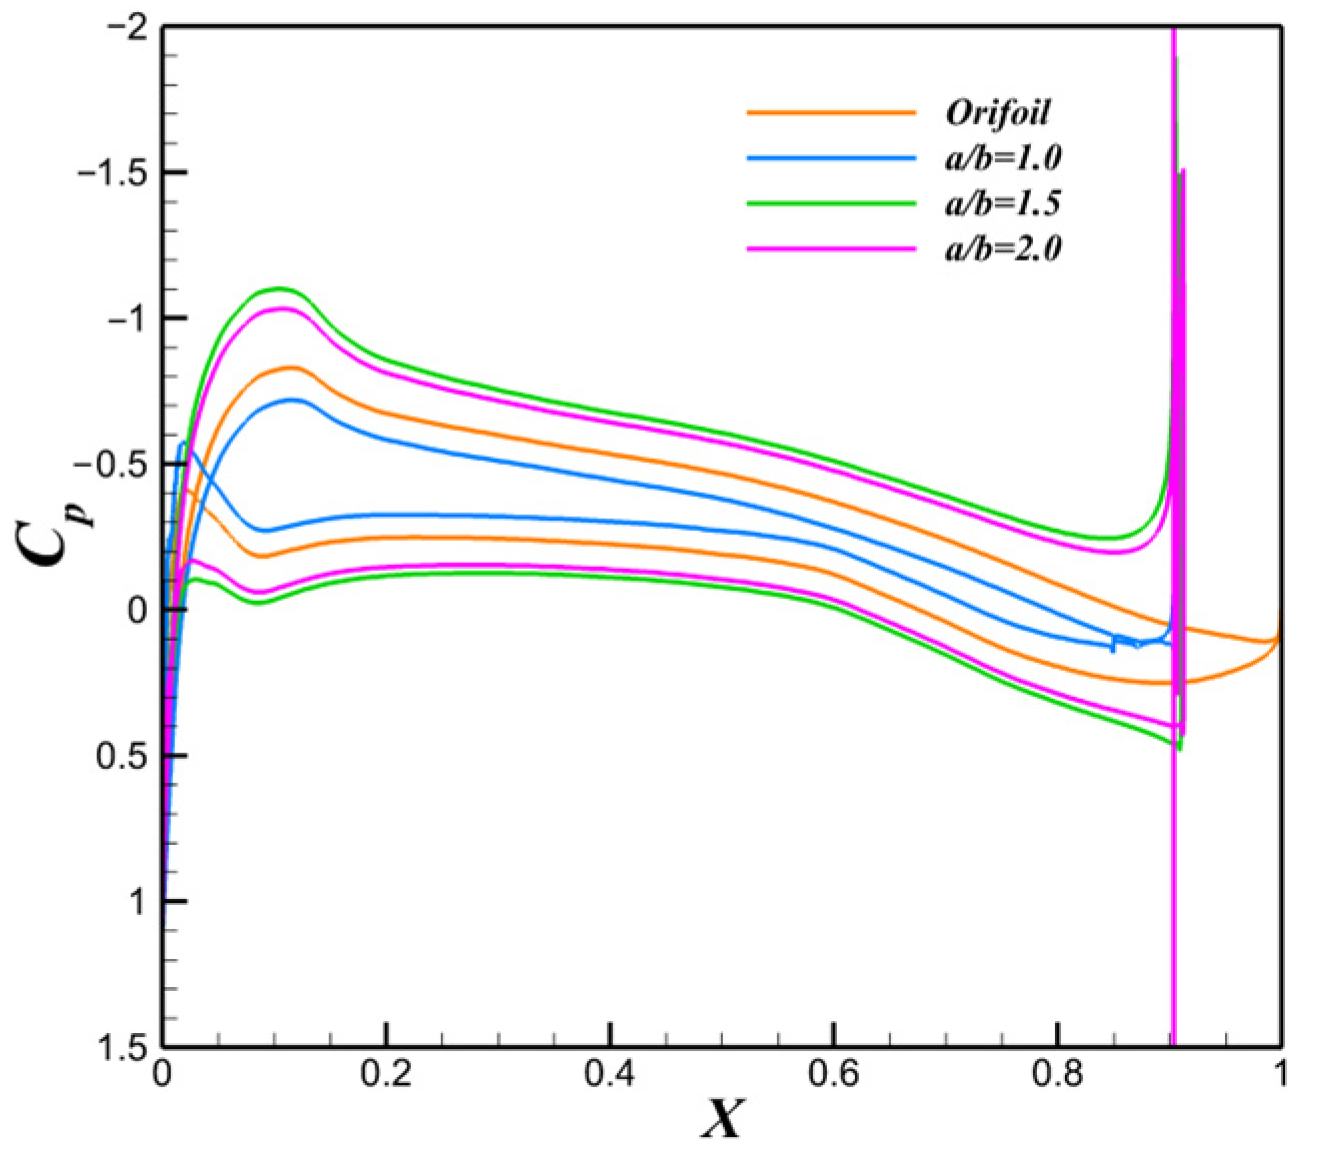
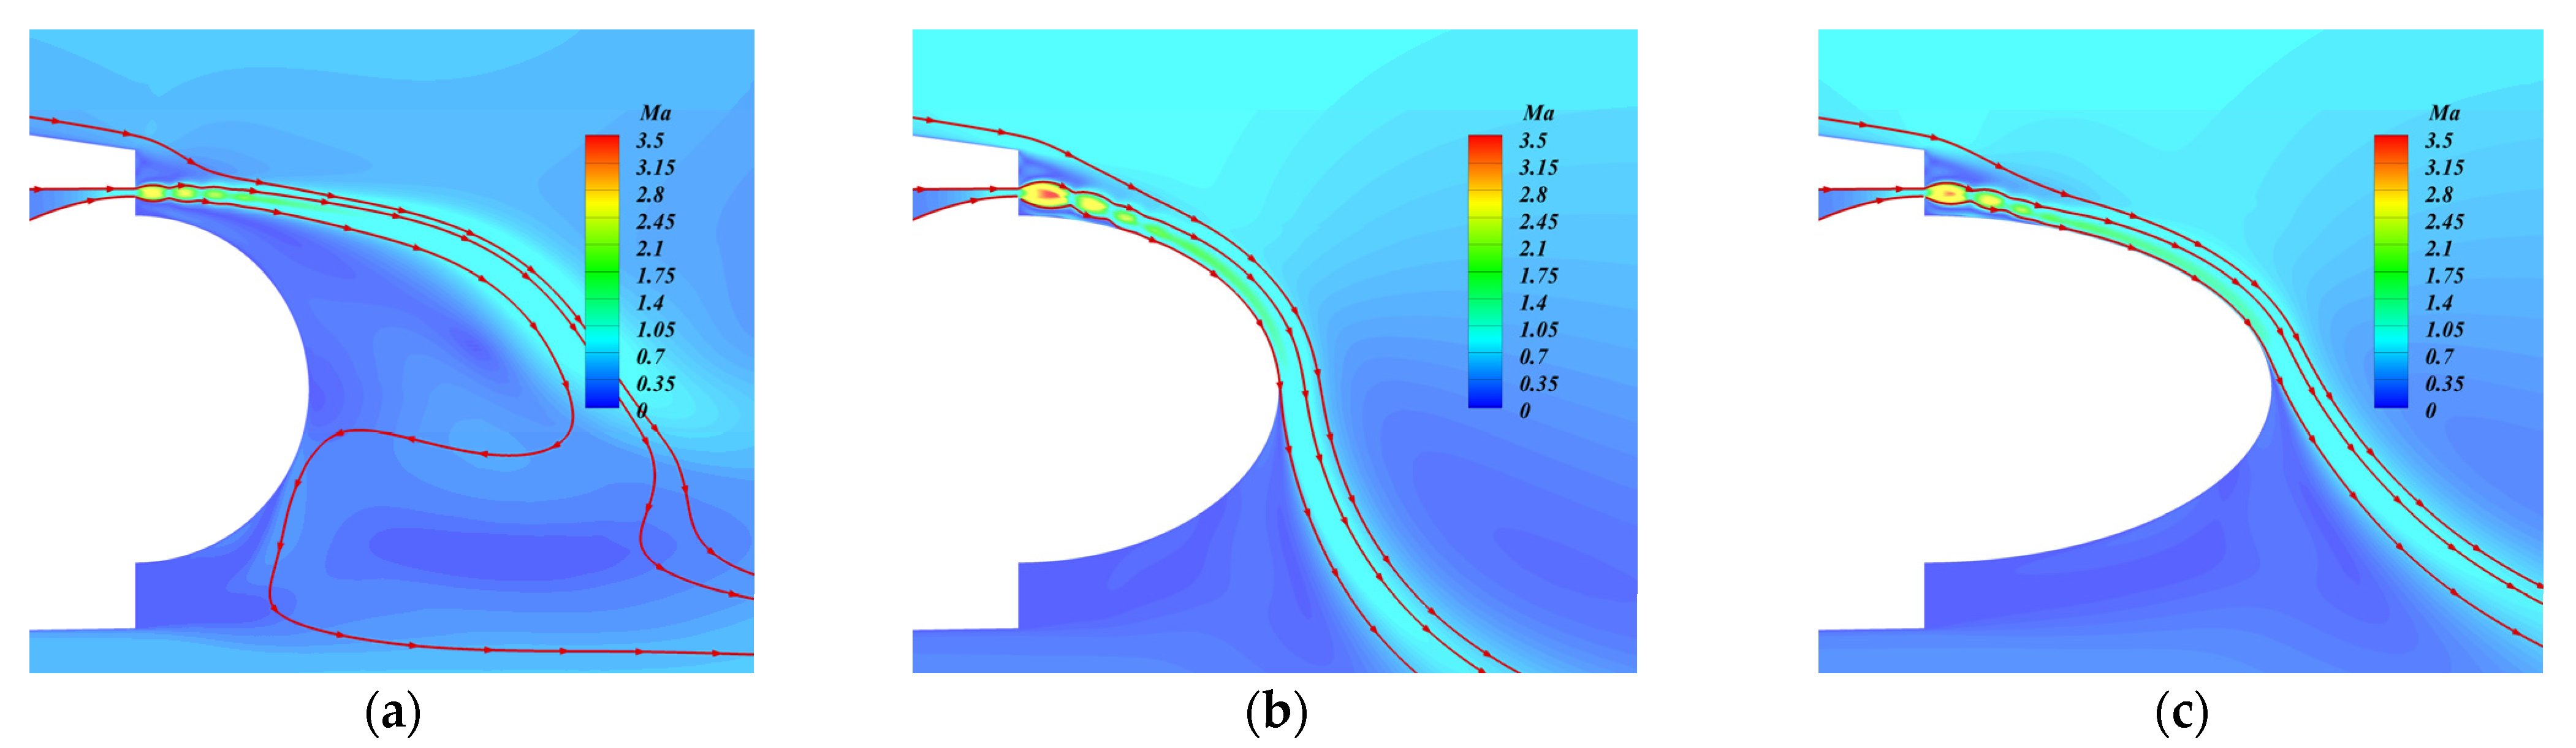
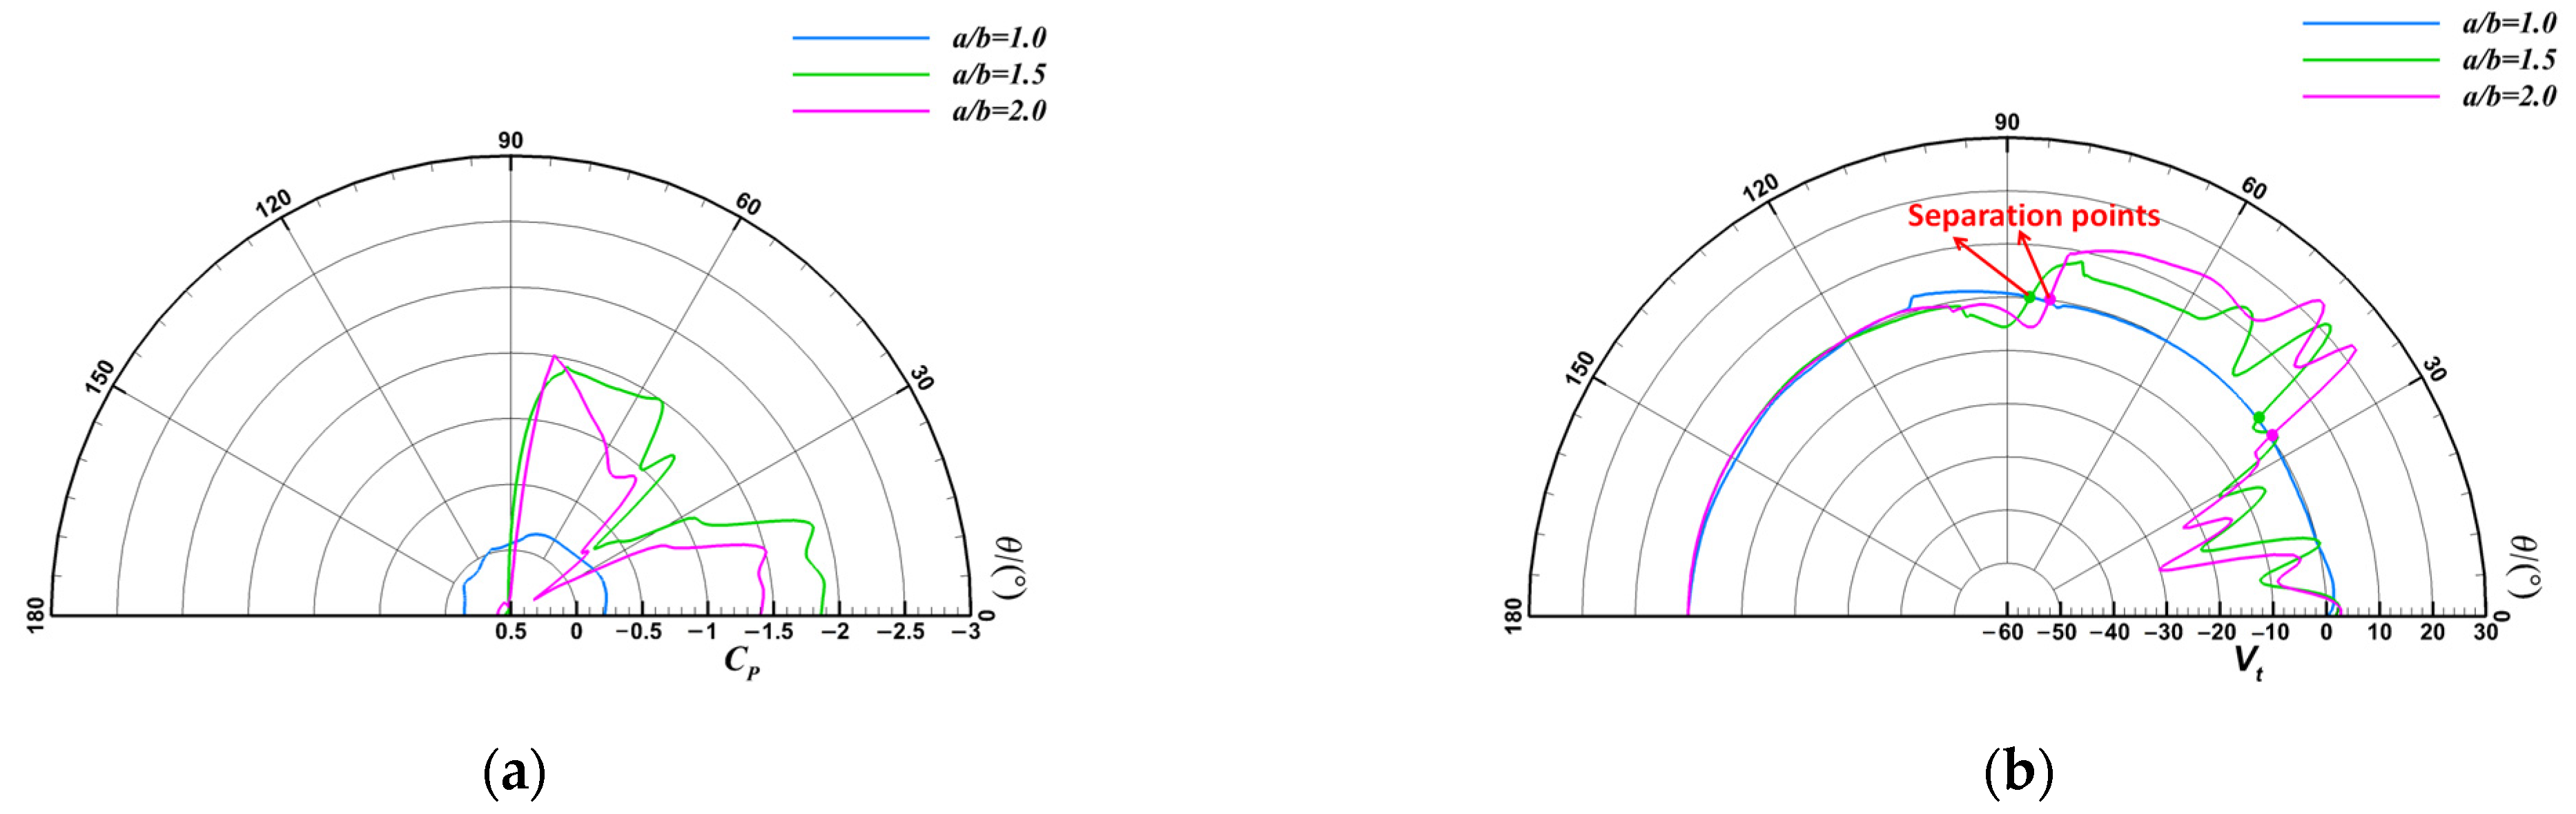
- As the ellipticity increases, the lift coefficient increases and then decreases. With the optimal ellipticity, the “virtual rudder surface” of the jet works best. The curvature at the exit and the curvature at the jet separation should be taken into account in the selection of ellipticity. In order to improve the jet control efficiency, the curvature change rate of the Coanda profile should be reduced as much as possible after the jet is attached at the exit.
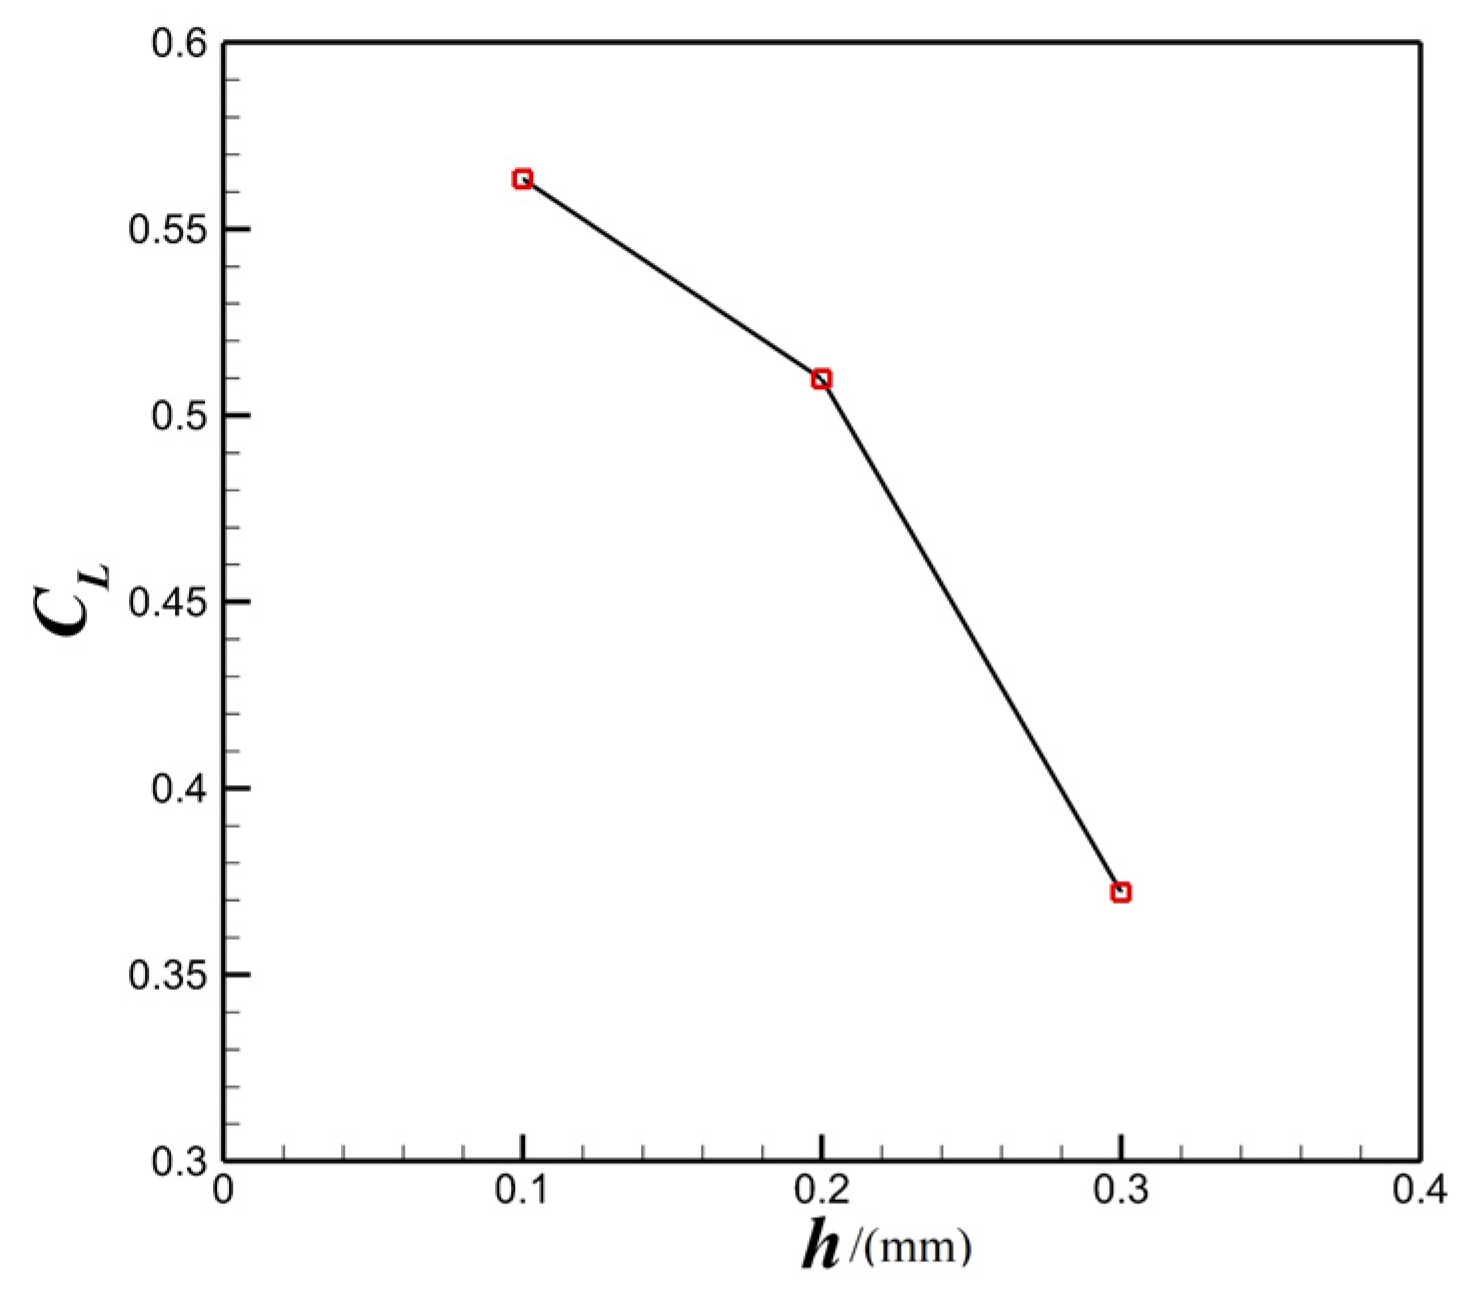
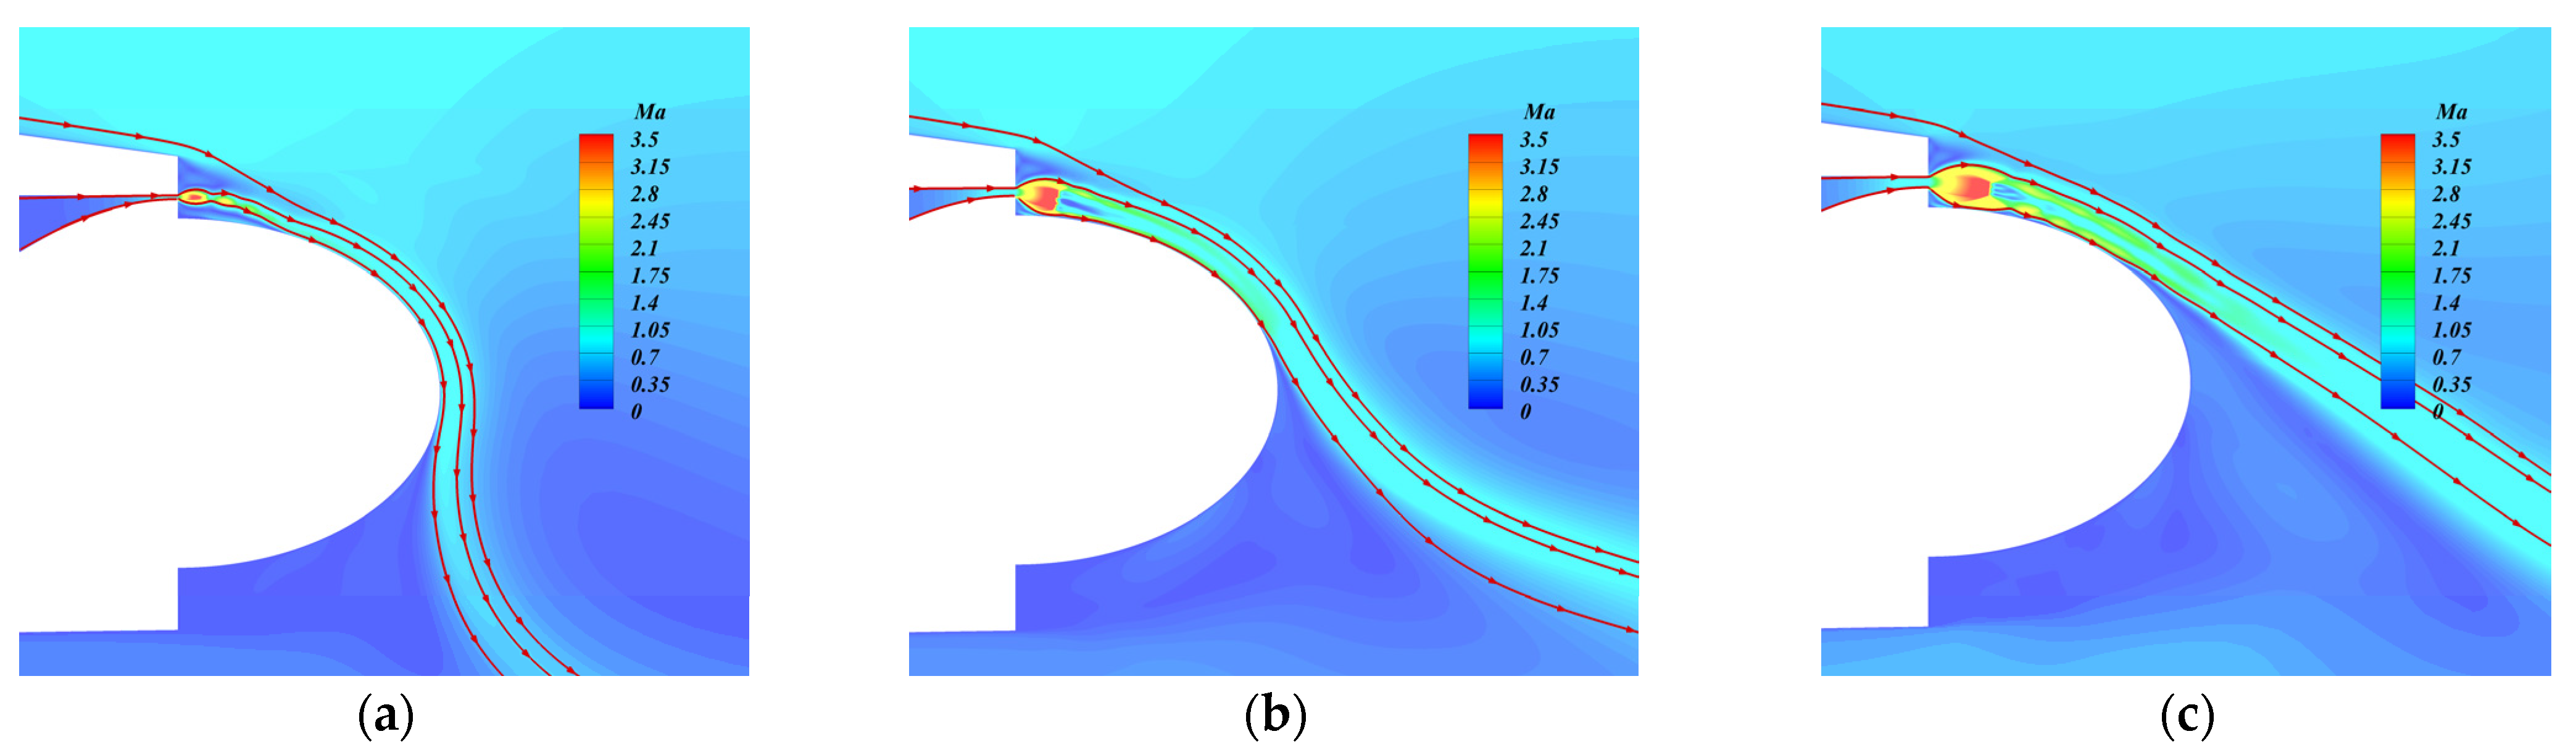
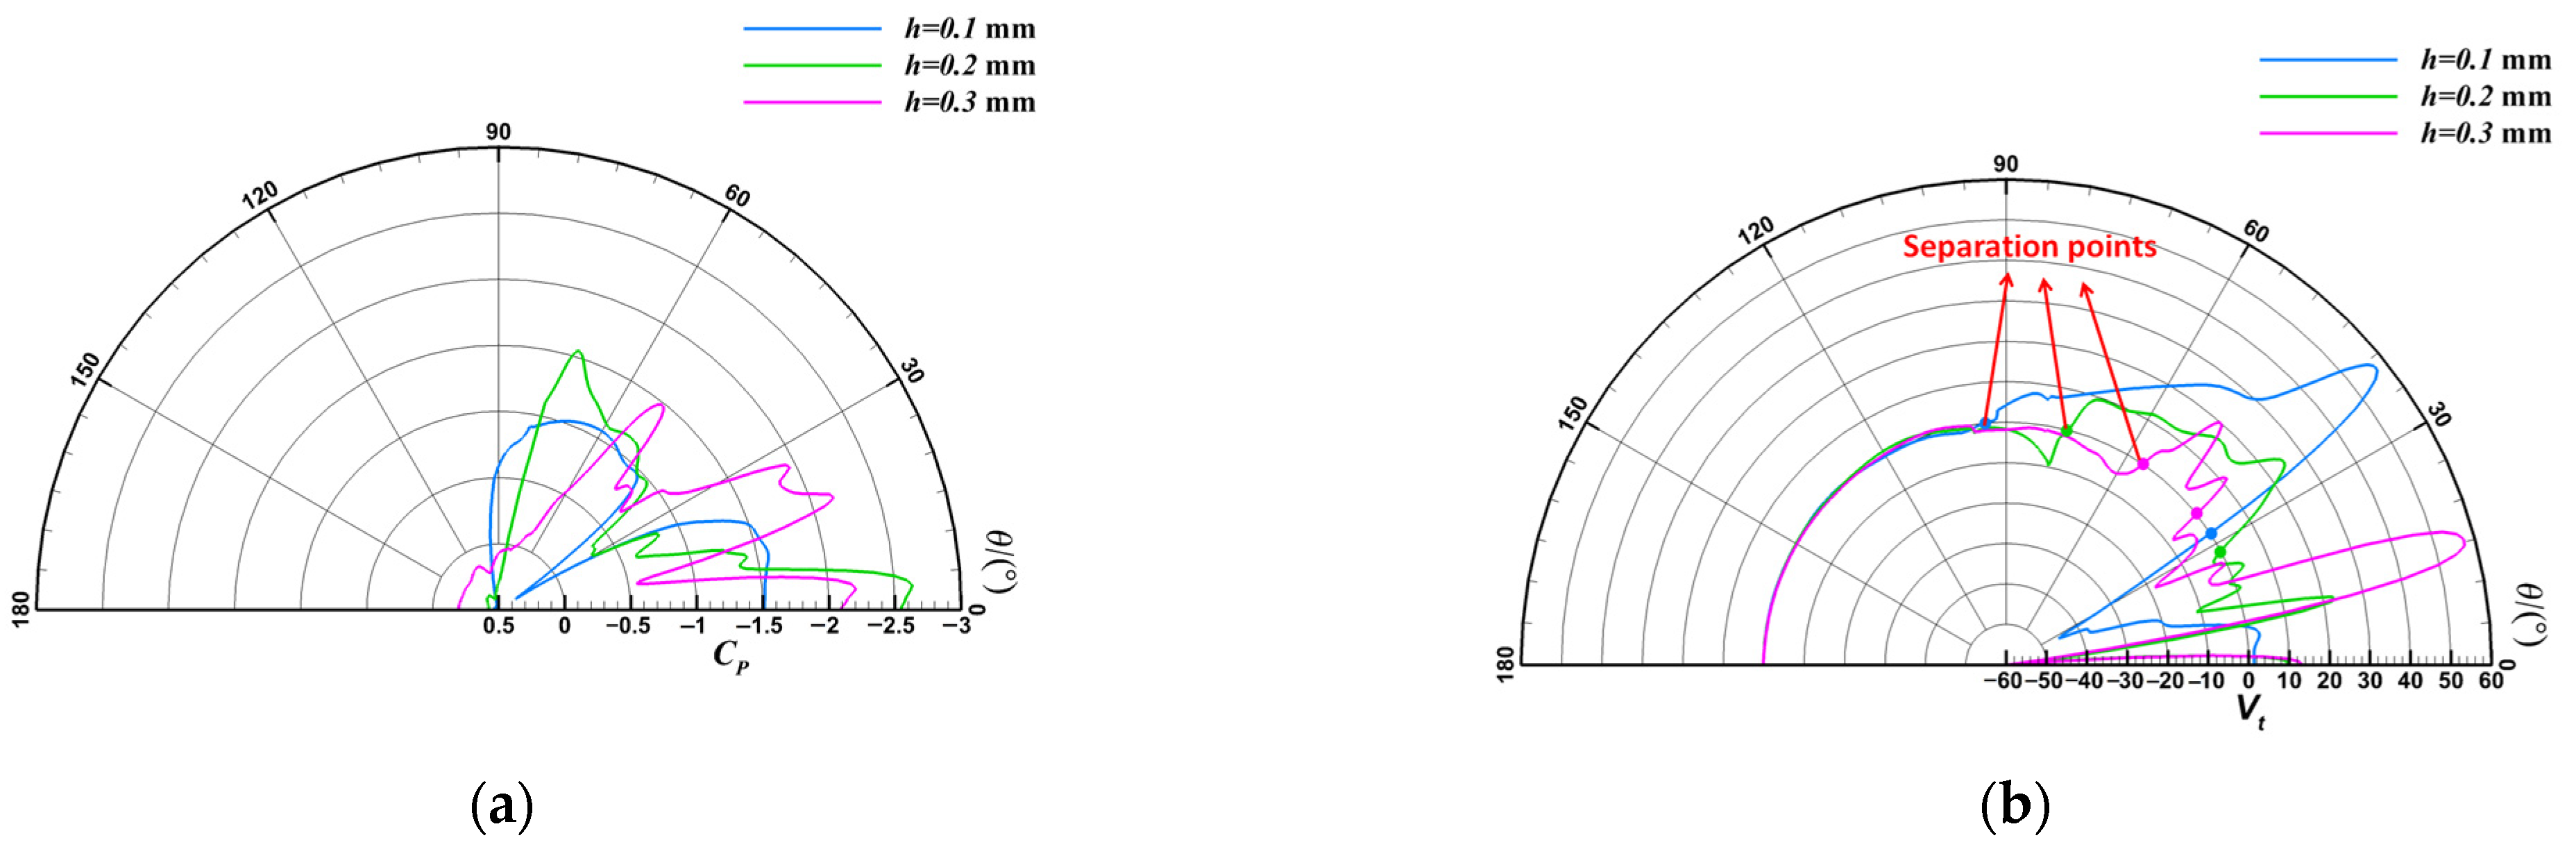
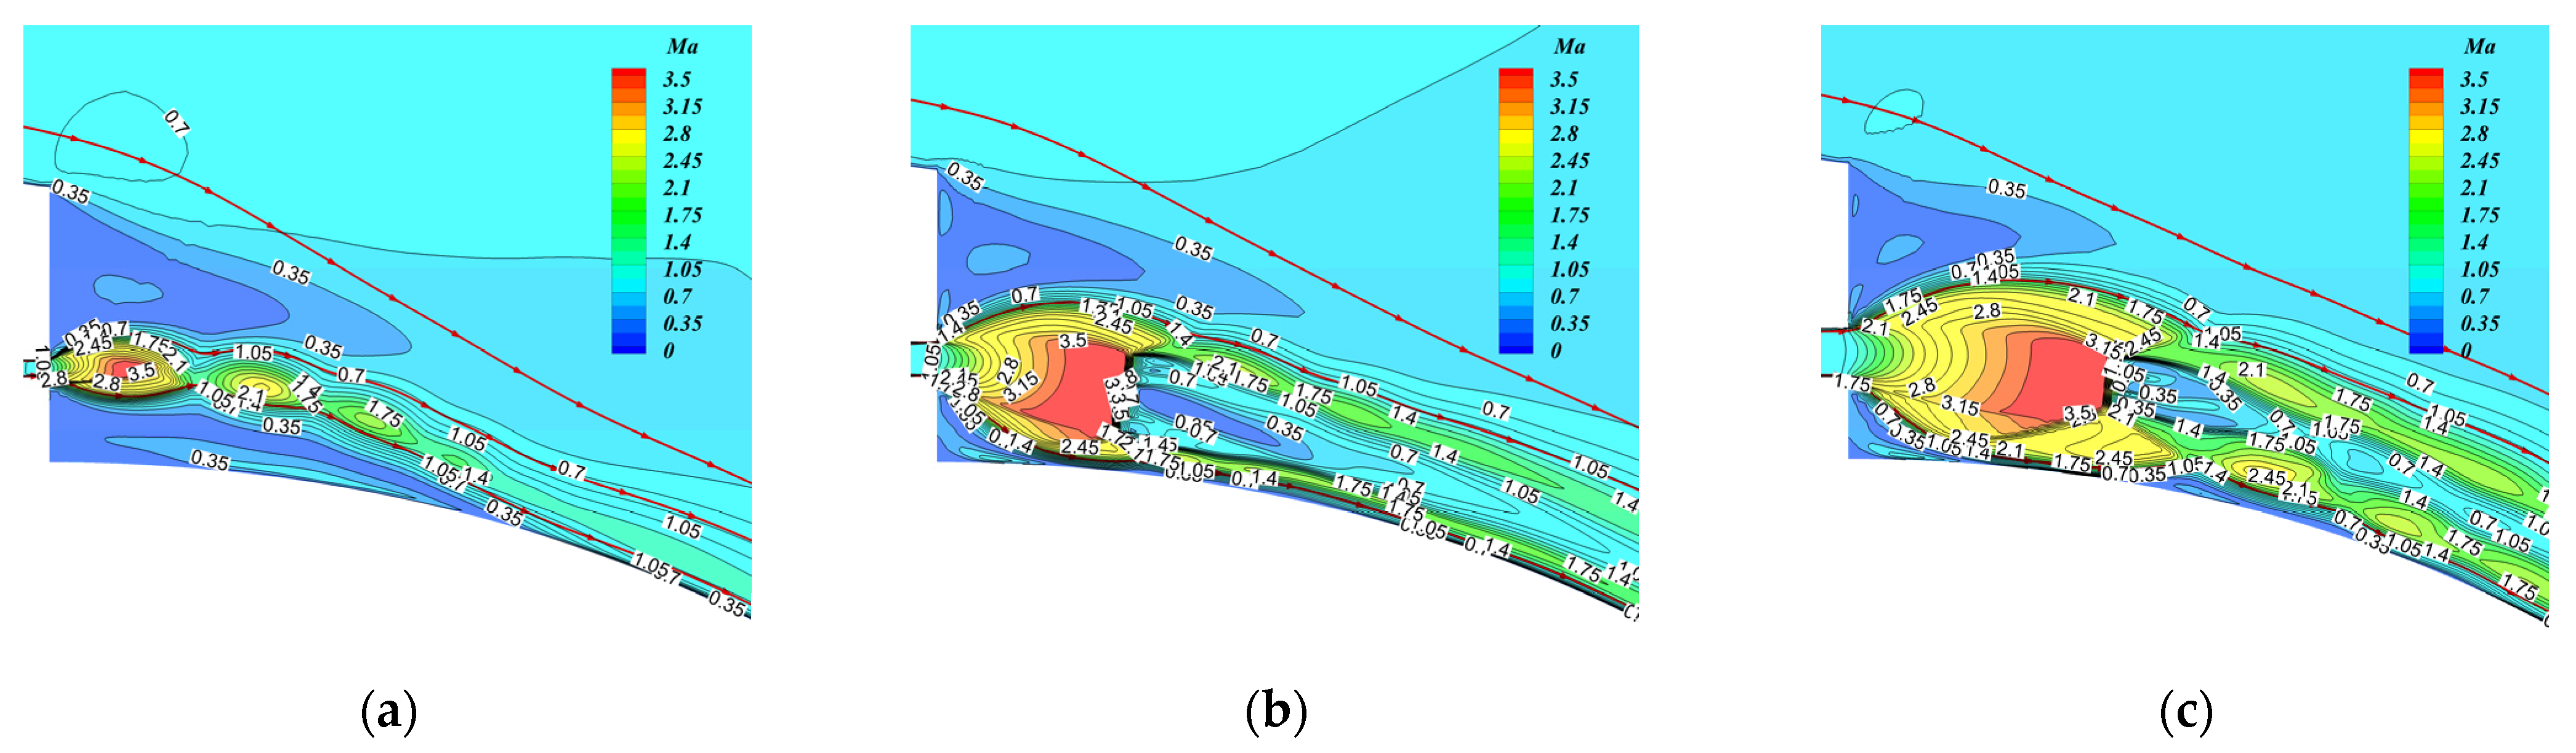
- At a high jet pressure ratio, as the nozzle height increases, the jet momentum and thickness increase, and the adhesion capability of the jet is reduced. At h = 0.3 mm, the shock structure at the jet exit stratifies the jet, and the bifurcated jet near the wall forms a sub-shock cell structure, which is not conducive to jet attachment. Reducing the nozzle height can improve the adhesion capability of the jet at a high pressure ratio.
- The next research direction is to study the stability of under-expanded jet based on the high precision numerical simulation methods (such as DDES and LES). A wind tunnel experimental study on jet circulation control airfoil is also carried out to study the structural details of the supersonic Coanda jet field using some test equipment and flow field measurement means.
Author Contributions
Funding
Data Availability Statement
Conflicts of Interest
Abbreviations
| RANS | Reynolds averaged Navier–Stokes equation |
| CC | Circulation control |
| CFD | Computational fluid dynamics |
| NASA | National aeronautics and space administration |
| TDT | Langley transonic dynamics tunnel |
| LES | Large eddy simulation |
| STOL | Short takeoff and landing |
| ICE | Innovative control effectors |
| EXP | Experiment |
| UAV | Unmanned aerial vehicle |
References
- Metral, A.R. On the Phenomenon of Fluid Veins and Their Application, the Coanda Effect. AF Transl. F-TS-786-RE 1939. [Google Scholar]
- Englar, R.J. Two-Dimensional Transonic Wind Tunnel Tests of Three 15-Percent Thick Circulation Control Airfoils; David W. Taylor Naval Ship Research and Development Center: Washington, DC, USA, 1970. [Google Scholar]
- Englar, R.J. Two-Dimensional Subsonic Wind Tunnel Tests of Two 15-Percent Thick Circulation Control Airfoils; David W. Taylor Naval Ship Research and Development Center: Washington, DC, USA, 1971. [Google Scholar]
- Englar, R.J. Low-Speed Aerodynamic Characteristics of a Small, Fixed-Trailing-Edge Circulation Control Wing Configuration Fitted to a Supercritical Airfoil; David W. Taylor Naval Ship Research and Development Center, Bethesda Md Aviation and Surface Effects Dept: Washington, DC, USA, 1981. [Google Scholar]
- Abramson, J. Two-dimensional Subsonic Wind Tunnel Evaluation of Two Related Cambered 15-Percent Thick Circulation Control Airfoils; David W. Taylor Naval Ship Research and Development Center, Bethesda Md Aviation and Surface Effects Dept: Washington, DC, USA, 1977. [Google Scholar]
- Novak, C.; Cornelius, K.; Roads, R. Experimental Investigations of the Circular Wall Jet on a Circulation Control Airfoil. In Proceedings of the 25th AIAA Aerospace Sciences Meeting, Reno, NV, USA, 24–26 March 1987. [Google Scholar] [CrossRef]
- NTRS—NASA Technical Reports Server. Available online: https://ntrs.nasa.gov/api/citations/20050165090/downloads/20050165090.pdf (accessed on 11 November 2021).
- Swanson, R.C.; Rumsey, C.L. Computation of Circulation Control Airfoil Flows. Comput. Fluids 2009, 38, 1925–1942. [Google Scholar] [CrossRef]
- Nishino, T.; Hahn, S.; Shariff, K. Large-Eddy Simulations of a Turbulent Coanda Jet on a Circulation Control Airfoil. Phys. Fluids 2010, 22, 125105. [Google Scholar] [CrossRef]
- Rumsey, C.L.; Nishino, T. Numerical Study Comparing RANS and LES Approaches on a Circulation Control Airfoil. Int. J. Heat Fluid Flow 2011, 32, 847–864. [Google Scholar] [CrossRef]
- Williams, D.R.; Seidel, J.; Osteroos, R. NATO AVT-239 Task Group: Flight Control Derivatives using Active Flow Control Effectors on the ICE/SACCON USA Model. In Proceedings of the AIAA Scitech 2019 Forum, San Diego, CA, USA, 7–11 January 2019. [Google Scholar] [CrossRef]
- Smith, D.; Warsop, C. NATO AVT-239 Task Group: ‘Innovative Control Effectors for Manoeuvring of Air Vehicles’—Introduction and overview. In Proceedings of the AIAA Scitech 2019 Forum, San Diego, CA, USA, 7–11 January 2019. [Google Scholar] [CrossRef]
- Savvaris, A.; Buonanno, A.; Jamil, R.; Tsourdos, A. Design and Development of the DEMON UAV Fluidic Flight Control System. In Proceedings of the AIAA Infotech @ Aerospace (I @ A) Conference, Boston, MA, USA, 19–22 August 2013. [Google Scholar] [CrossRef]
- Warsop, C.; Crowther, W. NATO AVT-239 Task Group: Flight Demonstration of Fluidic Flight Controls on the MAGMA Subscale Demonstrator Aircraft. In Proceedings of the AIAA Scitech 2019 Forum, San Diego, CA, USA, 7–11 January 2019. [Google Scholar] [CrossRef]
- Zhang, L.; Huang, Y.; Zhu, Z.L. Virtual Flight Test of Pitch and Roll Attitude Control Based on Circulation Control of Tailless Flying Wing Aircraft Without Rudders. Chin. J. Aeronaut. 2023. [Google Scholar] [CrossRef]
- Gregory-Smith, D.G.; Senior, P. The Effects of Base Steps and Axisymmetry on Supersonic Jets over Coanda Surfaces. Int. J. Heat Fluid Flow 1994, 15, 291–298. [Google Scholar] [CrossRef]
- Carpenter, P.W.; Green, P.N. The Aeroacoustics and Aerodynamics of High-Speed Coanda Devices, PART 1: Conventional Arrangement of Exit Nozzle and Surface. J. Sound Vib. 1997, 208, 777–801. [Google Scholar] [CrossRef]
- Forster, M.; Steijl, R. Numerical simulation of transonic circulation control. In Proceedings of the 53rd AIAA Aerospace Sciences Meeting, Kissimmee, FL, USA, 5–9 January 2015. [Google Scholar] [CrossRef]
- Llopis-Pascual, A. Supercritical Coanda Jets for Flight Control Effectors. Ph.D. Thesis, Manchester University, Manchester, UK, 2016. [Google Scholar]
- Wang, Q.; Qu, F.; Zhao, Q.; Bai, J. Numerical Study of the Hysteresis Effect on the Supercritical Airfoil for the Transonic Circulation Control. Aerosp. Sci. Technol. 2022, 126, 107645. [Google Scholar] [CrossRef]


| Design Parameters | Value Range |
|---|---|
| Jet pressure ratio, (NPR) | 2, 3, 4, 5, 6, 7, 8 |
| Ellipticity, (a/b) | 1.0, 1.5, 2.0 |
| Nozzle height, (h), mm | 0.1, 0.2, 0.3 |
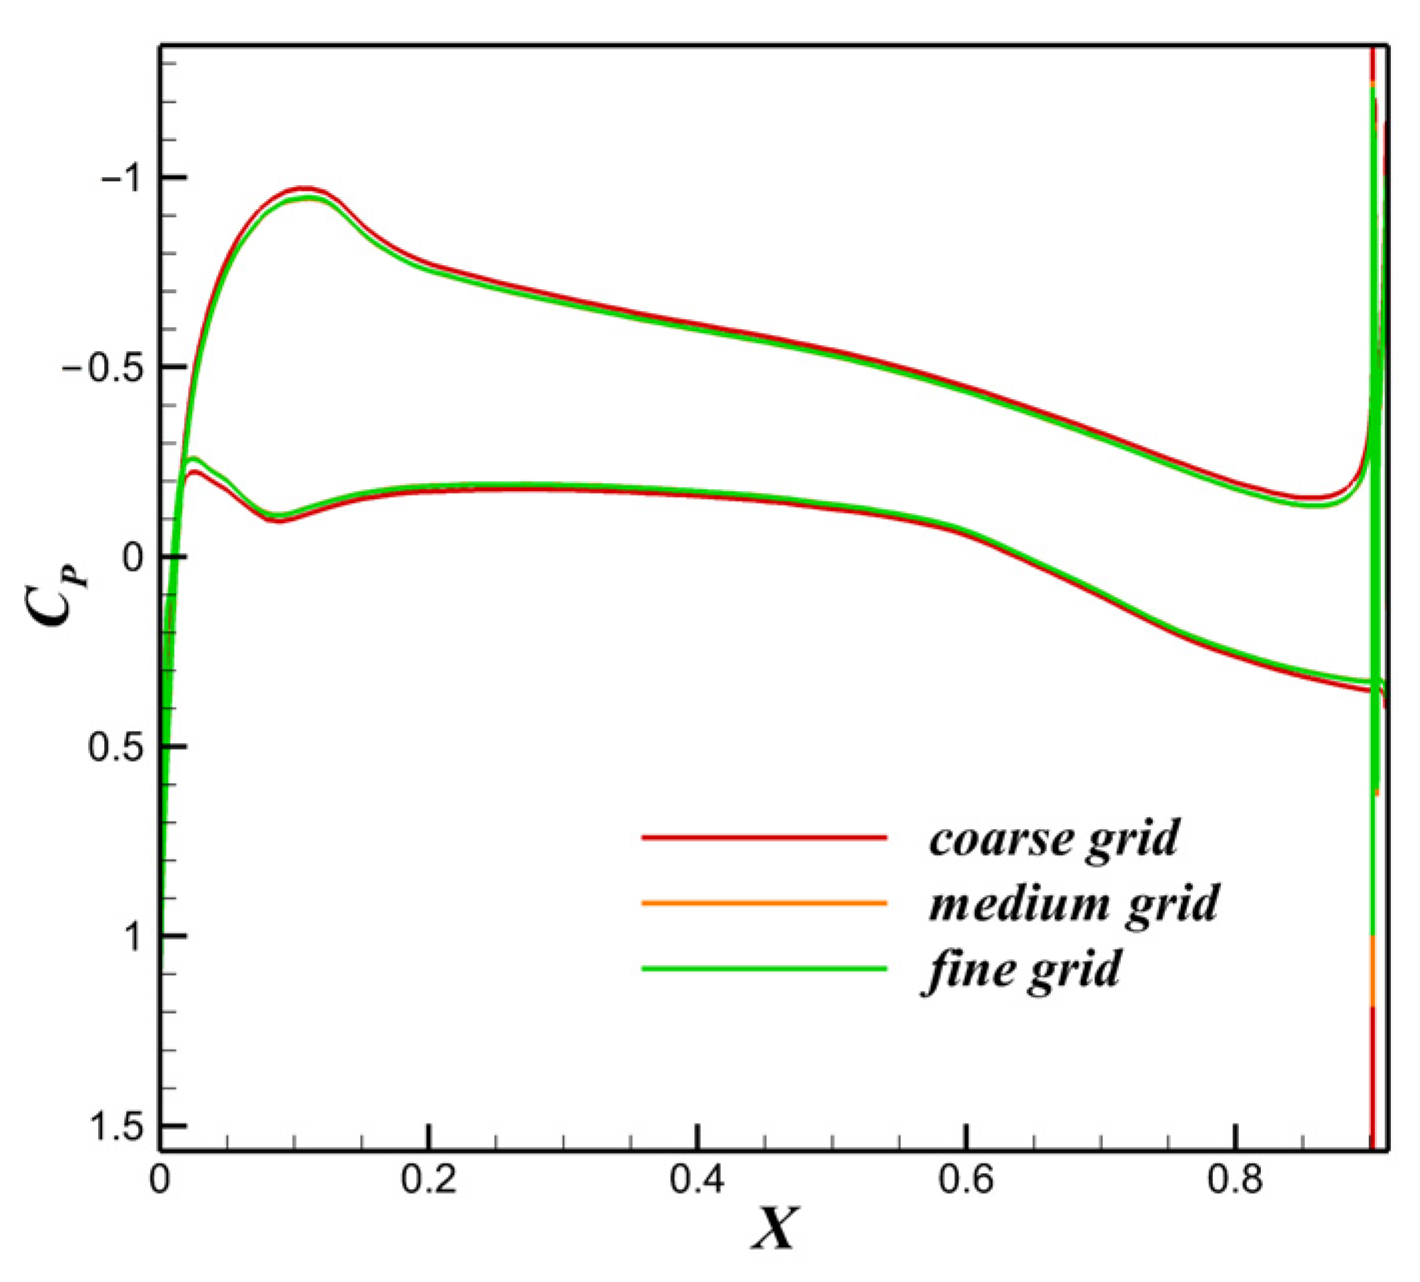
| Grid Size | CL | CD | NPR | |
|---|---|---|---|---|
| L0 | 0 | 0.4276 | 0.010256 | 4 |
| L1 | 0 | 0.4258 | 0.010248 | 4 |
| L2 | 0 | 0.4570 | 0.010657 | 4 |
Disclaimer/Publisher’s Note: The statements, opinions and data contained in all publications are solely those of the individual author(s) and contributor(s) and not of MDPI and/or the editor(s). MDPI and/or the editor(s) disclaim responsibility for any injury to people or property resulting from any ideas, methods, instructions or products referred to in the content. |
© 2023 by the authors. Licensee MDPI, Basel, Switzerland. This article is an open access article distributed under the terms and conditions of the Creative Commons Attribution (CC BY) license (https://creativecommons.org/licenses/by/4.0/).
Share and Cite
He, M.; Zhang, L.; Li, C.; Zhao, L. Flow Characteristics and Parameter Influence of the Under-Expansion Jet on Circulation Control Airfoil. Energies 2023, 16, 3818. https://doi.org/10.3390/en16093818
He M, Zhang L, Li C, Zhao L. Flow Characteristics and Parameter Influence of the Under-Expansion Jet on Circulation Control Airfoil. Energies. 2023; 16(9):3818. https://doi.org/10.3390/en16093818
Chicago/Turabian StyleHe, Meng, Liu Zhang, Chang Li, and Lei Zhao. 2023. "Flow Characteristics and Parameter Influence of the Under-Expansion Jet on Circulation Control Airfoil" Energies 16, no. 9: 3818. https://doi.org/10.3390/en16093818