Article

Nuclear Power Plant to Support Indonesia’s Net Zero Emissions: A Case Study of Small Modular Reactor Technology Selection Using Technology Readiness Level and Levelized Cost of Electricity Comparing Method

by
Mujammil Asdhiyoga Rahmanta
1,*,
Andang Widi Harto
2,
Alexander Agung
2 and
Mohammad Kholid Ridwan
2
1
PT. PLN (Persero) Puslitbang Ketenagalistrikan (Research Institute), Jalan Duren Tiga No. 102, Jakarta 12760, Indonesia
2
Department of Nuclear Engineering and Engineering Physics, Universitas Gadjah Mada, Jalan Grafika No. 2, Yogyakarta 55281, Indonesia
*
Author to whom correspondence should be addressed.
Energies 2023, 16(9), 3752; https://doi.org/10.3390/en16093752
Submission received: 11 April 2023 / Revised: 25 April 2023 / Accepted: 26 April 2023 / Published: 27 April 2023
(This article belongs to the Topic Low Carbon Economy and Sustainable Development)

Abstract

:
Most power plants, particularly those that burn fossil fuels such as coal, oil, and gas, create CO2, a greenhouse gas that contributes to climate change. By 2060, the Indonesian government has committed to reach net zero emissions. With the lowest CO2 emissions, nuclear power plants are dependable sources of energy. Small modular reactors (SMRs) are a particular kind of nuclear power plant that has the potential to be Indonesia’s first commercial nuclear power plant because of their small size, low capacity, uncomplicated design, and modular characteristics. The purpose of this study is to examine the economics and technological feasibility of SMRs. In this analysis, the levelized cost of electricity (LCOE) comparative method and the technology readiness level (TRL) approach are both applied. The SMRs with a minimum TRL value of 7 were CAREM-25 (TRL7), KLT-40S (TRL8), and HTR-PM (TRL 8), according to the results of this research. Although CAREM-25 and KLT-40S are still in the demonstration stage and have not yet entered the market, their LCOE estimates are greater than 0.07 USD/kWh with a 5% discount rate. Whereas CAREM 100 MW is an economy scale from CAREM-25 and VBER 300 MW is a commercial size from KLT-40S, HTR-PM is already an economy scale. With discount rates between 5% and 10%, the LCOE values of HTR-PM, CAREM 100 MW, and VBER 300 MW range from 0.06 USD to 0.12 USD per kWh. Other than hydropower and coal-fired power plants, these LCOE figures can compete with the local LCOE in Indonesia and the LCOE of a variety of other types of power plants.

1. Introduction

Some of the occurrences brought on by climate change include increasing sea levels, melting glaciers, more intense storms, and greater drought [1]. Due to the current trend of global warming brought on by a rise in the amount of greenhouse gases in the atmosphere, climate change is a global issue. CO2, CH4, N2O, and F-gases are examples of greenhouse gases. The main source of CO2, which makes up more than 65% of greenhouse gases, is industrial activity and the burning of fossil fuels. Electricity and heat generation (25%), industry (24%), transportation (14%), other energy (10%), and building (6%) were the sectors that contributed the most to greenhouse gas emissions in 2014 [2]. From 3.09 billion tons of CO2 in 1921 to 37.12 billion tons of CO2 in 2021, global emissions have sharply increased [3]. To address the issue of global warming and climate change, nations approved the Kyoto Protocol in 1998, which aims to reduce the production of greenhouse gas emissions. Indonesia accepted the Kyoto Protocol and the United Nations Framework Convention on Climate Change (UNFCCC) [4]. The penetration objective of the renewable energy mix in Indonesia will be raised to 23% by 2025 as one way to reduce emissions in the electrical industry [5].
Due to Indonesia’s geographic location as an archipelago, it is challenging to construct an inter-island electricity interconnection infrastructure. Only the islands of Java, Bali, and Madura have significant inter-island interconnection systems, with Java’s electrical load accounting for more than 70% of the country’s electricity. From 2015 through 2020, Indonesia’s electricity demand is expected to climb by about 3.5% annually. The installed capacity of the power plants in Indonesia is 61.13 GW in 2020. Coal-fired power plants (CFPP) provide more than 50% of Indonesia’s electricity [6,7]. The abundance of Indonesian coal reserves is one of the key elements of the CFPP. In 2021, Indonesia produced 614 million tons of coal, of which 481 million tons (78%) were exported and the remaining 133 million tons (22%) were used for domestic electricity needs [8]. The penetration of renewable energy sources in Indonesia is very modest, with hydropower plants accounting for the majority in 2020, with 4.9 GW (8%), and geothermal power plants accounting for 2.44 GW (3.9%) [7].
Fossil fuels including coal, oil, and gas are among the sources of greenhouse gases, including CO2, which they produce. Global warming could be accelerated by the CO2 emissions from coal combustion in CFPP [9]. The following power generating methods produce the most CO2 equivalent per kWh: coal (820), biomass combustion (740), natural gas (490), solar photovoltaic (48), geothermal (38), hydropower (24), and nuclear power plants (12). The biggest emissions come from power plants that burn coal, such CFPP [10]. To reach carbon neutrality by the year 2060, PT. PLN (Persero), a government-owned electricity utility business, aims for a renewable energy mix of 24.8% in 2030, the majority of which comes from hydropower plants (15%), geothermal (6%), and solar power (5%). The Indonesian government is also considering using a nuclear power plant (NPP), which is anticipated to start operating in 2045 and have a 35 GW capacity through 2060 [11]. In Indonesia, sustainable energy options such as NPPs and renewable energy can help minimize expensive oil imports [12]. In general, Indonesia’s dependence on foreign financial support for NPP development and its relatively limited understanding of NPP technology have a significant negative impact on the development of NPPs [13].
Nuclear reactors are still being used in Indonesia for medical and technical research as of right now. Three nuclear reactors in Indonesia are run by the National Energy Atomic Agency (BATAN), namely: G.A. Siwabessy with a capacity of 30 MW, Triga 2000 with a capacity of 2 MW, and Kartini 100 kW. Before the 1990s, all of these reactors were in use [14,15]. Both the public and private sectors in Indonesia have conducted feasibility studies on industrial-scale NPPs. Some of these research projects include The Muria Peninsula Study, carried out in 1983 by the National Energy Atomic Agency (BATAN) and NIRA (Nuclear Italiana Reacttori Avancatti), which established the possibility of the site for the construction of an NPP. Then, the feasibility study for the first nuclear power plants in the Muria Peninsula region, which included forecasts of electricity demand and supply in Java and Bali with NPPs, was continued by New Japan Engineering Consultants (NEWJEC Inc.), in 1993. According to the assessment, Indonesia may construct 12 reactors with a combined capacity of 600 MW, with construction beginning in 1996 and ending with full commercial operation in 2003 [16]. In 2009, the BATAN organization completed research titled “Utilization of Nuclear Science and Technology for the Welfare of the Community of Bangka-Belitung.” According to the report’s results, an NPP with a 10 GWe capacity could be built, consisting of six NPP reactors at Tanjungular in West Bangka’s Muntok and four NPP reactors at Sebagin Village Coast in South Bangka [17,18].
A new technology called the small modular reactor (SMR) is in development. This concept has been used in the military, particularly for the USSR and USA’s warships and submarines’ energy sources [19]. The majority of small-scale NPP components are created and manufactured as modules (modularization) to make work on-site easier. This offers benefits, including shorter construction times than for non-modularized reactors, higher safety margins, ease of network adaptation, flexible (multifunctional) design, cheap capital costs, and lengthy fuel change intervals [20,21]. While the challenges of this SMR include license, siting, multiple units/modules at the same site, and the number of reactors needed to meet energy needs and be competitive [22], the competitive level of this SMR depends on the production series, which is getting greater. Due to the advantages of its modular architecture for manufacturing, transportation, and assembly, SMR has the potential to offer competitive energy costs [23]. Reducing the initial investment, co-sitting economics, learning, scalability economics, and system modularization are a few strategies to improve the economics of SMRs [24]. The challenge posed by the development of SMRs is the need to optimize production procedures in order to boost productivity and cut costs. Manufacturing should take place in factories that are fully automated and the level of modularity in reactor design should be raised [25]. The Korea Atomic Energy Research Institute (KAERI) and BATAN, among others, conducted a study titled “A preliminary economic feasibility evaluation of nuclear desalination in Madura Island” in 2001 that was one of many studies on the use of SMR in Indonesia. The research mentions the usage of two 100 Megawatt SMR reactors on Madura Island that were designed by KAERI and are expected to start up in 2005 [26]. Studies on the utilization of “Floating Small SMR in Gorontalo, Sulawesi Island” have also been done by BATAN and ROSATOM. The Akademik Lomonosov type of floating NPP will be used and a prototype is still being used for testing [18].
A measure known as the levelized cost of electricity (LCOE) is used to assess the relative costs of producing energy from various sources over the course of a power production asset’s lifetime. In terms of dollars per unit of energy, it is the overall cost of constructing, running, and maintaining a power generation asset divided by the total quantity of energy produced over the asset’s lifetime (e.g., dollars per kilowatt-hour) [27,28,29,30,31]. Calculating the LCOE of small modular reactor plants is difficult because there is very little data on commercial SMR operation. In NuScale Power’s Spring 2020 update, they stated that their target LCOE for the 12-module UAMPS project was 0.065 USD/kWh but more general analyses have estimated that the LCOE of SMRs could be anywhere from 0.045 USD to 0.095 USD/kW [32,33]. Several studies with different capital costs demonstrate that the LCOE of NPPs ranges from 0.04 to 0.14 USD/kWh [34]. The goal of this study is to identify a type of SMR technology that is ready for commercial application and to analyze its economics. This study differs from earlier ones in that it compares the LCOE of several types of Indonesian power plants to determine the readiness of the NPP SMR technology and its economics. The advantages of this study include highlighting the most recent advancements in SMR technology, aspects of SMRs technology readiness, and a comparison of the economics of SMRs for various locations in Indonesia related to LCOE, which is expected to serve as a modest benchmark for the development of Indonesia’s first NPP.
(1) An introduction that explains the context of the plan to utilize SMR and the progression of research on the use of NPPs that has been conducted in Indonesia; (2) materials and techniques; (3) results and discussion; this section includes information and analysis on SMR preparedness as well as a comparison of their LCOE to the LCOE currently in place in Indonesia. The summation of this research is then put to rest in (4) conclusion. There are (5) references in the last section.

2. Materials and Methods

The Technology Readiness Level Scale (TRL) was created by the National Aeronautics and Space Administration (NASA) as a tool to support the management of technology development for its space program. Other industries, including aerospace and energy, as well as the European Union later adopted the TRL [35,36,37]. NASA divides TRL into nine levels, starting at level 1 (basic principles) and ending at level 9 (proved technology) [36,38]. The Regulation of the Ministry of Research, Technology, and Higher Education No. 42 of 2016 is the reference for the technology readiness level (TRL) for the application of technology in Indonesia. The regulation specifies nine degrees of technology readiness, with level 1 (TRL 1) being the lowest level and levels 2 through 9 (TRL 9) being the highest levels [39]. TRL is also used to assess the development of nuclear fuel and NPP materials, where it serves as a program management and maturity assessment tool [
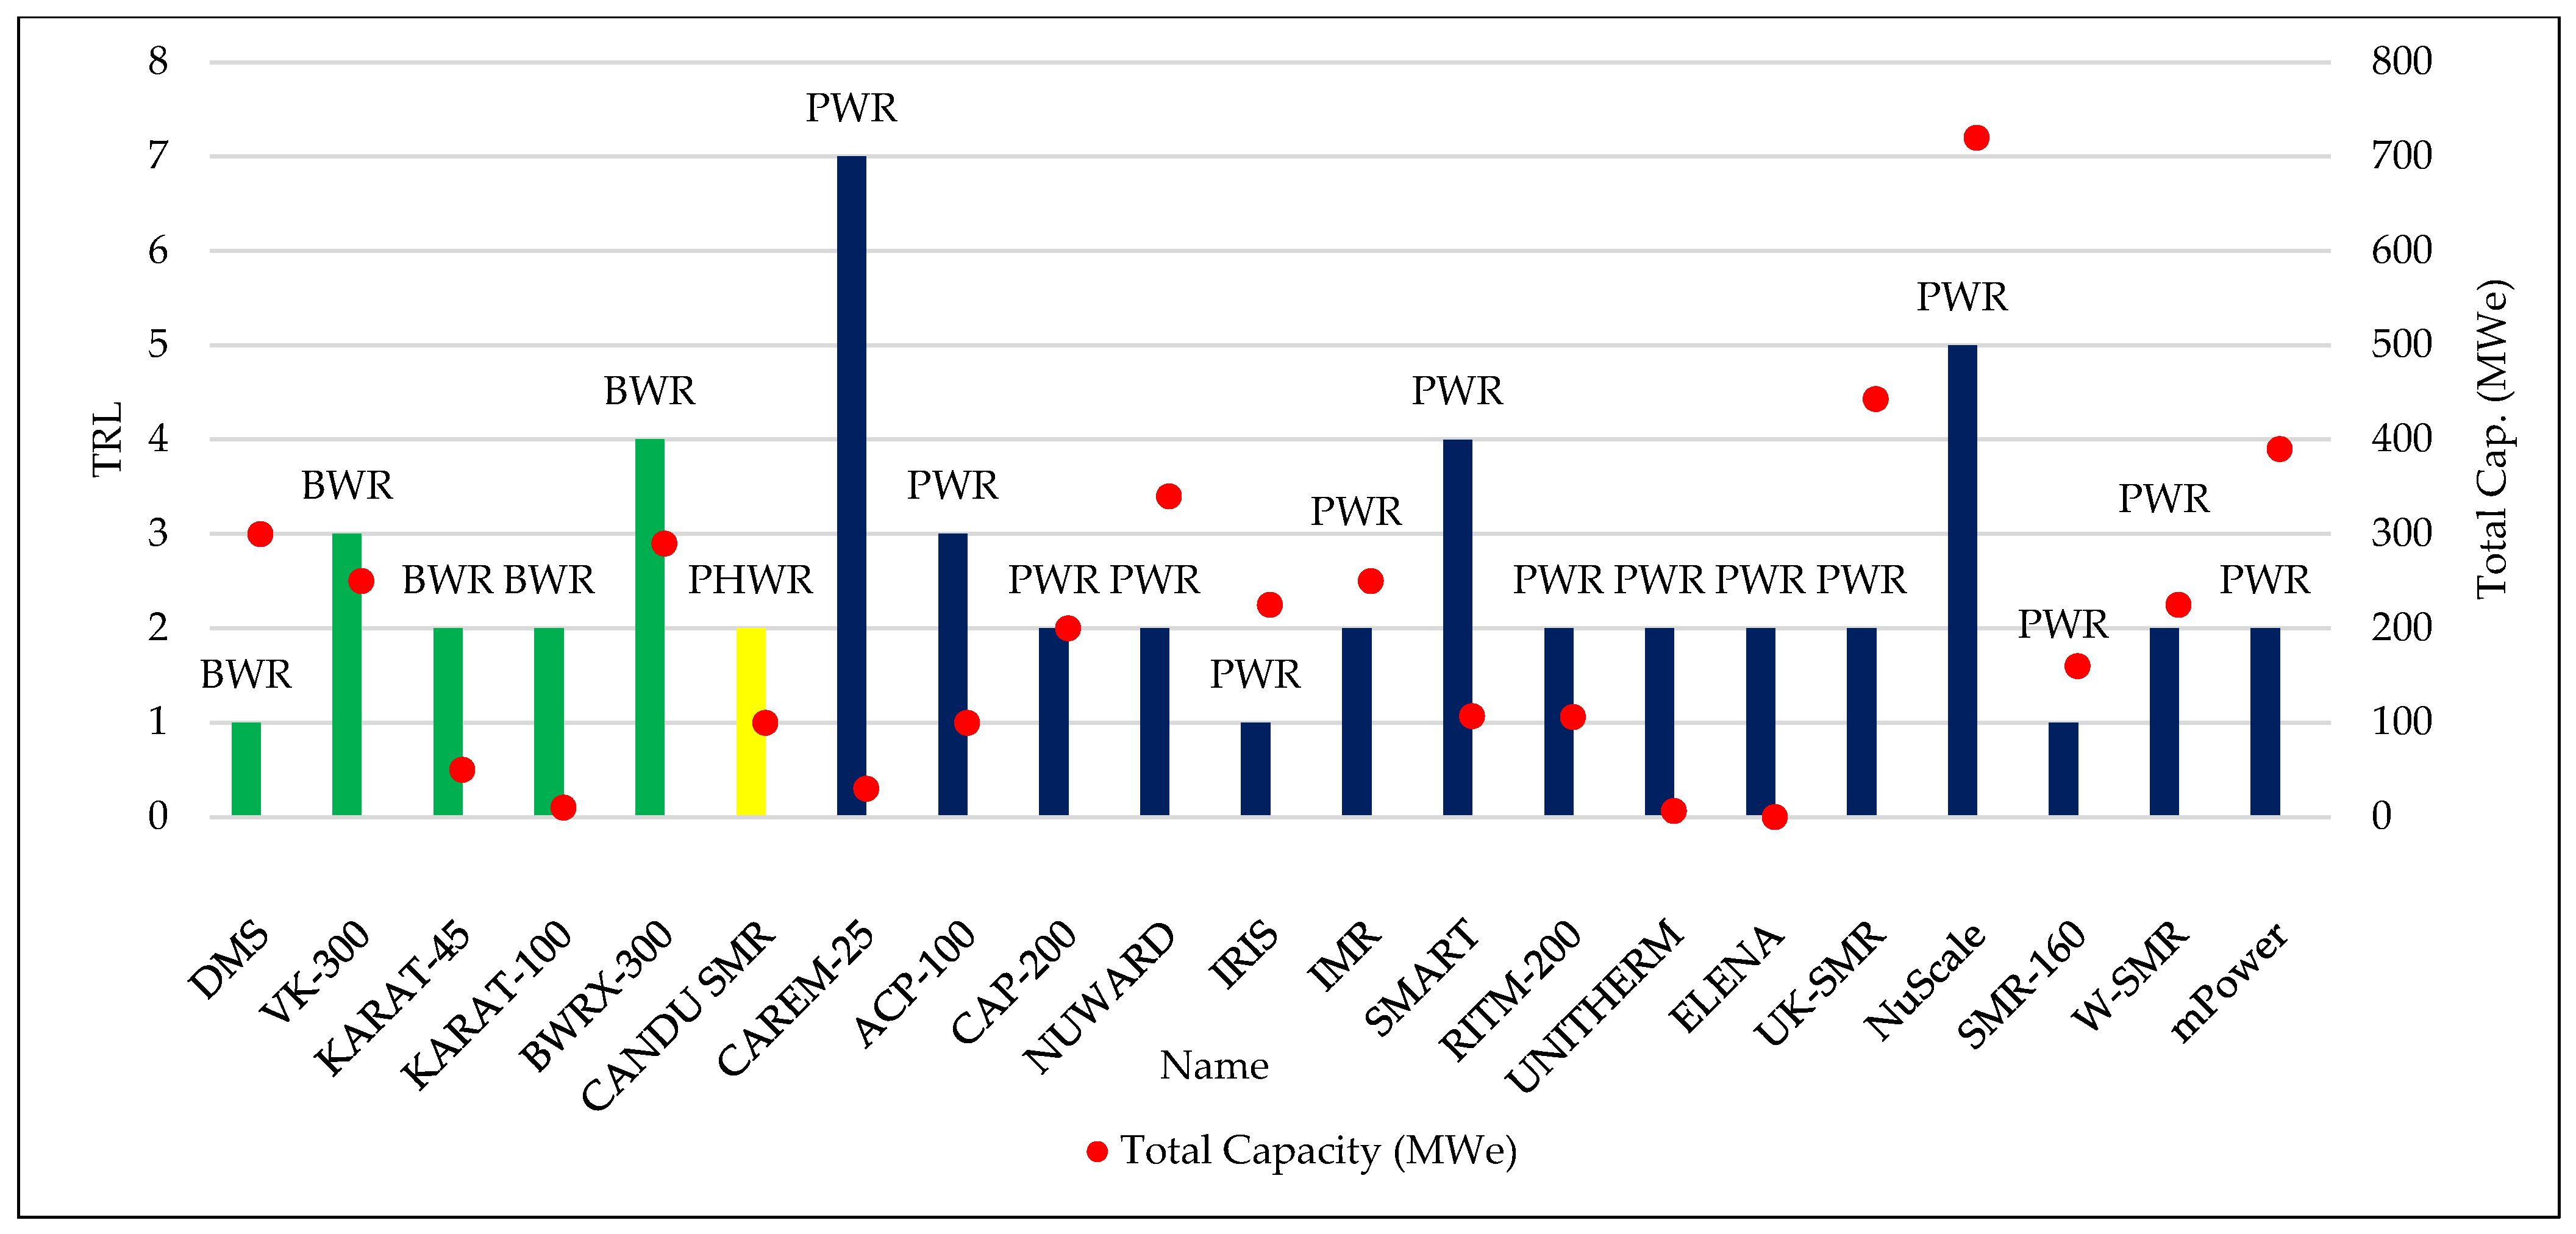
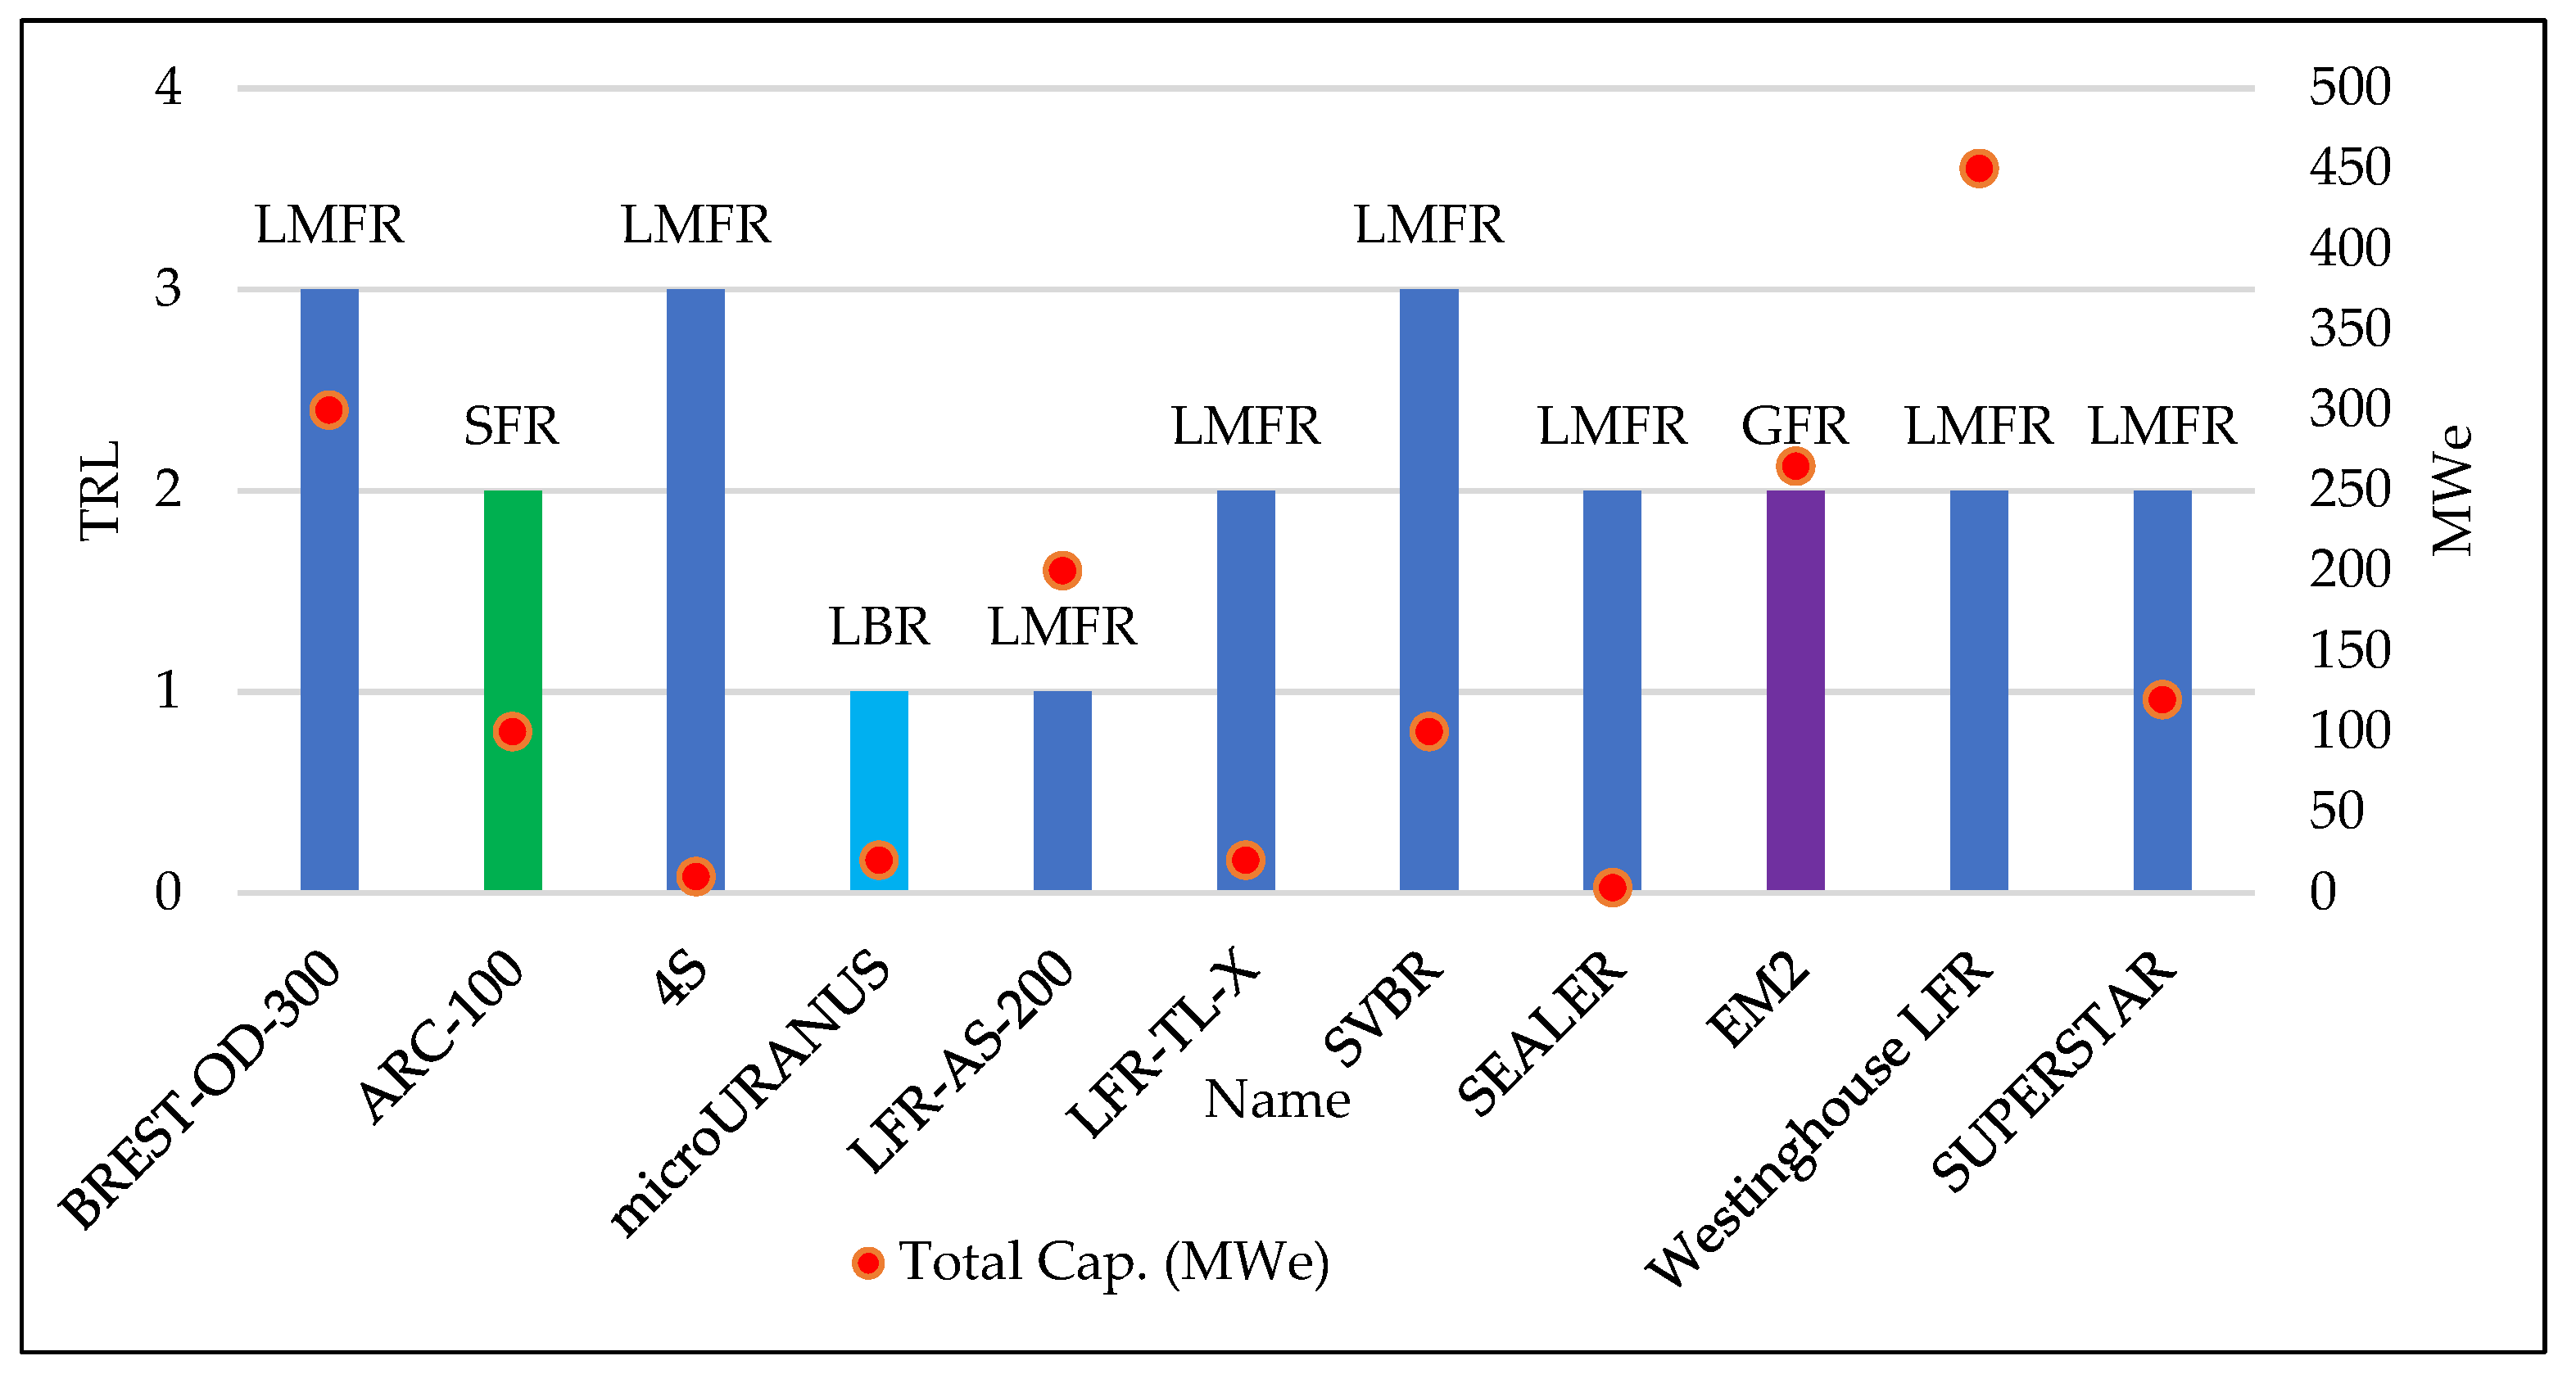
40]. The technologies that can be used for commercial endeavors include TRL 7 (system prototype demonstration in operational environment), TRL 8 (system complete and qualified), and TRL 9 (actual system proven in operational environment). According to the TRL listed in Table 1, the SMR technology data will be categorized and examined. The IAEA’s Advanced Reactors Information System (ARIS), which contains information on the state of the most recent SMR technology advancements, is used to compile data on SMR technology. The SMR NPP is chosen depending on the available nuclear technology after obtaining one that is acceptable for commercial operation. The lowest TRL level of SMR technology that is usable is 7.
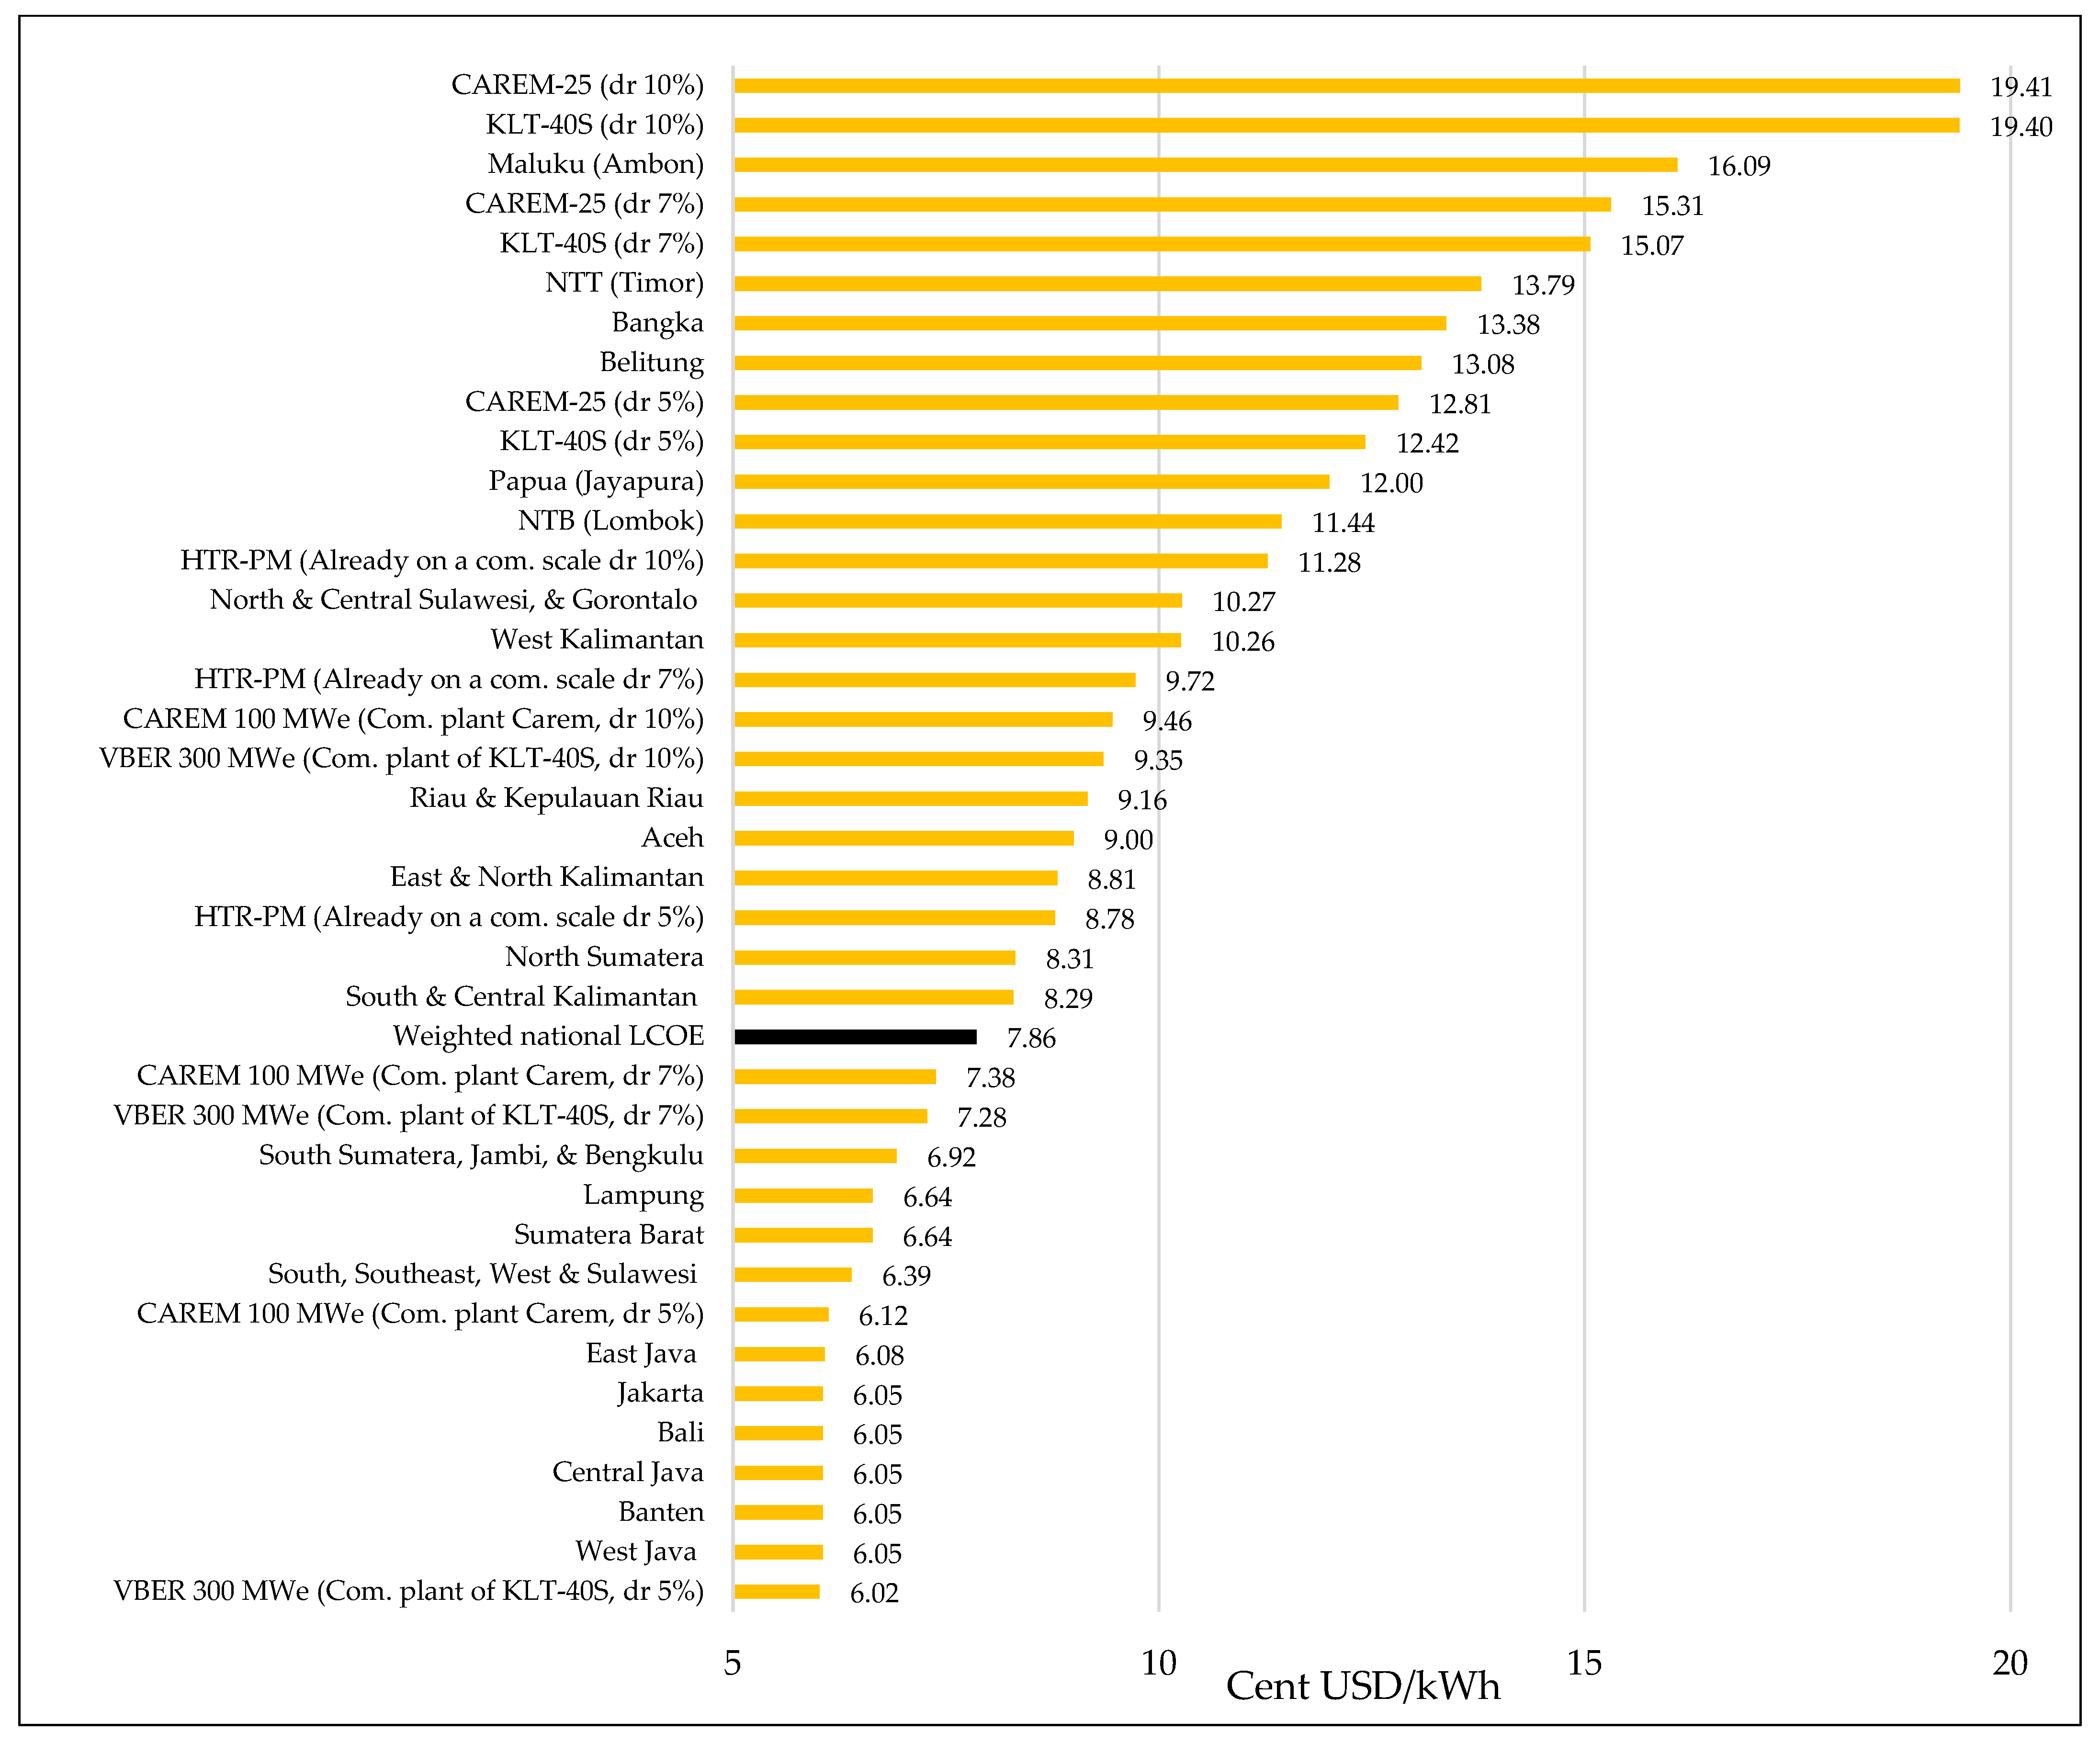
The next stage is to examine the technology’s economics after identifying the sort of SMR technology that has a minimum TRL value of level 7. Calculating LCOE is the process used in the economic study of power plants. When comparing technologies with various operating characteristics, LCOE is a highly useful tool. The LCOE of the NPP SMR, which is categorized into TRL 7, 8, and 9, will be compared. The LCOE is then contrasted with the LCOE of power plants and the weighted LCOE in various Indonesian areas.
LCOE is calculated by using the following formula [30,31]:
L C O E = t ( I n v e s t m e n t t + O & M t + F u e l t + D e c o m m i s i o n i n g t ( 1 + r ) t ) t ( E l e c t r i c i t y t ( 1 + r ) t )
where:
L C O E : Levelized cost of electricity;
I n v e s t m e n t t : Investment costs in the year “t”;
O & M t : Operation and maintenance costs in the year “t”;
F u e l t : Cost of fuel in year “t”;
D e c o m m i s i o n i n g t : Decommissioning costs in the year “t”;
E l e c t r i c i t y t : Total electrical energy produced in the year “t”;
r : Discount rate of E l e c t r i c i t y t ;

3. Results

3.1. NPP Technology and SMR Types

3.1.1. Development of NPPs

To further enhance safety, dependability, and economic features, NPPs have been created and undergone several upgrades. The performance of NPPs has improved along with NPP technology advancements, such as a rise in NPP capacity factor (CF), which went from only having a CF value of roughly 30% above 80% in the 1970s to 70% above 80% in the 2020s. This evolution has occurred in a few of the generations depicted in Figure 1, namely [41,42]:
  • Generation 1, which includes early-stage NPP technology (1950–the 1960s);
  • Generation 2 NPP technology, which has advanced and been standardized (development in the 1960s–1980s);
  • Generation 3, an advancement of NPP Generation 2 that aims to increase economy, safety, and dependability (development 1980–2000);
  • Generation 3+, a development of the NPP generation 3 that typically involves the inclusion of new passive safety systems and extra safety systems (development after 2000);
  • Generation 4; these reactors, which are slated for deployment by 2030, are anticipated to be very cost-effective, feature improved safety features, and generate less waste. The Pb/Bi-cooled SVBR-75/100, a modular reactor with 100 MW of power per module, serves as an illustration.
The three generations of nuclear power plants that are now in use are Generation 2, Generation 3, and Generation 3+. The brand-new, technologically advanced NPPs are called Generation 3 and Generation 3+. Water is typically used as a moderator or coolant in Generation 3 and Generation 3+ NPPs, which are typically NPPs with high power. PWR (pressurized water reactor), BWR (boiling water reactor), and PHWR (pressurized heavy water reactor) are the three different types of water-cooled reactors. Whereas PHWR employs heavy water (D2O) as a coolant and moderator, PWR and BWR use plain water (H2O). Over 75% of nuclear power plants (NPPs) currently in service worldwide are of the PWR type, 15% are of the BWR type, 6% are of the PHWR type, and there are other types of reactors as well that do not need moderators or water cooling [44,45].
Figure 2 shows that SMR NPPs looks to have a considerably lower LCOE value than larger NPPs due to their constrained capacity. However, the existence of modularity (reducing complexity by dividing a system into independent components or interdependent components with understood and manageable characteristics), simplicity (resulting in reduced operation and maintenance work, competitive capital and operational costs, enhanced safety and reliability, reduced off-site emergency measures and decreased machine–human interactions), and standardization of design will cause the SMR NPP LCOE to decrease. One advantage of these traits is the time and money savings during the construction phase, where serial construction can reduce costs. In other industries, such as the shipbuilding and aircraft industries, serial manufacturing has yielded learning rates between 10 and 20%, which have been well-documented [24,46,47,48].
“First-of-a-kind” nuclear, or FOAK nuclear, refers to the initial application of a specific nuclear technology on a large-scale commercial basis. This might involve, for instance, the development and initial use of a novel reactor design or nuclear fuel cycle technology [23,50,51]. The phrase “Nth-of-a-kind” (NOAK) nuclear designates a category of cutting-edge nuclear reactor technology that is intended to be a standard, repeatable design that can be produced and installed on a massive scale. NOAK reactors are designed to be a specific kind of nuclear reactor that is “mass-produced,” with the goal of lowering costs while enhancing reliability and safety. Instead of the six years (or more) for large reactors, the SMR anticipated schedule is 4/5 years for the FOAK and 3/4 years for the NOAK [51,52,53].

3.1.2. Analysis of Technology Readiness Level

The fourth generation of NPP technology, sometimes known as SMR, comes after the third generation [41]. Intentional tiny reactors are ideally positioned to play a significant role in the second nuclear era because they provide significant advantages in terms of safety, security, operational flexibility, and economics [54]. As a result, the majority of low-power NPP or SMR designs feature different levels (some are still conceptual designs, some are still preliminary designs, and so on). Certain SMR types are currently in the building stage, while others are at the design certification stage. Nonetheless, certain SMR variants are already in use as prototypes [55]. NPP nuclear reactors are the type of reactors whose output power is expressed in MWe. SMR is divided into six classes by the IAEA (International Atomic Energy Agency), including:
  • Water-cooled SMR to build on land (land base)
Normal operation of boiling water reactors (BWRs) relies on natural circulation for cooling, obviating the need for circulating pumps and the related power supply system. In these reactors, liquid water serves as a moderator. This makes the system’s design more straightforward and smaller. The most obvious benefit of BWRs is that they do not require a secondary system of heat exchangers because they create steam that is supplied directly to a turbine. They also generate more steam pressure than PWRs, but the turbine and related auxiliary equipment must be handled with radioactive care. BWRs and PWRs both benefit from being established technologies with a wealth of operational expertise [56]. This kind is a development of large-scale nuclear power plants, where the technology is established. As shown in Figure 3, the developed capabilities range from less than 10 MWe to 700 MWe. The majority of these water-cooled SMR technologies are still in the design phase, and CAREM-25 (TRL 7) and NuScale are the two technologies with the highest TRLs (TRL 5) [57,58].
2.
Water-cooled SMR for marine deployment (marine base)
This type of technology is installed at sea, either afloat or on a ship at rest. Some implementations of this technology include in the military world, for example for submarines. Several of these SMRs are listed below in Table 2 1. VBER-300, with an output power of 325 Mwe, has a TRL value of 6 and KLT-40S has the highest TRL of 8 [59,60].
3.
Gas-cooled SMR operating at high temperature
There are now a few SMRs that utilize gas cooling, but not many. Graphite moderators are employed in gas-cooled nuclear power facilities. Graphite moderators with CO2 gas cooling are presently used in the majority of nuclear power stations in operation in the UK. A gas-cooled nuclear power station that used helium gas as a coolant once ran in Germany. Compared to CO2 gas, helium gas has superior heat transport and chemical characteristics. As a result, a reactor using helium gas as a coolant can operate at a greater temperature than a reactor using CO2 gas. The term “HTGR” (high-temperature gas cooled reactor) is frequently used to describe nuclear reactors that use helium gas as a coolant [62,63,64]. Figure 4 lists several SMRs along with their capacity and TRL values. The HTR-PM, which has been running at Shidao Bay with a power of 210 MWe, has the highest TRL value of 8. At Shidaowan, in the Chinese province of Shandong, the high-temperature gas-cooled reactor pebble bed module (HTR-PM) demonstration project was wired into the grid. The fact that it was the first operational modular Generation 4 nuclear power system with high-temperature gas cooling made it historic [63,65,66,67].
4.
Fast Neutron Reactor (FNR) type SMR
Unlike the SMR spectrum of thermal neutrons, which utilizes a moderator in the form of H2O or D2O, the SMR spectrum of fast neutrons (high energy neutrons) does not use a moderator. Fast neutron SMR spectra, however, employ liquid metal or gas coolants. In accordance with the coolant utilized, there are many types of SMR, including:
  • SFR (sodium fast reactor) which uses liquid sodium (sodium) coolant;
  • The LMFR (liquid metal fast reactor), which employs a mixture of Pb (lead) and Bi to cool liquid metal (bismuth);
  • The LBR (liquid bismuth reactor), which makes use of cooling liquid bismuth;
  • The helium-gas-cooled GFR (gas cooled fast reactor).
TRL 3 is seen on the BREST-OD-300 in Figure 5. It is a lead-cooled fast neutron reactor that is currently being built in Seversk, Russian Federation and is expected to be operating by the end of 2026. This is a demonstration-prototype effort for a large-power future architecture that will allow a closed nuclear fuel cycle [55].
5.
Molten Salt Reactor type SMR
Typically, fluoride- or chloride-based liquid salt is used in molten salt reactors as a coolant with solid fuel or as a coolant plus fuel when the fuel is dissolved in a carrier salt. The inherent safety of salt, a low-pressure, single-phase coolant system that does not require a big containment, a high-temperature system that produces high efficiency, and a variable fuel cycle are just a few of the benefits that SMRs promise. In Canada, the UK, and the US, several SMR designs are engaged in preliminary licensing activities. The majority of this technology’s SMRs are still in the conceptual design phase (TRL 2). Only one reactor, Fuji, designed by the International Thorium Molten-Salt Forum (ITMSF), has a TRL rating of 3 [55,70].
6.
Micro-sized SMRs
In recent years, interest in micro-sized nuclear reactors—those with a capacity of less than 15 MWe—has grown as a potential solution for military or remote-area power generation. Micro-modular SMRs are still in the preliminary (TRL 1) and conceptual (TRL 2) stages, just like SMRs employing molten salt [71].

3.1.3. Selection of SMRs

Only three technology kinds, CAREM, KLT-40S, and HTR-PM, can currently be planned in Indonesia with the requirement that technology usage has a minimum TRL value of 7, as indicated in Table 3.

3.2. SMR Economics

3.2.1. Data and Assumptions

  • Technical data and assumptions
Following the aforementioned choice of SMR technology, CAREM-25, KLT-40S, and HTR-PM are the three types of technologies being investigated. For more details on these assumptions, see Table 4.
2.
Economic data
The cost of controlling radioactive waste is one aspect unique to the NPP (Decommissioning and Decontamination Cost—D&D Cost). In certain literature, these costs are frequently listed individually. Over the course of the NPP’s operational life, the NPP firm will set aside a specific amount of money each year as a reserve for decommissioning costs; but, in practice, this cost can also be incorporated into the operating and maintenance costs [24,31,73].
  • Investment cost
The costs that do not include interest during construction (IDC) interest rates are known as NPP investment costs or overnight costs. Instantaneous expenses, also known as overnight costs, are capital costs that are incurred expressly to fund the construction phase. Engineering, procurement, and construction (EPC) expenses, owner expenses (land, cooling infrastructure, related buildings, work sites, switchyards, project management, permits, etc.), and reserve expenses are all considered intermediate costs. Around 70% of immediate costs are connected to EPC expenditures (physical plant equipment plus labor and materials to construct it), while the remaining 30% are indirect costs (supervision and labor support costs). The remaining 20% of the immediate costs go toward owner fees and backup expenses (cost of system testing and staff training). The SMR NPP’s nightly expenses are as follows: CAREM 25 costs USD 3600 per kW, KLT-40S costs USD 3950 per kW, and HTR-PM costs USD 1500 per kW [52,72].
  • Interest during Construction (IDC)
This charge is an interest charge on the money that was used to build the plant. When there is no income, these expenses are spent throughout the construction phase. When the building duration is five years, the International Nuclear Association advises an IDC size of 30% of capital, increasing to 40% of capital when the construction term is seven years [74,75].
  • Operation and maintenance cost
Nuclear energy offers the advantage of having cheaper operation and maintenance (O&M) expenses as compared to coal, natural gas, and other power producing facilities. O&M cost is the cost associated with carrying out the NPP’s ordinary operations and maintaining the facility; this cost is heavily influenced by the technology and kind of reactor being used. There are two types of O&M costs: fixed O&M and variable O&M. A fixed operating expense is one that is incurred on a regular basis and includes labor costs, property taxes, plant insurance, and life-cycle maintenance. The O&M expenses variable covers fuel prices, consumables, direct generating unit maintenance, building maintenance, and maintenance performed by contractors [76]. The O&M cost variable is a cost that is dependent on production; hence, the expenses incurred depend on how much energy is produced at the SMR NPP. O&M and fuel expenses are currently 0.0141 USD/kW for CAREM-25, 0.0107 USD/kW for KLT-40S, and 0.0209 USD/ kW for HTR-PM [51,52,72].
Figure 6. Cost component for 1 kg of uranium as UO2 fuel [74].
Energies 16 03752 g006
An NPP is run to generate electrical energy during the course of its lifetime. The entire nuclear fuel cycle is covered, commencing with exploration, mining, milling, refining, and enrichment, followed by fabrication into reactor-ready nuclear fuel elements, and finally wasted fuel (spent fuel). Back-end costs include expenses for managing used fuel after it is used and exits the reactor, including expenses for both long-term and short-term on-site storage at the NPP. The quantity of energy generated by the reactor for every metric ton of U235 is known as nuclear fuel burn-up. The majority of fuels recommended for SMRs or advanced reactor ideas need uranium enrichments above 5%, typically between 10% and 20%. Nuclear fuel prices include natural uranium prices, conversion costs, enrichment expenses, and fabrication costs, to name a few. It costs USD 1.663 to convert 1 kg of uranium into UO2 [52,75,77].
  • Decommissioning cost
The International Nuclear Association advises that decommissioning costs should account for 9–15% of total capital expenditures (capital cost). The cost of decommissioning in the USA ranges from 0.01 to 0.02 USD per kWh [74,77,78]. For big reactors, the Nuclear Energy Agency estimates the cost of decommissioning to be 0.016 USD per kWh for a 5% discount rate or 0.01 USD per kWh for a 10% discount rate [52].
  • Disaster costs (liability)
The IAEA takes a role in the case of accidents by advocating a responsibility framework for nuclear accidents through international treaties and offers legal and policy guidance to help nations develop their nuclear energy infrastructures safely. Members of the IAEA have signed one or more of the three main international liability agreements. The “Paris and Brussels” Conventions, administered by the OECD, and the “Vienna” Convention, administered by the IAEA, are the two main international third-party nuclear energy liability regimes in use today. The Convention on Supplemental Compensation for Nuclear Damage (CSC), which is overseen by the IAEA and supported by the USA, is a third regime. The CSC recently went into effect, despite the fact that only a few nations have ratified it [79,80].
There are several nuclear liability regulations in Indonesia, for example, according to Law No. 10 of 1997 concerning Nuclear Power Article 28, nuclear installation operators are obliged to be responsible for nuclear losses suffered by third parties due to nuclear accidents that occur in nuclear installations. Government Regulation (PP) No. 46 of 2009 article 15 paragraph 2 states that a nuclear installation when applying for a commissioning permit must attach proof of guarantee of financing for the responsibility for nuclear losses. The limit of nuclear responsibility is regulated in Law No. 10 of 1997, amounting to IDR 9 billion, which was further expanded in the Presidential Regulation of the Republic of Indonesia Number 74 of 2012 concerning Nuclear Damage Liability. Numerous laws and regulations govern nuclear liability in Indonesia. For instance, Article 28 of Law No. 10 of 1997 Concerning Nuclear Power requires operators of nuclear installations to be liable for nuclear losses suffered by third parties as a result of nuclear accidents that take place in nuclear installations. Even according to Government Regulation No. 46 of 2009 article 15 paragraph 2, a nuclear installation must affix proof of financing for the responsibility for nuclear losses when asking for a commissioning license. Law No. 10 of 1997, which established an IDR 9 billion cap on nuclear liability, was later enlarged by Presidential Regulation of the Republic of Indonesia No. 74 of 2012 about Nuclear Damage Liability. A guarantee of insurance or other financial means is required for up to IDR 4 trillion in coverage. A commissioning permission application must be submitted along with proof of guarantee (policy). The expenses are IDR 250 billion for nuclear power reactors with a capacity of up to 500 MWe.
3.
Assumptions data
The SMRs are expected to begin being used around 2030. To determine how sensitive the discount rate is to LCOE, the discount rate is varied between 5%, 7%, and 10%. The cost of waste is 0.0010 USD/kWh and the inflation rate is considered to be 4%. It is expected that the USD to IDR conversion rate is 15,000 IDR to 1 USD; other details are in Table 5.

3.2.2. Results and Analysis of LCOE SMRs

Figure 7 illustrates how the LCOE value rises as the discount rate does. When compared to CAREM-25 and KLT-40S, the LCOE of the HTR-PM SMR has the lowest LCOE. The value of the CAREM-25 LCOE is 0.1941 USD/kWh at a discount rate of 10%, KLT-30 S is 0.1940 USD/kWh, and HTR-PM is 0.1128 USD/kWh, which is 42% less than the average for the CAREM-25 and KLT-40S LCOEs. Even though their TRL scales are below 7, CAREM 100 MWe and VBER 300 MWe are SMRs on a commercial scale and are employed in a comparison study for the NPP economics of scale; details will be discussed later [81]. SMRs experience greater costs compared to LRs due to economies of scale. The total cost of the plant rises while the cost per kilowatt decreases as its capacity grows. According to studies, this cost per kilowatt decreases by anywhere between 11.1% and 51% for every doubling of capacity [82,83]. Figure 8 displays the contribution of each cost component to LCOE. The biggest contributor to LCOE costs is overnight, followed by O&M and fuel costs.

3.2.3. LCOE of SMRs with Economy of Scale

Since this type of SMR is still a prototype, its power level is low, and it has not been used at a high-power level on a commercial scale, the LCOE cost for KLT-40S and CAREM-25 is expensive. Following an economy-of-scale curve based on plant capacity is necessary to scale the costs associated with a large-scale reactor to those of an SMR; this curve suggests that the particular capital cost, or the cost per kW of energy, will decrease with growing plant capacity [52,53,83]. On a commercial scale, the CAREM-25 prototype’s power will increase to 100–150 MWe from 27 MWe [81,84,85]. Another prototype that will eventually be turned into the RITM and VBER with a higher output of up to 300 MWe is the KLT-40S reactor [59,86,87]. It is still challenging to find data for CAREM and VBER at a commercial scale. However, the scaling approach can be used with the techno-economic data in Table 6 to estimate the cost component.
The results of the LCOE calculation for commercial scale SMRs are obtained utilizing data from CAREM and VBER on a commercial scale. The LCOE of the VBER 300 MWe and 100 MWe CAREM SMR types is calculated in Table 7 using various discount rates. The LCOE costs of VBER 300 MWe with a 10% discount rate are 0.0935 USD per kWh, according to Figure 7 and Table 5, while the cost per kWh for CAREM 100 MWe at a 10% discount rate is 0.0946 USD.

3.3. Comparison of SMR LCOEs

3.3.1. LCOE of SMRs with Local LCOE

Figure 9 illustrates the LCOE comparison between regional LCOEs and SMRs in Indonesia in 2020. Indonesia has a wide range of local LCOEs, with the average LCOE in Java and Bali being less than the country’s weighted LCOE of 0.0786 USD/kWh. However, in areas that are remote and underdeveloped, and where the power system has a very limited capacity, the LCOE figure is very high, as with the Ambon system. CAREM-25 and KLT-40S have an LCOE value range of 0.12–0.20 USD/kWh with varying discount rates from 5% to 10%. In a number of places, including Bangka, Belitung, NTT (Timor), and Ambon, this technology has a relatively competitive LCOE. However, the comparatively big capacity HTR-PM, CAREM 100 MW, and VBER 300 MW have LCOE values between 0.06 and 0.12 USD/kWh with a discount rate variance of between 5 and 10%. Even with a discount rate below 7%, the LCOE value is below the national weight of LCOE for Indonesia, allowing SMR technology to compete in many Indonesian locales with that LCOE value.

3.3.2. SMR LCOEs Compared with Other Power Plants

Figure 10 displays the LCOE of several types of power plants in Indonesia. The highest average LCOE value is seen in diesel power plants, which are frequently utilized to electrify remote places (small systems). The average LCOE for the gas turbine power plant (GTPP), which typically serves as a peaker and consumes a lot of fuel oil (high speed diesel), is 0.2447 USD per kWh. Some generation types, however, have LCOE values that are less than 0.10 USD per kWh. The LCOEs of several prototype and commercial-scale power plants and SMRs are also compared in Figure 11 in a number of different discount rate values. None of the SMRs can compete with CFPP and hydropower plant LCOE values, which are frequently employed as base loads in electricity systems and have an average LCOE below 0.05 USD/kWh.

4. Conclusions

This study analyzes the technology readiness of SMRs and compares the economics of SMRs using the LCOE approach with the LCOEs that are now in existence in Indonesia, both regionally and in terms of generation type. According to the results of this research, CAREM-25 (TRL7), KLT-40S (TRL8), and HTR-PM (TRL 8) were the SMRs with a minimum TRL value of 7. The LCOE calculations of CAREM-25 and KLT-40S are higher than 0.07 USD/kWh with a 5% discount rate since they are still in the demonstration phase and have not yet entered the market. HTR-PM is already an economy scale, while CAREM 100 MW is an economy scale from CAREM-25 and VBER 300 MW is a commercial scale from KLT-40S. The LCOE values of HTR-PM, CAREM 100 MW, and VBER 300 MW range from 0.06 to 0.12 USD per kWh with discount rates between 5% and 10%. These LCOE values can compete with the local LCOE in Indonesia and the LCOE of a number of different types of power plants besides hydropower and coal-fired power plants.

Author Contributions

Conceptualization, M.A.R.; methodology, M.A.R., A.W.H. and A.A.; software, M.K.R.; validation, M.A.R., A.W.H. and M.K.R.; formal analysis, M.A.R. and A.W.H.; investigation, M.K.R.; resources, A.W.H.; data curation, A.W.H. and M.K.R.; writing—original draft preparation, M.A.R.; writing—review and editing, M.A.R.; visualization, M.A.R.; supervision, A.W.H. and A.A.; project administration, M.A.R.; funding acquisition, M.A.R. All authors have read and agreed to the published version of the manuscript.

Funding

This research received no external funding.

Data Availability Statement

Not applicable.

Conflicts of Interest

The authors declare no conflict of interest.

Abbreviations

BATANBatan Tenaga Atom Nasional (National Energy Atomic Agency)
BWRBoiling water reactor
CAREMCentral Argentina de Elementos Modulares
CFCapacity factor
CFPPCoal fired power plant (steam turbine)
FNPPFloating nuclear power plant
FOAKFirst-of-a-kind
GSTPPGas steam turbine power plant (combined cycle)
GTPP Gas turbine power plant (open cycle)
HTR-PMHigh-temperature gas-cooled reactor—pebble-bed module
IDCInterest during construction
LCOELevelized cost of electricity
NOAKNth-of-a-kind
NPPNuclear power plant
O&MOperation and maintenance
PHWR Pressurized heavy water reactor
PLNPerusahaan Listrik Negara (State Electricity Company of Indonesia)
PWRPressurized water reactor
SMRSmall modular reactor
TRLTechnology readiness level

References

  1. United Nations Causes and Effects of Climate Change. Available online: https://www.un.org/en/climatechange/science/causes-effects-climate-change (accessed on 1 April 2023).
  2. Anderson, T.R.; Hawkins, E.; Jones, P.D. CO2, the greenhouse effect and global warming: From the pioneering work of Arrhenius and Callendar to today’s Earth System Models. Endeavour 2016, 40, 178–187. [Google Scholar] [CrossRef] [PubMed] [Green Version]
  3. Hannah Ritchie, M.R.P.R. CO2 and Greenhouse Gas Emissions. Our World Data. 2020.
  4. United Nations. Kyoto Protocol to the United Nations Framework; United Nations: San Francisco, CA, USA, 1998. [Google Scholar]
  5. President of Republic Indonesia. Regulation of the President of the Republic of Indonesia Number 22 Year 2017 about National Energy General Plan; 2017. Available online: https://jdih.esdm.go.id/peraturan/Perpres%2022%20Tahun%202017.pdf (accessed on 4 November 2022).
  6. PT. PLN (Persero). PLN Statistics; PT. PLN (Persero): Jakarta, Indonesia, 2022. [Google Scholar]
  7. MEMR. National Electricity General Plan 2019–2038; MEMR: Jakarta, Indonesia, 2021.
  8. MEMR. Ministry of Energy and Mineral Resources 2021 Performance Report; MEMR: Jakarta, Indonesia, 2022.
  9. Damayanti, R.; Khaerunissa, H. Carbon dioxide emission factor estimation from Indonesian coal. Indones. Min. J. 2018, 21, 45–58. [Google Scholar] [CrossRef]
  10. Schlömer, S.; Bruckner, T.; Fulton, L.; Hertwich, E.; McKinnon, A.; Perczyk, D.; Roy, J.; Schaeffer, R.; Sims, R.; Smith, P.; et al. Annex III: Technology-specific cost and performance parameters. In Climate Change 2014: Mitigation of Climate Change. Contribution of Working Group III to the Fifth Assessment Report of the Intergovernmental Panel on Climate Change; Edenhofer, O., Pichs-Madruga, R., Sokona, Y., Farahani, E., Kadner, S., Seyboth, K., Adler, A., Baum, I., Brunner, S., Eickemeier, P., et al., Eds.; Cambridge University Press: Cambridge, UK; New York, NY, USA, 2014; pp. 1329–1356. [Google Scholar]
  11. MEMR Ini Prinsip Dan Peta Jalan Pemerintah Capai Net Zero Emission. Available online: https://www.esdm.go.id/id/media-center/arsip-berita/ini-prinsip-dan-peta-jalan-pemerintah-capai-net-zero-emission (accessed on 4 November 2022).
  12. Soentono, S.; Aziz, F. Expected Role of Nuclear Science and Technology to Support the Sustainable Suppy of Energy in Indo-nesia. Progess Nucl. Energy 2008, 50, 75–81. [Google Scholar] [CrossRef]
  13. Cho, I.; Oh, S.; Kim, S.; Ardin, F.; Heo, E. Determinants of Nuclear Power Expansion in Indonesia; Korea Nuclear Society: Daejeon, Republic of Korea, 2021; Volume 53, ISBN 8252714226. [Google Scholar]
  14. WNA Nuclear Power in Indonesia. Available online: https://world-nuclear.org/information-library/country-profiles/countries-g-n/indonesia.aspx (accessed on 1 April 2023).
  15. Ratiko, R.; Wisnubroto, D.; Nasruddin, N.; Mahlia, T. Current and future strategies for spent nuclear fuel management in Indonesia. Energy Strat. Rev. 2020, 32, 100575. [Google Scholar] [CrossRef]
  16. Sustainability, N.I. Feasibility Studies. Available online: https://nautilus.org/projects/by-name/aus-indo/aust-ind-nuclear1/ind-np-old/muria/feasibility-studies/ (accessed on 1 April 2023).
  17. Wisnubroto, D.S.; Ruslan, R.; Irawan, D. Is West Kalimantan More Suitable for Constructing the First Nuclear Power Plant in Indonesia Compared with Bangka Belitung? Analysis of Public Surveys in those Two Provinces. Indian J. Sci. Technol. 2021, 14, 3014–3025. [Google Scholar] [CrossRef]
  18. Cogswell, B.K.; Siahaan, N.; Siera, F.; Ramana, M.V.; Tanter, R. Nuclear Power and Small Modular Reactors in Indonesia: Potential and Challenges. 2017. [Google Scholar]
  19. Ingersoll, D.T. A Brief History of Small Nuclear Power (1950–2000). Small Modul. React. 2016, 21–38. [Google Scholar] [CrossRef]
  20. Schaffrath, A.; Wielenberg, A.; Kilger, R.; Seubert, A. SMRs—Overview, international developments, safety features and the GRS simulation chain. Front. Energy 2021, 15, 793–809. [Google Scholar] [CrossRef]
  21. Lloyd, C.A.; Roulstone, T.; Lyons, R.E. Transport, constructability, and economic advantages of SMR modularization. Prog. Nucl. Energy 2021, 134, 103672. [Google Scholar] [CrossRef]
  22. Lokhov, A.; Cameron, R.; Sozoniuk, V. OECD/NEA Study on the Economics and Market of Small Reactors. In Proceedings of the International Congress on Advances in Nuclear Power Plants (ICAPP 2013): Nuclear Power—A Safe and Sustainable Choice for Green Future, Held with the 28th KAIF/KNS Annual Conference, Jeju Island, Republic of Korea, 14–18 April 2013; pp. 821–825. [Google Scholar]
  23. Carelli, M.; Garrone, P.; Locatelli, G.; Mancini, M.; Mycoff, C.; Trucco, P.; Ricotti, M. Economic features of integral, modular, small-to-medium size reactors. Prog. Nucl. Energy 2010, 52, 403–414. [Google Scholar] [CrossRef]
  24. Boarin, S.; Mancini, M.; Ricotti, M.; Locatelli, G. Economics and Financing of Small Modular Reactors (SMRs); Mario, D.C., Daniel, T.I., Eds.; Woodhead Publishing Series in Energy: Sawston, UK, 2015; ISBN 9780857098535. [Google Scholar]
  25. Matthews, J.; Irvine, N.; Dawson, S. The Challenges for Nuclear Advanced Manufacturing. Nucl. Futur. 2016, 12, 24–29. [Google Scholar]
  26. Kim, S.; Hwang, Y.; Box, P.O.; Konishi, T. A Preliminary Economic Feasibility Assessment of Nuclear Desalination in Madura Island. Int. J. Nucl. Desalination 2005, 1, 466–476. [Google Scholar] [CrossRef]
  27. Shen, W.; Chen, X.; Qiu, J.; Hayward, J.A.; Sayeef, S.; Osman, P.; Meng, K.; Dong, Z.Y. A comprehensive review of variable renewable energy levelized cost of electricity. Renew. Sustain. Energy Rev. 2020, 133, 110301. [Google Scholar] [CrossRef]
  28. Branker, K.; Pathak, M.J.M.; Pearce, J.M. A review of solar photovoltaic levelized cost of electricity. Renew. Sustain. Energy Rev. 2011, 15, 4470–4482. [Google Scholar] [CrossRef] [Green Version]
  29. Agency, N.E. Projected Costs of Generating Electricity 2010; International Energy Agency: Paris, France, 2010; p. 220. [Google Scholar]
  30. Aldersey-Williams, J.; Rubert, T. Levelised cost of energy—A theoretical justification and critical assessment. Energy Policy 2018, 124, 169–179. [Google Scholar] [CrossRef]
  31. HM Government Department for Business. Energy and Industrial Strategy Electricity Generation Costs 2016. In BEIS Electricity Generation Costs; HM Government Department for Business: London, UK, 2016; p. 85. [Google Scholar]
  32. Strike, C. Examining the Feasibility of Small Modular Nuclear Reactors as the Leading Global Source of Energy Generation. Master’s Thesis, Johns Hopkins University, Baltimore, MD, USA, 2021. [Google Scholar]
  33. Alliance, H.E.; May, U. Analyzing the Cost of Small Modular Reactors and Alternative Power Portfolios; Energy Strategies, LLC: Salt Lake City, UT, USA, 2019. [Google Scholar]
  34. Timilsina, G.R. Demystifying the Costs of Electricity Generation Technologies; World Bank: Washington, DC, USA, 2020. [Google Scholar] [CrossRef]
  35. Hirshorn, S.; Jefferies, S. Final Report of the NASA Technology Readiness Assessment (TRA) Study Team; 2016; pp. 42–43. Available online: https://ntrs.nasa.gov/search.jsp?R=20170005794 (accessed on 7 November 2022).
  36. Héder, M. From NASA to EU: The Evolution of the TRL Scale in Public Sector Innovation. Innov. J. 2017, 22, 1–23. [Google Scholar]
  37. European Commission Technology Readiness Levels (TRL). Horiz. 2020–Work Program. 2014-2015 Gen. Annex. Extr. from Part 19-Comm. Decis. C 2014, 1. Available online: http://ec.europa.eu/research/participants/data/ref/h2020/wp/2014_2015/annexes/h2020-wp1415-annex-g-trl_en.pdf (accessed on 7 November 2022).
  38. Mankins, J.C. Technology readiness assessments: A retrospective. Acta Astronaut. 2009, 65, 1216–1223. [Google Scholar] [CrossRef]
  39. MECRT Measurement and Determination of Technology Readiness Levels. 2016; 390–392.
  40. Carmack, W.; Braase, L.; Wigeland, R.; Todosow, M. Technology readiness levels for advanced nuclear fuels and materials development. Nucl. Eng. Des. 2017, 313, 177–184. [Google Scholar] [CrossRef] [Green Version]
  41. Goldberg, S.M.; Rosner, R. Nuclear Reactors: Generation to Generation; The American Academy of Arts and Sciences: Cambridge, MA, USA, 2011; ISBN 0877240906. [Google Scholar]
  42. Oka, Y. Nuclear Power Plants: History and the Role. Tokyo. 2017.
  43. Carlsson, J. Inherent Safety Features and Passive Prevention Approaches for Pb/Bi-Cooled Accelerator-Driven Systems. Doctoral Dissertation, Royal Institute of Technology, Stockholm, Sweden, 2003. [Google Scholar]
  44. WNA. Nuclear Power Reactors. Available online: https://world-nuclear.org/information-library/nuclear-fuel-cycle/nuclear-power-reactors/nuclear-power-reactors.aspx (accessed on 1 April 2023).
  45. Reinberger, D.; Ajanovic, A.; Haas, R. The Technological Development of Different Generations and Reactor Concepts. Energy Policy Clim. Prot. 2019, 243–258. [Google Scholar] [CrossRef] [Green Version]
  46. National Nuclear Laboratory. Small Modular Reactors (SMR) Feasibility Study; National Nuclear Laboratory: Cumbria, UK, 2014. [Google Scholar]
  47. Baldwin, C.Y.; Clark, K.B. Clark Design Rules The Power of Modularity; The MIT Press: Cambridge, MA, USA, 2000; ISBN 9780262538206. [Google Scholar]
  48. IAEA. IAEA Nuclear Energy Series: Design Features to Achieve Defence in Depth in Small and Medium Sized Reactors; IAEA: Vienna, Austria, 2009. [Google Scholar]
  49. NEA. Unlocking Reductions in the Construction Costs of Nuclear: A Practical Guide for Stakeholders; NEA: Philadelphia, PE, USA, 2020.
  50. Stewart, W.B.; Shirvan, K. Capital Cost Estimation for Advanced Nuclear Power Plants. Renew. Sustain. Energy Rev. 2022, 155, 111880. [Google Scholar] [CrossRef]
  51. Mignacca, B.; Locatelli, G. Economics and finance of Small Modular Reactors: A systematic review and research agenda. Renew. Sustain. Energy Rev. 2019, 118, 109519. [Google Scholar] [CrossRef]
  52. Boldon, L.M.; Sabharwall, P. Small Modular Reactor: First-of-a-Kind (FOAK) and Nth-of-a-Kind (NOAK) Economic Analysis; Summer 2014 Report; Idaho National Laboratory: Idaho Falls, ID, USA, 2014. [Google Scholar]
  53. Khan, S.U.-D.; Khan, R. Techno-economic assessment of a very small modular reactor (vSMR): A case study for the LINE city in Saudi Arabia. Nucl. Eng. Technol. 2023, 55, 1244–1249. [Google Scholar] [CrossRef]
  54. Ingersoll, D. Deliberately small reactors and the second nuclear era. Prog. Nucl. Energy 2009, 51, 589–603. [Google Scholar] [CrossRef]
  55. IAEA. Advances in Small Modular Reactor Technology Developments; IAEA: Vienna, Austria, 2020. [Google Scholar]
  56. Hussein, E.M. Emerging small modular nuclear power reactors: A critical review. Phys. Open 2020, 5, 100038. [Google Scholar] [CrossRef]
  57. Magan, H.B.; Delmastro, D.F.; Markiewicz, M.; LoPasso, E.; Diez, F.; Giménez, M.; Rauschert, A.; Halpert, S.; Chocrón, M.; Dezzutti, J.C.; et al. CAREM Project Status. Sci. Technol. Nucl. Install. 2011, 2011, 140373. [Google Scholar] [CrossRef] [Green Version]
  58. Nusclae. NUSCALE Advanced Nuclear Technology To Power The Future; Nusclae: Portland, OR, USA, 2022. [Google Scholar]
  59. Lee, K.-H.; Kim, M.-G.; Lee, J.I.; Lee, P.-S. Recent Advances in Ocean Nuclear Power Plants. Energies 2015, 8, 11470–11492. [Google Scholar] [CrossRef] [Green Version]
  60. IAEA. KLT-40S; IAEA: Vienna, Austria, 2013; Available online: https://aris.iaea.org/PDF/KLT-40S.pdf (accessed on 9 November 2022).
  61. Polushkin, A.K.; Kuzin, E.A.; Vorobiov, V.M.; Klykov, D.M.; Panov, J.K. Implementation of the Project for the Construction and Operation of a Nuclear Heat and Power Plant on the Basis of a Floating Power Unit With Klt-40c Reactors. International Atomic Energy Agency: Vienna, Austria, 2000; Volume 1172, pp. 53–65. [Google Scholar]
  62. IAEA. High Temperature Gas Cooled Reactor Fuels and Materials; IAEA: Vienna, Austria, 2010. [Google Scholar]
  63. Dong, Y. Design, Safety Features & Progress of HTR-PM. 2018. Available online: https://www.gen-4.org/gif/upload/docs/application/pdf/2018-02/gif_webinar_htr-pm_dong_201801v2_final.pdf (accessed on 1 April 2023).
  64. Zhang, Z.-Y.; Dong, Y.-J.; Shi, Q.; Li, F.; Wang, H.-T. 600-MWe high-temperature gas-cooled reactor nuclear power plant HTR-PM600. Nucl. Sci. Tech. 2022, 33, 101. [Google Scholar] [CrossRef]
  65. Zhang, Z.; Dong, Y.; Li, F.; Zhang, Z.; Wang, H.; Huang, X.; Li, H.; Liu, B.; Wu, X.; Wang, H.; et al. The Shandong Shidao Bay 200 MWe High-Temperature Gas-Cooled Reactor Pebble-Bed Module (HTR-PM) Demonstration Power Plant: An Engineering and Technological Innovation. Engineering 2016, 2, 112–118. [Google Scholar] [CrossRef] [Green Version]
  66. Zhang, Z.; Wu, Z.; Wang, D.; Xu, Y.; Sun, Y.; Li, F.; Dong, Y. Current status and technical description of Chinese 2 × 250 MW Th HTR-PM demonstration plant. Nucl. Eng. Des. 2009, 239, 1212–1219. [Google Scholar] [CrossRef]
  67. Zhang, J.; Guo, J.; Li, F.; Sun, Y. Research on the fuel loading patterns of the initial core in Chinese pebble-bed reactor HTR-PM. Ann. Nucl. Energy 2018, 118, 235–240. [Google Scholar] [CrossRef]
  68. Starcore Starcore Nuclear. Available online: https://starcorenuclearpower.com/technology/ (accessed on 5 April 2023).
  69. Wu, Z.; Lin, D.; Zhong, D. The design features of the HTR-10. Nucl. Eng. Des. 2002, 218, 25–32. [Google Scholar] [CrossRef]
  70. Rosenthal, M.W.; Kasten, P.R.; Briggs, R.B. Molten-Salt Reactors—History, Status, and Potential. Nucl. Appl. Technol. 1970, 8, 107–117. [Google Scholar] [CrossRef]
  71. Black, G.; Shropshire, D.; Araújo, K.; van Heek, A. Prospects for Nuclear Microreactors: A Review of the Technology, Economics, and Regulatory Considerations. Nucl. Technol. 2022, 209, S1–S20. [Google Scholar] [CrossRef]
  72. NEA. Current Status, Technical Feasibility, and Economics of Small Nuclear Reactors; NEA: Philadelphia, PE, USA, 2011.
  73. SPRU. University of Sussex; NERA Economic Consulting Paper 4: The Economics of Nuclear Power; SPRU: Lisboa, Portugal, 2006. [Google Scholar]
  74. WNA Economics of Nuclear Power. Available online: https://www.world-nuclear.org/information-library/economic-aspects/economics-of-nuclear-power.aspx#ECSArticleLink1 (accessed on 7 November 2022).
  75. MIT. The Future of Nuclear Energy in a Carbon-Constrained World; MIT: Cambridge, MA, USA, 2018. [Google Scholar]
  76. IAEA. Operation and Maintenance Costs Integrated Approach to Optimize for Operating Nuclear Power Plants; IAEA: Vienna, Austria, 2006. [Google Scholar]
  77. Lenzen, M. Life cycle energy and greenhouse gas emissions of nuclear energy: A review. Energy Convers. Manag. 2008, 49, 2178–2199. [Google Scholar] [CrossRef]
  78. IAEA. Status of the Decommissioning of Nuclear Facilities; IAEA: Vienna, Austria, 2004. [Google Scholar]
  79. Heffron, R.J.; Ashley, S.F.; Nuttall, W.J. The Global Nuclear Liability Regime Post Fukushima Daiichi. Progess Nucl. Energy 2016, 90, 1–10. [Google Scholar] [CrossRef] [Green Version]
  80. Mcintosh, S. Nuclear Liability and Post-Fukushima Developments. Nucl. Law Glob. Debate 2022, 249–269. [Google Scholar] [CrossRef]
  81. World Nuclear News Construction of Argentina’s CAREM-25 Unit to Restart. Available online: https://www.world-nuclear-news.org/Articles/Construction-of-Argentinas-small-CAREM-25-unit-to (accessed on 23 January 2023).
  82. The University of Chicago. The Economic Future of Nuclear Power: A Study Conducted at the University of Chicago; The University of Chicago: Chicago, IL, USA, 2004; p. 24. [Google Scholar]
  83. Asuega, A.; Limb, B.J.; Quinn, J.C. Techno-economic analysis of advanced small modular nuclear reactors. Appl. Energy 2023, 334, 120669. [Google Scholar] [CrossRef]
  84. Delmastro, D. Advance in CAREM Contruction: First Passive/Natural Circulation Integral-PWR SMR; IAEA: Vienna, Austria, 2020; pp. 50–51. [Google Scholar]
  85. Marcel, C.; Delmastro, D. A Small Innovative Modular Nuclear Reactor: The Carem-25. In Proceedings of the 16th International Conference on Emerging Nuclear Energy Systems (ICENES 2013), Madrid, Spain, 26–30 May 2013. [Google Scholar]
  86. Faber, J.; Jaspers, D.; Kleijn, A. Summary Assessment of the Status of Floating Power Plants; CE Delft: Delft, The Netherlands, 2022. [Google Scholar]
  87. Rosatom Small- and Medium-Size Reactors. Available online: https://www.rosatom.ru/en/rosatom-group/engineering-and-construction/small-and-medium-size-reactors/index.php?sphrase_id=757140 (accessed on 23 January 2023).
  88. MEMR Regulation of MEMR No. 169.K.HK.02.MEM.M.2021 about LCOE of PT. PLN (Persero). 2020. Available online: https://jdih.esdm.go.id/storage/document/Kepmen%20No.%20169.K.HK.02.MEM.M.2021.pdf (accessed on 7 November 2022).
Figure 1. The evolution of nuclear power described in generations (modified from ref. [43]).
Energies 16 03752 g001
Figure 2. Small modular reactor economic drivers that help compensate for diseconomies of scale (modified from ref. [49]).
Energies 16 03752 g002
Figure 3. Technology readiness level of SMR land base [55].
Energies 16 03752 g003
Figure 4. Technology readiness level of high-temperature reactors (HTR) [55,65,68,69].
Energies 16 03752 g004
Figure 5. Technology readiness level of fast neutron reactor [55].
Energies 16 03752 g005
Figure 7. Graph of CAREM-25, KLT-40S, and HTR-PM LCOEs with various discount rates.
Energies 16 03752 g007
Figure 8. Graph of the distribution of cost components of CAREM-25, KLT-40S, and HTR-PM LCOE with various discount rates.
Energies 16 03752 g008
Figure 9. Graph of local LCOE and LCOE of selected SMRs [88].
Energies 16 03752 g009
Figure 10. Graph of LCOE of several types of power plants in Indonesia [6].
Energies 16 03752 g010
Figure 11. LCOE graphs of several types of power plants in Indonesia and SMRs [6].
Energies 16 03752 g011
Table 1. TRL scale in technology maturity level assessment [35,38].
LevelDefinition
TRL 9Actual system proven
TRL 8Actual system completed and qualified through test and demonstration
TRL 7System/subsystem model or prototype demonstration in the planned environment
TRL 6System/subsystem model or prototype demonstration in relevant environment
TRL 5Component and/or breadboard validation in relevant environment
TRL 4Component and/or breadboard validation in “laboratory” environment
TRL 3Analytical and experimental critical function and/or characteristic proof of concept
TRL 2Technology concept and/or application formulated
TRL 1Basic principles observed and reported
Table 2. Technology readiness level of small modular reactor type marine base [55,59,60,61].
TRLNameTotal Cap. (Mwe)
1ACPR-50S50
2ABV-6E9
2RITM-200M100
4SHELF6.6
6VBER-300325
8KLT-40S70
Table 3. Small modular reactor classification based on TRL value [35,37,40,55].
NameTypeCapacity (MWe)ManufacturerCountryTRL
NuScalePWR12 × 60GE-Hitachi Nuclear EnergyUSA and Japan5
VBER-300PWR (FNPP)325JSC “Afrikantov OKBM”Russia6
CAREM-25PWR30IRIS ConsorsiumArgentina7
KLT-40SPWR (FNPP)2 × 35JSC “Afrikantov OKBM”Russia8
HTR-PMHTGR210INET, Tsinghua UniversityChina8
Table 4. SMR technical parameter data [51,72].
No.ItemUnitCAREM-25KLT-40SHTR-PM
1CapacityMWe100/272 × 150/2 × 352 × 250/2 × 105
2Cap. factor%858590
3Efficiency%2723.342
4Operation periodYears404040
5Construction timeYears445
6Burn-up timeMWd/kg3545.580
7Fuel enrichment%3.514.18.77
Table 5. Economic and technical data of SMRs [72].
Techno-Economic DataUnitCAREM-25KLT-40SHTR-PM
CapacityMW100/272 × 150/2 × 352 × 250/2 × 105
Cap. Factor%858590
Plant eff.%2723.342
Operating ageYears404040
Construction periodYears445
Average burn-upGWd/tU3545.580
Fuel enrichment%3.514.18.77
Overnight capital cost (2009)USD/kW360039501500
Inflation rate%/year444
Overnight capital cost (2030)USD/kW8203.569001.133418.15
O&M cost + fuel cost (2009)USD/kW0.01410.01070.0209
Inflation rate%444
O&M + fuel cost (2030)USD/kW0.032130.024380.04763
Table 6. Overnight capital cost and O&M plus fuel cost of commercial scale SMR NPPs.
MetricUnitKLT-40SVBER 300 MWeCAREM-25CAREM 100 MWe
Plant Cap.MWe7030027100
Overnight Capital Cost (2030)USD/kWe9001.134347.968203.574262.70
O&M + Fuel Cost (2030)USD/kWe0.02440.01180.02440.0127
Table 7. Sensitivity of discount rate calculation of LCOE for SMR Types VBER 300 MWe and CAREM 100 MWe.
LCOE (2030)Discount Rate 5%Discount Rate 7%Discount Rate 10%
VBER 300 MWeCAREM 100 MWeVBER 300 MWeCAREM 100 MWeVBER 300 MWeCAREM 100 MWe
USD/kWh0.06.020.06120.07280.07380.09350.0946
IDR/kWh902.40918.021091.791107.481402.511418.26
Disclaimer/Publisher’s Note: The statements, opinions and data contained in all publications are solely those of the individual author(s) and contributor(s) and not of MDPI and/or the editor(s). MDPI and/or the editor(s) disclaim responsibility for any injury to people or property resulting from any ideas, methods, instructions or products referred to in the content.

