1. Introduction
The inlet air quality of the gas turbine influences its efficiency and unit life significantly [
1]. Particles with a size larger than 5 μm entering the gas turbine may cause impact and wear to the metal surface, lowering the smoothness and fatigue strength of the metal surface, reducing compressor efficiency and damaging the blades [
2]. Pollutants such as fine particles or oil attached to the surface of the gas turbine compressors and turbine blades can change clearance and reduce the rotating smoothness of the blades’ surface, thus reducing the unit efficiency [
3]. The air filter media are the key element in the air filters to guarantee the inlet air cleanliness of a gas turbine. A large number of application cases show that filter media can easily fail under extreme conditions of high humidity, haze, rain or snow, thus seriously affecting the energy efficiency of gas turbines [
4,
5,
6]. Therefore, the influence of the relative humidity on the dust-holding performance of air filter media should be studied.
Many scholars often study the properties of porous media and particle motion by means of numerical simulation. Cravero, C. et al. [
7] showed various numerical strategies for the design of a pre-heating system for recycled glass raw material through CFD techniques and used the porous domain to evaluate the thermal response for the pre-heating of raw material. Z. Pan et al. [
8] analyzed microstructure information and air flow properties and simulated the motion of ultrafine particles in unresolved and resolved models. They also found that smaller diameter PET fibers in the filter media led to a lower average pore size, lower permeability and a better collection performance by simulation methods [
9]. Zhou, B. et al. [
10] presented the LB method which could be used to predict the performance of fibrous media well. Some literature reported the performance of filter media in different environments mainly focusing on the investigation of filtration efficiency and dust-holding performance against the standard particles [
11,
12,
13,
14,
15,
16]. It mainly involves the influence of surface velocity, particle concentration and filter media porosity on the resistance of filter media. Only a few studies have considered the performance of filter media in a real environment (extreme conditions such as high humidity, rain or snow). Gupta et al. noted no change when the filter was subjected to relative humidities between 1 and 100%. They highlighted the importance of the hygroscopic nature of aerosols on the evolution of the pressure drop of a filter during its clogging [
17]. For a non-hygroscopic aerosol or a hygroscopic aerosol at a relative humidity below its deliquescent point, the increase in the filter pressure drop is much lower than when the humidity is high; for a hygroscopic aerosol at relative humidity above its deliquescent point, the pressure drop of the filter increases exponentially after a certain mass of droplets has collected. The same observations have been reported by A.F. Miguel et al. [
18] with large-diameter polyester fiber filters clogged with hygroscopic and non-hygroscopic aerosols. Xu He et al. [
19] studied the dust-holding pressure difference curve of vehicle filter media under different humidity conditions for an A2 dust [
20] and soot particle mixture. However, these studies focused on the results of the influence of humidity without further investigation of the influence mechanism of humidity and the structure of the filter media on the dust-holding performance against the A2 fine dust.
This study has analyzed the dust-holding characteristics of filter media under different humidity conditions and revealed the mechanism of filter material failure in a high humidity environment by characterizing the distribution of dust in filter media and analyzing the structure of the dustcake. The influence of the structure of filter media on their dust-holding performance at different relative humidities was also discussed.
2. Materials and Methods
Three kinds of typical filter media such as electrospun fiber composite filter material, synthetic fiber composite filter material and melt-blown fiber composite filter material with similar initial filtration efficiency are selected as the study objects. The basic properties of these filter media are listed in
Table 1.
The size, permeability and surface contact angle of filter media are tested with a capillary flow aperture meter (CFP1100-Porometer, PMI, Ithaca, NY, USA), air permeability meter (FX 3300-IV, Textest, Schwerzenbach, Switzerland) and surface contact angle meter (Biolin Scientific, Manchester, UK). The morphology and structure are tested and characterized with a scanning electron microscope (PhenomPro, Thermo Fisher Scientific, Eindhoven, The Netherlands).
Based on the fiber composition and performance test results of three filter media, the Geodict (Math2 Market, Kaiserslautern, Germany) software is used to build structural models of three filter media. Meanwhile, analog computation is conducted for the motion trajectory of the particles in the three filter media. During the calculation, based on the distribution of the A2 dust particle size, particles are loaded to the model and the calculation is terminated when the model differential pressure increased by 60 Pa.
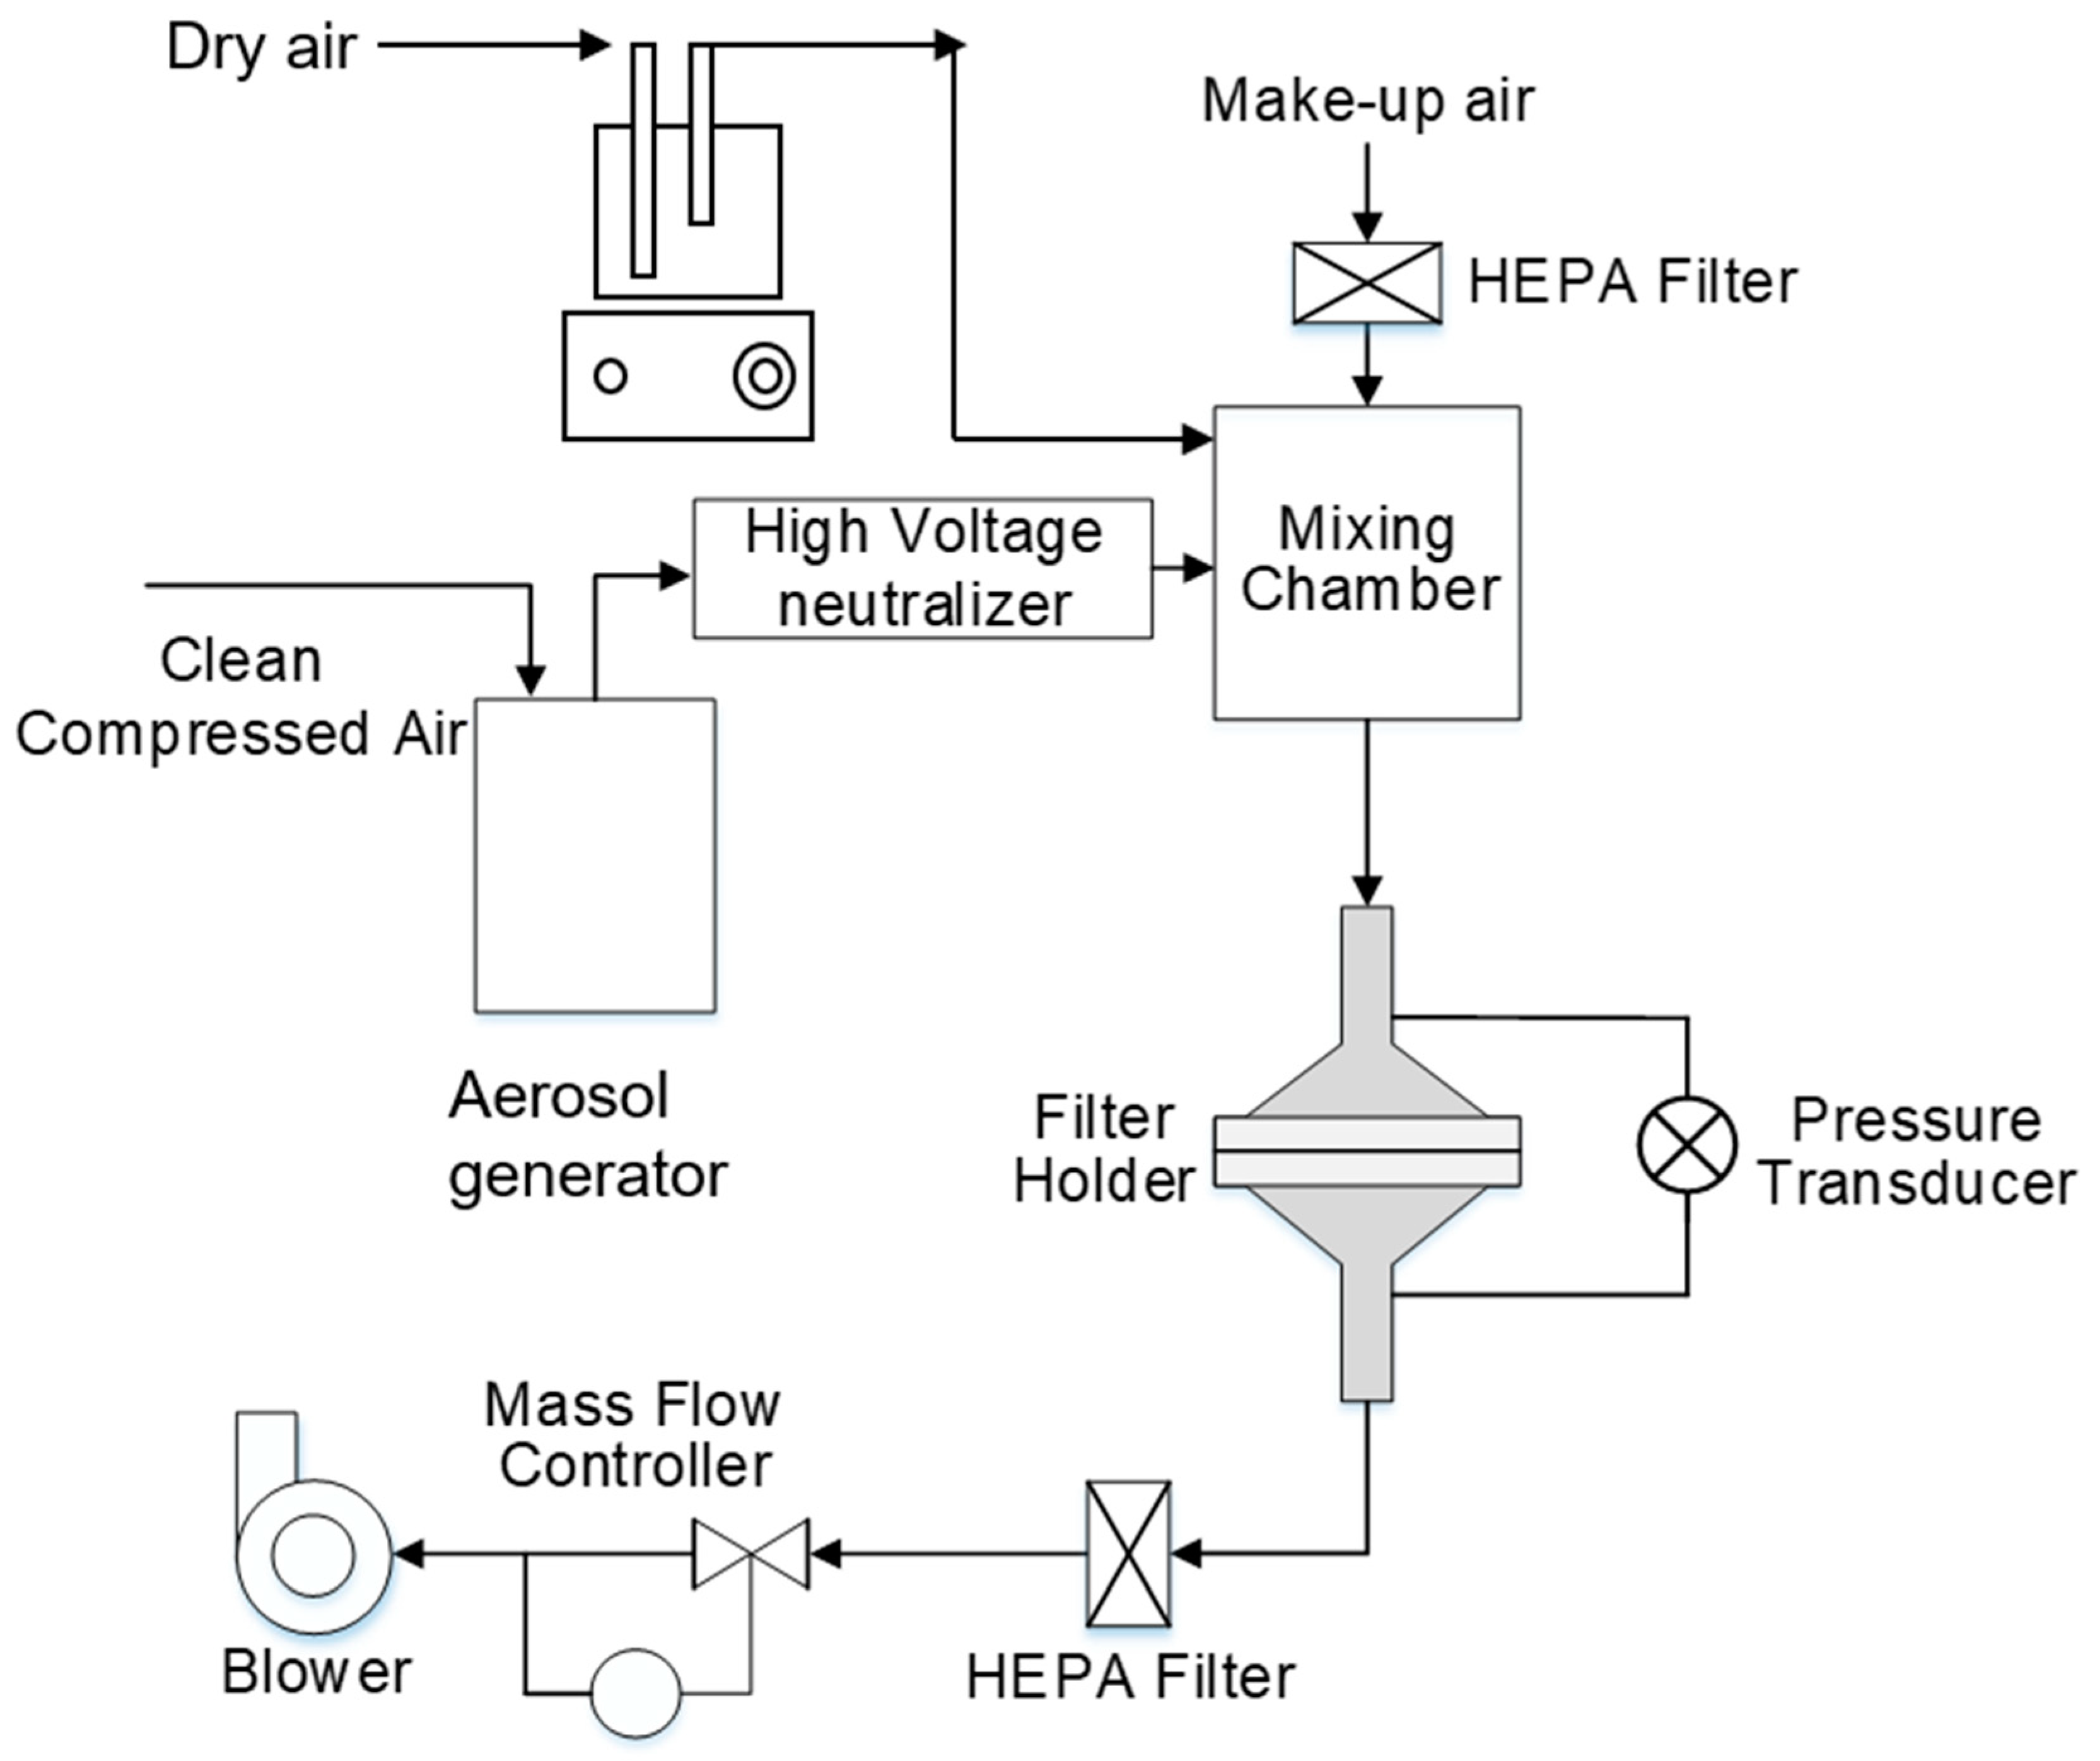
The diagram of the dust loading system under different humidity conditions is shown in
Figure 1. Water mist generated by the ultrasonic humidifier is used to humidify the test system. A2 dust is generated by the dust generator mix with the water mist inside the test pipe. A humidity sensor (HC2A-S, Rotronic, Bassersdorf, Switzerland) is installed in the upstream of the filter material for the monitoring of humidity of the test system in real-time. During the test, the surface velocity was 11.1 cm/s, and the effective test area of the filter media was 100 cm
2. The clean air was used for the make-up flow for the whole test system which was controlled by a mass flow controller. When the filter material pressure drop increased by 1, 2, 3, 4 and 5 times, the initial pressure drop and by 1500 Pa, respectively, the test was terminated and the filter media were taken out for weighing. The test was also terminated when the filter material pressure drop increased to 2000 Pa. The dust-holding capacity of the filter media was calculated as the following:
where
is the mass of filter media loaded with dust,
is the mass of the clean filter media and
is the filtration area.
3. Results and Discussion
3.1. Structural Analysis of Three Filter Media
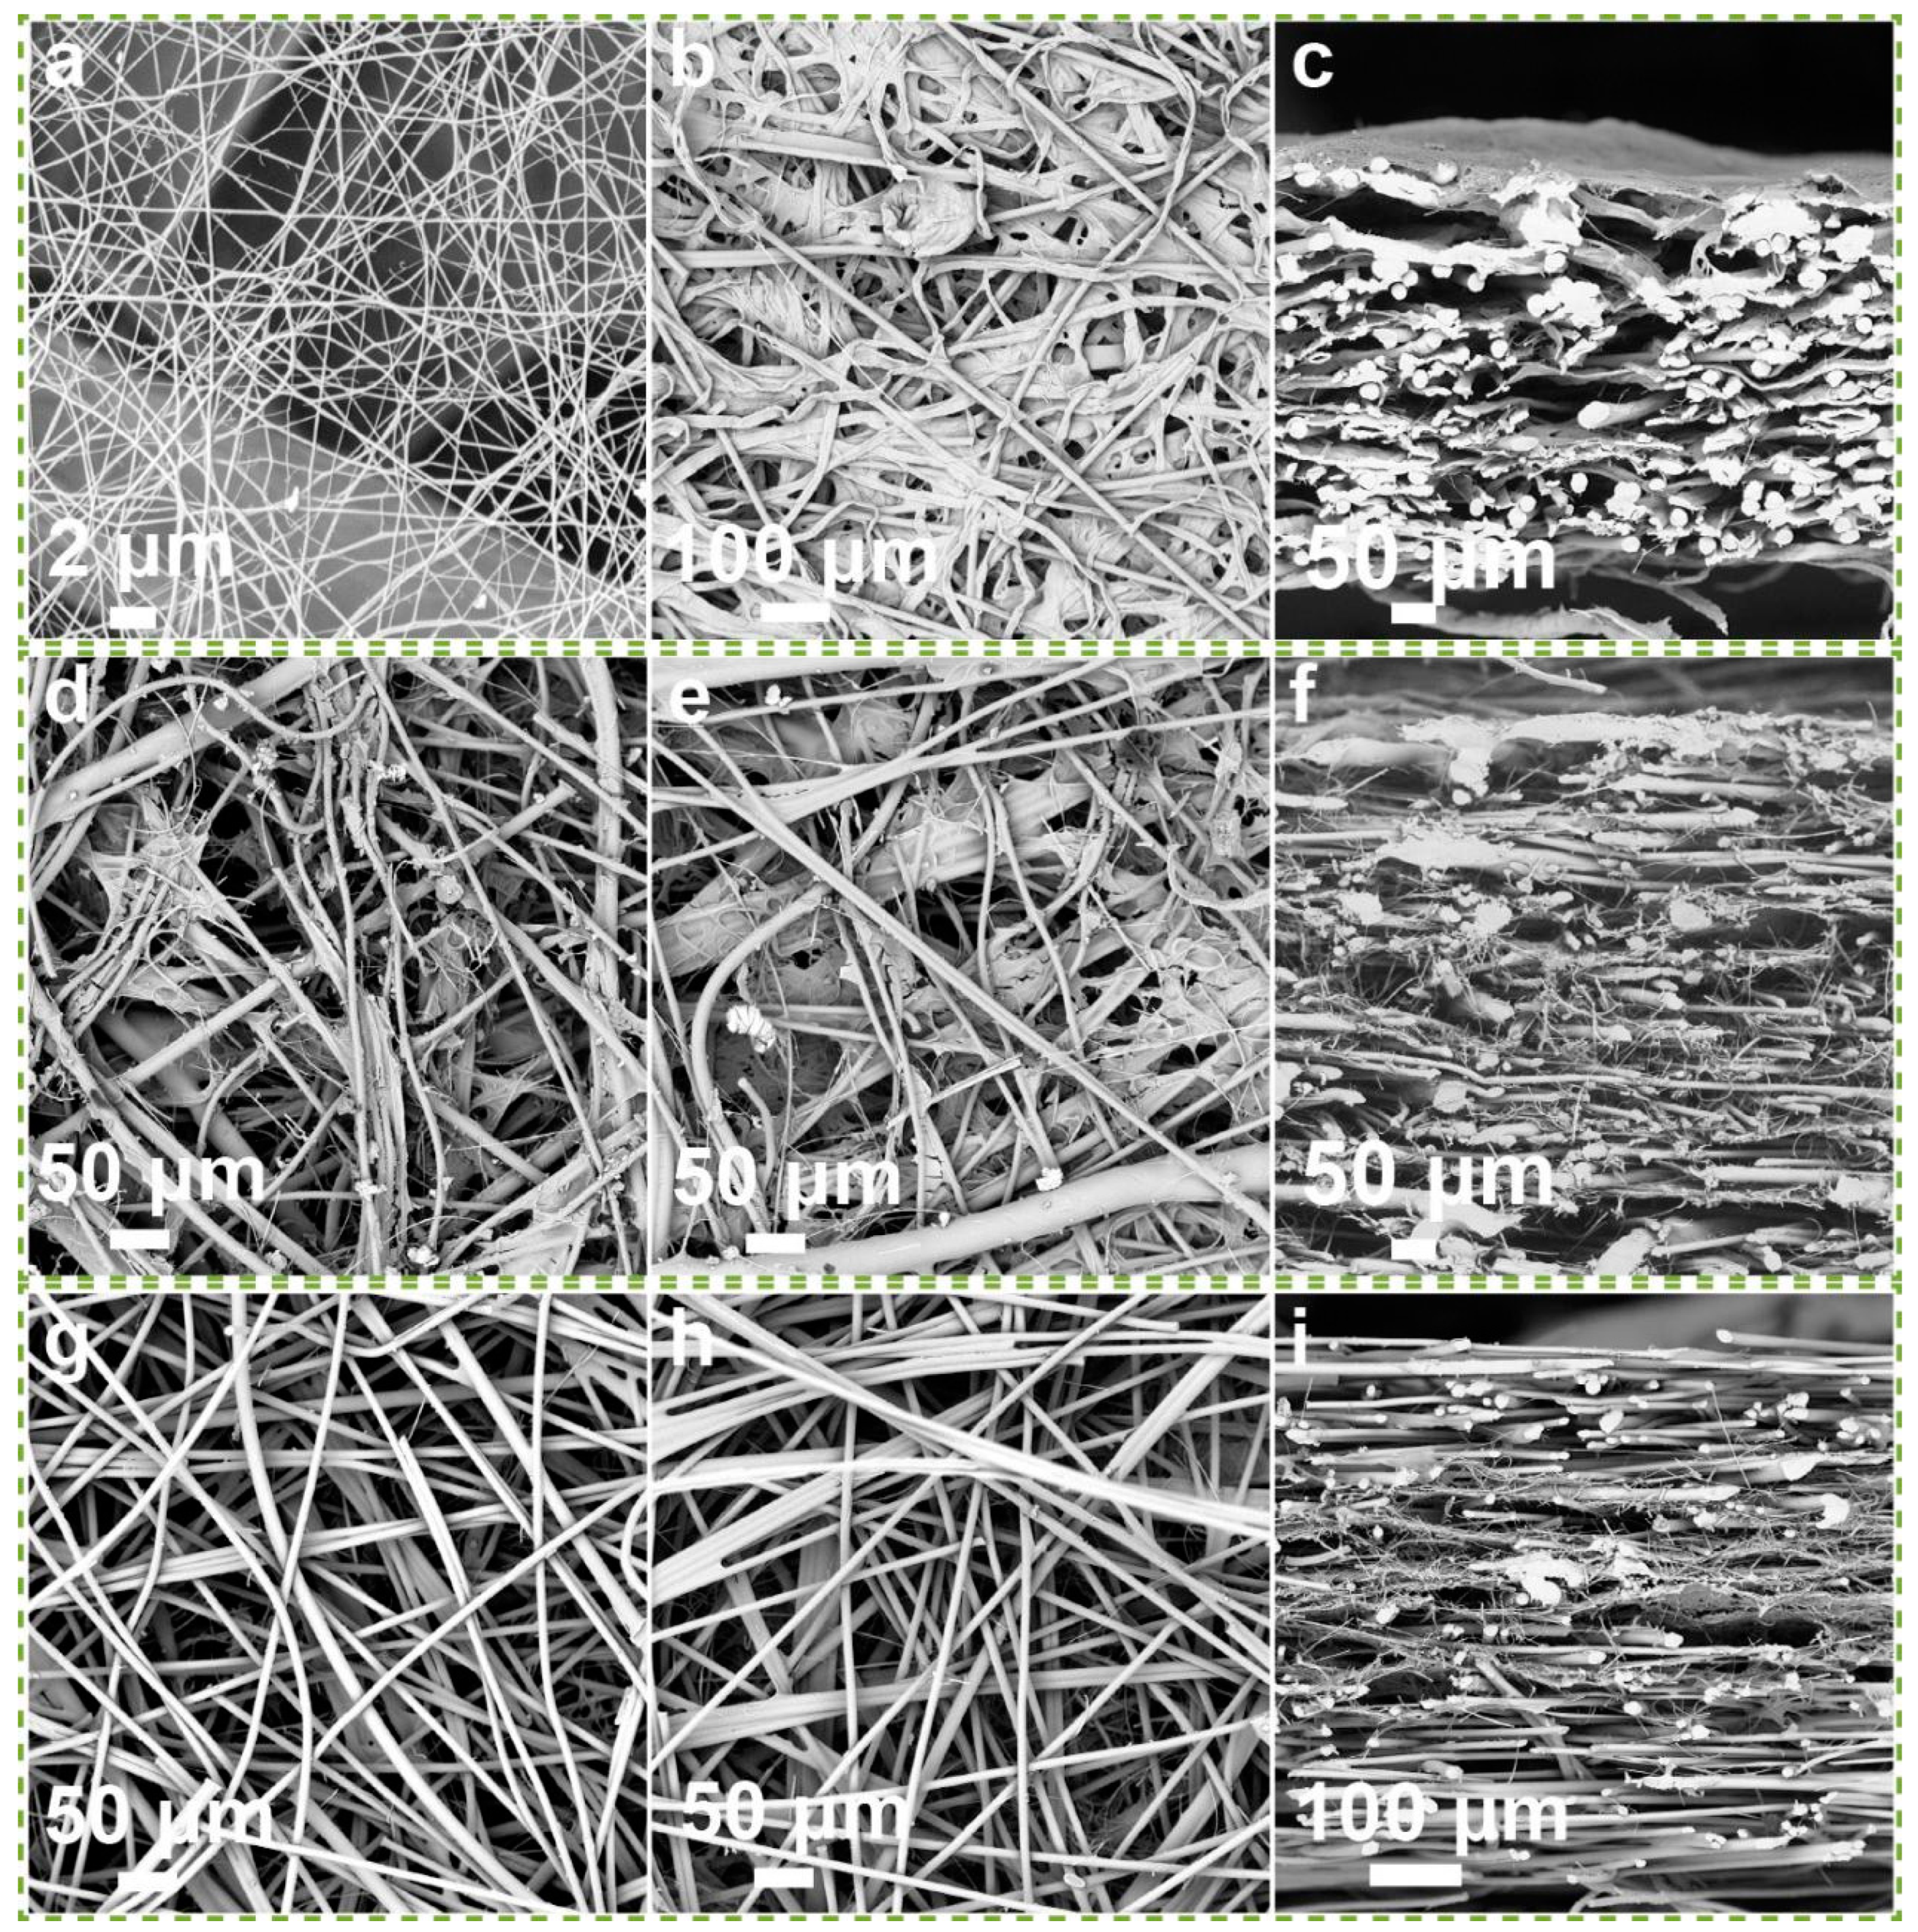
The inflow surface and section morphology of the three filter media are shown in
Figure 2. The electrospun nanofiber composite filter media are dual-layer structured. The substrate layer consists of kraft cellulose fibers and about 20 percent PET fibers (
Figure 2a–c). From
Figure 2d–f, it can be seen that the synthetic fiber filter media consisting of glass wool fibers and synthetic fibers (polyethylene terephthalate fibers) have a single-layer structure. From
Figure 2g–i, it can be seen that the melt-blown fiber composite filter material has a “sandwich” structure. The bottom layer consists of polyethylene terephthalate fibers, the middle layer consists of glass wool fibers and synthetic fiber and the top layer consists of melt-blown polypropylene fibers.
3.2. Basic Performance of Three Filter Media
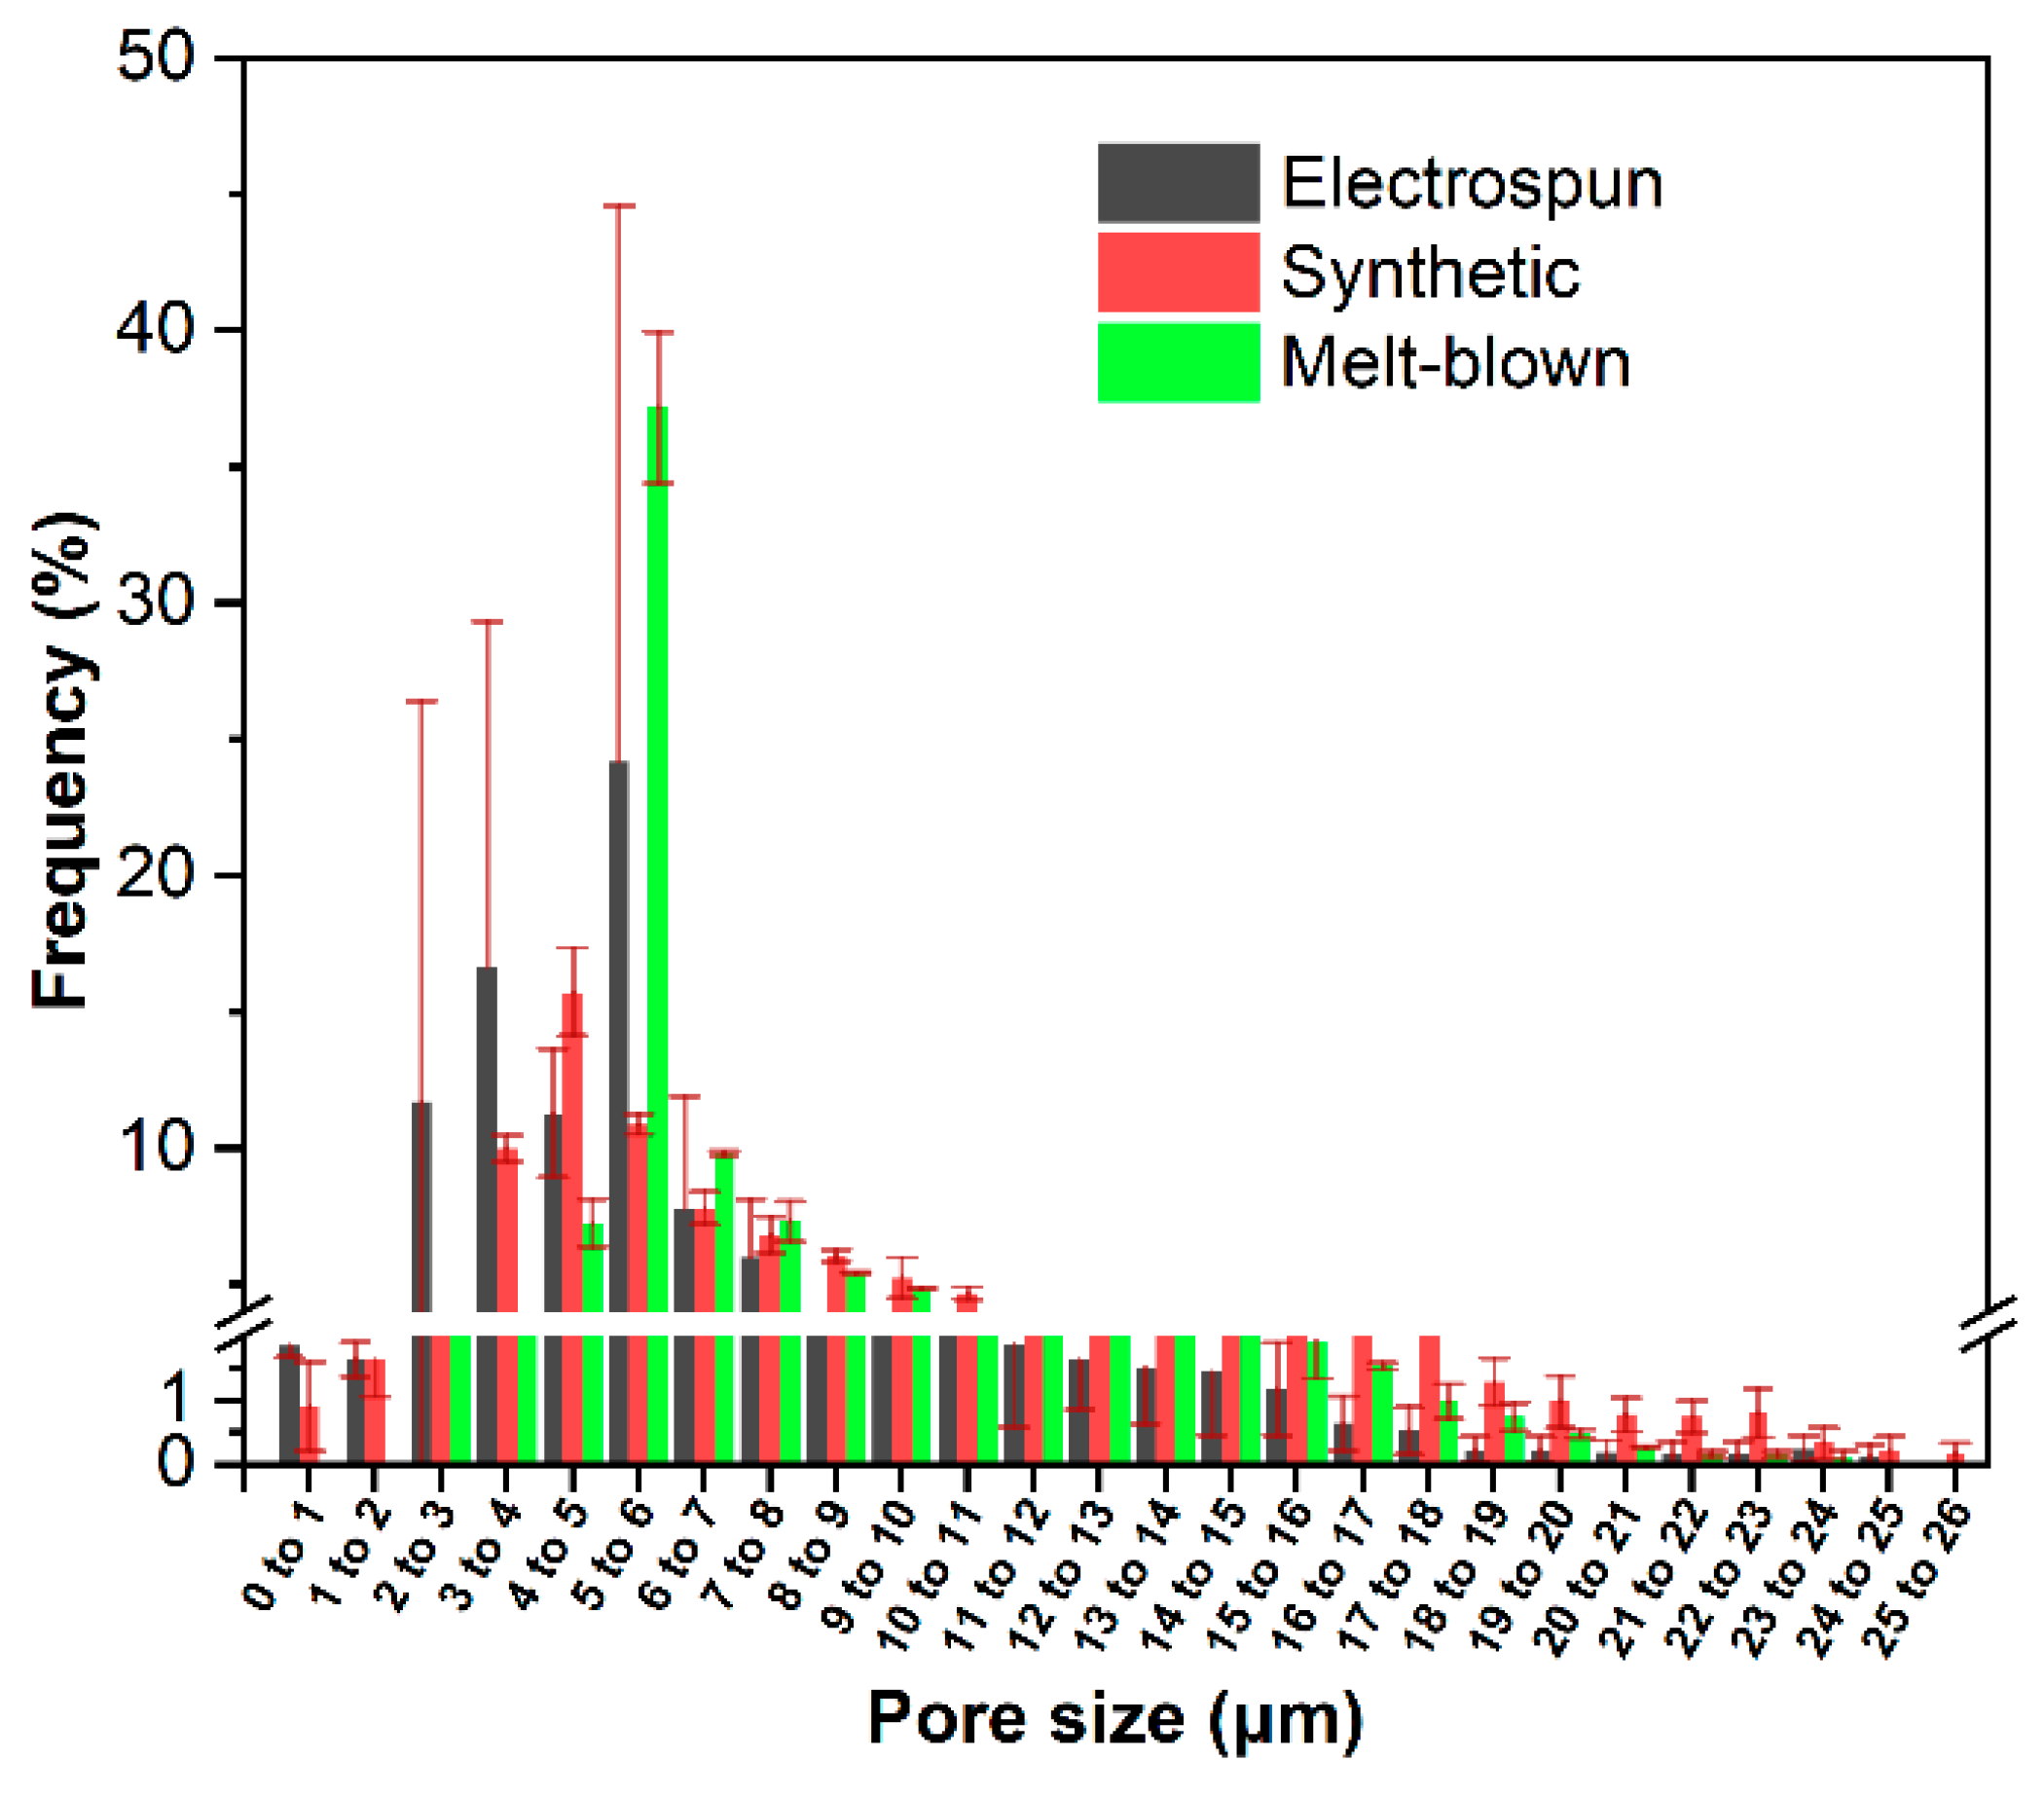
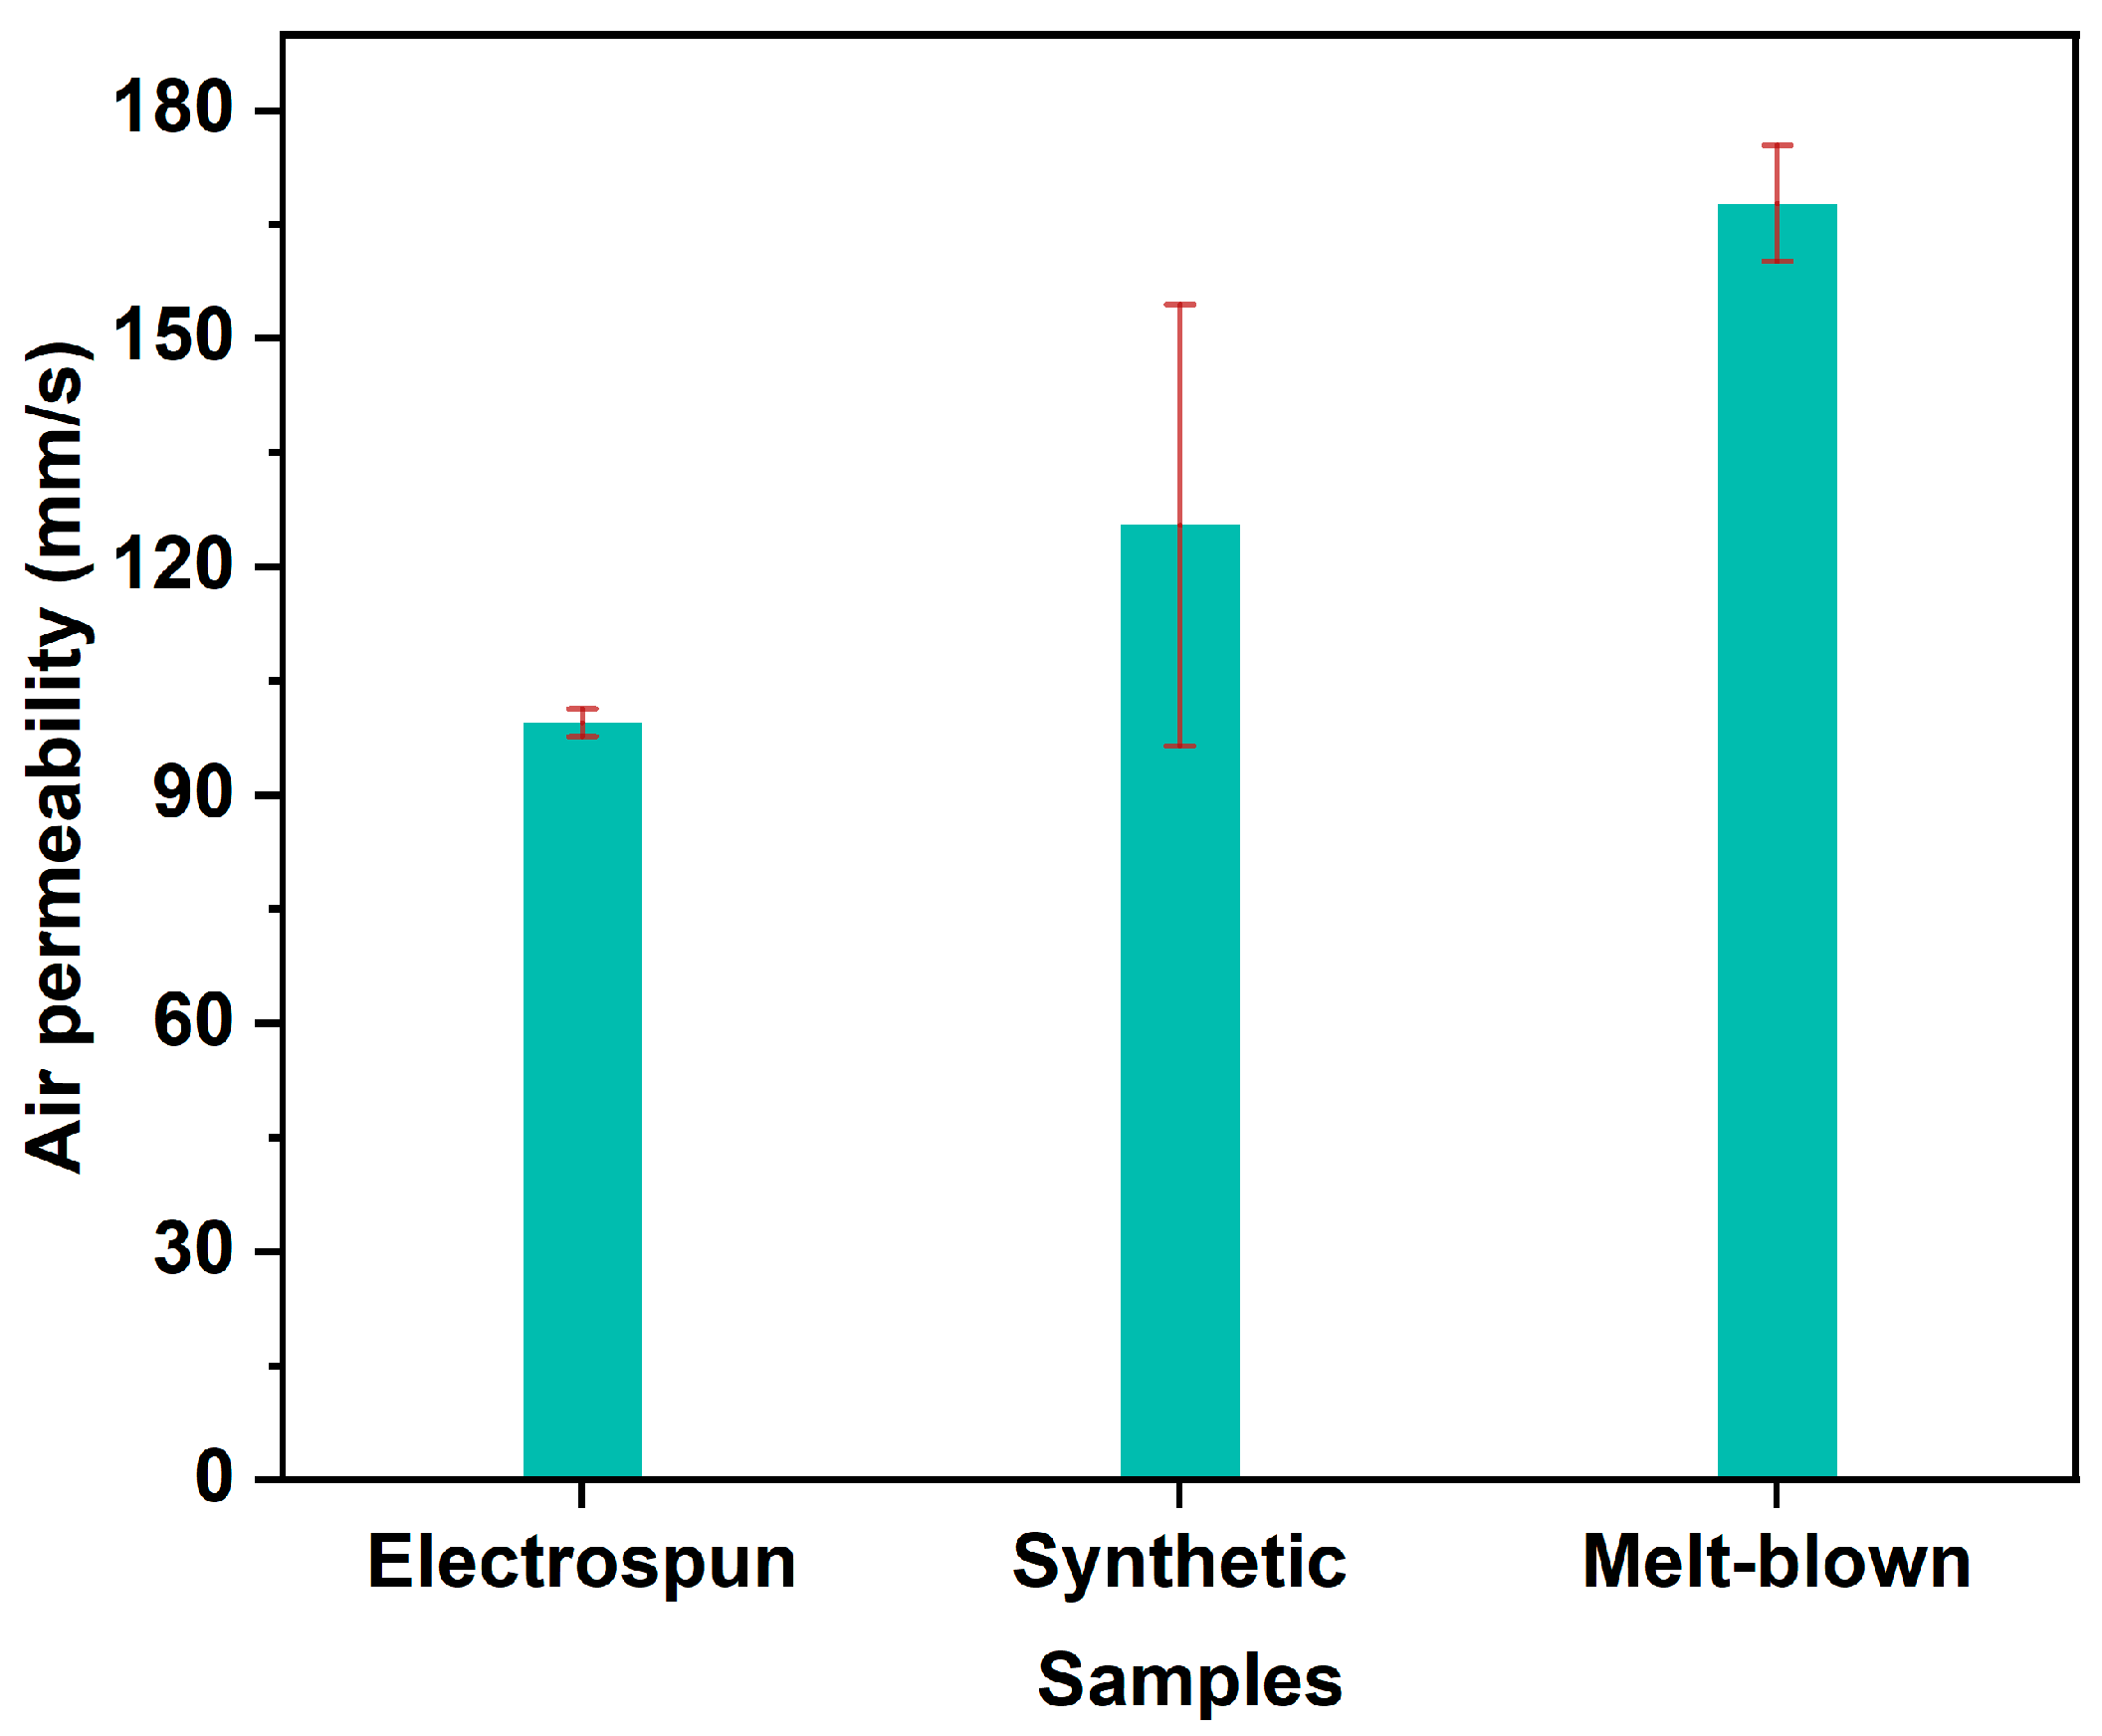
The air permeability and pore size distribution are shown in
Figure 3 and
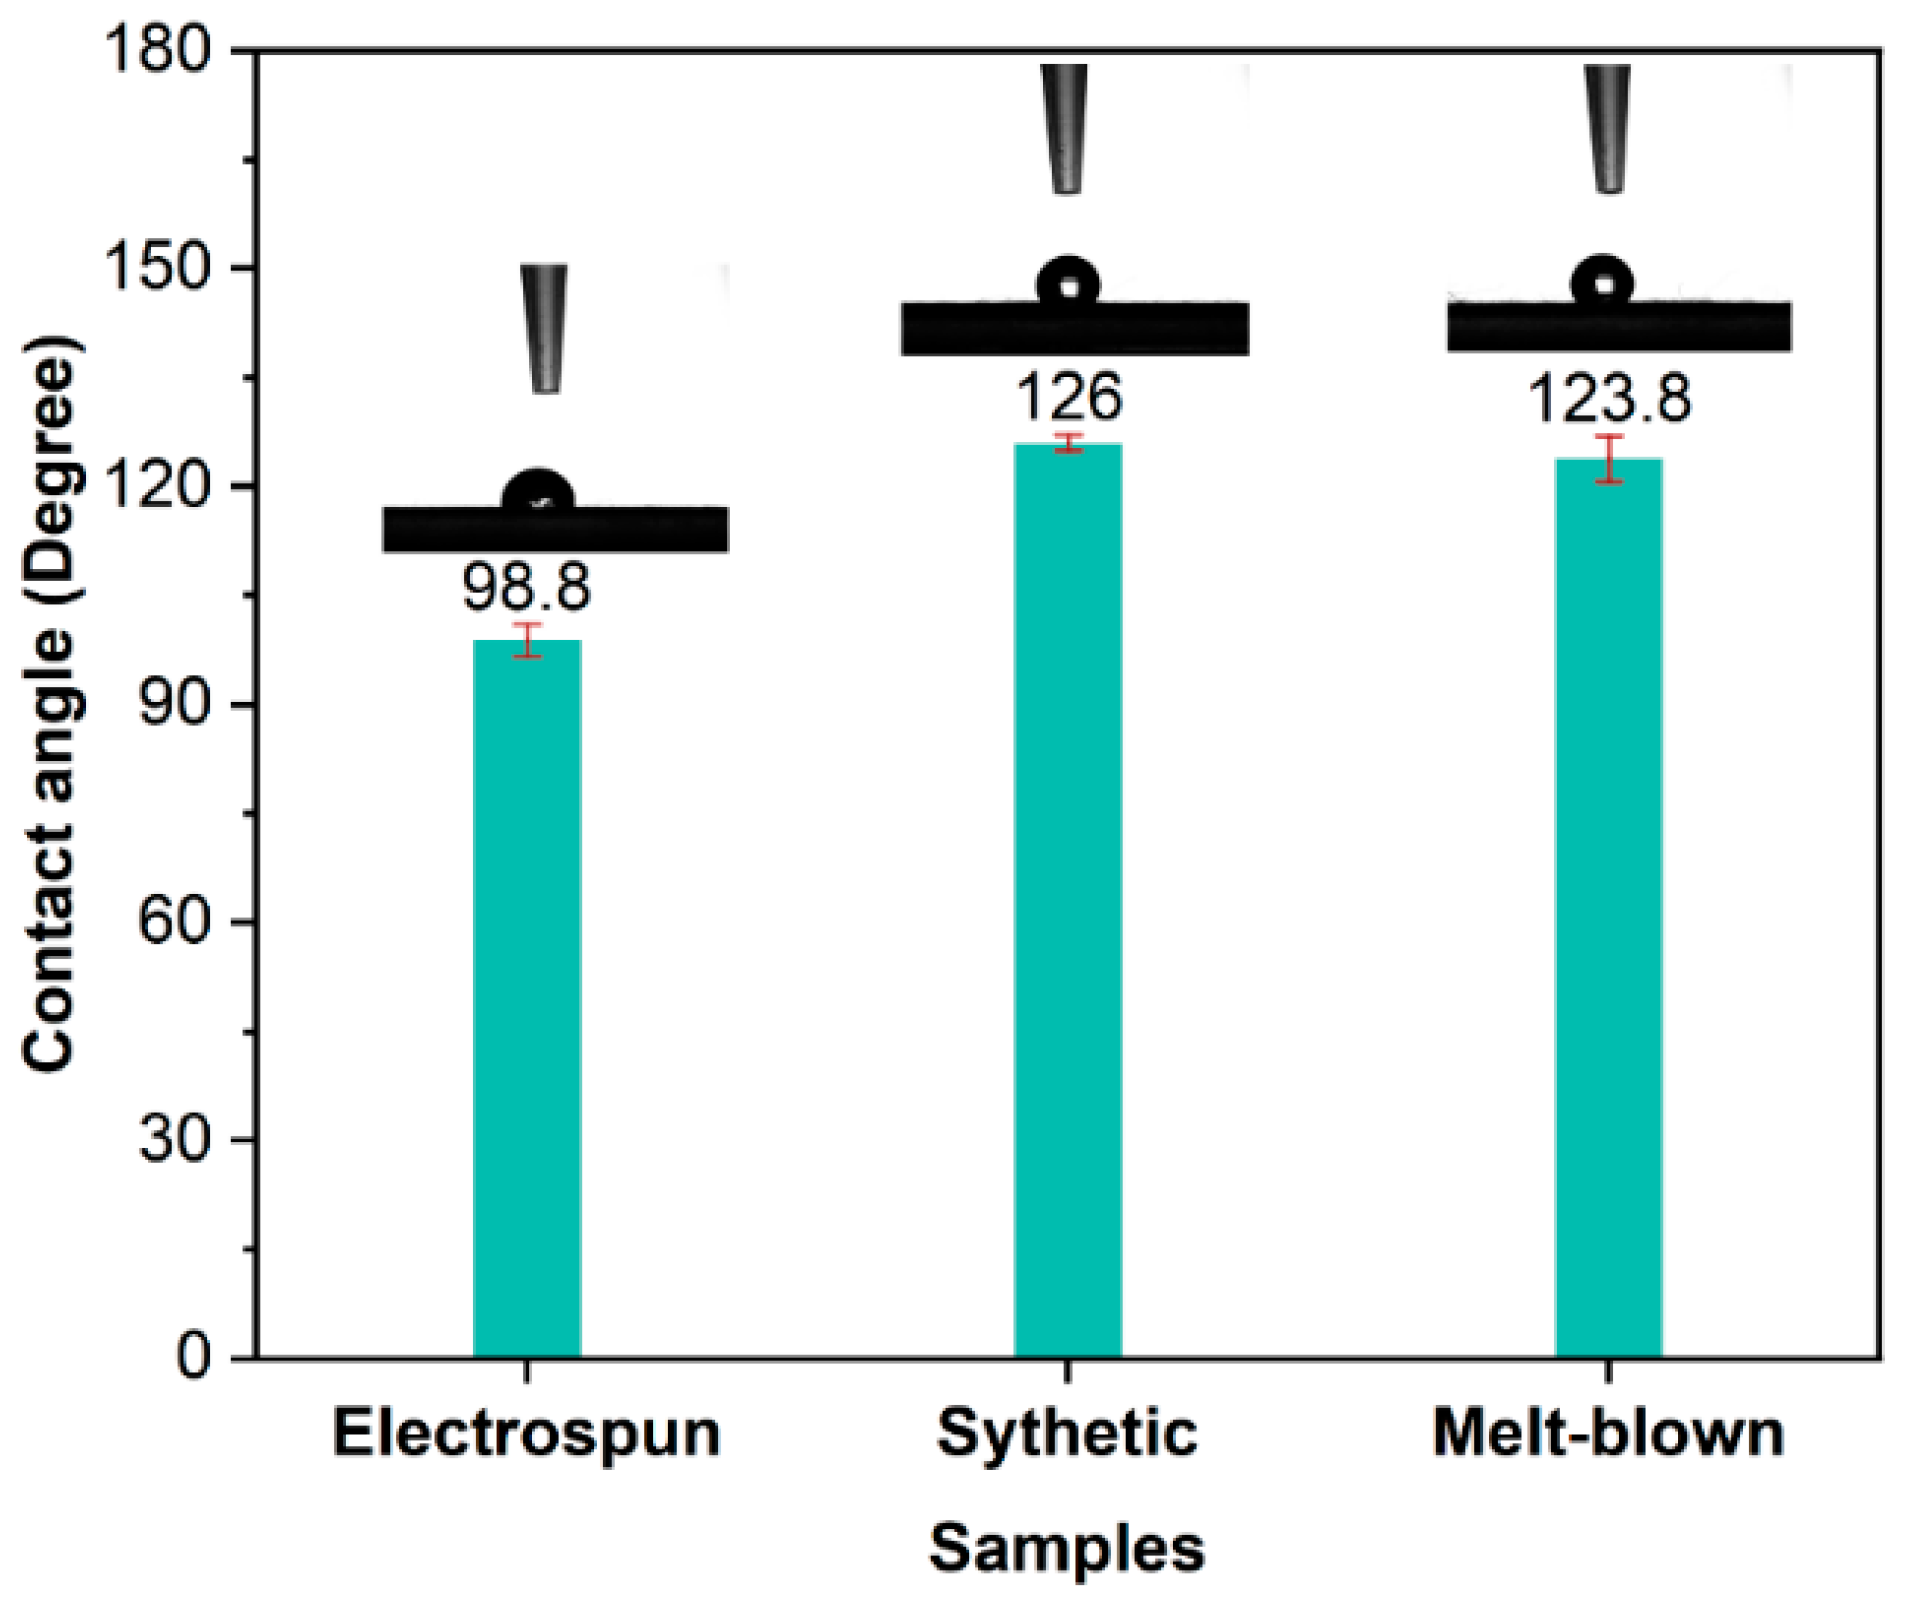
Figure 4. The pore size of the electrospun fiber composite filter material is mainly between 0 and 10 μm; among it, the size of 2~7 μm accounts for 71.7%; 5~6 μm has the largest number, accounting for 24.2%. The pore size of the synthetic fibers filter material is mainly between 0 and 18 μm; among it, the size of 2~7 μm accounts for 48%; 4~5 μm has the largest number, accounting for 15.7%. The pore size of the filter media with a sandwich structure is mainly between 2 and 8 μm; among it, 5 to 6 μm has the largest number, accounting for 37.2%. The fluffy structure on the top and bottom layer in the sandwich-structured filter media contributes to the largest air permeability. The compact structure of the electrospun fiber composite filter material leads to the smallest air permeability. Before the filter material contact angle was tested, a glass slide was used to flatten the filter material to minimize the impact of surface roughness of the filter media. From
Figure 5, it can be seen that the surface contact angle of the electrospun fiber composite filter material is the smallest. The contact angle of the filter media consisting of polyethylene terephthalate fiber in the surface layer is the largest.
3.3. Filter Performance of Three Filter Media
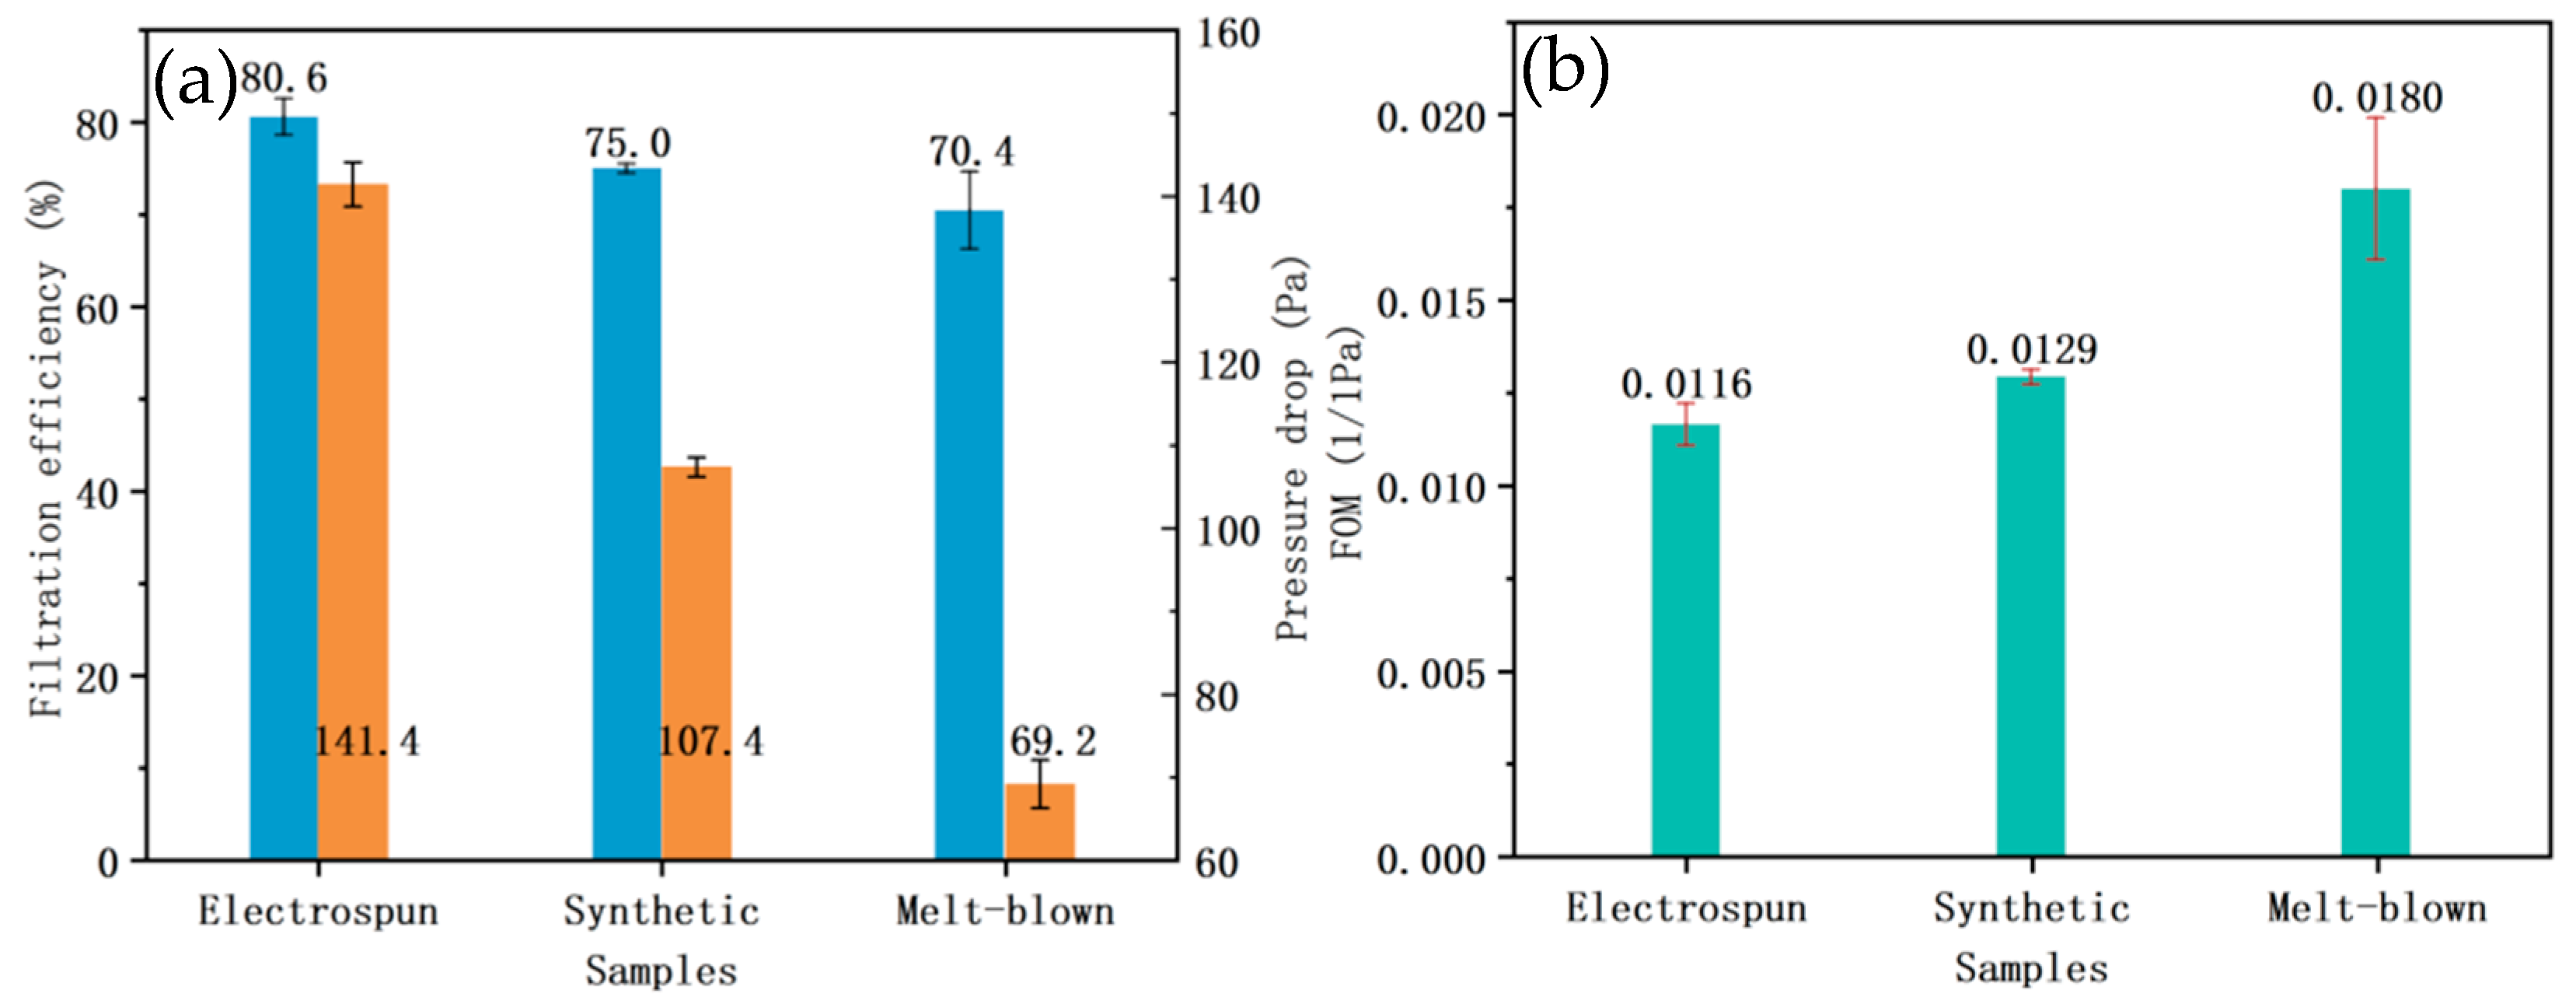
The initial filter performance of the three filter media is shown in
Figure 6. The initial filter efficiency of the three filter media is between 70 and 80%; the efficiency and resistance of the electrospun fiber composite filter material are the highest and the quality factor the lowest. The main reason is that the electrospun nanofiber layer structure is dense, leading to larger composite filter material resistance. The filter media with a sandwich structure has the lowest efficiency and resistance. This is due to its “sandwich” structure. The melt-blown fiber on the surface layer is looser than the electrospun fiber layer and the base layer is looser than the structure of the total synthetic fiber filter material. Therefore, the overall air resistance is the lowest among the three filter media.
3.4. Simulation of Deposition Behavior of Particulate Matters in Filter Media
The models established based on the fiber composition, structure and basic performance are shown in
Figure 7,
Figure 8 and
Figure 9.
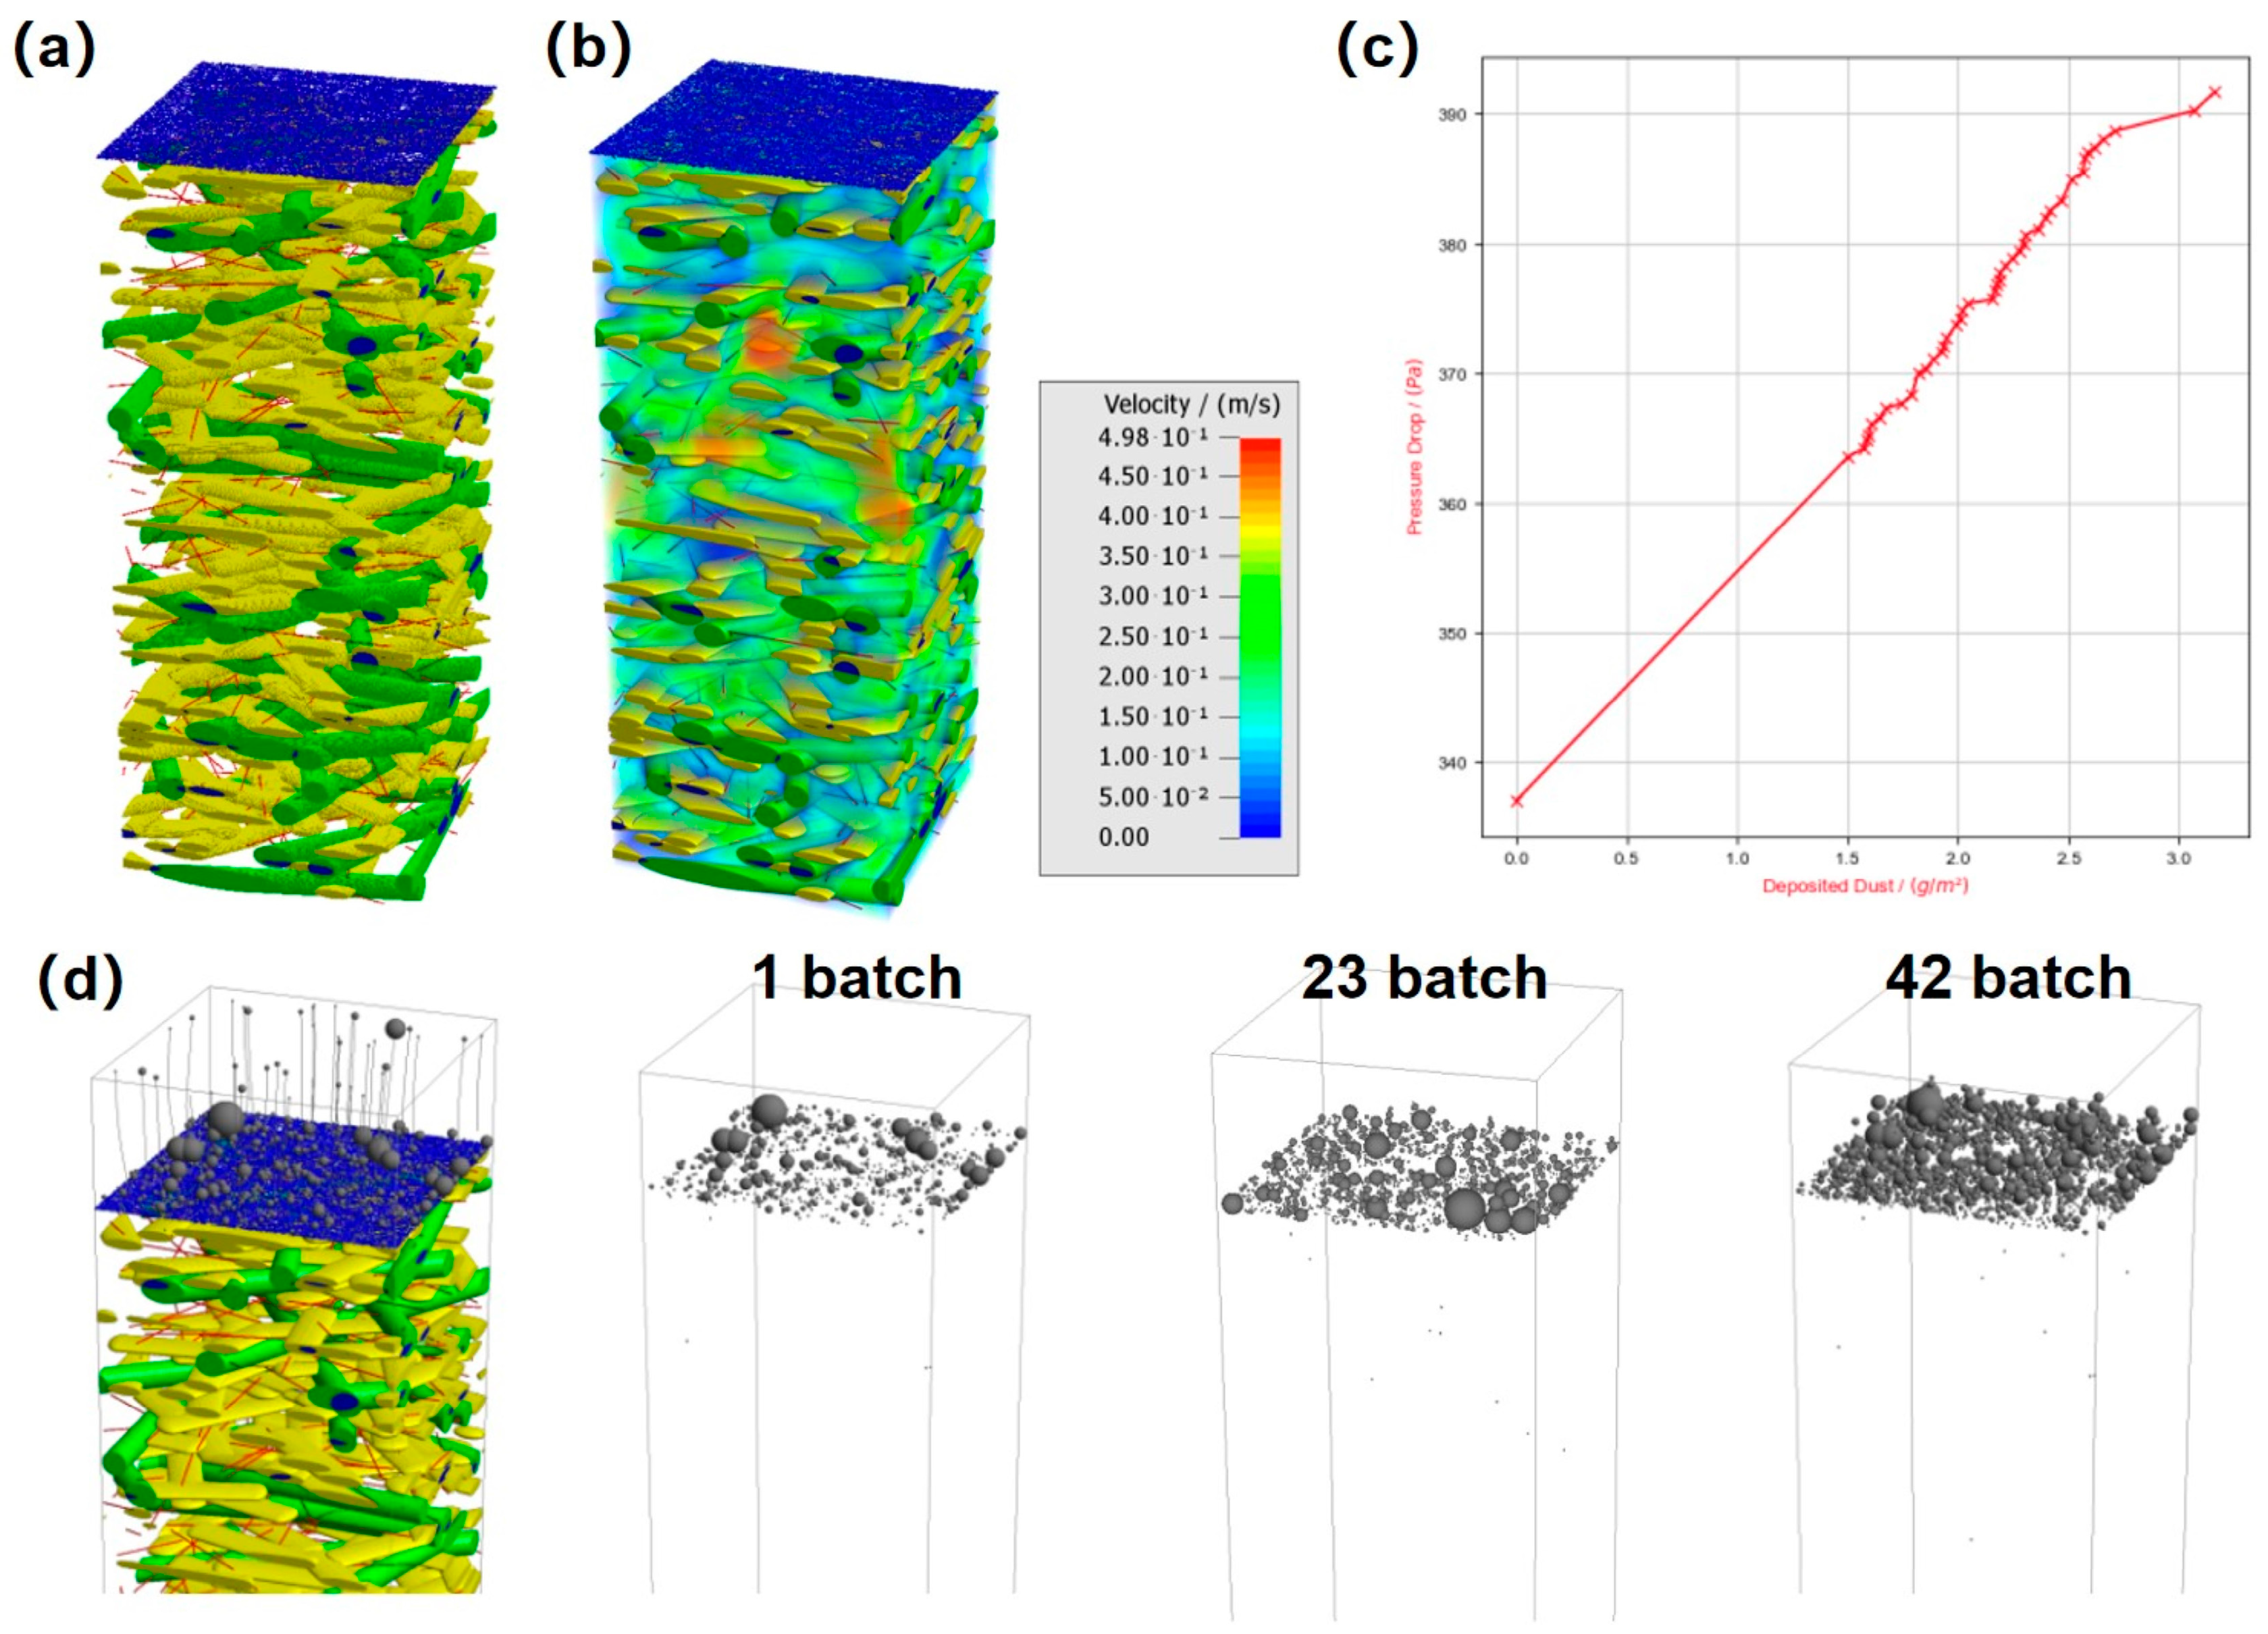
Figure 7c is the calculation result of the dust-holding resistance of electrospun fiber composite filter material models. With the increase of the dust-holding capacity, the model resistance increases linearly.
Figure 7d is the calculation result of the deposition behavior by loading different amounts of A2 dust in models. The results show that A2 dust particles are mainly distributed in the electrospun nanofiber layer and only a small amount entered the filter material base.
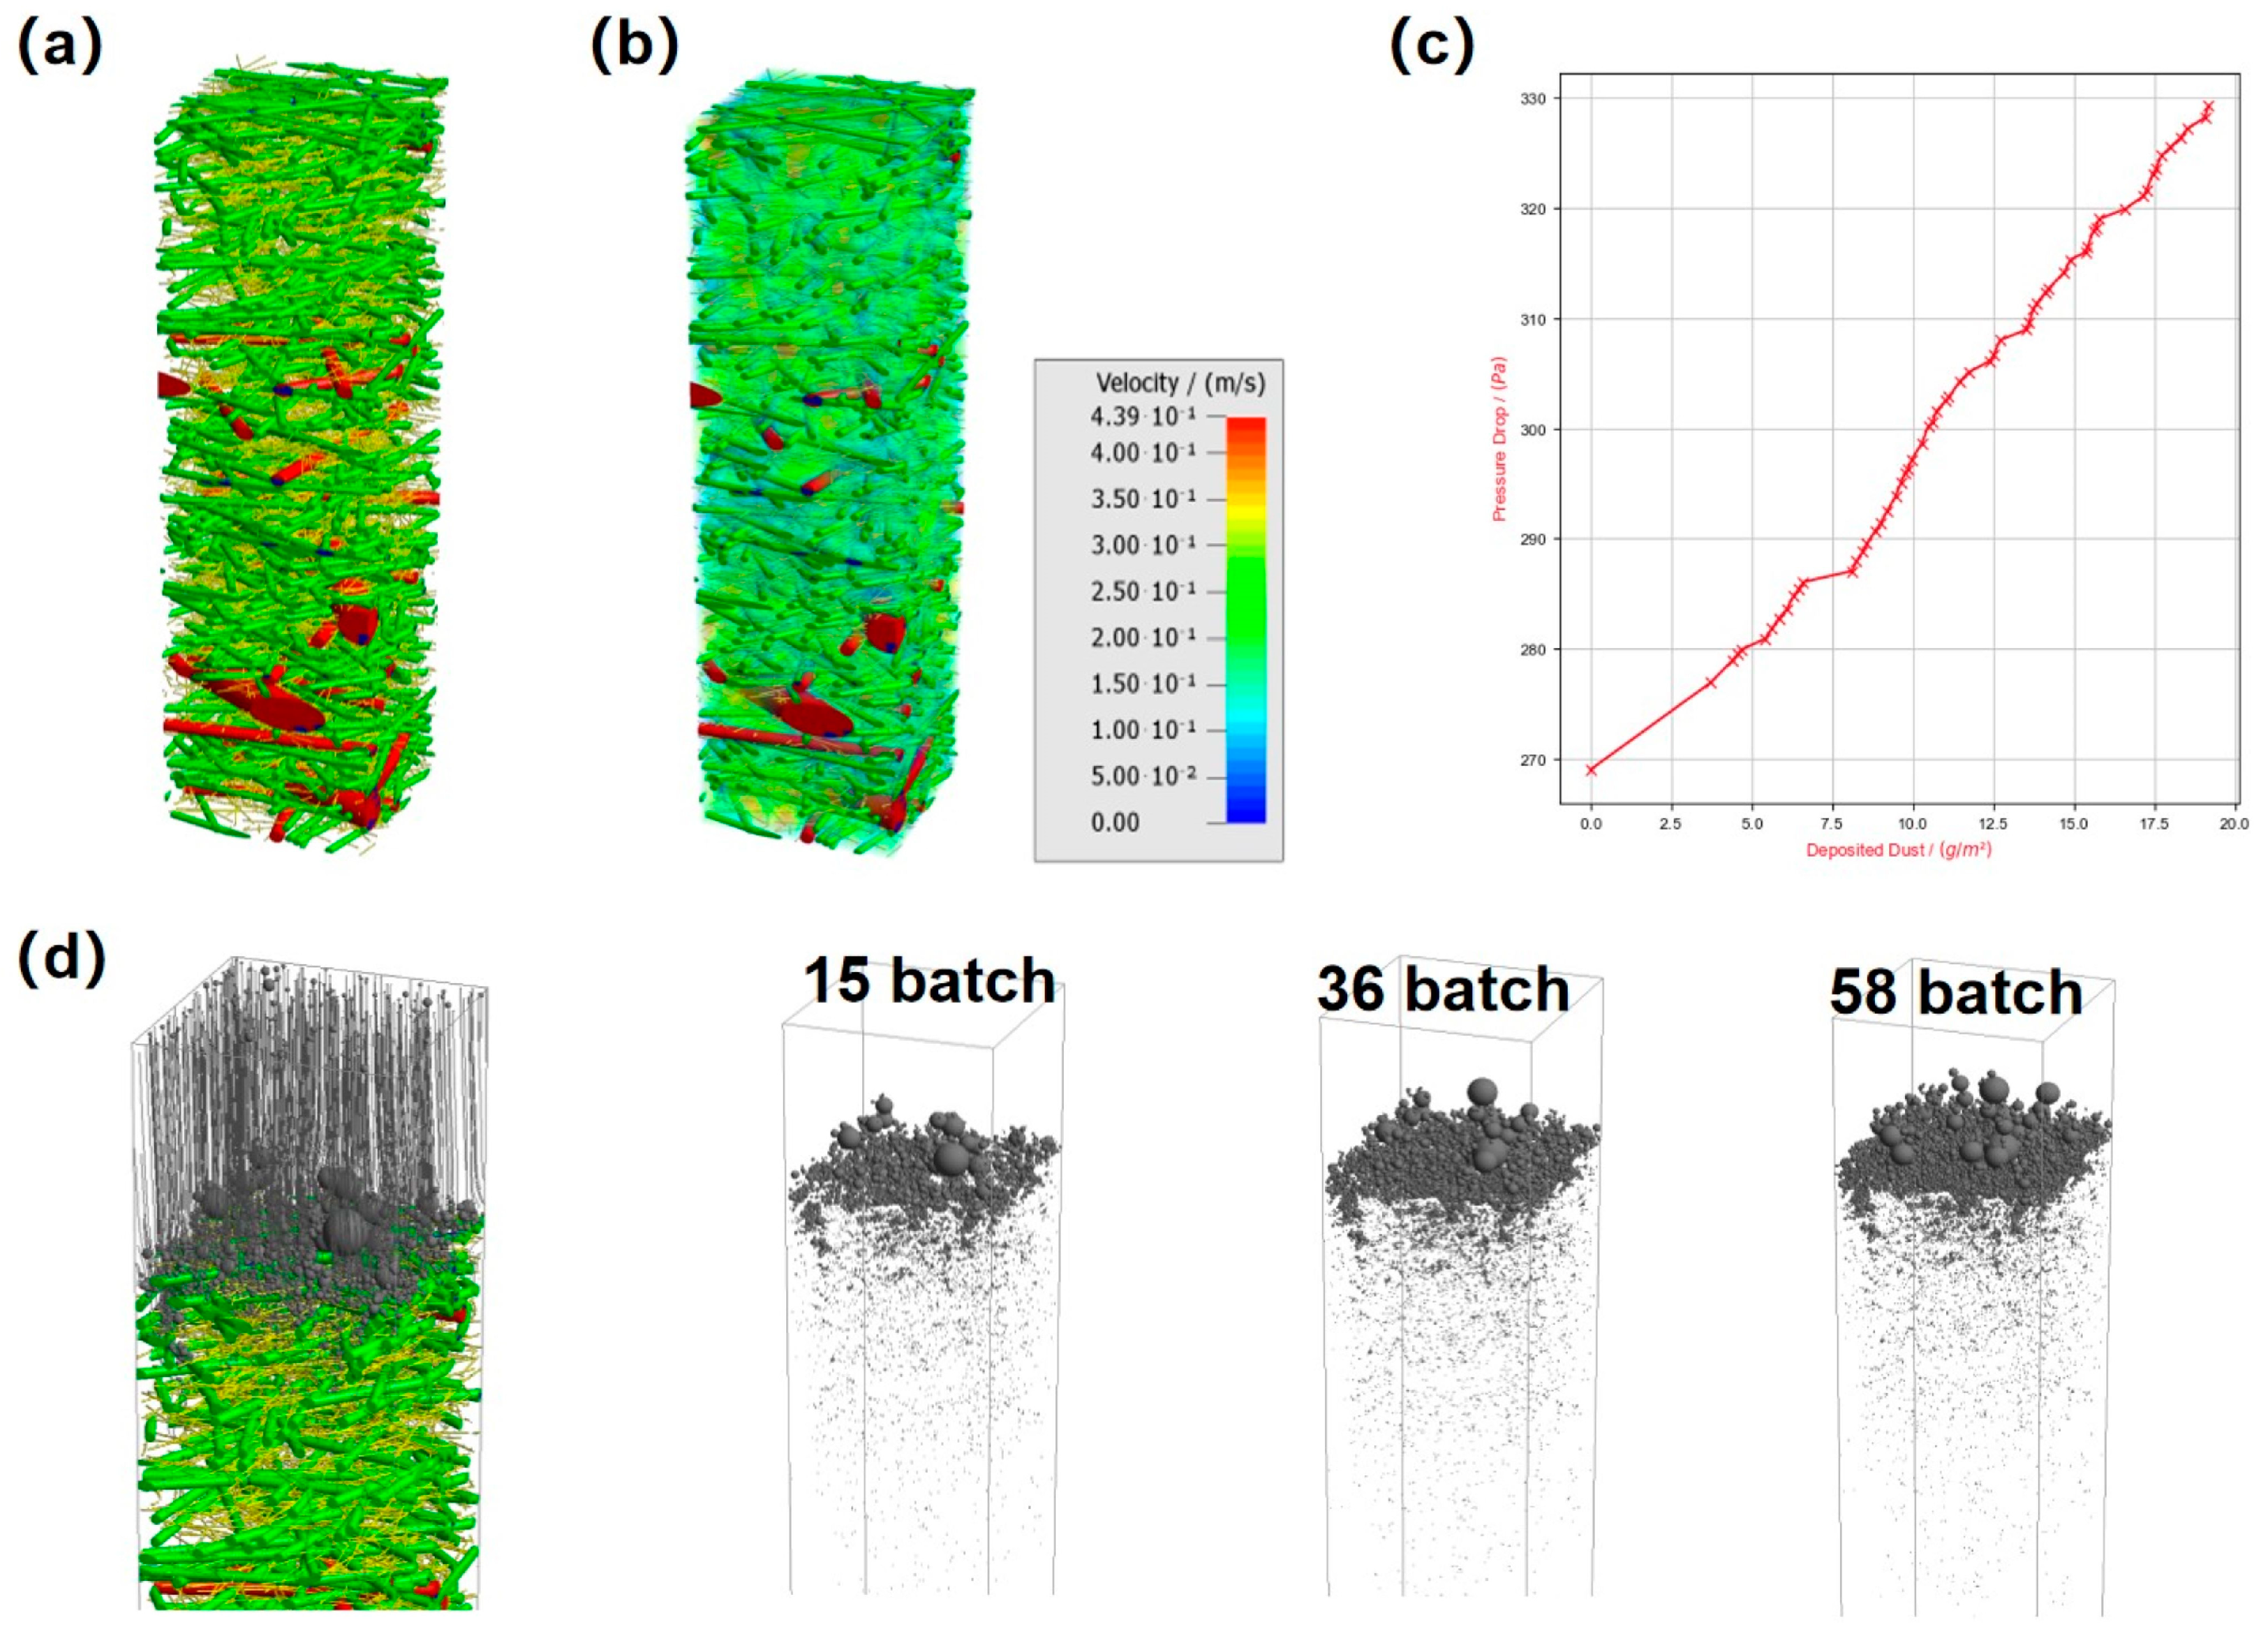
Figure 8c shows that with the increase of the dust-holding capacity, the increase rate of the pressure difference of the synthetic fiber filter material is less than that of the electrospun fiber composite filter material. The deposition track of particles in
Figure 8d shows that the larger particles in A2 dust are mainly distributed on the filter material surface and the smaller ones inside the filter media.
Figure 9d shows that the larger particles in the A2 dust of the sandwich-structured filter media are mainly captured by the loose inflow layer and the smaller ones pass through the inflow layer to be deposited in the intermediate layer of fine fiber. Compared with the electrospun fiber composite filter material, the result amounts to improving the porosity of the filter cake structure formed by particles in the filter media and reducing the resistance to air, which is also the reason why such material has a longer service life.
3.5. Dust-Holding Performance of Three Filter Media under Different Humidity Conditions
Dust-holding–resistance curves of the three filter media under humidity conditions of 30 ± 2%, 60 ± 3% and 75 ± 2% are shown in
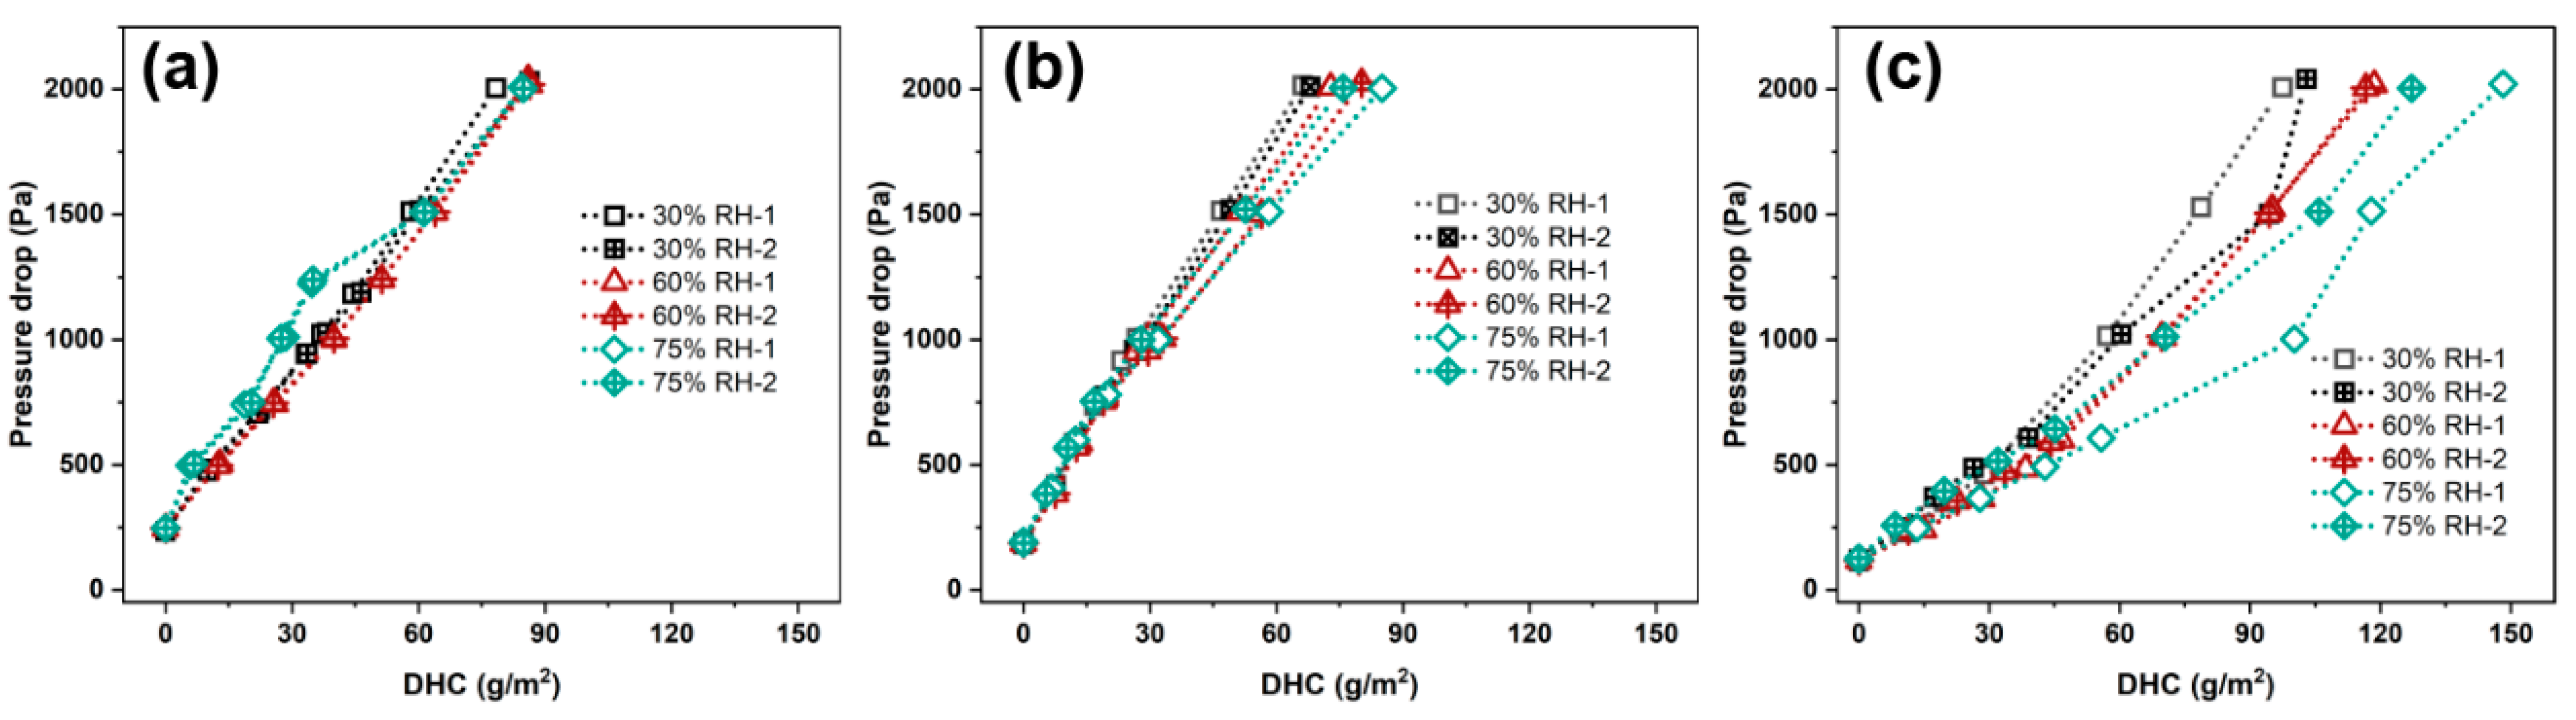
Figure 10. It can be seen that the dust-holding capacity of synthetic fiber filter media with a sandwich structure is the largest, while the dust-holding capacity of the synthetic fiber single-layer filter material is similar to that of the electrospun fiber composite filter material. During dust-holding, the resistance of the synthetic fiber filter media with a sandwich structure first increases slowly with the increase of the dust-holding capacity, and this phase is called depth filtration. Afterwards, the resistance of the filter media increases fast and this phase is called filter cake filtration. The resistance of the other two filter media increases linearly with the increase of the dust-holding capacity.
With the increase of humidity, the dust-holding resistance change curves of the three filter media are divided into two phases. In the first phase, before the filter cake is formed, with the increase of humidity, the dust-holding resistance change curves of the three filter media have little change. In the second phase, the filter cake is formed; with the increase of humidity, the resistance increasing rate of the three filter media decrease. It can be seen that the change of the dust-holding–resistance curve of the electrospun fiber composite filter material is least affected by humidity, so the humidity can hardly affect the dust-holding capacity.
The change of the dust-holding–resistance curves of the synthetic fiber single-layer filter material and synthetic fiber composite filter material with a sandwich structure are more significantly affected by humidity during filter cake filtration and the latter is most significant. Compared with a humidity of 30% RH, the increasing rate of resistance of the filter media decreased significantly when the humidity is 75% RH.
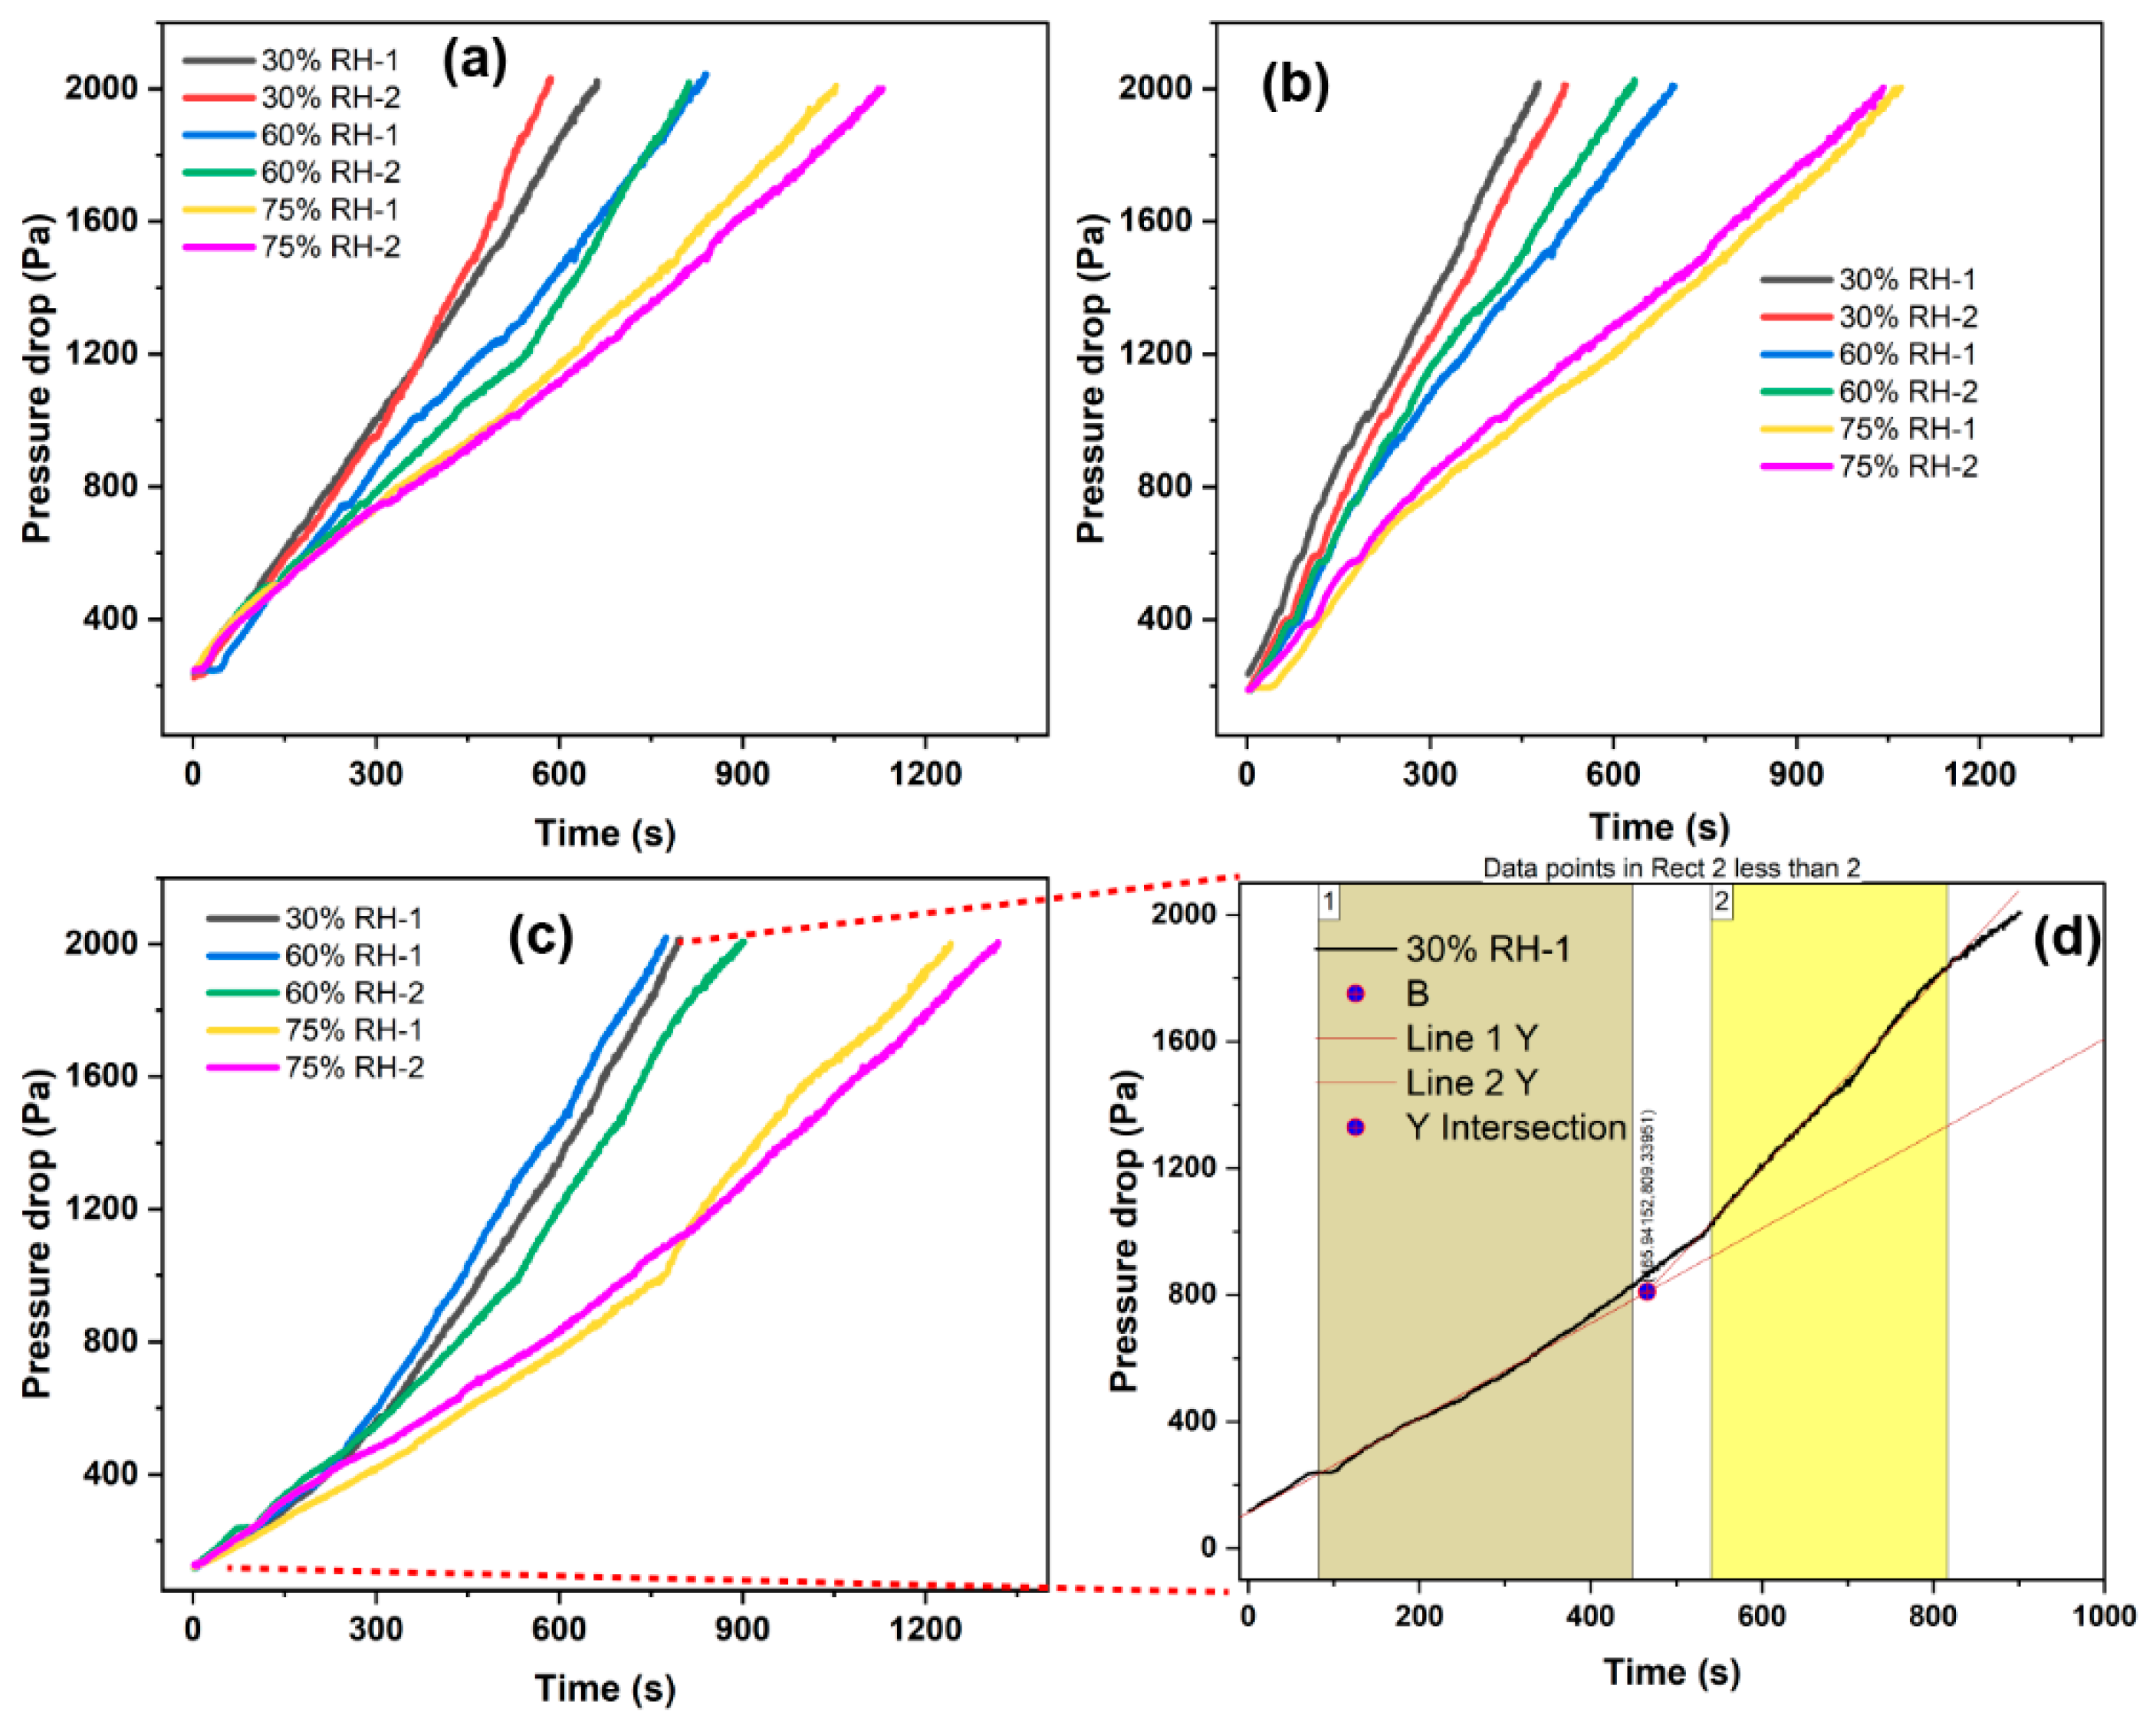
The resistance–time curves of the three filter media are shown in
Figure 11; a more intuitive analysis of the resistance changes of the three filter media can be obtained under different humidity conditions during dust holding. The analysis results of the increasing resistance rate are shown in
Table 1. During the early dust-holding stage of the three filter media, with the increase of humidity, the increasing rate of resistance has little change. The analysis results of the resistance change rate of the three filter media at this phase in
Table 2 indicate that under the same conditions, during the phase of deep filtration, the increasing resistance rate of the total synthetic fiber filter media with a sandwich structure is minimum and that of the total synthetic fiber filter media is maximum. When the duration of dust holding is 300 s, the resistance change rate of the electrospun fiber composite filter material and filter media with a sandwich structure markedly reduce with the increase of humidity. The impact degree of humidity on the resistance of the total synthetic single-layer fiber filter material is greater than that of the other two filter media during the entire dust-holding process. At the initial stage of dust holding, the resistance of the filter media increases faster than that of the cake filtration phase. In the deep filtration phase, particulate matters are deposited inside the filter media to reduce the porosity, which is smaller than the cake porosity formed by particulate matters. As a result, the resistance at the cake filtration phase increased more slowly.
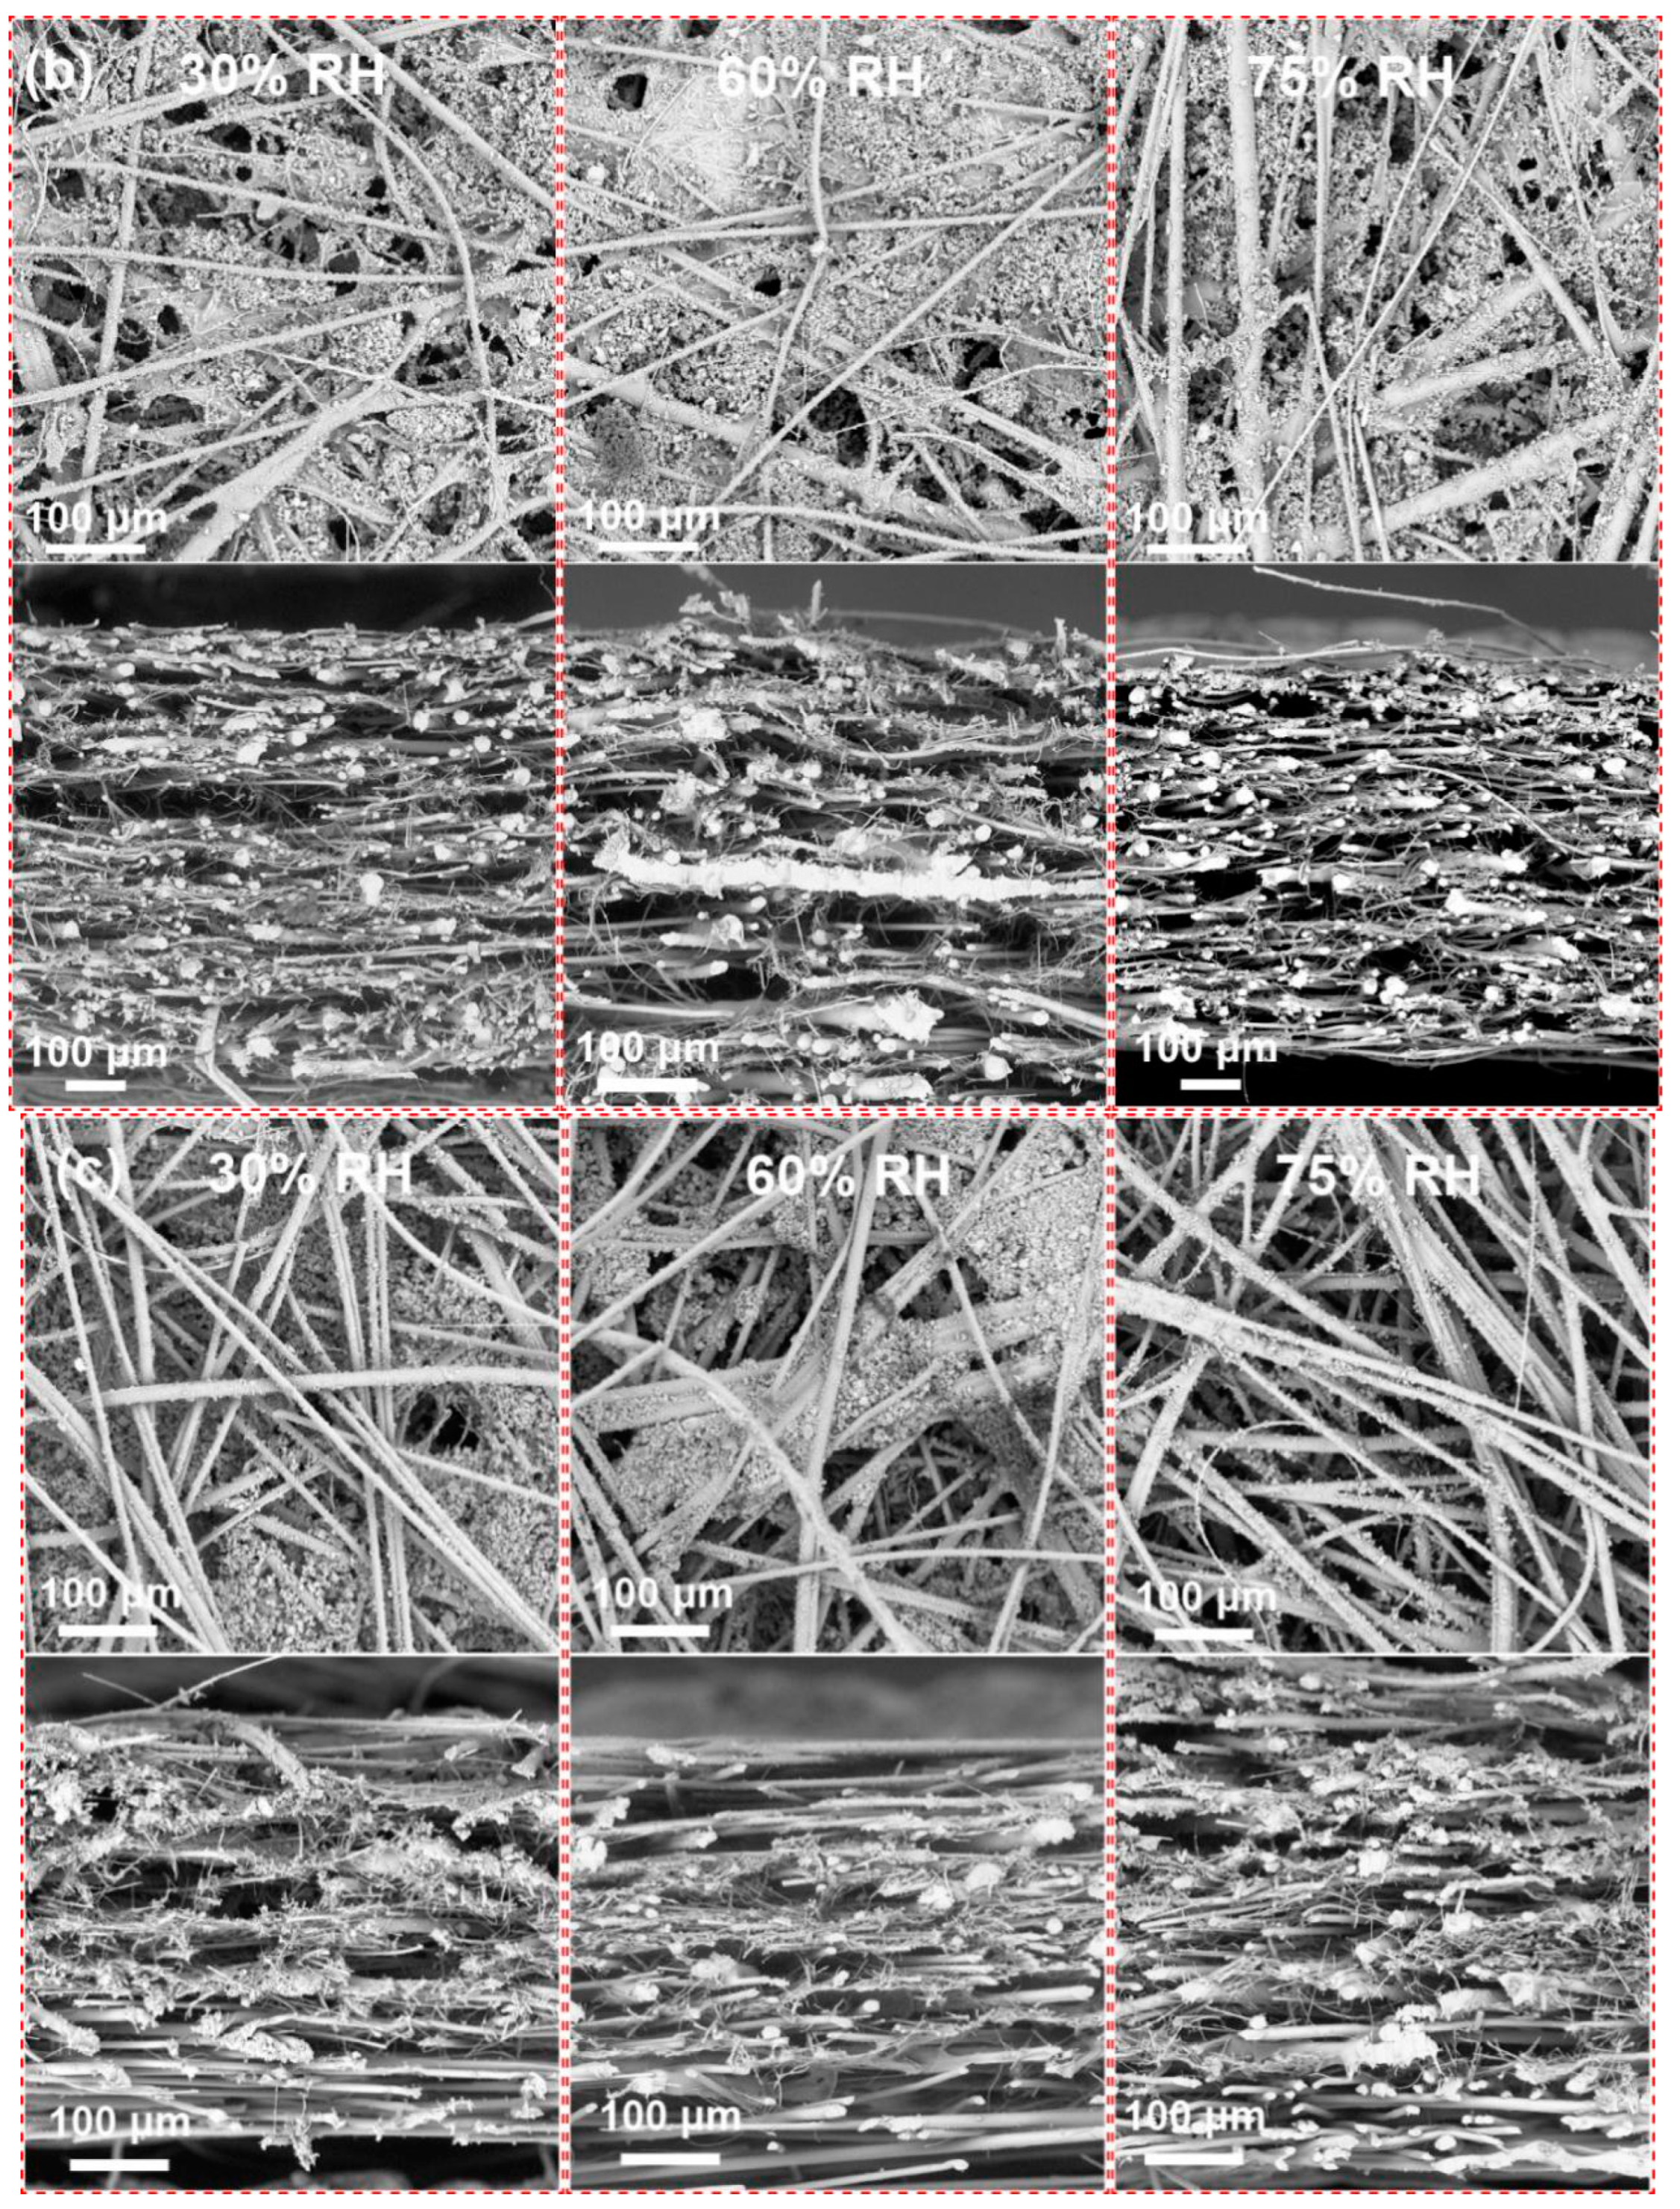
3.6. Particle Distribution in Filter Media after Dust Holding
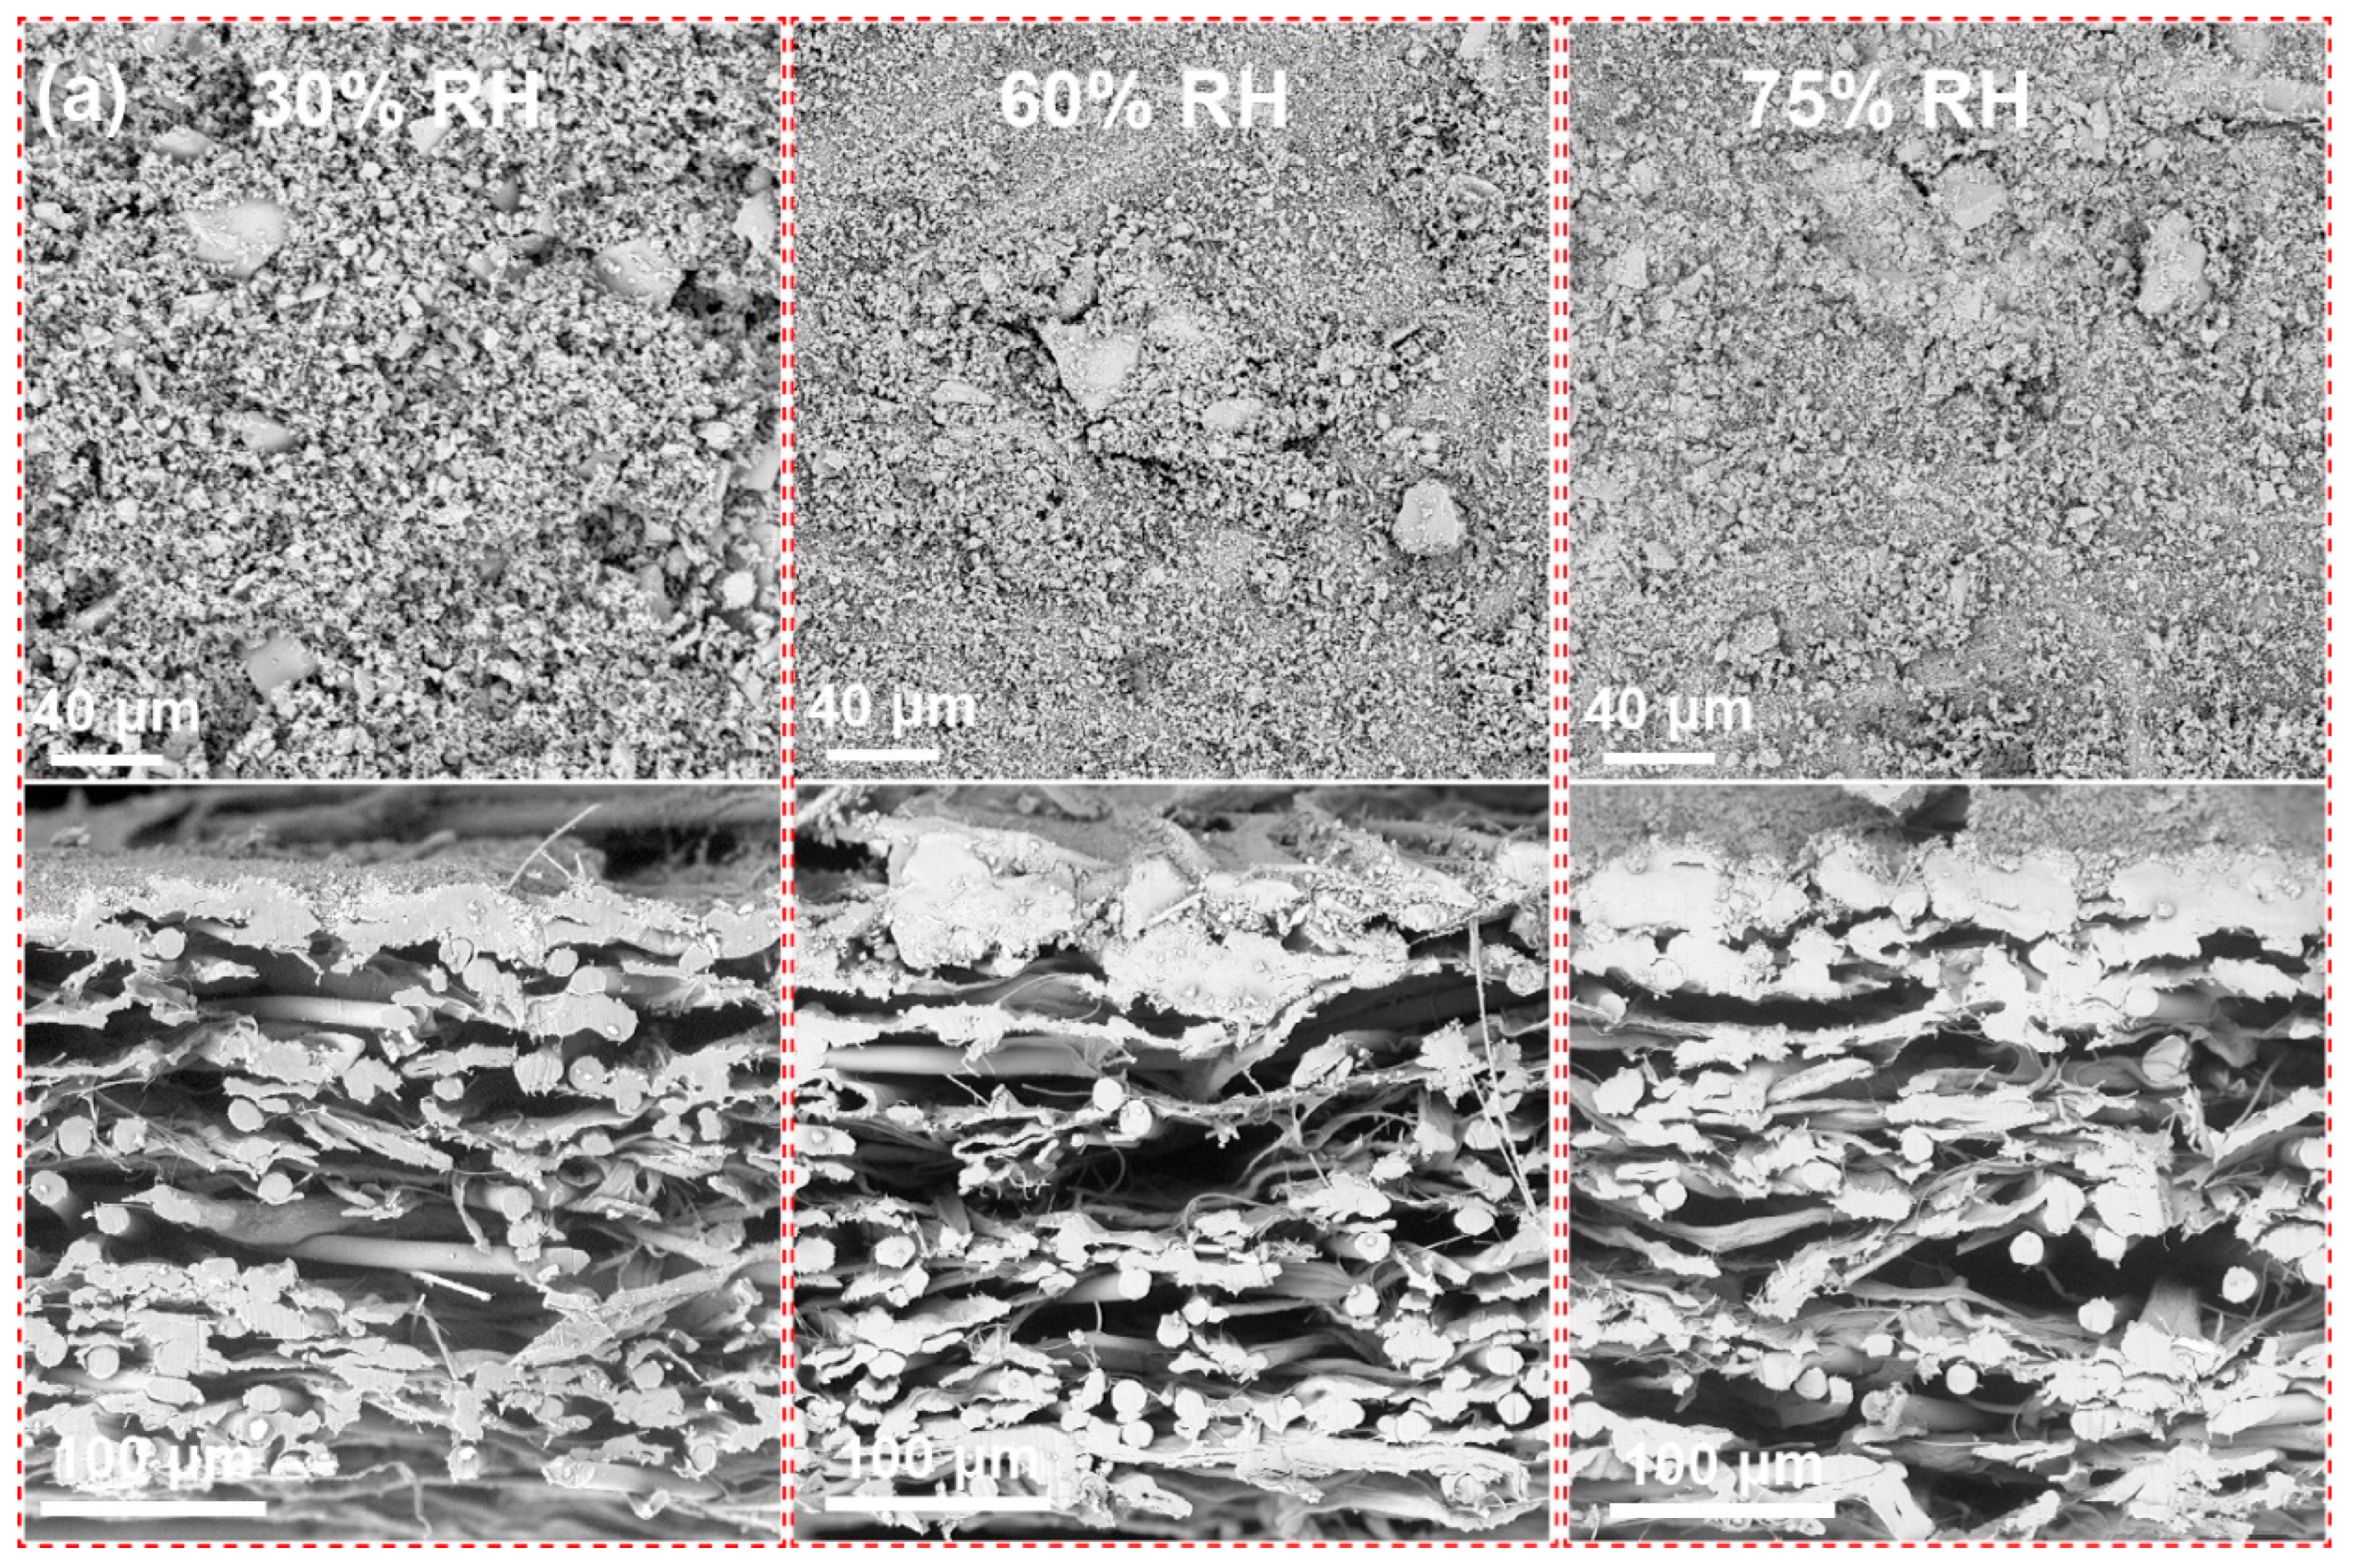
Figure 12 shows the analysis results of the particle distribution in the three filter media after dust holding under different humidity conditions. Particles in the electrospun fiber composite filter material are distributed in the electrospun fiber layer and there are almost no particulate matters in the base layer, which is consistent with the simulation results. There are particulate matters distributed throughout the thickness direction of the synthetic fiber single-layer filter material. A large number of particles is mainly distributed in the upper layer of the inflow surface of the synthetic fiber filter media with a sandwich structure and a small number in the middle fine fiber layer. It is shown that the cake structure formed by the particles on the surface of the electrospun fiber composite filter material was denser with the increase of humidity.
3.7. Influence of Humidity on Cake Performance
The total resistance after the filter media form cake is the sum of the clean filter material Δ
Pfilter and cake resistance Δ
Pcake.
The clean filter material and filter cake are regarded as rigid materials and the passing air stream as laminar flow, so the calculation formulas for the resistance using Darcy’s law of the two parts are:
where
is the resistance coefficient of clean filter material,
is the cake resistance coefficient,
is cake quality and
is the effective filtration area. Integrate the above three formulas to obtain the resistance calculation formula of filter cake as below:
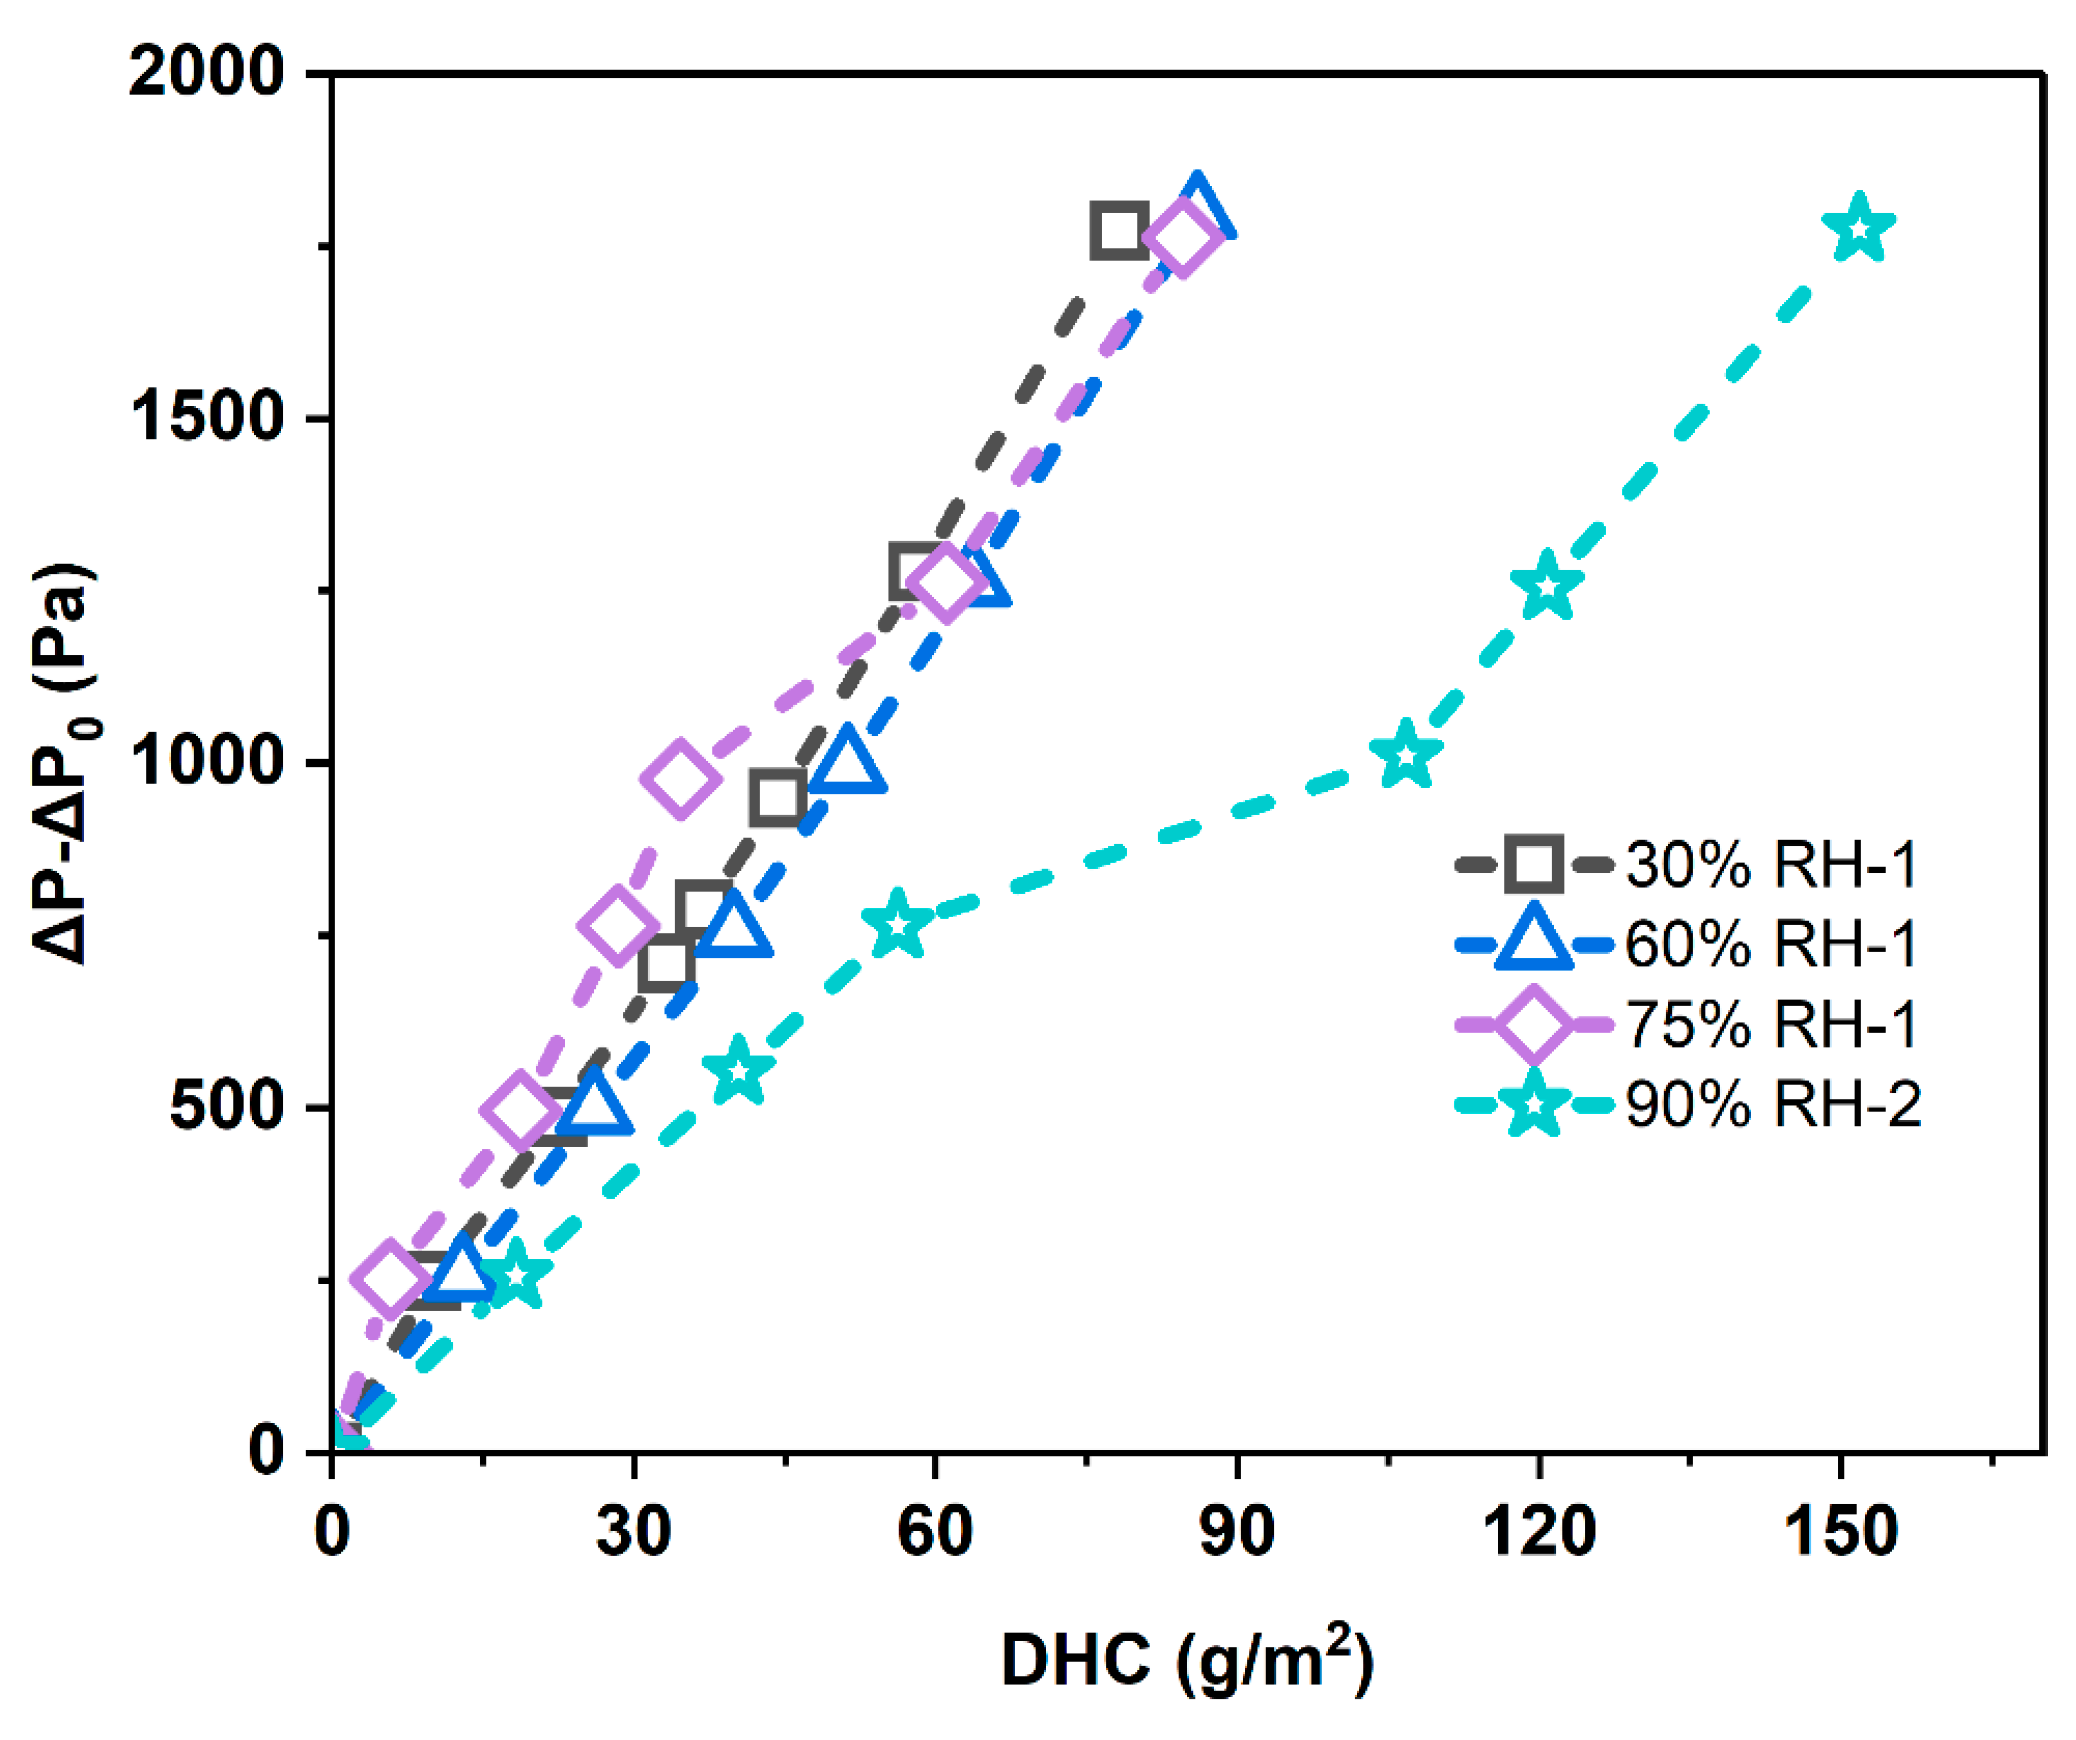
Figure 12 shows that the particles are deposited on the surface of the electrospun fiber composite filter material. Therefore, the increase of filter material weight during dust holding can be seen as the mass of the filter cake, while there is particle deposition inside the other two filter media. Therefore, the cake quality cannot be accurately determined, and as a result, the cake resistance coefficient cannot be accurately calculated. The below analysis is carried out based on the electrospun fiber composite filter material. See
Figure 13 for the cake resistance–dust-holding capacity curve. Based on Formula (4), the resistance curve under different humidity conditions is fitted to obtain the slope
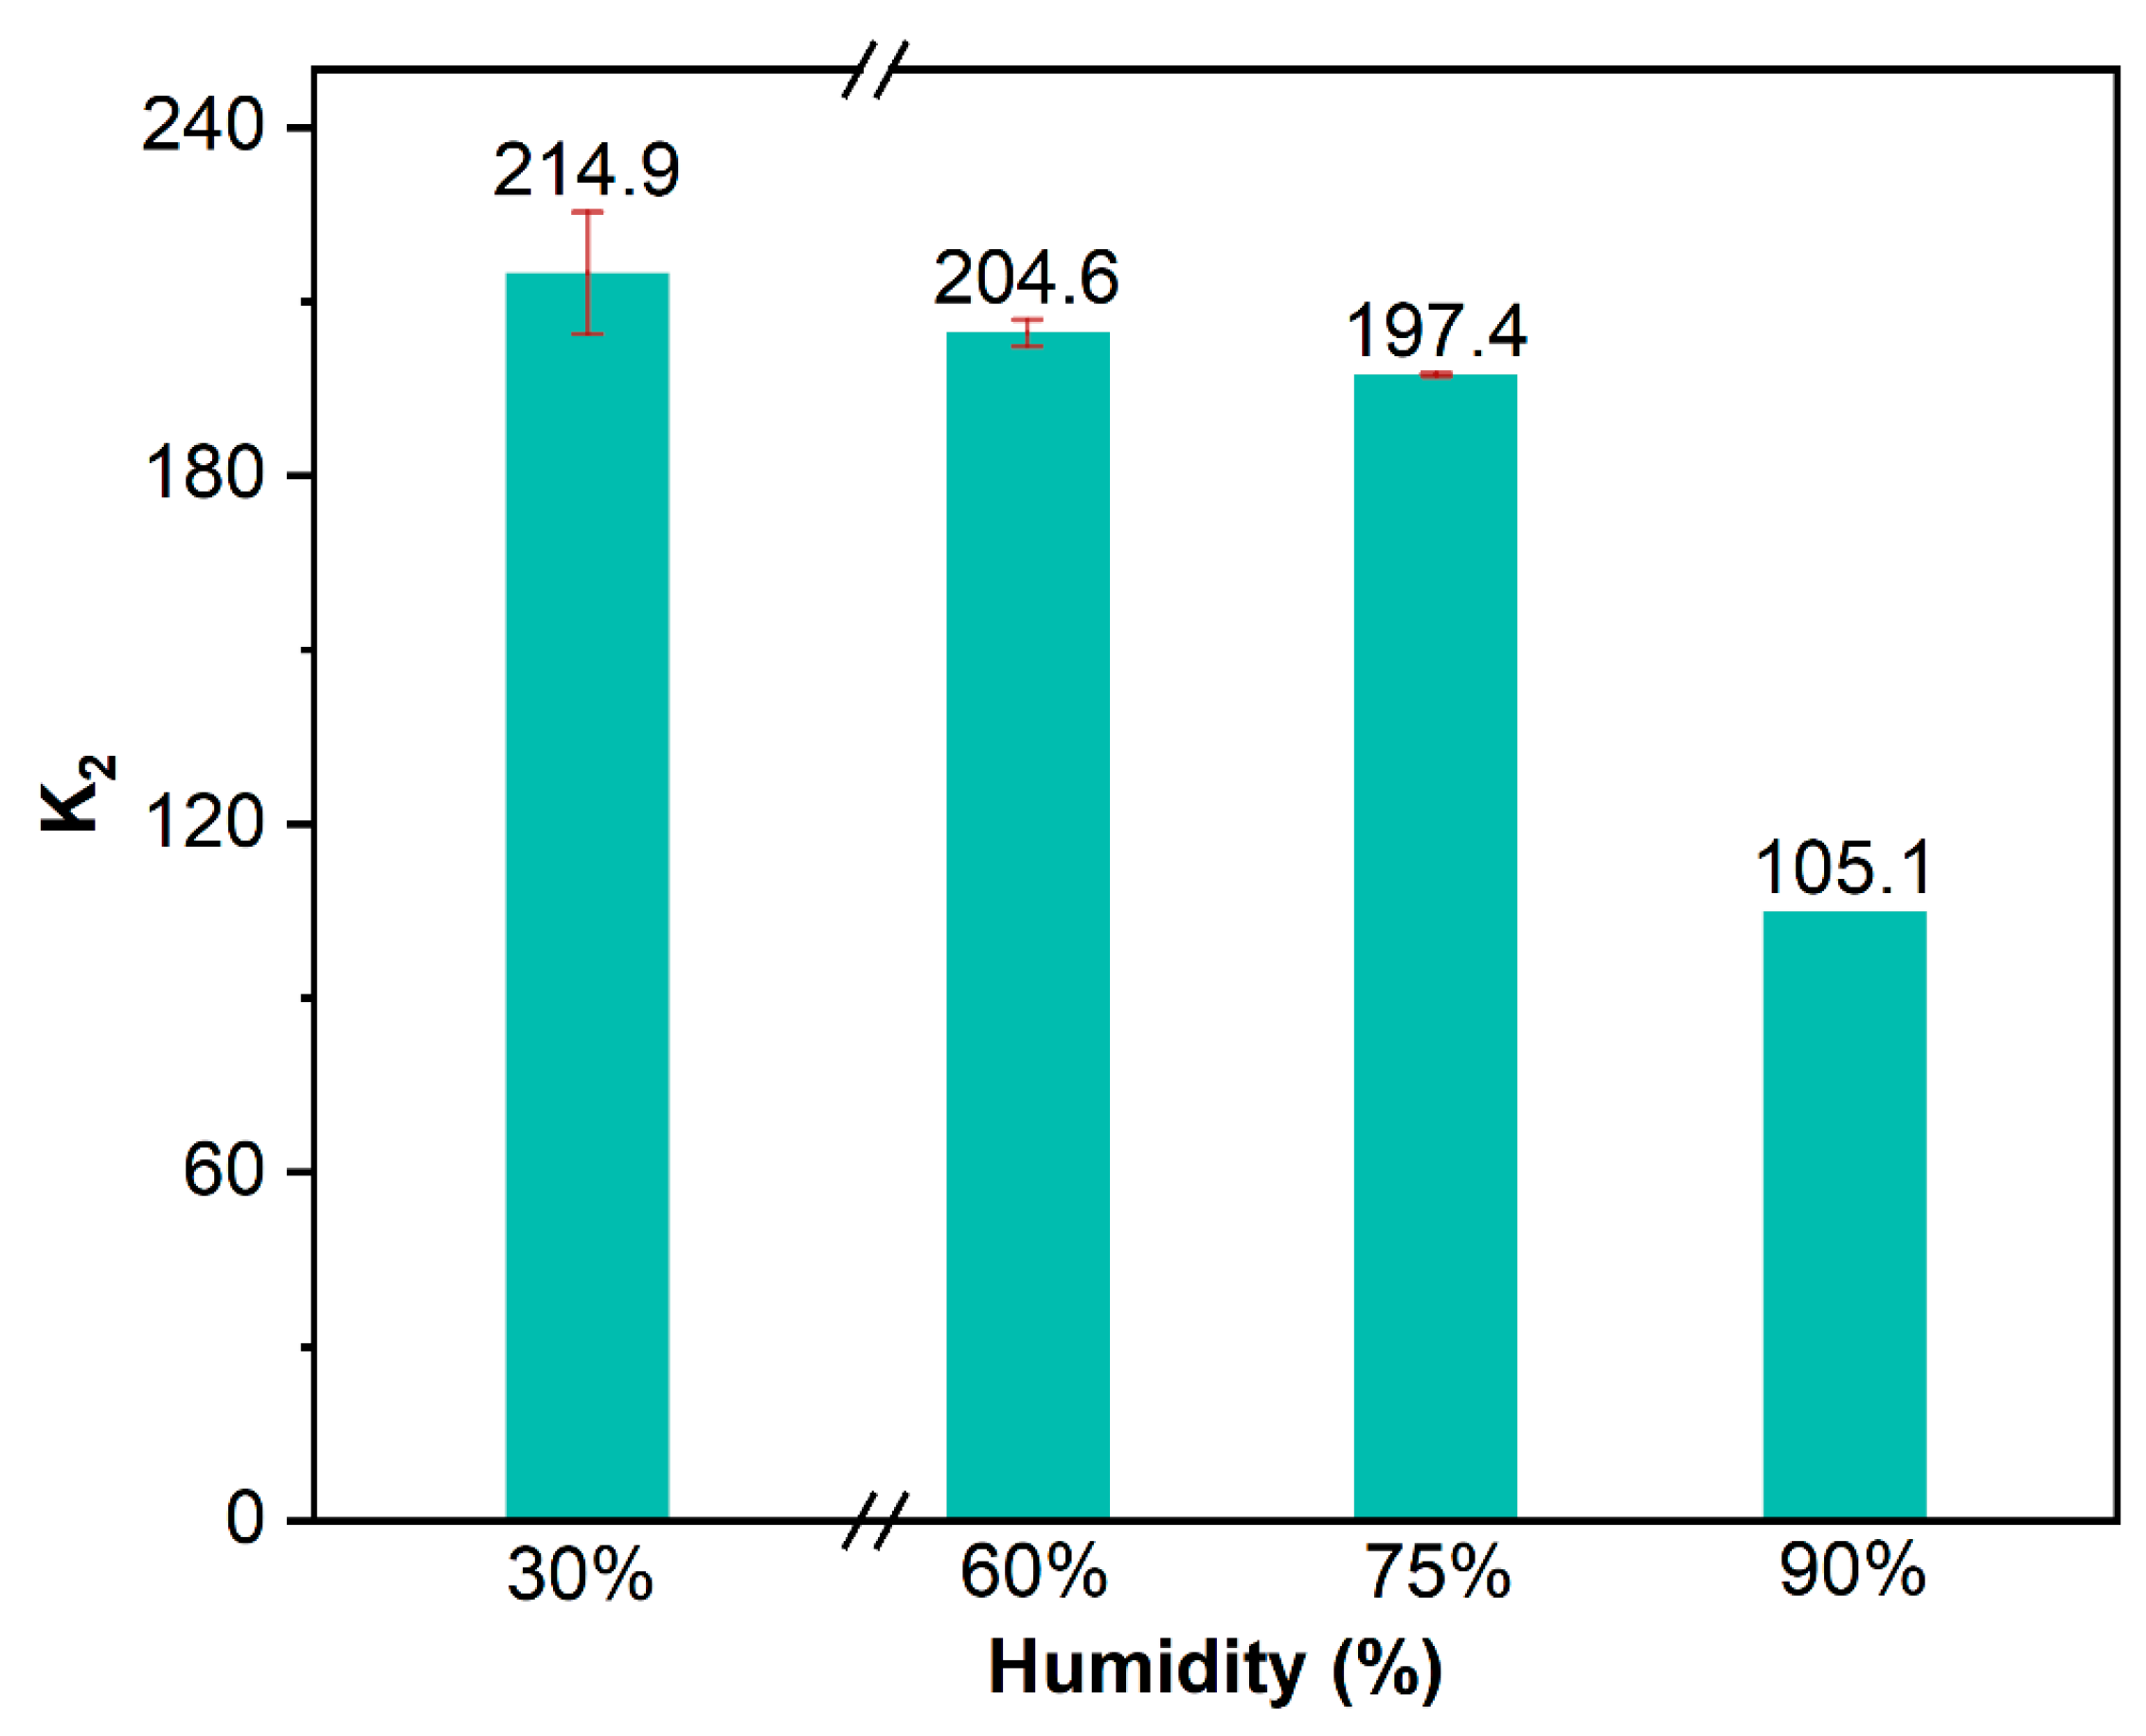
of the curve; the resistance coefficient of the filter cake. Under different humidity conditions, the analysis results of the cake resistance coefficient are shown in
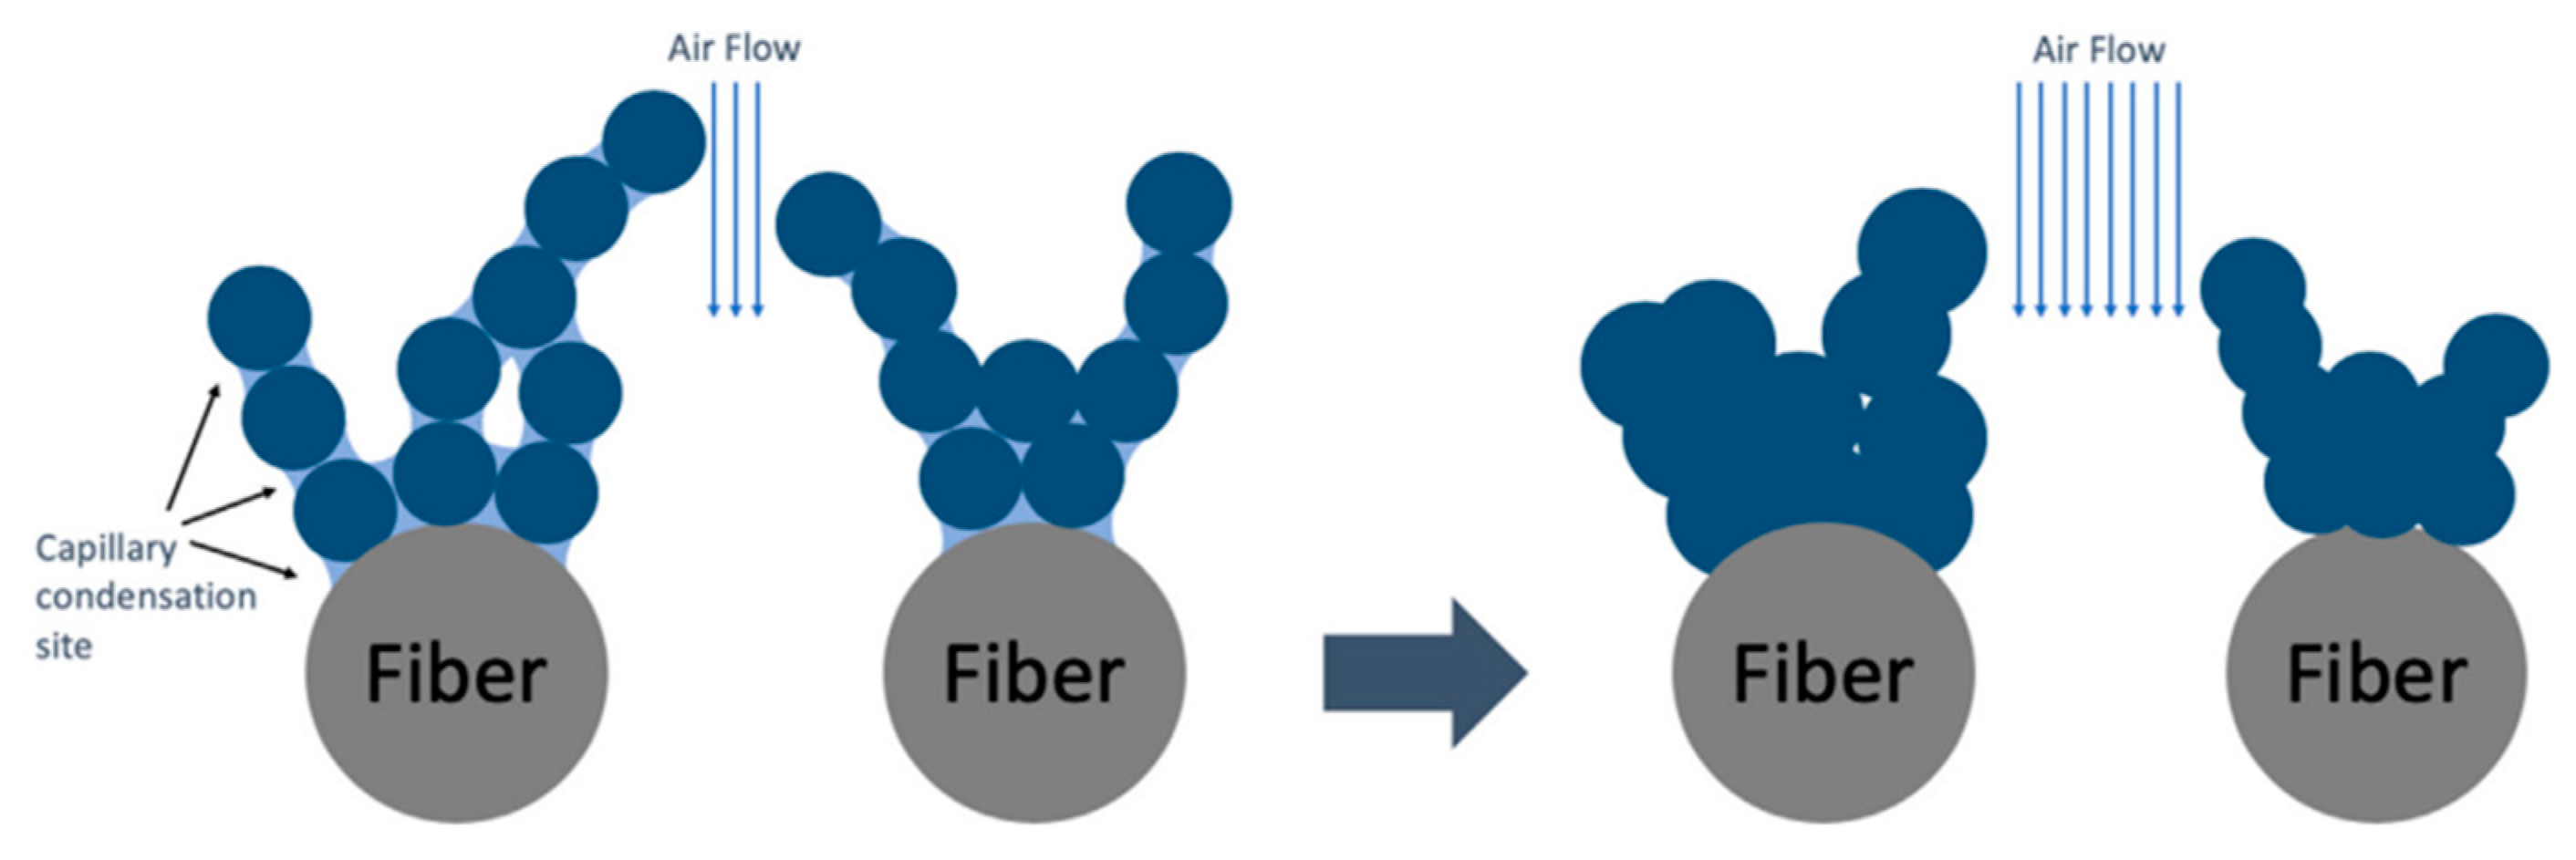
Figure 14. With the increase of relative humidity, water mist in the airflow increased and a filter cake formed after the particle surface absorbed the water vapor; the capillary pressure between the particles deposited particles on the surface of other particles rather than filling in the space between particles. Therefore, the cake structure is looser and the resistance coefficient of the filter cake is reduced [
19]. The space between particles is an ideal location for water vapor condensation and water vapor condensation between the particles would lead to necking down. With the increase of particle water absorption, the dendritic structure would shrink and produce a larger air passage (
Figure 15 [
21]), thus reducing the air resistance.
Through analyzing the morphology and thickness of the filter cake on the surface of the electrospun fiber composite filter material, the porosity of the filter cake can be calculated, with the calculation formula as below:
where
is the filter cake quality,
the true particle density and
the filter cake thickness. The topography of the filter cake under different humidity conditions is shown in
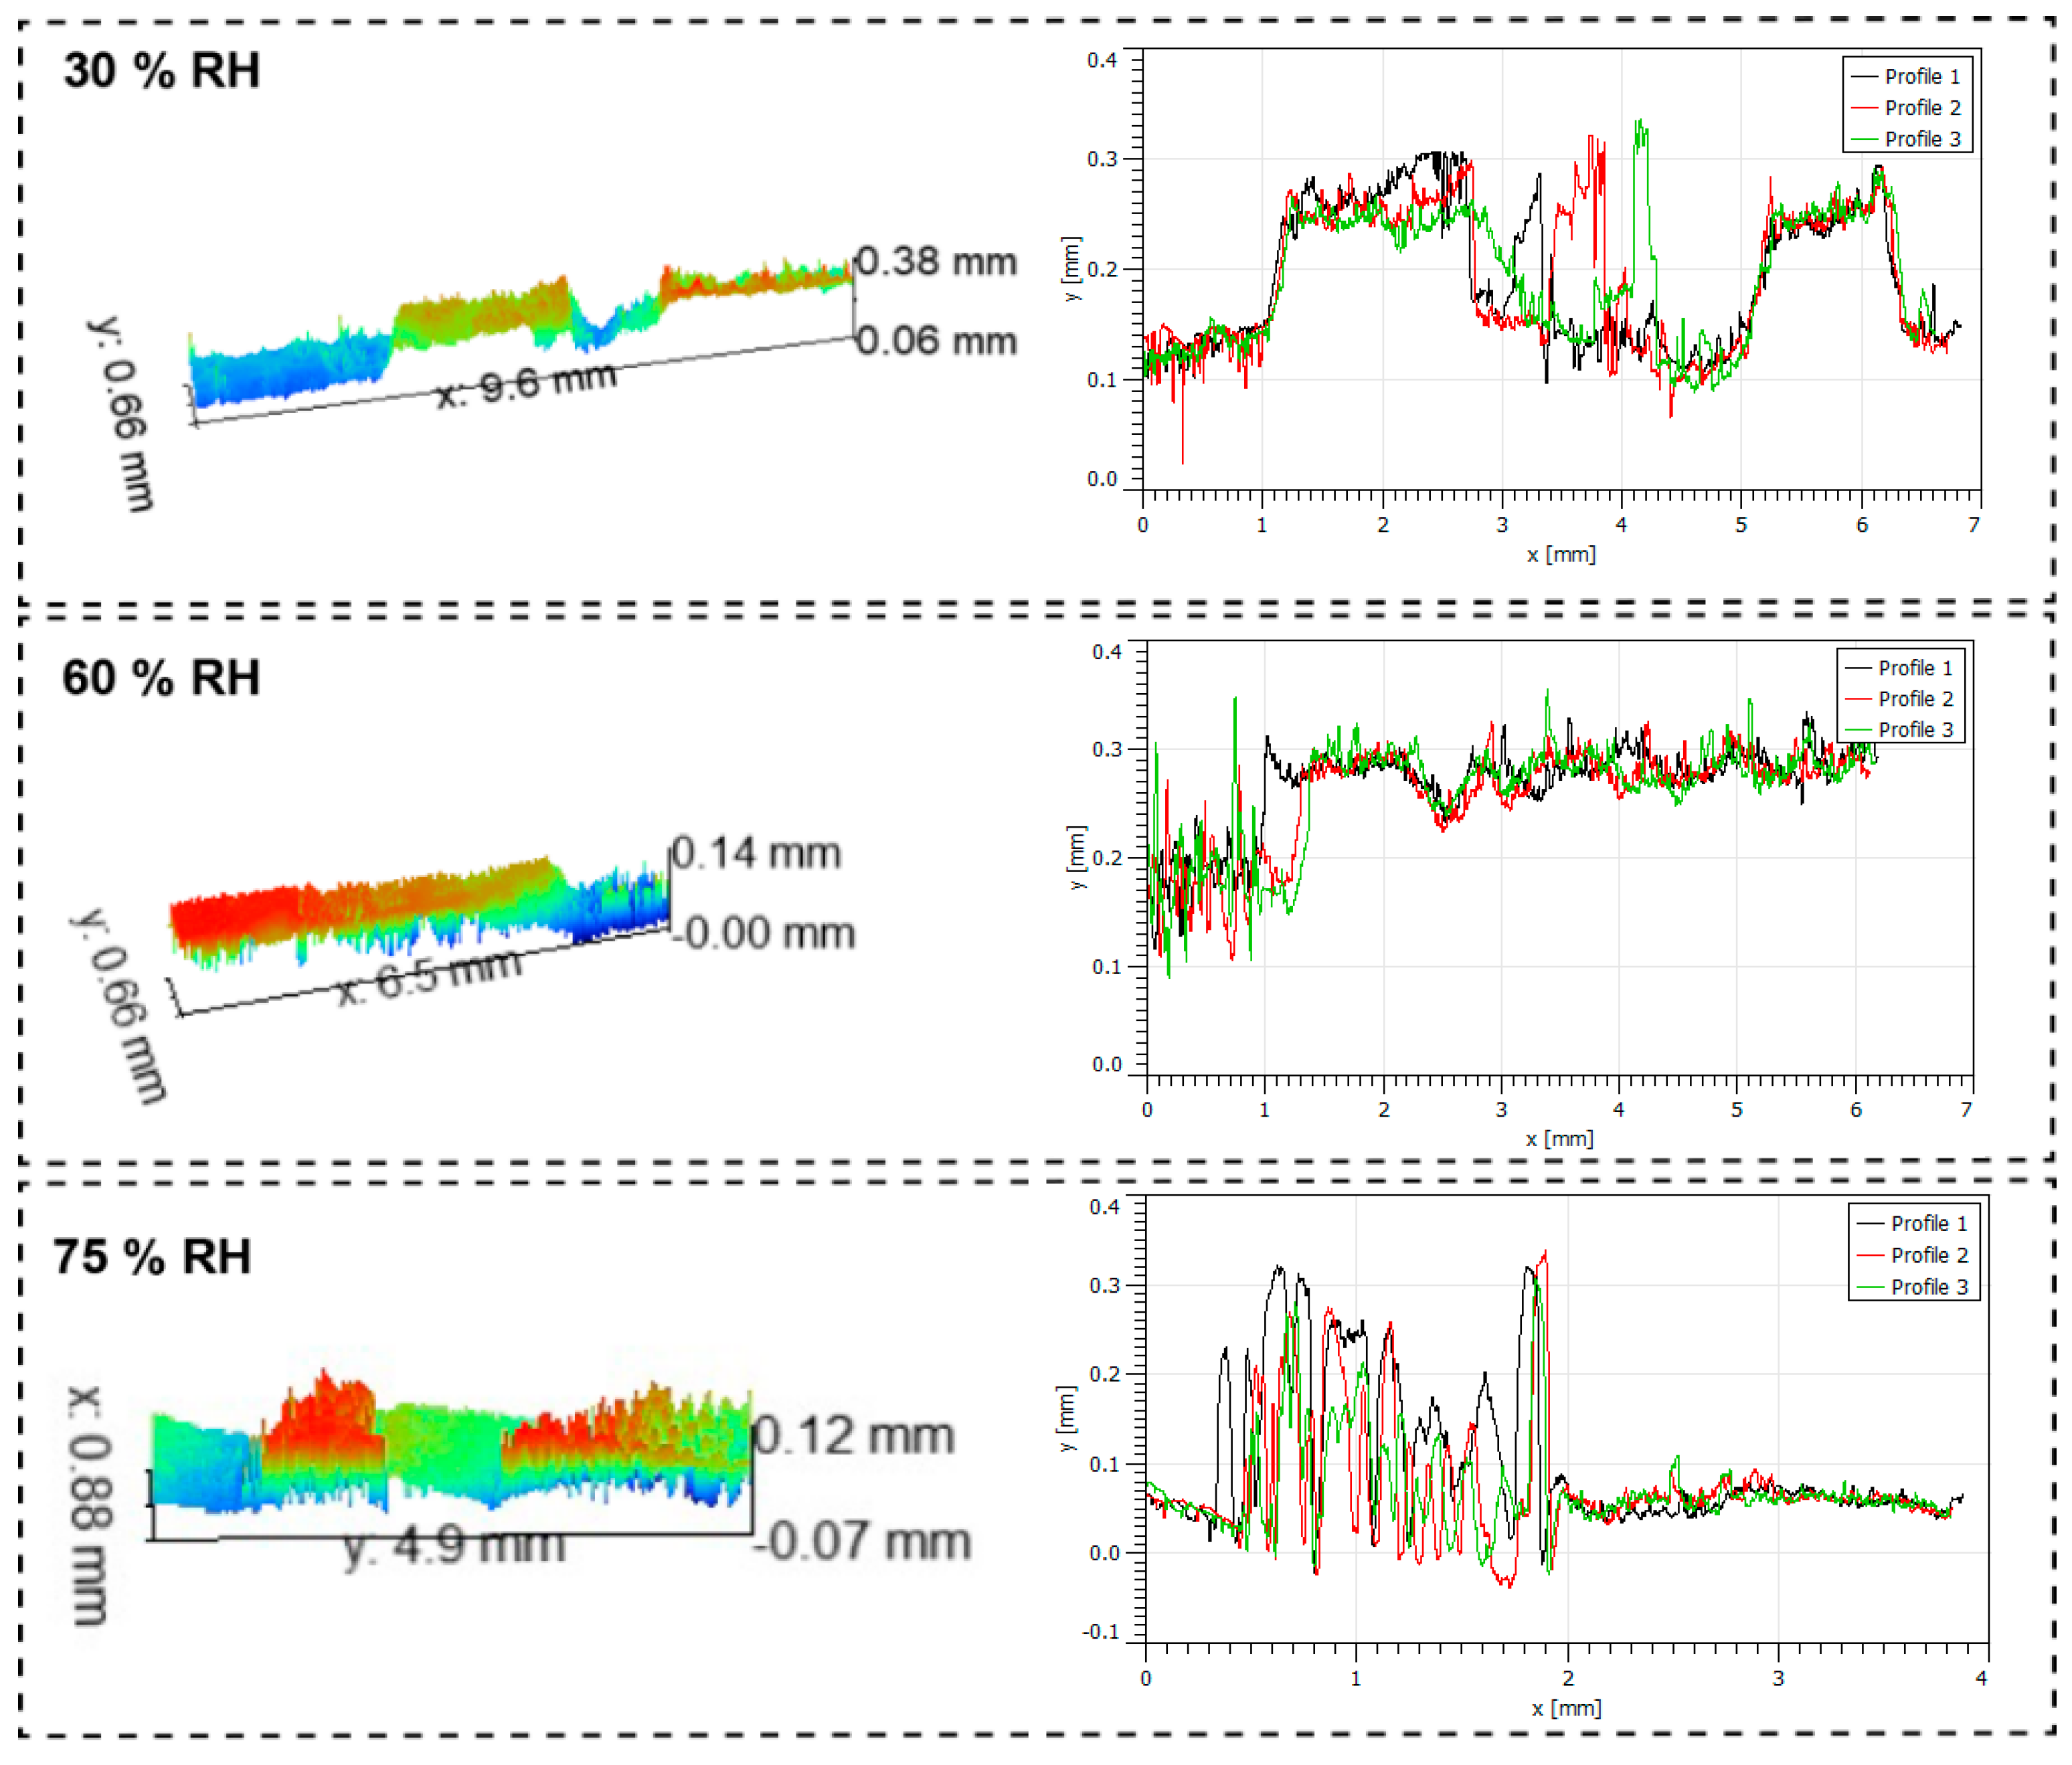
Figure 16. The 3D topography of the cake thickness is analyzed to obtain the average thickness.
Table 3 shows the specific information. With the increase of humidity, the cake porosity on the surface of the filter media also increased, which is consistent with the previous analysis results.
4. Conclusions
Three kinds of typical filter media applied for gas turbine air filtration with a similar efficiency were selected as the study objects. Their three-dimensional structure models are constructed using the Geodict software and the deposition behaviors of the particulate matters in the models are calculated. The results show that under the same conditions, larger particulate matters are mainly deposited on the surface of the filter media with a sandwich structure. The middle fiber layer consisting of fine fibers could capture the fine particles that pass through the surface layer so as to guarantee the filtration efficiency of the filter media. Dust particles were mainly deposited in the nanofiber layer of the electrospun fiber composite filter media and distributed throughout the entire thickness of the synthetic fiber single-layer structured filter media.
Under different loading conditions, the filter media with a sandwich structure had the longest service life and the electrospun fiber composite filter media had the shortest service life. With the increase of relative humidity, the increasing pressure drop rate of the three kinds of filter media decreased during the dust-holding process, especially during the cake filtration phase. The results showed that the cake porosity increased with the increase of relative humidity. When relative humidity is 30%, the cake porosity is 0.738; when relative humidity is 75%, porosity is 0.889. The relative humidity has a stronger influence on the sandwich-structured filter media.
Our results indicate that the relative humidity affects the dust-loading performance of filter media mainly during the cake filtration phase. The open structure in the inlet air layer contributes to the high dust-holding capacity of the filter media under the condition of high relative humidity. The influence of humidity on the structure and dust-holding performance of the filter media with a high content of cellulose fibers needs further study.
Author Contributions
Conceptualization, T.Z. and Z.F.; data curation, T.Z. and Z.F.; investigation, T.Z., Z.F. and H.Z.; methodology, T.Z. and Z.F.; supervision, Z.F.; validation, T.Z., Z.F. and H.Z.; writing—original draft, T.Z. All authors have read and agreed to the published version of the manuscript.
Funding
This research received no external funding.
Data Availability Statement
Data sharing not applicable. No new data were created or analyzed in this study. Data sharing is not applicable to this article.
Conflicts of Interest
The authors declare no conflict of interest.
References
- Kurz, R.; Brun, K. Degradation in gas turbine systems. J. Eng. Gas Turbines Power 2000, 123, 70–77. [Google Scholar] [CrossRef]
- Wilcox, M. Successful selection and operation of gas turbine inlet filtration systems. In Proceedings of the Fortieth Turbo Machinery Symposium, Huston, TX, USA, 12–15 September 2011; pp. 254–268. [Google Scholar]
- Hanachi, H.; Liu, J.; Banerjee, A.; Chen, Y. Effects of the intake air humidity on the gas turbine performance monitoring. In Proceedings of the ASME Turbo Expo 2015: GT2015-43026, Montréal, QC, Canada, 15–19 June 2015. [Google Scholar]
- Brekke, O. Performance deterioration of intake air filters for gas turbines in offshore Installations. In Proceedings of the ASME Turbo Expo, Glasgow, UK, 14–18 June 2010; pp. 1–10. [Google Scholar]
- Wilcox, M.; Baldwin, R.; Garcia-Hernandez, A.; Brun, K. Guideline for Gas Turbine Inlet Air Filtration System; Gas Machinery Research Council Southwest Research Institute: Dallas, TX, USA, 2010; p. 4. [Google Scholar]
- Madsen, S.; Watvedt, J. Gas turbine fouling offshore; air intake filtration optimization. In Proceedings of the ASME Turbo Expo 2018: GT2018-75613, Oslo, Norway, 11–15 June 2018. [Google Scholar]
- Chen, Z.; Bao, B.; Zhu, W.; Lin, Z. Effect of Test Dust on Performance Test for a Pleated Filter Cartridge. Aerosol Air Qual. Res. 2015, 15, 2436–2444. [Google Scholar] [CrossRef]
- Cravero, C.; De Domenico, D.; Leutcha, P.J.; Marsano, D. Strategies for the Numerical Modelling of Regenerative Pre-heating Systems for Recycled Glass Raw Material. Math. Model. Eng. Probl. 2019, 6, 324–332. [Google Scholar] [CrossRef]
- Pan, Z.; Zhang, X.; Sun, Z.; Jiang, F.; Lin, L.; Liang, Y.; Tang, M.; Wang, J. High fidelity simulation of ultrafine PM filtration by multiscale fibrous media characterized by a combination of X-ray CT and FIB-SEM. J. Membr. Sci. 2020, 620, 118925. [Google Scholar] [CrossRef]
- Pan, Z.; Liang, Y.; Tang, M.; Sun, Z.; Hu, J.; Wang, J. Simulation of performance of fibrous filter media composed of cellulose and synthetic fibers. Cellulose 2019, 26, 7051–7065. [Google Scholar] [CrossRef]
- Zhou, B.; Xu, Y.; Fan, J.Q.; Chen, L.P.; Li, F.; Xue, K. Numerical Simulation and Experimental Validation for the Filtration Performance of Fibrous Air Filter Media with LB Method. Aerosol Air Qual. 2017, 17, 2645–2658. [Google Scholar] [CrossRef]
- Cheng, Y.-H.; Tsai, C.-J. Factors influencing pressure drop through a dust cake during filtration. Aerosol Sci. Technol. 1998, 29, 315–328. [Google Scholar] [CrossRef]
- Graef, A.; Stenhouse, J.I.T.; Walsh, D.C. The effect of solid aerosol on prefilter material performance. J. Aerosol Sci. 1995, 26, S741–S742. [Google Scholar] [CrossRef]
- Jabri, W.; Vroman, P.; Perwuelz, A. Study of the influence of synthetic filter media compressive behavior on its dust holding capacity. Sep. Purif. Technol. 2015, 156, 92–102. [Google Scholar] [CrossRef]
- Jeon, K.-J.; Jung, Y.-W. A simulation study on the compression behavior of dust cakes. Powder Technol. 2004, 141, 1–11. [Google Scholar] [CrossRef]
- Chen, S.C.; Wang, J.; Fissan, H.; Pui, D.Y. Optimizing filtration experiments for length and fractal dimension characterization of non-spherical particles. Aerosol Sci. Technol. 2015, 49, 547–605. [Google Scholar] [CrossRef]
- Gupta, A.; Novick, V.J.; Biswas, P.; Monson, P.R. Effect of Humidity and Particle Hygroscopicity on the Mass Loading Capacity of High Efficiency Particulate Air (HEPA) Filters. Aerosol Sci. Technol. 1993, 19, 94–107. [Google Scholar] [CrossRef]
- Miguel, A. Effect of air humidity on the evolution of permeability and performance of a fibrous filter during loading with hygroscopic and non-hygroscopic particles. J. Aerosol Sci. 2003, 34, 783–799. [Google Scholar] [CrossRef]
- He, X.; Brem, B.T.; Bahk, Y.K.; Kuo, Y.-Y.; Wang, J. Effects of relative humidity and particle type on the performance and service life of automobile cabin air filters. Aerosol Sci. Technol. 2016, 50, 542–604. [Google Scholar] [CrossRef]
- ISO 16890-2016; Air Filters for General Ventilation. International Standardization Organization: Geneva, Switzerland, 2016.
- Pei, C.; Ou, Q.; Pui, D.Y.H. Effect of relative humidity on loading characteristics of cellulose filter media by submicrometer potassium chloride, ammonium sulfate, and ammonium nitrate particles. Sep. Purif. Technol. 2019, 212, 75–83. [Google Scholar] [CrossRef]
Figure 1.
The schematic setup of testing system of dust-loading system with controlled humidity.
Figure 1.
The schematic setup of testing system of dust-loading system with controlled humidity.
Figure 2.
Fiber composite filter material: (a) inflow surface of electrospun media, (b) outflow surface, (c) cross-section, (d) inflow surface of total synthetic fiber single-layer filter material, (e) outflow surface, (f) cross-section and (g) inflow surface of filter media with sandwich structure, (h) outflow surface and (i) cross-section SEM image.
Figure 3.
Pore size diameter of three filter media.
Figure 3.
Pore size diameter of three filter media.
Figure 4.
Air permeability of three filter media.
Figure 4.
Air permeability of three filter media.
Figure 5.
Surface contact angle of three filter media.
Figure 5.
Surface contact angle of three filter media.
Figure 6.
Initial filter efficiency of three filter media: (a) filtration efficiency and pressure drop, (b) quality factor.
Figure 6.
Initial filter efficiency of three filter media: (a) filtration efficiency and pressure drop, (b) quality factor.
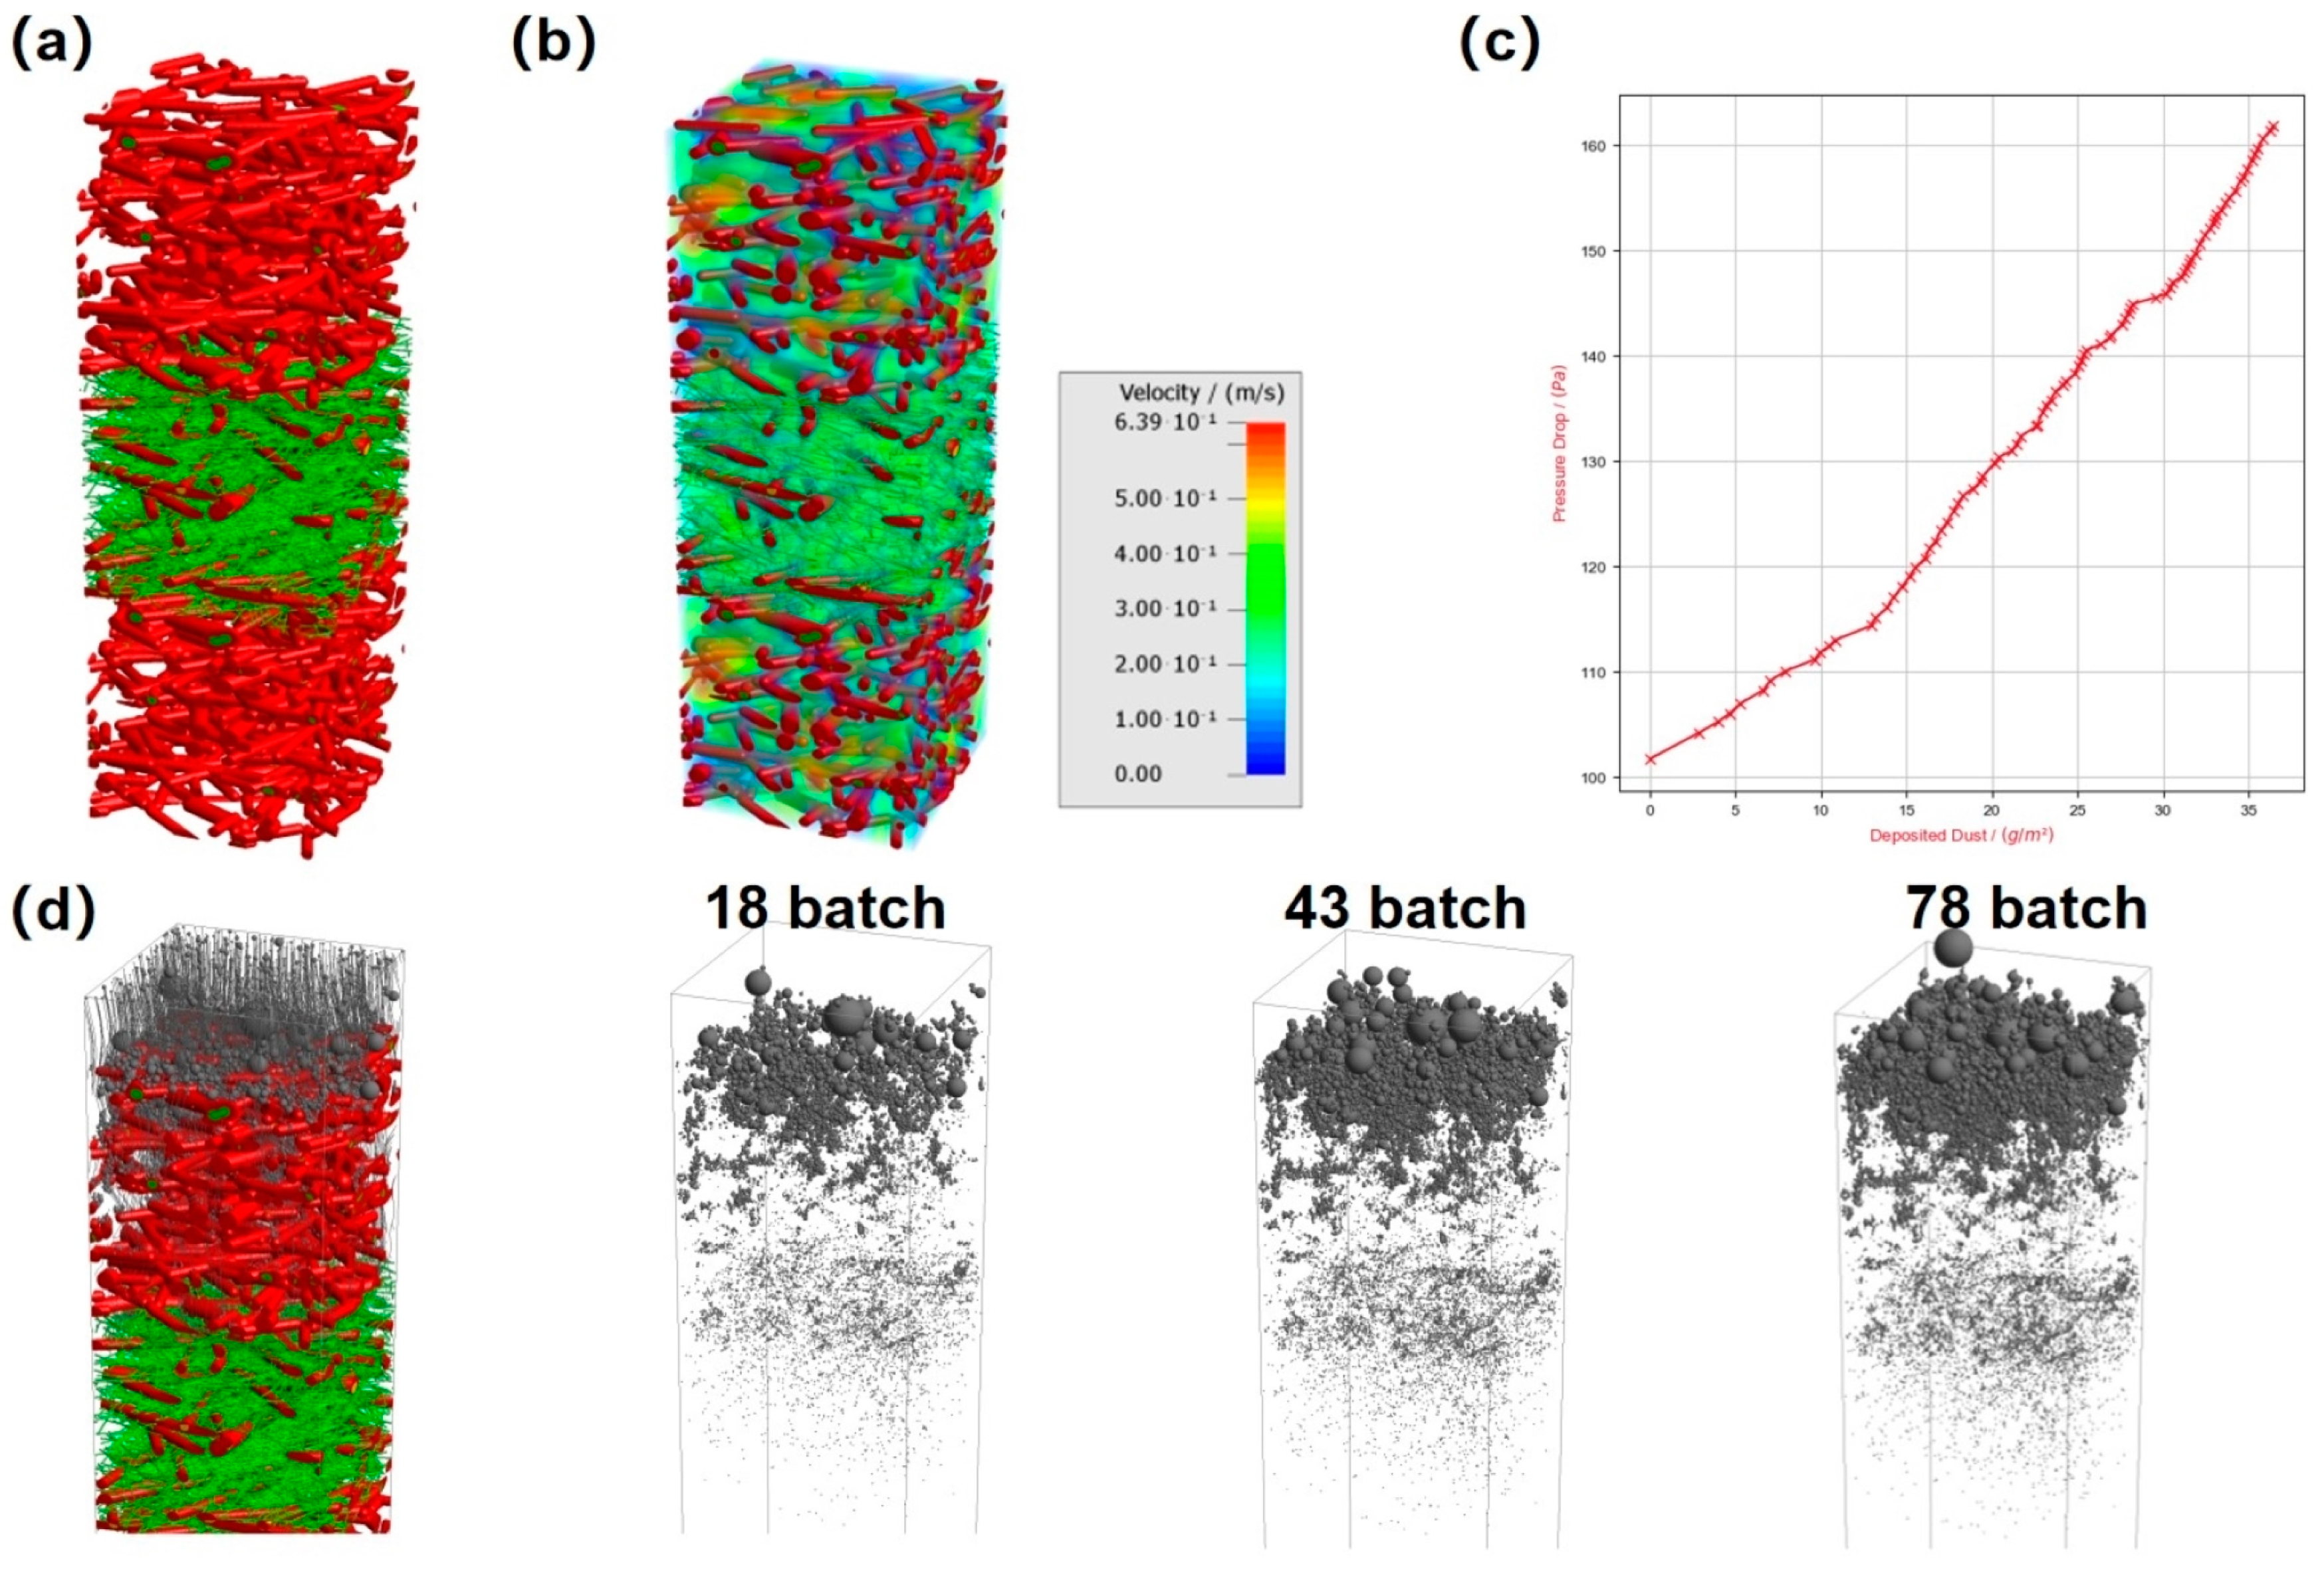
Figure 7.
Electrospun fiber composite filter material: (a) model; (b) flow field distribution; (c) calculation result of dust-holding pressure difference and (d) deposition track of loading different amounts of A2 dust in filter media.
Figure 7.
Electrospun fiber composite filter material: (a) model; (b) flow field distribution; (c) calculation result of dust-holding pressure difference and (d) deposition track of loading different amounts of A2 dust in filter media.
Figure 8.
Synthetic fiber single filter material: (a) model; (b) flow field distribution; (c) calculation result of dust-holding pressure difference; (d) deposition track of loading different amounts of A2 dust in the filter material.
Figure 8.
Synthetic fiber single filter material: (a) model; (b) flow field distribution; (c) calculation result of dust-holding pressure difference; (d) deposition track of loading different amounts of A2 dust in the filter material.
Figure 9.
Filter material with sandwich structure: (a) model; (b) flow field distribution; (c) calculation result of dust-holding pressure difference; (d) deposition track of loading different amounts of A2 dust in the filter material.
Figure 9.
Filter material with sandwich structure: (a) model; (b) flow field distribution; (c) calculation result of dust-holding pressure difference; (d) deposition track of loading different amounts of A2 dust in the filter material.
Figure 10.
Dust-holding–resistance curves of three filter media: (a) electrospun fiber composite filter material, (b) synthetic fiber single-layer filter material, (c) filter media with sandwich structure under different humidity conditions.
Figure 10.
Dust-holding–resistance curves of three filter media: (a) electrospun fiber composite filter material, (b) synthetic fiber single-layer filter material, (c) filter media with sandwich structure under different humidity conditions.
Figure 11.
Resistance–time curves of three filter media: (a) electrospun fiber composite filter material; (b) synthetic fiber single-layer filter material; (c) filter media with sandwich structure under different humidity conditions; (d) An example of the analyzation method of pressure drop curves.
Figure 11.
Resistance–time curves of three filter media: (a) electrospun fiber composite filter material; (b) synthetic fiber single-layer filter material; (c) filter media with sandwich structure under different humidity conditions; (d) An example of the analyzation method of pressure drop curves.
Figure 12.
SEM images of particle distribution: (a) electrospun fiber composite filter material; (b) synthetic fiber single-layer filter material; (c) filter material with sandwich structure after dust holding.
Figure 12.
SEM images of particle distribution: (a) electrospun fiber composite filter material; (b) synthetic fiber single-layer filter material; (c) filter material with sandwich structure after dust holding.
Figure 13.
Resistance–dust-holding capacity curve of electrospun fiber composite filter material cake.
Figure 13.
Resistance–dust-holding capacity curve of electrospun fiber composite filter material cake.
Figure 14.
Cake resistance coefficient under different humidity conditions.
Figure 14.
Cake resistance coefficient under different humidity conditions.
Figure 15.
Dendritic structure reconstitution caused by water vapor condensation [
17].
Figure 15.
Dendritic structure reconstitution caused by water vapor condensation [
17].
Figure 16.
3D morphology and thickness analysis of filter cake under different humidity conditions.
Figure 16.
3D morphology and thickness analysis of filter cake under different humidity conditions.
Table 1.
The basic properties of the three kinds of filter media in this study.
Table 1.
The basic properties of the three kinds of filter media in this study.
| Sample | Structure | Fibers in the Filter Media | Supplier |
|---|
| Electrospun | Dual layer | The substrate layer consists of cellulose and polyethylene terephthalate fibers | Fibr Way, Guangzhou, China |
| Synthetic | Single layer | Glass fibers and the polyethylene terephthalate | Ahlstrom, Helsinki, Finland |
| Melt-blown | Sandwich | The polypropylene fibers distribute in the top part, the polyethylene terephthalate fibers distribute in the bottom part of the filter media and glass fibers and the polyethylene terephthalate fibers distribute in the middle part of the filter media | Ahlstrom, Helsinki, Finland |
Table 2.
Analysis results of increasing resistance rate of three filter media under different humidity conditions.
Table 2.
Analysis results of increasing resistance rate of three filter media under different humidity conditions.
| Samples | Kd | Kcake | Clogging Point(s) |
|---|
| 5003-30-1 | -- | 2.62 | -- |
| 5003-30-2 | | 2.77 | |
| 5003-60-1 | | 2.06 | |
| 5003-60-2 | | 1.95 | |
| 5003-75-1 | -- | 1.60 | -- |
| 5003-75-2 | -- | 1.52 | -- |
| 5242-30-1 | 3.93 | -- | -- |
| 5242-30-2 | 3.52 | -- | -- |
| 5242-60-1 | 2.71 | -- | -- |
| 5242-60-2 | 2.97 | -- | -- |
| 5242-75-1 | 2.59 | 1.56 | 197 |
| 5242-75-2 | 2.29 | 1.58 | 239 |
| 9008-30-1 | 1.3 | 2.92 | 298 |
| 9008-60-1 | 1.38 | 2.99 | 260 |
| 9008-60-2 | 1.5 | 2.92 | 466 |
| 9008-75-1 | 1.14 | 1.97 | 635 |
| 9008-75-2 | 1.17 | 1.65 | 675 |
Table 3.
Performance parameters of filter cake under different humidity conditions.
Table 3.
Performance parameters of filter cake under different humidity conditions.
| Relative Humidity (%) | Filter Cake Quality (g) | Filter Cake Thickness (m) | Particle Density (g/cm3) | Effective Filtering Area (m2) | Filter Cake Porosity |
|---|
| 30 | 0.823 | 0.000121 | 2.6 | 0.01 | 0.738 |
| 60 | 0.862 | 0.000138 | 2.6 | 0.01 | 0.760 |
| 75 | 0.847 | 0.000292 | 2.6 | 0.01 | 0.889 |
| Disclaimer/Publisher’s Note: The statements, opinions and data contained in all publications are solely those of the individual author(s) and contributor(s) and not of MDPI and/or the editor(s). MDPI and/or the editor(s) disclaim responsibility for any injury to people or property resulting from any ideas, methods, instructions or products referred to in the content. |
© 2023 by the authors. Licensee MDPI, Basel, Switzerland. This article is an open access article distributed under the terms and conditions of the Creative Commons Attribution (CC BY) license (https://creativecommons.org/licenses/by/4.0/).


