
Impact of Static Air-Gap Eccentricity Fault on Synchronous Generator Efficiency

Abstract
:1. Introduction
- (1)
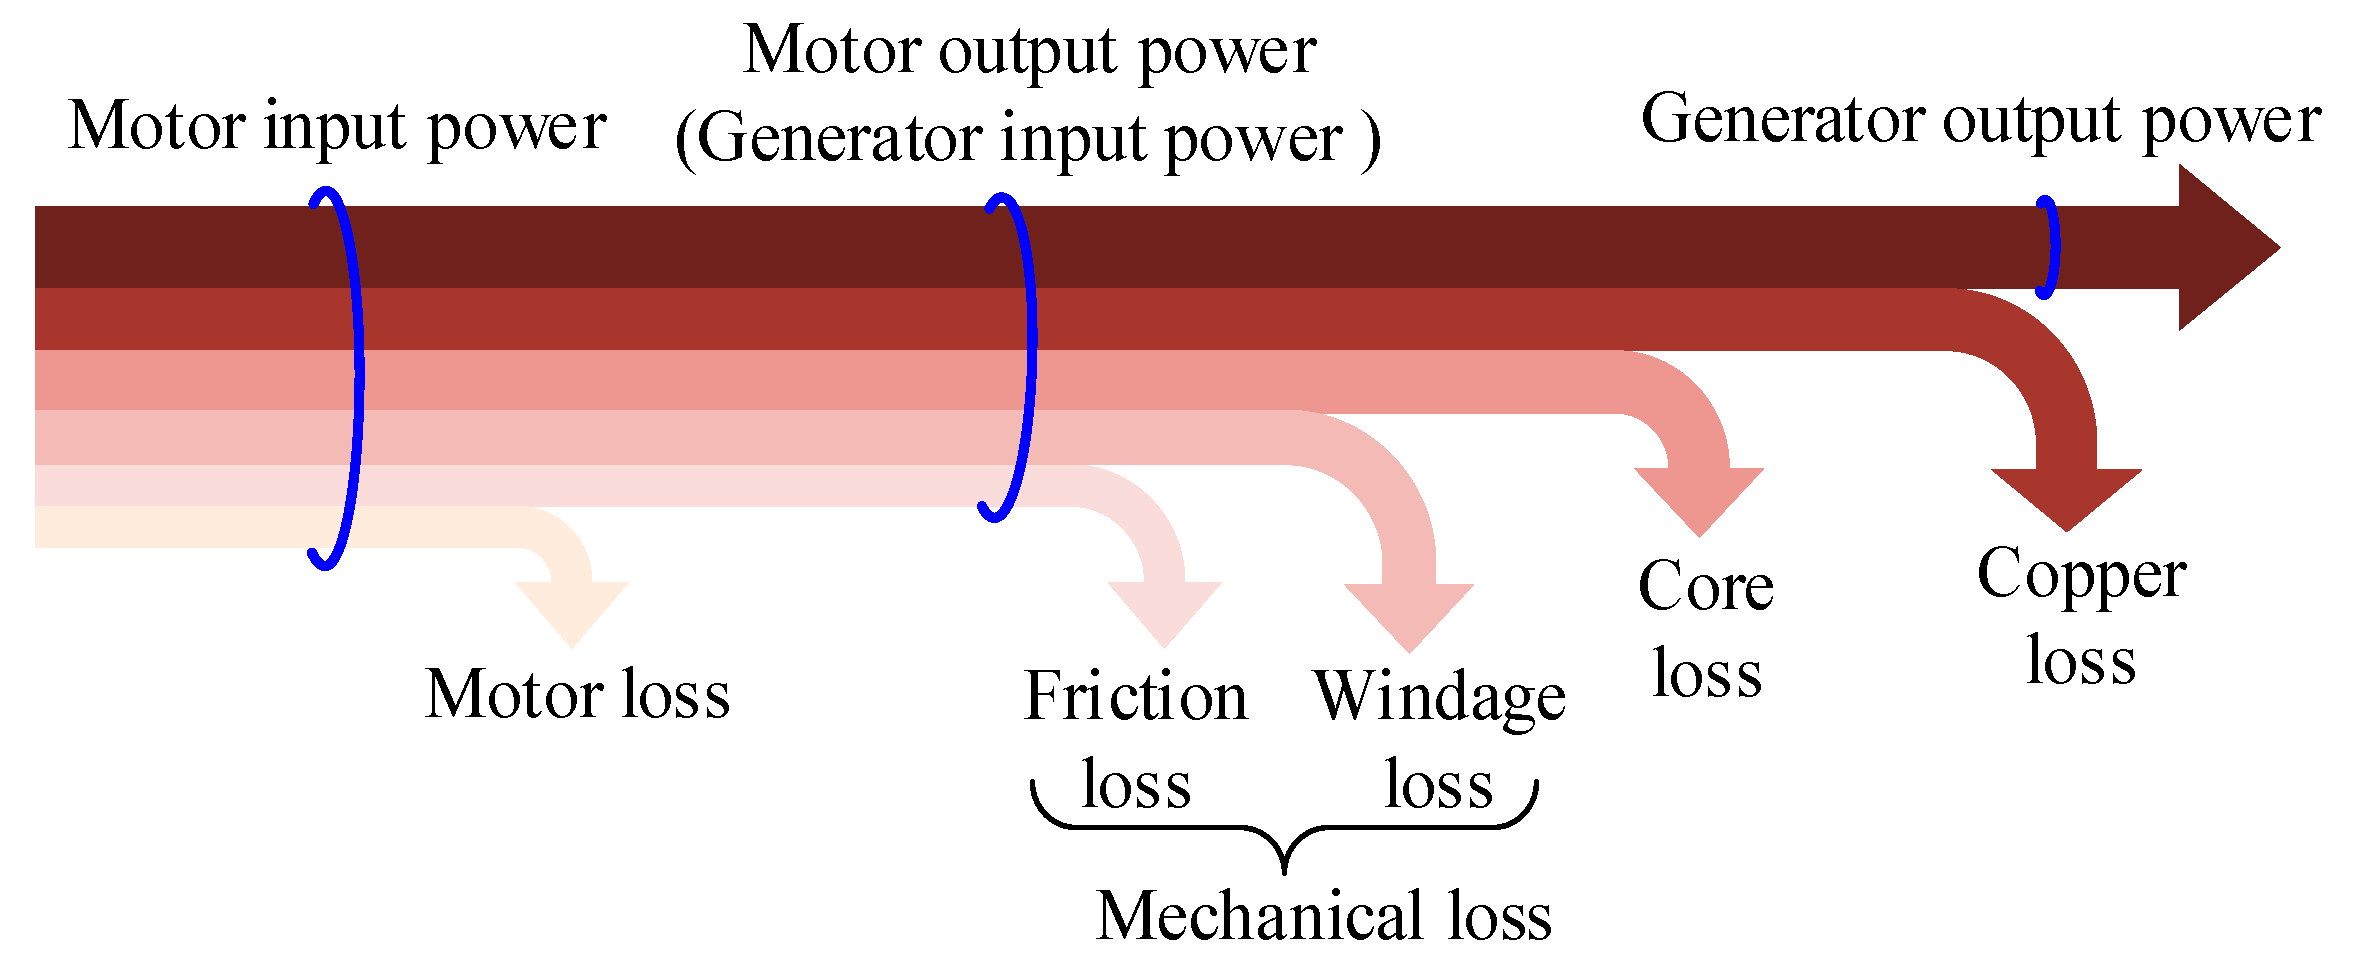
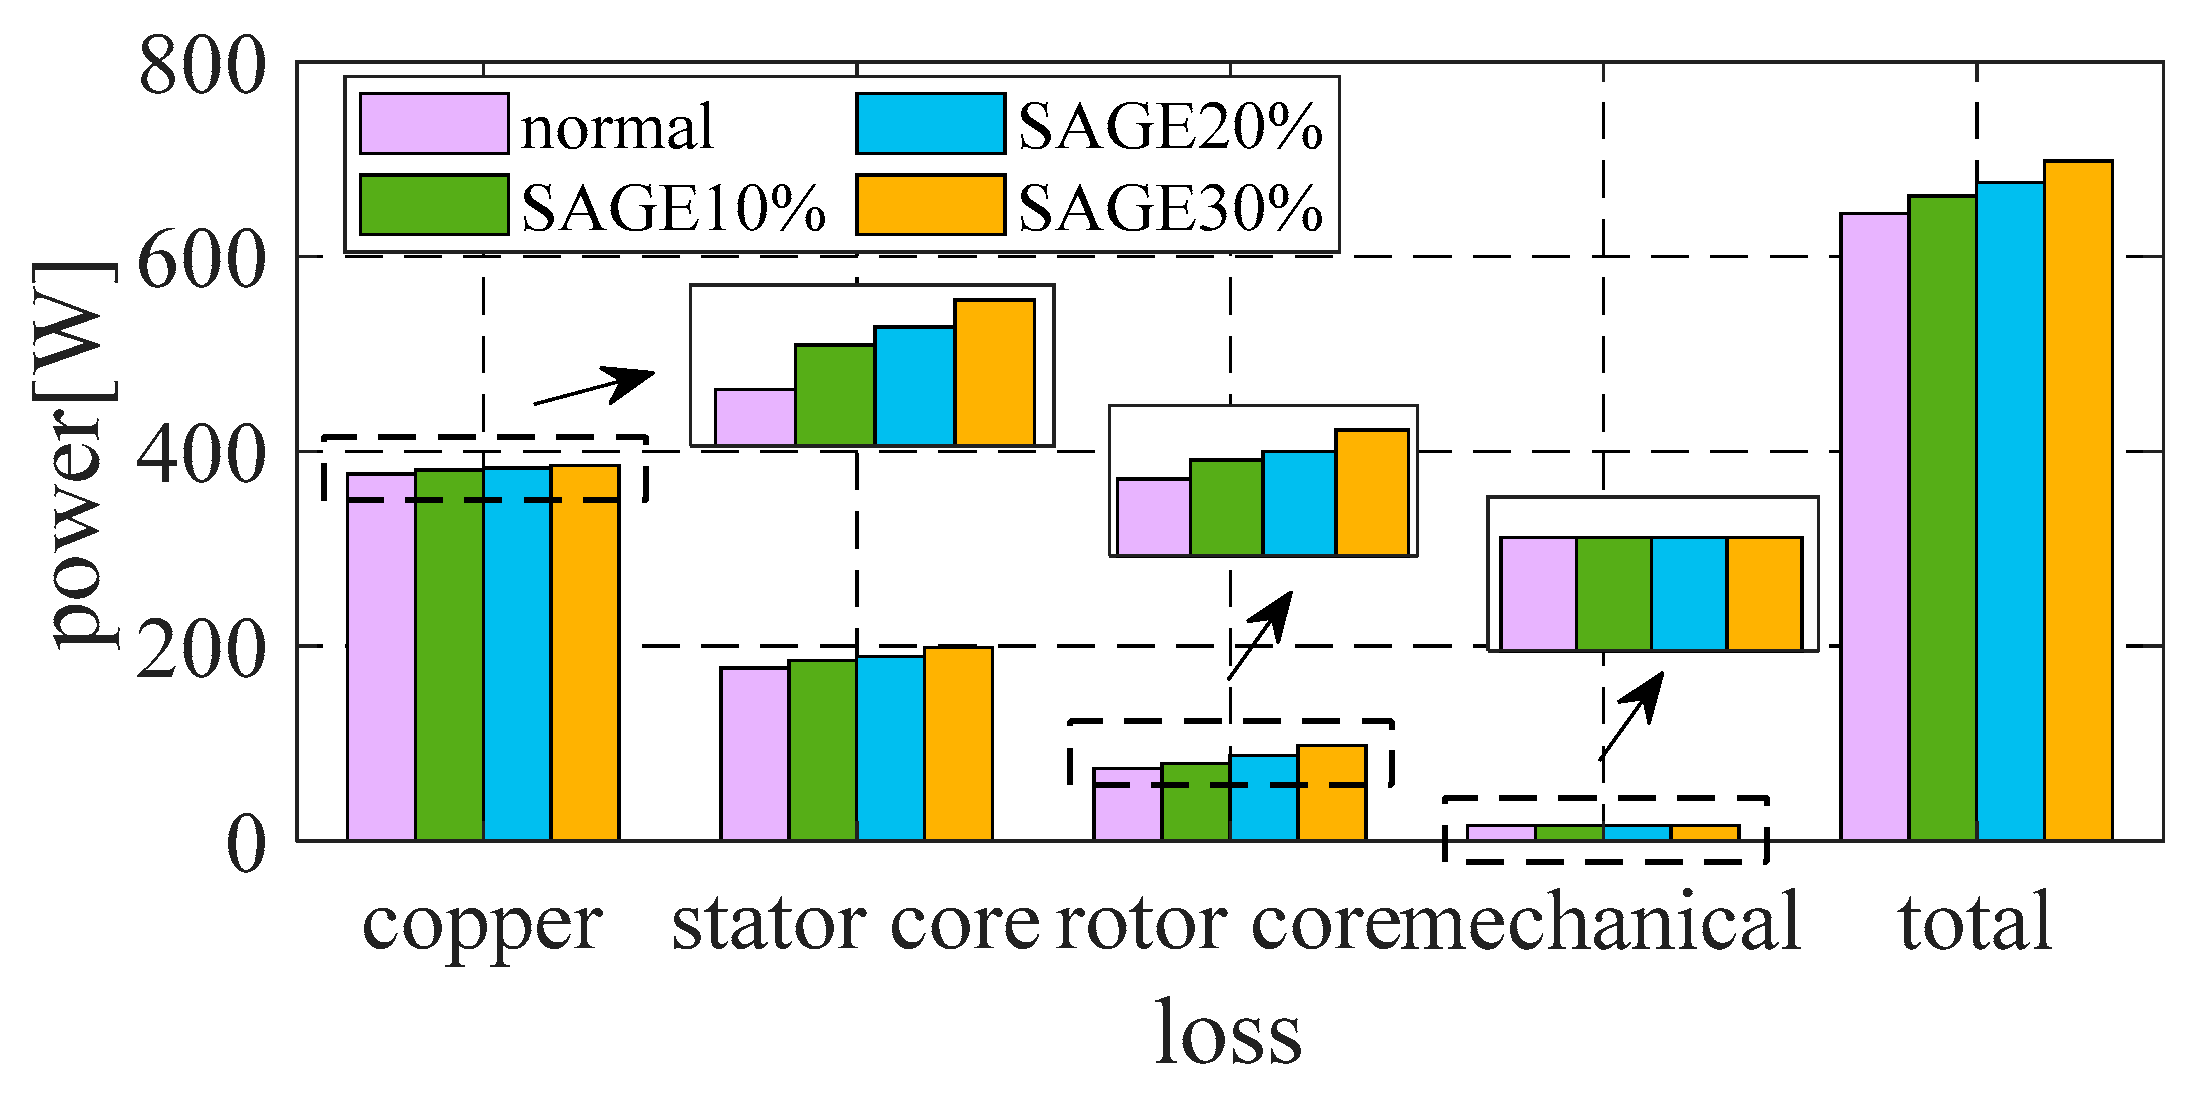
- The losses in the generator, including copper loss, core loss, and mechanical loss, are analyzed in detail, and the expressions of all losses are derived. Further, the efficiency model is proposed according to the loss and the output of the synchronous generator;
- (2)
- Unlike previous studies, which mainly focuses on normal condition, this paper not only focuses on various generator loss under the SAGE conditions but also investigates the generator efficiency variation regularities as the SAGE intensifies.
2. Theory Analysis
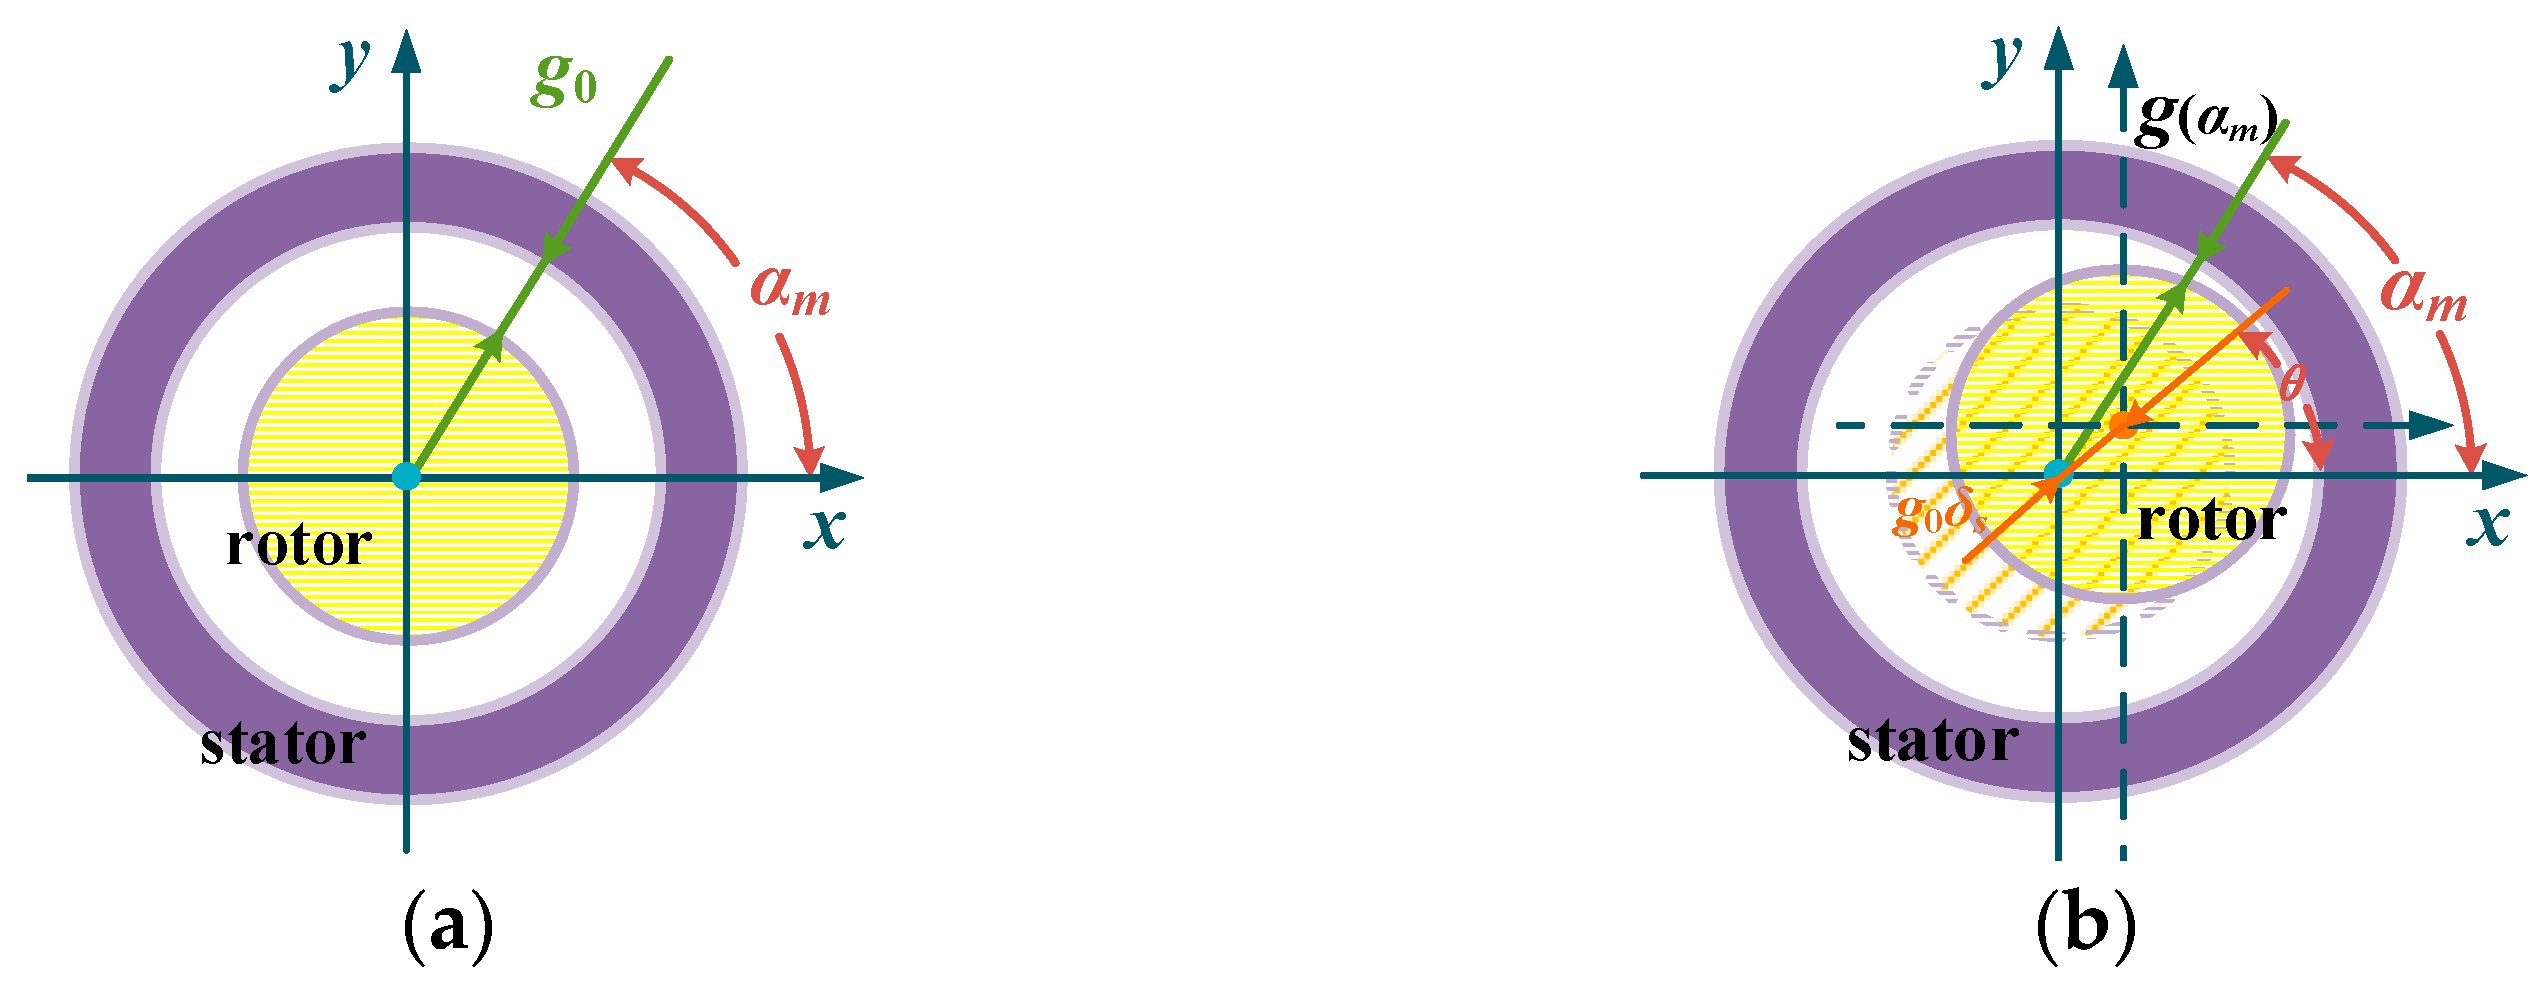
2.1. The MFD Model
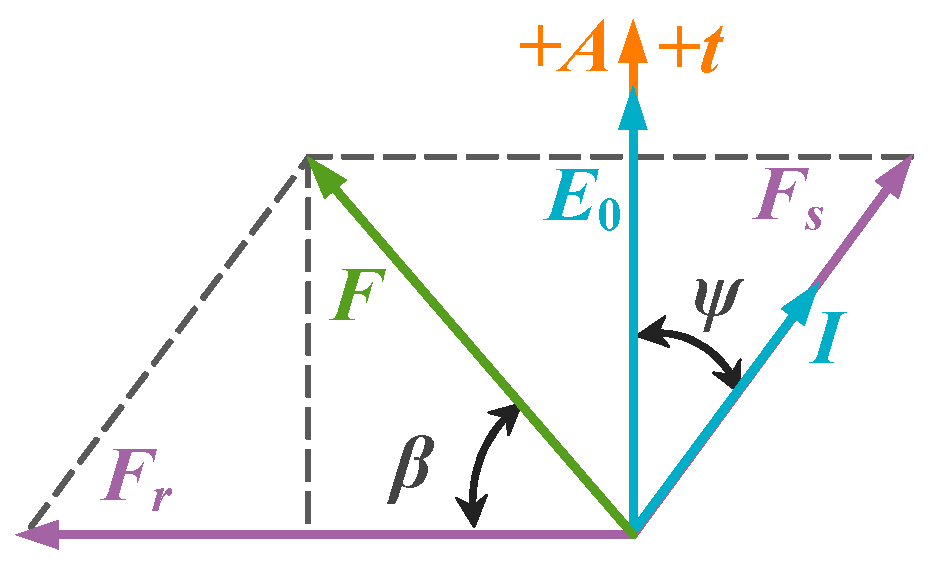
2.2. Phase Current Model
2.3. Generator Loss Model
2.3.1. Core Loss
2.3.2. Stator Copper Loss
2.3.3. Mechanical Loss
2.4. The Efficiency Model
3. FEA Verification
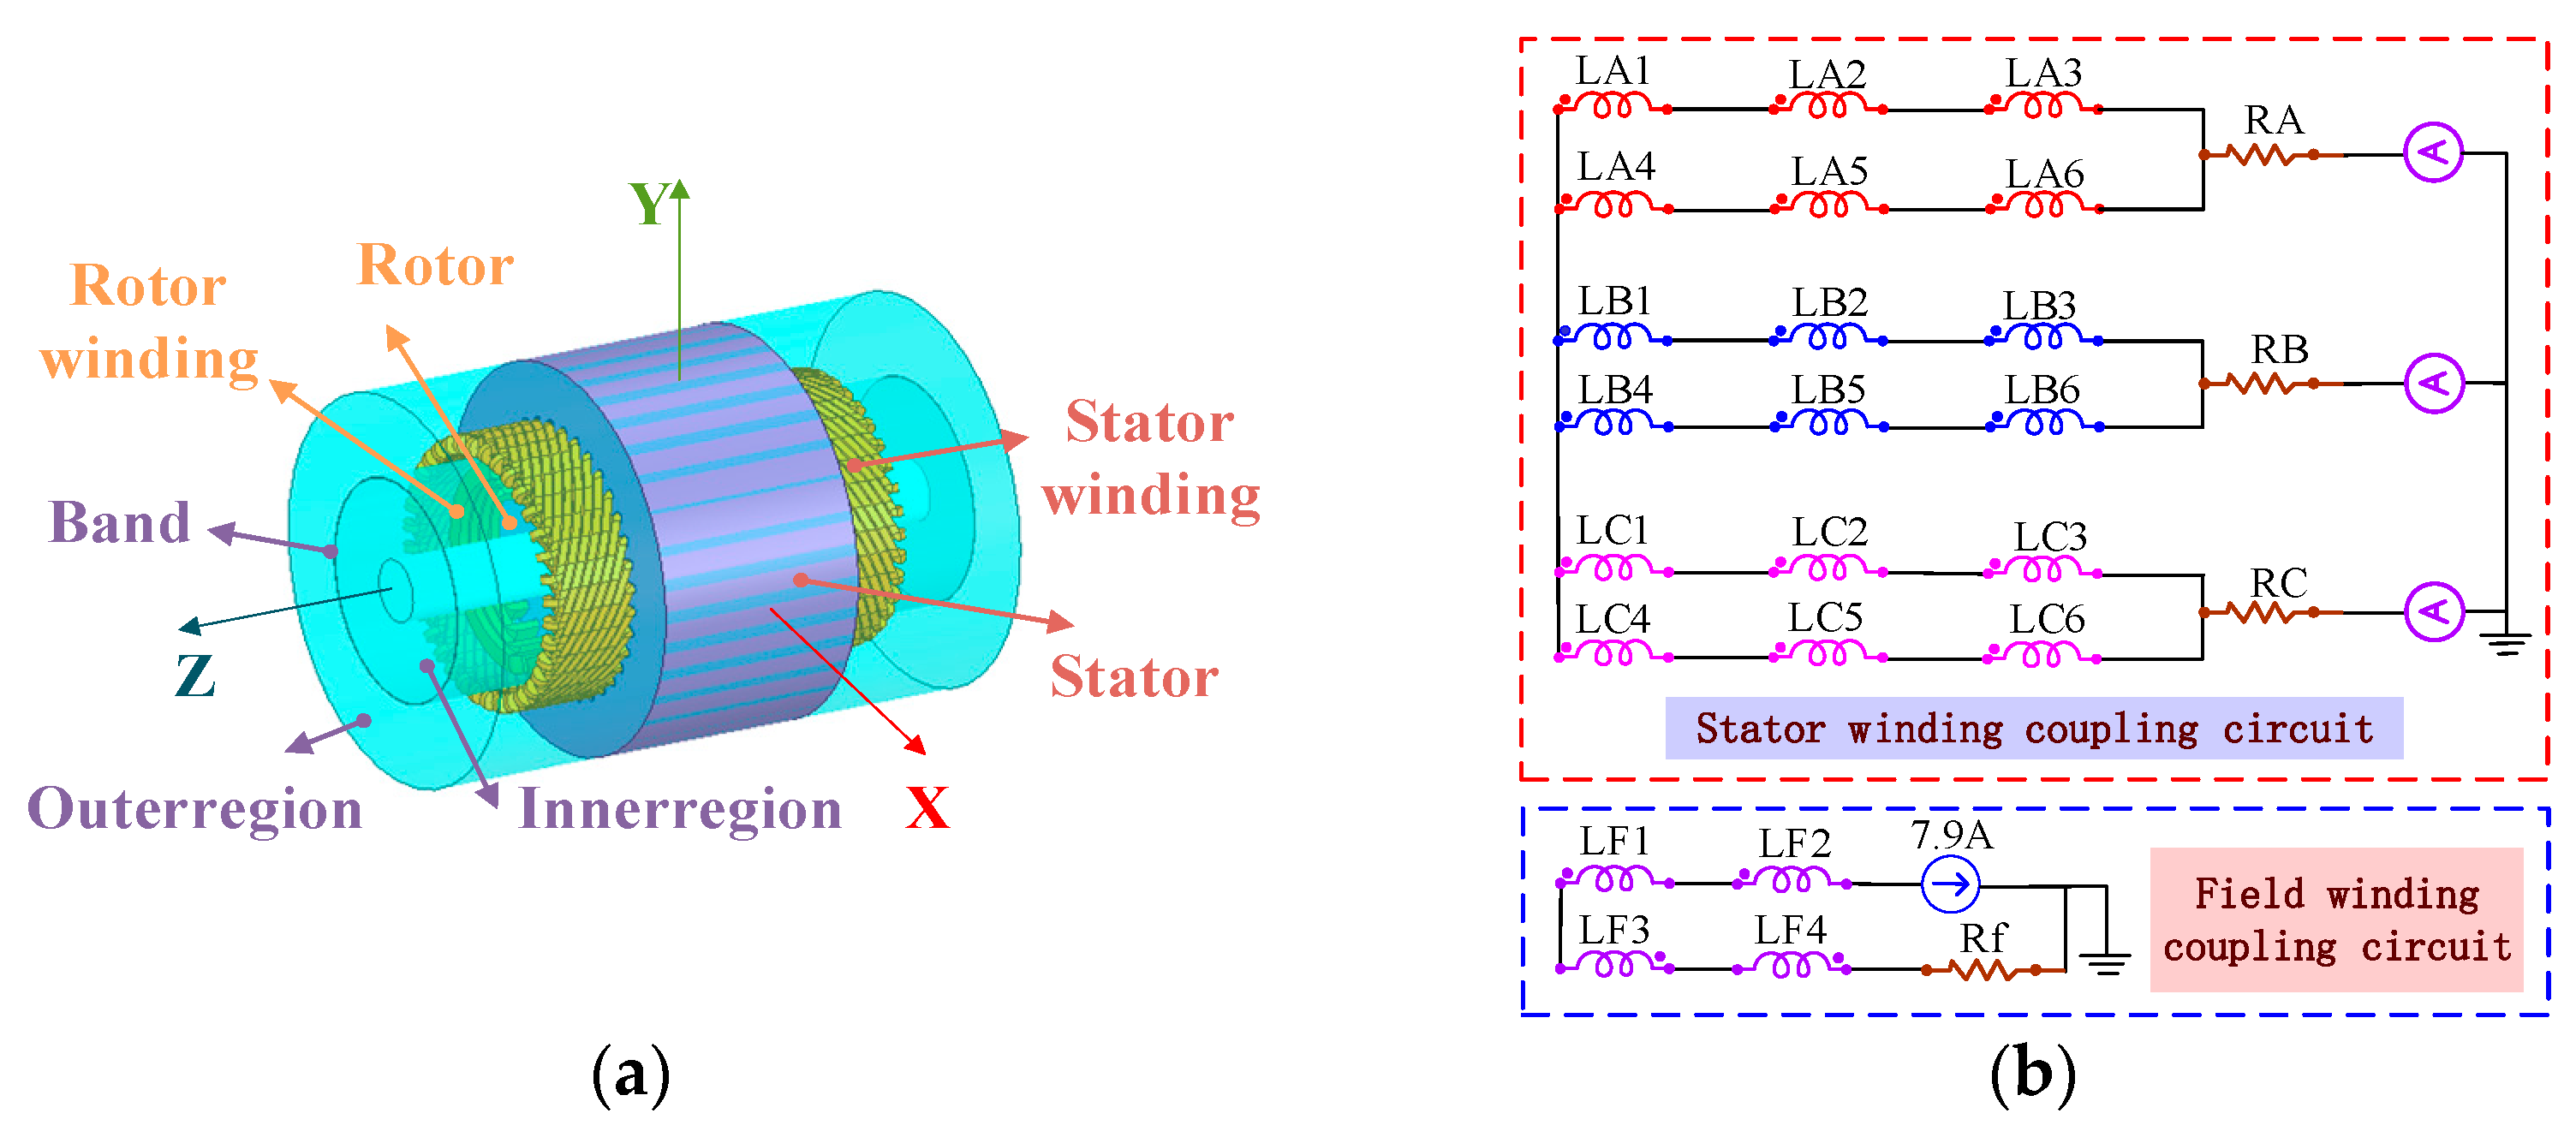
3.1. FEA Setup
3.2. FEA Results
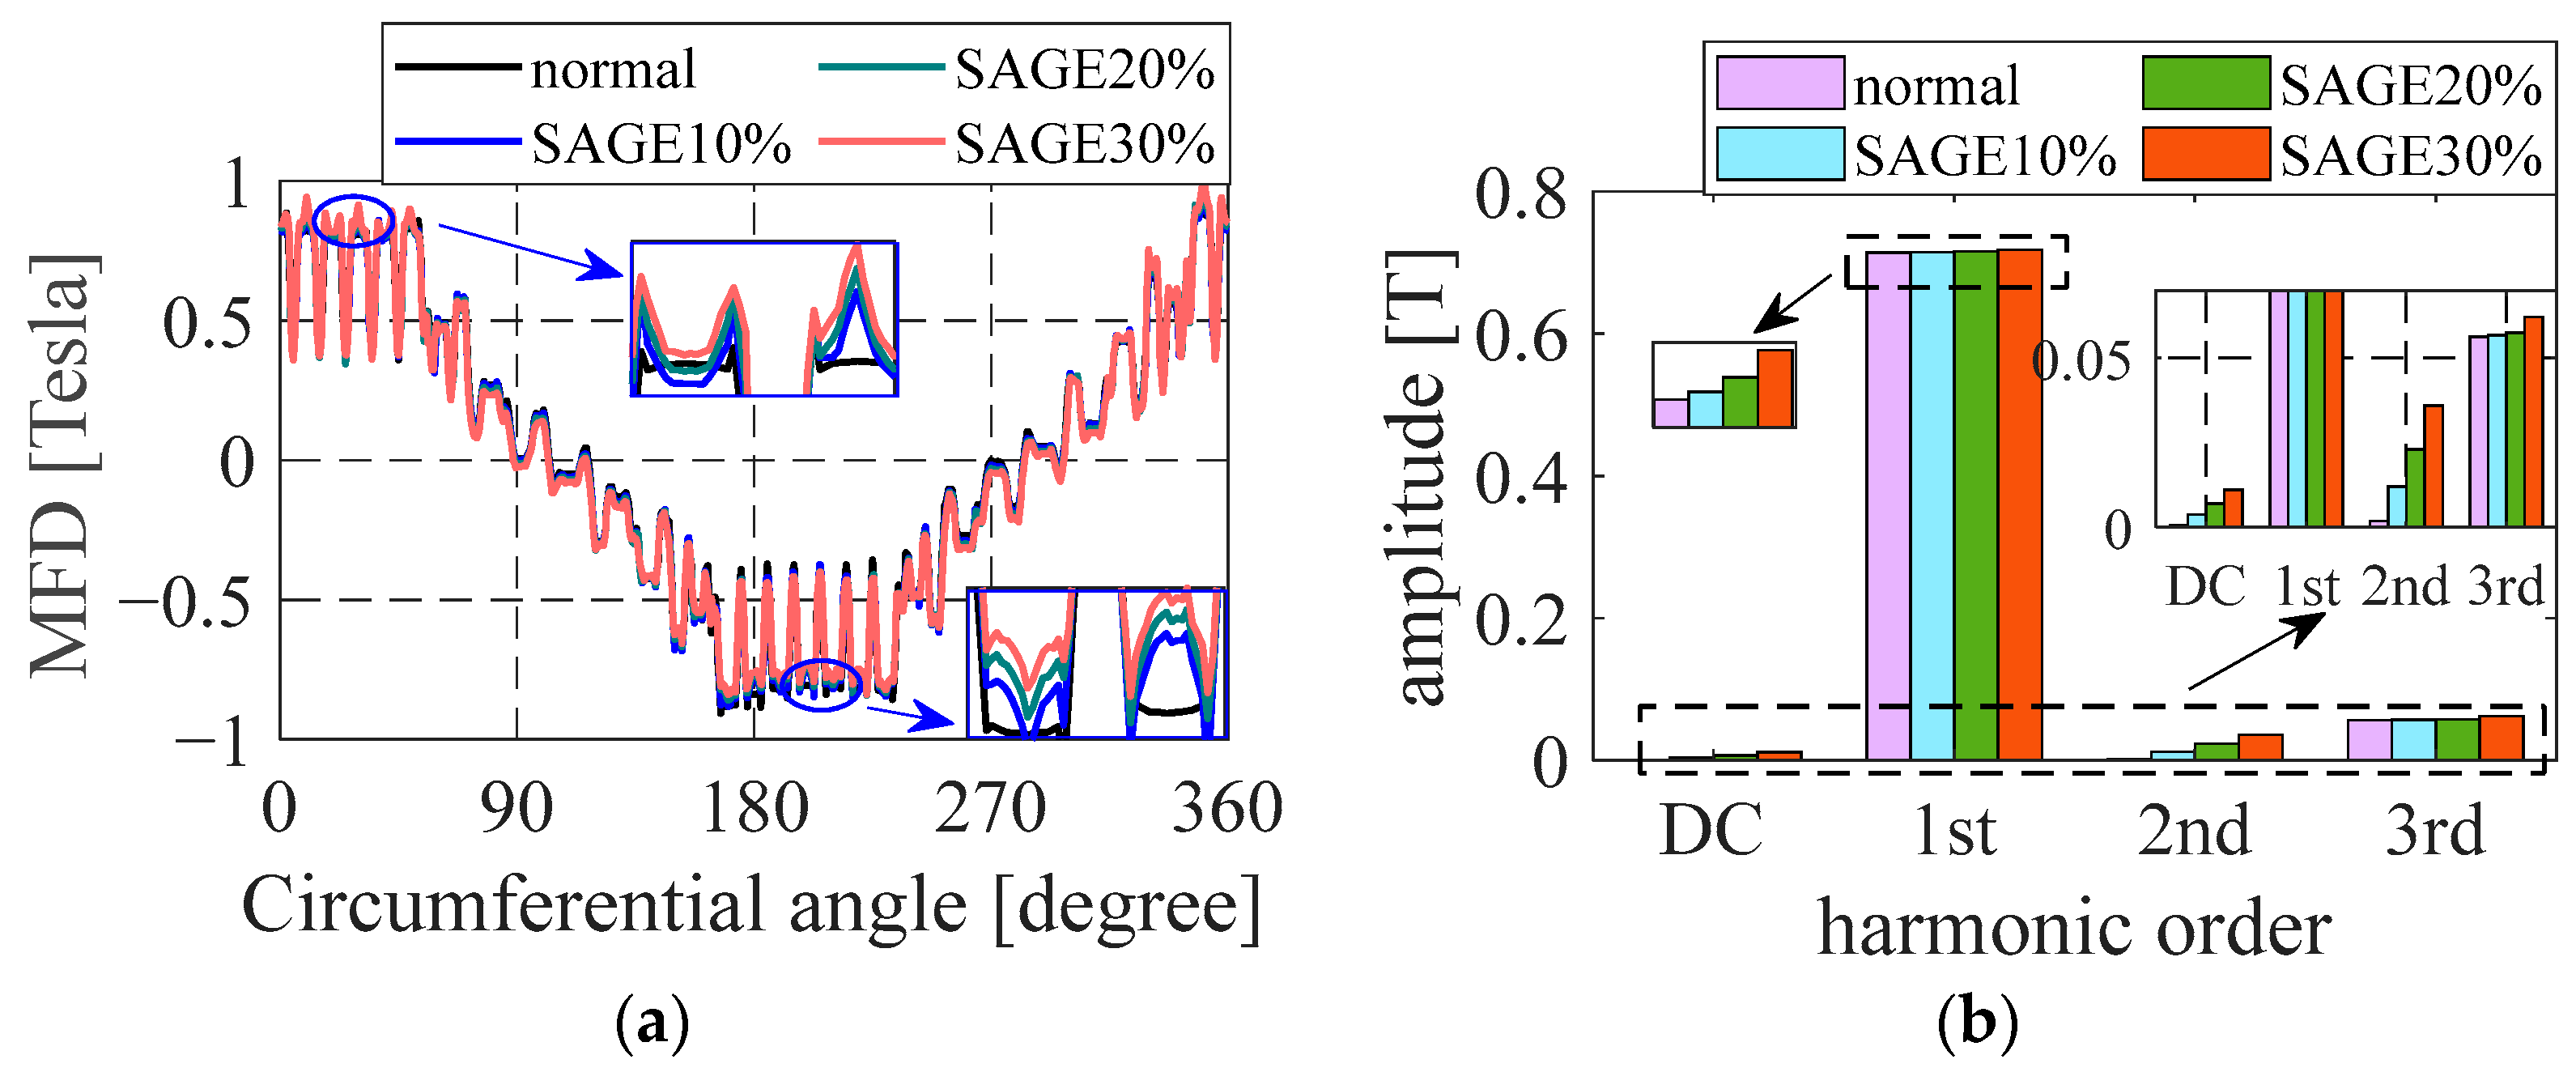
3.2.1. MFD Results
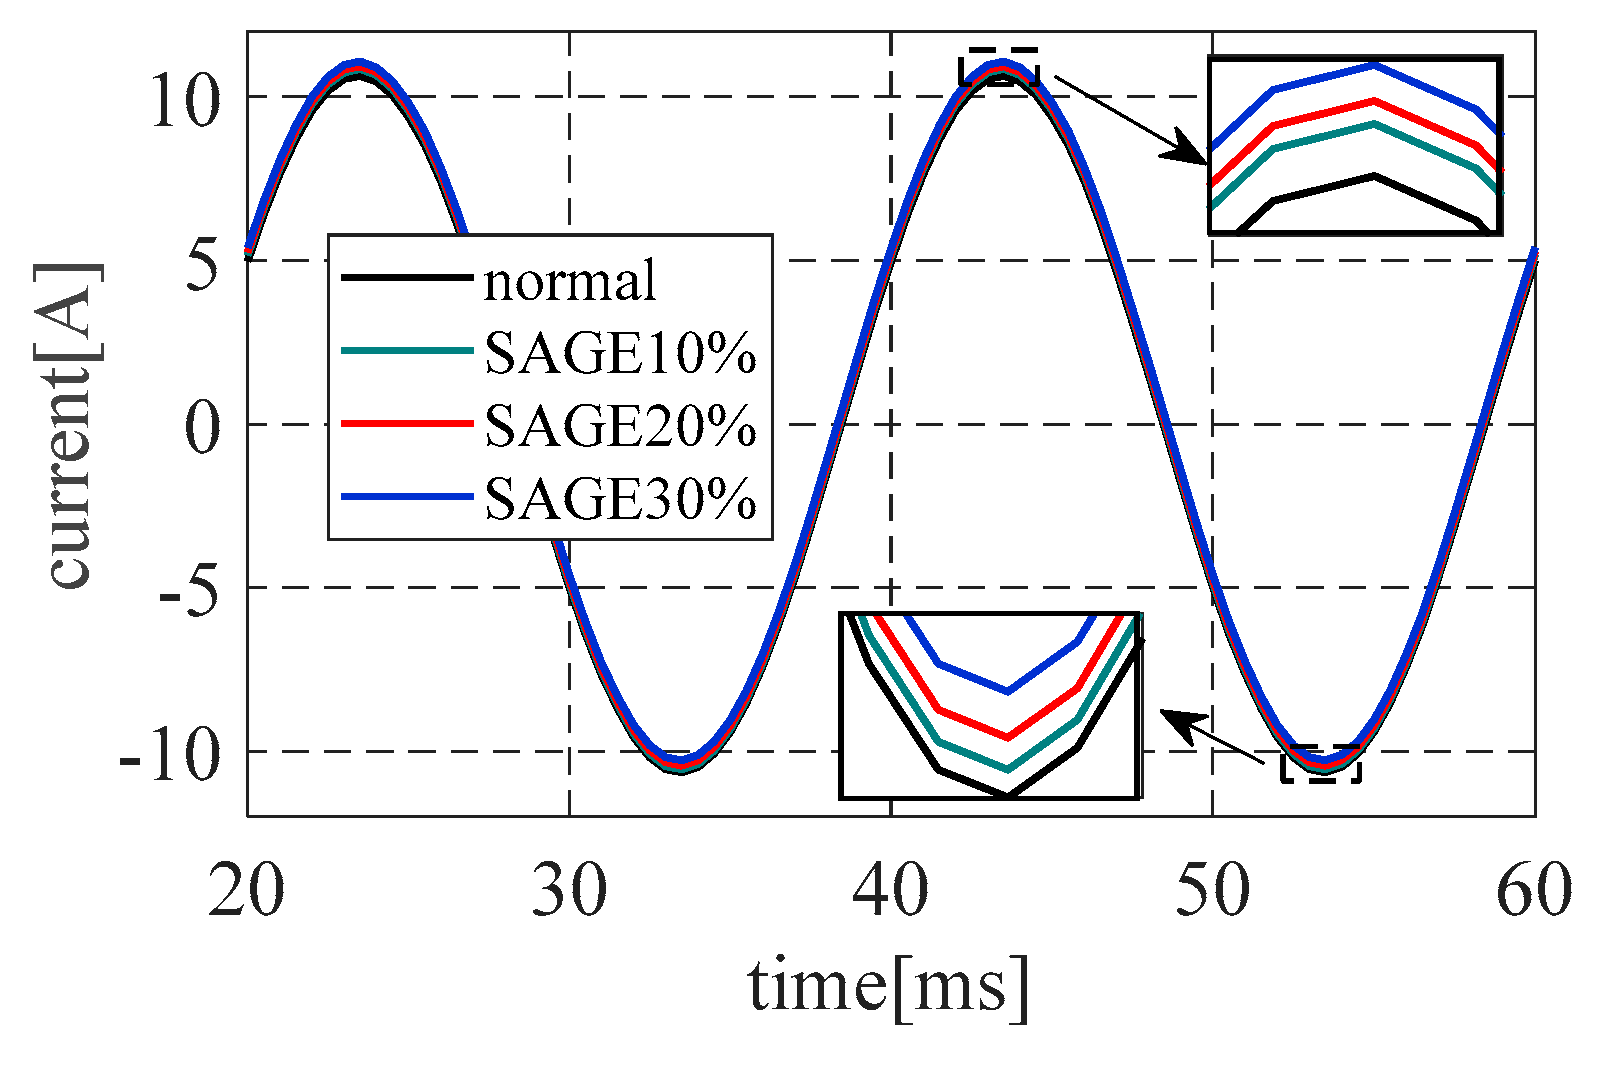
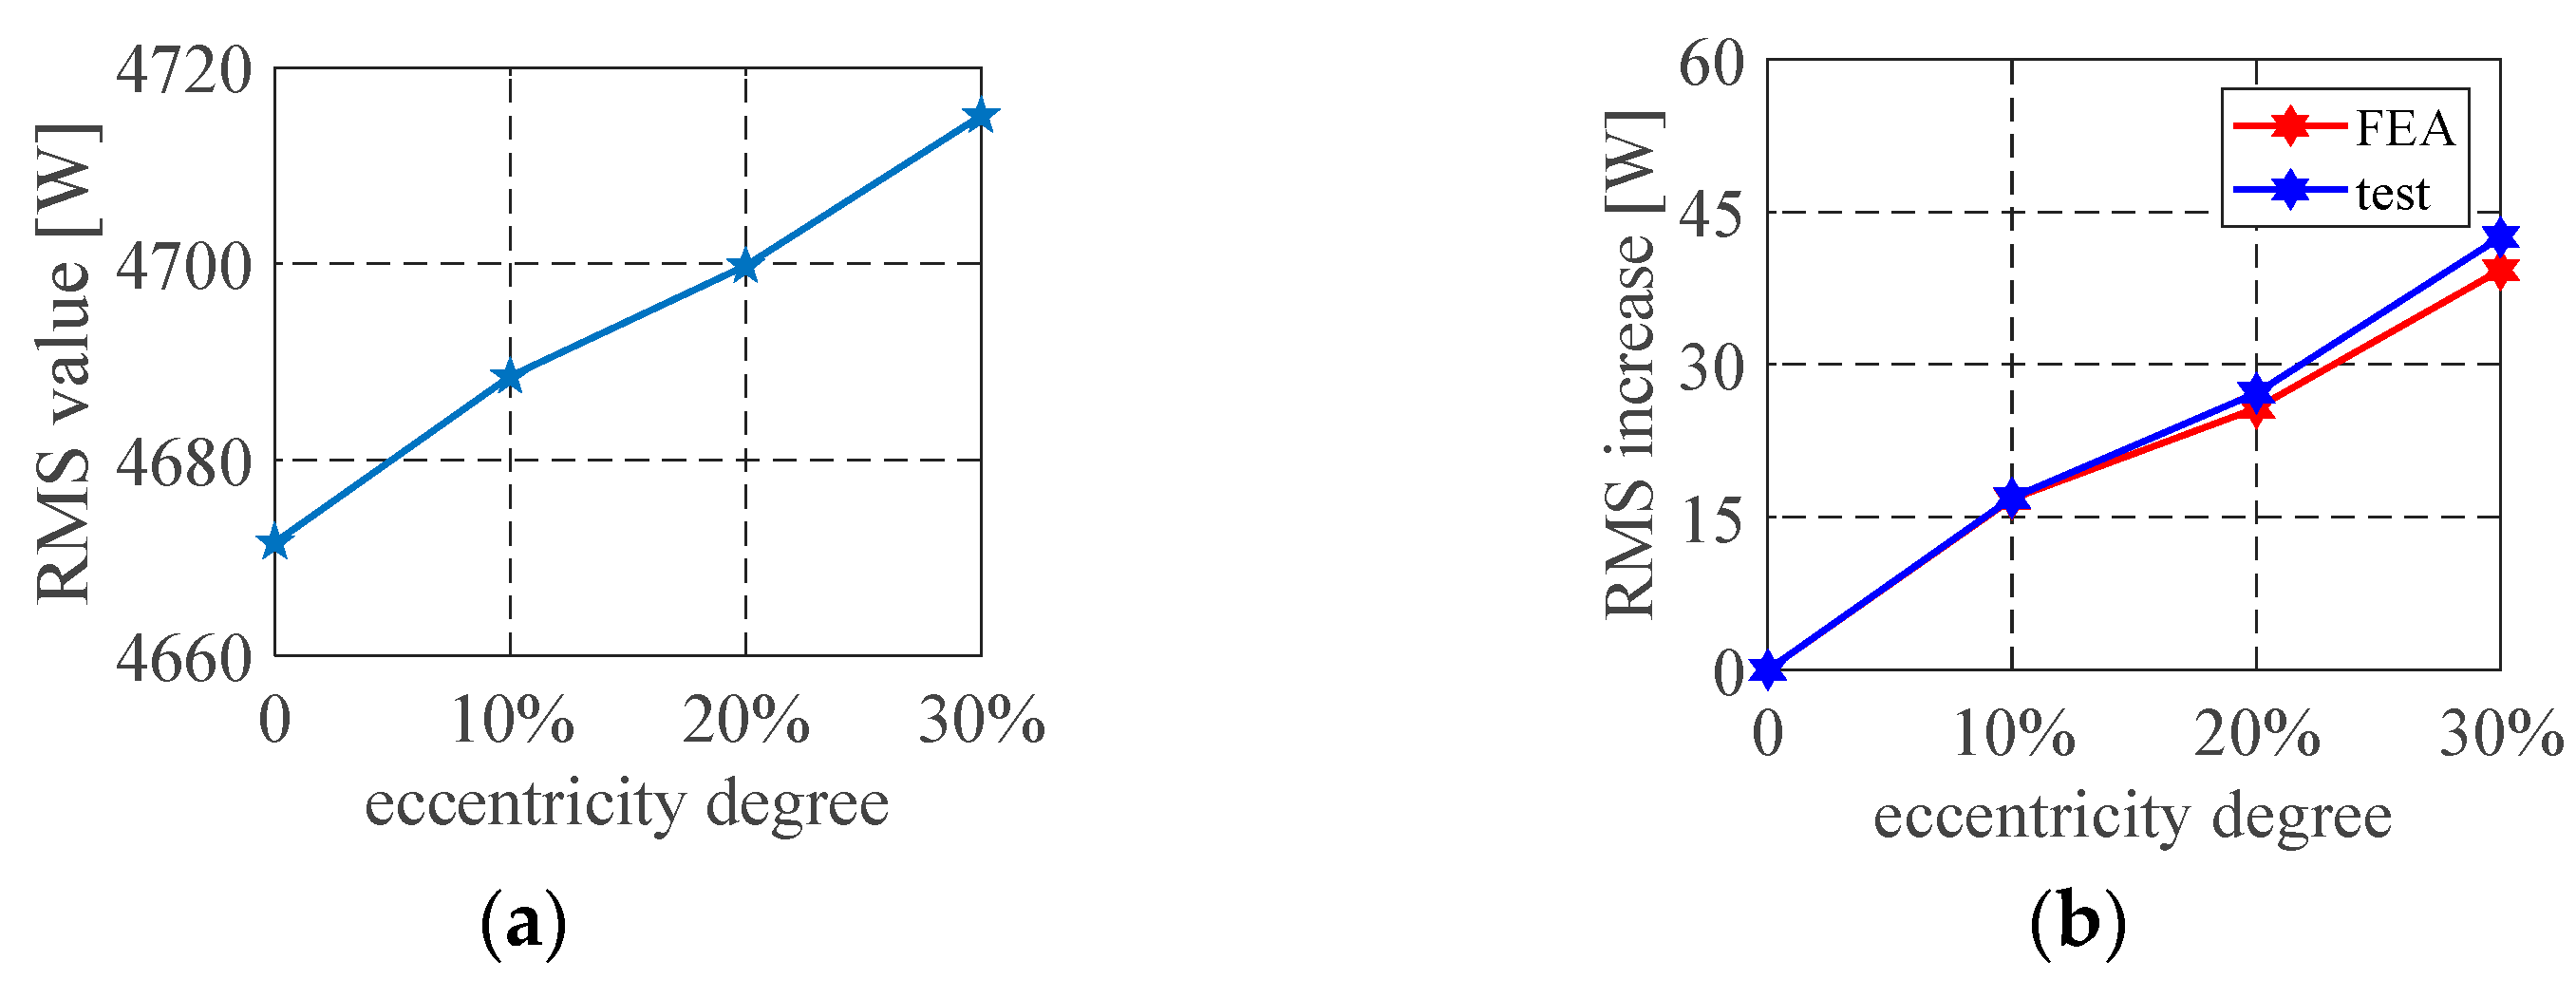
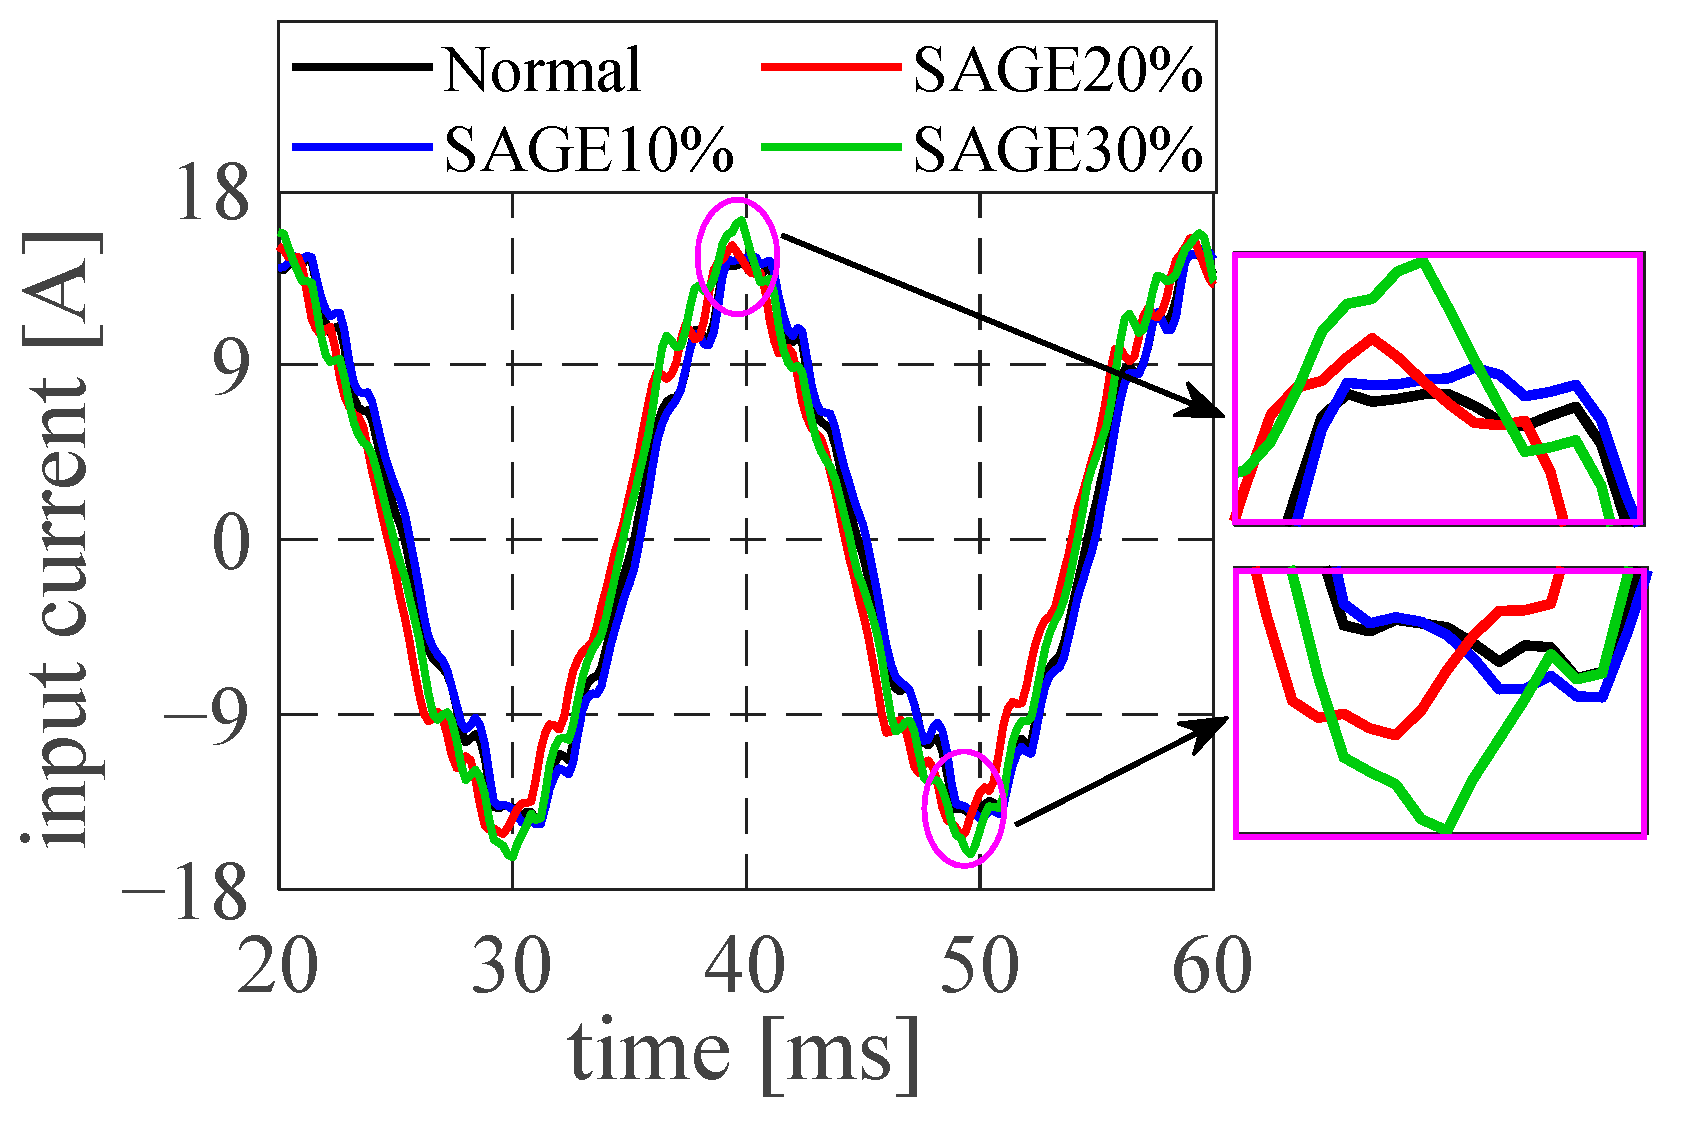
3.2.2. Current Results
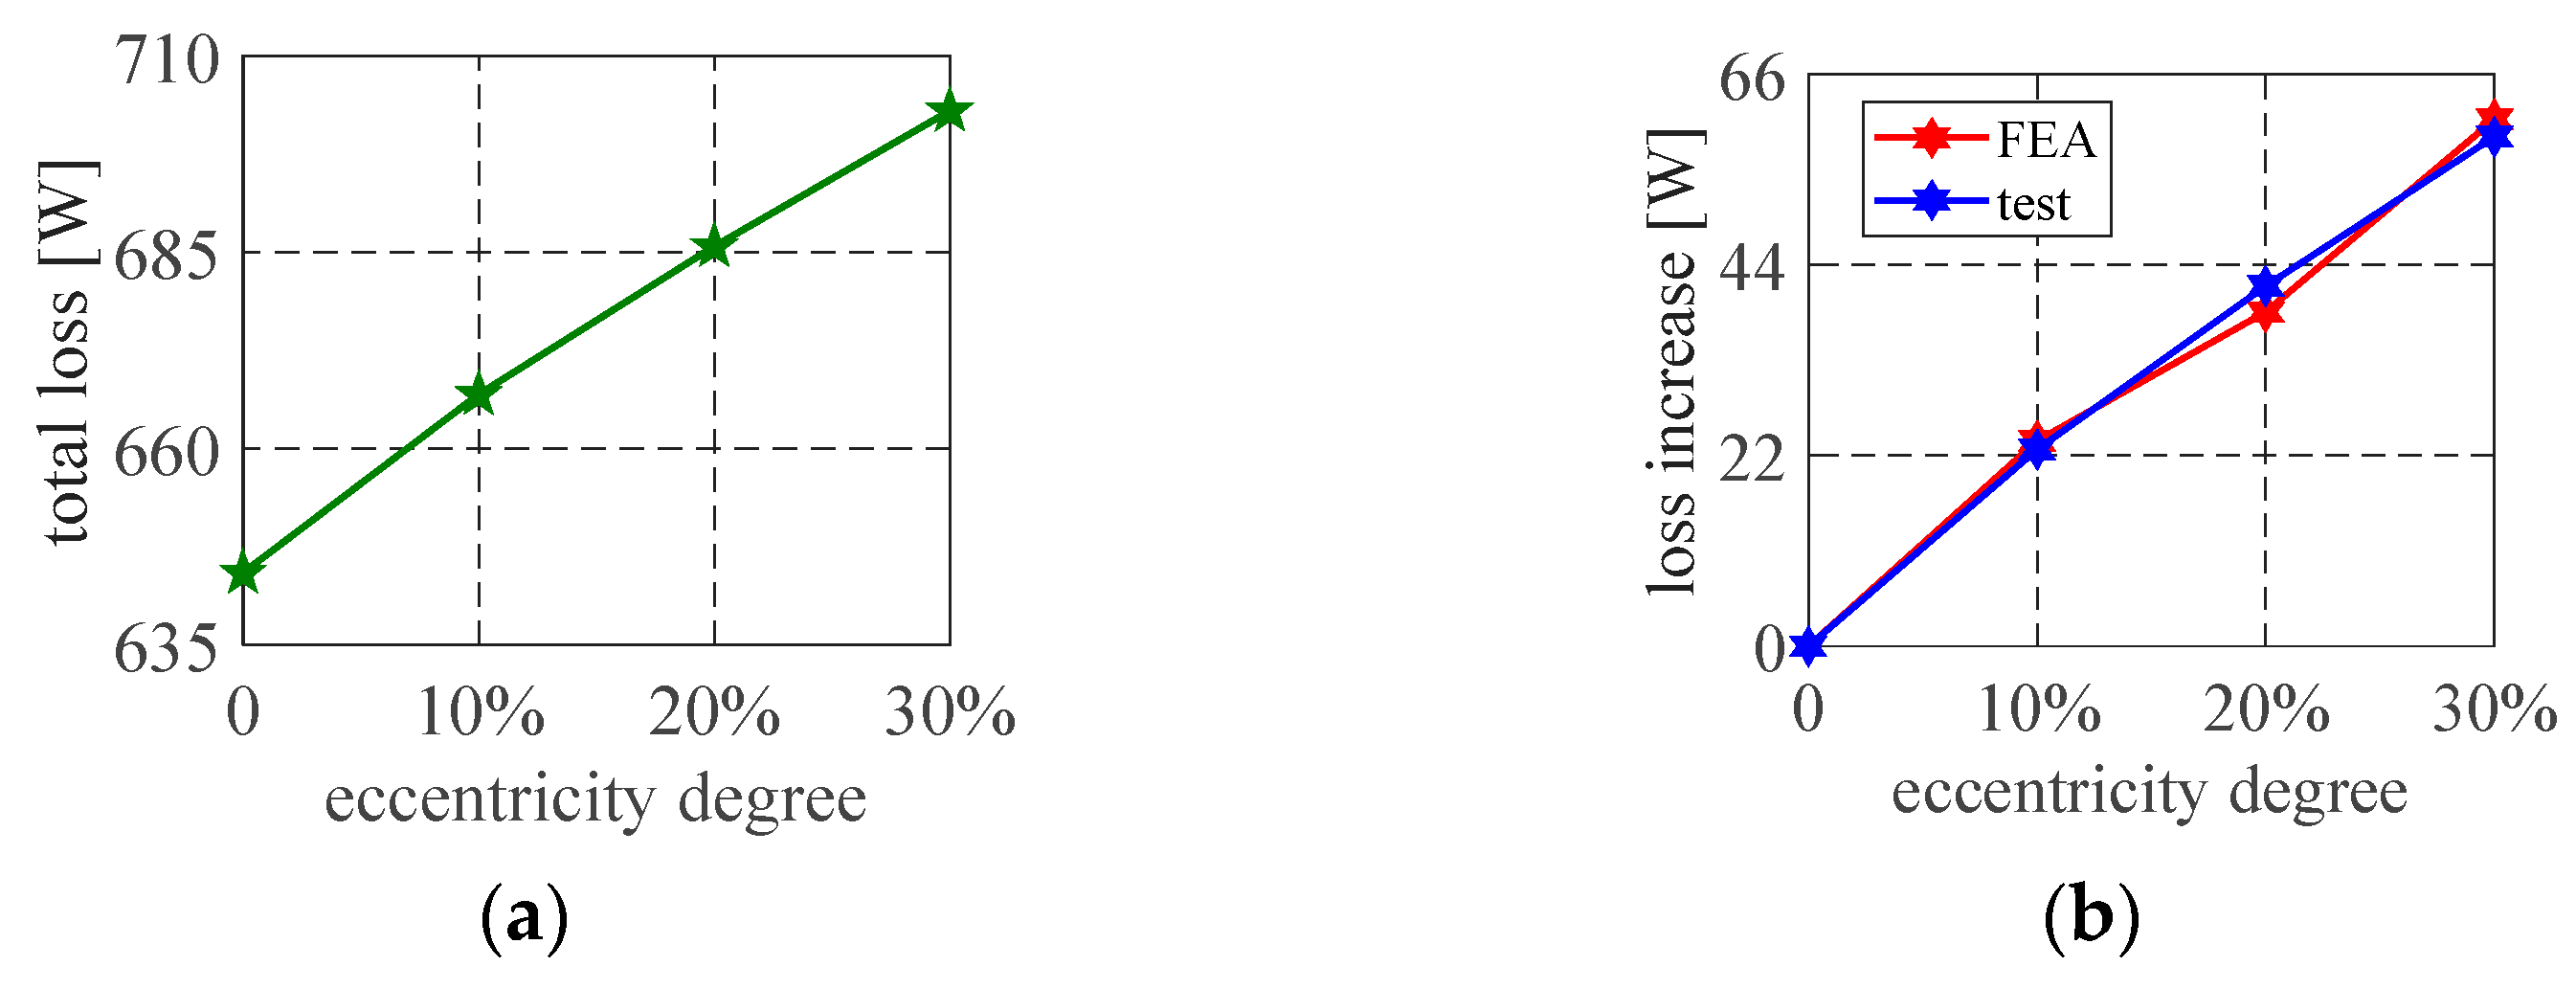
3.2.3. Loss Results
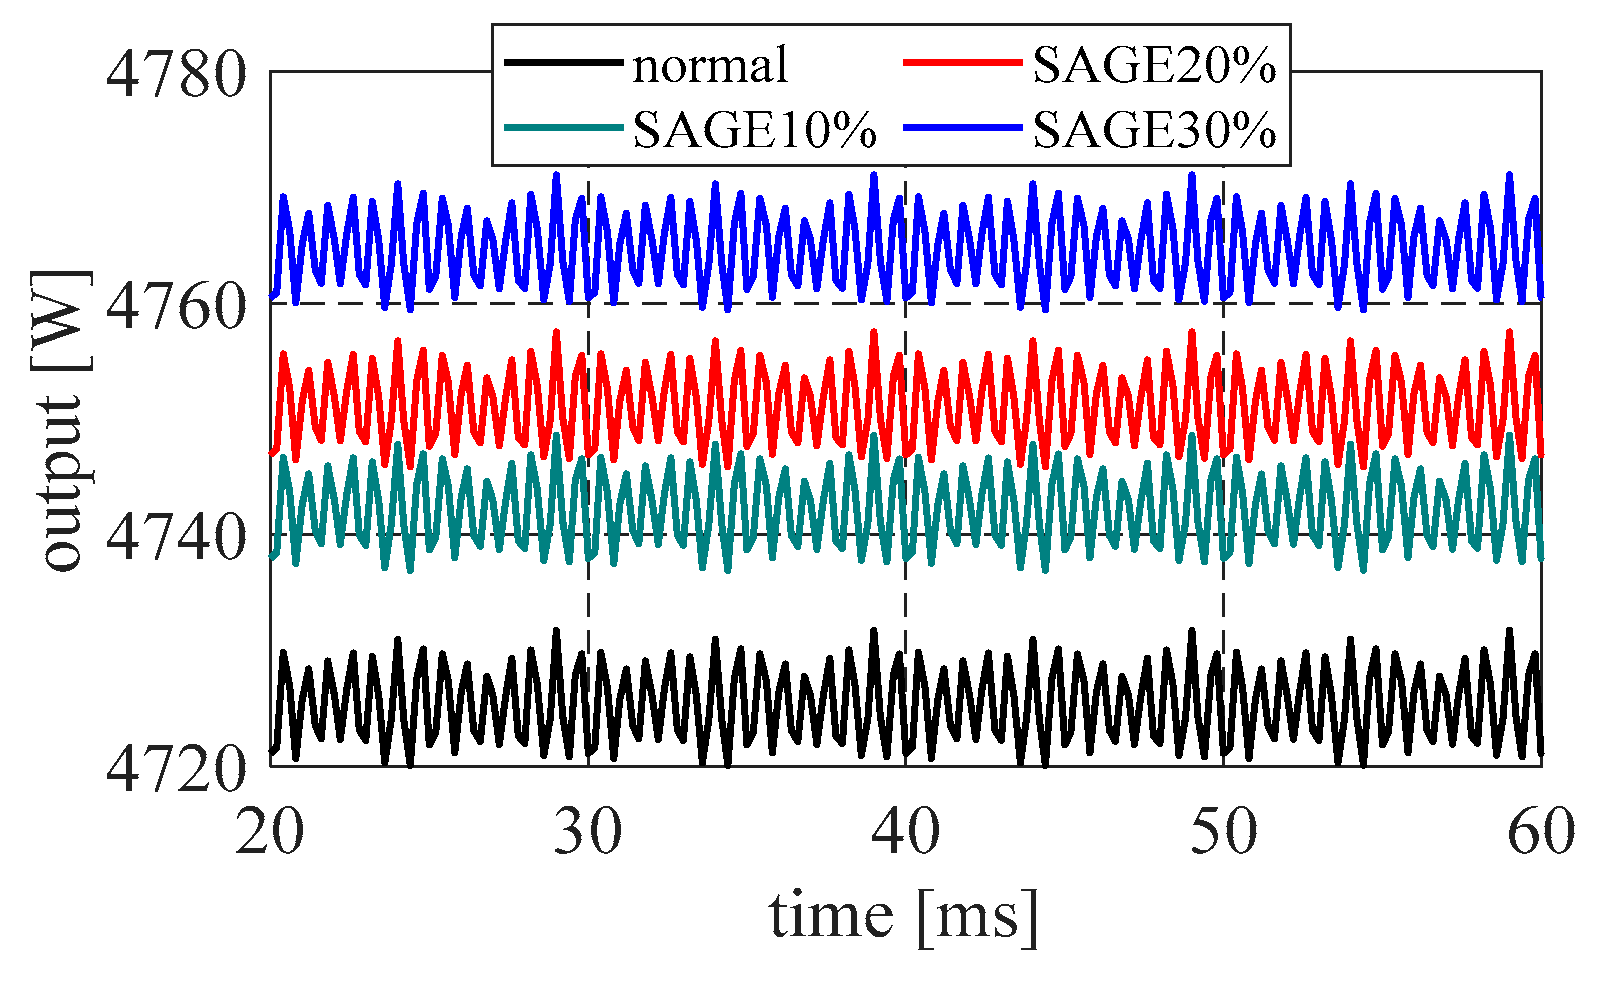
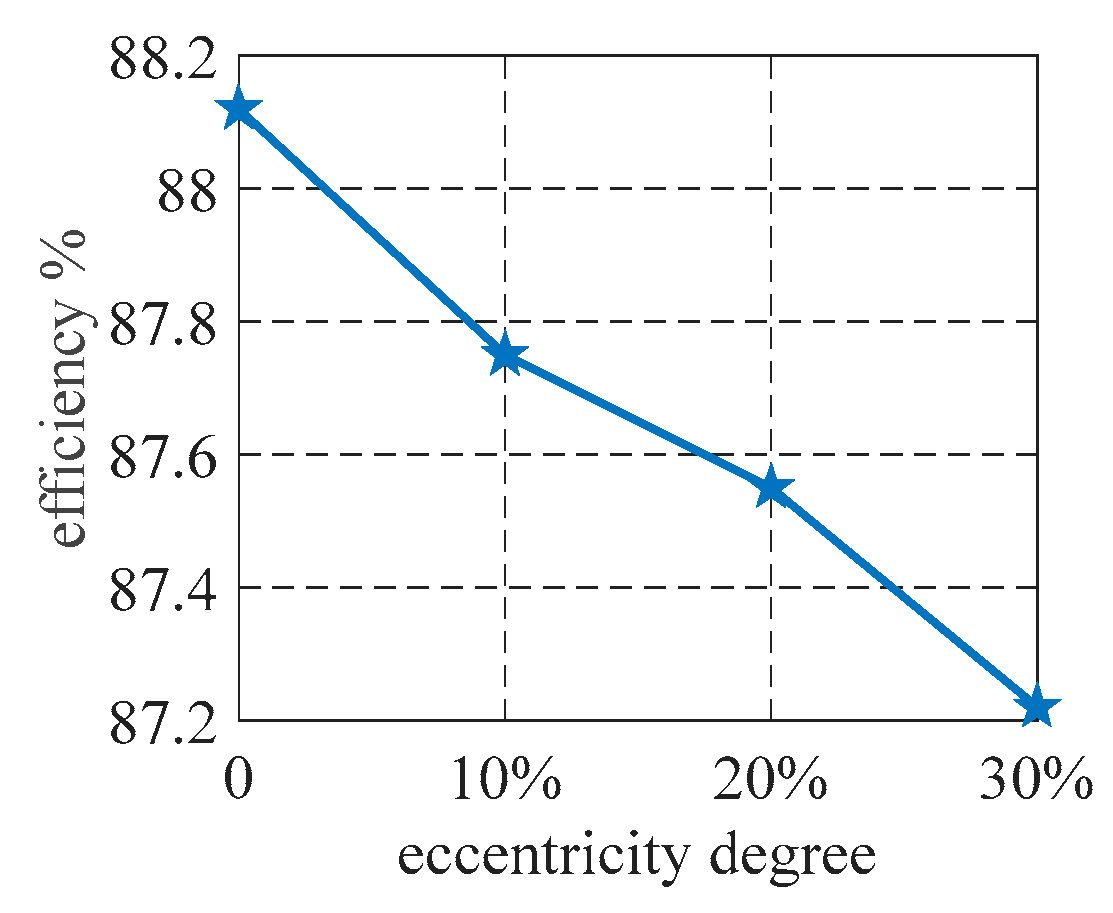
3.2.4. Efficiency Results
4. Experimental Verification
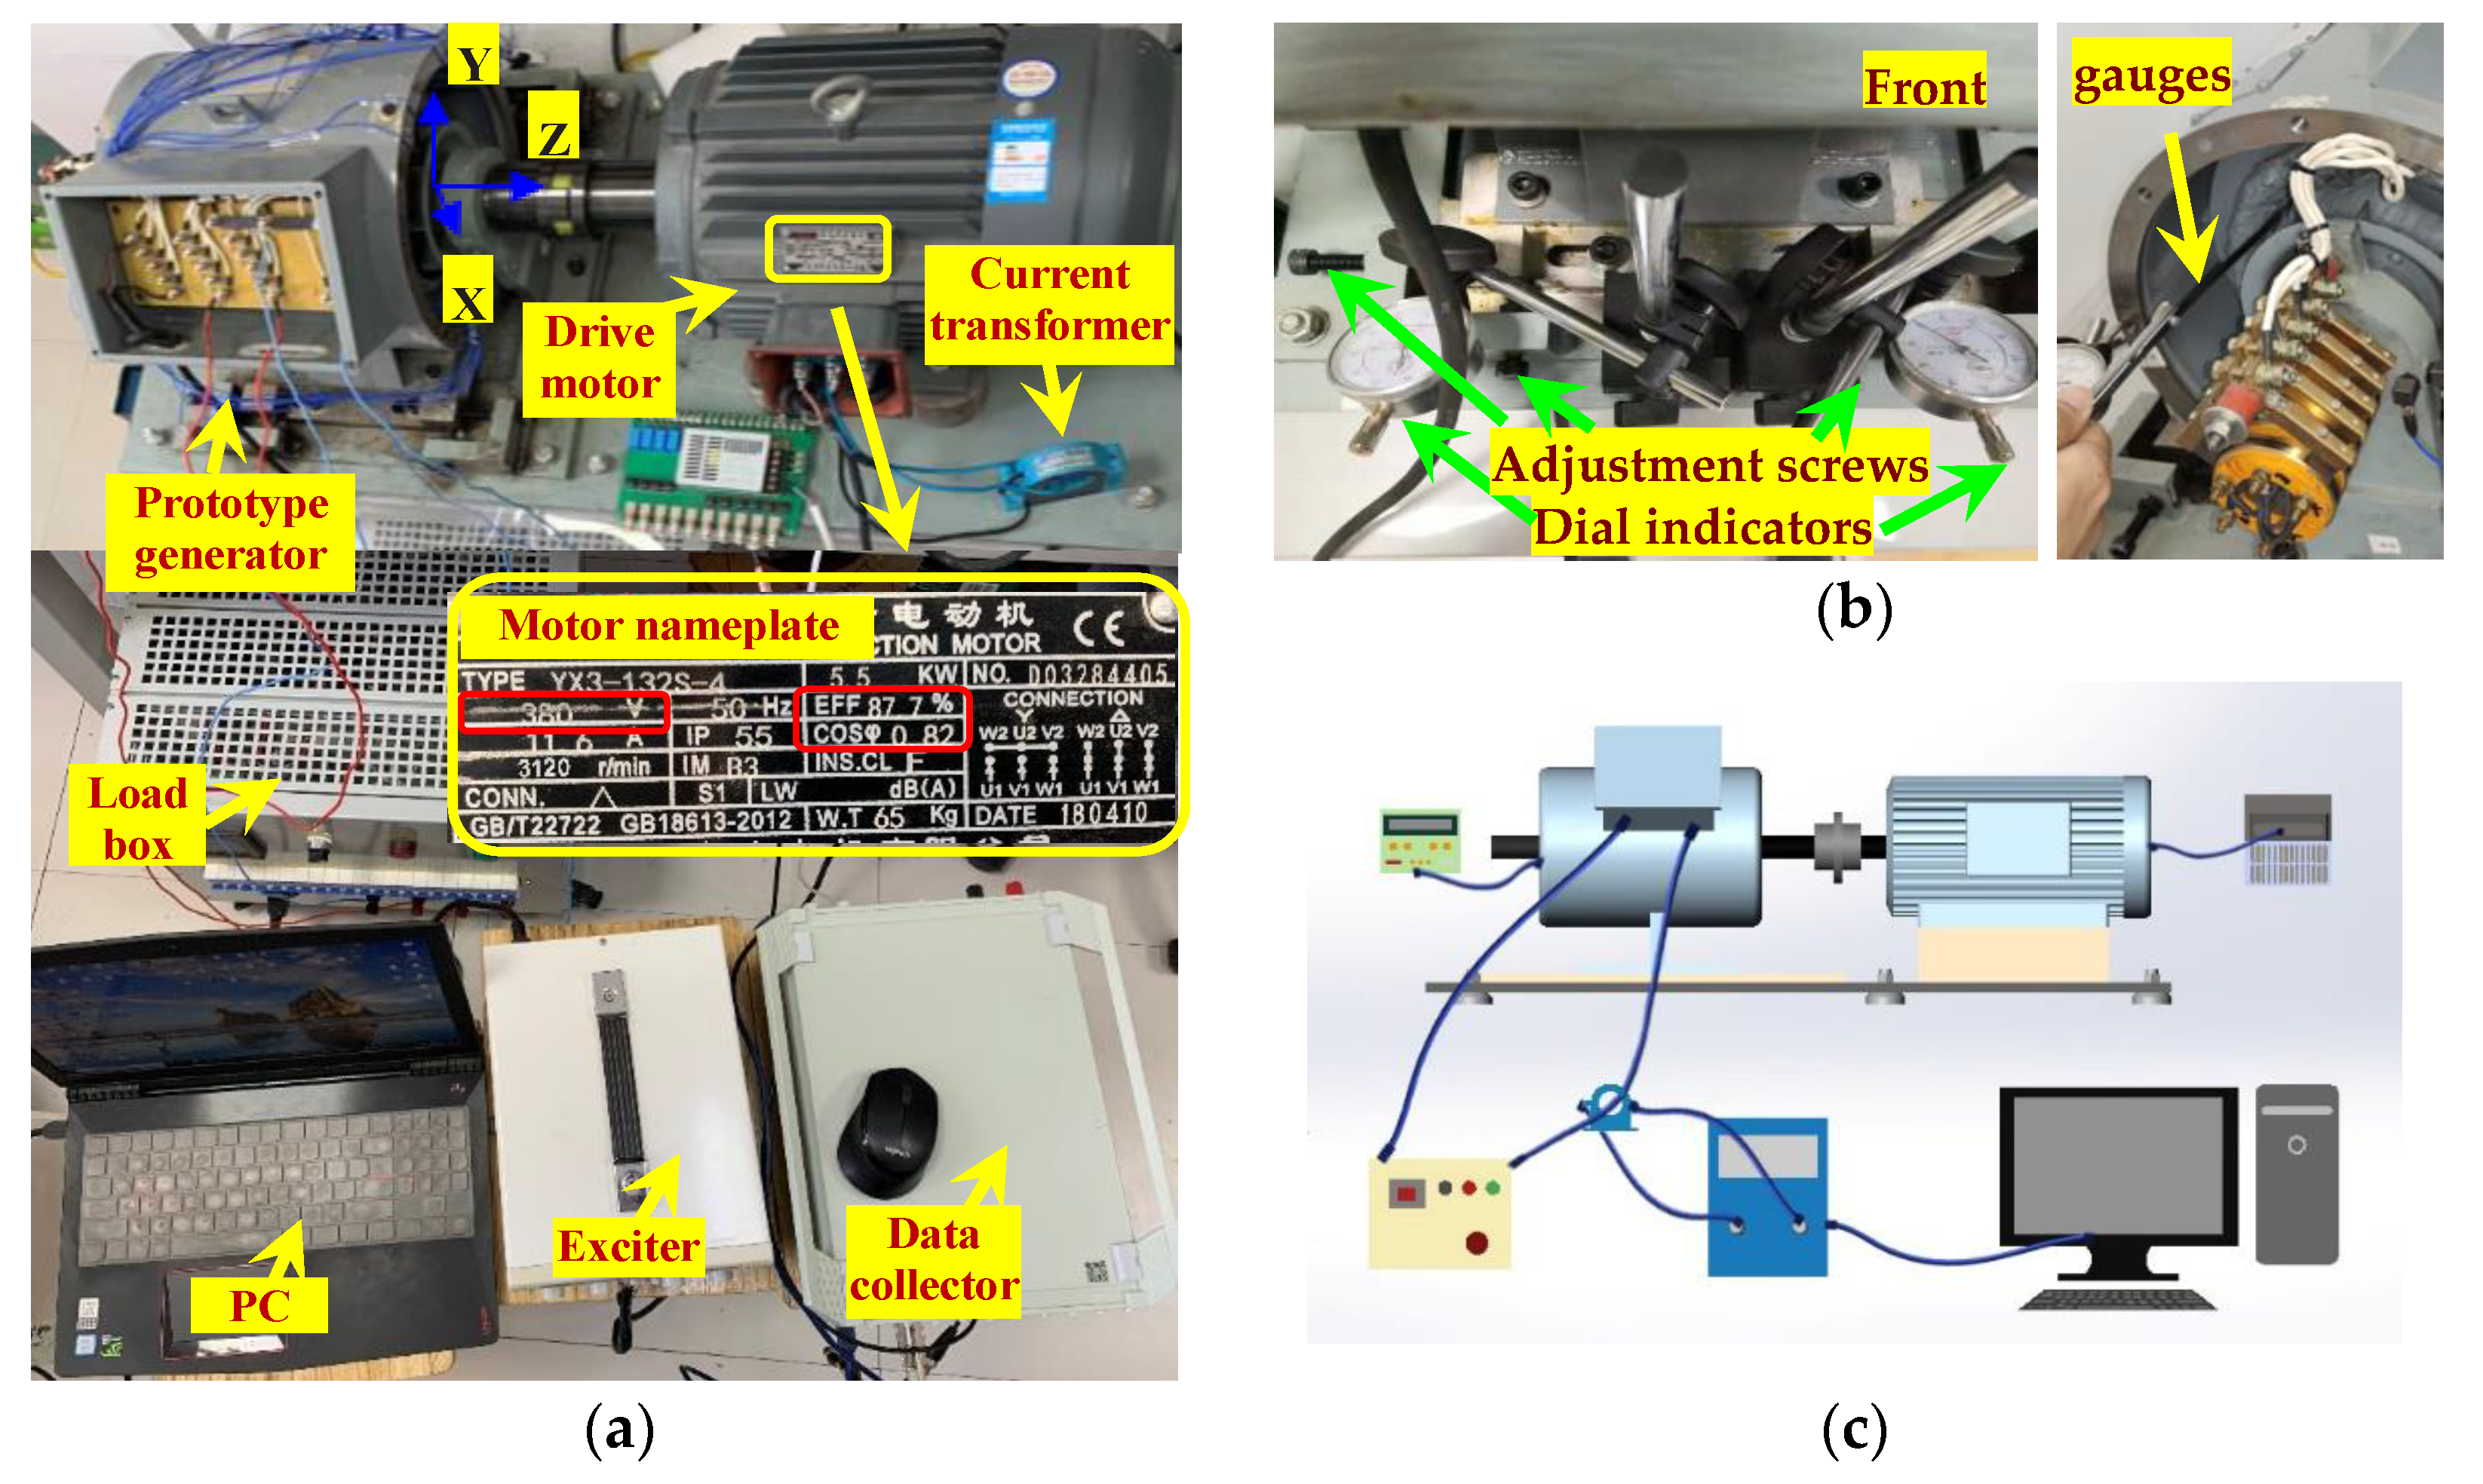
4.1. Experimental Setup
4.2. Experimental Results
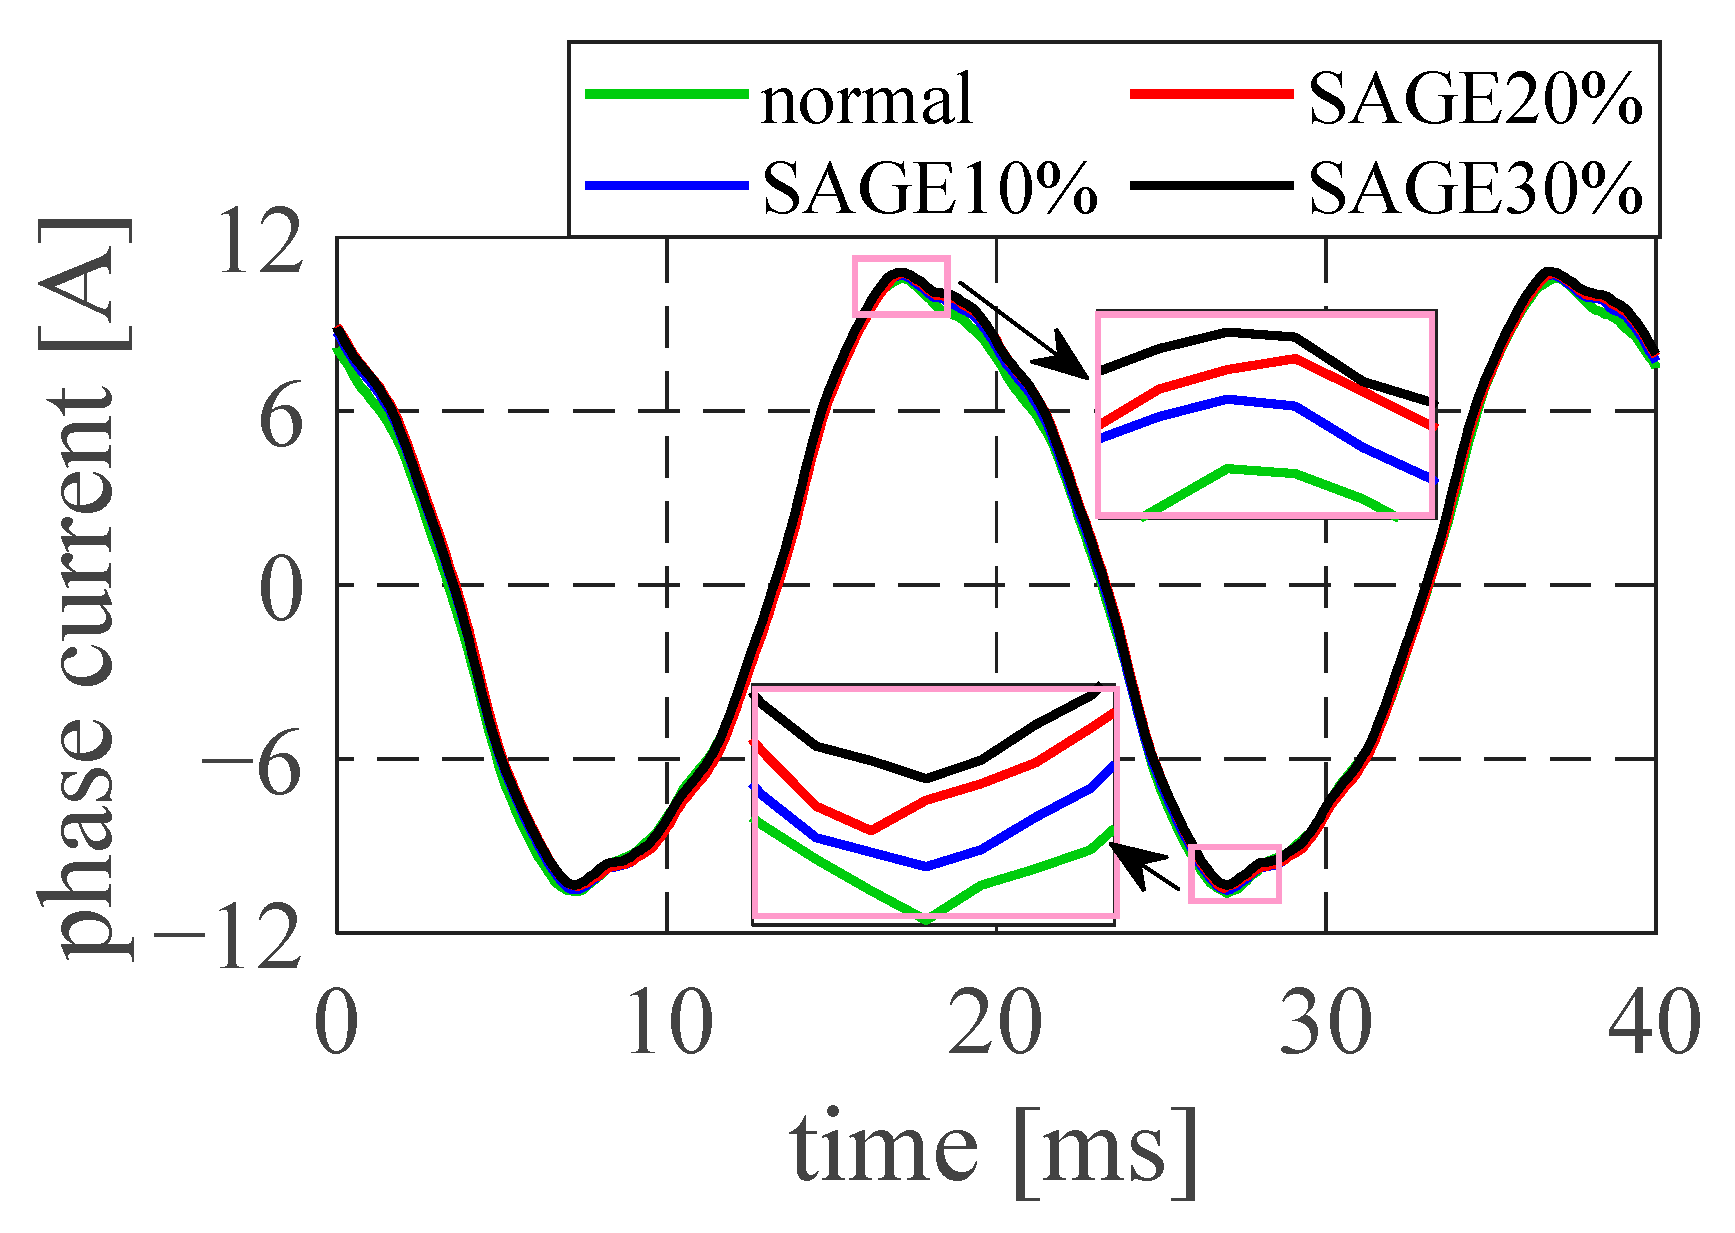
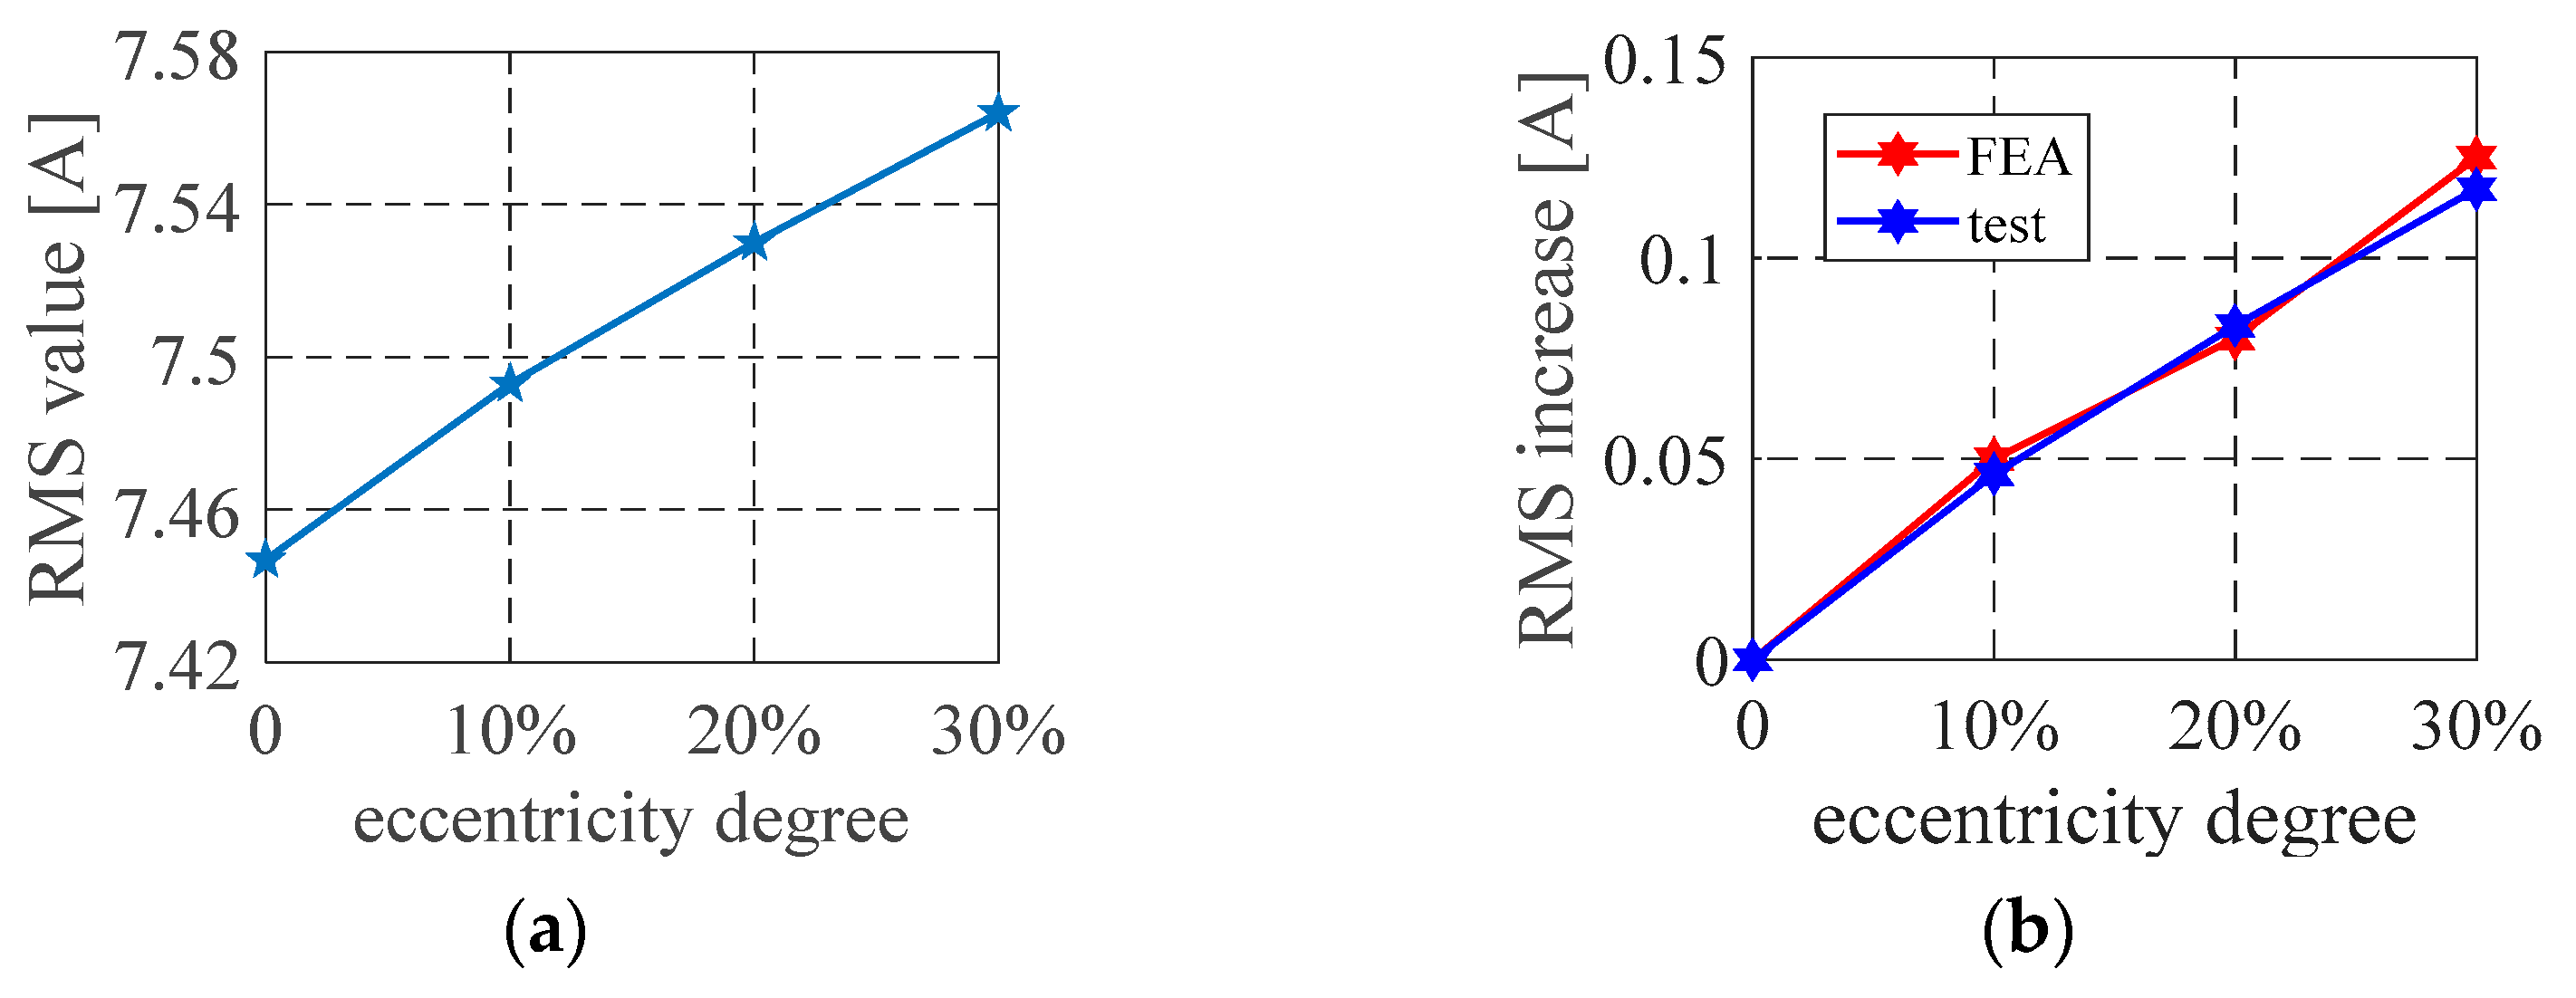
4.2.1. Measurement of Phase Current
4.2.2. Loss Results
4.2.3. Efficiency Results
5. Conclusions
Author Contributions
Funding
Data Availability Statement
Conflicts of Interest
References
- Dirani, H.C.; Merkhouf, A.; Giroux, A.M.; Kedjar, B.; Al-Haddad, K. Impact of Real Air-Gap Nonuniformity on the Electromagnetic Forces of a Large Hydro-Generator. IEEE Trans. Ind. Electron. 2018, 65, 8464–8475. [Google Scholar] [CrossRef]
- He, Y.L.; Xu, M.X.; Xiong, J.; Sun, Y.X.; Wang, X.L.; Gerada, D.; Vakil, G. Effect of 3D Unidirectional and Hybrid SAGE on Electromagnetic Torque Fluctuation Characteristics in Synchronous Generator. IEEE Access 2019, 7, 100813–100823. [Google Scholar] [CrossRef]
- Khajueezadeh, M.S.; FeizHoseini, S.; Nasiri-Gheidari, Z.; Behzad, M. Analysis of Torsional Vibrations on the Resolver Under Eccentricity in PMSM Drive System. IEEE Sens. J. 2022, 22, 21592–21599. [Google Scholar] [CrossRef]
- Echeverria, J.J.R.; da Silva, P.V.V.; da Costa Bortoni, E. Analysis of Orbital Eccentricity and UMP in Large Salient Pole Synchronous Machines. IEEE Trans. Ind. Appl. 2019, 55, 4715–4722. [Google Scholar] [CrossRef]
- He, Y.L.; Zhang, Y.Y.; Xu, M.X.; Wang, X.L.; Xiong, J. New Hybrid Model for Electromechanical Characteristic Analysis Under SISC in Synchronous Generators. IEEE Trans. Ind. Electron. 2020, 67, 2348–2359. [Google Scholar] [CrossRef]
- He, Y.L.; Sun, Y.X.; Xu, M.X.; Wang, X.L.; Wu, Y.C.; Vakil, G.; Gerada, D.; Gerada, C. Rotor UMP Characteristics and Vibration Properties in Synchronous Generator Due to 3D Static Air-Gap Eccentricity Faults. IET Electr. Power Appl. 2020, 14, 961–971. [Google Scholar] [CrossRef]
- Bruzzese, C.; Joksimovic, G.; Santini, E. Static Eccentricity Detection in Synchronous Generators by Field Current and Stator Voltage Signature Analysis—Part II: Measurements. In Proceedings of the XIX International Conference on Electrical Machines—ICEM 2010, Rome, Italy, 6–8 September 2010; pp. 1–5. [Google Scholar]
- Bruzzese, C.; Giordani, A.; Santini, E. Static and Dynamic Rotor Eccentricity On-Line Detection and Discrimination in Synchronous Generators by No-Load E.M.F. Space Vector Loci Analysis. In Proceedings of the 2008 International Symposium on Power Electronics, Electrical Drives, Automation and Motion, Ischia, Italy, 11–13 June 2008; pp. 1259–1264. [Google Scholar]
- Zhu, Z.Q.; Wu, L.J.; Jamil, M.L.M. Distortion of Back-EMF and Torque of PM Brushless Machines Due to Eccentricity. IEEE Trans. Magn. 2013, 49, 4927–4936. [Google Scholar] [CrossRef]
- Ma, C.; Li, J.; Zhang, N.; Bu, F.; Yang, Z. Open-Circuit Radial Stray Magnetic Flux Density Based Noninvasive Diagnosis for Mixed Eccentricity Parameters of Interior Permanent Magnet Synchronous Motors in Electric Vehicles. IEEE Trans. Ind. Electron. 2023, 70, 1983–1992. [Google Scholar] [CrossRef]
- He, Y.L.; Zhang, Z.J.; Tao, W.Q.; Wang, X.L.; Gerada, D.; Gerada, C.; Gao, P. A New External Search Coil Based Method to Detect Detailed Static Air-Gap Eccentricity Position in Nonsalient Pole Synchronous Generators. IEEE Trans. Ind. Electron. 2021, 68, 7535–7544. [Google Scholar] [CrossRef]
- Caetano, R.E.; Chabu, I.E.; Stolfi, G.; Santos, J.C.; Nagao, S.; Gomes, C.E.; Paiva, R.D.; Nabeta, S.I.; Micerino, F.J. Capacitive and Inductive Sensors for Diagnosing Air-Gap Anomalies in Synchronous Generators. In Proceedings of the 2015 IEEE International Electric Machines & Drives Conference (IEMDC), Coeur d’Alene, ID, USA, 10–13 May 2015; pp. 637–641. [Google Scholar]
- Wu, X.; Zhu, Z.Q.; Wu, Z.Y.; Liu, T.Y.; Li, Y.X. Analysis and Suppression of Rotor Eccentricity Effects on Fundamental Model Based Sensorless Control of Permanent Magnet Synchronous Machine. IEEE Trans. Ind. Appl. 2020, 56, 4896–4905. [Google Scholar] [CrossRef]
- Mirzaeva, G.; Saad, K.I. Advanced Diagnosis of Rotor Faults and Eccentricity in Induction Motors Based on Internal Flux Measurement. IEEE Trans. Ind. Appl. 2018, 54, 2981–2991. [Google Scholar] [CrossRef]
- Doorsamy, W.; Abdallh, A.A.; Cronje, W.A.; Dupré, L. An Experimental Design for Static Eccentricity Detection in Synchronous Machines Using a Cramér–Rao Lower Bound Technique. IEEE Trans. Energy Convers. 2015, 30, 254–261. [Google Scholar] [CrossRef]
- Nasiri-Gheidari, Z.; Tootoonchian, F. Axial Flux Resolver Design Techniques for Minimizing Position Error Due to Static Eccentricities. IEEE Sens. J. 2015, 15, 4027–4034. [Google Scholar] [CrossRef]
- Steinmetz, C.P. On the Law of Hysteresis. Trans. Am. Inst. Electr. Eng. 1892, 9, 1–64. [Google Scholar] [CrossRef]
- Bertotti, G. General Properties of Power Losses in Soft Ferromagnetic Materials. IEEE Trans. Magn. 1988, 24, 621–630. [Google Scholar] [CrossRef]
- Kim, C.W.; Kim, J.M.; Seo, S.W.; Ahn, J.H.; Hong, K.; Choi, J.Y. Core Loss Analysis of Permanent Magnet Linear Synchronous Generator Considering the 3-D Flux Path. IEEE Trans. Magn. 2018, 54, 8200604. [Google Scholar] [CrossRef]
- Li, L.; Li, W.; Li, D.; Zhang, X.; Fan, Y. Influence of sleeve thickness and various structures on eddy current losses of rotor parts and temperature field in surface mounted permanent-magnet synchronous motor. IET Electr. Power Appl. 2018, 12, 1183–1191. [Google Scholar] [CrossRef]
- Han, J.; Ge, B.; Li, W. Influence of Magnetic Permeability of the Press Plate on the Loss and Temperature of the End Part in the End Region of a Turbogenerator. IEEE Trans. Ind. Electron. 2019, 66, 162–171. [Google Scholar] [CrossRef]
- Belahcen, A.; Arkkio, A. Computation of Additional Losses Due to Rotor Eccentricity in Electrical Machines. IET Electr. Power Appl. 2010, 4, 259–266. [Google Scholar] [CrossRef]
- Kifune, H.; Zadhe, M.K.; Sasaki, H. Efficiency Estimation of Synchronous Generators for Marine Applications and Verification with Shop Trial Data and Real Ship Operation Data. IEEE Access 2020, 8, 195541–195550. [Google Scholar] [CrossRef]
- Lu, B.; Habetler, T.G.; Harley, R.G. A Nonintrusive and In-Service Motor-Efficiency Estimation Method Using Air-Gap Torque with Considerations of Condition Monitoring. IEEE Trans. Ind. Appl. 2008, 44, 1666–1674. [Google Scholar] [CrossRef]
- Gokasan, M.; Bogosyan, S.; Goering, D.J. Sliding Mode Based Powertrain Control for Efficiency Improvement in Series Hybrid-Electric Vehicles. IEEE Trans. Power Electron. 2006, 21, 779–790. [Google Scholar] [CrossRef] [Green Version]
- Mirahki, H.; Moallem, M.; Rahimi, S.A. Design Optimization of IPMSM for 42 V Integrated Starter Alternator Using Lumped Parameter Model and Genetic Algorithms. IEEE Trans. Magn. 2014, 50, 114–119. [Google Scholar] [CrossRef]
- Urase, K.; Yabu, N.; Kiyota, K.; Sugimoto, H.; Chiba, A.; Takemoto, M.; Ogasawara, S.; Hoshi, N. Energy Efficiency of SR and IPM Generators for Hybrid Electric Vehicle. IEEE Trans. Ind. Appl. 2015, 51, 2874–2883. [Google Scholar] [CrossRef]
- Al-Adsani, A.S.; Beik, O. Design of a Multiphase Hybrid Permanent Magnet Generator for Series Hybrid EV. IEEE Trans. Energy Convers. 2018, 33, 1499–1507. [Google Scholar] [CrossRef]
- Liu, Y.; Zhang, Y.; Xu, W.; Zhang, M.; Pan, W.; Rodriguez, J.; Boldea, I. Improved Efficiency Optimization Control for Brushless Doubly Fed Induction Generator–DC System by Regulating Stator Frequency. IEEE Trans. Power Electron. 2023, 38, 3624–3639. [Google Scholar] [CrossRef]
- Grachev, P.Y.; Tabachinskiy, A.S.; Kanagavel, P. New Stator Construction and Simulation of High-Efficiency Wind Turbine Generators. IEEE Trans. Ind. Appl. 2020, 56, 1389–1396. [Google Scholar] [CrossRef]
- Bonthu, S.S.R.; Choi, S.; Baek, J. Design Optimization with Multiphysics Analysis on External Rotor Permanent Magnet-Assisted Synchronous Reluctance Motors. IEEE Trans. Energy Convers. 2018, 33, 290–298. [Google Scholar] [CrossRef]
- Wan, S.T.; He, Y.L.; Tang, G.J.; Li, Y.G. Analysis on Stator Circulating Current Characteristics under Eccentricity Faults of Turbo-Generator. High Volt. Eng. 2010, 36, 1547–1553. [Google Scholar]
- Gao, J.; Dai, L.; Zhang, W.; Huang, S.; Wu, X. Multi-Interval Efficiency Design Optimization for Permanent Magnet Synchronous Generators Used in Hybrid Electric Special Vehicles. IEEE Trans. Ind. Electron. 2021, 68, 4646–4656. [Google Scholar] [CrossRef]
- Zarko, D. A Systematic Approach to Optimized Design of Permanent Magnet Motors with Reduced Torque Pulsations. Ph.D. Thesis, The University of Wisconsin—Madison, Madison, WI, USA, 2004. [Google Scholar]
- Ristanovic, D.; Taher, M.; Bhatia, N. Turbo-Expander Generators for Supplemental Power Generation in LNG Liquefaction Plants. IEEE Trans. Ind. Appl. 2020, 56, 6094–6103. [Google Scholar] [CrossRef]


| Parameters | Values | Parameters | Values |
|---|---|---|---|
| rated power | 5 kVA | stator core length | 130 mm |
| rated excitation current | 7.9 A | stator coil turns per slot | 22 |
| pole-pairs | 1 | rotor virtual slots | 24 |
| rated power factor | 0.8 | rotor actual slots | 16 |
| air-gap length | 1.2 mm | rotor outer diameter | 142.6 mm |
| stator slots | 36 | rotor inner diameter | 40 mm |
| stator outer diameter | 250.5 mm | rotor coil turns per slot | 60 |
| stator inner diameter | 145 mm | internal power factor | 0.62 |
Disclaimer/Publisher’s Note: The statements, opinions and data contained in all publications are solely those of the individual author(s) and contributor(s) and not of MDPI and/or the editor(s). MDPI and/or the editor(s) disclaim responsibility for any injury to people or property resulting from any ideas, methods, instructions or products referred to in the content. |
© 2023 by the authors. Licensee MDPI, Basel, Switzerland. This article is an open access article distributed under the terms and conditions of the Creative Commons Attribution (CC BY) license (https://creativecommons.org/licenses/by/4.0/).
Share and Cite
He, Y.-L.; Tang, L.; Sun, K.; Zhang, W.-H.; Wu, X.-W.; Wang, H.-P. Impact of Static Air-Gap Eccentricity Fault on Synchronous Generator Efficiency. Energies 2023, 16, 3294. https://doi.org/10.3390/en16073294
He Y-L, Tang L, Sun K, Zhang W-H, Wu X-W, Wang H-P. Impact of Static Air-Gap Eccentricity Fault on Synchronous Generator Efficiency. Energies. 2023; 16(7):3294. https://doi.org/10.3390/en16073294
Chicago/Turabian StyleHe, Yu-Ling, Ling Tang, Kai Sun, Wen-Hao Zhang, Xue-Wei Wu, and Hai-Peng Wang. 2023. "Impact of Static Air-Gap Eccentricity Fault on Synchronous Generator Efficiency" Energies 16, no. 7: 3294. https://doi.org/10.3390/en16073294