Article

Multiple Load Forecasting of Integrated Energy System Based on Sequential-Parallel Hybrid Ensemble Learning

1
College of Electrical Engineering and New Energy, China Three Gorges University, Yichang 443002, China
2
Hubei Key Laboratory of Cascaded Hydropower Stations Operation and Control, China Three Gorges University, Yichang 443002, China
3
Hubei Electric Power Co., Ltd., Xiaogan Power Supply Company, Xiaogan 432000, China
*
Author to whom correspondence should be addressed.
Energies 2023, 16(7), 3268; https://doi.org/10.3390/en16073268
Submission received: 19 February 2023 / Revised: 29 March 2023 / Accepted: 2 April 2023 / Published: 6 April 2023
(This article belongs to the Special Issue Advanced Optimization and Forecasting Methods in Power Engineering)

Abstract

:
Accurate multivariate load forecasting plays an important role in the planning management and safe operation of integrated energy systems. In order to simultaneously reduce the prediction bias and variance, a hybrid ensemble learning method for load forecasting of an integrated energy system combining sequential ensemble learning and parallel ensemble learning is proposed. Firstly, the load correlation and the maximum information coefficient (MIC) are used for feature selection. Then the base learner uses the Boost algorithm of sequential ensemble learning and uses the Bagging algorithm of parallel ensemble learning for hybrid ensemble learning prediction. The grid search algorithm (GS) performs hyper-parameter optimization of hybrid ensemble learning. The comparative analysis of the example verification shows that compared with different types of single ensemble learning, hybrid ensemble learning can better balance the bias and variance and accurately predict multiple loads such as electricity, cold, and heat in the integrated energy system.

1. Introduction

Integrated Energy System (IES) is a system that closely combines various types of energy to realize energy production, transmission, storage, and use, providing users with services such as power supply, heating, and cooling. It plays an important role in improving energy efficiency, reducing carbon emissions, and increasing the penetration of renewable energy [1,2]. The traditional energy system load forecasting only needs to consider one load, while the IES multi-load forecasting needs to consider various loads such as electricity, cold, heat, and gas, and the difficulty of forecasting also increases. IES multivariate load forecasting is an important basis for energy management and optimal scheduling of integrated energy systems, which puts forward higher requirements for the accuracy and reliability of forecasting [3].

1.1. Related Work

In recent years, the field of load forecasting has been widely studied by scholars, mainly using three research methods: deep learning method, single machine learning algorithm, and integrated learning algorithm. Deep learning is a multi-layer neural network: a machine learning method. In terms of deep learning, Ref. [4] proposed a load forecasting model based on Convolutional Neural Network (CNN) combined with a Bidirectional Long Short-Term Memory (BiLSTM) neural network. The example of an integrated energy system verifies that it has an excellent performance in terms of calculation time and prediction accuracy. On the basis of ensemble learning, Ref. [5] proposed a power load forecasting model based on BP neural network, support vector regression, random forest, and gradient boosting decision tree. Through the experimental data verification of the Tempe campus of Arizona State University, the accuracy of power load forecasting of integrated energy systems can be improved. In Ref. [6], a load forecasting model based on a convolutional neural network (CNN) and long short-term memory (LSTM) is proposed. The results show that the CNN-LSTM model proposed in this paper has higher prediction accuracy. In terms of a single machine learning algorithm, Ref. [7] proposed the application of a support vector machine (SVM) for real-time power load forecasting, which improved the accuracy of prediction. Ref. [8] proposed a power load forecasting model based on a decision tree algorithm, which reduced the operation risk value of the system. Refs. [9,10] proposed a multivariate load forecasting model based on long short-term memory (LSTM) neural network. Since the above uses a single machine learning algorithm, the single algorithm mechanism weakens the prediction generalization performance, and the prediction result accuracy is not high. In terms of ensemble learning algorithms, ensemble learning can learn from others‘ strengths and combine the advantages of different prediction methods to improve the generalization performance of the algorithm. Ensemble learning includes sequential integration and parallel integration. In terms of sequential integration, the AdaBoost algorithm is proposed in Ref. [11] to predict the load of the station area, and higher prediction accuracy is obtained. Ref. [12] used the XGBoost algorithm for short-term load forecasting, which further improved the prediction accuracy. Ref. [13] proposed the GBDT algorithm for load forecasting and achieved good prediction results. In terms of parallel integration, Ref. [14] proposed a heterogeneous integrated Stacking ensemble learning method, which gave full play to the advantages of the model itself and achieved higher prediction accuracy. Ref. [15] proposed an improved Bagging algorithm (RF) for load forecasting and achieved good results. However, the above literature only uses a single sequential integration or parallel integration. Because different integration methods have different effects on the generalization error, it is impossible to reduce the prediction bias and variance at the same time [16]. Based on the Extreme Gradient Boosting (XGBoost) algorithm, Ref. [17] introduces the idea of Bagging to establish the extreme weather identification and short-term load forecasting model of the Bagging-XGBoost algorithm. In this paper, the Bagging-XGBoost model is applied to the field of multi-load forecasting of integrated energy systems. The maximal information coefficient method is introduced to analyze the correlation between meteorological factors and electric, cooling, and hot loads. The grid search method is used to optimize the parameters of the XGBoost model, which can effectively improve the prediction accuracy of the model proposed in this paper.
By introducing the work of previous researchers, the current research in the field of integrated energy system load forecasting is still insufficient. The deficiencies are summarized as follows:
(1) Although deep learning is widely used in the field of integrated energy load forecasting and many researchers are studying deep learning methods, the network structure of deep learning method is more complex, and the model training often requires a lot of historical data as the basis. The operation is also more time-consuming and the hidden layer and the number of nodes in the model architecture are easily over-fitted. These characteristics limit its further play a huge role in load forecasting.
(2) The above part of the literature uses a single machine learning algorithm, such as a support vector machine (SVM) and decision tree. The single algorithm mechanism makes the prediction generalization performance weak, and the prediction accuracy is not high. Other literature only uses a single serial or parallel integration. Because different integration methods have different effects on generalization errors, they cannot reduce prediction bias and variance at the same time.
(3) Most of the existing integrated energy system load forecasting studies use deep learning algorithms, and ensemble learning does not seem to be the focus of researchers. It is still necessary to analyze the sensitivity of the ensemble learning method to generalization error and its application in load forecasting.
In order to further exert the advantages of ensemble learning, this paper proposes a hybrid ensemble learning method for load forecasting of integrated energy systems combining sequential ensemble learning and parallel ensemble learning. Firstly, on the basis of feature selection by IES, the prediction bias and variance of prediction are comprehensively considered. Secondly, the sequential integration uses the XGBoost algorithm as the base learner and then uses the Bagging method for parallel integration to construct a hybrid ensemble learning IES load forecasting model. Then, the grid search method is used to optimize the parameters. Finally, a numerical example is used to verify the effectiveness of the model in IES multivariate load forecasting.

1.2. Contributions

The main contributions of this paper are reflected in the following four aspects:
(1) Previous scholars have studied the application of many ensemble learning methods in load forecasting of the single energy system, while the application in multi-load forecasting of the integrated energy system is not very common. This paper verifies that the ensemble learning method also has good performance in load forecasting of the integrated energy system, which reflects the effectiveness and applicability of ensemble learning in different forecasting scenarios.
(2) This paper proposes a combination model based on the serial ensemble learning method (XGBoost) and parallel ensemble learning method (Bagging). This model can effectively combine the two ensemble learning methods, give full play to their respective advantages, improve the stability of the model and enhance the generalization ability of the model.
(3) The maximum information coefficient (MIC) method is proposed. This method defines the maximum information coefficient between two variables through mutual information and deeply excavates the complex coupling relationship between the two variables. It can measure the correlation between electric load and cooling load, electric load and heating load, and cooling load and heating load. Finally, the feature selection of input variables is carried out.
(4) Through the integrated energy system data set of the Tempe campus of Arizona State University, the effectiveness of the proposed model is verified compared with the deep learning method and the single integration method, which can well balance the prediction accuracy and calculation time.
The contents of this paper are as follows: The second section introduces two different ensemble learning methods and analyzes the bias and variance in the generalization error. The third section proposes the maximum information coefficient (MIC) method and the sequential-parallel integrated learning model. In the fourth section, the performance evaluation index is used to evaluate the proposed model, which verifies its effectiveness of the proposed model. The last section is the conclusion and future work plan.

2. Sequential-Parallel Hybrid Ensemble Learning

2.1. Ensemble Learning

Ensemble learning is formed by multiple base learners through a certain combination strategy. According to the generation method of the base learner, ensemble learning is divided into two categories. The base learner is sequentially generated and has a strong dependence on sequential integration. Parallel integration is one where there is no strong dependency between base learners. The base learner of the sequential ensemble is generally homogeneous, the typical algorithm is the Boosting series algorithm based on a decision tree, and the typical parallel ensemble is a Bagging series algorithm.

2.1.1. Typical Sequential Ensemble Learning Methods

Boosting is a class of algorithms that can upgrade weak learners to strong learners. XGBoost is one of the most representative algorithms in the Boosting series. XGBoost is based on the traditional Gradient Boosting Decision Tree (GBDT) [18]. XGBoost not only supports the CART regression tree but also supports linear classifier. At the same time, XGBoost adds regular terms to the objective function to avoid the overfitting of the model, and the second-order Taylor expansion of the loss function makes it more effective in solving the optimal solution.
XGBoost is a linear addition model, and K CART trees are constructed by incremental learning. The algorithm flow is shown in Figure 1. Suppose a given data set D = x i , y i , the mathematical model is as follows:
y = Φ x = k = 1 K f k x i , f k F
where f k is the CART tree, x i is the feature vector of the i t h data, and F is the hypothesis space. There are:
F = f x = ω q x q : R m T , ω R T
In the formula: ω represents the score of the leaf node; q x denotes the assignment of sample x to leaf nodes; ω q ( x ) represents the predicted value of the sample; T is the number of leaf nodes, which is used to represent the complexity of the tree.
The objective function of XGBoost is as follows:
L Φ = i l y i ^ , y i + k Ω f k
The right side is divided into two parts. The first part is the general loss function, which represents the empirical risk minimization. The second part is the regularization term, which represents structural risk minimization.

2.1.2. Typical Parallel Ensemble Learning Methods

Bagging is a typical representative of parallel ensemble learning algorithms. It uses a self-help sampling method to generate different base classifiers [19]. The algorithm process is shown in Figure 2. The Bagging algorithm is divided into two steps.
The first step of sampling uses random sampling with a putback to expand the data set; The second step uses the voting combination method to integrate each sub-model.

2.2. Prediction Generalization Error

For the prediction problem, the error result of the prediction model for unknown data is called generalization error, which includes the following three parts: Bias, Variance, and Noise [20].
Bias refers to the gap between the expectation of the predicted value and the real value, which reflects the fitting ability of the learning algorithm. The larger the bias is, the more the predicted value deviates from the real data. The variance describes the range or dispersion of the predicted value, the distance from the expected value, which shows the impact of data disturbance. The larger the variance, the more dispersed the data distribution. Noise is affected by factors other than the algorithm, and data quality determines the upper limit of learning. Figure 3 shows the distribution of bias and variance with a prediction as an example. It can be seen that the predicted value falling in the red area of the target center is the ideal effect of multiple predictions, which is reflected in low bias and low variance.
The XGBoost algorithm uses the residual of the weak classifier as the input of the next classifier during training, which makes the bias gradually decrease. The strong correlation between the base learners of the XGBoost algorithm does not significantly reduce the variance. The Bagging algorithm can significantly reduce the variance, randomly sample from the original training data, train each base learner separately and calculate the average. This parallel set method effectively reduces the variance and avoids the over-fitting effect of the model, thereby improving the generalization performance of the model. The comparison between sequential and parallel integration algorithms is shown in Table 1.

3. Analysis of Load Forecasting Model Based on Sequential-Parallel Hybrid Ensemble Learning

3.1. Sequential-Parallel Hybrid Ensemble Learning

XGBoost-Bagging hybrid ensemble learning is based on a decision tree, using random sampling, applying XGBoost method to train each sub-sample set respectively, and then using the mean voting strategy to combine the results of load forecasting of each XGBoost model. The XGBoost-Bagging hybrid ensemble learning method gives full play to the advantages of sequential and parallel models, and the hybrid ensemble model is more stable and has better generalization performance. The hybrid ensemble learning structure based on XGBoost-Bagging is shown in Figure 4.

3.2. Maximal Information Coefficient

MIC is used to measure the linear or nonlinear relationship between two variables, X and Y [21], which has the advantages of high robustness, wide application range, and low complexity. The MIC range is between 0 and 1, and the higher the value, the stronger the correlation. The calculation formula is:
M I C X ; Y = max X Y < B I X ; Y log 2 min X , Y

3.3. IES Model Framework Based on Sequential-Parallel Hybrid Ensemble Learning

The process of the overall framework of IES multiple load forecasting is shown in Figure 5.
Step 1: Use the MIC method to analyze the correlation between multi-load and meteorological factors, calendar rules, and other characteristics, and screen out the characteristics with a strong correlation with each load.
Step 2: The grid search method is used to optimize the four hyperparameters in the XGBoost algorithm. The four hyperparameters are the maximum depth of the tree (max _depth), the number of trees (n _estimators), the learning rate and the minimum loss value of node splitting (gamma), and the optimal hyperparameter set of the XGBoost algorithm are obtained.
Step 3: The Bagging algorithm uses random sampling with a putback to form training samples.
Step 4: Train the corresponding XGBoost model for each training subset.
Step 5: For the load forecasting results of each sequential training, the mean vote is used to combine the forecasting results of each model to obtain the final forecasting outcome.

4. Example Analysis

The example is the IES power, heat, and cooling load data of Arizona State University from 1 January 2021 to 31 December 2021 [22], and their units are kW, mmBTU, and tons. The sampling interval of the data set selected is 1 h. The load data is derived from the CAMPUS METABOLISM database of the school, and the meteorological data is obtained through the website of the National Renewable Energy Laboratory of the United States. In this paper, the data set is divided into a training set, verification set, and test set according to 6:2:2, and the related programming and calculation are realized by Python3.7.
By analyzing Figure 6, Figure 7 and Figure 8, it can be seen that the electric load is positively correlated with the cooling load, the electric load is negatively correlated with the heat load, and the cooling load is negatively correlated with the heat load. This shows that in the integrated energy system, the three loads of electricity, heat, and cooling are closely related and have a complex coupling relationship. In load forecasting, not only one load is considered, but the three loads should be considered at the same time so as to ensure the accuracy of the forecasting results.

4.1. Evaluating Indicator

In order to better verify the prediction performance of the model proposed in this paper, Mean Absolute Error (MAE), Root Mean Square Error (RMSE), and Mean Absolute Percentage Error (MAPE) are selected as evaluation indicators. Among them, MAE can better reflect the actual situation of the predicted value error, which is used to measure the variance between the predicted value and the true value; RMSE describes a degree of dispersion, which is used to measure the bias between the predicted value and the true value; MAPE depicts the overall level of the model. The detailed expression of the error-index is shown in Table 2.

4.2. Correlation Analysis Based on MIC

IES is an energy balance system with electric energy as the core, which can realize the multi-energy complementarity of electricity, heat, cooling, and gas. There are different forms of mutual conversion between different loads, indicating that there is a coupling relationship between multiple loads. Multivariate load forecasting first needs to determine the reasonable characteristic quantities corresponding to different types of loads, that is, to determine the dependent variables through correlation analysis. The MIC method is used to analyze the annual IES data and weather data of the Tempe campus of Arizona State University in the United States. The calculation results are shown in Table 3.
In the integrated energy system, as shown in Figure 9, the correlation between cooling load and heat load is the strongest, and the correlation coefficient reaches 0.726. The correlation between cooling load and electric load and the correlation between heat load and electric load is relatively weak, and the correlation coefficients are 0.481 and 0.413, respectively. From the perspective of meteorological factors, the cooling and heat loads are strongly correlated with temperature, and the correlation coefficients reach 0.853 and 0.653. The correlation between cooling load and pressure, and relative humidity is strong, and the correlation coefficients reach 0.328 and 0.315. The correlation coefficients between heat load and pressure, and rainfall also reached 0.363 and 0.315. The correlation between electric load and other meteorological indexes, except temperature, is weak.
In summary, there are both strong correlations and weak correlations between multiple loads, and the correlation between multiple loads and meteorological factors is not exactly the same. Electric load is strongly correlated with heat load, cooling load, and temperature. Cooling load is strongly correlated with electric load, heat load, pressure, temperature, and relative humidity. Heat load is strongly correlated with electric load, cooling load, pressure, temperature, and rainfall. Therefore, the influencing factors with a correlation coefficient greater than 0.3 (strong correlation) are selected as input features to train the model. The main influencing factors are shown in Figure 10.

4.3. XGBoost Parameter Tuning

Due to the differences between IES multi-loads, different parameters need to be selected for different load types. Based on the training data set, the four hyperparameters in the XGBoost model are optimized by using the grid search method [23] combined with cross validation. After several debugging, the setting of hyperparameters is shown in Table 4.

4.4. Comparative Analysis of Prediction Results

4.4.1. Comparison of Single Load Forecasting and Multiple Load Forecasting

In order to verify that the MIC method has obvious advantages in improving the results of multiple load forecasting by analyzing the strong and weak correlation between multiple loads and between multiple loads and meteorological factors, the results of single load forecasting and electric cooling and heating multiple load forecasting are compared. The comparison results are shown in Table 5.
Because the multi-load forecasting takes into account the coupling characteristics of the interaction between multi-loads, the prediction errors of electric load, cooling load, and heat load of multi-load forecasting are reduced by 17.9%, 10.5%, and 12.9%, respectively. There is a strong correlation between the electric cooling and heating loads, which reflects the superiority of MIC in analyzing the coupling of multiple loads.

4.4.2. Comparison of Prediction Results of Different Models

In order to verify the effectiveness and reliability of the proposed method, the model is compared with the LSTM model of deep learning, the XGBoost model of single sequential integration of ensemble learning, the RF model of single parallel integration, and the Bagging-GBDT model of ensemble learning. The load forecasting results are shown in Figure 11, Figure 12, Figure 13, Figure 14, Figure 15 and Figure 16.
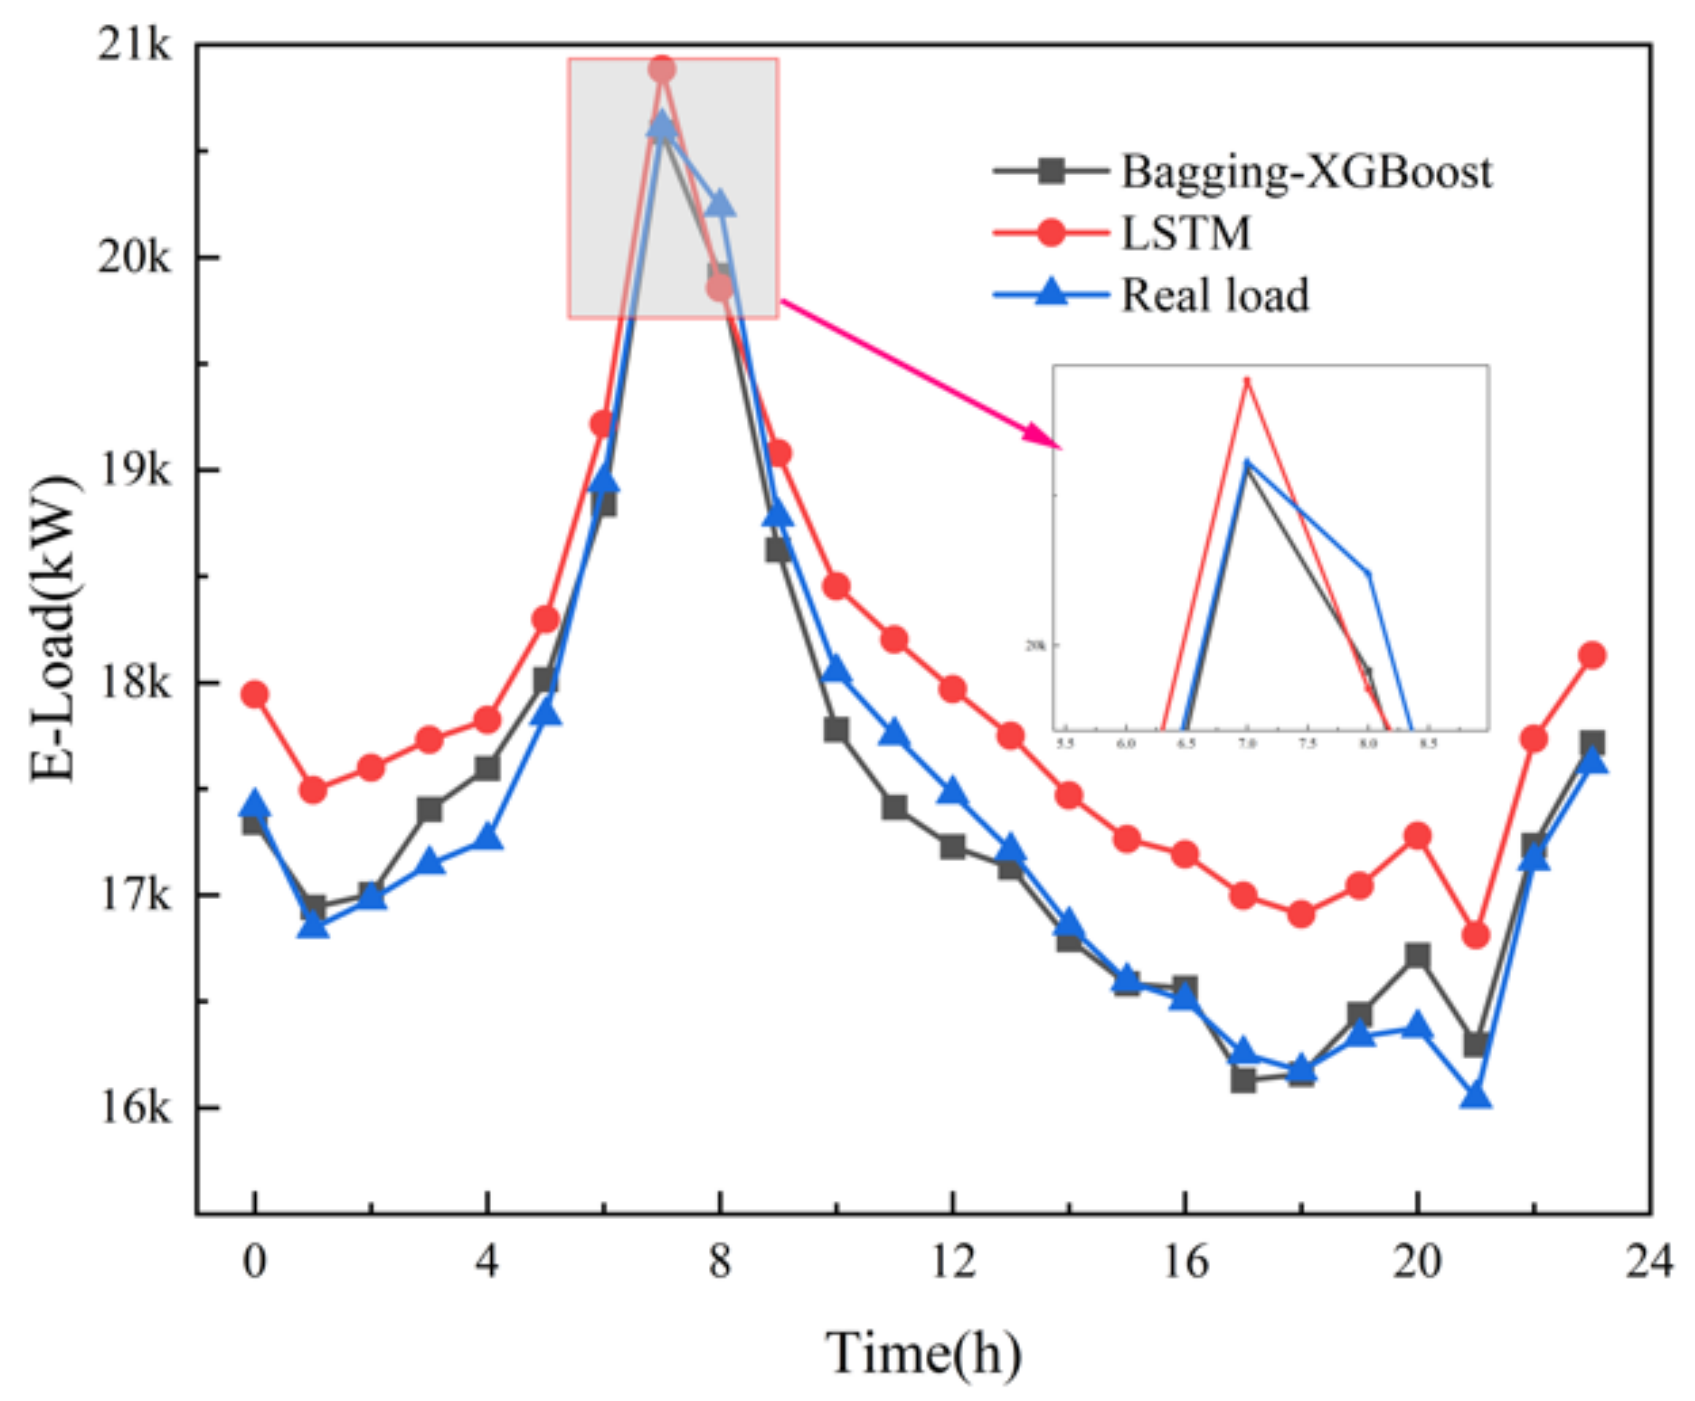
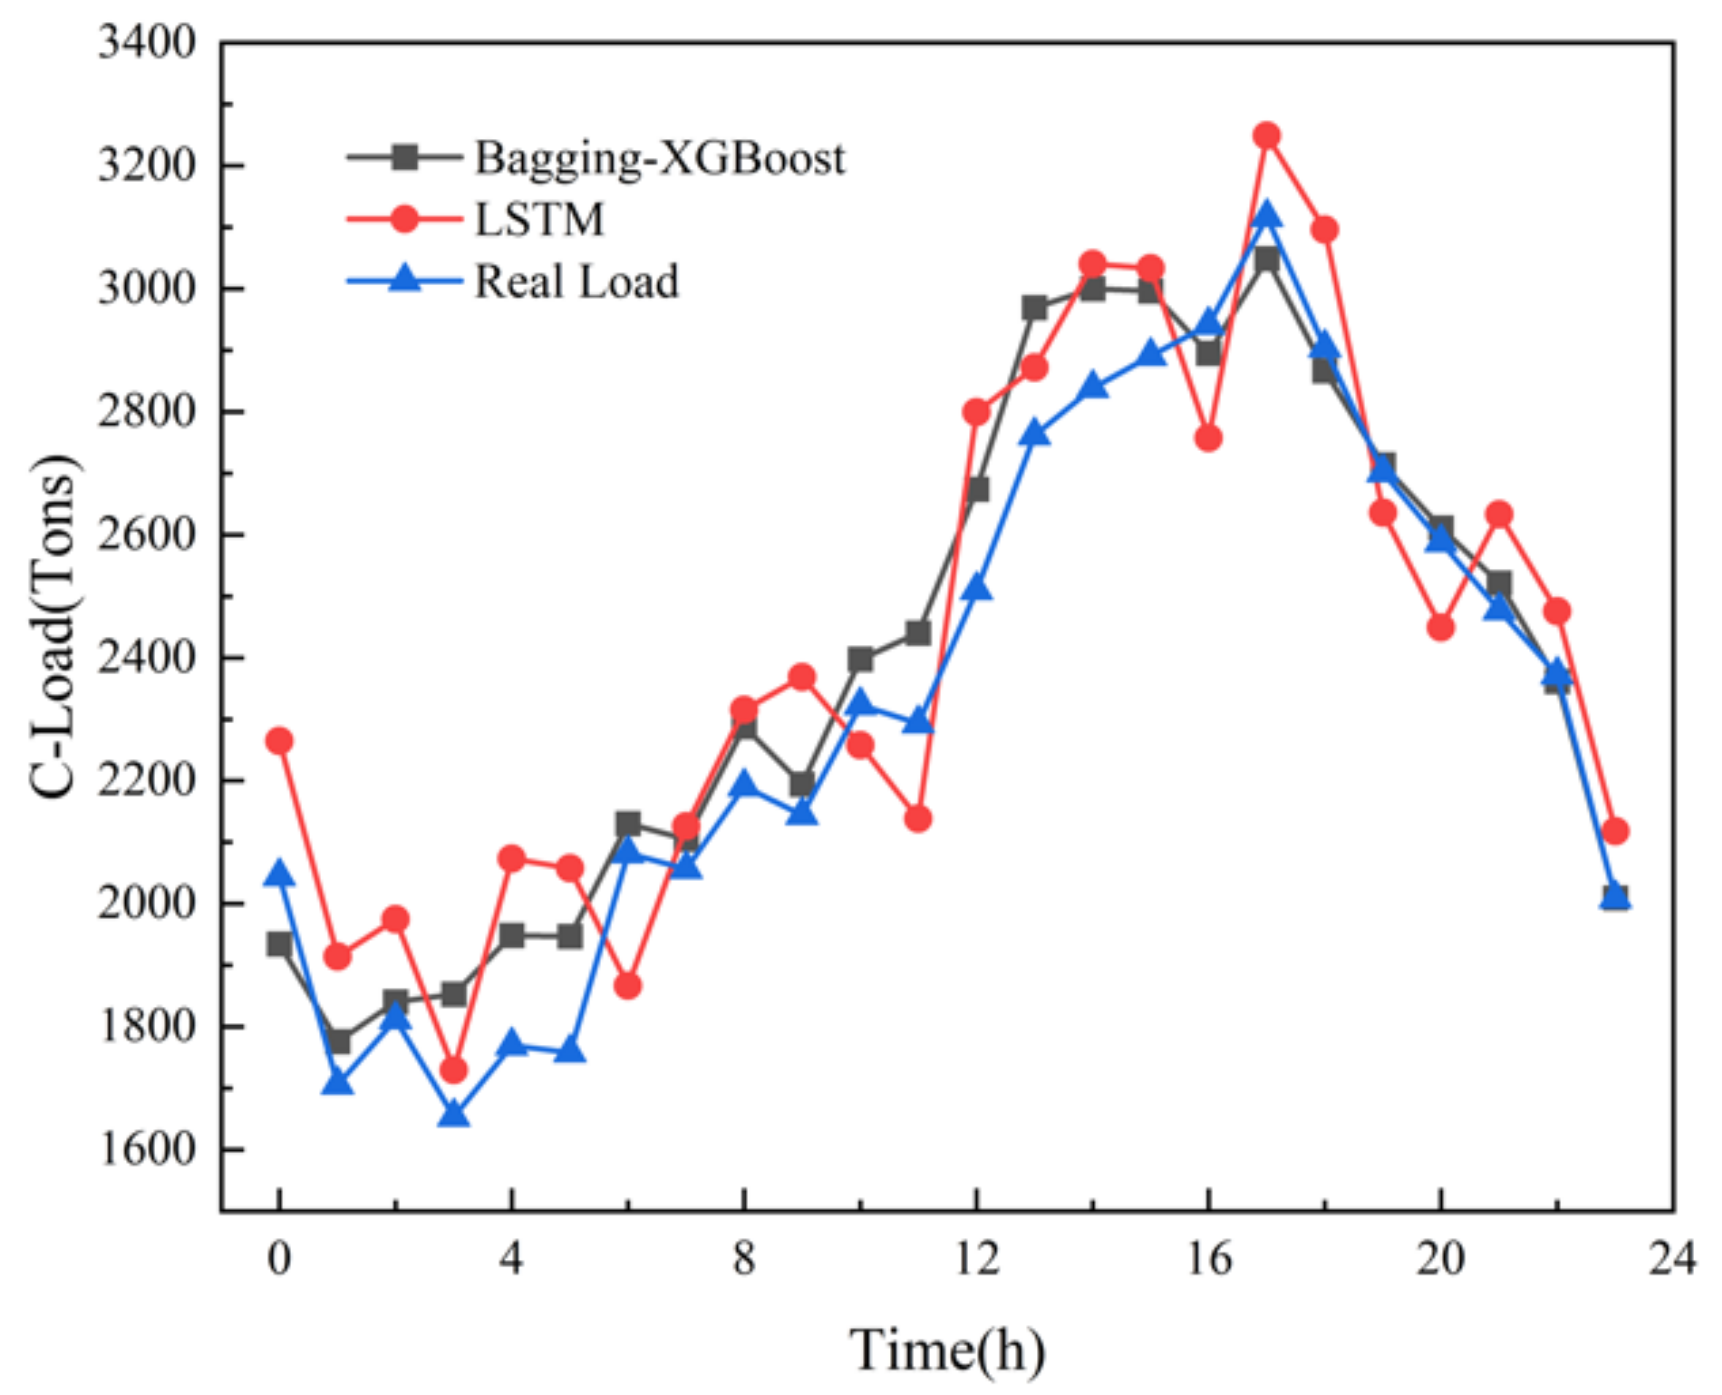
(1) Comparison between Bagging-XGBoost model and the LSTM model
The LSTM algorithm is called Long short-term memory, which was first proposed in 1997. It is a specific form of RNN (Recurrent neural network) and has been widely used in the field of multi-load forecasting of integrated energy systems. Electric, cooling and heat multivariate load forecasting is shown in the following figures.
From the comparison of load forecasting curves and load forecasting results, it can be seen that the prediction accuracy of Bagging-XGBoost model is higher than that of the LSTM model. From the results of electric load forecasting, the MAPE% value of the Bagging-XGBoost model is 1.169 lower than that of the LSTM model, the MAE value is reduced by 145.908, and the RMSE value is reduced by 153.666. Based on the prediction results of cooling load and heat load, the prediction performance index of the proposed model is better than that of the LSTM model.
The structure of the LSTM model itself is relatively complex and the training is time-consuming. In addition, the network structure characteristics determine that it cannot process data in parallel. Taking the electric load as an example, when the prediction step size is 24 h, the Bagging-XGBoost model takes 42.29 s, and the LSTM model takes 39.86 s. Although the LSTM model takes less time, the speed advantage is not particularly obvious. Considering the prediction accuracy and training time, the Bagging-XGBoost model better achieves a good balance between prediction accuracy and training time.
(2) Comparison of Bagging-XGBoost model with RF model and XGBoost model
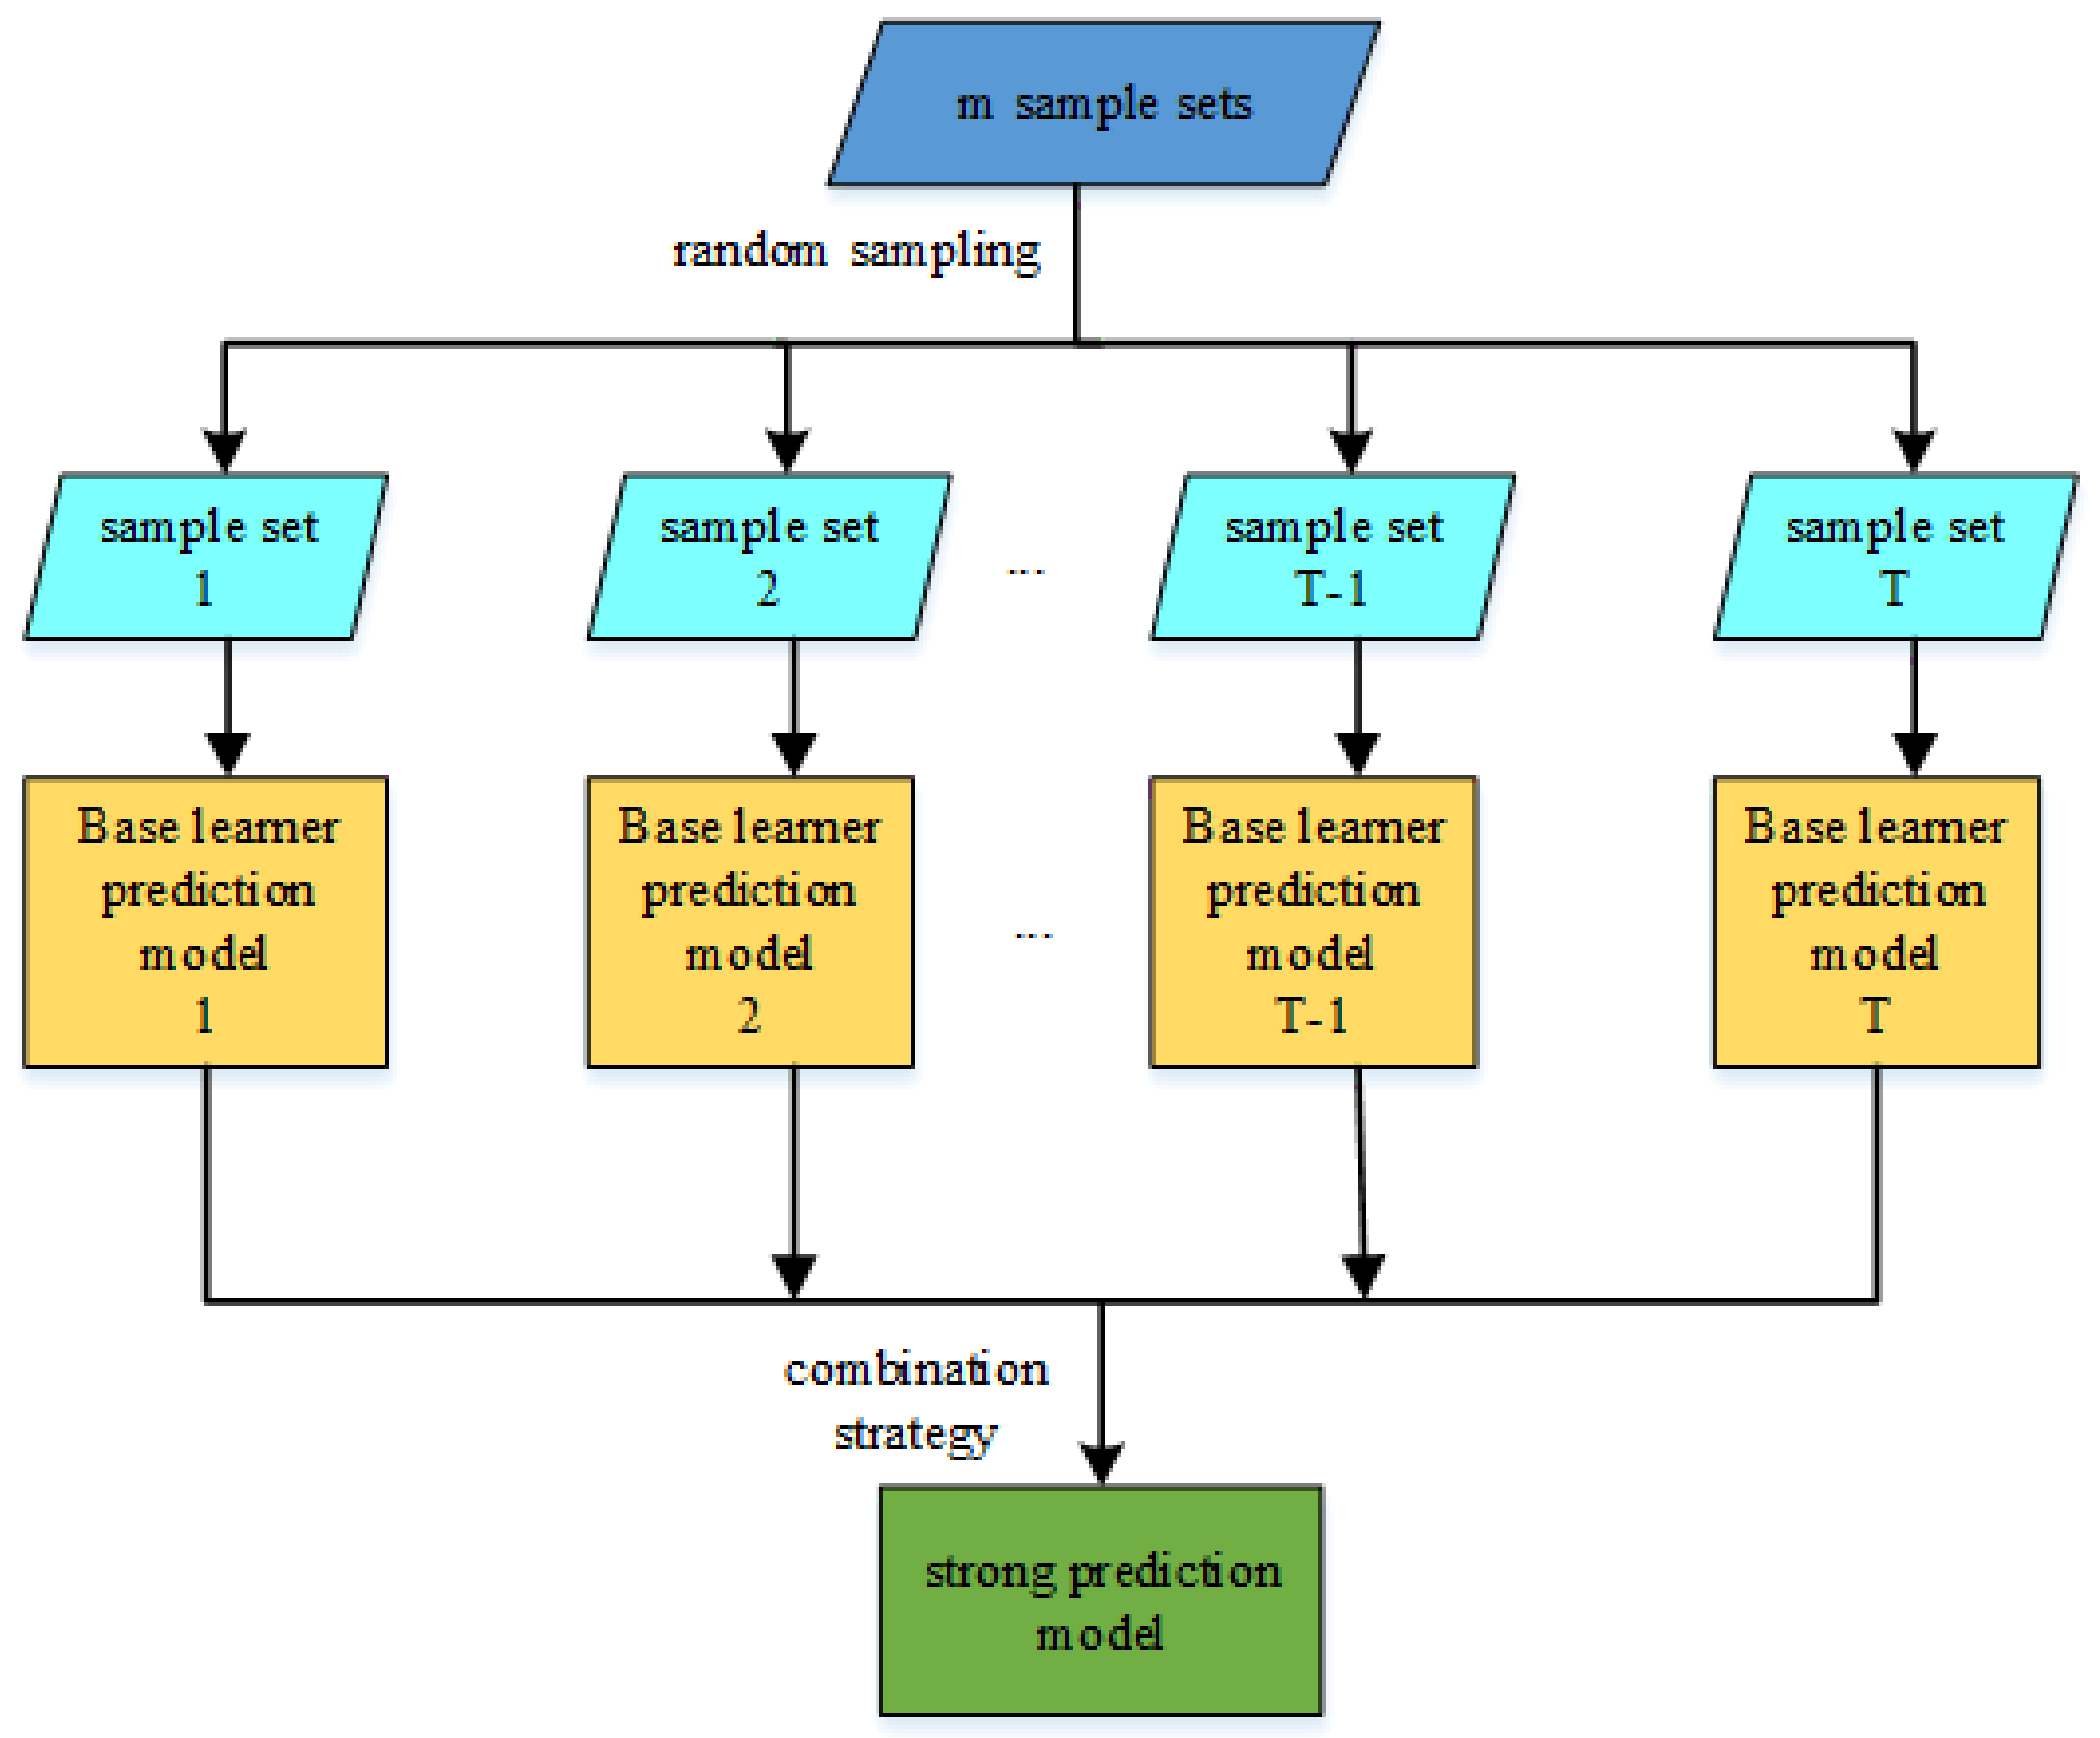
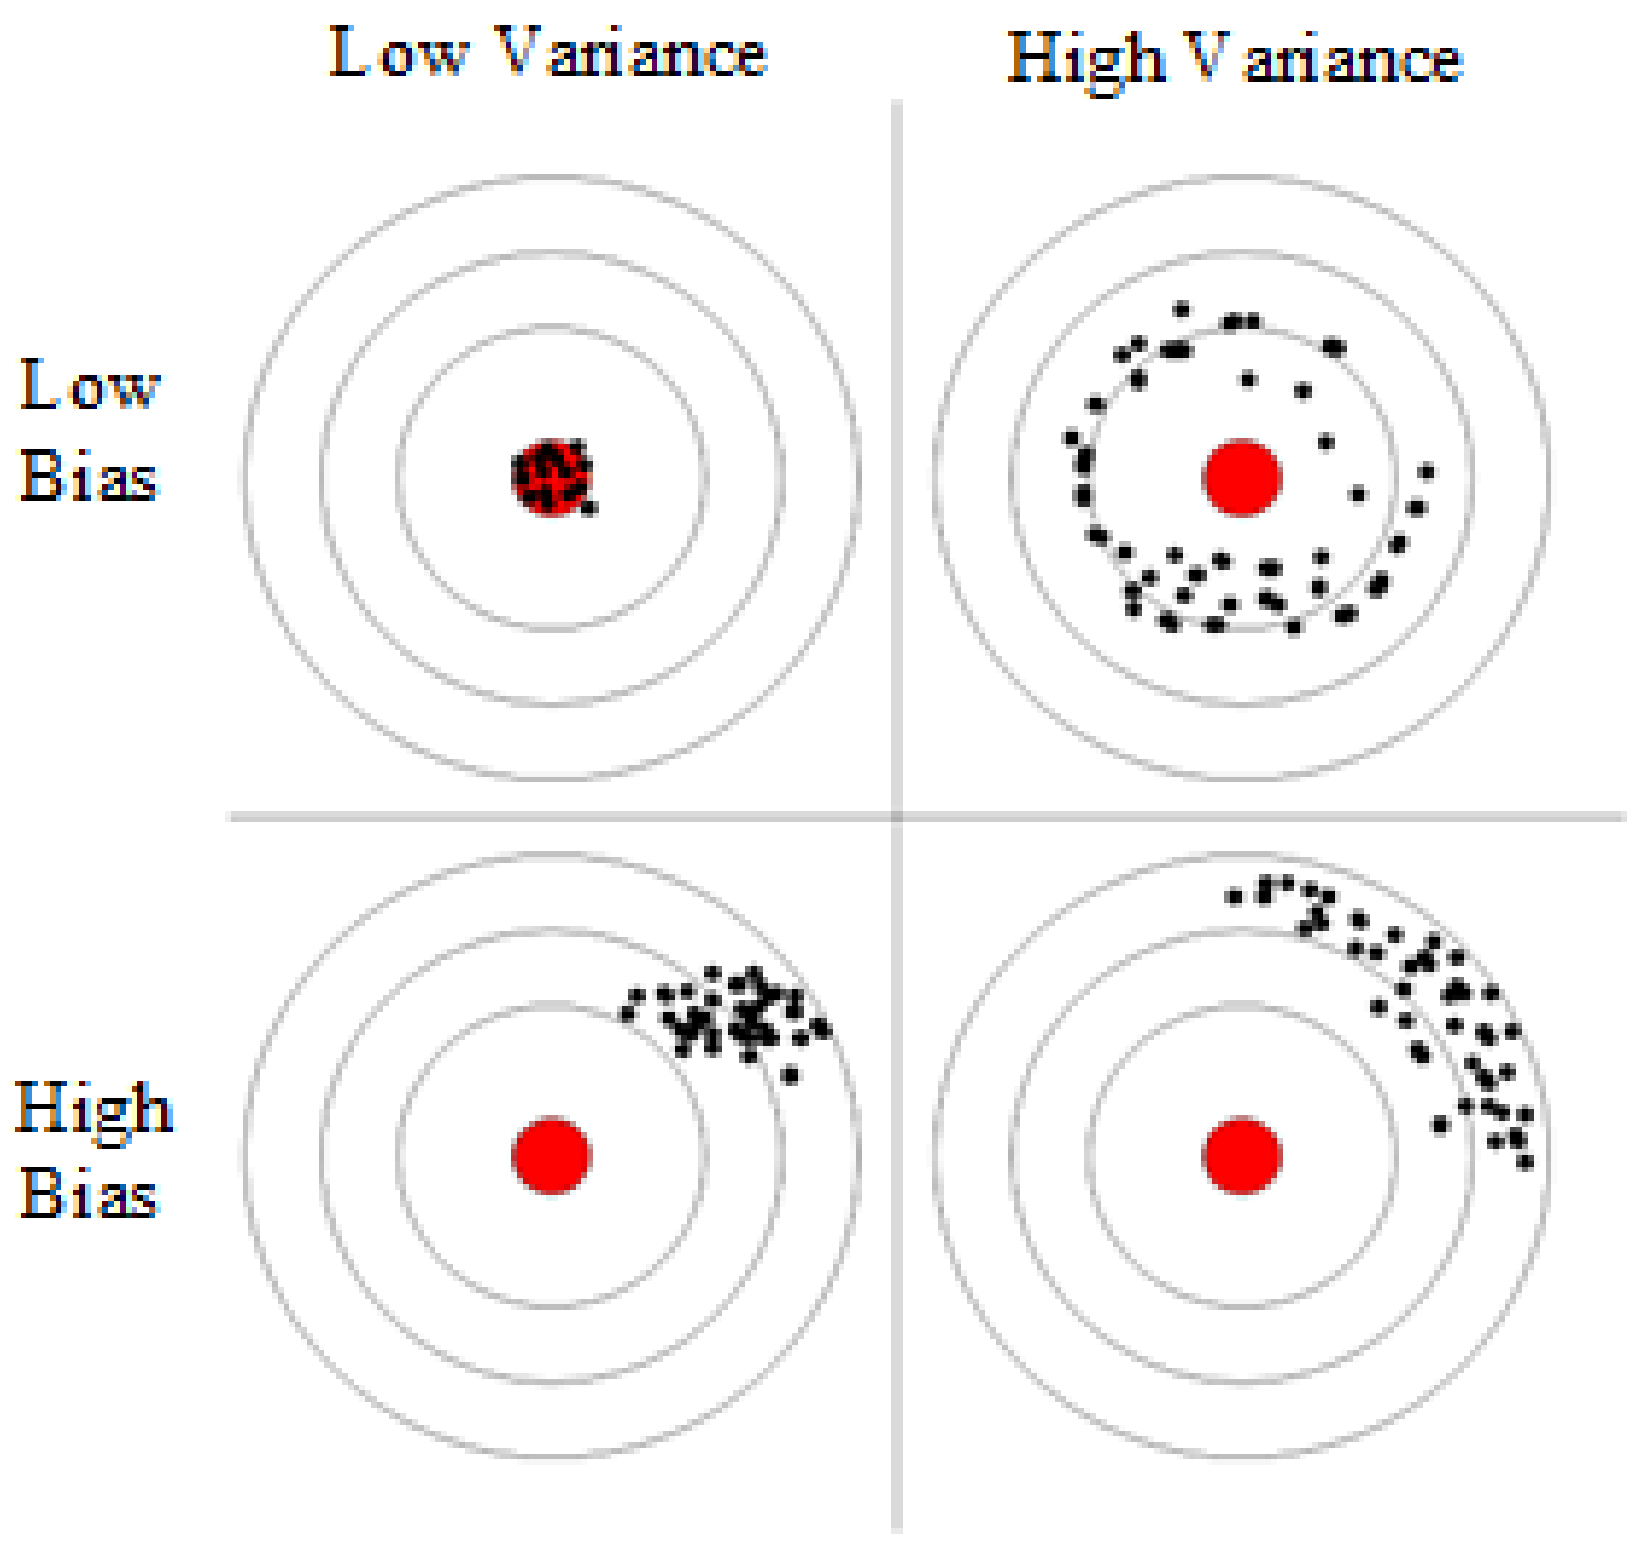
From the overall prediction results, it can be seen that the prediction accuracy of the sequential-parallel integration model (Bagging-XGBoost) is greatly improved compared with the sequential integration model (XGBoost) and parallel integration model (RF). Compared with the XGBoost model, the MAPE index of the electric, cooling, and heat load forecasting results of the Bagging-XGBoost model is reduced by 74.8%, 35.7%, and 57.7%, respectively. Compared with the RF model, it decreased by 86.9%, 66.8%, and 34.2%. From the perspective of bias and variance, the prediction results of the Bagging-XGBoost model also achieve the desired results. Taking the electrical load as an example, the MAE index and RMSE index of the Bagging-XGBoost model are reduced by 192.665 and 189.257 kW compared with the RF model. Compared with the XGBoost model, it is reduced by 148.747 and 215.342 kW. It can be seen that sequential-parallel hybrid ensemble learning can better balance bias and variance than single sequential ensemble learning or single parallel ensemble learning to achieve the best prediction results.
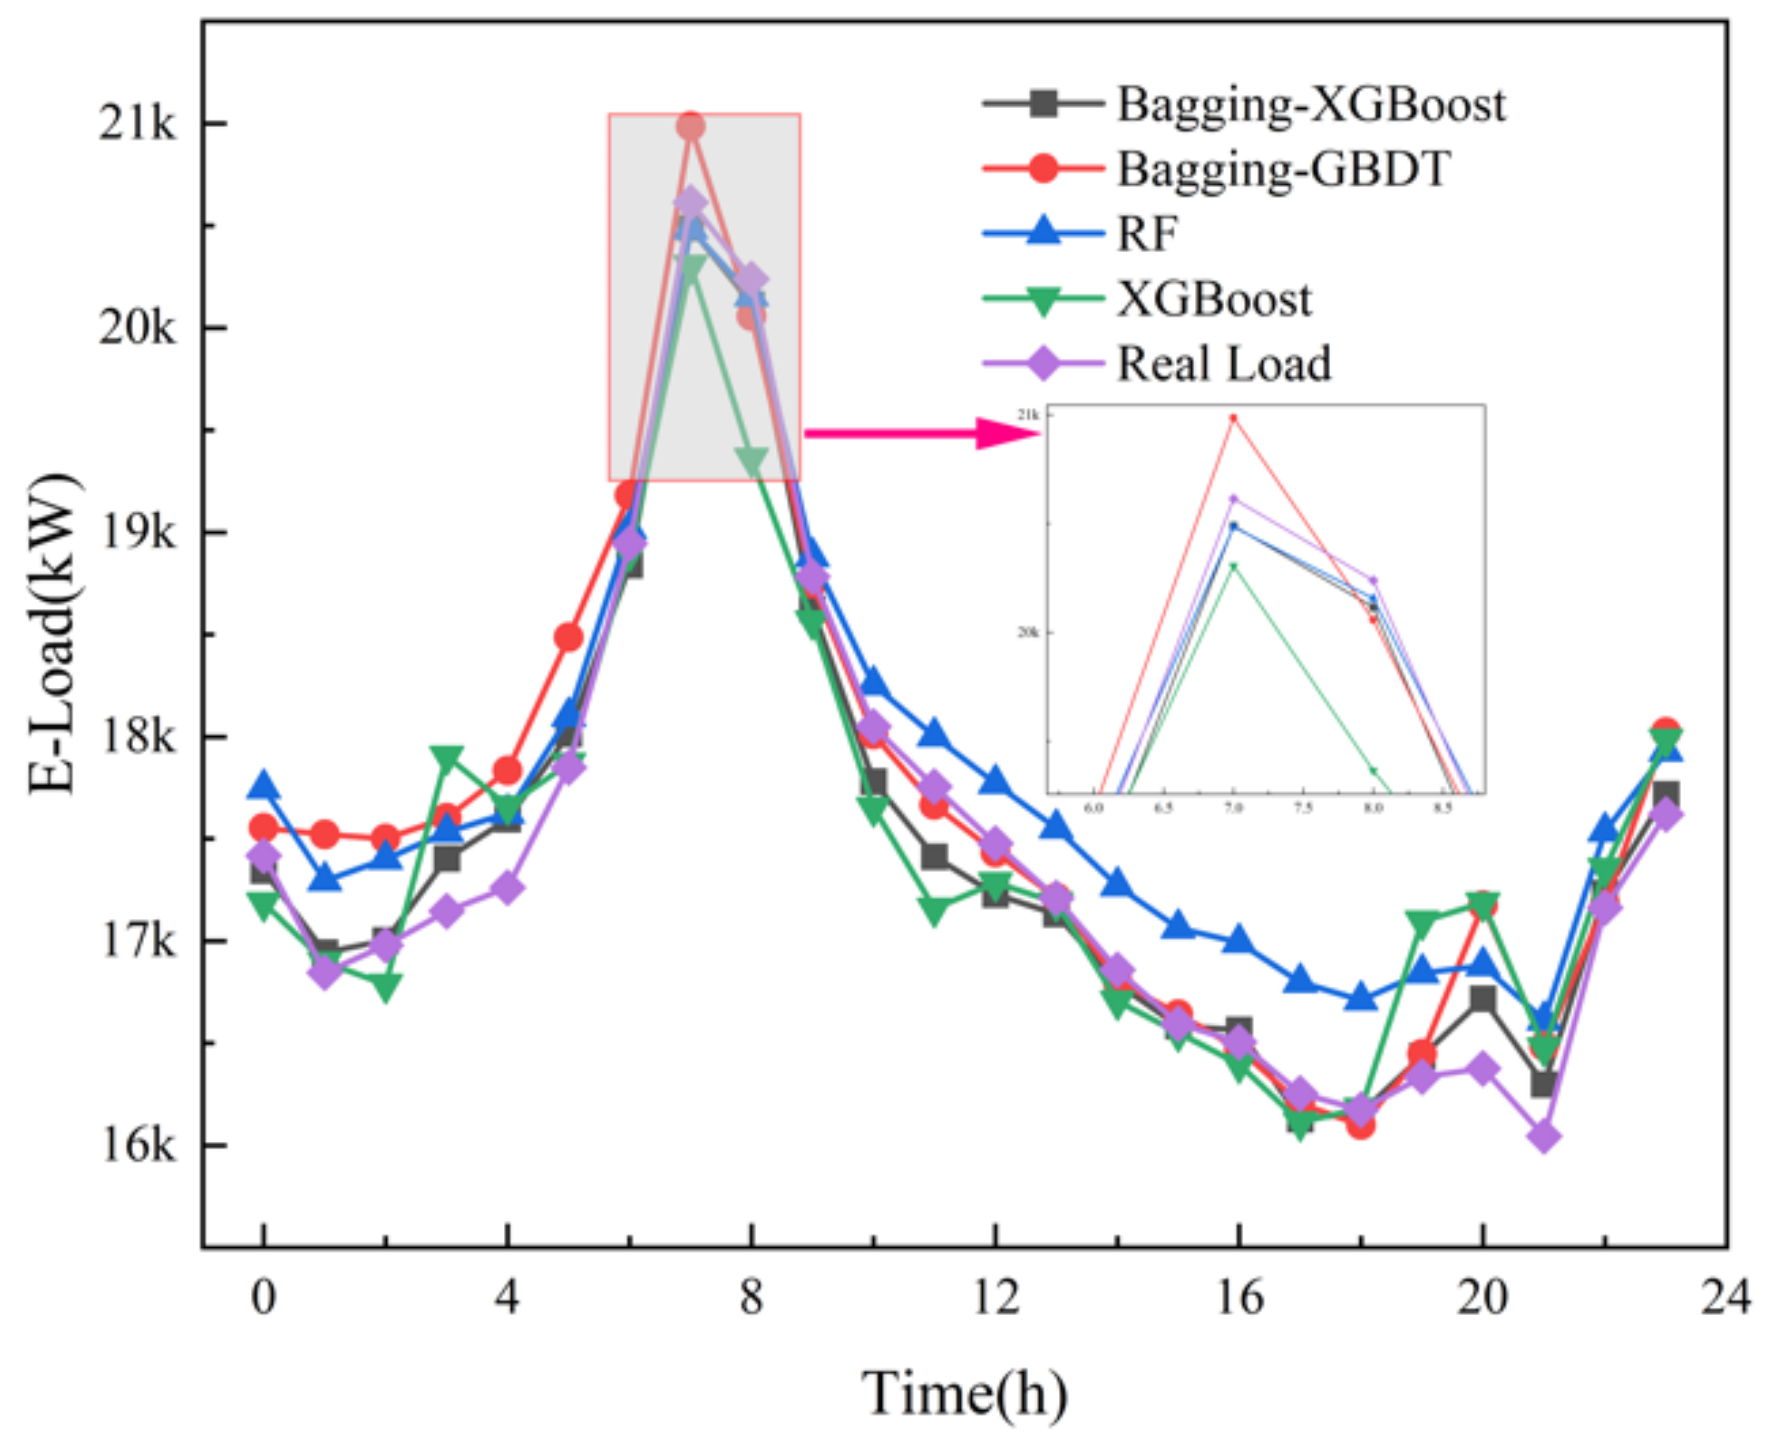
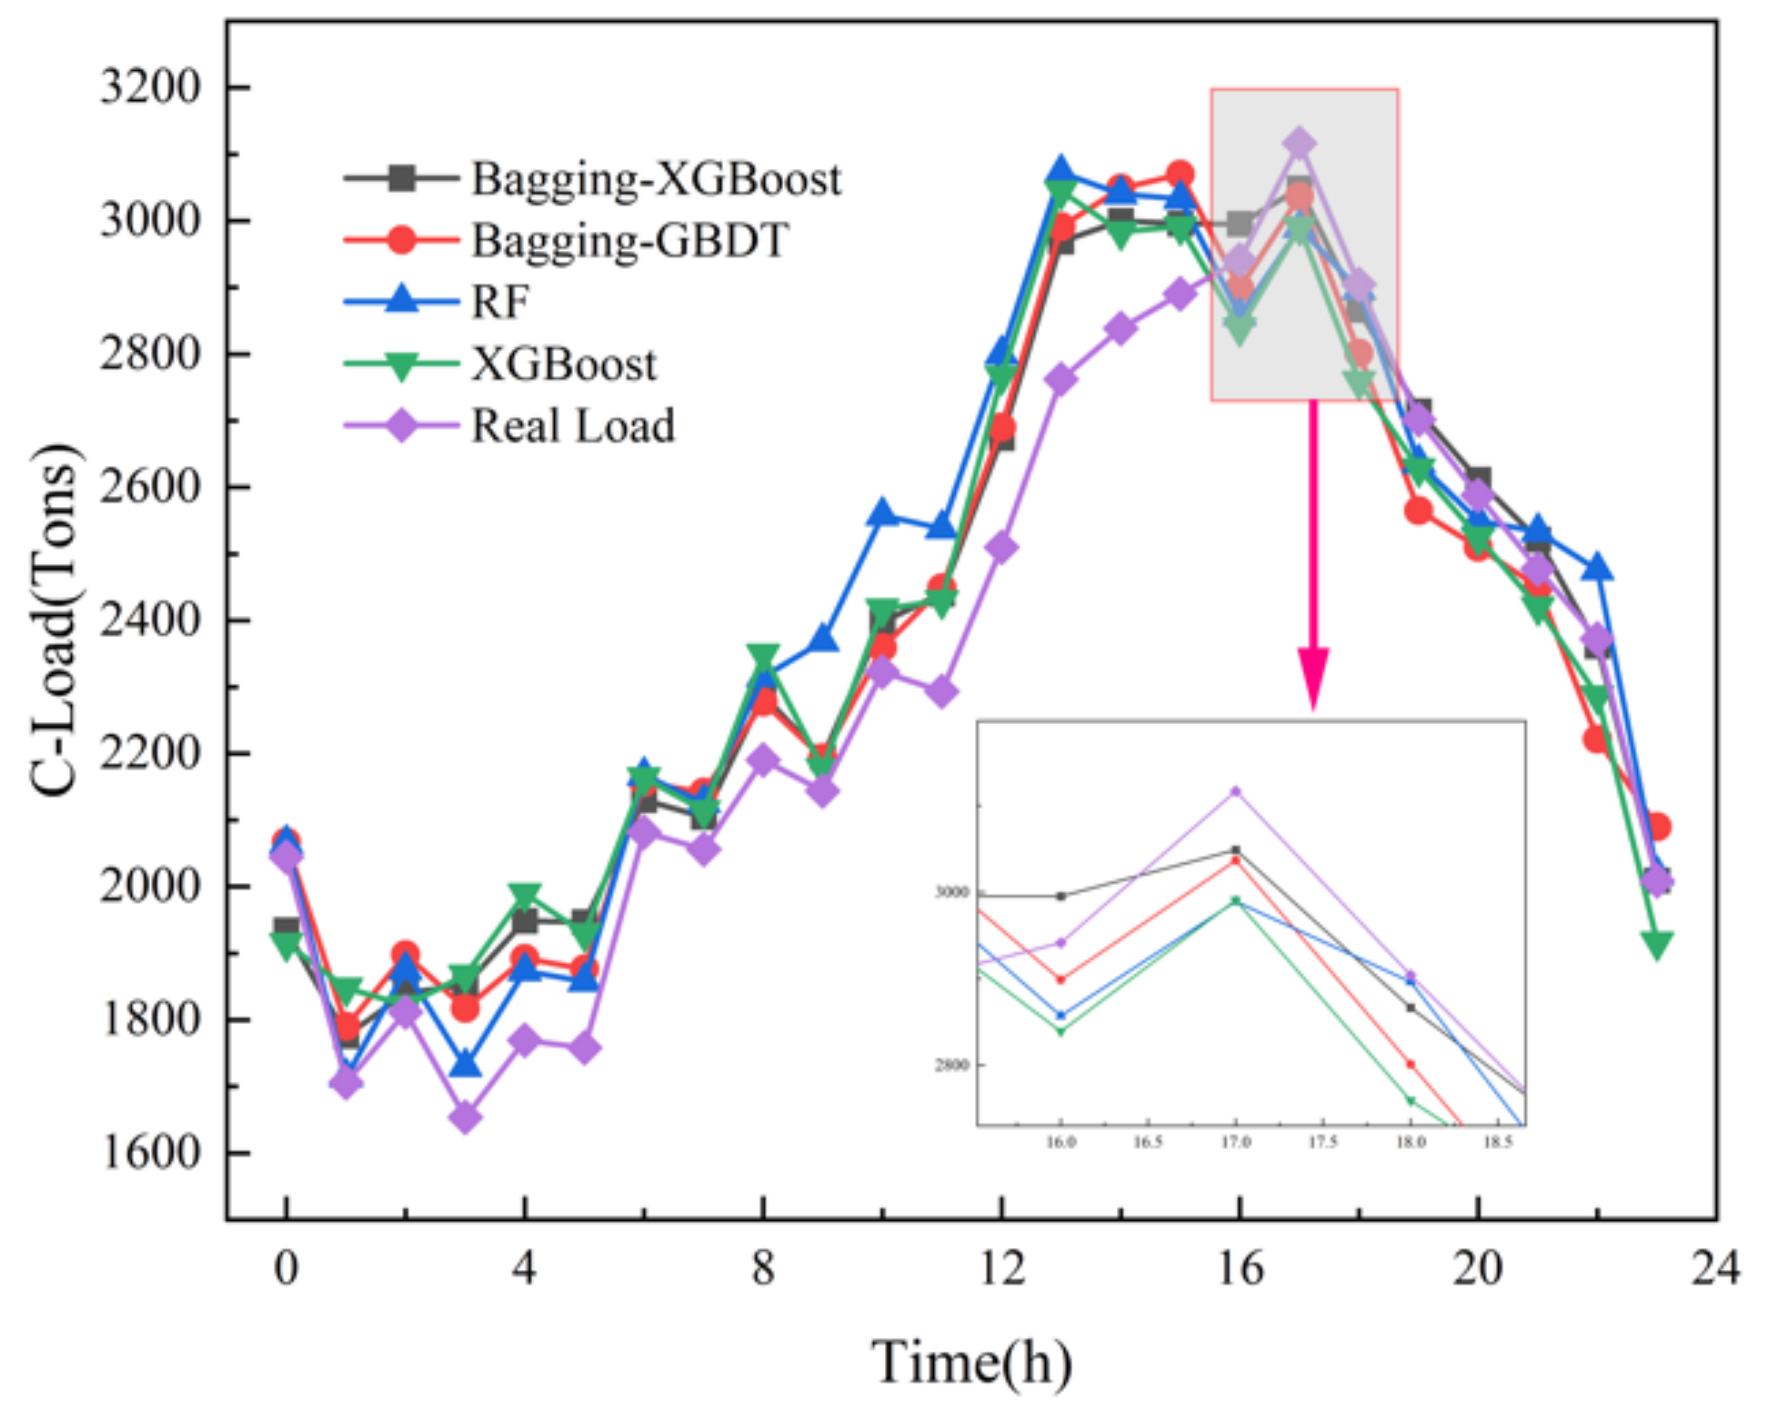
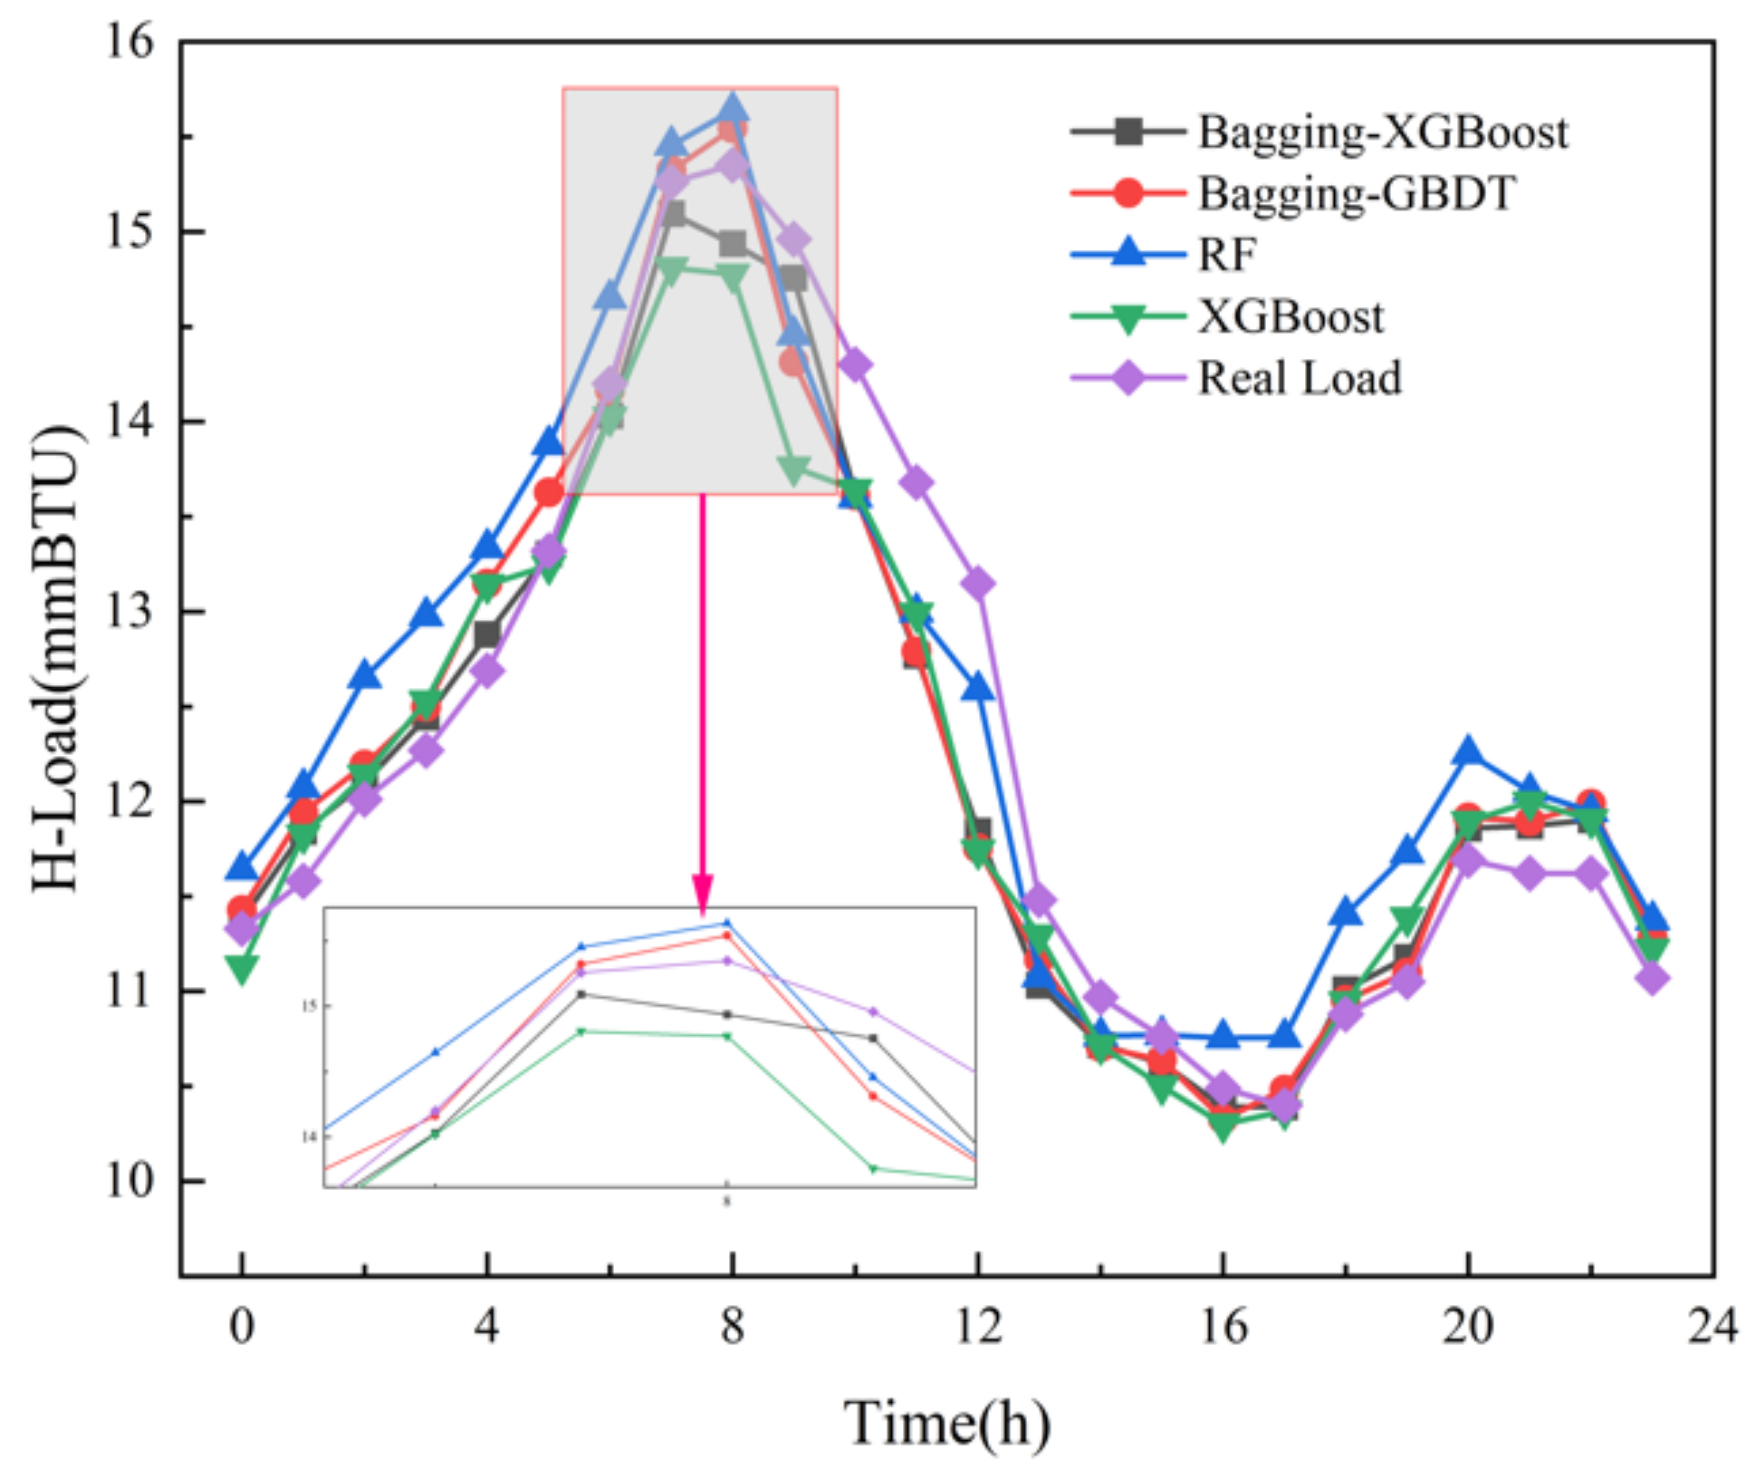
(3) Comparison between the Bagging-XGBoost model and Bagging-GBDT model
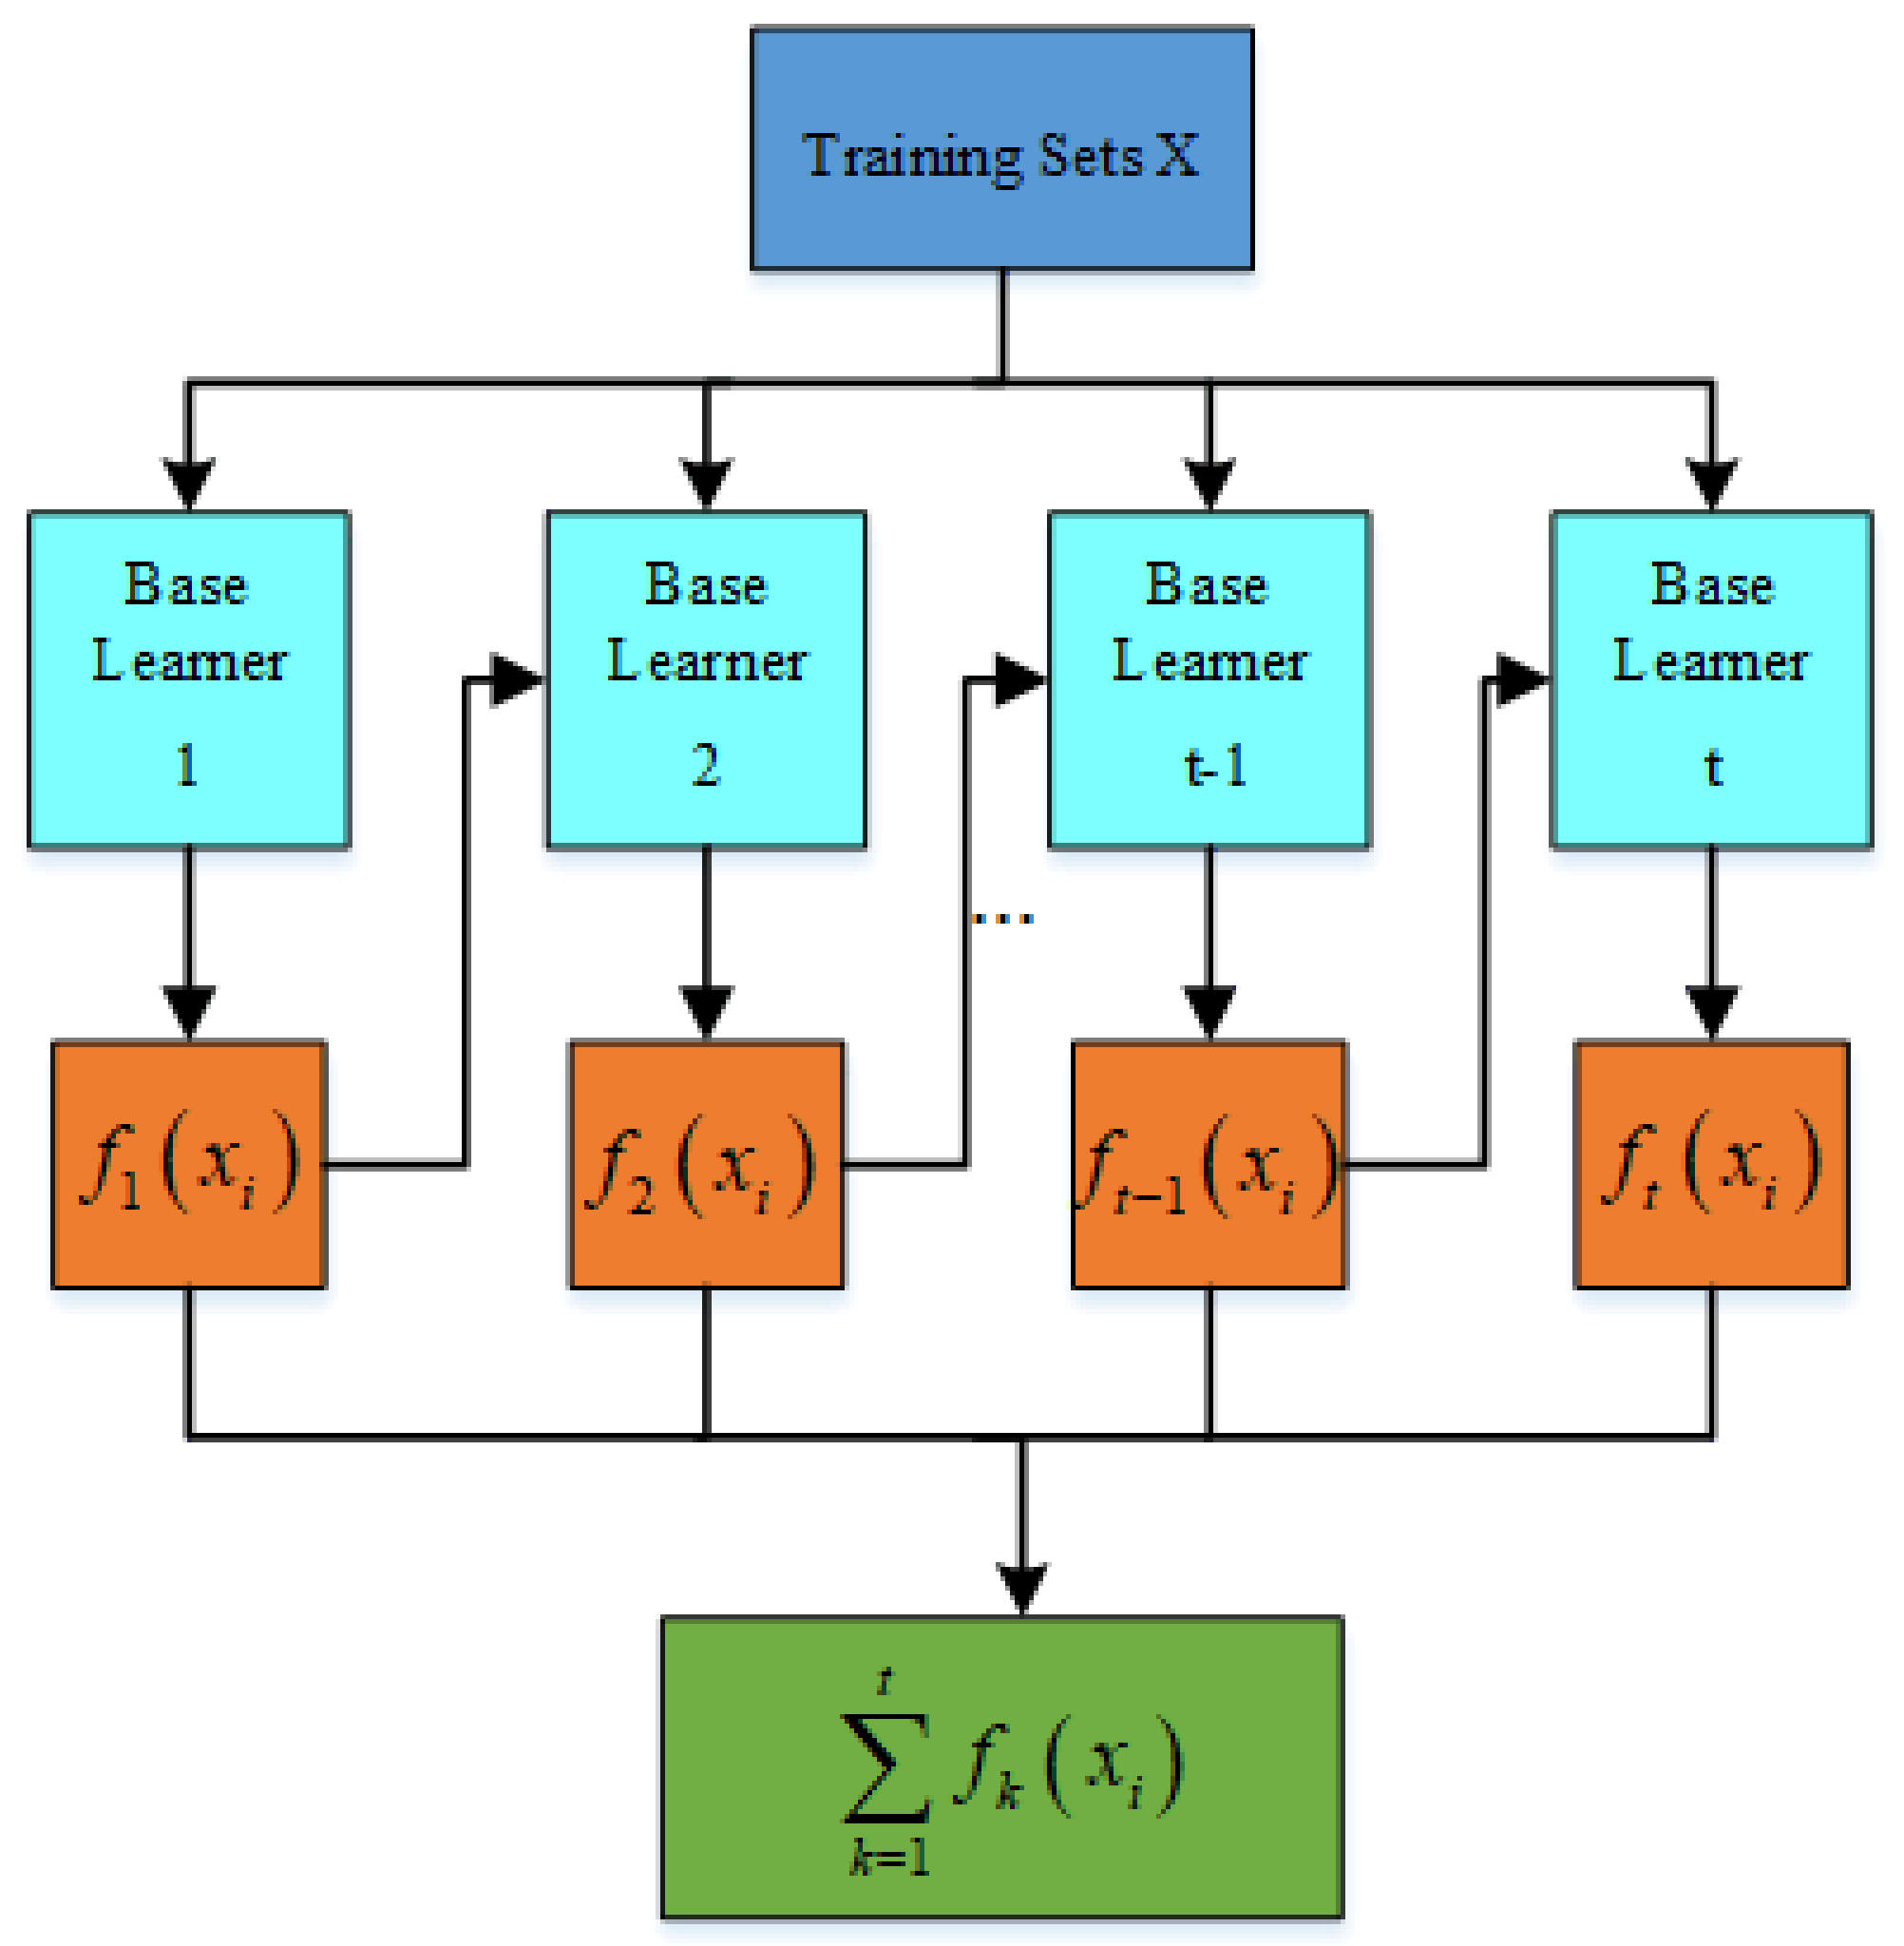
Both XGBoost and GBDT are sequential ensemble learning algorithms. Because XGBoost is an improved algorithm of GBDT, XGBoost performs second-order Taylor expansion on the loss function and can apply first-order and second-order derivatives at the same time. It can quickly find the splitting point so that it has a strong ability to prevent overfitting. However, GBDT only applies first-order derivative information during training, and the model training is not sufficient, resulting in lower prediction accuracy than XGBoost. From Table 6 and Figure 7 to Figure 9, it can be seen that the overall prediction effect of the Bagging-XGBoost model is better, and the prediction accuracy is higher than that of the Bagging-GBDT model. Among them, the prediction accuracy of electric, cooling, and heat load is increased by 28.6%, 6.9%, and 13.1%, respectively, and all three loads achieve the ideal prediction effect.
From the load forecasting results, the Bagging-XGBoost model has the best effect in the prediction of electric load and cooling load, and the heat load is slightly inferior in the prediction effect, and the prediction accuracy is significantly improved. From the load forecasting curve, the overall error fluctuation of the Bagging-XGBoost model is relatively stable during the forecasting process, while the error fluctuation of the other three forecasting models is more severe. In summary, the Bagging-XGBoost hybrid ensemble learning model adopted in this paper can reduce the bias and variance, enhance the generalization performance of the model, and greatly improve the multi-load forecasting accuracy of the integrated energy system.
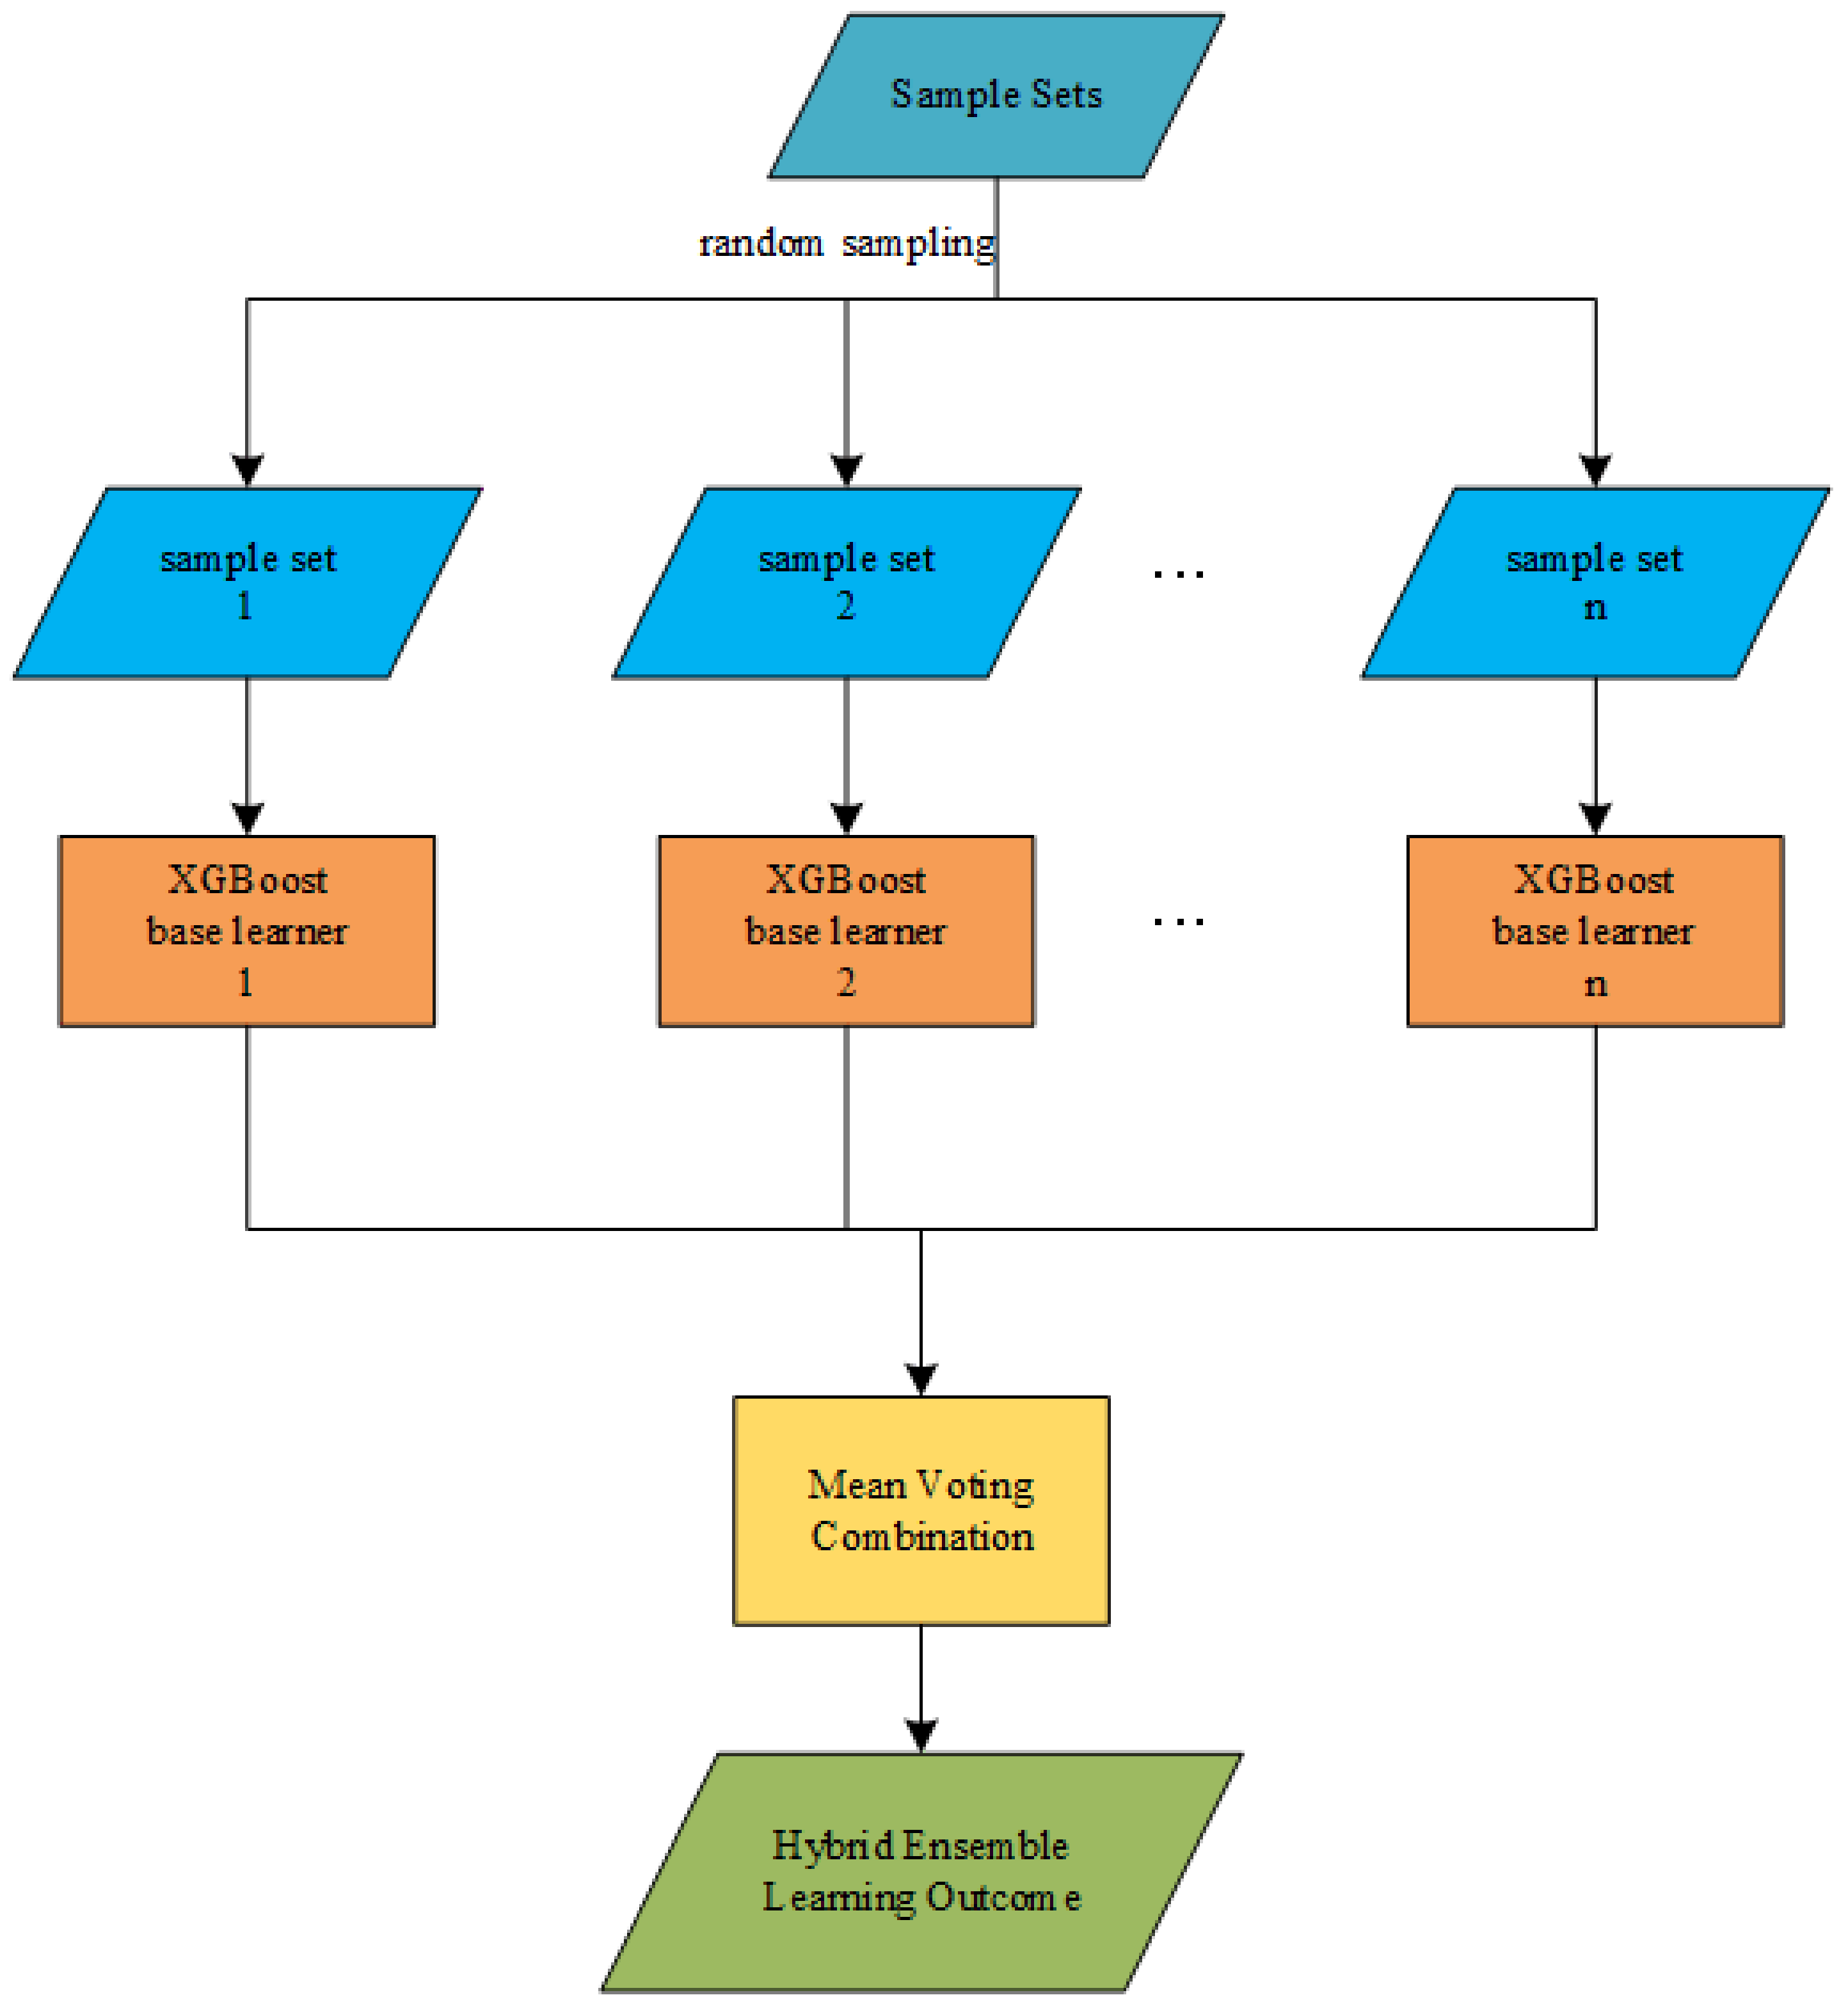
In order to verify the feasibility and effectiveness of the Bagging-XGBoost hybrid integration algorithm, avoid too single training set to make the prediction result accidental. Taking the electric load as an example, the data set is divided into a training set, verification set and test set according to 6:2:2, and then the data with prediction steps of one week, one month, and one quarter are tested. The average absolute percentage error and training time of the prediction results are obtained, as shown in the following Table 7.
From the data analysis in Table 8, with the increase in the prediction step size, the data is more complex. While the prediction difficulty increases, the training time will also increase, and the prediction accuracy of the model will generally decrease. This shows that the more data, the more information it contains. Under the influence of various factors, the full learning ability of the model is insufficient, and the generalization performance is not strong. The Bagging-XGBoost model not only has higher prediction accuracy than other models but also has a more stable prediction performance. In terms of training time, the representative RF model in parallel integration has a shorter training time than the typical sequential integrated XGBoost model because the parallel integration algorithm is faster than the sequential integration algorithm. While the Bagging-XGBoost model ensures higher prediction accuracy, the training time is not much different from other models, which reflects the superiority of the sequential-parallel hybrid integration algorithm and has better application prospects in the field of load forecasting.

5. Conclusions

Aiming at the coupling relationship between multiple loads of integrated energy systems, this paper introduces MIC for correlation analysis and feature screening, analyzes the mechanism of sequential ensemble learning and parallel ensemble learning, and proposes a multiple-load forecasting method of an integrated energy system based on the sequential-parallel hybrid ensemble. Through the example analysis, this paper mainly draws the following conclusions:
(1) The sequential-parallel ensemble learning algorithm has the characteristics of high accuracy and strong generalization. At the same time, the prediction results show that the XGBoost (sequential integration) ensemble learning and Bagging (parallel integration) hybrid ensemble learning methods have greatly improved the accuracy of IES multivariate load forecasting. Taking the electric load as an example, the Bagging-XGBoost model has improved the prediction accuracy by about 10% compared with other comparison models.
(2) In the field of integrated energy system load forecasting, many scholars are very keen to study deep learning represented by the LSTM algorithm. Although the model proposed in this paper is a combined model with a complex structure, it is still satisfactory in terms of performance. The training time is about 3 s slower than LSTM, and the prediction accuracy is 20% higher than the LSTM model, which reflects that the model proposed in this paper maintains a balance between prediction accuracy and training time.
(3) Sequential ensemble learning and parallel ensemble learning can complement each other, reduce the model bias, reduce the variance of the model, avoid the risk of model over-fitting, improve the generalization performance of the model, and thus improve the prediction accuracy.
In the future, load forecasting will be carried out further for different requirements of integrated energy system planning and operation.

Author Contributions

Conceptualization, W.Y.; methodology, W.Y.; investigation, W.L.; resources, W.L.; data curation, D.G.; writing—original draft preparation, D.G.; writing—review and editing, D.G.; visualization, D.G.; supervision, Y.W. All authors have read and agreed to the published version of the manuscript.

Funding

This research received no external funding.

Data Availability Statement

Data is contained within the article. The data presented in this study are available in the cited references.

Conflicts of Interest

The authors declare no conflict of interest.

References

  1. Zang, H.; Geng, M.; Huang, M.; Wei, Z.; Cheng, S.; Sun, G. Review and prospect of state estimation for Electricity-Heat-Gas integrated energy system. Autom. Electr. Power Syst. 2022, 46, 187–199. [Google Scholar]
  2. Li, S.; Qi, J.; Bai, X.; Ge, L.; Li, T. A short-term load prediction of integrated energy system based on IPSO-WNN. Electr. Meas. Instrum. 2020, 57, 103–109. [Google Scholar] [CrossRef]
  3. Cheng, H.; Hu, X.; Wang, L.; Liu, Y.; Yu, Q. Review on research of regional integrated energy system planning. Autom. Electr. Power Syst. 2019, 43, 2–13. [Google Scholar]
  4. Yao, Z.; Zhang, T.; Wang, Q.; Zhao, Y. Short-Term Power Load Forecasting of Integrated Energy System Based on Attention-CNN-DBILSTM. Math. Probl. Eng. 2022, 2022, 1075698. [Google Scholar] [CrossRef]
  5. Chen, B.; Wang, Y. Short-Term Electric Load Forecasting of Integrated Energy System Considering Nonlinear Synergy Between Different Loads. IEEE Access 2021, 9, 43562–43573. [Google Scholar] [CrossRef]
  6. Qi, X.; Zheng, X.; Chen, Q. A short-term load forecasting of integrated energy system based on CNN-LSTM. E3S Web Conf. 2020, 185, 01032. [Google Scholar] [CrossRef]
  7. Zhao, P.; Dai, Y. Power load forecasting of SVM based on real-time price and weighted grey relational projection algorithm. Power Syst. Technol. 2020, 44, 1325–1332. [Google Scholar]
  8. Cai, Y.; Zhang, Y.; Cao, S.; Kang, N.; Song, X. Short-term power load big data forecasting model based on decision tree algorithm. Manuf. Autom. 2022, 44, 152–155+182. [Google Scholar]
  9. Sun, Q.; Wang, X.; Zhang, Y.; Zhang, F.; Zhang, P.; Gao, W. Multiple load prediction of integrated energy system based on long short-term memory and multi-task learning. Autom. Electr. Power Syst. 2021, 45, 63–70. [Google Scholar]
  10. Jiang, Y.; Li, X.; Gao, D.; Duan, R.; Zhou, H.; Liu, Y. Combined Forecasting of Electricity and Gas Load for Regional Integrated Energy System. Electr. Meas. Instrum. 2021, 1–6. Available online: https://kns.cnki.net/kcms/detail/23.1202.TH.20210429.1059.008.html (accessed on 15 February 2023).
  11. You, W.; Zhao, D.; Wu, Y.; Huang, Y.; Shen, K.; Li, W. Research on maximum load forecasting of power distribution area based on AdaBoost integrated learning. J. China Three Gorges Univ. Nat. Sci. 2020, 42, 92–96. [Google Scholar] [CrossRef]
  12. Shen, Y.; Xiang, K.; Huang, X.; Hong, L.; Cai, J.; Xu, Z. Research on short-term load forecasting based on XGBoost algorithm. Water Resour. Hydropower Eng. 2019, 50, 256–261. [Google Scholar] [CrossRef]
  13. Xu, Y.; Zuo, F.; Zhu, X.; Li, S.; Liu, H.; Sun, B. Research on load forecasting based on improved GBDT algorithm. Proc. CSU-EPSA 2021, 33, 94–101. [Google Scholar] [CrossRef]
  14. Shi, J.; Zhang, J. Load forecasting based on multi-model by Stacking ensemble learning. Proc. CSEE 2019, 39, 4032–4042. [Google Scholar] [CrossRef]
  15. Huang, H.; Sun, K.; Liu, D. Hourly load forecasting of power system based on random forest. Smart Power 2018, 46, 8–14. [Google Scholar]
  16. Yu, T.; Yan, X. Robust multi-layer extreme learning machine using bias-variance tradeoff. J. Cent. South Univ. 2020, 27, 3744–3753. [Google Scholar] [CrossRef]
  17. Deng, X.; Ye, A.; Zhong, J.; Xu, D.; Yang, W.; Song, Z.; Zhang, Z.; Guo, J.; Wang, T.; Tian, Y.; et al. Bagging–XGBoost algorithm based extreme weather identification and short-term load forecasting model. Energy Rep. 2022, 8, 8661–8674. [Google Scholar] [CrossRef]
  18. Wu, R.; Li, X.; Bin, D. A network attack identification model of smart grid based on XGBoost. Electr. Meas. Instrum. 2023, 60, 64–70+86. [Google Scholar] [CrossRef]
  19. Sharafati, A.; Haji, S.B.H.S.; Al-Ansari, N. Application of bagging ensemble model for predicting compressive strength of hollow concrete masonry prism. Ain Shams Eng. J. 2021, 12, 3521–3530. [Google Scholar] [CrossRef]
  20. Yang, L.; Wang, Y. Survey for various cross-validation estimators of generalization error. Appl. Res. Comput. 2015, 32, 1287–1290+1297. [Google Scholar]
  21. Wang, S.L.; Zhao, L.P.; Shu, Y.; Yuan, H.; Geng, J.; Wang, S. Fast search local extremum for maximal information coefficient (MIC). J. Comput. Appl. Math. 2018, 327, 372–387. [Google Scholar] [CrossRef]
  22. Aus. Campus Metabolism [DB/OL]. America. Available online: http://cm.asu.edu/ (accessed on 12 October 2021).
  23. Iwamori, H.; Ueki, K.; Hoshide, T.; Sakuma, H.; Ichiki, M.; Watanabe, T.; Nakamura, M.; Nakamura, H.; Nishizawa, T.; Nakao, A.; et al. Simultaneous Analysis of Seismic Velocity and Electrical Conductivity in the Crust and the Uppermost Mantle: A Forward Model and Inversion Test Based on Grid Search. J. Geophys. Res. Solid Earth 2021, 126, e2021JB022307. [Google Scholar] [CrossRef]
Figure 1. Sequential ensemble learning based on XGBoost.
Energies 16 03268 g001
Figure 2. Parallel ensemble learning based on Bagging.
Energies 16 03268 g002
Figure 3. Characteristics of the distribution of the bias and variance of the prediction problem.
Energies 16 03268 g003
Figure 4. Hybrid ensemble learning structure based on XGBoost-Bagging.
Energies 16 03268 g004
Figure 5. Multivariate load forecasting based on sequential-parallel hybrid ensemble learning.
Energies 16 03268 g005
Figure 6. Correlation between electrical load and heat load.
Energies 16 03268 g006
Figure 7. Correlation between electrical load and cooling load.
Energies 16 03268 g007
Figure 8. Correlation between cooling load and heat load.
Energies 16 03268 g008
Figure 9. The correlation analysis results between electric, cooling and heat loads and characteristics.
Energies 16 03268 g009
Figure 10. Main influencing factors between multivariate load.
Energies 16 03268 g010
Figure 11. Electric load forecast results. Electrical load forecasting results compared with LSTM.
Energies 16 03268 g011
Figure 12. Cooling load forecast results. Cooling load forecasting results compared with LSTM.
Energies 16 03268 g012
Figure 13. Heat load forecast results. Heat load forecasting results compared with LSTM.
Energies 16 03268 g013
Figure 14. Electric load forecast results.
Energies 16 03268 g014
Figure 15. Cooling load forecast results.
Energies 16 03268 g015
Figure 16. Heat load forecast results.
Energies 16 03268 g016
Table 1. Comparison of sequential -parallel ensemble learning.
AlgorithmIntegrated MethodsBase LearnerCorrelationError Type
BaggingParallel Integrationstrong prediction modelWeakReduced Variance
XGBoostSequential Integrationweak prediction modelStrongReduced Bias
Table 2. Evaluation metrics.
Evaluation IndexError DefinitionExpression
MAEMean Absolute Error M A E = 1 n i = 1 n y i ^ - y i
RMSERoot Mean Square Error R M S E = 1 n i = 1 n y i ^ y i 2
MAPEMean Absolute Percentage Error M A P E = 100 % n i = 1 n y i ^ y i y i
Where: n represents the number of predicted points, y i ^ represents the predicted value of the load, y i represents the real value of the load.
Table 3. Correlation analysis between multivariate load and characteristics.
Electric LoadingCooling LoadingHeat Loading
Cloud Type0.0660.0720.055
Dew Point0.2190.2130.217
Surface Reflectance0.1120.1920.191
Wind Speed0.0780.0970.059
Precipitable Water Vapor0.2230.2350.315
Wind Direction0.0780.0970.059
Relative Humidity0.1390.3150.251
Temperature0.4380.8530.653
Pressure0.2170.3280.363
Day Type0.0720.0430.112
Electric Loading10.4810.413
Cooling Loading0.48110.726
Heat Loading0.4130.7261
Table 4. Hyper parameter setting.
Max_ Depthn_ EstimatorsLearning_ RateGamma
Electric42000.1100
Cooling61500.250
Heat53000.1200
Table 5. Single load forecasting and multivariate load forecasting results.
ModelMAPE/%
Electric/kWCooling/TonsHeat/mmBTU
Single load forecasting1.1374.5212.831
Multiple load forecasting0.8924.0462.466
Table 6. Comparison of Bagging-XGBoost model and LSTM model indicators.
ModelMAPE/%MAERMSE
ECHECHECH
Bagging-XGBoost0.8924.0462.266156.43488.4600.320190.096109.3190.450
LSTM2.0614.6243.608302.342127.3470.451343.762134.7580.556
Table 7. Comparison of indicators of different forecasting models.
ModelMAPE/%MAERMSE
ECHECHECH
Bagging-XGBoost0.8924.0462.266156.43488.4600.320190.096109.3190.450
RF1.7614.7142.608349.099109.4670.443379.353142.3280.483
Bagging-GBDT1.254.3472.503251.246105.9620.317350.701121.1460.443
XGBoost1.644.4032.843305.181119.9260.366405.438139.4080.513
Table 8. Electrical load prediction errors of different models with different predicting step sizes.
ModelPredictive Time Length/hMAPE/%Training Duration/min
Bagging-XGBoost1680.9325
7201.12611
21601.05820
RF1682.0613
7201.9426
21602.19311
Bagging-GBDT1681.454
7201.9269
21602.28618
XGBoost1681.744
7201.828
21602.21317
LSTM1682.3845
7202.67110
21603.03218
Disclaimer/Publisher’s Note: The statements, opinions and data contained in all publications are solely those of the individual author(s) and contributor(s) and not of MDPI and/or the editor(s). MDPI and/or the editor(s) disclaim responsibility for any injury to people or property resulting from any ideas, methods, instructions or products referred to in the content.

