
Estimation Model of Agrivoltaic Systems Maximizing for Both Photovoltaic Electricity Generation and Agricultural Production
 , ,
, ,  and
and
Abstract
:1. Introduction
1.1. Background
1.2. Purpose
1.3. Contents and Boundaries
2. Materials and Methods
2.1. Materials
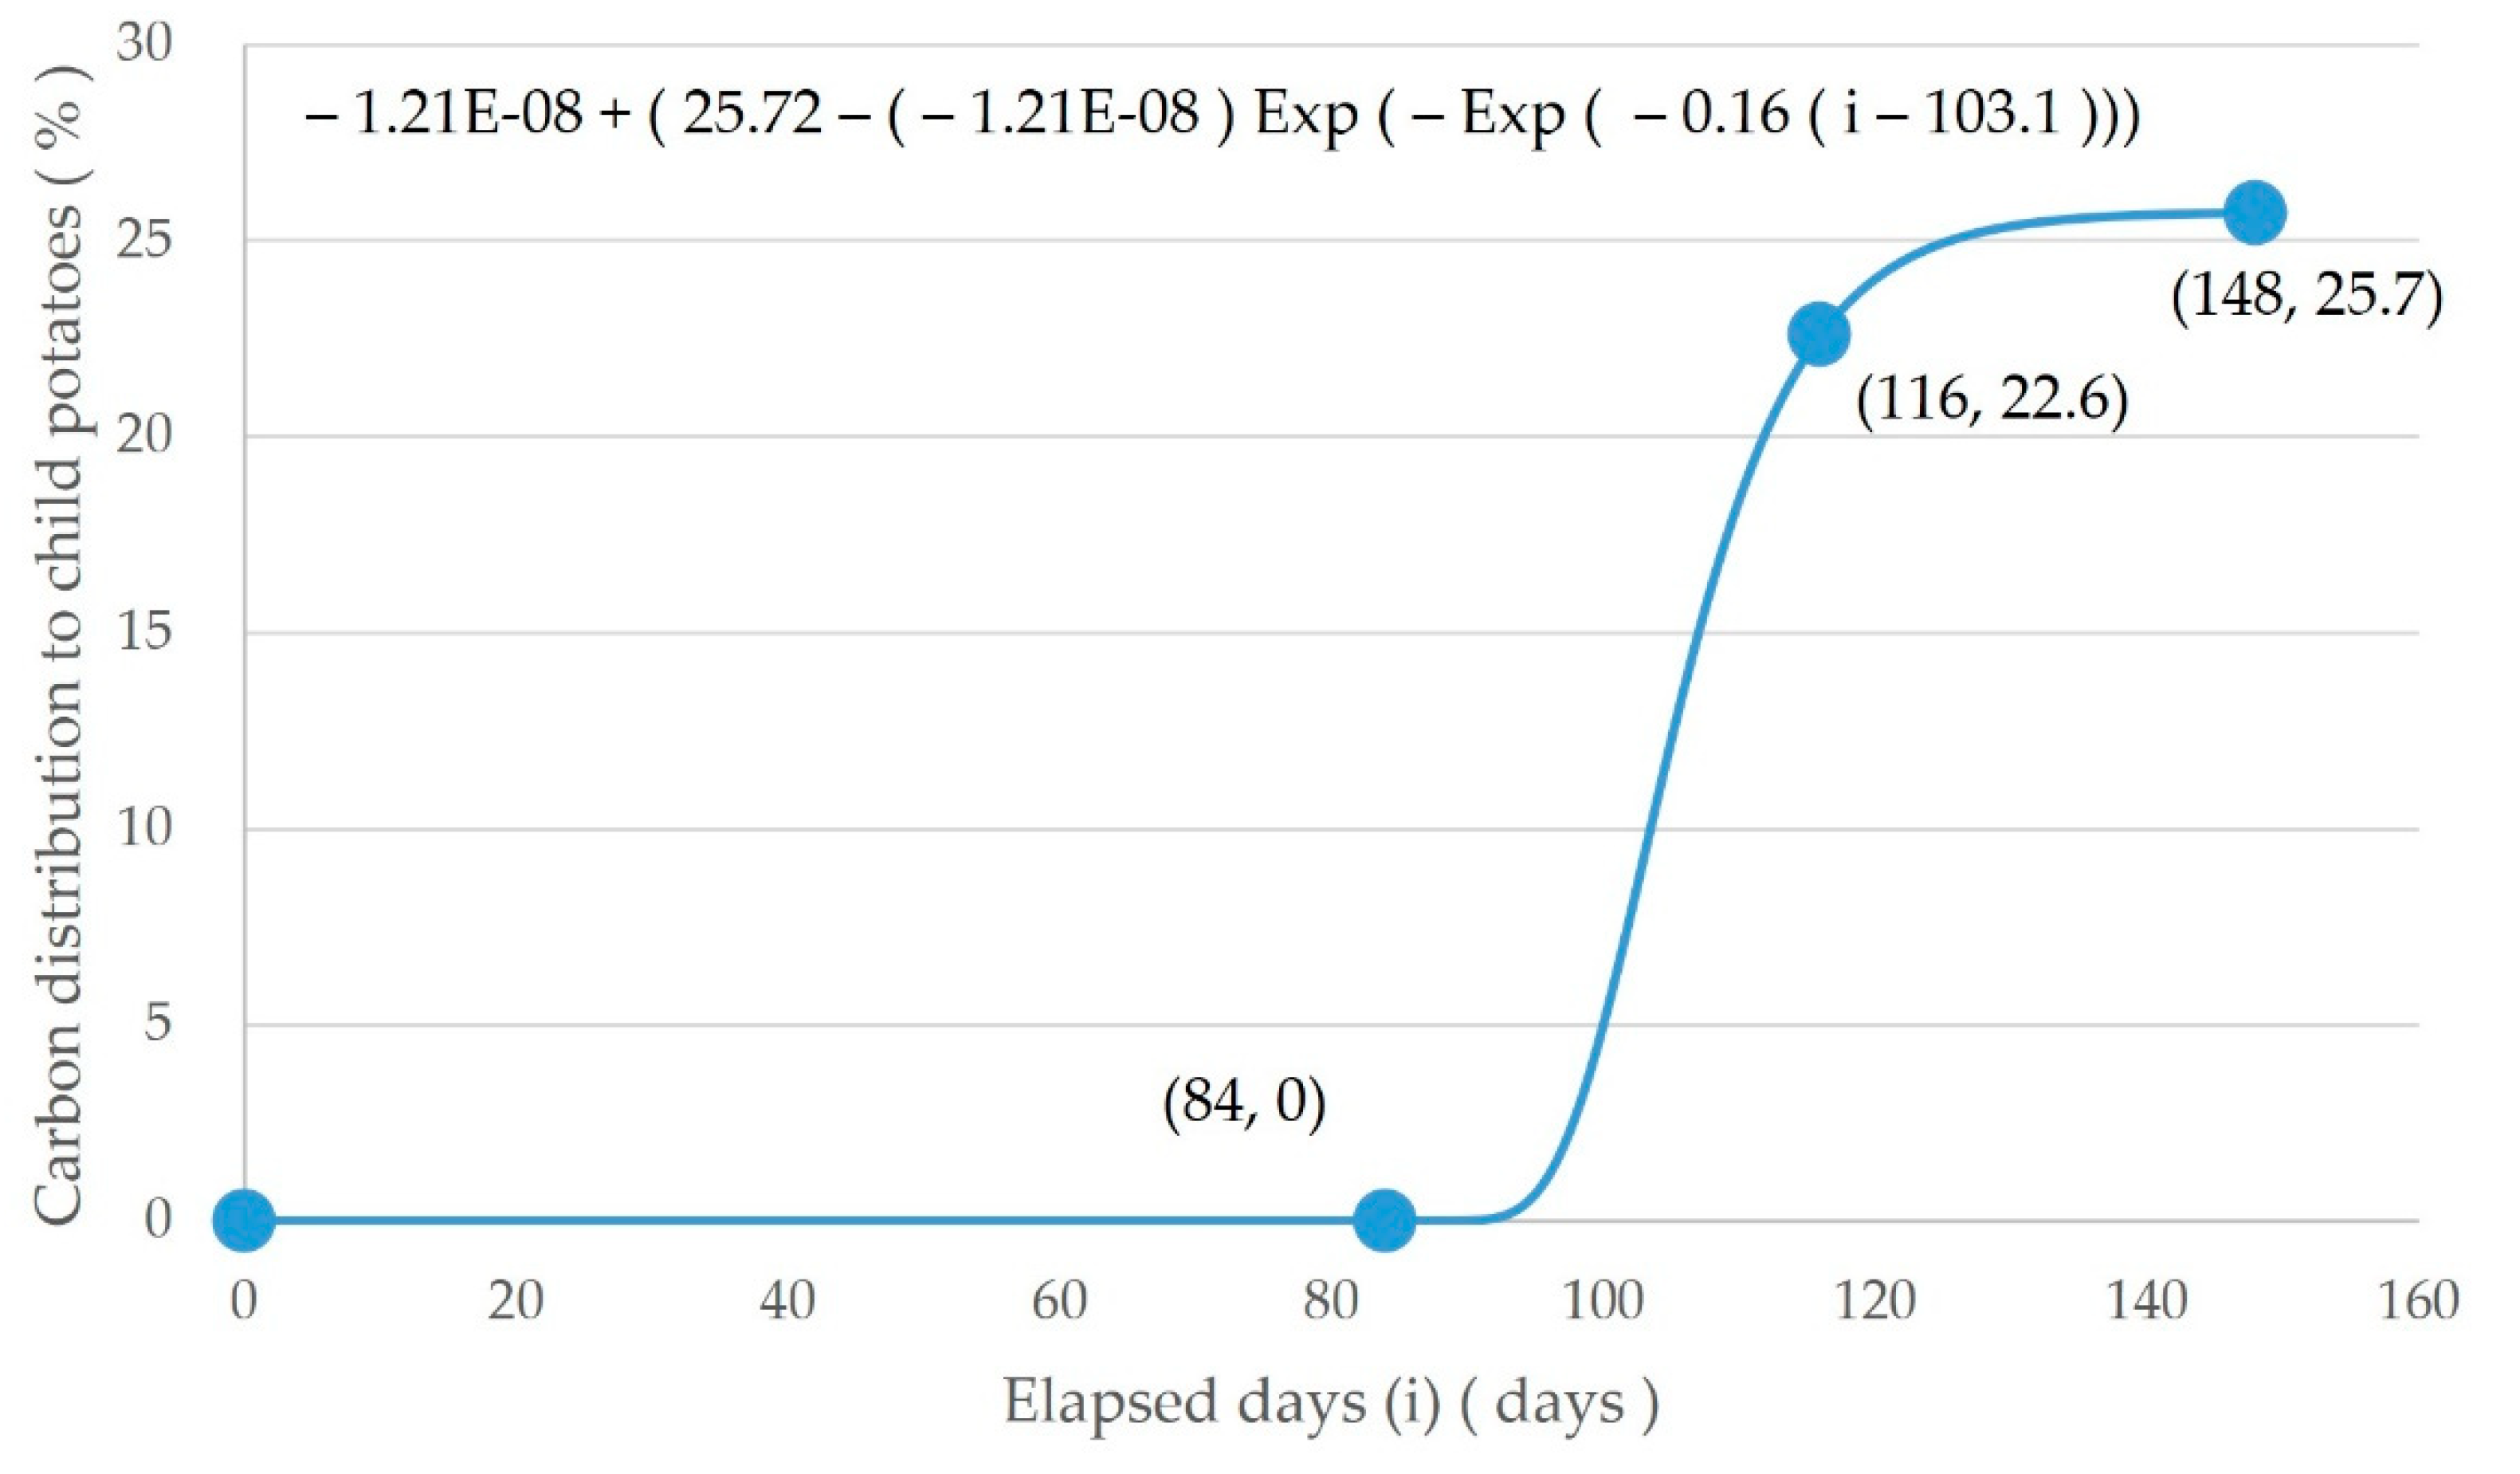
2.2. Growth of Taro
2.3. Growth Weight of Child Potatoes (Wp)
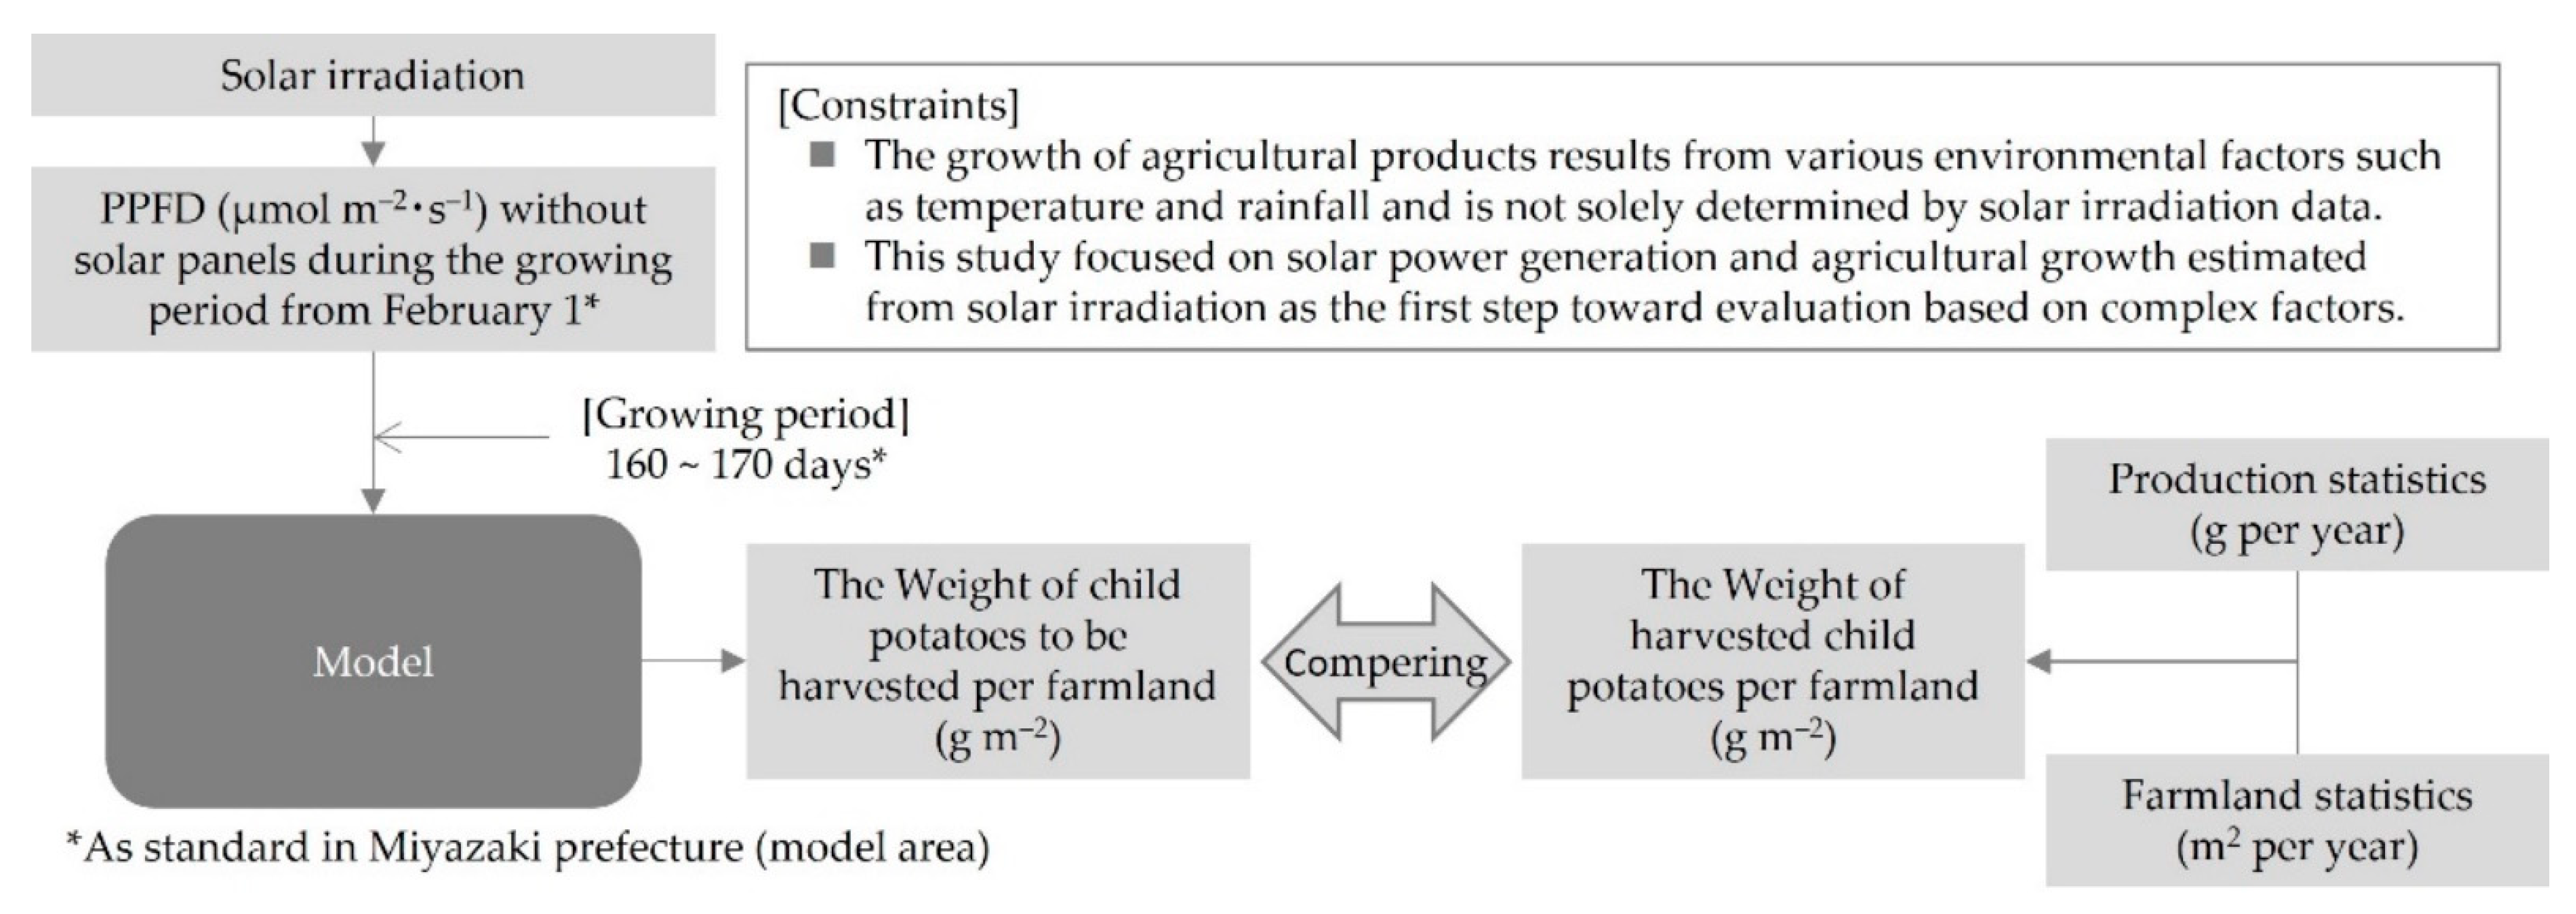
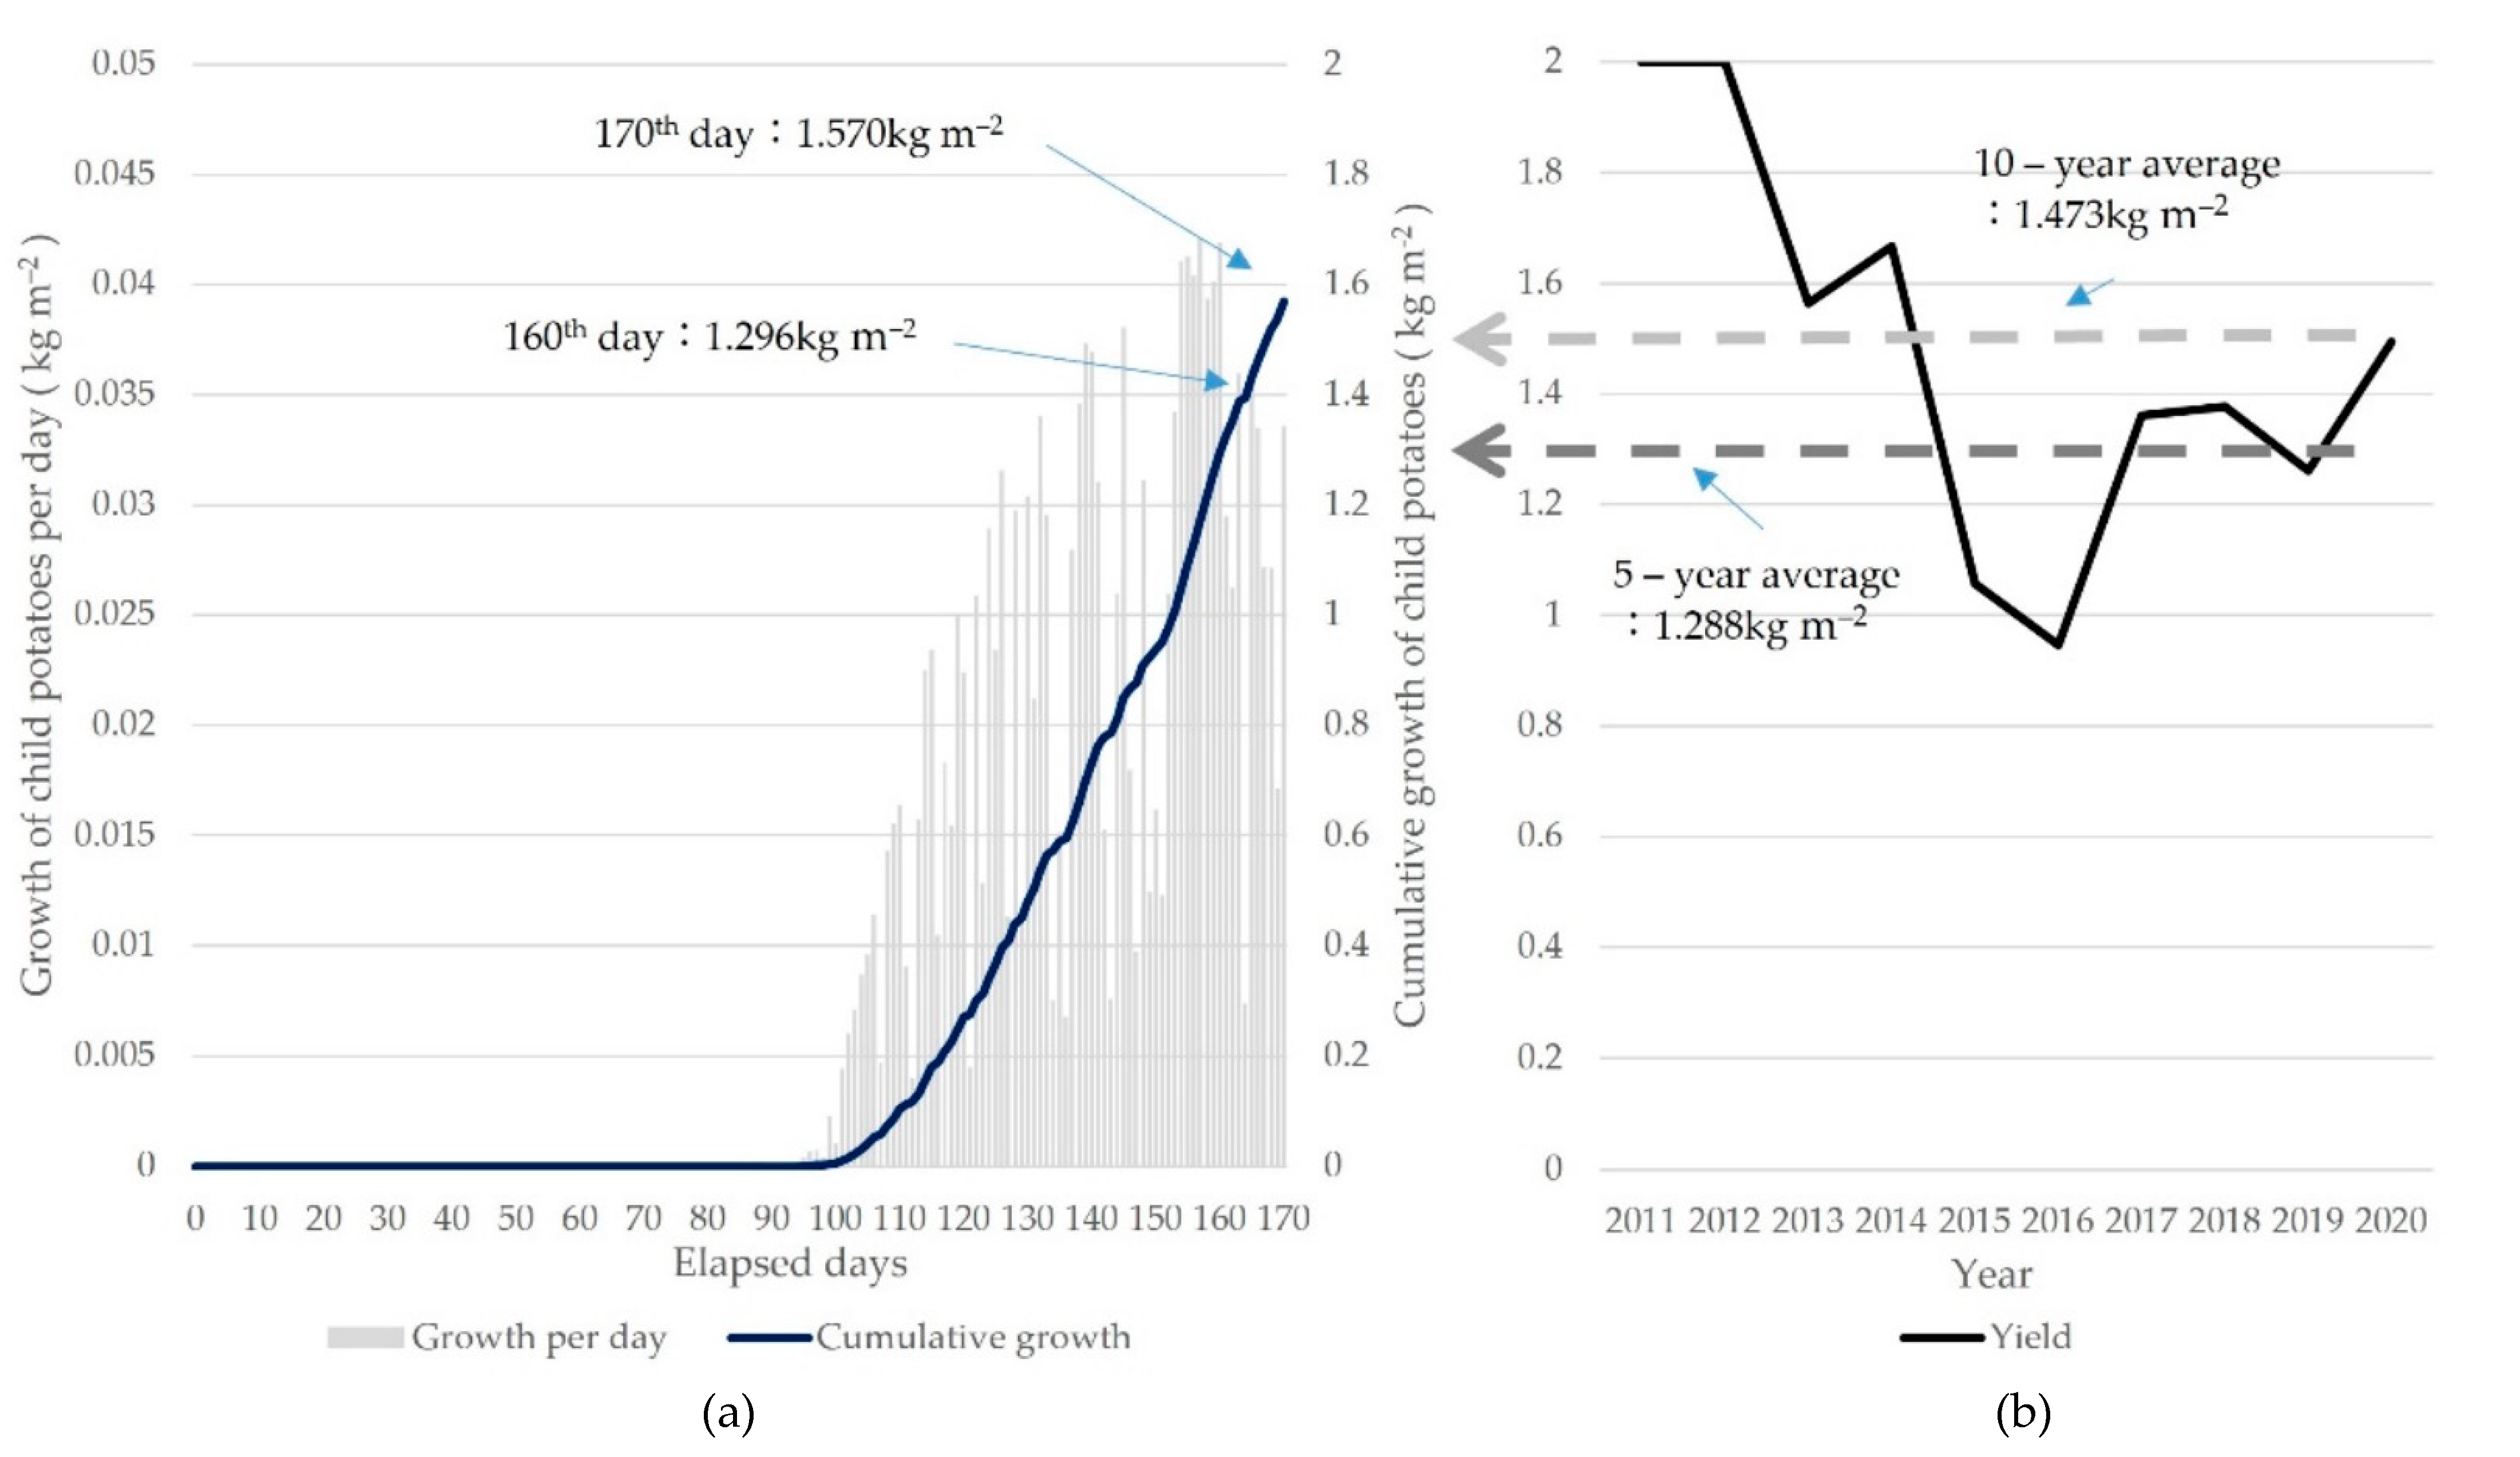
2.4. Model Verification
3. Results
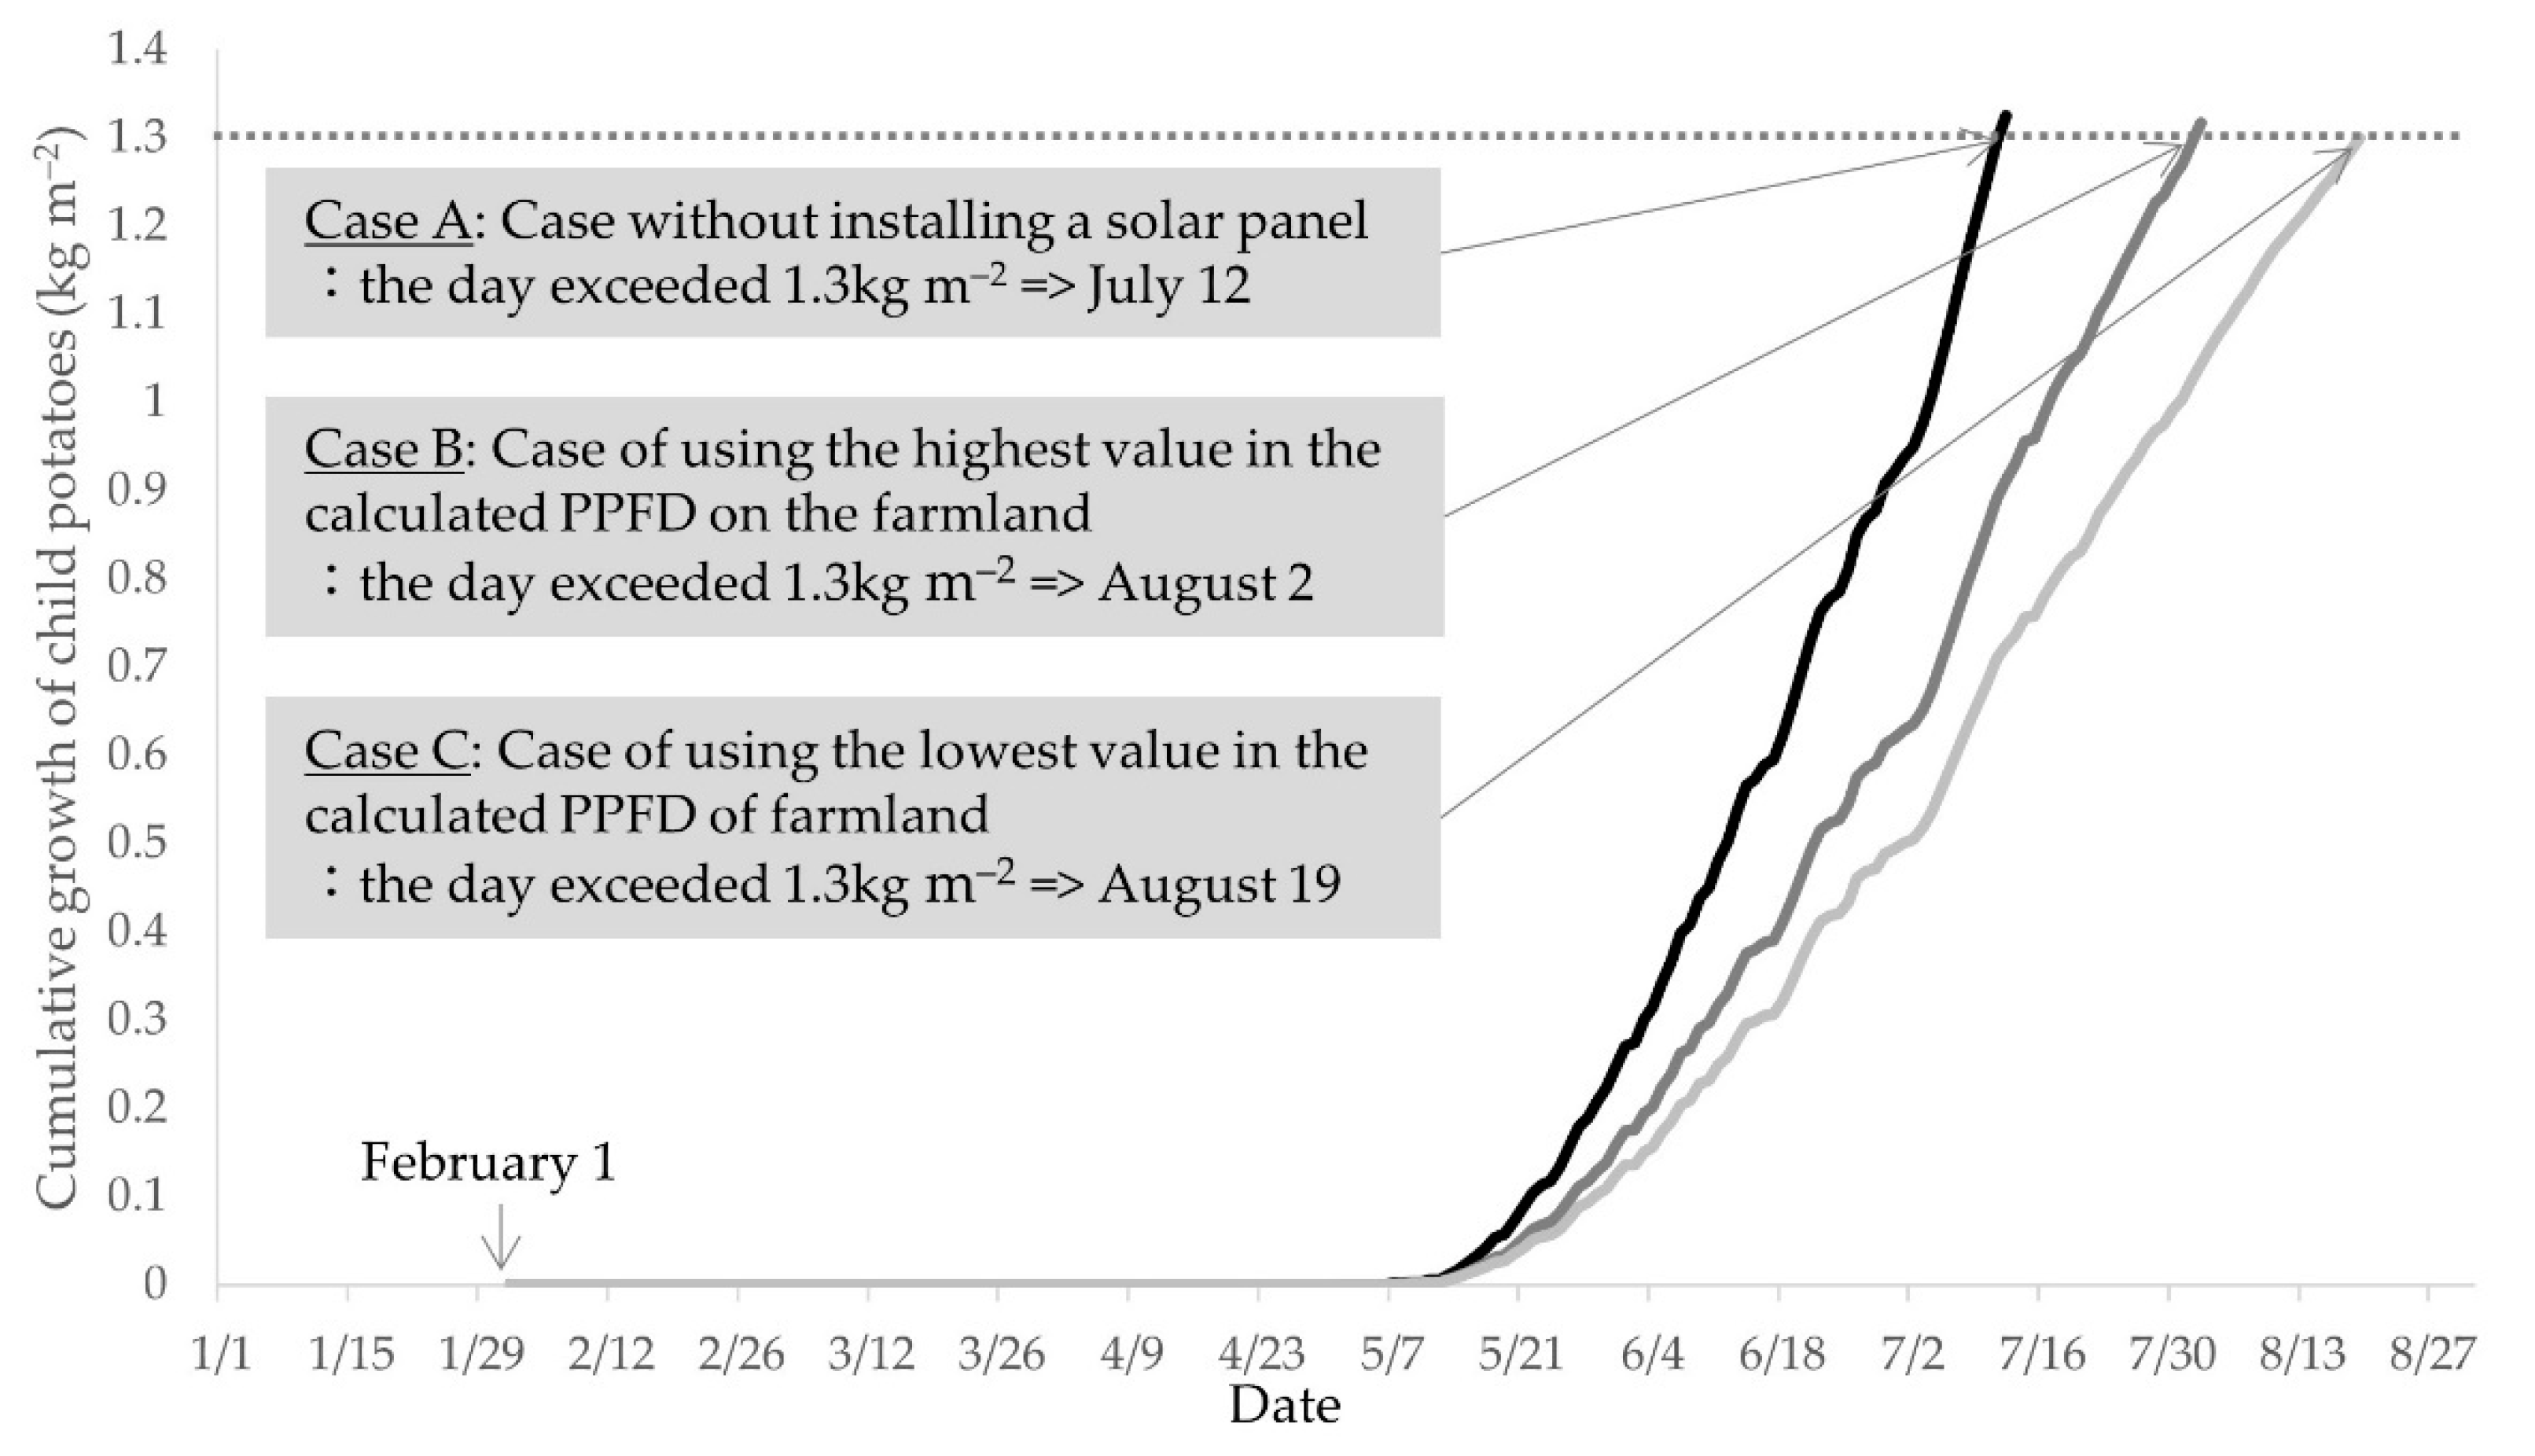
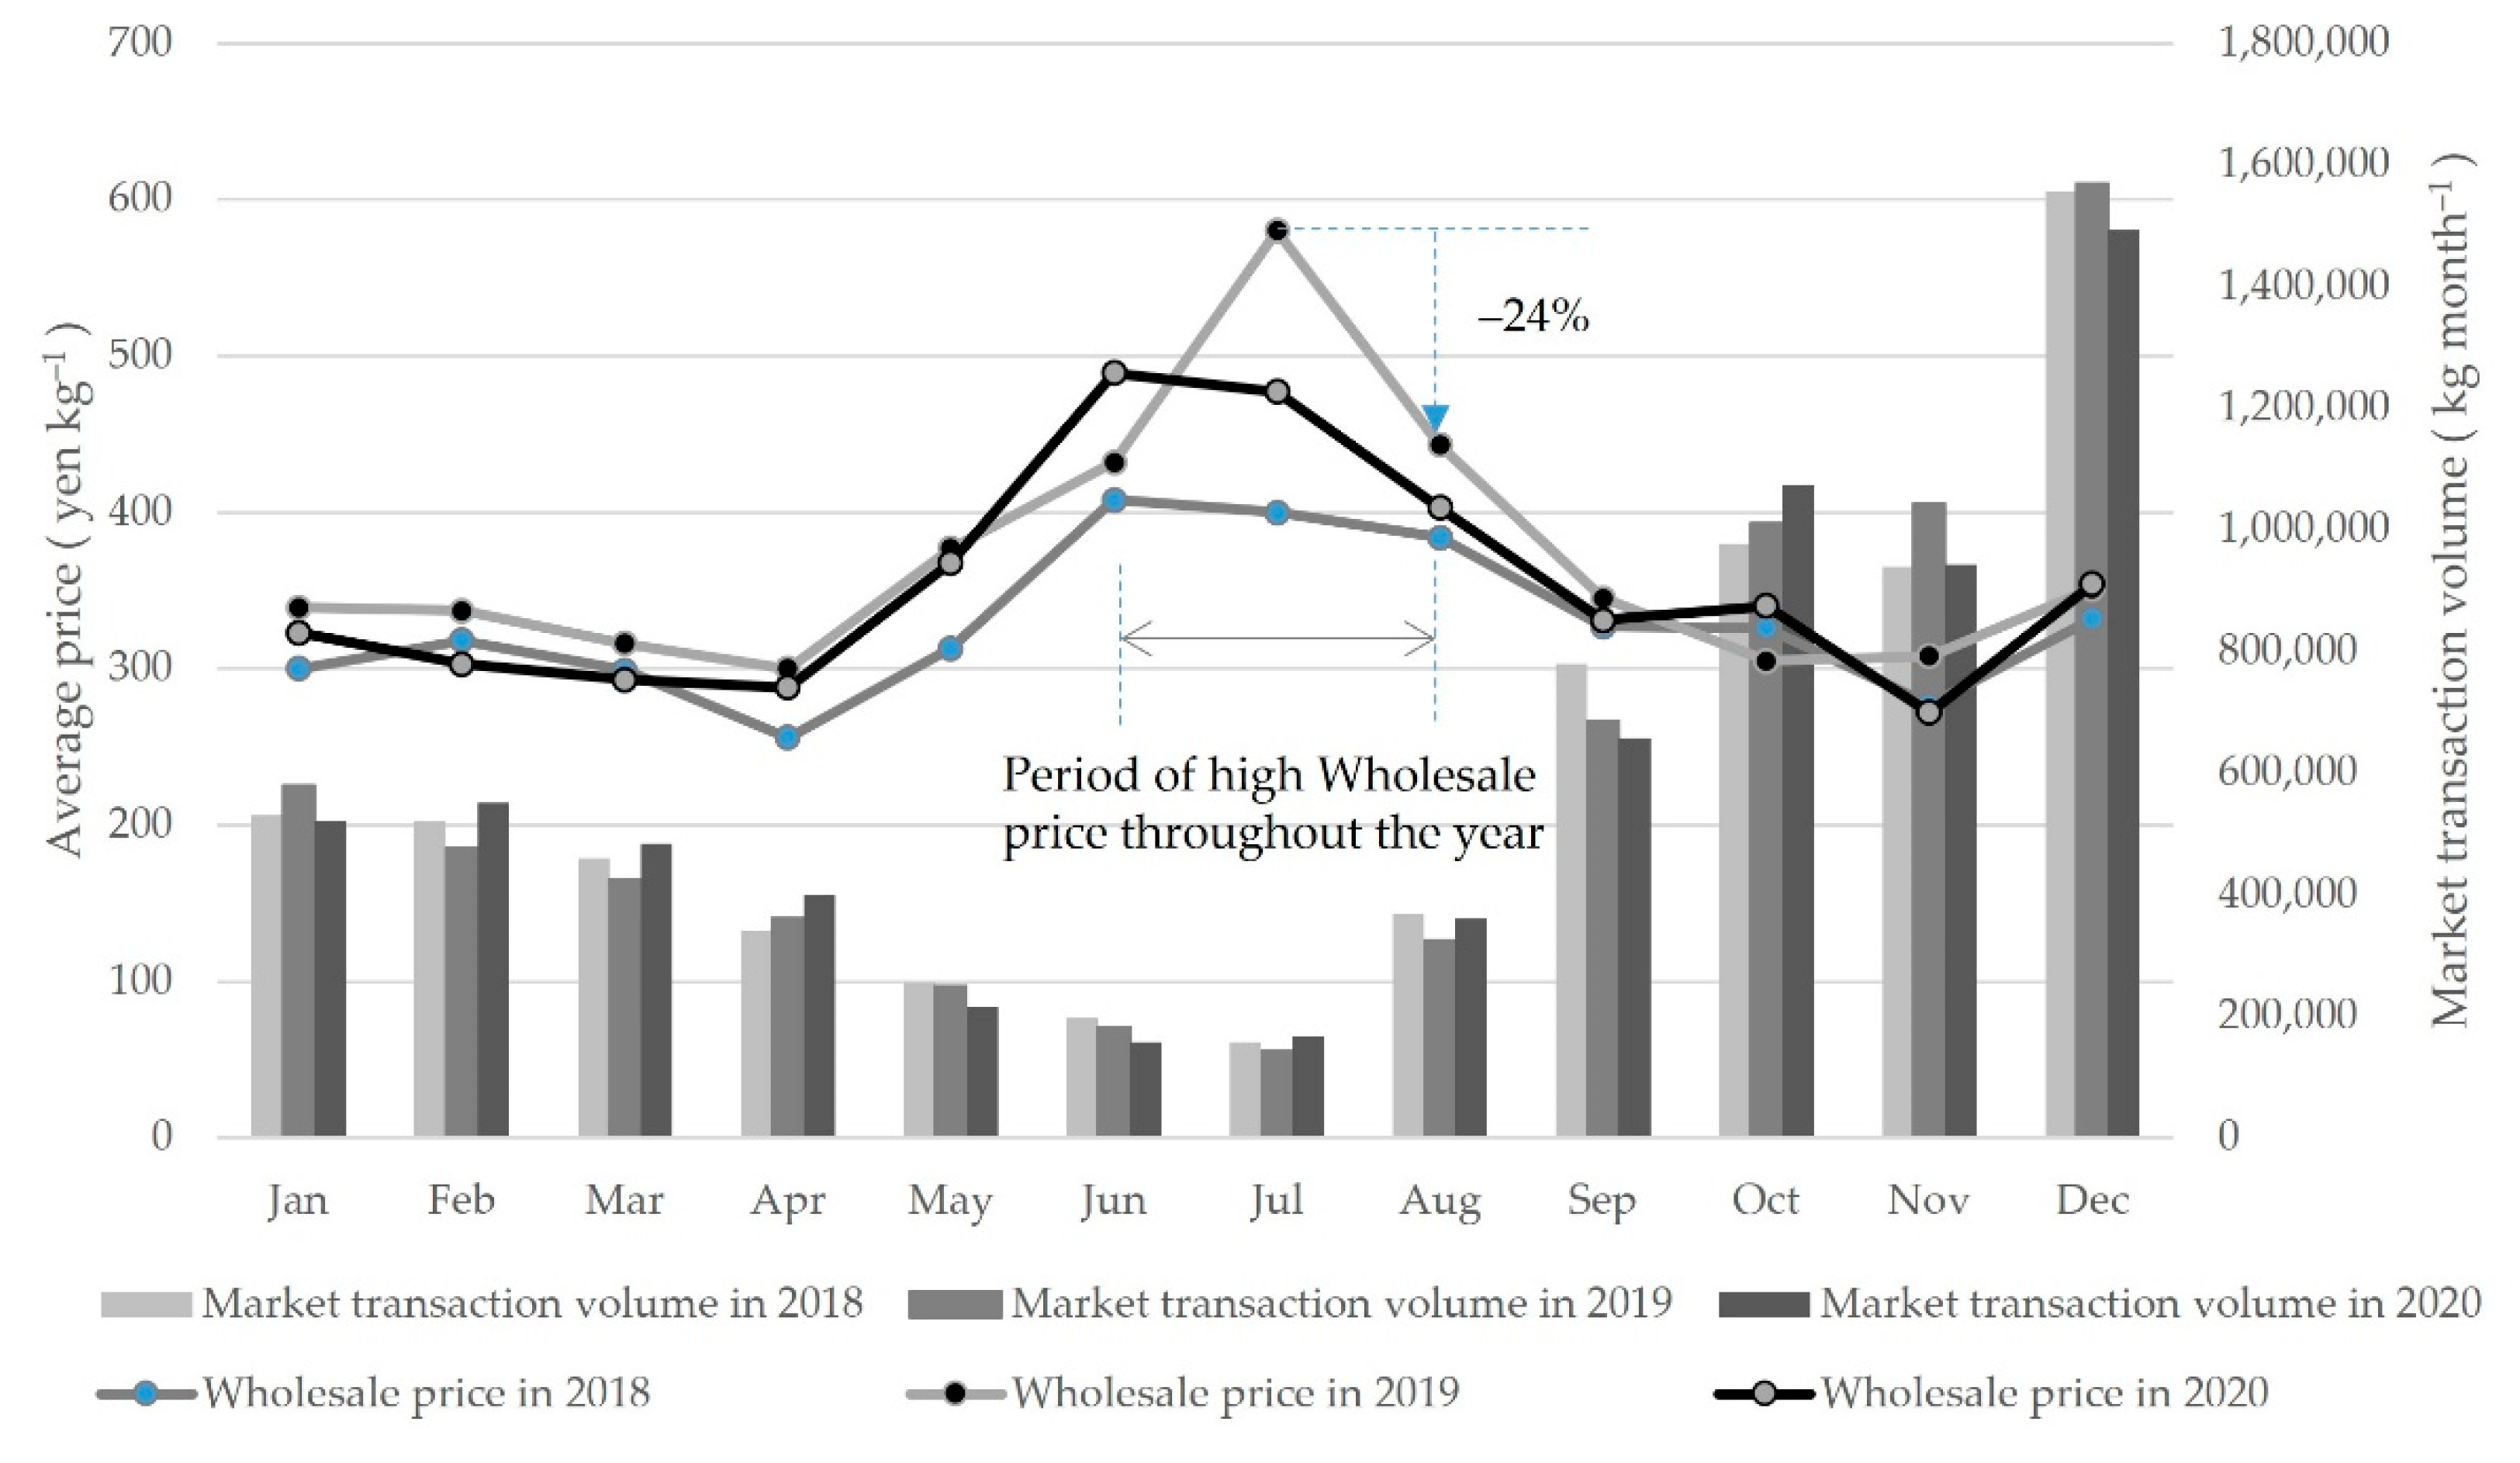
3.1. Impact of Solar Panel Installation on Crop Shipping Dates of Taro
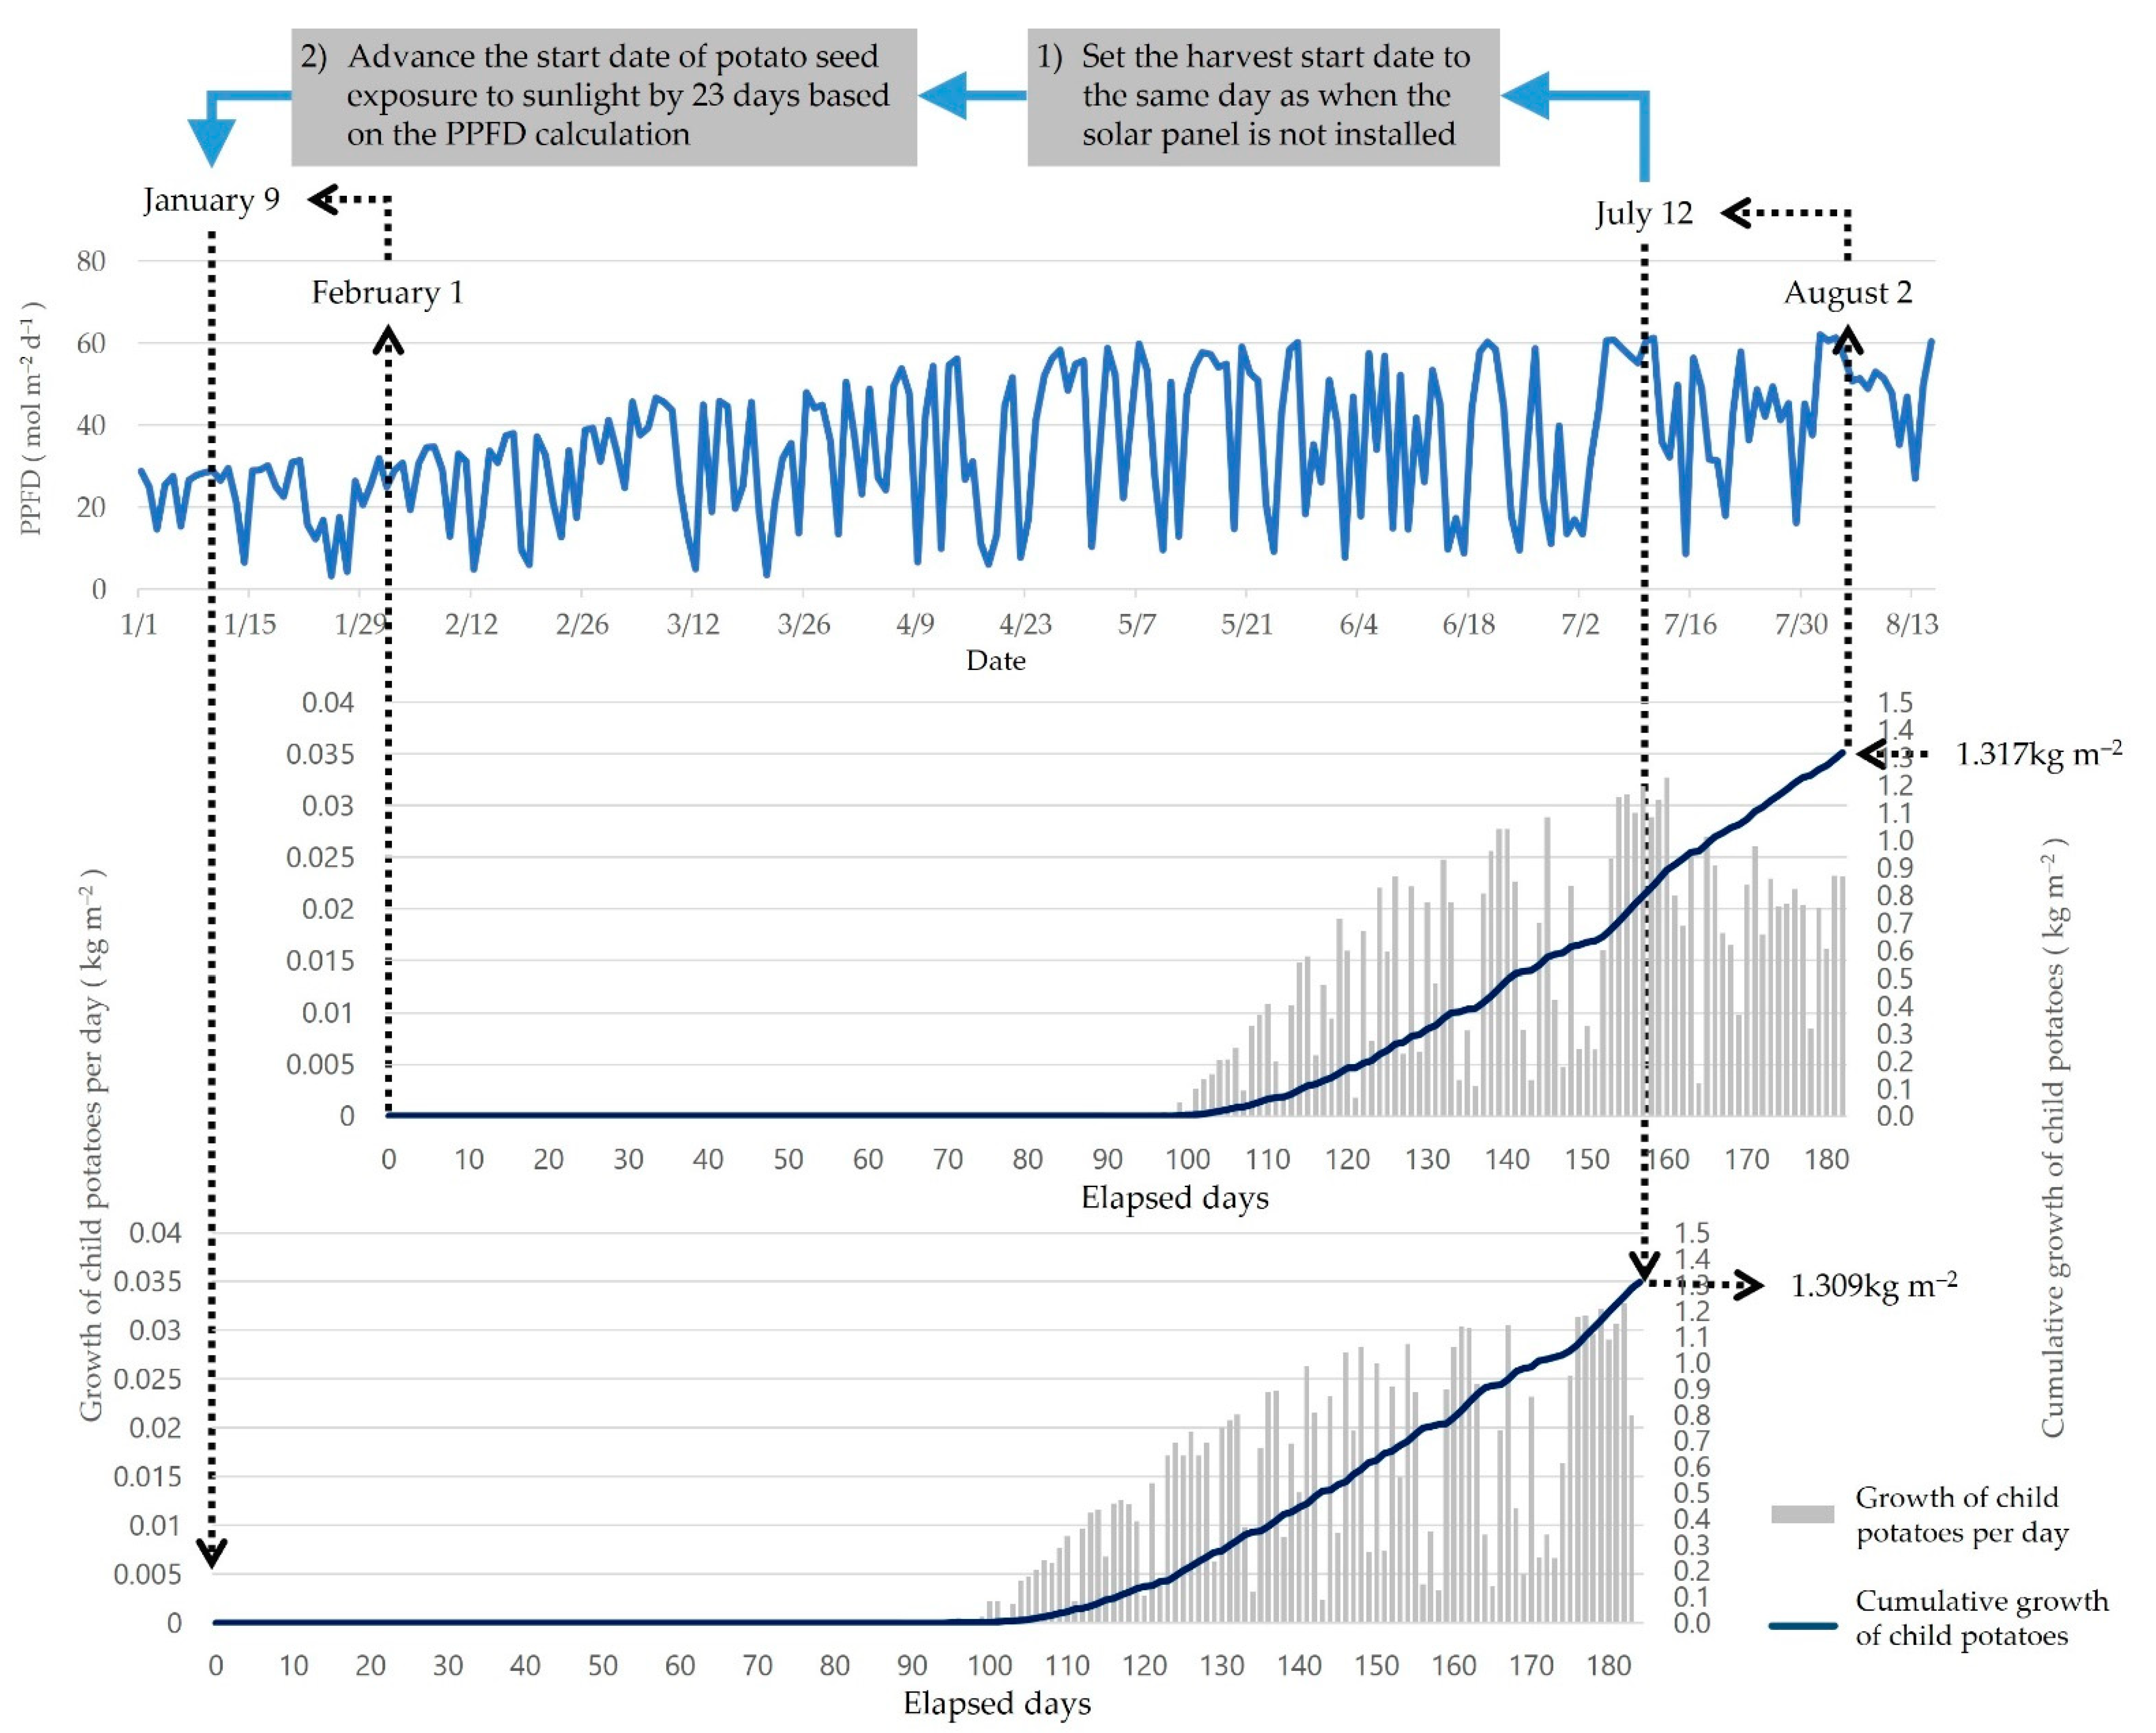
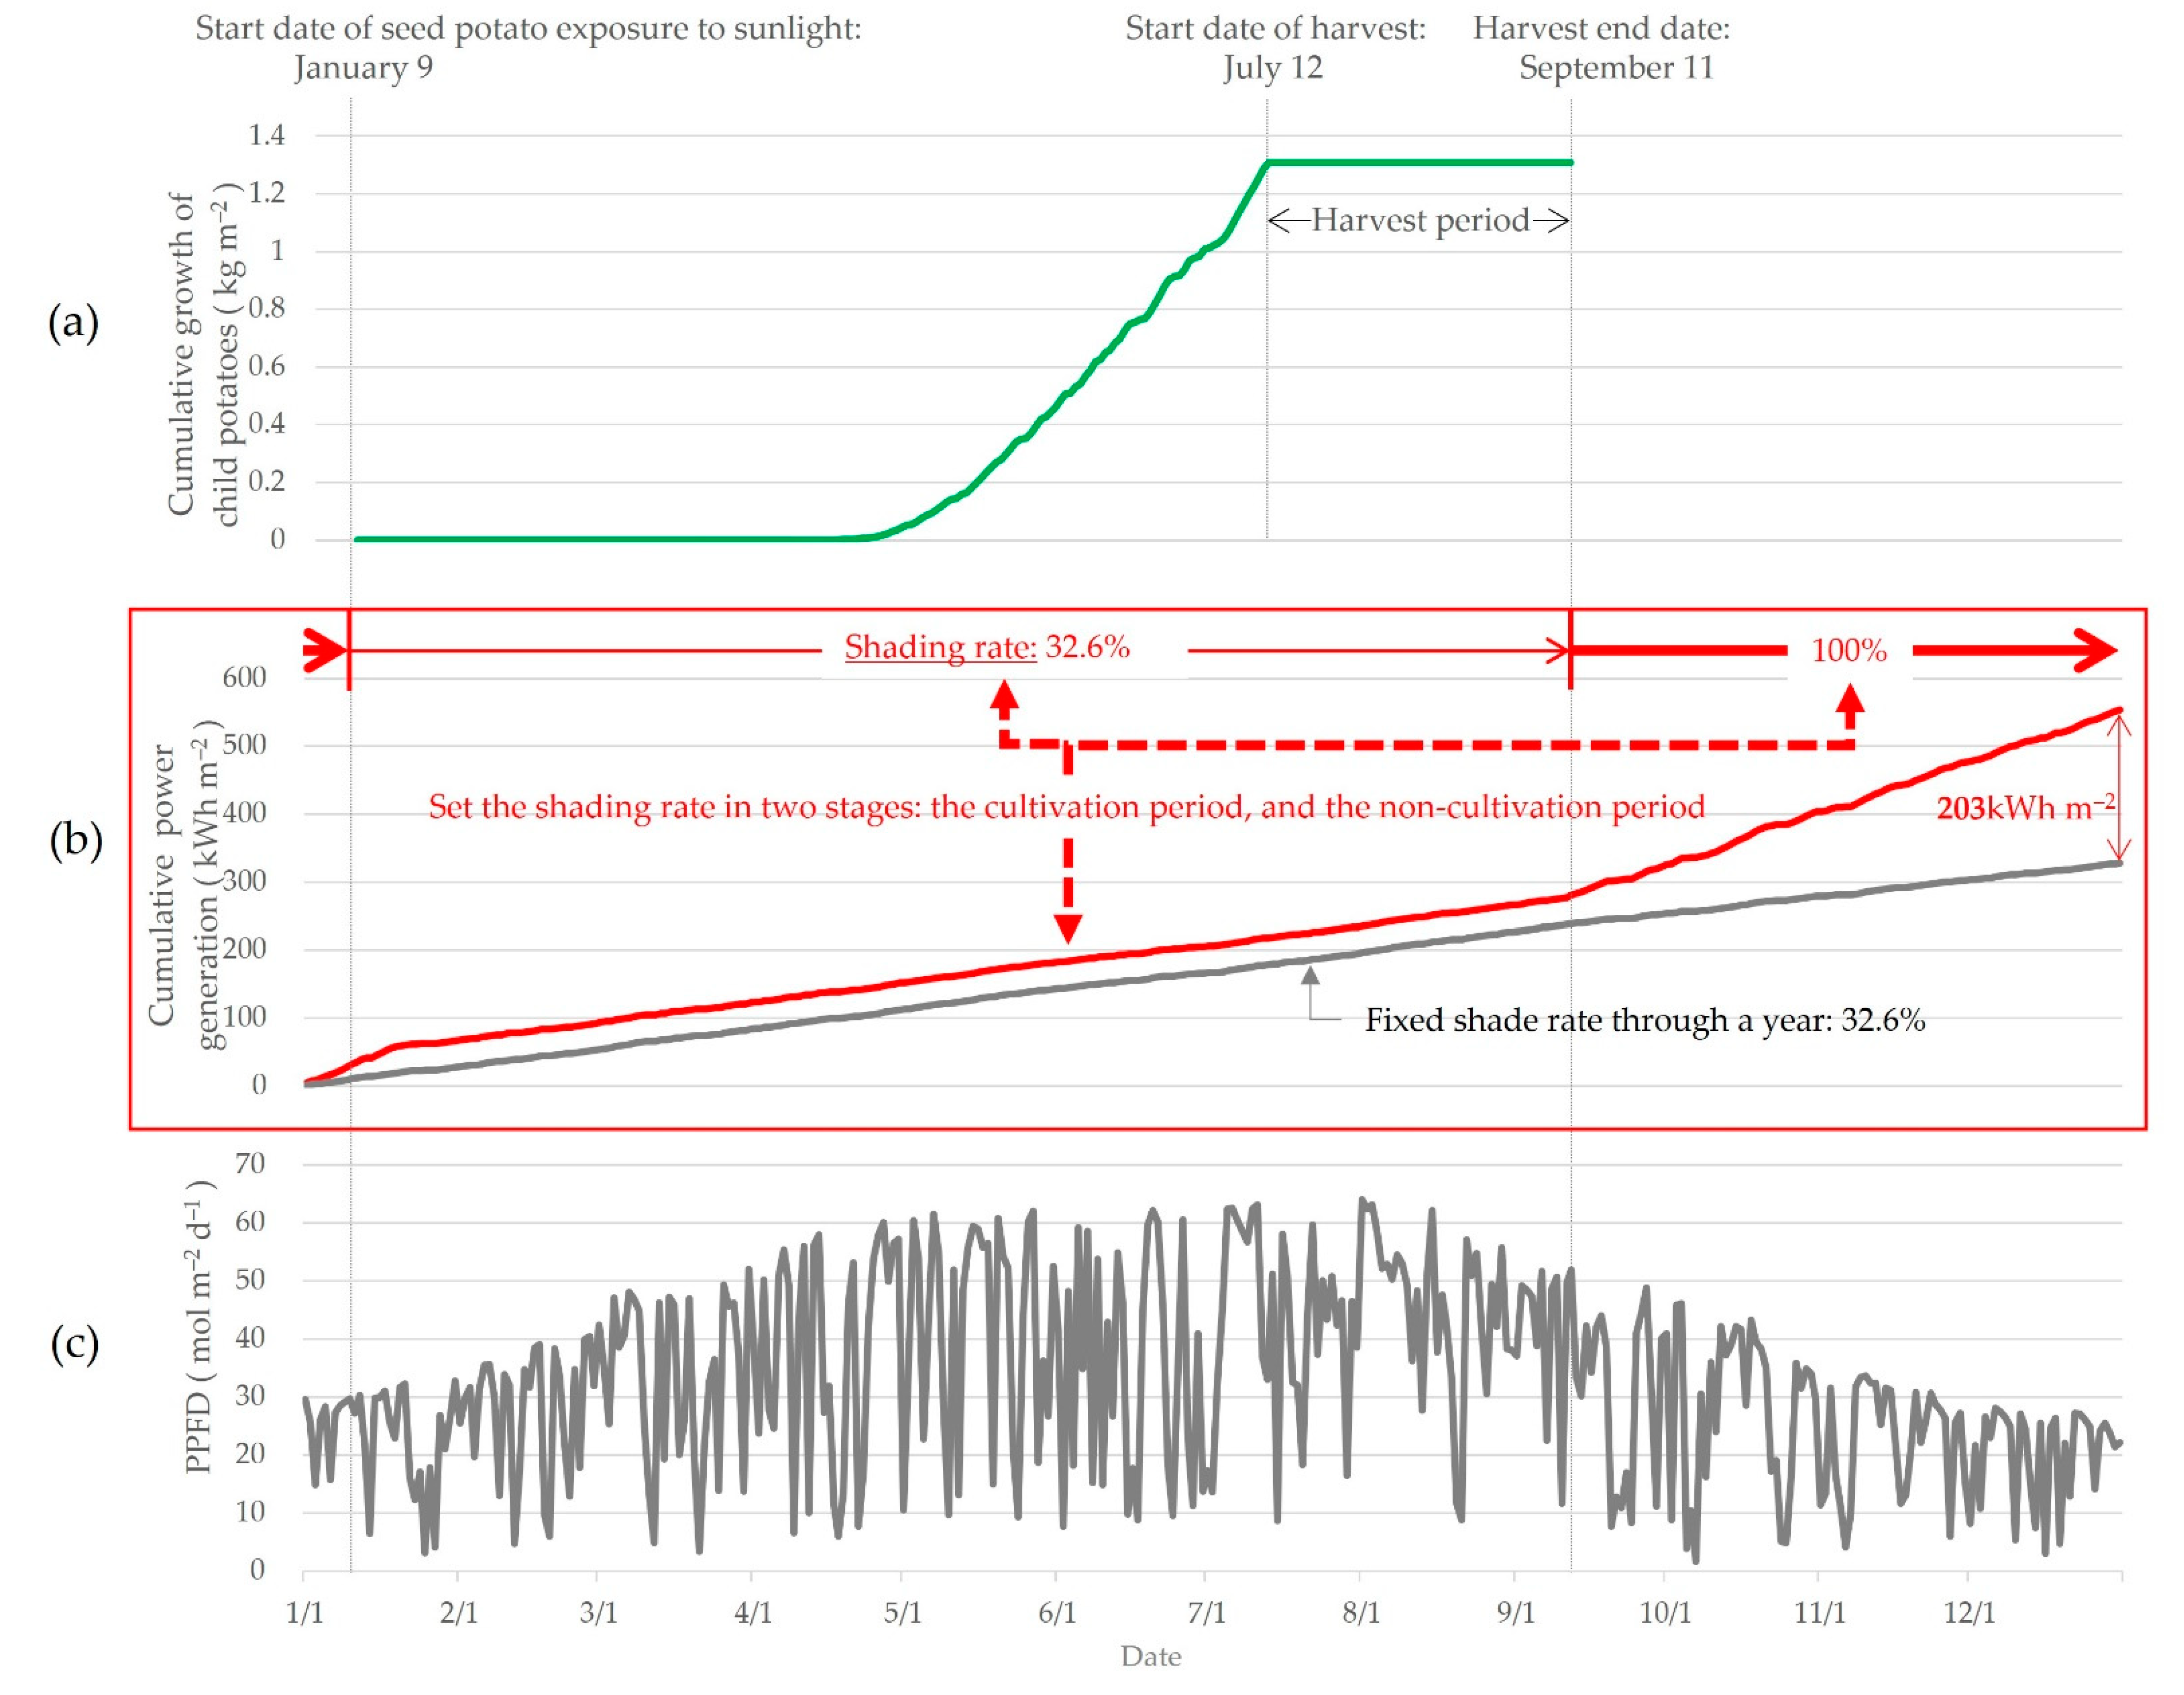
3.2. Calculation of Cultivation Date to Avoid Delaying Harvest Date Due to Solar Panel Installation
4. Discussion
4.1. Model Applicability
4.2. Study Limitations and Future Study
5. Conclusions
Author Contributions
Funding
Data Availability Statement
Conflicts of Interest
References
- Dupraz, C.; Marrou, H.; Talbot, G.; Dufour, L.; Nogier, A.; Ferard, Y. Combining solar photovoltaic panels and food crops for optimising land use: Towards new agrivoltaic schemes. Renew. Energy 2011, 36, 2725–2732. [Google Scholar] [CrossRef]
- Schindele, S.; Trommsdorff, M.; Schlaak, A.; Obergfell, T.; Bopp, G.; Reise, C.; Braun, C.; Weselek, A.; Bauerle, A.; Högy, P.; et al. Implementation of agrophotovoltaics: Techno-economic analysis of the price-performance ratio and its policy implications. Appl. Energy 2020, 265, 114737. [Google Scholar] [CrossRef]
- Tajimam, M.; Iida, T. Evolution of agrivoltaic farms in Japan. AIP Conf. Proc. 2021, 2361, 030002. [Google Scholar] [CrossRef]
- Pascaris, A.S. Examining existing policy to inform a comprehensive legal framework for agrivoltaics in the U.S. Energy Policy 2021, 159, 112620. [Google Scholar] [CrossRef]
- Marrou, H.; Guilioni, L.; Dufour, L.; Dupraz, C.; Wery, J. Microclimate under agrivoltaic systems: Is crop growth rate affected in the partial shade of solar panels? Agric. For. Meteorol. 2013, 177, 117–132. [Google Scholar] [CrossRef]
- Cho, J.; Park, S.M.; Park, A.R.; Lee, O.C.; Nam, G.; Ra, I.-H. Application of Photovoltaic Systems for Agriculture: A Study on the Relationship between Power Generation and Farming for the Improvement of Photovoltaic Applications in Agriculture. Energies 2020, 13, 4815. [Google Scholar] [CrossRef]
- Chopard, J.; Bisson, A.; Lopez, G.; Persello, S.; Richert, C.; Fumey, F. Development of a decision support system to evaluate crop performance under dynamic solar panels. AIP Conf. Proc. 2021, 2361, 050001. [Google Scholar] [CrossRef]
- Gonocruz, R.A.; Nakamura, R.; Yoshino, K.; Homma, M.; Doi, T.; Yoshida, Y.; Tani, A. Analysis of the Rice Yield under an Agrivoltaic System: A Case Study in Japan. Environments 2021, 8, 65. [Google Scholar] [CrossRef]
- Fujita, Y.; Nagumo, Y.; Higuchi, Y.; Kawakami, O.; Yamada, N. Influence of shading treatment on growth and yield of paddy rice and soybean with the objective of solar sharing. Hokuriku Crop Sci. 2019, 54, 22–27. [Google Scholar] [CrossRef]
- Takeuchi, M.; Hayashi, H.; Kato, M. Effects of light interception rate on the growth and yield of buckwheat (Fagopyrum esculentum Moench). Crop Sci. Soc. Jpn. 2019, 247, 51. [Google Scholar] [CrossRef]
- Ministry of Agriculture Forestry and Fisheries of Japan. About the Farming Photovoltaics (FPV). 9. Feb. 27. 2021. Available online: https://www.maff.go.jp/j/shokusan/renewable/energy/attach/pdf/einou-65.pdf (accessed on 27 February 2022).
- Ministry of Agriculture Forestry and Fisheries of Japan. Guide Book for Installing of the Farming Photovoltaics (FPV). 2022. Available online: https://www.maff.go.jp/j/shokusan/renewable/energy/attach/pdf/einou-6.pdf (accessed on 31 August 2022).
- Yamada, A.; Ogata, S. Potential evaluation of agrivoltaic case of Kyoto prefecture Japan. AIP Conf. Proc. 2021, 2361, 020003. [Google Scholar] [CrossRef]
- Dinesh, H.; Pearce, J.M. The potential of agrivoltaic systems. Renew. Sustain. Energy Rev. 2016, 54, 299–308. [Google Scholar] [CrossRef] [Green Version]
- Feuerbacher, A.; Laub, M.; Högy, P.; Lippert, C.; Pataczek, L.; Schindele, S.; Wieck, C.; Zikeli, S. An analytical framework to estimate the economics and adoption potential of dual land-use systems: The case of agrivoltaics. Agric. Syst. 2021, 192, 103193. [Google Scholar] [CrossRef]
- Cuppari, R.I.; Higgins, C.W.; Characklis, G.W. Agrivoltaics and weather risk: A diversification strategy for landowners. Appl. Energy 2021, 291, 116809. [Google Scholar] [CrossRef]
- Nordberg, E.J.; Julian, M.C.; Schwarzkopf, L. Designing solar farms for synergistic commercial and conservation outcomes. Solar Energy 2021, 228, 586–593. [Google Scholar] [CrossRef]
- Marrou, H.; Dufour, L.; Wery, J. How does a shelter of solar panels influence water flows in a soil–crop system? Eur. J. Agron. 2013, 50, 38–51. [Google Scholar] [CrossRef]
- Zainol, M.A.; Mahyuddin, M.N.; Mohd Zainuri, M.A.A. Solar Photovoltaic Architecture and Agronomic Management in Agrivoltaic System: A Review. Sustainability 2021, 13, 7846. [Google Scholar] [CrossRef]
- Elamri, Y.; Cheviron, B.; Lopez, J.-M.; Dejean, C.; Belaud, G. Water budget and crop modelling for agrivoltaic systems: Application to irrigated lettuces. Agric. Water Manag. 2018, 208, 440–453. [Google Scholar] [CrossRef]
- Hassanpour Adeh, E.; Selker, J.S.; Higgins, C.W. Remarkable agrivoltaic influence on soil moisture, micrometeorology and water-use efficiency. PLoS ONE 2018, 13, e0203256. [Google Scholar] [CrossRef] [Green Version]
- Parkinson, S.; Hunt, J. Economic Potential for Rainfed Agrivoltaics in Groundwater-Stressed Regions. Environ. Sci. Technol. Lett. 2020, 7, 525–531. [Google Scholar] [CrossRef]
- Andrew, A.C.; Higgins, C.W.; Bionaz, M.; Smallman, M.A.; Ates, S. Pasture production and lamb growth in agrivoltaic system. AIP Conf. Proc. 2021, 2361, 060001. [Google Scholar] [CrossRef]
- Andrew, A.C.; Higgins, C.W.; Smallman, M.A.; Graham, M.; Ates, S. Herbage Yield, Lamb Growth and Foraging Behavior in Agrivoltaic Production System. Front. Sustain. Food Syst. 2021, 5, 659175. [Google Scholar] [CrossRef]
- Weselek, A.; Ehmann, A.; Zikeli, S.; Lewandowski, I.; Schindele, S.; Högy, P. Agrophotovoltaic systems: Applications, challenges, and opportunities. A review. Agron. Sustain. Dev. 2019, 39, 35. [Google Scholar] [CrossRef]
- Malu, P.R.; Sharma, U.S.; Pearce, J.M. Agrivoltaic potential on grape farms in India. Sustain. Energy Technol. Assess. 2017, 23, 104–110. [Google Scholar] [CrossRef] [Green Version]
- Zayed, M.E.; Zhao, J.; Elsheikh, A.H.; Li, W.; Sadek, S.; Aboelmaaref, M.M. A comprehensive review on Dish/Stirling concentrated solar power systems: Design, optical and geometrical analyses, thermal performance assessment, and applications. J. Clean Prod. 2021, 283, 124664. [Google Scholar] [CrossRef]
- El-Hadary, M.I.; Senthilraja, S.; Zayed, M.E. A hybrid system coupling spiral type solar photovoltaic thermal collector and electrocatalytic hydrogen production cell: Experimental investigation and numerical modeling. Process Saf. Environ. Prot. 2023, 170, 1101–1120. [Google Scholar] [CrossRef]
- Majumdar, S.; Pasqualetti, M.J. Dual use of agricultural land: Introducing ‘agrivoltaics’ in Phoenix Metropolitan Statistical Area, USA. Landsc. Urban Plan. 2018, 170, 150–168. [Google Scholar] [CrossRef]
- Irie, N.; Kawahara, N.; Esteves, A.M. Sector-wide social impact scoping of agrivoltaic systems: A case study in Japan. Renew. Energy 2019, 139, 1463–1476. [Google Scholar] [CrossRef]
- Pascaris, A.S.; Schelly, C.; Burnham, L.; Pearce, J.M. Integrating solar energy with agriculture: Industry perspectives on the market, community, and socio-political dimensions of agrivoltaics. Energy Res. Soc. Sci. 2021, 75, 102023. [Google Scholar] [CrossRef]
- Braik, A.; Makhalfih, A.; Sopian, K.; Jarimi, H.; Ibrahim, A. Review of agrivoltaics systems potential in Palestine. In Proceedings of the 2021 IEEE Jordan International Joint Conference on Electrical Engineering and Information Technology (JEEIT), Amman, Jordan, 16–18 November 2021; pp. 176–180. [Google Scholar] [CrossRef]
- Moreda, G.P.; Muñoz-García, M.A.; Alonso-García, M.C.; Hernández-Callejo, L. Techno-economic viability of agro-photovoltaic irrigated arable lands in the EU-Med region: A case-study in southwestern Spain. Agronomy 2021, 11, 593. [Google Scholar] [CrossRef]
- Trommsdorff, M.; Kang, J.; Reise, C.; Schindele, S.; Bopp, G.; Ehmann, A.; Weselek, A.; Högy, P.; Obergfell, T. Combining food and energy production: Design of an agrivoltaic system applied in arable and vegetable farming in Germany. Renew. Sustain. Energy Rev. 2021, 140, 110694. [Google Scholar] [CrossRef]
- Coşgun, A.E. The potential of agrivoltaic systems in TURKEY. Energy Rep. 2021, 7, 105–111. [Google Scholar] [CrossRef]
- Willockx, B.; Herteleer, B.; Cappelle, J. Theoretical potential of agrovoltaic systems in Europe: A preliminary study with winter wheat. In Proceedings of the 2020 47th IEEE Photovoltaic Specialists Conference (PVSC), Calgary, ON, Canada, 5 June–21 August 2020; pp. 996–1001. [Google Scholar] [CrossRef]
- Kostik, N.; Bobyl, A.; Rud, V.; Salamov, I. The potential of agrivoltaic systems in the conditions of southern regions of Russian Federation. IOP Conf. Ser. Earth Environ. Sci. 2020, 578, 12047. [Google Scholar] [CrossRef]
- Trommsdorff, M.; Vorast, M.; Durga, N.; Patwardhan, S.M. Potential of agrivoltaics to contribute to socio-economic sustainability: A case study in Maharashtra/India. AIP Conf. Proc. 2021, 2361, 040001. [Google Scholar] [CrossRef]
- Kumpanalaisatit, M.; Setthapun, W.; Sintuya, H.; Jansri, S.N. Efficiency improvement of oround-mounted solar power generation in agrivoltaic system by cultivation of bok choy (Brassica rapa subsp. chinensis L.) under the panels. Int. J. Renew. Energy Dev. 2021, 11, 103–110. [Google Scholar] [CrossRef]
- Randle-Boggis, R.J.; Lara, E.; Onyango, J.; Temu, E.J.; Hartley, S.E. Agrivoltaics in East Africa: Opportunities and challenges. AIP Conf. Proc. 2021, 2361, 090001. [Google Scholar] [CrossRef]
- Toledo, C.; Scognamiglio, A. Agrivoltaic Systems Design and Assessment: A Critical Review, and a Descriptive Model towards a Sustainable Landscape Vision (Three-Dimensional Agrivoltaic Patterns). Sustainability 2021, 13, 6871. [Google Scholar] [CrossRef]
- Adeh, E.H.; Good, S.P.; Calaf, M.; Higgins, C.W. Solar PV power potential is greatest over croplands. Sci. Rep. 2019, 9, 11442. [Google Scholar] [CrossRef] [Green Version]
- Valle, B.; Simonneau, T.; Sourd, F.; Pechier, P.; Hamard, P.; Frisson, T.; Ryckewaert, M.; Christophe, A. Increasing the total productivity of a land by combining mobile photovoltaic panels and food crops. Appl. Energy 2017, 206, 1495–1507. [Google Scholar] [CrossRef]
- Perna, A.; Grubbs, E.K.; Agrawal, R.; Bermel, P. Design considerations for agrophotovoltaic systems: Maintaining PV area with increased crop yield. In Proceedings of the 2019 IEEE 46th Photovoltaic Specialists Conference (PVSC), Chicago, IL, USA, 16–21 June 2019; pp. 668–672. [Google Scholar] [CrossRef]
- Osterthun, N.; Neugebohrn, N.; Gehrke, K.; Vehse, M.; Agert, C. Spectral engineering of ultrathin germanium solar cells for combined photovoltaic and photosynthesis. Opt. Express 2021, 29, 938. [Google Scholar] [CrossRef]
- Keil, J.; Liu, Y.; Kortshagen, U.; Ferry, V.E. Bilayer Luminescent Solar Concentrators with Enhanced Absorption and Efficiency for Agrivoltaic Applications. ACS Appl. Energy Mater. 2021, 4, 14102–14110. [Google Scholar] [CrossRef]
- Honsberg, C.B.; Sampson, R.; Kostuk, R.; Barron-Gafford, G.; Bowden, S.; Goodnick, S. Agrivoltaic Modules Co-Designed for Electrical and Crop Productivity. In Proceedings of the 2021 IEEE 48th Photovoltaic Specialists Conference (PVSC), Fort Lauderdale, FL, USA, 20–25 June 2021; pp. 2163–2166. [Google Scholar] [CrossRef]
- Othman, N.F.; Jamian, S.; Su, A.S.M.; Ya’acob, M.E. Tropical field assessment on pests for Misai Kucing cultivation under agrivoltaics farming system. AIP Conf. Proc. 2019, 2129, 020002. [Google Scholar] [CrossRef]
- Othman, N.F.; Yaacob, M.; Su, A.M.; Jaafar, J.; Hizam, H.; Shahidan, M.; Jamaluddin, A.; Chen, G.; Jalaludin, A. Modeling of Stochastic Temperature and Heat Stress Directly Underneath Agrivoltaic Conditions with Orthosiphon Stamineus Crop Cultivation. Agronomy 2020, 10, 1472. [Google Scholar] [CrossRef]
- Yajima, D.; Toyoda, T.; Kirimura, M.; Araki, K.; Ota, Y.; Nishioka, K. Agrivoltaic system: Estimation of photosynthetic photon flux density under solar panels based on solar irradiation data using all-climate solar spectrum model. Clean Eng. Technol. 2023, 12, 100594. [Google Scholar] [CrossRef]
- Tawa, H.; Saiki, H.; Ota, Y.; Araki, K.; Takamoto, T.; Nishioka, K. Accurate output forecasting method for various photovoltaic modules considering incident angle and spectral change owing to atmospheric parameters and cloud conditions. Appl. Sci. 2020, 10, 703. [Google Scholar] [CrossRef] [Green Version]
- Itagaki, A.; Okamura, H.; Yamada, M. Preparation of meteorological data set throughout Japan for suitable design of PV systems. In Proceedings of the 3rd World Conference on Photovoltaic Energy Conversion, 2003, Osaka, Japan, 11–18 May 2003; pp. 2074–2077. [Google Scholar]
- Santra, P.; Meena, H.M.; Yadav, O.P. Spatial and temporal variation of photosynthetic photon flux density within agrivoltaic system in hot arid region of India. Biosyst. Eng. 2021, 209, 74–93. [Google Scholar] [CrossRef]
- Sekiyama, T.; Nagashima, A. Solar Sharing for Both Food and Clean Energy Production: Performance of Agrivoltaic Systems for Corn, A Typical Shade-Intolerant Crop. Environments 2019, 6, 65. [Google Scholar] [CrossRef] [Green Version]
- Omoto, Y.; Uewada, T. Effect of Shading on Growth and Yield of Taro. J. Agric. Meteorol. 1982, 38, 55–58. [Google Scholar] [CrossRef]
- Sugimoto, H. Photosynthesis of Daughter-Tuber Leaves in Eddoe Population and Its Contribution to Canopy Photosynthesis and Tuber Yield. Jpn. J. Crop Sci. 2001, 70, 92–98. [Google Scholar] [CrossRef] [Green Version]
- Sugimoto, H. Partitioning of 13C-labeled Photosynthate in Eddoe Plants with Special Reference to Source-sink Unit. Jpn. J. Crop Sci. 2001, 70, 99–104. [Google Scholar] [CrossRef] [Green Version]
- Forestry and Fisheries Bio-Recycling Research Systematization Sub-Team of the Agriculture, Design and Evaluation of Biomass Utilization System. The National Agriculture and Food Research Organization. Available online: https://www.naro.affrc.go.jp/org/nkk/soshiki/soshiki07-shigen/01shigen/sekkeitohyouka.html (accessed on 31 August 2022).
- Metropolitan Central Wholesale Market of Japan. Market Statistics Information. Available online: https://www.shijou.metro.tokyo.lg.jp/torihiki/geppo/ (accessed on 6 March 2022).
- Almodfer, R.; Zayed, M.E.; Elaziz, M.A.; Aboelmaaref, M.M.; Mudhsh, M.; Elsheikh, A.H. Modeling of a solar-powered thermoelectric air-conditioning system using a random vector functional link network integrated with jellyfish search algorithm. Case Stud. Therm. Eng. 2022, 31, 101797. [Google Scholar] [CrossRef]


| Item | Precondition |
|---|---|
| Area of farmland | 10,000 m2 |
| Installation rate of solar panels on the farmland | 80% (8000 m2) |
| Tilting angle of solar panels | 30 degrees |
| Shading rate by solar panels | 32.6% |
| Output of solar panel | 218 Wm−2 |
| Unit selling price of electricity | 10 yen kWh−1 (around USD0.09 kWh−1) |
| Variables | Description |
|---|---|
| i | Index number of elapsed days from the start day of seed potato exposure to sunlight to the day of harvest (0 ≤ i < 170) |
| Wp | Growth weight of child potatoes (g m−2 (farmland)) |
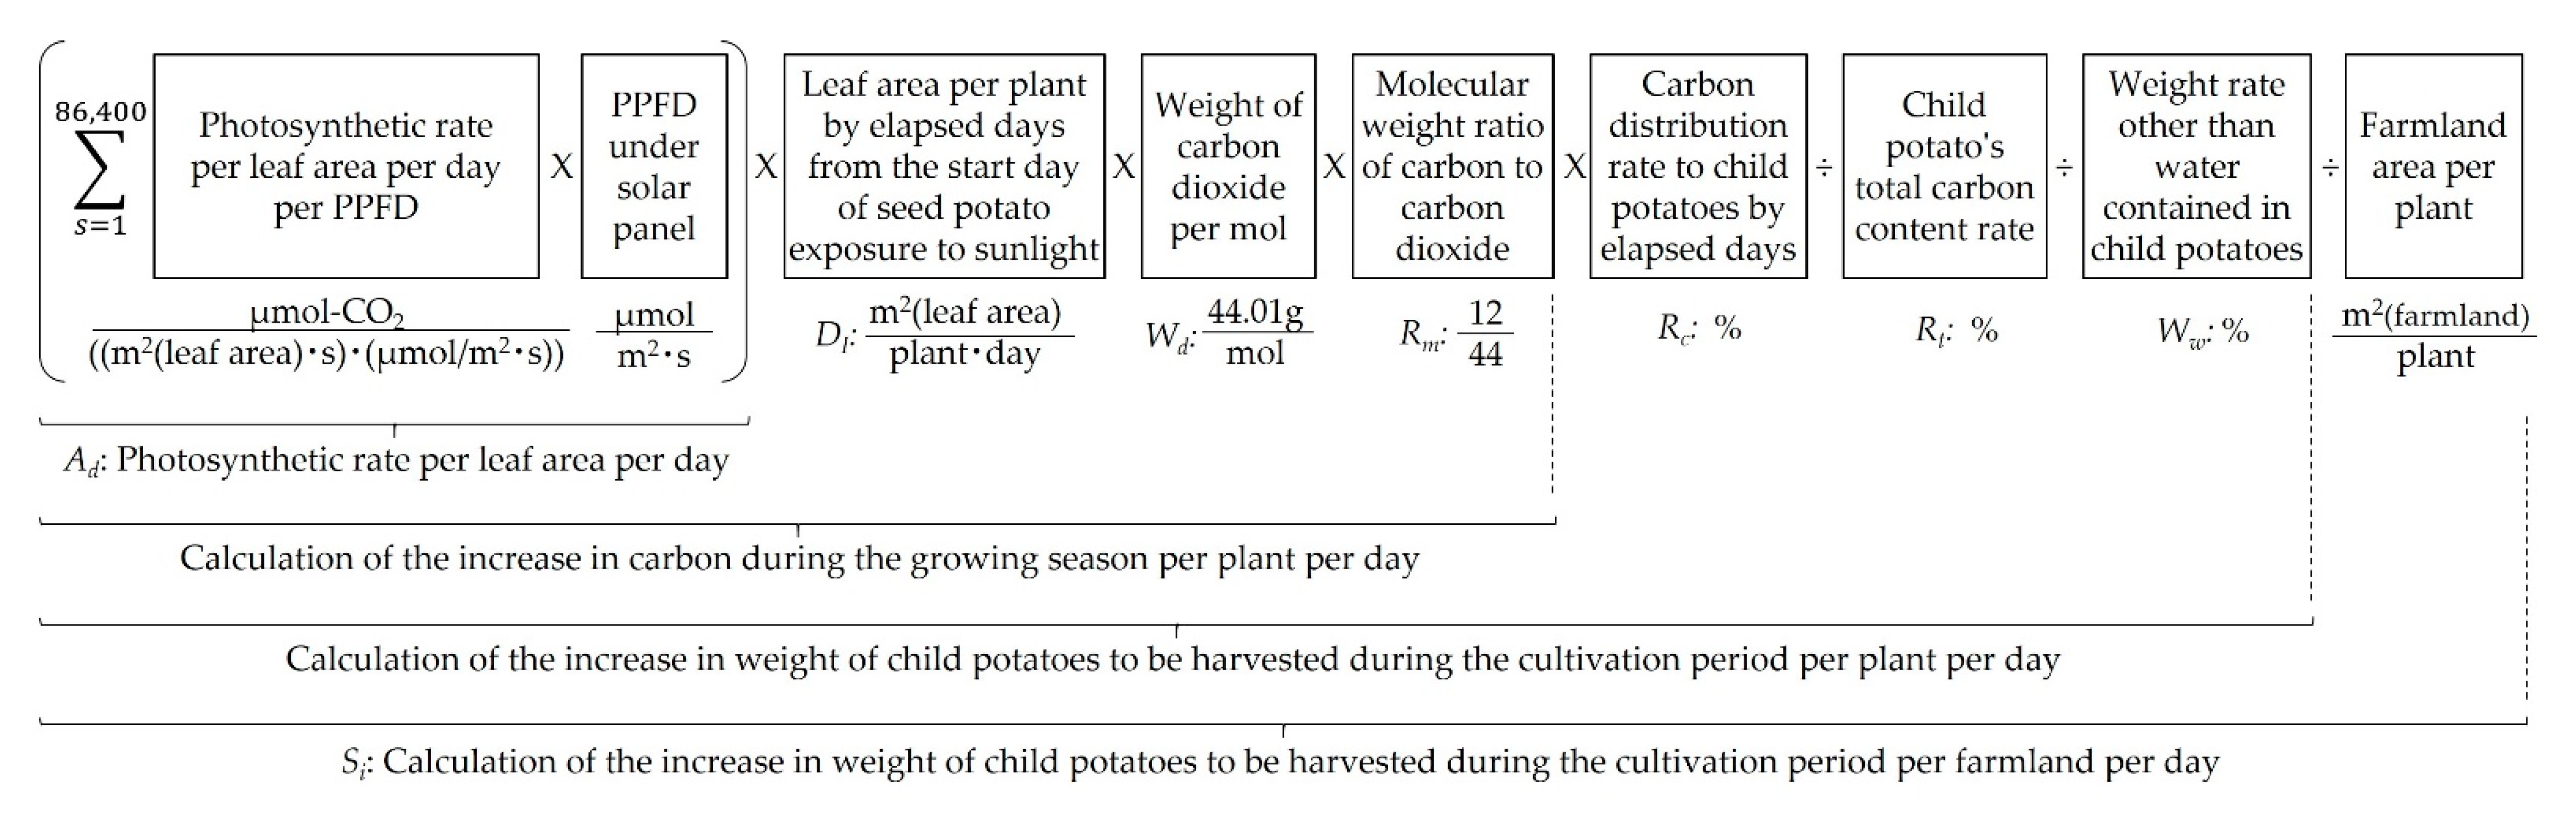
| Ad | Photosynthetic rate per leaf area per day (μmol (CO2) m−2 (leaf) d−1, 0 <) |
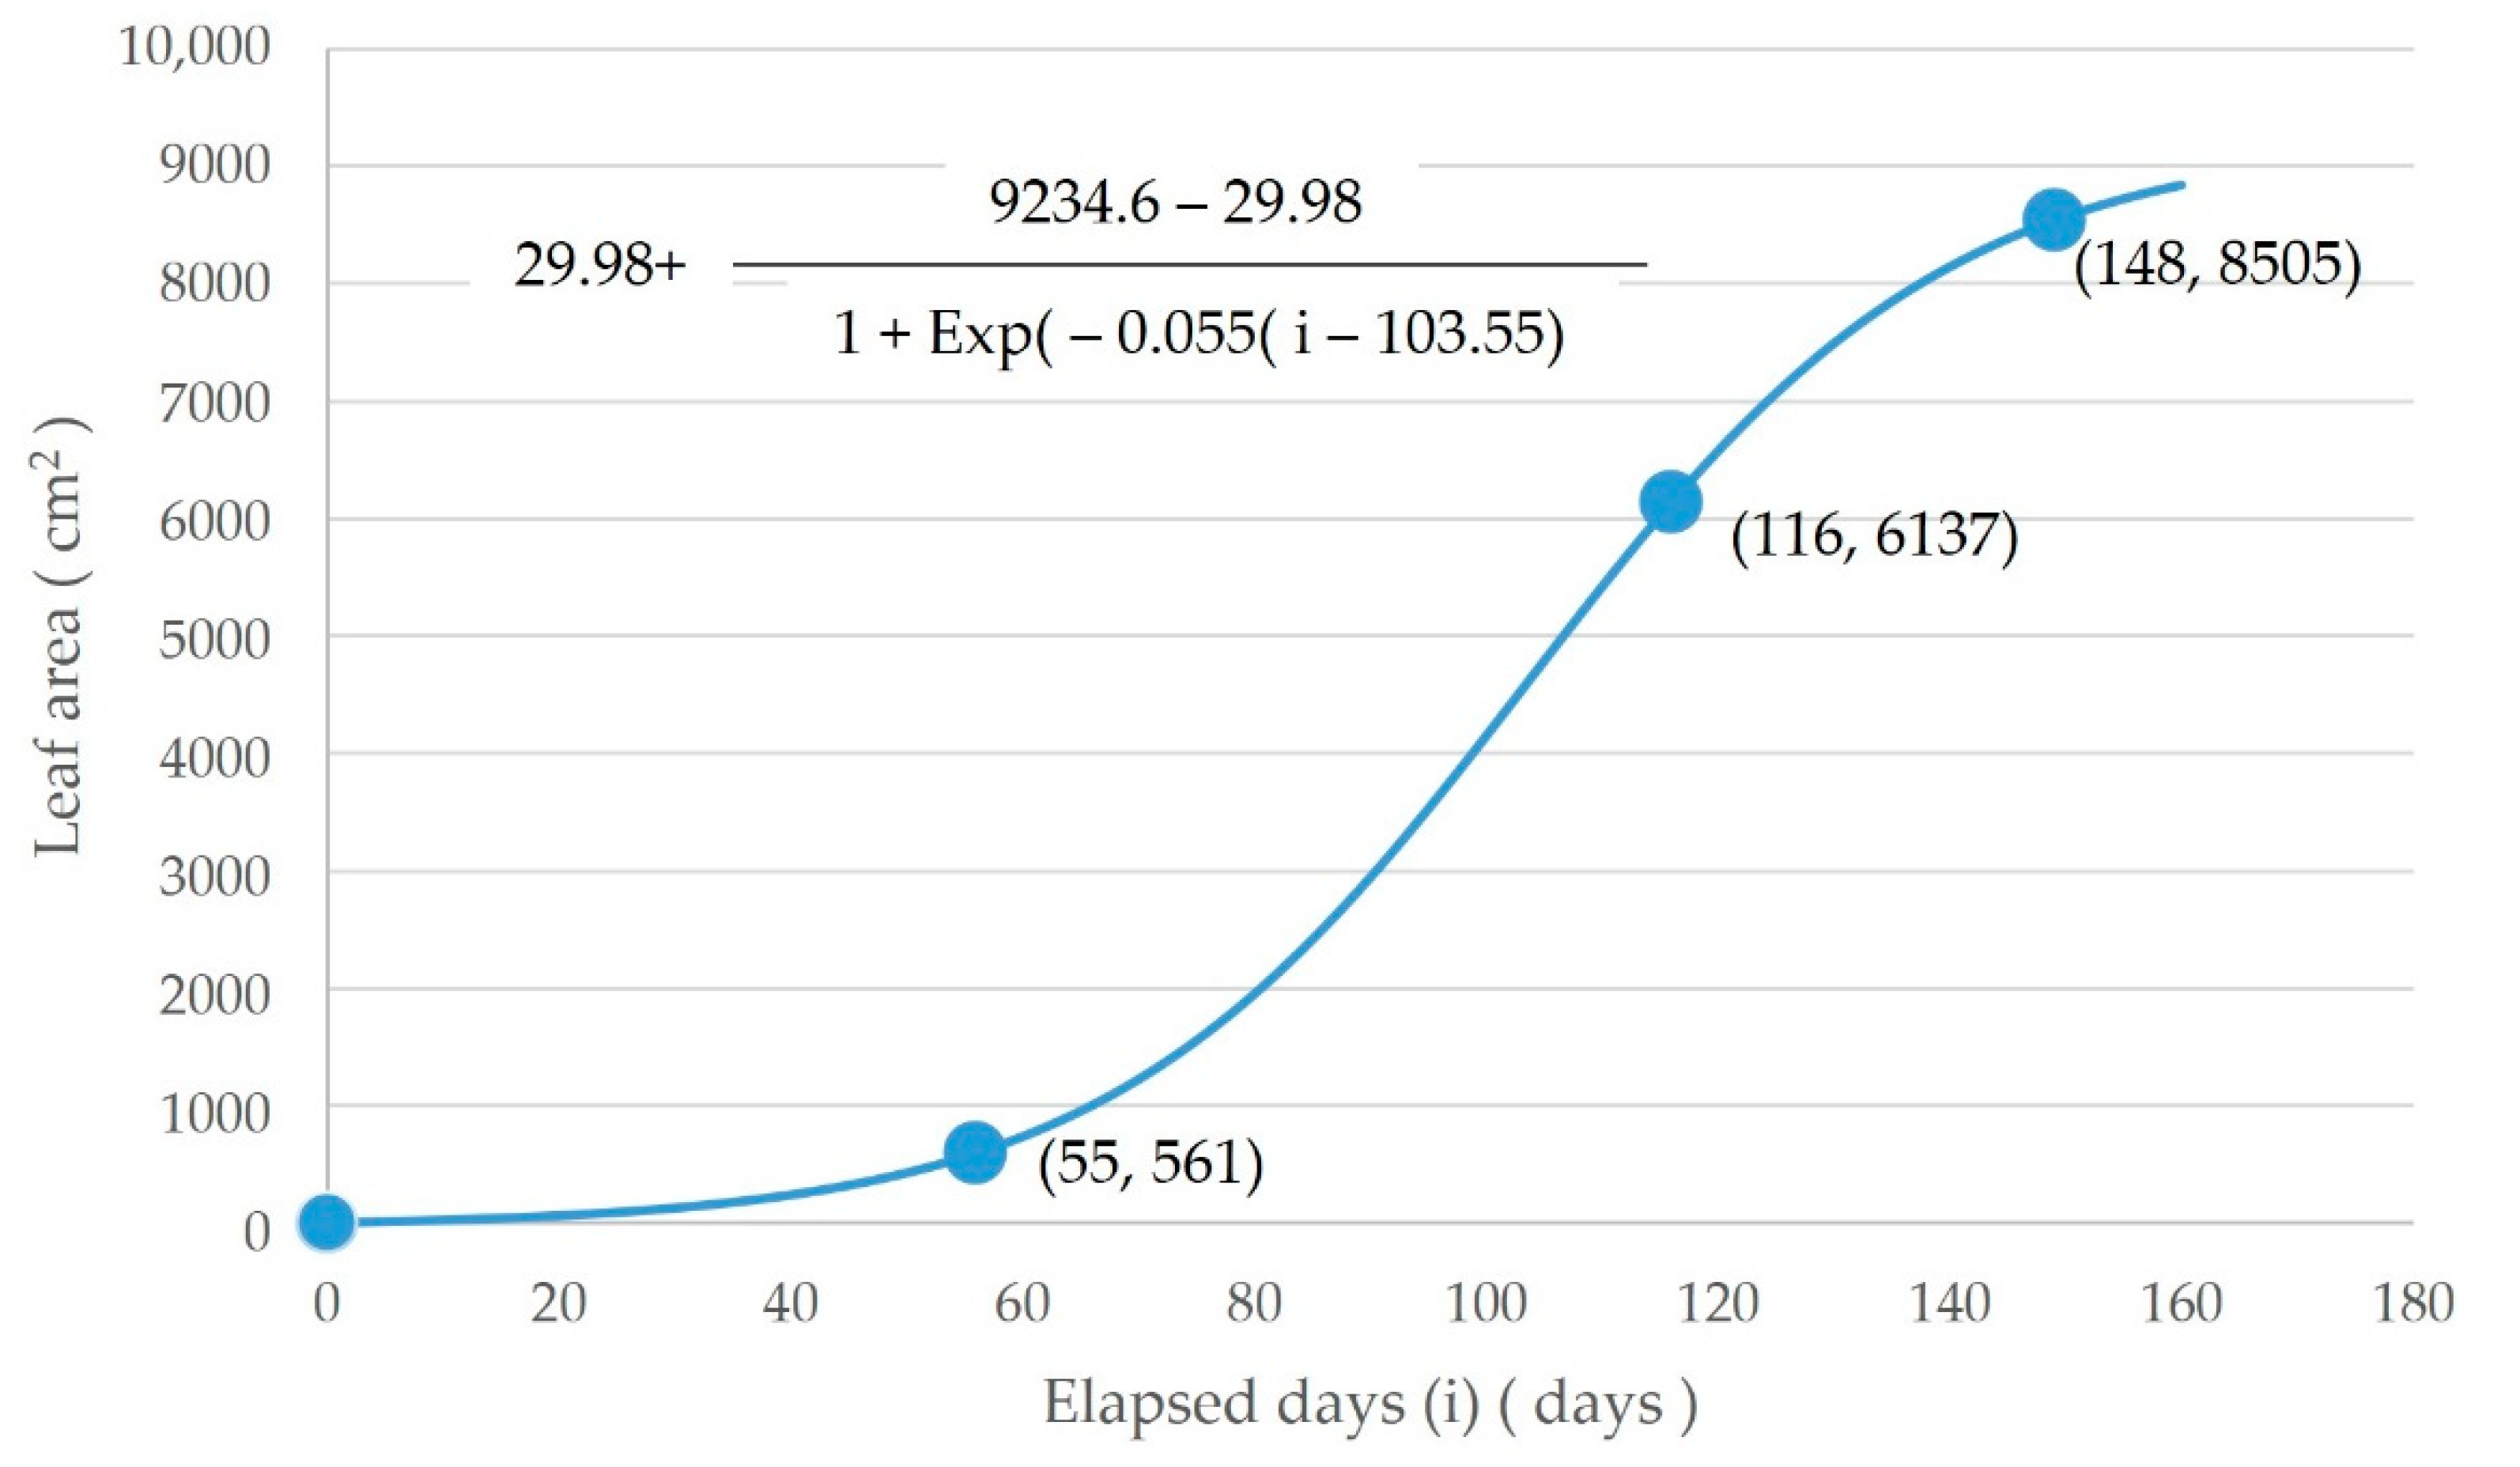
| Dl | Leaf area per plant by elapsed days from the start day of seed potato exposure to sunlight (m2 (leaf) per plant, 0 <) |
| Wd | Weight of carbon dioxide per mol (= 44.01 g mol−1 (CO2)) |
| Rm | Molecular weight ratio of carbon to carbon dioxide (= 12 / 44) |
| Rc | Carbon distribution rate to child potatoes by elapsed days (0 <) |
| Rt | Child potato’s total carbon content rate (0 <) |
| Wc | Dry weight ratio of carbohydrates in child potatoes (= 0.131) |
| Wr | Dry weight ratio of protein in child potatoes (= 0.015) |
| Wf | Dry weight ratio of fat in child potatoes (= 0.001) |
| Ww | Weight rate other than water contained in child potatoes (= 0.159) |
| Df | Farmland area per plant (m2 (farmland) per plant) (0 <) |
| Cases | Description |
|---|---|
| Case A | No solar panels installed |
| Case B | Highest calculated PPFD value on the farmland under the solar panels |
| Case C | Lowest calculated PPFD value on the farmland under the solar panels |
| Item | Precondition |
|---|---|
| Seed potatoes sunlight exposure date | January 9 |
| Harvest starts data | July 12 and continues for two months |
| Shading rate during cultivation | 32.6% |
| Shading rate when cultivation is unsuitable | 100% |
Disclaimer/Publisher’s Note: The statements, opinions and data contained in all publications are solely those of the individual author(s) and contributor(s) and not of MDPI and/or the editor(s). MDPI and/or the editor(s) disclaim responsibility for any injury to people or property resulting from any ideas, methods, instructions or products referred to in the content. |
© 2023 by the authors. Licensee MDPI, Basel, Switzerland. This article is an open access article distributed under the terms and conditions of the Creative Commons Attribution (CC BY) license (https://creativecommons.org/licenses/by/4.0/).
Share and Cite
Yajima, D.; Toyoda, T.; Kirimura, M.; Araki, K.; Ota, Y.; Nishioka, K. Estimation Model of Agrivoltaic Systems Maximizing for Both Photovoltaic Electricity Generation and Agricultural Production. Energies 2023, 16, 3261. https://doi.org/10.3390/en16073261
Yajima D, Toyoda T, Kirimura M, Araki K, Ota Y, Nishioka K. Estimation Model of Agrivoltaic Systems Maximizing for Both Photovoltaic Electricity Generation and Agricultural Production. Energies. 2023; 16(7):3261. https://doi.org/10.3390/en16073261
Chicago/Turabian StyleYajima, Daisuke, Teruya Toyoda, Masaaki Kirimura, Kenji Araki, Yasuyuki Ota, and Kensuke Nishioka. 2023. "Estimation Model of Agrivoltaic Systems Maximizing for Both Photovoltaic Electricity Generation and Agricultural Production" Energies 16, no. 7: 3261. https://doi.org/10.3390/en16073261