Article

Virtual Development of Advanced Thermal Management Functions Using Model-in-the-Loop Applications

1
Chair of Thermodynamics of Mobile Energy Conversion Systems, RWTH Aachen University, Forckenbeckstraße 4, 52074 Aachen, Germany
2
FEV Europe GmbH, Neuenhofstraße 181, 52078 Aachen, Germany
*
Author to whom correspondence should be addressed.
Energies 2023, 16(7), 3238; https://doi.org/10.3390/en16073238
Submission received: 16 February 2023 / Revised: 23 March 2023 / Accepted: 30 March 2023 / Published: 4 April 2023
(This article belongs to the Special Issue Thermal Management of Internal Combustion Engines)

Abstract

:
Development challenges in the automotive industry are constantly increasing due to the high number of vehicle variants, the growing complexity of powertrains, and future legal requirements. In order to reduce development times while maintaining a high level of product quality and financial feasibility, the application of new model-based methods for virtual powertrain calibration is a particularly suitable approach. In this context, TME and FEV combine advanced thermal management models with electronic control unit (ECU) models for model-in-the-loop applications. This paper presents a development process for ECU and on-board diagnostics (OBD) functions of thermal management systems in hybrid electric vehicles. Thanks to the highly accurate 1D/3D-models, optimal control strategies for electrically actuated components can be developed in early development phases. Virtual sensors for local temperatures are developed for the ECU software to enable a cost-effective use of dedicated control functions. Furthermore, an application for OBD cooling system leakage detection is shown. Finally, the transferability of the methodology to a battery cooling system is demonstrated.

1. Introduction

In order to comply with the Paris Climate Agreement to reduce global warming, the European Commission adopted the European Green Deal in 2019 [1,2]. The targets are defined in directives of the “Fit for 55” package and require CO2-neutral operation of newly registered vehicles in the transport sector from 2035 (see accelerated scenario in Figure 1). This is a major challenge for the automotive industry, as the homologation of conventional and hybrid powertrains with internal combustion engines would only be possible in combination with synthetic fuels. The EU decision on this approval is still pending and is expected in 2023 [1]. Figure 1 shows the projected future distribution of powertrain technologies for two different scenarios in Europe. In the transition phase to carbon-free mobility, a mix of different technologies is expected to achieve the intermediate fleet target of 59 gCO2/km in 2030 [3,4]. The ramp-up of electric vehicles is largely determined by customer acceptance with criteria such as charging infrastructure, costs, or driving range [5]. In the recent past, the targeted new registrations could not be achieved due to ongoing supply chain problems for raw materials and semiconductors, especially during the COVID-19 pandemic [6,7]. In case of EU approval of renewable fuels, a higher share of vehicles with internal combustion engine is conceivable after 2035.
Besides CO2 emissions, the negative impact of pollutants on air quality has been reduced in recent decades by continuously lowering pollution limits. As part of the Green Deal, the EU published a proposal for a new EU7 pollutant emissions directive in October 2022 [8,9].
Optimal powertrain energy management is necessary to cost-effectively meet all regulatory requirements. The use of chemical energy in the combustion engine and battery, as well as electrical energy in the electric components, is determined by the overall powertrain operating strategy, which can be implemented using a variety of approaches [10,11,12,13,14]. For the propulsion of the vehicle, these energies must be converted into mechanical energy. During the energy conversion processes, losses occur in the form of thermal energy. For peak efficiency operation, the temperatures of all powertrain components must be kept within an optimal temperature range by thermal management [15,16]. Especially for hybrid and electric vehicles, the complexity is rising due to the additional thermal requirements of the battery, inverter, and electric motor and the respective cooling systems.
Combined with a continuous reduction of time-to-market, this leads to challenges in the development process. To ensure financial feasibility and high quality levels while reducing development time, model-based methods for virtual powertrain and vehicle design are increasingly used [16,17,18,19,20,21].
Simulation-based design has been well established in powertrain development for decades. Typical applications in the area of thermal management are shown in Figure 2. In early development phases, cooling system predesign and component sizing can be carried out due to relatively small amount of input data required [22]. The results are continuously reviewed and refined throughout the development process in form of the V-model (see Figure 2) [23]. As more detailed component-specific input data becomes available, different thermal management technologies, such as electric water pumps or electric control valves, are widely investigated [24,25,26].
Today’s state-of-the-art control of these components is rule-based, typically using map-based approaches for target temperatures and relying on physical coolant and oil temperature sensors in the cooling system [15,27,28]. The PID algorithms of these controllers can be enhanced by using fuzzy controllers or a Smith predictor, which reduces the temperature overshoot and improves temperature regulation [29,30]. According to other publications, model predictive control with reduced order models (ROM) can further increase the engine efficiency by exploiting the nucleate boiling heat transfer [25,31].
Modular ROMs with lumped thermal masses of the real system are mainly used for the control strategy development due to the simulation effort and real-time capability on the ECU [32,33,34,35,36,37]. The reusability in different projects and the relatively low effort for model input data configuration is beneficial. However, one of the main challenges is the availability of measurement results for model calibration and the corresponding effort [32].
Therefore, comprehensive validation in early development phases for models with high calibration requirements is only possible by accepting increased inaccuracies. Hence, additional time, cost-intensive work and earlier prototype hardware are required to enable the implementation of advanced control strategies. In general, this may lead to the need for earlier HiL and vehicle testing.
Simulation results of 3D CFD and CHT modelling approaches show higher accuracies without calibration and enable the analysis of stationary local component heat transfer. However, a transient system analysis and control strategy development is not appropriate due to the high computational effort [17,38,39,40,41]. For this purpose, Millo and Banjac use 1D models for the cooling and lubrication system with its respective fluids in combination with 3D engine mesh [24,42]. Depending on the mesh resolution, the simulation time can be strongly reduced compared to the CFD/CHT approach. This ensures a transient analysis of the heat transfer within the overall thermal management system and the driving cycle fuel economy.
The novelty of the presented methodology is the setup of real-time capable thermal management models (ATMM) in a 1D/3D approach and its application for ECU and OBD function development in early project phases without the need for hardware measurements. The resulting functions are validated with the ATMM in a virtual vehicle MiL environment. The following research objectives are addressed in this article:
  • Development of a methodology for designing thermal management features early in the product life cycle.
  • Setup of advanced thermal management models that reflect the real system to enable high accuracy with low calibration effort and real-time capability.
  • Demonstration of control unit function development for electric actuators in an internal combustion engine cooling system. Here, intelligent functions enable highest efficiency and thermal safety under all driving conditions. In addition, the influence of model predictive control on efficiency is analyzed.
  • Demonstration of the development of on-board diagnostic functions for failure mode detection in a cooling system of an ICE.
  • Demonstration of the methodology transferability for a battery cooling system in a challenging kickdown driving scenario.

2. Methodology of Control Unit Function Development

In order to overcome the disadvantages of using ROMs for software development, TME and FEV use a customized development approach. First, advanced thermal management models (ATMM) are developed. These include meshed component structures connected to one-dimensional cooling and lubrication systems. The heat transfer between fluid, air and structure is represented by detailed physical-empirical correlations. As a result, the model accuracy can be significantly improved compared to ROMs even without the availability of measured data.
Based on ATMM simulation results, MATLAB Simulink ROMs can be calibrated with virtual sensors. ECU functions are derived from the thermal requirements and integrated into the models.
Initially, the control strategy is predesigned only within the ATMM. Afterwards, both models are coupled together to form the model-in-the-loop environment. This allows reproducible and reliable ECU software testing in the virtual vehicle under real driving conditions long before component or ECU hardware is available. Consequently, issues can be found early, and calibration of functions can be performed in early development stages. The result is a high level of confidence and maturity that reduces risk in later development phases.
The extended MiL testing is followed by conventional software-in-the-loop (SiL), as well as shorter periods of HiL and vehicle testing. A reduction in the number of iterations during SiL validation is expected as software maturity improves after MiL. Prototype hardware is still needed for HiL testing but at a later point in the development process. This can lead to reduced costs and easier procurement of parts with the correct hardware specifications. Vehicle testing with all climatic and driving extremes still plays a very important role as a final validation step [43]. However, its duration is reduced, and the availability of the vehicle prototype can be postponed.
Results from HiL and vehicle tests can be reused in the MiL environment to provide an end-to-end support throughout the development. This enables improved calibration results in less time. Consequently, ATMM and the MiL approach lead to considerable advantages in function development. For this reason, the paper focuses on the ATMM setup and the subsequent software development.

3. Vehicle Specifications

As an example, a serial-parallel hybrid SUV is chosen as the target vehicle for the simulation study. Its specifications are listed in the Appendix A (see Figure A1). Figure 3 shows the schematic layout of the engine high-temperature cooling circuit, including three controlled actuators and temperature sensors:
  • 12 V electric water pump (450 W)
  • Electric actuated thermal management module
  • 12 V electric fan (600 W)
  • Coolant temperature sensors T1, T2 and T3
Standing water in the entire cooling system is possible by deactivating the electric water pump. This enables fast warm-up of the combustion chamber structure during a cold start. Furthermore, the independence of the water pump from engine speed allows dedicated oil heating strategies with the oil-coolant heat exchanger in parallel with the engine. In addition, the liner temperature can be continuously controlled by the TMM during the coolant warm-up phase. Once the target coolant operating temperature is reached, the ability to control split cooling is limited by simultaneously opening the block and radiator paths. Moreover, a dedicated coolant temperature control is possible, which is beneficial for reducing engine knock tendency at high load or wall heat losses at part load. In order to ensure sufficient heat dissipation from the various cooling circuits to the environment at low vehicle speeds, the electric fan is activated at different speed levels.

4. Model Setup

4.1. Vehicle Model Setup

In order to determine the vehicle and powertrain operation, advanced simulation methodologies are used for the virtual vehicle setup. The main pillars of the simulation approach are shown in Figure 4.
Based on benchmark validated models, the integrated system simulation considers all powertrain components. The driving behavior is respected by variable driver and traffic models for different environmental conditions. All possible powertrain architectures with various levels of complexity can be simulated and optimized in different development phases within the system simulation toolchain. The powertrain optimization is carried out with a scaling approach for all components. In addition, the operation strategy is represented by a parameter set for driving mode changes and battery recharging, developed by [44,45].
Thanks to the physical-empirical modeling approach with high accuracy and low computational effort, a design of experiments (DoE) can be performed. For this purpose, a DoE test plan for the combination of the variable hardware and control input parameters is generated [46]. Thereby, all parameters can be flexibly combined so that the effect of a parameter change on each requirement can be quantified. Possible layout parameters for the powertrain optimization are, e.g., engine displacement, maximum power of the electric machines, battery cell capacity, final drive ratio and operating strategy parameters.
Based on the results of the longitudinal dynamics simulation, the polynomial model can be trained. During optimization, all requirements, such as performance, CO2 emissions, NVH or costs, can be considered and weighted regarding the target customer preferences. After defining individual optimal hardware and control parameter sets using mathematical models, a validation has to be carried out within the vehicle model [47,48].

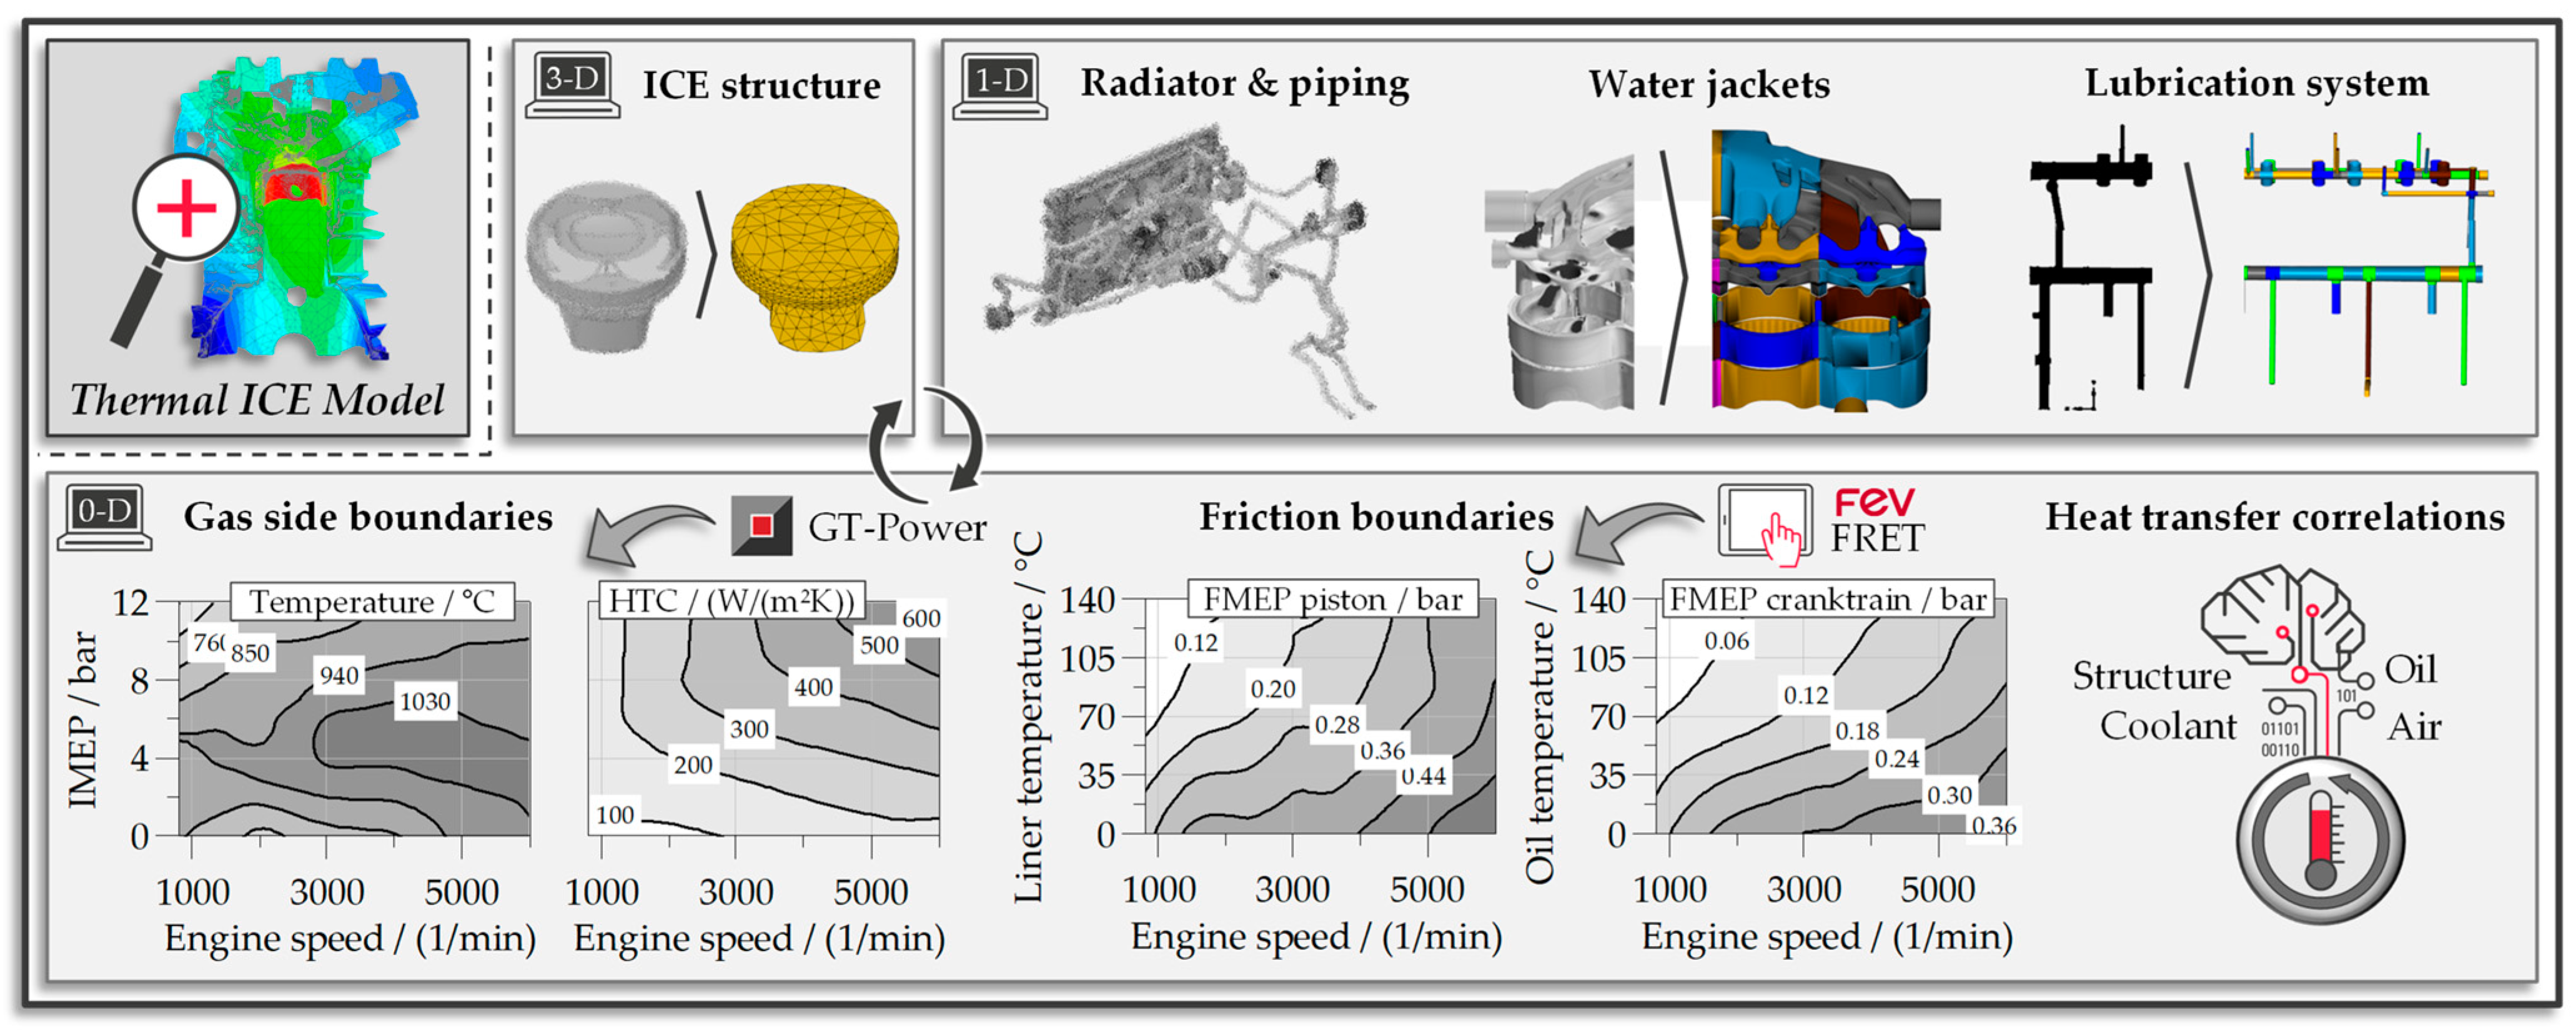
4.2. Advanced Thermal Management Model Setup

The vehicle model is coupled with advanced thermal management submodels, as shown in Figure 5. Thereby, vehicle and powertrain operation conditions, e.g., characterized by component speeds and loads, are inputs for the thermal submodels. This enables transient simulations of local structure, coolant, oil, and air temperatures, which are essential for holistic powertrain evaluation and associated control strategies.
In early development phases, highest model accuracy is ensured by using the finite element method (FEM) for all relevant engine components, including the cylinder block, cylinder head, pistons, and valves. In addition, the lubrication and cooling systems are represented in one-dimensional thermo-hydraulic models. These are extracted from the initial CAD concepts of the engine and peripherals (see top right in Figure 5). Afterwards, the subsystems are transferred to an overall system model. Therefore, the element surfaces are coupled with the corresponding heat transfer objects of the combustion chamber gas side, lubrication side, and coolant side. This requires an accurate discretization of structure surfaces, water jackets and piping geometry.
Coefficients for structure-to-structure and oil-to-structure heat transfer are calculated transiently based on physical-empirical correlations. The heat transfer from the piston via the rings and the cylinder liner to the coolant was investigated by Klaus and described in universal correlations with the following equations [49]. The heat transfer coefficient αPS,L between the piston skirt and the liner is a function of the piston skirt temperature TPS shown in the following Equation (1):
αPS,L = 0.0415 · TPS2 + 178.86
The heat transfer coefficient between the piston and the piston rings αP,PR depends on the engine load, which is defined as the indicated mean effective pressure pmi (see Equation (2)).
αP,PR = 10.86 · pmi2 + 4110.46
The heat transfer between the piston rings and the liner αPR,L is largely dependent on the mean piston velocity cm and the dynamic oil viscosity η shown in Equation (3).
α PR , L = y 1   ·   6   ·   η   ·   c m ·   98066.5 1 1
Thereby, y1 defines the mean coefficient of the piston ring heat transfer areas (see Equation (4)).
y 1 = 0.2709 0.9
According to Klaus, the minimum piston velocity is limited to cm,min = 6.5 m/s [49]. The calculation of the heat transfer coefficients within the water jackets is determined by the Reynolds and Prandtl numbers. Based on that, the individual Nusselt numbers for the cylinder head NuCH (see Equation (5)) and the cylinder block water jacket NuCB (see Equation (6)) are calculated. The corresponding coefficients and exponents are derived from measurements by Pflaum and Mollenhauer [50].
NuCH = 4.3 · Re0.34 · Pr0.33 = αCH · DCH · λCH−1
NuCB = 11.5 · Re0.24 · Pr0.33 = αCB · DCB · λCB−1
After conversion of Equations (5) and (6), the heat transfer coefficients can be determined using the hydraulic diameter of the water jacket section D and the thermal conductivity λ in Equation (7). In later development phases, CFD simulation results can be used to calibrate the local water jacket heat transfer coefficients.
α = Nu · λ · D−1
According to the fundamental investigations of Plettenberg et al., the heat transfer of crankcase splash oil to liner NuO,L can be described with Equation (8) [51].
Nu O , L = K   ·   Re 0.8   ·   Pr 0.33 = α   ·   L   ·   λ 1 = K   ·   ( ρ   ·   u   ·   L η ) 0.8 · ( η   ·   c p λ ) 0.33
For the calculation of the heat transfer coefficient at the piston bottom, the impingement area is divided into several surfaces. The fixed position of the piston cooling jets and the oscillating motion of the piston result in a movement of the direct oil impingement area. The individual Nusselt numbers of the oil covered surfaces are calculated using Equation (9).
NuO,L = K · Rea · Prb · (ηOil · ηWall−1)c = α · LPCJ · λ−1
The corresponding parameters K, a, b, and c are defined in [51]. After conversion of Equation (9), the heat transfer coefficients can be obtained with the hydraulic diameter of the piston cooling jets LPCJ and the ratio of the oil viscosity ηOil to the oil viscosity on the piston surface ηWall.
Gas side boundaries for the heat transfer in the combustion chamber are derived from engine process simulations. Woschni developed a phenomenological model for the combustion heat transfer, which is based on the Newtonian approach and the similarity theorem [16,52,53]. The resulting gas temperatures and heat transfer coefficients for the different combustion chamber zones, such as liner, flame deck, piston, and valves, are converted into maps over the entire engine operating range (see bottom left in Figure 5). Thereby, different combustion calibration settings, e.g., the impact of an ignition angle sweep, can be considered. Furthermore, an advanced friction simulation is included based on local oil and structure temperatures for individual friction groups (see lower center in Figure 5). In the early development phases, FEV’s friction estimation tool FRET is used to generate the required friction maps based on a large database and engineering expertise [54].
The underhood subsystem includes the air path with local air temperatures and flow rates for all radiators and engine components. All radiators interact with the respective cooling system, the environment and among each other. As a result of the transient thermal simulation, the power demand of individual actuators is considered in the overall powertrain energy consumption.

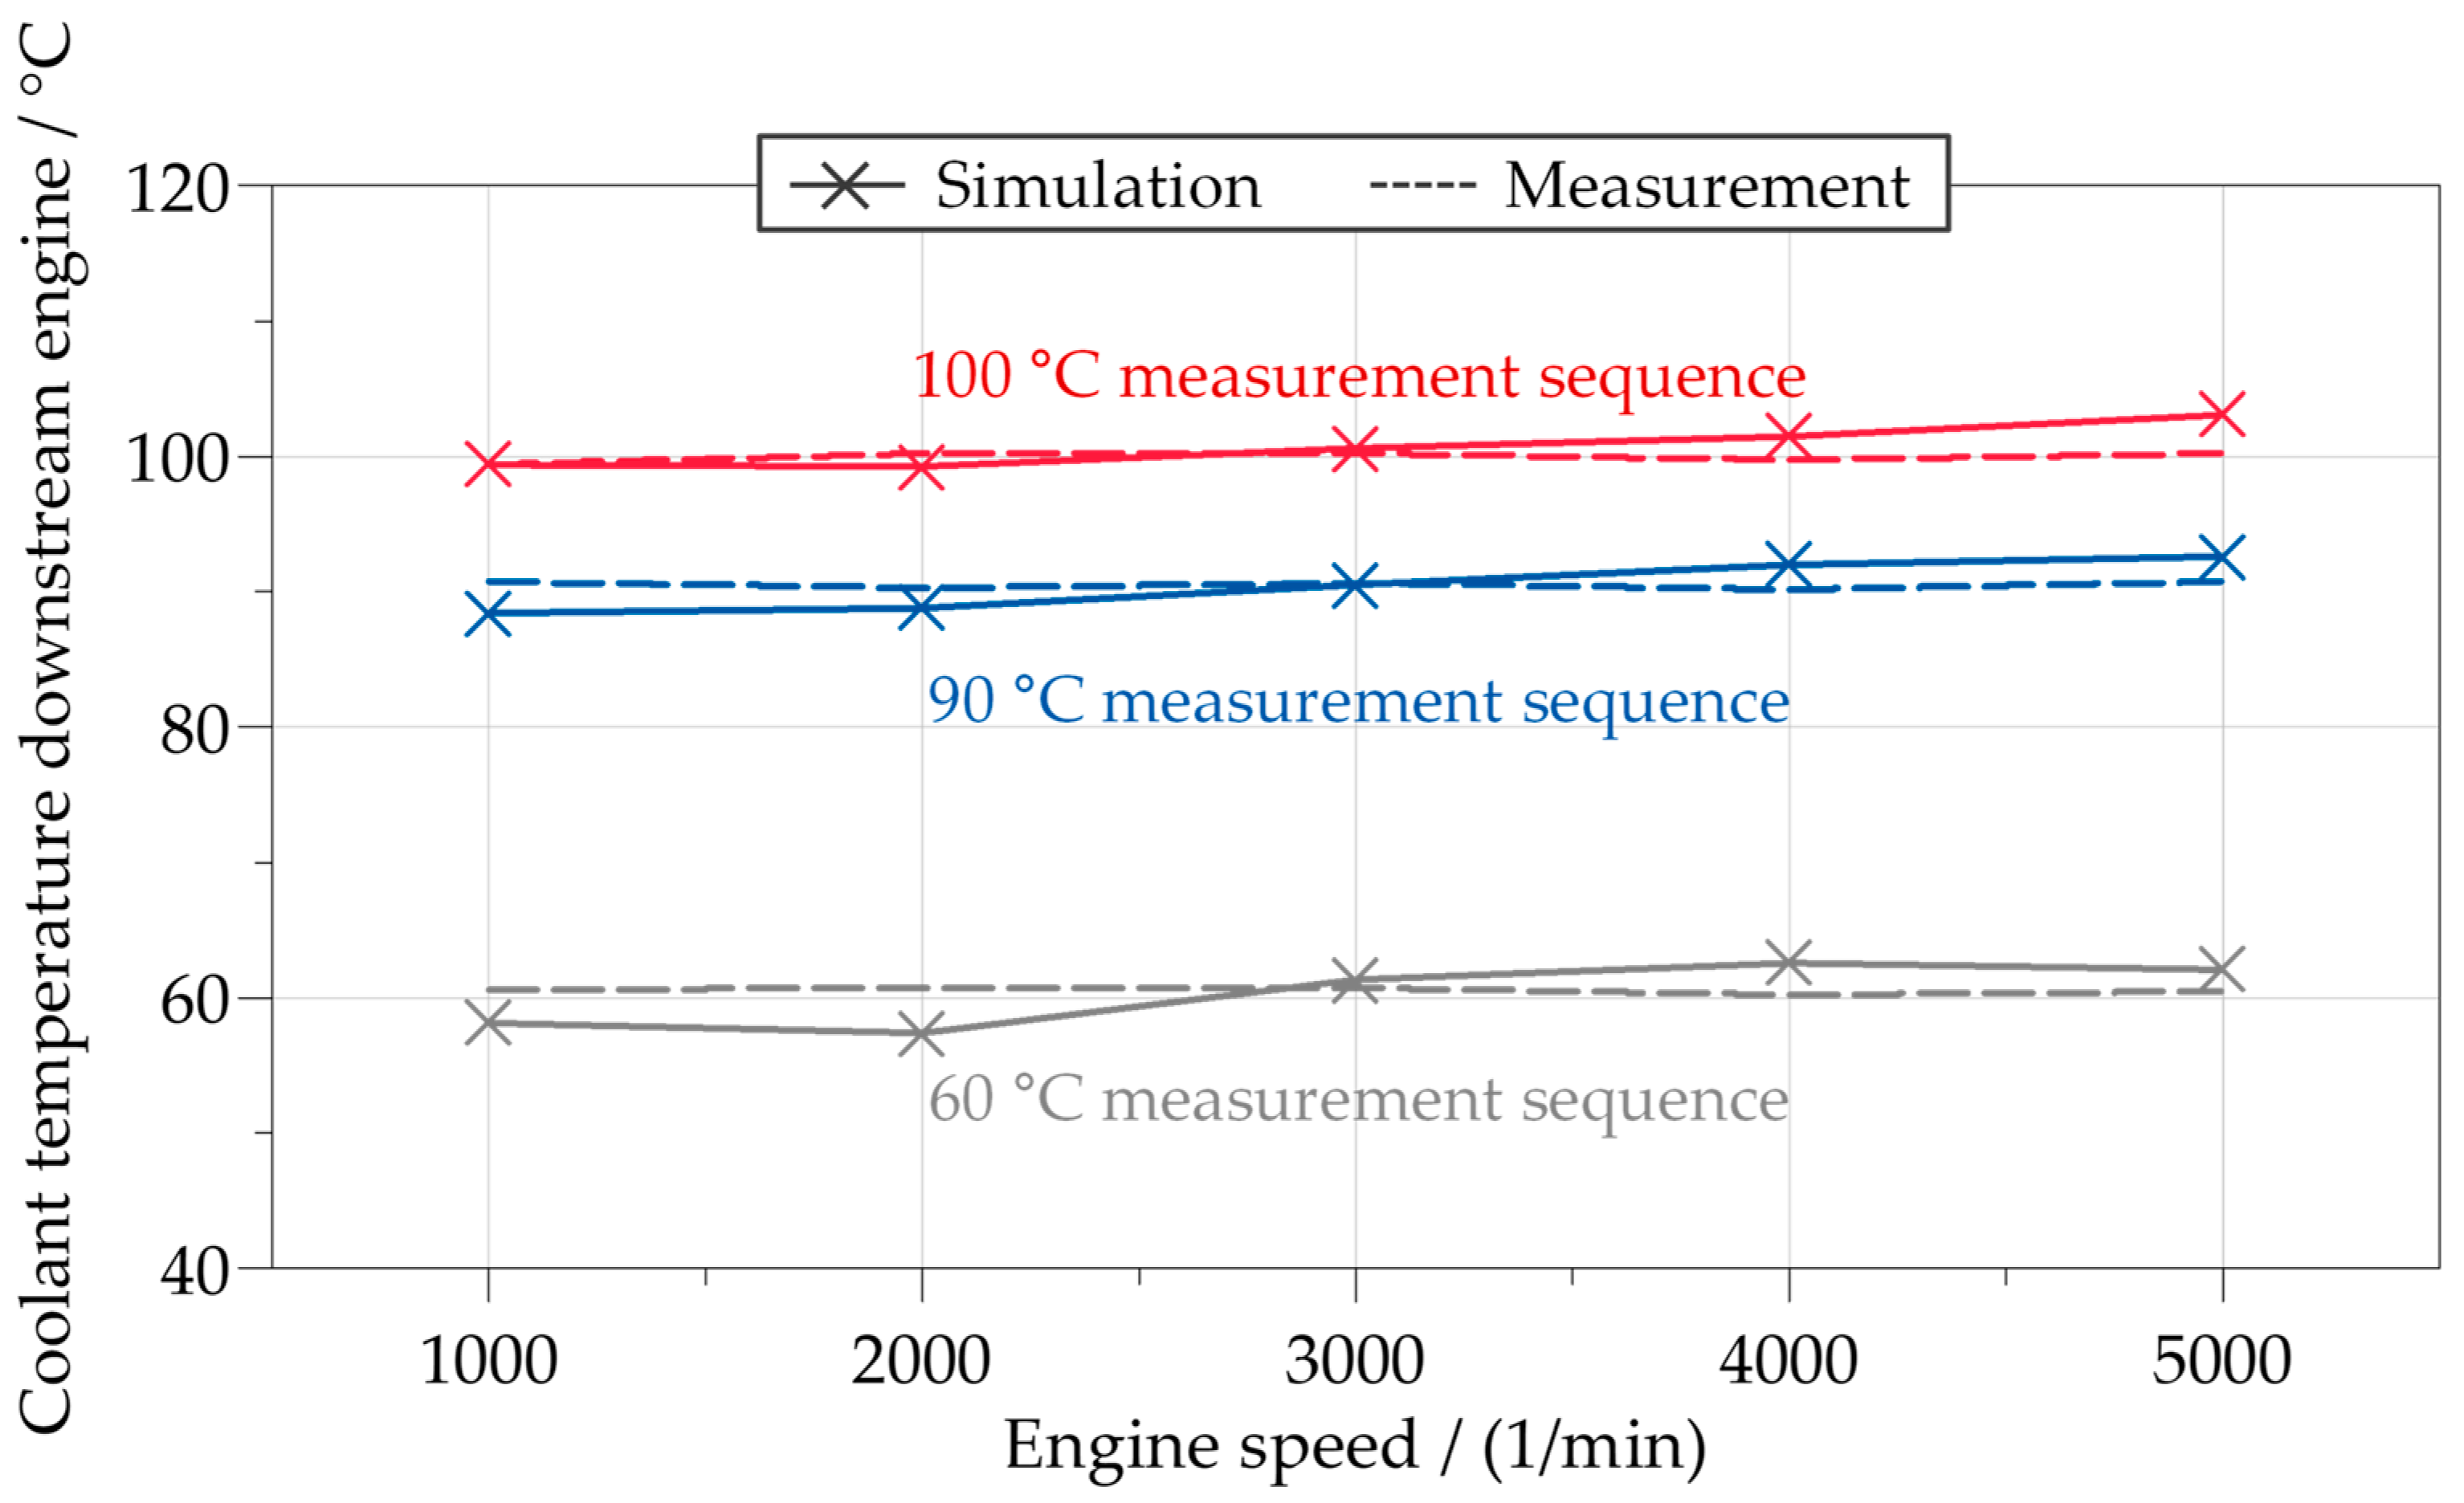
Thermal Management Model Validation

To demonstrate the accuracy of the model, the ATMM is validated exemplarily for the engine full load curve and different coolant temperatures downstream engine. Figure 6 shows the comparison of simulated and measured coolant outlet temperatures during stationary engine operation.
Without prior calibration of the ATMM, the results show an accuracy higher than 95%. The absolute temperature error is below 3 °C for all coolant temperatures investigated, with a trend towards higher accuracy at high coolant temperatures. This can be explained by the fact that some cooling system components, e.g., the oil cooler performance, are database based. Furthermore, the temperature and flow rate sensors do not have a flawless accuracy, which can result in inaccurate boundary conditions for the validation simulation.
The thermal behavior of the combustion engine and the heat input into the cooling system are well represented by the ATMM. Consequently, the 1D/3D modelling approach is suitable for the software development and thermal system validation.

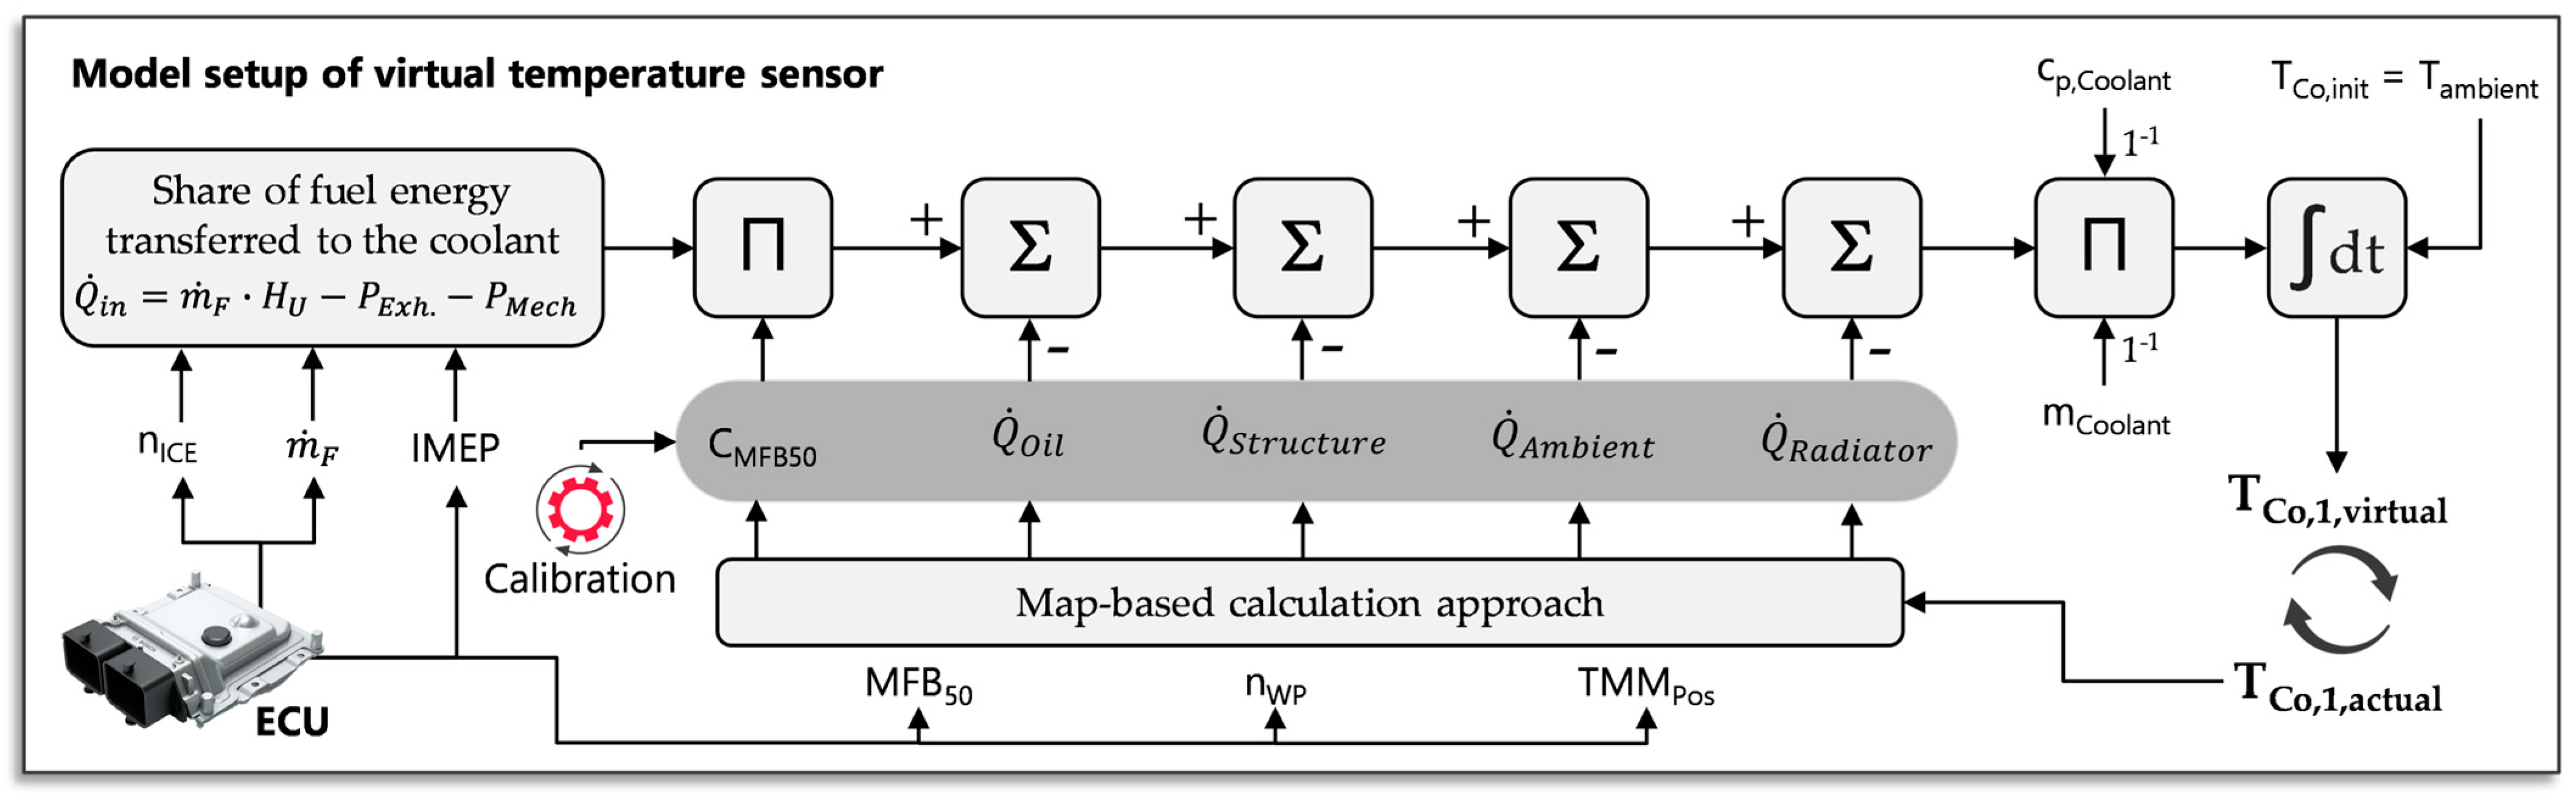
4.3. Reduced Order Model for Control Unit

In the presented development approach, the ECU model setup begins after starting the ATMM setup and is finished shortly thereafter. A major challenge for control unit implementation is the limited computing power. Therefore, the main components and heat transfer mechanisms are analyzed and potential simplifications, such as neglecting radiative heat transfer from the engine and simplified geometries, are identified. The resulting model structure is very similar to the schematic layout used for the advanced thermal model (see Figure 3).
The implementation of components as heat source or heat sink with standardized interfaces results in a good modularity, which leads to efficient adaptation to different cooling system layouts. Figure 7 shows the simulation process for determining the actual temperatures and flow rates at the ECU. In addition to the aforementioned simplifications, some calculations, such as the flow distribution as a function of pump speed and TMM position, can be performed offline instead of online. Furthermore, it is important to avoid loops and iterations whenever possible to reduce computational complexity.
The resulting semi-physical models are designed close to the advanced thermal model wherever empirical values that cannot be measured directly at test benches are needed, e.g., heat transfer coefficients. This ensures that the control unit model behaves similarly to the ATMM and can be calibrated with its respective results.
The resulting ECU model calculates mean structure temperatures of cylinder head and block, fluid temperatures as well as heat fluxes at heat sinks and sources as a function of water pump speed, TMM position and temperature sensor values. During MiL and HiL operation, the sensor values are provided by the ATMM. During engine dynamometer or vehicle operation, these values are provided by sensors. In addition, certain local structure temperatures, such as the flame deck temperature, can be calculated based on the mean structure temperature and a substitute wall thickness. These values can be used as virtual sensor inputs for advanced control strategies. Virtual sensor calibration is also based on ATMM simulation results.

5. Rule-Based Control Strategies Predesign within Advanced Thermal Management Model

5.1. Control Strategy Predesign within Advanced Thermal Management Model

Hybrid powertrain system efficiency depends on component temperatures. In order to operate all powertrain components in the optimal temperature range, an intelligent thermal management system with dedicated control strategies is required. Figure 8a shows the resulting function definition on the left side and actuator specification on the right side. The functions are predesigned with respect to the thermal requirements defined in the previous chapter. The target is to implement the best control strategy for an optimal efficiency, while maintaining emission limits, safety, comfort, and drivability.
Initially, the water pump remains turned off so that no coolant is circulating, allowing the combustion chamber walls to heat up faster. As shown in the lower center of Figure 5, the piston group friction can be reduced by higher liner temperatures. HC and particulate emissions are further reduced by improved fuel vaporization, reduced fuel deposits on liner walls and piston crown, and reduced wall quenching. The dependence of the aforementioned raw emissions on the combustion chamber temperature is shown in Figure 8b. In this context, the average combustion chamber wall temperature TCCW is defined by the piston crown and liner temperatures related to their surface area in Equation (10).
TCCW = 0.185 · TPistonCrown + 0.815 · TLiner
A decrease in raw emissions can be observed at higher temperatures. However, other engine specific boundary conditions, such as the fuel injection system, must be considered for the absolute level and the resulting influence on the raw emissions [55]. Moreover, the reduced wall heat losses increase the exhaust enthalpy, so that the catalyst light-off temperature is reached faster. Due to the asymptotic nature of the temperature influence on the raw emissions, the electric water pump can be switched on at minimum speed in the range of 50 °C to 65 °C combustion chamber wall temperature. Sufficient flow can then be ensured for the coolant temperature sensors of T1 and T2 (see Figure 3 for sensor locations) can be ensured.
In the event of a request for oil or cabin heating, the pump is controlled according to the target temperatures. Thermal energy is extracted from the cylinder head structure and transferred to the engine oil and the HVAC airflow via coolant heat exchangers during the heating process.
While the TMM position is below 50%, a dedicated pump speed control is sufficient for flame deck cooling only. In function 1 through 5, the block and radiator paths are closed, enabling a fast liner warm-up by using split cooling. After liner or block water jacket temperature limits are reached, the rotary valve position must be greater than 50% to allow sufficient coolant circulation. Engine process simulation is used to derive combustion chamber wall temperature limits (see left side of Figure 9). As a result, ignition angle retardation due to high knock tendencies can be prevented. In addition to that, coolant temperature limits are foreseen to prevent film boiling. These limits depend on the engine operating point. While part-load operation allows a higher coolant temperature, the temperature limit is reduced at high-load operation.
All components are cooled on demand, corresponding to their target temperatures for low power consumption of the electric actuators. This requires a TMM position higher than 68%. At the same time, the use of the split cooling function is no longer possible, due to the fully opened block path. The after-run cooling pump speed depends on the resulting structure temperatures when the engine is turned off. During vehicle standstill, the activation of the vehicle fan is necessary for sufficient heat dissipation to the environment.
The function transfer to the control subsystem of the advanced thermal model is shown schematically in Figure 9. The main component is the coordinator which includes the function selection, actuator constraints and the PI controllers for the pump and TMM. Actual temperatures of the virtual sensors, the engine operating point and the corresponding coolant and structure temperature limits are required as input variables for the control. Based on actual temperatures, suitable functions are selected for the warm-up and cooling phases. Especially in hybrid vehicles, functions may be repeated several times due to the engine cool-down during electric driving. Inputs to the PI controller are the differences between actual and setpoint temperatures. The thermal requirements of the actuator motors are taken into account with restrictions on pump speed and TMM position changes. At the TMM end positions, the actuator speed is additionally reduced due to safety reasons. As a result, the target pump speed and TMM position are sent to the physical actuator models within the cooling circuit. The function pre-calibration is shown exemplarily for the WLTC and the Großglockner High Alpine Road.
The simulation results of the WLTC are shown in Figure 10 including a description with numbers for the selected control functions.
The urban section is mainly driven in electric mode due to the low vehicle speeds and power demands. This results in a low engine operating time in the first WLTC phase. After the first engine start, the combustion chamber is heated (see Function 1 in Figure 8) until the temperature threshold of the liner, piston and flame deck is reached. Meanwhile, the TMM position remains at 45%, and the pump is deactivated. This results in an increase of the average structure temperature (see Equation (10)) up to 85 °C. In addition, the water jacket temperatures are increasing in this phase due to natural convection.
However, during pump shutdown, temperature measurement is only possible with sensor T3 in the block water jacket. All other sensors are located in the external cooling system (see Figure 3). Therefore, T2 initially shows a constant temperature.
Cabin heating is not required because the ambient temperature is sufficiently high. Thus, active oil heating (see Function 4 in Figure 8) can be performed in the second phase. The heating power depends on the difference between the actual and target oil temperature. The simulation results show an initial pump speed of 1600 rpm. After the pump activation, sensor T2 shows an increase in temperature. The pump speed is then continuously reduced as the oil temperature increases until the target oil temperature of 75 °C is reached.
The pump is operated at its minimum speed (see Function 2 in Figure 8) for a short period to supply sufficient coolant flow for T1 and T2 sensor targets. In the urban section, engine operation is increasing, which results in an increase up to target operating temperatures. Cooling on demand is activated after 1050 s because the head water jacket temperature threshold is reached. Split cooling control (see Function 6 and 7 in Figure 8) is skipped due to the request for head water jacket cooling (see Function 8 in Figure 8). The first opening of the radiator path is limited caused by cold coolant entering the residual cooling system. This prevents overshooting of the TMM opening. By using an additional independently operated rotary valve, the split cooling potential can be extended [32].
The engine is running almost permanently in the remaining urban and highway part as a result of high power demand and vehicle speed. Subsequently, the pump speed increases, and the radiator path is continuously opened due to higher cooling demand. During this phase, the control is mainly driven by the block coolant temperature, which is controlled at 105 °C. Both actuator controllers are calibrated to ensure a fast control and low energy consumption. The electric water pump is deactivated in engine-off phases to avoid undesired engine and coolant cool down. High engine structure temperatures are only reached in the highway section so that after-run cooling is only necessary at the end of the WLTC (see Function 9 in Figure 8). The after-run cooling is calibrated for the entire engine map, which represents different structure temperatures at engine off. In addition to the water pump, the fan control is also included in this function.
The results of the control strategy optimization are shown in Table 1 with reference to a belt-driven pump and a standard wax thermostat. The main advantages result from the on-demand cooling and the reduced piston group friction due to split cooling. At lower ambient temperatures the friction reduction potential is even higher. Furthermore, the results are highly dependent on the scenario boundary conditions, such as driver type, traffic, battery state-of-charge and others. Liu et al. conducted a review of different thermal management measures and corresponding control strategies, which supports the simulation results of Table 1 [32].

5.2. MiL Control Unit Function Design and Calibration

The control strategies described in the previous sections also need to be implemented in the control unit functions. For the current situation, actual and virtual sensor values are used as inputs. The operating phases are taken from the ATMM control strategy. In this way, setpoints and limits can be used directly from the earlier design phases instead of having to perform extensive tests for the correlation between structure temperatures and actual sensor values. Design limit changes are also much easier to implement. Aside from the target and limit values for structures or fluids, the limits for the different cooling functions (see Figure 9) can be adjusted in the same way as in the ATMM.
In order to achieve the target temperatures and not exceed any temperature limits, a coordinator function has been developed. Figure 11 shows a simplified representation.
Each heat source is handled as a separate module for easy model customization. All modules calculate a cooling requirement based on target and actual temperatures. The coolant flow rate requirement is based on the corresponding cooling requirement and temperature difference across the component. The calculations use the same heat transfer coefficients as the ATMM. Thus, very limited additional calibration is necessary. The different flow rate requirements result in a TMM position request, based on the highest demand. The TMM position as well as the resulting change of the coolant temperature at the engine inlet are taken into account for the water pump speed calculation. The various phases are implemented using a rule-based approach that reflects the decisions made in the ATMM.
Additional calibration maps can be used for fine tuning, which may be necessary due to the implemented simplifications. To achieve better transient behavior and enable more detailed calibration, the current temperatures and the current heat flux into the cylinder head and block are considered. Depending on the difference of the structure temperature to the target value, the actual heat input into the structure is added to the cooling requirement with a correction factor αcorr, as shown in Equation (11).
Q ˙ req = m ˙ Co · c p , Co · ( T act T target ) + α corr · Q ˙ input
Calibration of this correction factor complements the PID controller and reduces the complexity of the calculation and calibration for the different PID gain factors. In particular, the calibration of the D gain is less sensitive. For calibration of the designed functions, the advanced thermal model and control unit functions are run in a co-simulation with a simulated real-time clock. The result is an accurate representation of the control unit function behavior with a real engine. The interface is exactly the same as in real world: temperature sensors, actual and requested TMM position, pump and fan speed, as well as operating point of the ICE. During the optimization of the control unit functions, the simulation time is determined by the ATMM. With the described setup, more than 48 WLTC simulations and corresponding calibration adjustments can be performed on a workstation in a single working day. This also allows for certain automated calibration procedures and DoE optimization.
Figure 12 shows results of a WLTC simulation. For the flame deck and liner temperatures, the black curves show the virtual sensor results compared to the advanced thermal model results, both in co-simulation. Since the virtual sensors are inputs to the implemented control strategy, the accuracy shown is at a good level. The plots for different temperatures, TMM position and water pump speed compare the results of the co-simulation with the standalone simulation of the ATMM. It is evident that the resulting control strategy and the heat-up behavior are the same for both cases.

5.3. Thermal System Protection

The thermal system protection is conducted for the Großglockner High Alpine Road as an exemplary challenging scenario in Europe [56]. The vehicle speed and elevation profile are shown in Figure 13. Starting in Bruck, the cycle leads up to the Großglockner at an altitude of 2509 m with a maximum slope of 12%. Since this is a control model validation of a thermal system, a worst-case ambient temperature of 30 °C is used in the entire cycle. In addition, the air conditioning system is activated for cabin climatization. The resulting condenser heat flux causes an increase in air inlet temperature to the high-temperature radiator, resulting in a degradation of heat exchange.
The main objective of the protection is to verify compliance of mandatory requirements under extreme conditions.
A summary of relevant results comparing the advanced thermal model with the model-in-the-loop simulation is shown in Figure 14. As a consequence of the limited battery energy, the vehicle is mainly driven by the ICE with e-motor boosting during high power demands. This is reflected in a short warm-up phase, where the target operating temperature is reached much earlier than in the WLTC. After 250 s, TMM and water pump are in continuous on-demand cooling mode. While TMM reaches the end stop position for a fully open radiator path, the water pump speed can still be increased.
Low vehicle velocities lead to reduced radiator heat dissipation to the environment. Therefore, after exceeding a preset temperature limit, the electric fan is activated at 1250 s to increase the air mass flow rate across the underhood. After reaching the first summit, the engine is switched off during the descent due to low power demand (electric driving) and recuperation. An after-run cooling with additional fan activation is performed. TMM position returns to the initial position of 50% in order to re-enable split cooling at the next engine start. Both simulations do not show a temperature limit exceedance in the entire driving cycle. Consequently, the thermal system protection for this scenario is successfully carried out, and the control unit software shows a good match to the ATMM results. In the development process, many other scenarios, such as uphill driving with a trailer, have to be taken into account to complete the holistic design process.

6. Enhancement by Model Predictive Control Strategies

Despite their simplicity and feasibility, rule-based control strategies do not operate on basis of optimal control theory. Therefore, objectives such as actuator power consumption, fuel economy or other constraints cannot be optimally achieved. To overcome this shortcoming, control strategies are developed that consider a multi-objective optimization problem. Model predictive control (MPC) belongs to this category, where an optimized decision is made at each time step for the corresponding time horizon [57].
This section provides an outlook on the potential for optimization by using MPC. For this purpose, a lumped thermal model of the component and its cooling system is required as ROM. For demonstration purposes, the existing ROM of Section 4.3 can be applied to predict the thermal behavior of the components in a suitable prediction horizon (Time step 0.2 s, prediction horizon 6 s, control horizon 2 s), which in turn is used by the optimization algorithm to calculate the optimal actuation of cooling circuit accessories.
Two different variations of the MPC are examined. The first strategy uses the same temperature setpoints as used for the simulations in Section 5. Since the MPC allows a more dynamic control than the rule-based strategy by predicting the temperatures in the prediction horizon, the temperature limits in the second variant are shifted towards the boiling temperature limits. Castiglione et al. presented a similar approach by using a virtual sensor that provides a nucleate boiling index [34,58,59]. We calculate the coolant temperature setpoint TCo,set according to the local water jacket pressure pWJ,loc based on the ATMM (see Equation (12)).
TCo,set = 36.42 · ln(pWJ,loc) + 105.9
Table 2 shows a comparison of the rule-based (see Section 5) and model predictive control approaches for the WLTC with the different coolant temperature setpoints. As a result of optimal control of water pump and TMM, the baseline MPC can achieve a 4.4% reduction in pump energy with unchanged friction energy. Another 17.9% reduction potential comes from the advanced coolant temperature setpoints, which also enable higher liner and piston temperatures. This allows for an additional 3.7% reduction in friction energy.
For a holistic evaluation of the reduction potential of the different controls, the impact on the total energy consumption of the vehicle must be considered. For example, the absolute energy savings of the electric water pump of 0.07 Wh (see Baseline MPC in Table 2) and 0.32 Wh (see Advanced MPC in Table 2) are rather low compared to the results (Fuel consumption reduction of up to 8% compared to a belt-driven water pump in a conventional vehicle) of Castiglione et al. [59]. This results from the already high savings potential due to the use of the electric water pump compared to the belt-driven pump and the use of a hybrid electric vehicle. However, the control is limited by the safety of the engine and its temperature limits. The friction savings of the advanced MPC (13 Wh, see Advanced MPC in Table 2) have a higher impact on the total energy consumption resulting in a CO2 emission reduction of about 0.5 g/km. The impact is strongly dependent on the powertrain electrification level and architecture so that the savings potential may increase with higher engine operating times.
Furthermore, an accurate and precise MPC can not only optimize energy consumption and friction, but also ensure thermal safety by improving compliance with temperature limits in challenging driving conditions.

7. Generic Application of the Development Methodology

Since the presented development methodology is generic, it can be easily transferred to other applications. In the following, a smart failure mode detection for on-board-diagnostics and function development for the battery management system is exemplarily shown.

7.1. On-Board Diagnostics Failure Mode Detection

One of the mandatory stakeholder requirements is the safe operation of the vehicle and the powertrain [60]. In addition to the standard crash safety measures, the operation of all relevant powertrain components is continuously monitored by sensors and on-board diagnostics (OBD) functions in the ECU. In this context, due to the increasing powertrain complexity, the number of required physical sensors is increasing. This results in several drawbacks, such as increased cost, sensor lifetime or sensor repairability [61]. Furthermore, the technical feasibility of hardware sensors is not always possible due to packaging or other constraints.
One way to overcome these problems is to use virtual sensors. These have already been used in the past for a variety of automotive applications, e.g., for misfire detection, torque monitoring or tire pressure change detection [62]. In the area of thermal management, the use of physical sensors for temperatures in the cooling and lubrication system is still state of the art. In addition to optimizing thermal management control strategies (see Section 5), ATMM can be used to increase the safety of the cooling system through early failure detection using virtual sensors.
In the following, an OBD function using a virtual sensor for leakage detection in the thermal management module is demonstrated. Thereby, the existing physical sensor T1 (see Figure 3) measures the coolant temperature downstream of the TMM. In addition, a virtual sensor calculates the coolant temperature at the same position under ideal system conditions, i.e., without leakage. If the temperature difference between the physical and virtual sensors exceeds a defined threshold, a leak in the radiator path of the TMM can be detected.
The ROM for the virtual sensor is based on [44] and enhanced by the impact of the center of combustion (MFB50) and radiator heat exchange. Figure 15 shows the corresponding model setup.
The model considers thermal inertia of the engine coolant, the engine oil, and the engine structure. All required input parameters are provided by the ECU, either from available sensors or stored in maps calculated in offline simulations. Based on the engine operating point, the fuel energy transfer to the cooling system can be calculated from the fuel flow, the fuel calorific value and the resulting exhaust and indicated engine power. After this, the energy flow is corrected for heat exchange with the lubrication system, engine structure, environment and radiator in a map-based approach. The coolant temperature difference is calculated using the specific heat and mass of the coolant. Finally, the coolant temperature is calculated based on the initial temperature and the integral of the temperature difference. A genetic algorithm was used to calibrate the decisive parameters in several transient driving cycles based on the ATMM.
Simulations were performed in the MiL environment and the results of the failure mode detection in the WLTC are shown in Figure 16. The leakage boundary conditions are defined with a radiator path opening of 2%, which corresponds to a cross-sectional area of 45 mm2. The resulting leakage flow rate is partially up to 9 L/min (see center of Figure 16) but also depends on the water pump speed. The temperature difference setpoint for detection depends on the accuracy of the model. This model has an accuracy of 5 °C, but an additional safety margin of 10 °C is considered.
The results show a steadily increasing temperature of the virtual sensor up to 185 °C at 1300 s because the TMM position (sent by the ECU) indicates a closed radiator path. In comparison, the physical sensor shows significantly lower temperatures due to the leakage and heat exchange through the radiator. The TMM leakage failure mode can be detected at an early stage based on the temperature difference between the physical and virtual sensor, in this case, example after 300 s for the specific powertrain and its operating strategy. If the engine run time is higher at the beginning of the cycle, earlier detection is possible. However, after intentionally opening of the radiator path at 1200 s, the temperature of the virtual sensor is realigned with the physical sensor due to the radiator heat transfer.

7.2. Function Development for Electric Powertrain Components

The following is an example of how to develop and test a control strategy for a battery cooling system with the presented methodology. The battery system specifications are shown on the right side of Figure A2 in the Appendix A. One battery pack includes two battery modules of 12 cells each and a cooling plate in the middle of both modules connected to the cell bottom. All relevant parts of the battery pack (see left side of Figure A2) are considered in the advanced thermal model setup, including cells, cold plate, isolation foil, busbars, assembly plates and air volumes as well as the cooling system and the electrical equivalent model. The schematic layout of the low-temperature battery cooling circuit and its controlled actuators and temperature sensors are shown in Figure A3.
The optimal battery temperature operating range is between 20 °C and 45 °C. Therefore, a fast cell warm-up is beneficial to reduce ohmic losses in cold conditions [63]. On the other hand, it is mandatory to prevent cell operation above 60 °C due to the risk of thermal runaway and increased aging [64]. Consequently, sufficient cooling or derating of the battery is required.
For evaluation, simulation results for repetitive kickdowns (max. 130 km/h) under extreme conditions with a maximum current of 250 A at 40 °C ambient temperature are shown in Figure 17. To ensure thermal safety, the pump and compressor are activated after the first kickdown event and run for the entire driving cycle. Because of the limited heat transfer from the coolant to the cold plate and from the cold plate to the cells through thermal interface material, the cell temperatures are less sensitive to the rapidly decreasing coolant temperature. This results in a continuously increasing maximum cell temperature during the high current load operation. Focusing on the last kickdown event at 620 s, the temperature gradient at the cell surface is 7 °C due to the limited heat transfer apart from the cell bottom.
Simulation results clearly point out the poor cooling performance of the cold plate, resulting in non-uniform and slow cell cooling. To achieve better cooling performance, improvements in cooling channel geometries for increased heat transfer coefficients have to be made or other cooling techniques in combination with derating strategies can be applied [64,65]. Nevertheless, the results of the advanced thermal model can be used as a basis for the control unit software model.
Thanks to the modularity of the presented approach, virtual sensors for cell and busbar temperatures can be developed and used for the control model setup. Subsequently, MiL ECU function design and calibration can be performed and compared with the ATMM simulation results.

8. Conclusions

The automotive industry is undergoing a major transformation to meet future regulatory requirements. Especially in the field of calibration, the resulting powertrain diversification is challenging in terms of costs and time management. To meet these challenges, TME and FEV are using a customized virtualization methodology. This enables a reduction in development time while maintaining a high level of quality and financial feasibility.
The approach has been demonstrated for controls in an ICE high-temperature circuit with a focus on model-in-the-loop. This allows software calibration and validation in early development phases without relying on existing hardware components. In this context, an early exchange of information between the concept design and calibration departments is favorable. This ensures the applicability of control strategy functions on the control unit. The advanced thermal management and semi-physical ECU model setup were performed in parallel. Coupled with the virtual vehicle, the thermal requirements were used for the optimal control strategy predesign within the ATMM. Based on this, the functions were transferred to the ECU software. WLTC and Großglockner simulations have shown similar actuator and temperature results for ATMM and co-simulation in the MiL environment. Thus, the calibration and validation of the ECU for exemplary driving scenarios has been successfully completed. Furthermore, the transferability of the methodology to OBD functions and thermal management control of electric powertrain components has been verified. In conclusion, it has been demonstrated that the TME and FEV methodology can become a gamechanger in the software development process in terms of using advanced thermal management models in combination with MiL application.

Author Contributions

Conceptualization, J.M., J.K. and J.F.; methodology, J.M., J.K. and J.F.; software, J.M. and N.B.; validation, J.M. and N.B.; formal analysis, J.M. and N.B.; investigation, J.M., P.B., P.H. and N.B.; writing—original draft preparation, J.M. and J.F.; writing—review and editing, A.B., J.K., S.G., P.B., P.H. and S.P.; visualization, J.M. and N.B. All authors have read and agreed to the published version of the manuscript.

Funding

This research received no external funding.

Data Availability Statement

Not applicable.

Acknowledgments

The authors thank Artem Wendler and Shubham Barhate for their contribution to this publication.

Conflicts of Interest

The authors declare no conflict of interest.

Abbreviations

ATMMAdvanced Thermal Management Model
Byp Bypass
CFDComputational Fluid Dynamics
CHTConjugate Heat Transfer
CO2Carbon dioxide
c p Specific heat
DHEDedicated Hybrid Engine
DoEDesign of Experiments
ECUElectronic Control Unit
EME-Motor
EUEuropean Union
EU7Euro 7 emission legislation
eWPElectric water pump
FEM Finite Element Method
HiLHardware-in-the-Loop
HVHigh Voltage
HVACHeating, Ventilation and Air Conditioning
ICEInternal Combustion Engine
Max. Maximum
m ˙ C o Coolant mass flow rate
MFB50Location of 50% mass fraction burnt
MiLModel-in-the-Loop
Min.Minimum
neWPElectric water pump speed
nICEEngine speed
NVHNoise-Vibration-Harshness
OBDOn-Board Diagnostics
PIDProportional-Integral-Derivative controller
pmiEngine mean indicated pressure
posTMMPosition of thermal management module
Q ˙ x Heat transfer rate
RadRadiator
ROMReduced Order Model
SiLSoftware-in-the-Loop
SOPStart of Production
SUV Sport Utility Vehicle
TCoCoolant temperature
TMMThermal Management Module
TOilOil temperature
TStrucEngine structure temperature
TOilRadiator
Tx,nTemperature of current timestep
Tx,n-1Temperature of last timestep
WLTCWorldwide harmonized Light vehicles Test Cycle
V ˙ CH Volumetric flow rate for cylinder head water jacket
V ˙ CB Volumetric flow rate for cylinder block water jacket
V ˙ OC Volumetric flow rate for oil cooler
V ˙ Rad Volumetric flow rate for radiator
V ˙ Byp Volumetric flow rate for bypass
α c o r r Heat flux correction factor

Appendix A

Figure A1. Powertrain layout and component specification.
Energies 16 03238 g0a1
Figure A2. Battery module pack layout (left side), battery system specification (right side).
Energies 16 03238 g0a2
Figure A3. Schematic layout of battery and power electronics low-temperature cooling circuit including controlled actuators (Degas bottle is not included due to simplification).
Energies 16 03238 g0a3

References

  1. Europäische Kommission. Mitteilung der Kommission an das Europäische Parlament, den Europäischen Rat, den Rat, den Europäischen Wirtschafts- und Sozialausschuss und den Ausschuss der Regionen—Der Europäische Grüne Deal. 2019. Available online: https://eur-lex.europa.eu/resource.html?uri=cellar:b828d165-1c22-11ea-8c1f-01aa75ed71a1.0021.02/DOC_1&format=PDF (accessed on 6 February 2023).
  2. Vereinte Nationen—Weltklimakonferenz. Übereinkommen von Paris; Vereinte Nationen—Weltklimakonferenz: Paris, France, 2015; Available online: https://www.bmuv.de/fileadmin/Daten_BMU/Download_PDF/Klimaschutz/paris_abkommen_bf.pdf (accessed on 6 February 2023).
  3. Uhlmann, T.; Balazs, A.; Maurer, R. Hybrid-BEV—Ein-Plattform-Lösung für zukünftige PKW. In Proceedings of the 30th Aachen Colloquium Sustainable Mobility, Aachen, Germany, 4–6 October 2021; Aachener Kolloquium Fahrzeug-und Motorentechnik GbR: Aachen, Germany, 2021. [Google Scholar]
  4. Uhlmann, T.; Balazs, A.; Lückmann, D.; Müller, A.; Thewes, M.; Sahr, C.; Pischinger, J.; Hellenbroich, G.; Herold, K.L.; Lüdiger, T.; et al. High Efficient Gasoline HEV Meeting 2030 CO2 Targets—The Road towards 59 g/km Fleet CO2. In Proceedings of the 29th Aachen Colloquium Sustainable Mobility, Aachen, Germany, 5–7 October 2020; Aachener Kolloquium Fahrzeug-und Motorentechnik GbR: Aachen, Germany, 2020. ISBN 978-3-00-064871-7. [Google Scholar]
  5. Nationale Plattform Zukunft der Mobilität—Arbeitsgruppe 2. Alternative Antriebe und Kraftstoffe für Nachhaltige Mobilität. Kundenakzeptanz als Schlüssel für den Markthochlauf der Elektromobilität: Ein Forschungsvorhaben der AG 2: Alternative Antriebe und Kraftstoffe für Nachhaltige Mobilität; Nationale Plattform Zukunft der Mobilität: Berlin, Germany, 2021; Available online: https://www.plattform-zukunft-mobilitaet.de/wp-content/uploads/2021/10/NPM_AG2_Kundenakzeptanz.pdf (accessed on 22 March 2023).
  6. Carvalho, H.; Naghshineh, B.; Govindan, K.; Cruz-Machado, V. The resilience of on-time delivery to capacity and material shortages: An empirical investigation in the automotive supply chain. Comput. Ind. Eng. 2022, 171, 108375. [Google Scholar] [CrossRef]
  7. Eldem, B.; Kluczek, A.; Bagiński, J. The COVID-19 Impact on Supply Chain Operations of Automotive Industry: A Case Study of Sustainability 4.0 Based on Sense–Adapt–Transform Framework. Sustainability 2022, 14, 5855. [Google Scholar] [CrossRef]
  8. Europäische Kommission. Vorschlag für eine Verordnung des Europäischen Parlaments und des Rates über die Typgenehmigung von Kraftfahrzeugen und Motoren Sowie von Systemen, Bauteilen und Selbstständigen Technischen Einheiten für Diese Fahrzeuge Hinsichtlich Ihrer Emissionen und der Dauerhaltbarkeit von Batterien (Euro 7) und zur Aufhebung der Verordnungen (EG) Nr. 715/2007 und (EG) Nr. 595/2009, 2022 (2022/0365 (COD)). 2022. Available online: https://ec.europa.eu/info/law/better-regulation/have-your-say/initiatives/12313-Europaische-Normen-fur-Fahrzeugemissionen-Euro-7-fur-Pkw-leichte-Nutzfahrzeuge-Lastkraftwagen-und-Busse_de (accessed on 6 February 2023).
  9. Europäische Kommission. Anhänge zum Vorschlag für eine Verordnung des Europäischen Parlaments und des Rates über die Typgenehmigung von Kraftfahrzeugen und Motoren sowie von Systemen, Bauteilen und selbstständigen Technischen Einheiten für diese Fahrzeuge Hinsichtlich Ihrer Emissionen und der Dauerhaltbarkeit von Batterien (Euro 7) und zur Aufhebung der Verordnungen (EG) Nr. 715/2007 und (EG) Nr. 595/2009, 2022 (COM(2022) 586 Final). 2022. Available online: https://ec.europa.eu/info/law/better-regulation/have-your-say/initiatives/12313-Europaische-Normen-fur-Fahrzeugemissionen-Euro-7-fur-Pkw-leichte-Nutzfahrzeuge-Lastkraftwagen-und-Busse_de (accessed on 6 February 2023).
  10. Ao, G.-Q.; Qiang, J.-X.; Zhong, H.; Mao, X.-J.; Yang, L.; Zhuo, B. Fuel economy and NO x emission potential investigation and trade-off of a hybrid electric vehicle based on dynamic programming. Proc. Inst. Mech. Eng. D J. Automob. Eng. 2008, 222, 1851–1864. [Google Scholar] [CrossRef]
  11. Back, M. Prädiktive Antriebsregelung zum energieoptimalen Betrieb von Hybridfahrzeugen; Univ.-Verl. Karlsruhe: Karlsruhe, Germany, 2006; ISBN 9783866440319. [Google Scholar]
  12. Chen, Z.; Mi, C.C. An adaptive online energy management controller for power-split HEV based on Dynamic Programming and fuzzy logic. In Proceedings of the 2009 IEEE Vehicle Power and Propulsion Conference (VPPC), Dearborn, MI, USA, 7–10 September; IEEE: Piscataway, NY, USA, 2009; pp. 335–339, ISBN 978-1-4244-2600-3. [Google Scholar]
  13. Dextreit, C.; Assadian, F.; Kolmanovsky, I.V.; Mahtani, J.; Burnham, K. Hybrid Electric Vehicle Energy Management Using Game Theory. In SAE Technical Paper Series, Proceedings of the SAE World Congress & Exhibition, Detroit, MI, USA, 14–17 April 2008; SAE International 400 Commonwealth Drive: Warrendale, PA, USA, 2008. [Google Scholar]
  14. Jeon, S.; Jo, S.; Park, Y.; Lee, J. Multi-Mode Driving Control of a Parallel Hybrid Electric Vehicle Using Driving Pattern Recognition. J. Dyn. Syst. Meas. Control. 2002, 124, 141–149. [Google Scholar] [CrossRef]
  15. Müller, J.; Maurer, R.; Achenbach, J.; Balazs, A.; Knauf, J. Antriebsstrangoptimierung von Hybridsystemen unter Berücksichtigung thermischer Einzelkomponentenwirkungsgrade. In Experten-Forum Powertrain: Reibung in Antrieb und Fahrzeug 2020; Springer: Berlin/Heidelberg, Germany, 2021; pp. 179–201. [Google Scholar]
  16. Merker, G.P. Grundlagen Verbrennungsmotoren: Funktionsweise und Alternative Antriebssysteme Verbrennung, Messtechnik und Simulation, 9th ed.; Springer Fachmedien Wiesbaden: Wiesbaden, Germany, 2019; ISBN 9783658235574. [Google Scholar]
  17. Pischinger, S.; Seiffert, U. Vieweg Handbuch Kraftfahrzeugtechnik; Springer Fachmedien Wiesbaden: Wiesbaden, Germany, 2021; ISBN 978-3-658-25556-5. [Google Scholar]
  18. Andert, J.; Xia, F.; Klein, S.; Savelsberg, R.; Guse, D.; Tharmakulasingam, R.; Thewes, M.; Scharf, J. Road-to-Rig-to-Desktop—Virtual Development Using Real-Time Engine Modeling and Powertrain-Co-Simulation. COMODIA 2017, 2017.9, A108. [Google Scholar] [CrossRef]
  19. Gottorf, S.; Fryjan, J.; Leyens, L.; Picerno, M.; Habermann, K.; Pischinger, S. Lean Approach for Virtual Calibration Using Hardware-in-the-Loop and Electronic Control Unit (ECU)-Capable Engine Simulation. SAE Int. J. Engines 2021, 14. [Google Scholar] [CrossRef]
  20. Schäfer, S. Modellbasierte Steuerung des Kühlkreislaufes einer Brennstoffzelle mit automatisiertem Test der Software. Ph.D. Thesis, Technische Universität Darmstadt, Darmstadt, Germany, 2012. [Google Scholar]
  21. Platner, S.; Kordon, M.; Fakiolas, E.; Atzler, H. Modellbasierte Serien-kalibrierung—Der effiziente Weg für Variantenentwicklung. MTZ Motortech Z 2013, 74, 754–761. [Google Scholar] [CrossRef]
  22. Eichlseder, W.; Hager, J.; Raup, M.; Dietz, S. Auslegung von Kühlsystemen mittels Simulationsrechnung. Automob. Z. 1997, 99, 638–647. [Google Scholar]
  23. VDI/VDE. Entwicklung Mechatronischer und Cyber-Physischer Systeme; VDI/VDE: Berlin, Germany, 2021; Available online: https://www.vdi.de/richtlinien/details/vdivde-2206-entwicklung-mechatronischer-und-cyber-physischer-systeme (accessed on 3 February 2023).
  24. Banjac, T.; Wurzenberger, J.C.; Katrašnik, T. Assessment of engine thermal management through advanced system engineering modeling. Adv. Eng. Softw. 2014, 71, 19–33. [Google Scholar] [CrossRef]
  25. Lu, L.; Chen, H.; Hu, Y.; Gong, X.; Zhao, Z. Modeling and Optimization Control for an Engine Electrified Cooling System to Minimize Fuel Consumption. IEEE Access 2019, 7, 72914–72927. [Google Scholar] [CrossRef]
  26. Setlur, P.; Wagner, J.R.; Dawson, D.M.; Marotta, E. An Advanced Engine Thermal Management System: Nonlinear Control and Test. IEEE/ASME Trans. Mechatron. 2005, 10, 210–220. [Google Scholar] [CrossRef]
  27. Kang, H.; Ahn, H.; Min, K. Smart cooling system of the double loop coolant structure with engine thermal management modeling. Appl. Therm. Eng. 2015, 79, 124–131. [Google Scholar] [CrossRef]
  28. Wilson, S.; Yoon, H.-S.; Sun, Y.; Lee, J.H.; Ha, J.; Lee, E. A Comparative Study on Engine Thermal Management System. In Electronic Control Module Network and Data Link Development and Validation Using Hardware in the Loop Systems; SAE Technical Paper Series; 2020/04/14; Williams, D., Allen, J., Hukkeri, R., Eds.; SAE International: Warrendale, PA, USA, 2009; ISBN 0148-7191. [Google Scholar]
  29. Luptowski, B.J.; Arici, O.; Johnson, J.H.; Parker, G.G. Development of the Enhanced Vehicle and Engine Cooling System Simulation and Application to Active Cooling Control; SAE Technical Paper; 2005-01-0697; SAE International: Warrendale, PA, USA, 2005; Available online: https://www.sae.org/publications/technical-papers/content/2005-01-0697/ (accessed on 15 February 2023).
  30. Shujiang, L.; Chaoying, S.; Xiangdong, W.; Lixin, K. Based on intelligent controller design of automotive engine cooling in AVR microcontroller. In Proceedings of the 2011 IEEE International Conference on Automation and Logistics (ICAL), Chongqing, China, 15–16 August 2011; pp. 254–260, ISBN 2161-816X. [Google Scholar]
  31. Sanna, A.; Hutter, C.; Kenning, D.; Karayiannis, T.G.; Sefiane, K.; Nelson, R.A. Numerical investigation of nucleate boiling heat transfer on thin substrates. Int. J. Heat Mass Transf. 2014, 76, 45–64. [Google Scholar] [CrossRef] [Green Version]
  32. Liu, H.; Wen, M.; Yang, H.; Yue, Z.; Yao, M. A Review of Thermal Management System and Control Strategy for Automotive Engines. J. Energy Eng. 2021, 147. [Google Scholar] [CrossRef]
  33. Chen, Y.-M.; Lee, J.; Holmer, J.; Ha, J. Model Predictive Control for Engine Thermal Management System. In SAE Technical Paper Series, Proceedings of the SAE WCX Digital Summit, 12–15 April 2021; SAE International 400 Commonwealth Drive: Warrendale, PA, USA, 2021. [Google Scholar]
  34. Castiglione, T.; Pizzonia, F.; Bova, S. A Novel Cooling System Control Strategy for Internal Combustion Engines. SAE Int. J. Mater. Manf. 2016, 9, 294–302. [Google Scholar] [CrossRef]
  35. Zhou, B.; Lan, X.; Xu, X.; Liang, X. Numerical model and control strategies for the advanced thermal management system of diesel engine. Appl. Therm. Eng. 2015, 82, 368–379. [Google Scholar] [CrossRef]
  36. Bova, S.; Castiglione, T.; Piccione, R.; Pizzonia, F.; Belli, M. Experimental Investigation and Lumped-parameter Model of the Cooling System of an ICE under Nucleate Boiling Conditions. Energy Procedia 2015, 81, 907–917. [Google Scholar] [CrossRef] [Green Version]
  37. Caresana, F.; Bilancia, M.; Bartolini, C.M. Numerical method for assessing the potential of smart engine thermal management: Application to a medium-upper segment passenger car. Appl. Therm. Eng. 2011, 31, 3559–3568. [Google Scholar] [CrossRef] [Green Version]
  38. Margot, X.; Quintero, P.; Gomez-Soriano, J.; Escalona, J. Implementation of 1D–3D integrated model for thermal prediction in internal combustion engines. Appl. Therm. Eng. 2021, 194, 117034. [Google Scholar] [CrossRef]
  39. Broatch, A.; Margot, X.; Garcia-Tiscar, J.; Escalona, J. Validation and Analysis of Heat Losses Prediction Using Conjugate Heat Transfer Simulation for an Internal Combustion Engine. In SAE Technical Paper Series, Proceedings of the 14th International Conference on Engines & Vehicles, Napoli, Italy, 15–19 September 2019; SAE International 400 Commonwealth Drive: Warrendale, PA, USA, 2019. [Google Scholar]
  40. Mao, S.; Feng, Z.; Michaelides, E.E. Off-highway heavy-duty truck under-hood thermal analysis. Appl. Therm. Eng. 2010, 30, 1726–1733. [Google Scholar] [CrossRef]
  41. Bayraktar, I. Computational simulation methods for vehicle thermal management. Appl. Therm. Eng. 2012, 36, 325–329. [Google Scholar] [CrossRef]
  42. Millo, F.; Caputo, S.; Cubito, C.; Calamiello, A.; Mercuri, D.; Rimondi, M. Numerical Simulation of the Warm-Up of a Passenger Car Diesel Engine Equipped with an Advanced Cooling System. In SAE Technical Paper Series, Proceedings of the SAE 2016 World Congress and Exhibition, Detroit, MI, USA, 12–14 April 2016; SAE International 400 Commonwealth Drive: Warrendale, PA, USA, 2016. [Google Scholar]
  43. Mercedes-Benz SL: Entwicklung und Technik; Ernstberger, U.; Weissinger, J.; Frank, J. (Eds.) Springer Fachmedien Wiesbaden: Wiesbaden, Germany, 2013; ISBN 978-3-658-00799-7. [Google Scholar]
  44. Balazs, A. Optimierte Auslegung von ottomotorischen Hybridantriebssträngen unter realen Fahrbedingungen: Lehrstuhl für Verbrennungskraftmaschinen und Institut für Thermodynamik. Ph.D. Thesis, RWTH Aachen, Aachen, Germany, 2015. [Google Scholar]
  45. Seibel, J.; Pischinger, S. Abschlussbericht zum Vorhaben Untersuchung zur optimierten Auslegung von Ottomotoren in Hybrid-Antriebsträngen; FVV, Heft R537; FVV: Frankfurt, Germany, 2007. [Google Scholar]
  46. FEV Software and Testing Solutions. Doe Software with Global Map Optimization Gaussian Process Model. Available online: https://www.fev-sts.com/fileadmin/user_upload/STS/Brochure-Catalog_2022/FEV-STS_Brochure_xCAL_2022.pdf (accessed on 5 February 2023).
  47. Kexel, J.; Müller, J.; Pischinger, S.; Günther, M. Interim Report: Highly-Flexible Internal Combustion Engines for Hybrid Vehicles (HyFlex-ICE): FVV1433, Heft R602; FVV: Frankfurt, Germany, 2022. [Google Scholar]
  48. Kexel, J.; Müller, J.; Pischinger, S.; Günther, M. Optimal Powertrain Design Process Tailored for Specific Target Customer Requirements. In Proceedings of the E-MOTIVE 14th International Expert Forum: Conference on Electric Vehicle Drives and E-Mobility, Wolfsburg, Germany, 21–22 September 2022. [Google Scholar]
  49. Klaus, B. Untersuchung des Wärmetransports vom Kolben über die Ringe und die Zylinderbuchse zum Kühlmittel. Ph.D. Thesis, TU München, München, Germany, 1996. [Google Scholar]
  50. Pflaum, W.; Mollenhauer, K. Wärmeübergang in der Verbrennungskraftmaschine; Springer: Wien, Austria; New York, NY, USA, 1977; ISBN 9783211813874. [Google Scholar]
  51. Vieler, S. Mirko Plettenberg Bedarfsgerechte Kolbenkühlung F973. In Abschlussbericht Low Friction Powertrain; Forschungsvereinigung Verbrennungskraftmaschinen e.V. (FVV): Frankfurt, Germany, 2013. [Google Scholar]
  52. Handbuch Verbrennungsmotor: Grundlagen, Komponenten, Systeme, Perspektiven: Grundlagen, Komponenten, Systeme, Perspektiven, 8th ed.; Van Basshuysen, R.; Schäfer, F. (Eds.) Springer Science and Business Media, Springer Vieweg: Wiesbaden, Germany, 2017; ISBN 9783658109028. [Google Scholar]
  53. Woschni, G. Beitrag zum Problem des Wärmeübergangs im Verbrennungsmotor, 26th ed.; MTZ: Sulzbach, Germany, 1965. [Google Scholar]
  54. Kehren, C.; Henaux, D.; Hermsen, F.-G.; Ortlieb, P. How to Hybrid—Anwendung des digitalen Reibungsabschätzungstools FRET im Entwicklungs-Frontloading. In Experten-Forum Powertrain: Reibung in Antrieb und Fahrzeug 2020; Liebl, J., Ed.; Springer: Berlin/Heidelberg, Germany, 2021; pp. 61–77. ISBN 978-3-662-63607-7. [Google Scholar]
  55. Alexander Stalp, A.H. Partikelbildung bei DI-Ottomotoren: Systemische Analyse der Partikelbildung an Ottomotoren; FVV 1223, Heft R596; FVV: Frankfurt, Germany, 2020. [Google Scholar]
  56. Schyr, C.; Spreitzer, H. Digitaler Streckenatlas für die alpine Antriebsstrangerprobung. Automot. Eng. Partn. 2004, 44–47. [Google Scholar]
  57. Lopez-Sanz, J.; Ocampo-Martinez, C.; Alvarez-Florez, J.; Moreno-Eguilaz, M.; Ruiz-Mansilla, R.; Kalmus, J.; Graeber, M.; Lux, G. Thermal Management in Plug-In Hybrid Electric Vehicles: A Real-Time Nonlinear Model Predictive Control Implementation. IEEE Trans. Veh. Technol. 2017, 66, 7751–7760. [Google Scholar] [CrossRef] [Green Version]
  58. Bova, S.; Castiglione, T.; Piccione, R.; Pizzonia, F. A dynamic nucleate-boiling model for CO2 reduction in internal combustion engines. Appl. Energy 2015, 143, 271–282. [Google Scholar] [CrossRef]
  59. Castiglione, T.; Morrone, P.; Falbo, L.; Perrone, D.; Bova, S. Application of a Model-Based Controller for Improving Internal Combustion Engines Fuel Economy. Energies 2020, 13, 1148. [Google Scholar] [CrossRef] [Green Version]
  60. Weber, J. Automotive Development Processes; Springer: Berlin/Heidelberg, Germany, 2009; ISBN 978-3-642-01252-5. [Google Scholar]
  61. Cheng, J.; LaCrosse, S.M.; Tascillo, A.L.; Newman, C.E., Jr.; Davis, G.C. Virtual Vehicle Sensors based on Neural Networks Trained Using Data Generated by Simulation Models. U.S. Patent 6236908B1, 8 February 2023. [Google Scholar]
  62. Prokhorov, D. Virtual Sensors and Their Automotive Applications. In Proceedings of the 2005 International Conference on Intelligent Sensors, Sensor Networks and Information Processing, Melbourne, Australia, 5–8 December 2005; IEEE: New York, NY, USA, 2005; pp. 411–416, ISBN 0-7803-9399-6. [Google Scholar]
  63. Shutty, J.; Bongards, A.; Kondipati, N.; Ristevski, S. Thermomanagement bei elektrifizierten Antriebssystemen. ATZ Automobiltech Z 2022, 124, 38–43. [Google Scholar] [CrossRef]
  64. Rouaud, C. Innovatives Batteriekühlsystem mittels Immersionskühlung für Mainstream-BEV. In Proceedings of the 30th Aachen Colloquium Sustainable Mobility, Aachen, Germany, 4–6 October 2021; Aachener Kolloquium Fahrzeug-und Motorentechnik GbR: Aachen, Germany, 2021. [Google Scholar]
  65. Champagne, N. Wie durch den Einsatz einer innovativen Flüssigkeit für das Thermomanagement die Batteriesicherung erhöht werden. In Proceedings of the 30th Aachen Colloquium Sustainable Mobility, Aachen, Germany, 4–6 October 2021; Aachener Kolloquium Fahrzeug-und Motorentechnik GbR: Aachen, Germany, 2021. [Google Scholar]
Figure 1. Future development of passenger car powertrain topology in Europe (2020–2040) [3]. 1) Stop/Start and 12 V energy management. 2) 12 V and 28 V mild hybrids. 3) Includes 48 V hybrid with fully hybrid functionalities.
Energies 16 03238 g001
Figure 2. Simulation-based thermal management design applications and corresponding V-model for control strategy development.
Energies 16 03238 g002
Figure 3. Schematic layout of high-temperature cooling circuit including controlled actuators and temperature sensors (TMM: Thermal Management Module, HT: High-temperature circuit, MT: Medium-temperature radiator, LT: Low-temperature radiator, AC: Air condenser, HVAC: Heating, Ventilation, Air Conditioning heat exchanger).
Energies 16 03238 g003
Figure 4. Vehicle simulation methodology for hybrid electric vehicles. (DoE: Design of Experiments, V2X: Vehicle-to-X, ADAS: Advanced Driver Assistance Systems).
Energies 16 03238 g004
Figure 5. Advanced thermal management simulation model for an internal combustion engine.
Energies 16 03238 g005
Figure 6. ATMM model validation for coolant temperature variation of TCoolant,ICE,Out = 60 °C, TCoolant,ICE,Out = 90 °C and TCoolant,ICE,Out = 100 °C at engine full load with different engine speeds.
Energies 16 03238 g006
Figure 7. Process for the simulation actual temperatures and flow rates on the ECU.
Energies 16 03238 g007
Figure 8. (a) Function definition (left side), pump and TMM control (right side); (b) Relative HC and particulate raw emissions referred to TCoolant = 90 °C for a variation of average combustion chamber temperature TCCW and engine load pmi.
Energies 16 03238 g008
Figure 9. Schematic control structure electric actuated components in the high-temperature cooling circuit.
Energies 16 03238 g009
Figure 10. WLTC simulation results of the advanced thermal model at 23 °C ambient temperature.
Energies 16 03238 g010
Figure 11. Schematic layout of the ECU coordinator function.
Energies 16 03238 g011
Figure 12. WLTC simulation results of ATMM and Co-simulation (MiL) at 23 °C ambient temperature.
Energies 16 03238 g012
Figure 13. Großglockner real world driving scenario with corresponding vehicle speed and elevation profile.
Energies 16 03238 g013
Figure 14. Großglockner High Alpine Road simulation results at 30 °C ambient temperature.
Energies 16 03238 g014
Figure 15. Model setup of virtual coolant temperature sensor T1.
Energies 16 03238 g015
Figure 16. Demonstration of failure mode detection for TMM radiator path leakage in WLTC.
Energies 16 03238 g016
Figure 17. Simulation results of thermal battery performance and the corresponding cooling system during kickdown events at 40 °C ambient temperature.
Energies 16 03238 g017
Table 1. Technology (electric water pump and thermal management module) and control strategy optimization results for the WLTC at 23 °C ambient temperature compared to the baseline with mechanical pump and wax thermostat.
ParameterReduction Potential in WLTC, 23 °C
Water pump driving power 28.4%
Piston group friction 4.4%
Total friction 2.4%
CO2 emissions 0.5%
Table 2. Comparison of rule-based and model predictive control approaches for the WLTC with different boundary conditions for the coolant temperature setpoints.
Control ApproachWater Pump Energy ReductionFriction Energy Reduction
Baseline 1, rule-basedBaseBase
Baseline 1 MPC4.4%0%
Advanced 2 MPC22.3%3.7%
1 Baseline: Standard temperature setpoints for coolant as used for the simulations in Section 5. 2 Advanced: Coolant temperature setpoints increased to the boiling temperature with a safety margin of 5 K.
Disclaimer/Publisher’s Note: The statements, opinions and data contained in all publications are solely those of the individual author(s) and contributor(s) and not of MDPI and/or the editor(s). MDPI and/or the editor(s) disclaim responsibility for any injury to people or property resulting from any ideas, methods, instructions or products referred to in the content.

