Article

Techno-Economic Analysis of Succinic Acid Production from Sugar-Rich Wastewater

by
Hyunjin Kim
1,
Byoung-In Sang
1,2,
Panagiotis Tsapekos
3,
Irini Angelidaki
3 and
Merlin Alvarado-Morales
3,*
1
Department of Chemical Engineering, Hanyang University, 222 Wangshimni-ro, Seongdong-gu, Seoul 04763, Republic of Korea
2
Clean Energy Research Institute, Hanyang University, 222 Wangshimni-ro, Seongdong-gu, Seoul 04763, Republic of Korea
3
Department of Chemical and Biochemical Engineering, Technical University of Denmark, DK-2800 Kgs. Lyngby, Denmark
*
Author to whom correspondence should be addressed.
Energies 2023, 16(7), 3227; https://doi.org/10.3390/en16073227
Submission received: 23 January 2023 / Revised: 19 March 2023 / Accepted: 30 March 2023 / Published: 3 April 2023

Abstract

:
Succinic acid (SA) is a valuable platform chemical that can be converted into biodegradable plastics, resins, solvents, etc. The emerging biological routes for SA production are gaining more attention because they exploit the natural abilities of bacteria to fixate carbon dioxide (CO2). On the other hand, an inexpensive organic carbon source that can fulfill the energetic requirements of the microbial strain is also a significant challenge for industrial SA production. The current work presents a holistic techno-economic analysis of SA production using sugar-rich residual streams and biogas as raw materials. Simulation results showed that by establishing an integrated process, high SA production can be simultaneously achieved with biogas upgrading. The CO2 provided from biogas and carbohydrates, which are provided from organic by-products is converted into two products: biomethane (CH4 > 95%, a clean biofuel), and SA. The mass and energy balances and techno-economic indicators were simulated and calculated using SuperPro Designer®. The total capital investment and the total production cost for a facility producing 1000 tSA/year were estimated to be EUR 5,211,000 and EUR 2,339,000 per year, respectively. The total revenue was calculated to be EUR 2,811,000 per year, while the revenue due to biomethane produced, namely, 198,150 Nm3 corresponded to EUR 205,284 per year. The return on investment, payback period, and internal rate of return of the project were found to be 11.68%, 8.56 years, and 11.11%, respectively.

1. Introduction

Succinic acid (SA) is identified as one of the essential platform chemicals for the production of bulk chemicals, polymers, resins, solvents, etc. Traditionally, SA has been produced via the petro-chemically catalytic hydrogenation of maleic acid or maleic anhydride. However, fermentation-based bio-manufacturing processes have emerged due to sustainability, political, and environmental concerns [1]. Consequently, the market size of bio-based succinic acid (bio-SA) was estimated at USD 110.4 million in 2021 [2], while the market size of whole SA (combined bio-based SA and fossil-based SA) was USD 222.9 [3].
Because the market price of bio-SA (2.94 USD/kg) is higher than that of fossil-based SA (2.5 USD/kg) [4], the feasibility of the bio-based route highly depends on providing sustainable, adequate, and inexpensive raw materials. Nowadays, fermentative SA is mainly produced using agricultural feedstocks that need land and water for their cultivation. At a semi- or fully industrial scale, Myriant uses sorghum; Reverdia uses sugarcane and corn starch; and DMS and Roquette use starch from corn [5,6]. Nowadays, sugar-rich residual resources are explored as an alternative to lignocellulosic materials and agricultural feedstocks [7,8].
The interest in bio-SA can decline due to severe competition with low oil and gas prices, thus favoring the petrochemical route. The cost of bio-based production could be markedly reduced through the utilization of residual resources. Hence, the introduction into the market of an environmentally friendly technology utilizing sugar-rich waste streams and reducing the carbon footprint can have great advantages (e.g., high abundance of low-cost residual resources, increased sustainability, and a circular economy).
Focusing on the bioproduction route, various microbial hosts such as Anaerobiospirillum succiniciproducens, Actinobacillus succinogenes, Mannheimia succiniciproducens, and Basfia succiniciproducens were found to grow well on carbohydrates and CO2 [9,10]. SA production via fermentation requires both glucose and CO2 substrates, and hence, bio-based manufacturing involves not only on the hunting of new organic carbon sources but also CO2 sources. Alternative CO2 sources can also accelerate the market uptake of the SA bio-based route via carbon capture and utilization technology. A central role in achieving decarbonization can be fulfilled by the adoption of circular bioeconomy approaches for industrial sectors with high emissions of CO2. Meanwhile, the bio-based industry could also lead to the creation of net sinks since the CO2 that was previously fixed in the biomass is not released but stored as chemicals and materials.
On this topic, the biogas sector can serve as a perfect example of a mainstay of a circular bioeconomy. Traditionally, the produced biogas is burnt in a combined heat and power plant for energy and heat generation. Lately, there has been an increased interest in injecting the produced gas into the natural gas grid. It is known that biogas produced through anaerobic digestion is generally composed of 40% of CO2 and 60% CH4 [11]. Thus, first of all, the biogenic CO2 should be removed, and then, the pure biomethane can be injected into the natural gas grid. Succinogenic bacteria can be used to capture the CO2 that is present in biogas while producing SA and pure methane, which are two molecules of high interest in the market. Indeed, the Actinobacillus succinogenes bacterium has been proven to upgrade biogas into a quality that is suitable for grid injection (> 90% CH4) [12].
Focusing on market opportunities, the European Union (EU) is the world leader in biogas production, with more than 17,000 biogas plants (the combined production of biogas and biomethane is 18.4 billion Nm3 in Europe), and it is planning to widen the biomethane sector through both political and economic policies [13]. In addition, the EU has large markets for SA in the world [14]. Thus, newly built production facilities can only improve the market potential by reducing the imports of platform chemicals. Overall, the integration of these two processes (i.e., SA production and biogas upgrading) can result in benefits for existing biogas facilities and a greater return on their infrastructure. This is an emerging technology [15], and it could be a good, promising alternative for attaining a carbon-neutral society. For this reason, a study on the production of bio-SA by Actinobacillus succinogenes 130Z using sugar-rich industrial waste and biogas on a bench-top reactor has recently been reported [16].
Thus, the present study aims to assess the techno-economic performance of SA production using residual resources on a pilot-scale based on the data of the previous study. To benchmark our proposed process design scenarios, first, a base-case design in which the feedstocks are pure glucose and CO2 was simulated. In our proposed process design scenario 1, pure glucose was replaced by waste from a candy factory, a rather under-utilized sugar-rich residual stream. In process design scenario 2, glucose was replaced by the candy factory waste, and the CO2 stream was replaced by biogas that came from an anaerobic digestion facility.
The conditions under which the bio-based route could have increased profitability were revealed. Process flowsheets were modeled and simulated in the SuperPro Designer® and the economic performance was evaluated based on substrate, nutrients, water, and CO2 prices. SuperPro Designer® is a process simulator that facilitates the modeling, evaluation, and optimization of integrated processes. It was developed specifically for the simulation of bioprocessing unit operations [17]. It can also be used at all stages of process development, from conceptual design to process operation and optimization. In addition to process modeling, the software includes many advanced convenience features that can be used for material and energy balance calculations, as well as an extensive database of chemical constituents and mixtures, equipment and resources, equipment sizing and costing, thorough process economics, and waste stream characterization [18]. It is a useful resource for large-scale processes because of its easy and user-friendly interphase. The simultaneous SA production and biogas upgrading were evaluated to improve process economics and sustainability.

2. Materials and Methods

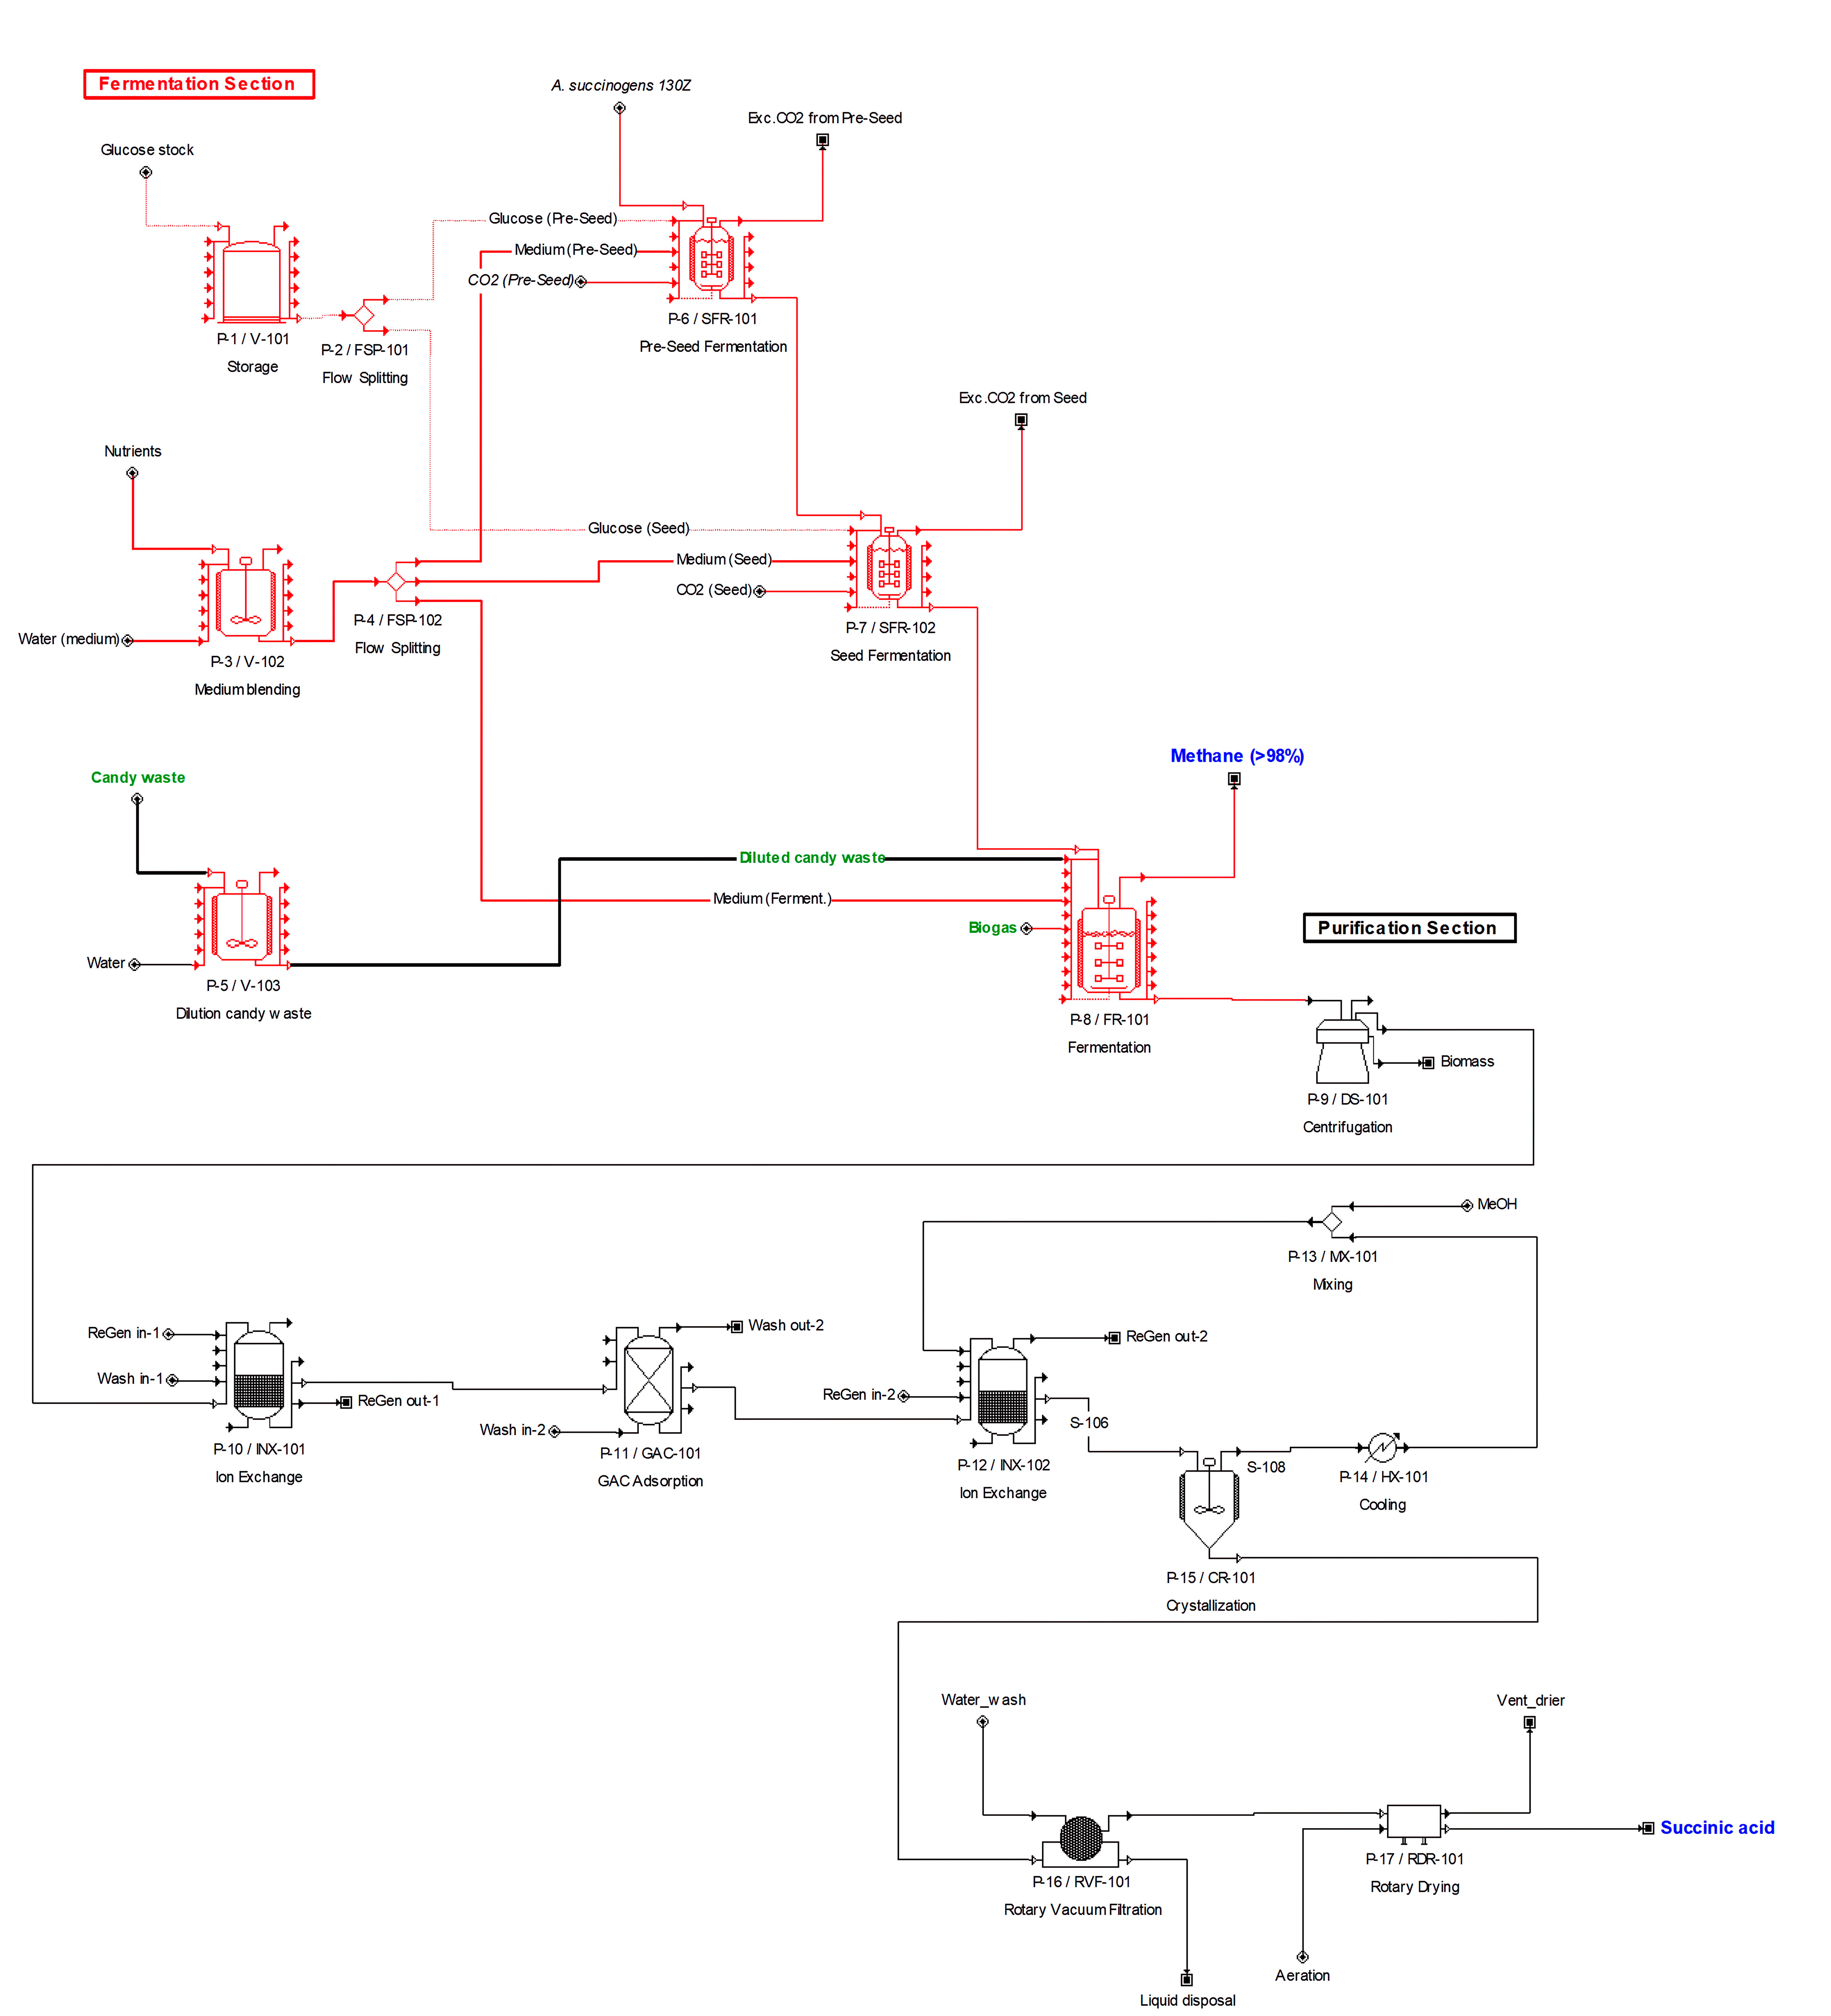
2.1. Base-Case Process Design

The techno-economic evaluation of the production process of bio-based SA was performed using the simulator SuperPro Designer® (v. 12, Intelligen, Inc., Scotch Plains, NJ, USA). In the base-case design, the plant consists of the fermentation and purification sections. The fermentation section consists of a pre-seed fermenter, a seed fermenter, and the main fermentation unit. Substrate and medium compositions were retrieved from the previous study [16]. The bacterial strain Actinobacillus succinogenes 130Z was selected as the SA producer. Glucose, CO2, and nutrients (NH3, CaCl2, MgCl2, K2HPO4, NaCl, and yeast extract) were the main raw materials for the fermentation process. The following stoichiometry in Equation (1) was considered for bio-based SA production [19].
C 6 H 12 O 6 + 0.8571 C O 2 + 0.0714 N H 3 0.3571 C H 1.8 O 0.5 N 0.2 + 1.25 C 4 H 6 O 4 + 0.5 C 2 H 4 O 2 + 0.5 C H 2 O + 0.5355 H 2 O
Acetic acid and formic acid, which are metabolites from the anaerobic fermentation of A. succinogenes 130Z, were considered by-products. Fermentation is performed at 37 °C and a concentration of SA of 40.62 g/L was specified from about 50 g/L of glucose, which resulted in a production of 1250 kg SA/batch in 24 h. On the other hand, the purification section was simulated based on ion exchange and crystallization. Ion exchange and crystallization process unit operations are commonly used for the separation and purification of SA [20]. In this study, cation exchange activated carbon treatment and dewatering with a polymer resin lab-scale data reported by Karp et al. [21] and used to validate the simulation tasks (details of the purification technology are in Section 2.3). It was considered that the plant produces ca. 1000 tons of bio-based SA per year at pilot scale. It was assumed that the plant has a lifespan of 20 years and operates 330 days per year. The construction period was assumed to start in year one, with a time frame of four months. Based on the Danish economic situation, the discount rate, income tax, inflation rate, and depreciation were set to 10%, 22%, 8%, and 5%, respectively [11,22,23]. The process flowsheet diagram is illustrated in Figure 1, and the plant’s characteristics are shown in Table 1.

2.2. Process Design Scenarios

After having defined the base-case scenario for producing bio-based SA from glucose and CO2 gas, two technological alternatives were simulated and analyzed. In process design 1, a residual stream coming from a candy factory was used as a feedstock instead of glucose. The concentrated candy waste contained 46.46 g/L of glucose, 76.92 g/L of fructose, and 153.00 g/L of maltose [16]. The raw candy waste solution was diluted to about 50 g/L of sugars containing maltose, fructose, and glucose, after which it was fed into the reactor. The purchase price of the candy waste residual stream was set to zero. For process design 2, biogas was used as the CO2 source instead of pure CO2. Biogas was considered a mixture of CH4 and CO2 in a 60:40 volume ratio. The methane content of the vented gas after SA production was calculated to be ≥ 98% and can be sold as high-purity biomethane. Proceeds due to the sale of methane were taken into account in the process profit calculation. The main values used in the techno-economic analysis are summarized in Table 2.

2.3. Downstream Process Simulation

The same downstream process was considered in all the process design scenarios; ion exchange, a purification method commonly used in bio-SA production, was selected [20]. As shown in Figure 1, after the fermentation process unit, the fermentation broth is sent to a centrifugation unit to remove cell biomass. Then, the first ion exchange unit removes cations such as Ca2+, Mg2+, and Na+. DOWEX G-26 resin was used, and its purchase price was assumed to be 56.8 EUR/kg [27]. After washing with water at 1-bed volume (BV), the SA concentration in the diluted fermentation broth from the ion exchange column was about 34 g/L. It was considered that a 1 BV with a 10 wt% sulfuric acid solution be used for the regeneration column [21]. After the first ion-exchange unit, the fermentation broth is sent to an adsorption column where color removal takes place using activated carbon. In this step, the remaining biomass, cations, and anions were also eliminated. A loss of 3% of the produced SA was considered in this step [21]. For water and remaining sugar removal, a second column was used. In order to separate the acids from the aqueous solution, a solid adsorbent with the property of selectively adsorbing acids is needed. Poly(4-vinylpyridine) (PVP) and polybenzimidazole (PBI) weak-base adsorbents are known to work well for this purpose [32,33]. Carboxylic acids can be selectively retained in the PVP and PBI resins through ion–pair interactions. Furthermore, it can be eluted with polar solvents (e.g., alcohol, acetone, etc.) [32,33]. In this simulation, PVP was applied to remove the acids, and its purchasing price was assumed to be 600 EUR/kg [28]. Glucose and water were removed by passing through the resin, and the remaining SA was eluted with methanol [21]. After the resin column, 1187 kg SA/batch was dissolved in about 22,000 kg methanol (40.45 g/L). Crystallization [21], rotary vacuum filtration [20], and drying [20] produce 1079 kg/batch with a purity of 99.5% of SA. After downstream processing, 86.32% of SA was recovered. The vented methanol vapor from the crystallization step was captured and liquefied by cooling. The gathered methanol was about 20,000 kg, and it was recycled into the resin column.

2.4. Economic and Sustainability Analysis

The proposed process design scenarios were implemented in the SuperPro Designer® simulator to obtain the mass and energy balances needed to produce 1 ktons of bio-based SA. Subsequently, sizing of the equipment was also performed, and then capital and operation costs were calculated. Finally, net present value (NPV), internal rate of return (IRR), payback period (PBP), and return on investment (ROI) were calculated to assess the economic feasibility of the process design alternatives. Euros were the currency employed in the simulation (EUR). The equipment sizing was performed by the simulator and the costs were calculated following [34] (see Supplemental Materials, Table S1). Candy waste is a stream that should be treated before being disposed of, while biogas was considered to be directly produced in the wastewater treatment plant where the SA production site was considered to be built. Thus, the purchase, production, and transportation costs associated with the candy waste were set to zero. The purchase price of biogas was set at 0.172 EUR/kg (0.2 EUR/Nm3, biogas density; 1.158 kg/Nm3) [11], which is the operating cost for anaerobic digestion without upgrading biogas to biomethane. The produced SA was set as the main revenue, while the produced methane was set as an extra revenue in process design 2. The selling price of products was retrieved from [29] and International Energy Agency [30] (Table 2). Other materials’ purchasing prices, price of utility, consumable, and wastewater treatment are shown in Table 2, Tables S2 and S3. The estimation of equipment costs was based on a factor method that estimates installation and construction costs based on equipment purchase costs [35]. Table 3 provides the relevant information. To use the candy waste as an organic carbon source, a blending tank for dilution was added in scenarios 1 and 2 (Table S1). Thus, differences in the equipment purchase costs led to differences in the total capital costs (Table 3). Operating costs for SA were computed by aggregating expenses, including raw materials, utilities, waste management, wages, depreciation, and company taxes. The operator-related costs were estimated considering an operator salary of 24.2 EUR/h [36,37]. The labor load required for each operation followed the default settings of SuperPro Designer®. The depreciation method used for equipment and buildings was the straight-line method with a 5% depreciation period of 20 years [34]. For the analysis, it assumed that the Danish corporate tax rate is 22% [38] and the inflation rate is 8% [23].
The simulated alternatives of the different processes were evaluated as an investment project, considering different techno-economic indicators for subsequent analysis, such as the NPV, IRR, PBP, and ROI. The profitability over the project’s lifetime was evaluated by calculating several indicators as follows:
N e t   p r o f i t = R e v e n u e O p e r a t i n g   c o s t T a x e s + D e p r e c i a t i o n
G r o s s   m a r g i n = R e v e n u e O p e r a t i n g   c o s t R e v e n u e × 100
R e t u r n o n i n v e s t m e n t R O I = N e t   p r o f i t T o t a l   i n v e s t m e n t
P a y b a c k   t i m e P B P = T o t a l   i n v e s t m e n t N e t   p r o f i t
N e t   c a s h   f l o w N C F = D e b t   f i n a n c i n g C a p i t a l   e x p e n s e s + R e v e n u e O p e r a t i n g   c o s t T a x e s + D e p r e c i a t i o n
where NCFn refers to the future net cash flows from the plant over n years with interest rate i and project lifetime (N = 20 years):
N e t   p r e s e n t   v a l u e N P V = n = 0 N N C F n ( 1 + i ) n
The direct fixed capital (DFC) outlay is 30%, 40%, and 30% for the 1st, 2nd, and 3rd years, respectively.
Based on process design alternative 2, a sensitivity analysis was performed to evaluate the economics of the process. The following parameters were examined: the selling price of SA, the biomethane selling price, the tax imposed on CO2 emissions (750 DKK/ton CO2 = 100.84 EUR/ton CO2), biogas purchasing price, and DFC. All variables of interest varied over the ±20% range.

3. Results and Discussion

3.1. Technical Evaluation

In the base-case simulation, 1097 kg/batch of bio-based SA with a purity of 99.5% was produced. Based on this, it was calculated that 890,729 kg (about 1.0 ktons) of SA is produced per year. The annual input of CO2 was 261 tons, and the glucose input was calculated to be 1,252,020 kg (1252 tons). In reported commercial bio-based SA fermentation processes, about 10–14 ktons of SA were produced annually [39,40,41,42,43,44]. Thus, the process in this study is about 1/10 of the scale compared with existing bio-based SA production processes [39,40,41,42,43,44]. As the aim of this study is to assess the economic feasibility of this emerging technology, which integrates biogas upgrading and SA production, and as no technology with these characteristics is yet available at a commercial scale, the selected production capacity is thus justified.
In process design alternative 1, the production of SA was the same as in the base case. However, the glucose input was dramatically reduced to 13,286 kg/year using the candy waste stream. The input glucose was only used for the pre-seed and seed fermentations, respectively. When the candy waste stream is used as the organic carbon source, the consumption of pure glucose in the main fermentation unit is no longer needed. In process design alternative 2, the input of CO2 to the main fermenters was replaced by biogas. Only 1219 Nm3 (1.81 tons) of CO2 was utilized for seed fermentation, and a volume of 218,413 Nm3 (401 tons) of biogas was processed per year. Of this, the amount of CO2 was 87,365 Nm3 (161 tons), and credits were applied for reducing CO2 emissions by this amount. After fermentation, 198,150 Nm3 (230 tons) of biomethane with 98.7% purity could be obtained annually.

3.2. Economic Evaluation

3.2.1. Capital Investment Estimation

Table 3 presents the capital investment for all the process equipment employed in the fermentation and purification sections. Extra equipment was required when utilizing the concentrated candy waste. The DFC investments were EUR 4656 M (base case), EUR 4792 M (alternative 1), and EUR 2792 M (alternative 2), respectively. Minor differences in total capital investment values between the two alternative cases were due to working capital, which was calculated as a 30-day expense. This was because the manufacturing cost of alternative 2 was higher, and a 30-day operation required a slightly higher investment.
The equipment purchase costs were estimated at approximately EUR 1.7 MM. Since the process in this study is on a pilot scale (1.0 ktons of annual production), the purchase cost of this equipment is quite small compared to reports on the techno-economic analysis of the SA production. The relatively small total capital investment (TCI) value (EUR 5.2 MM) was also attributed to the small equipment purchase cost. As an example, in the case of a process that produces 30 kt of SA per year using cane sugar, a TCI of EUR 146.6–153.5 MM was suggested [38]. When the annual production increased by 30 times, the TCI also increased by about 30 times. However, profitability cannot be simply compared because it must reflect the lifespan of the process. The TCI for the process to produce 1.9 ktons of SA using empty fruit branches was EUR 41 MM [45]. The annual production nearly doubled with the proposed process, and the TCI increased nearly 10 times, which can be attributed to the addition of the hydrolysis process for the saccharification of empty fruit branches. Since the use of the candy waste stream requires no special pretreatment other than dilution, the TCI could be reduced.

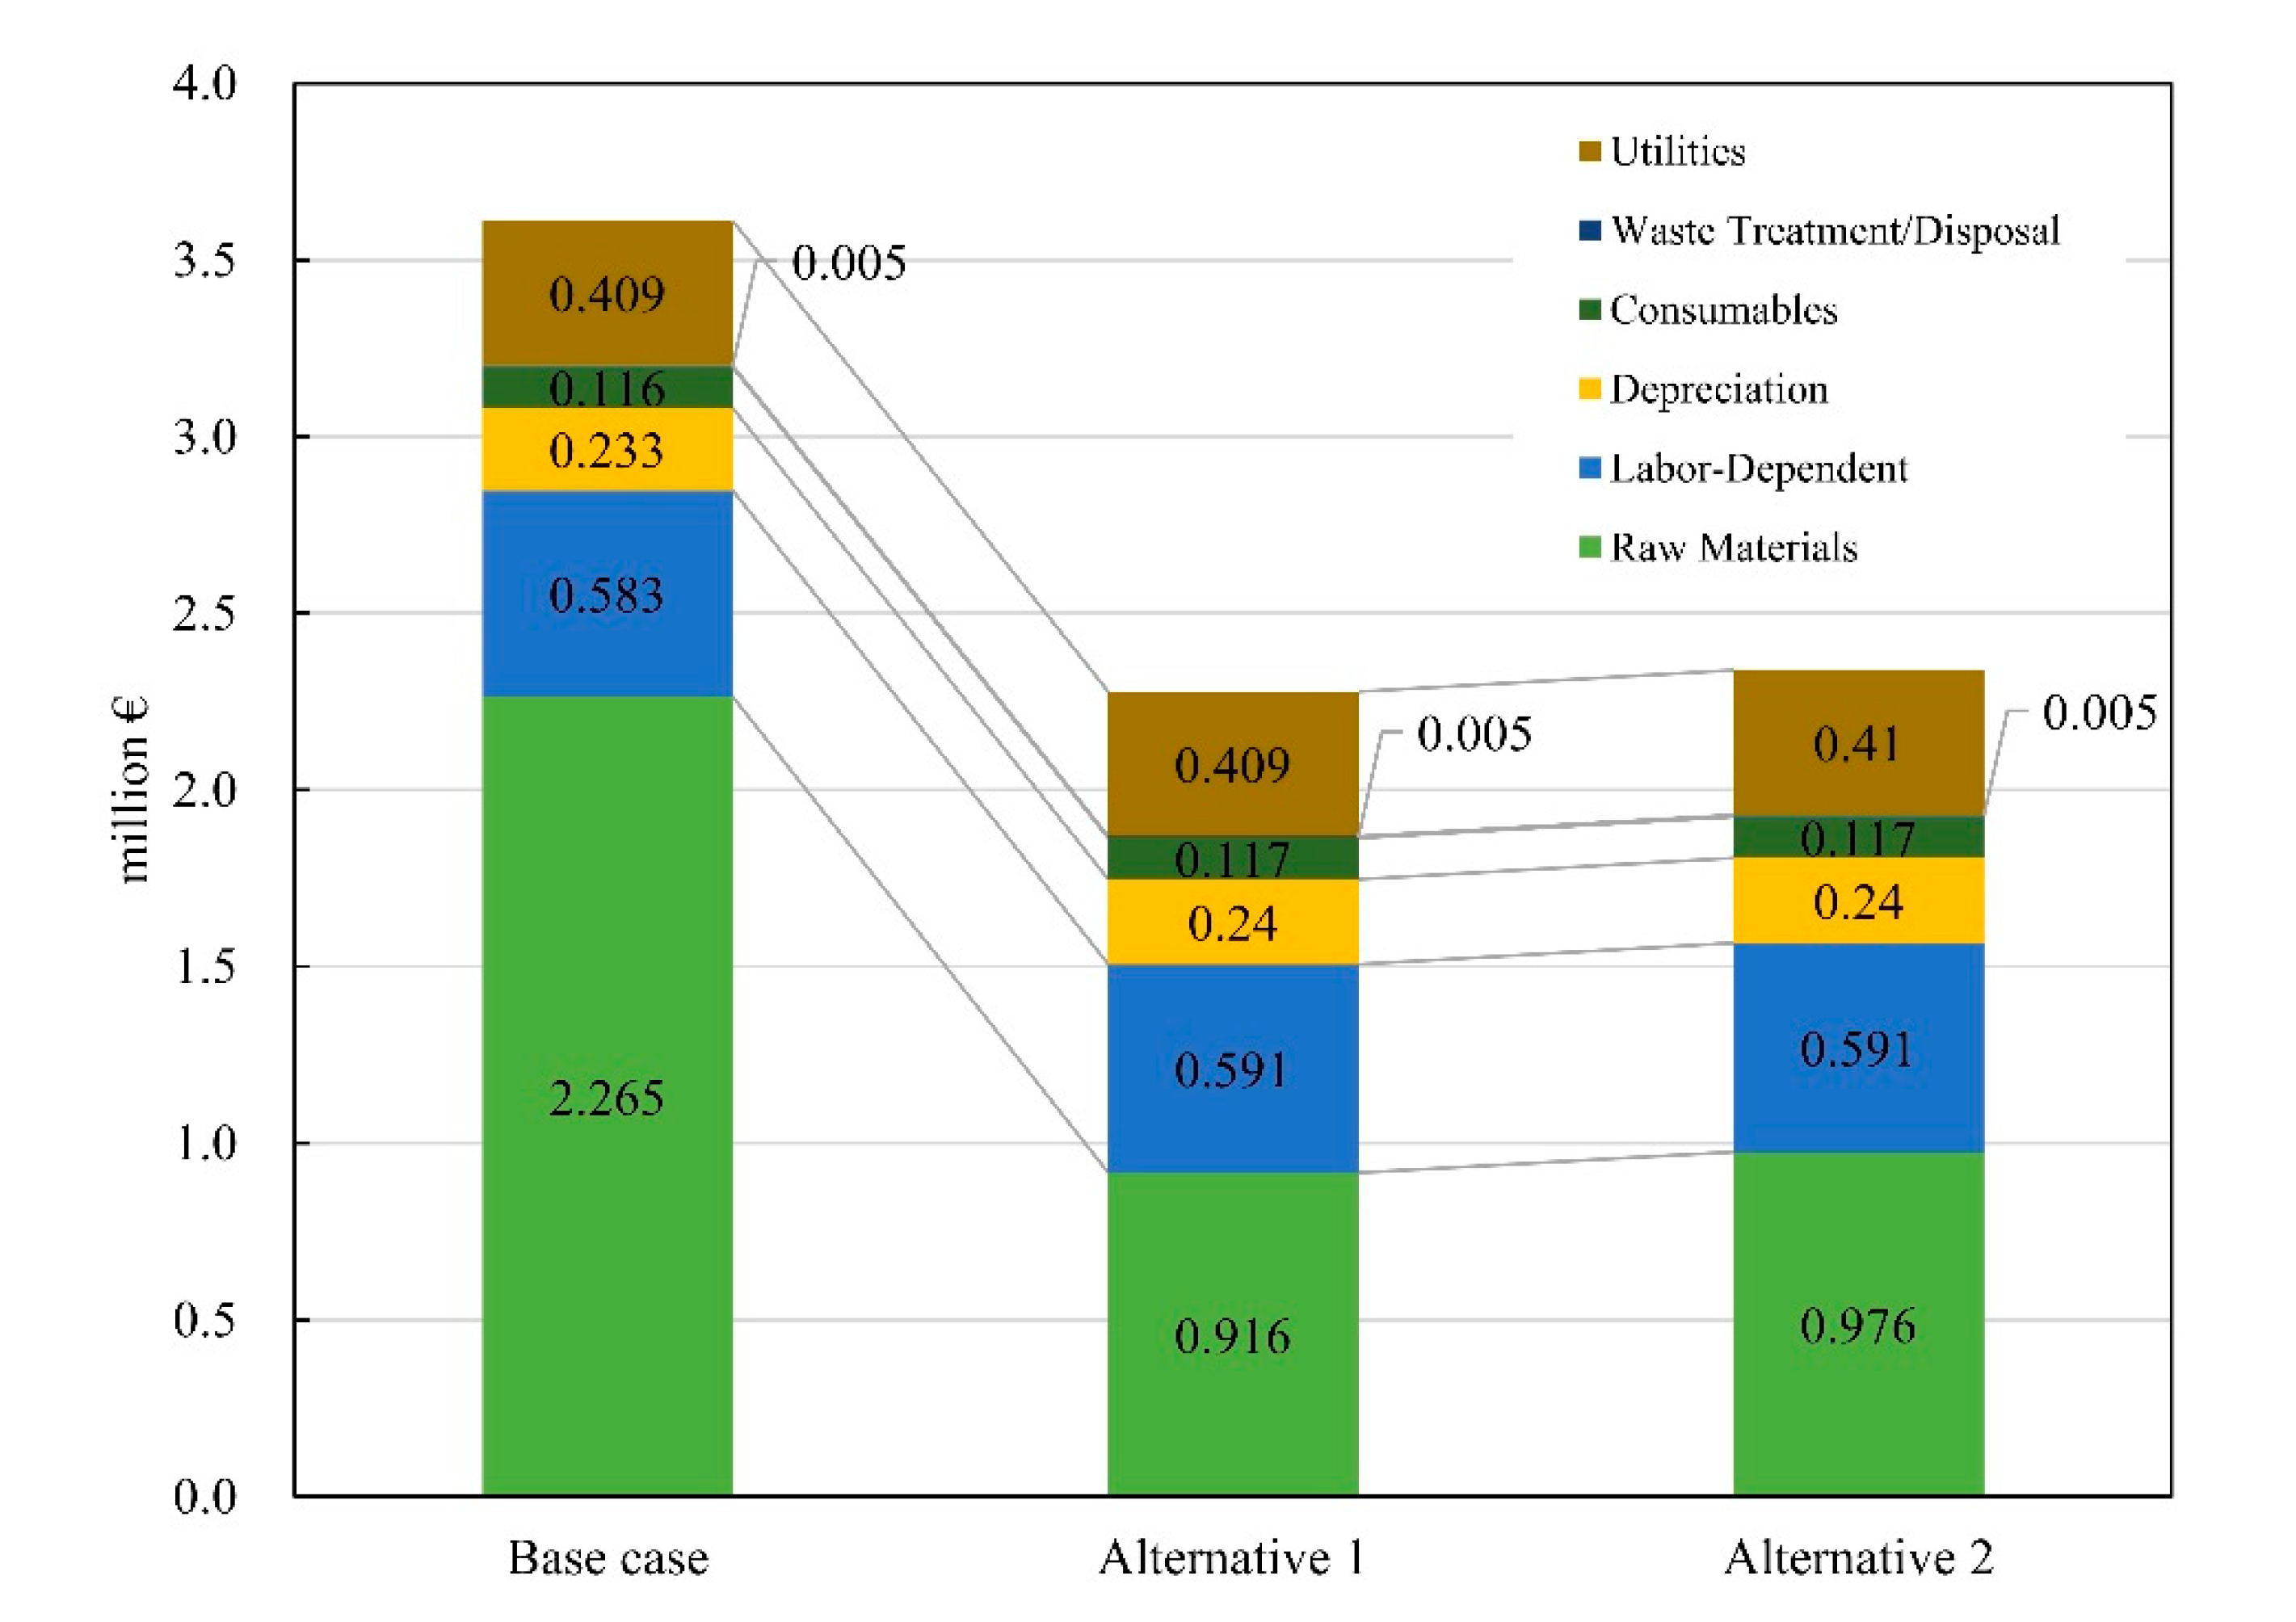
3.2.2. Estimation of the Cost of Manufacture

As shown in Figure 2, the raw material costs account for the largest percentage of the manufacturing costs. In the base case, it accounted for up to 63% of the total manufacturing cost of EUR 3.61 MM. In the base-case design and alternative process design 1, the cost of raw materials more than doubled (Figure 2). The reduced glucose cost is EUR 1.35 MM. This has significantly contributed to lowering the manufacturing cost per kg to below the selling price per kg (Table 4). Because the purchase cost of biogas was higher than the CO2 purchase cost, the raw material costs of alternative 2 were higher than alternative 1. When purifying the chemicals through distillation in a bioprocess, hot steam is used, which is often the reason for the highest cost of utilities in the process [46]. However, in the downstream process considered in this study, none of the steps require hot steam. About 21 ktons and 244 ktons of steam and chilled water are used annually for heating and cooling, respectively. The utility costs, including electricity consumption, accounted for 12–19% of the total manufacturing costs, at around EUR 0.41 MM. When using biogas as the CO2 source, more energy was needed, because a greater volume of gas was supplied. Thus, the utility costs of alternative 2 were higher than alternative 1. The cost of consumables, including activated carbon and two types of resin, was EUR 0.12 MM, which accounted for 2–5% of the total. With low consumables and utility costs, downstream processes can prove economically viable. The annual cost of waste treatment is estimated at around EUR 5.0 k, and the costs related to labor and depreciation are EUR 0.58 and EUR 0.23 MM, respectively. As the scale of the process increases, the share of labor-dependent costs can be expected to decrease [36]. The manufacturing costs per kg of SA in this study ranged from 2.57 EUR/kg to 4.07 EUR/kg (Table 4). It was still a high value compared to the reported range of 0.88 EUR/kg to 2.32 EUR/kg [5,9,38] in the previous techno-economic analysis of SA production.

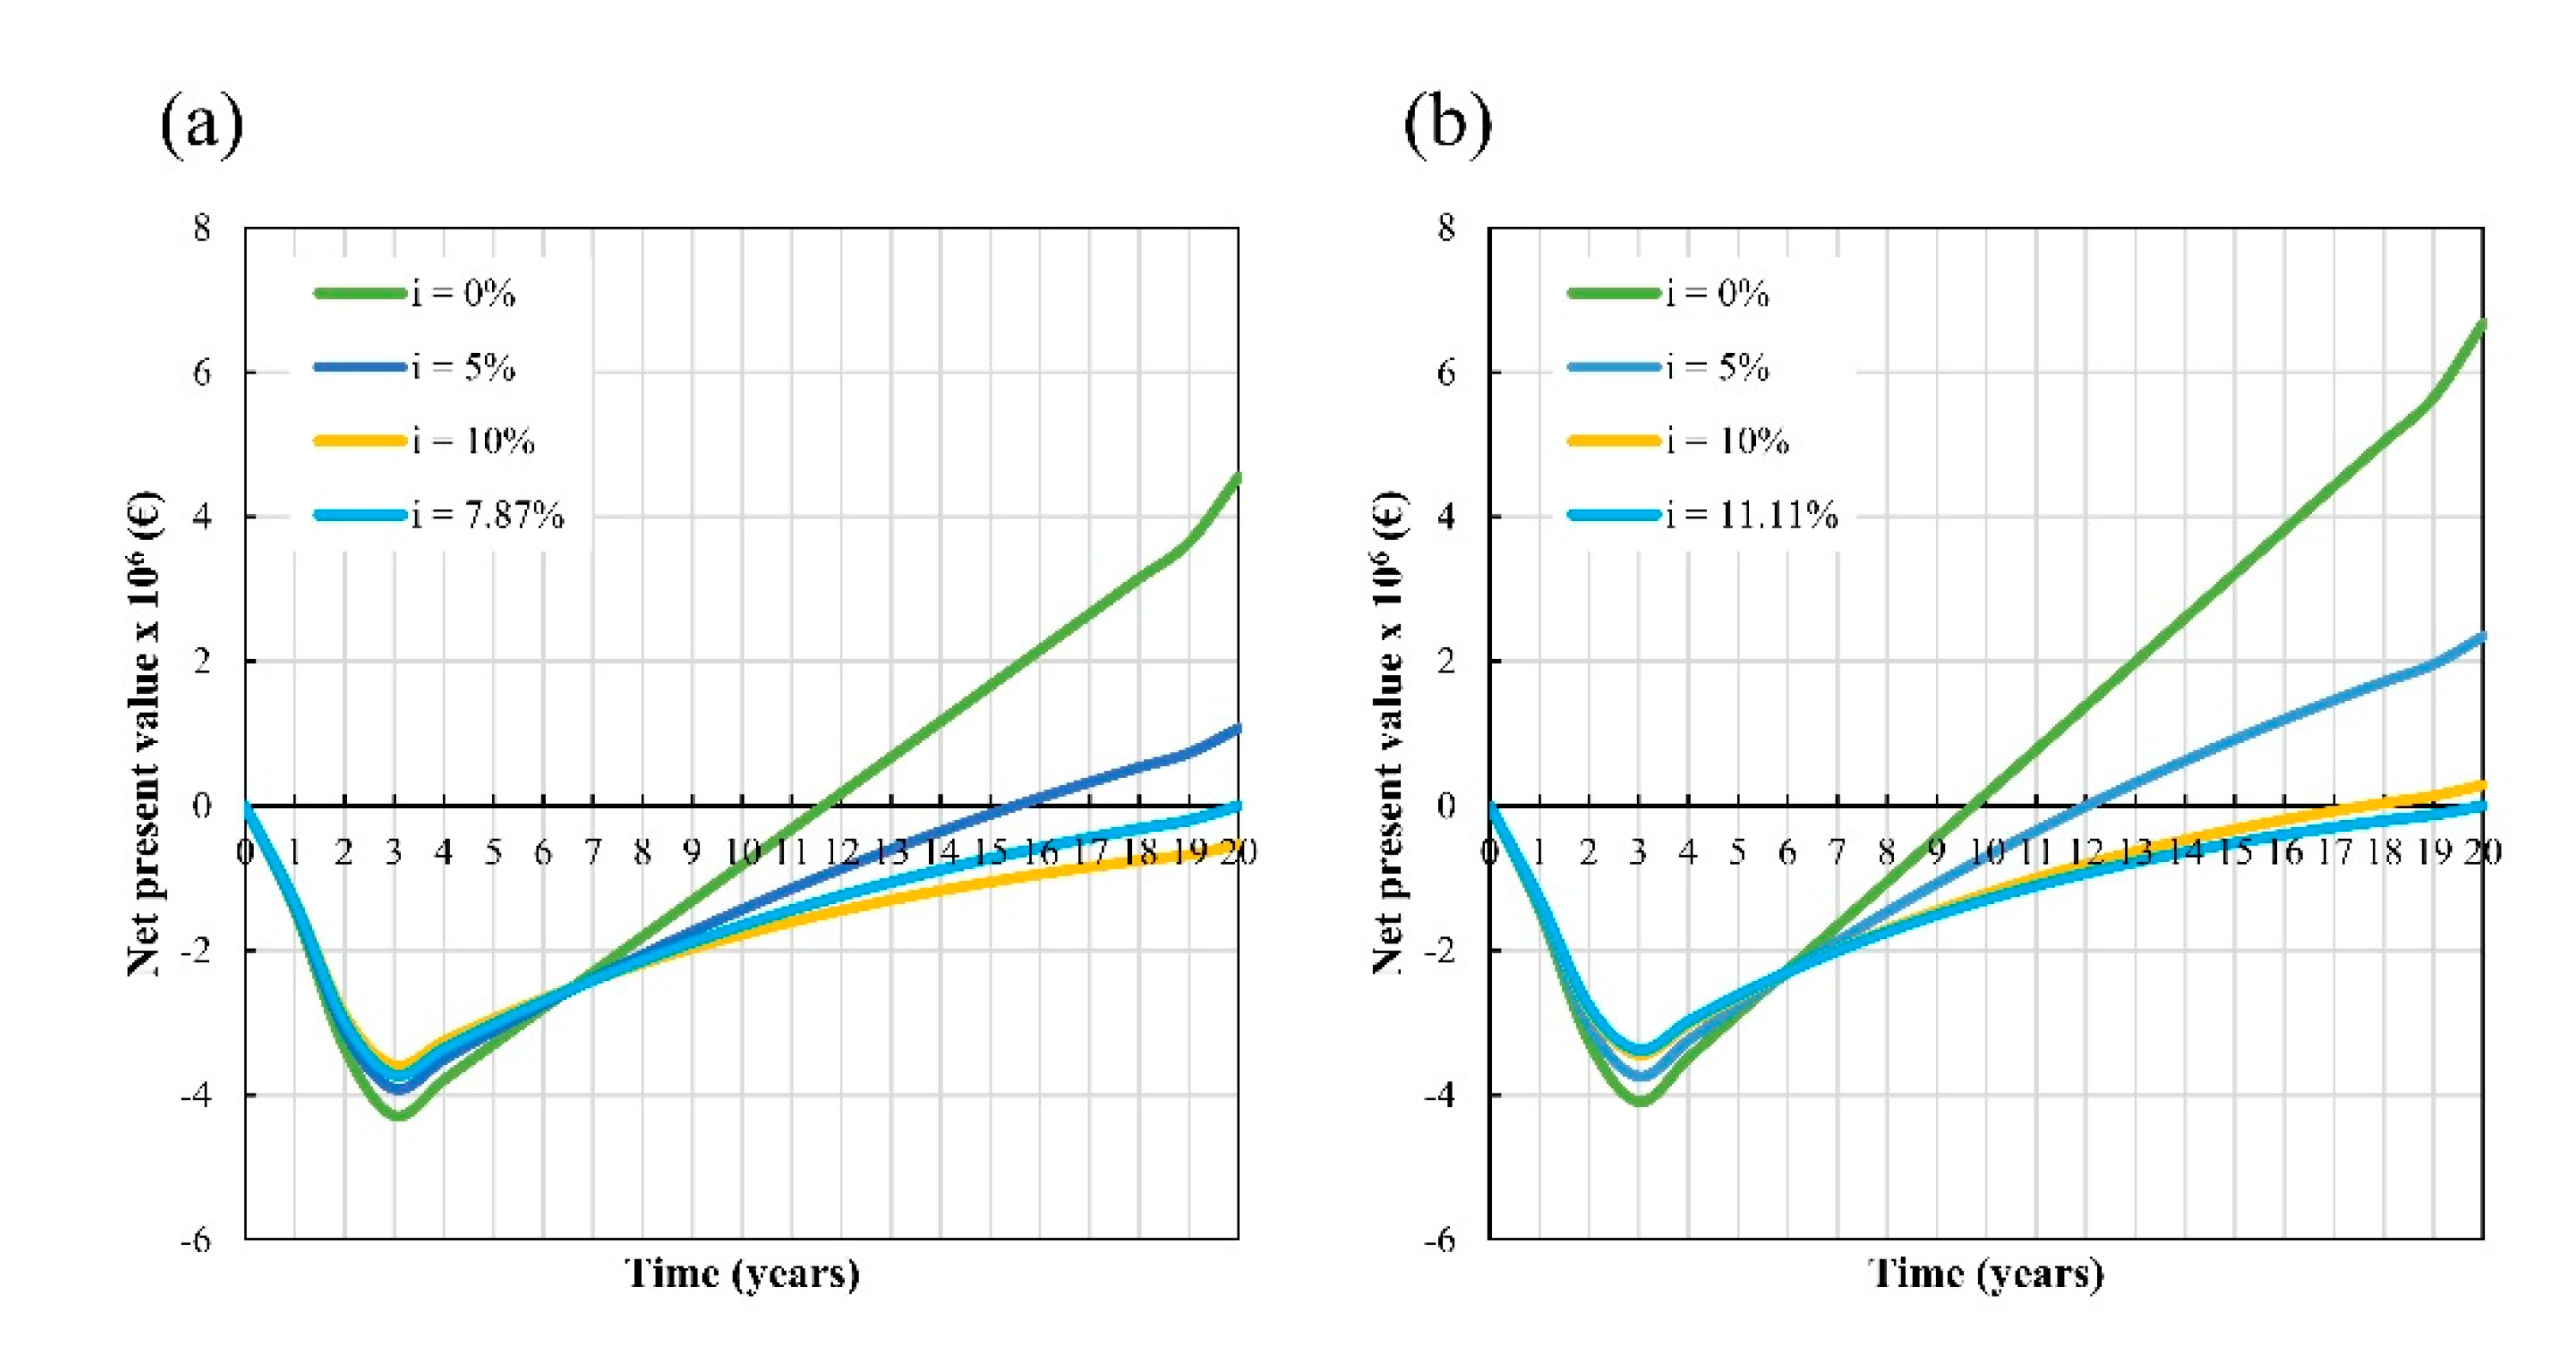
3.2.3. Profitability Analysis

Table 4 summarizes the profitability analysis for each simulation scenario. The profitability analysis is mainly affected by the cost of raw materials. As shown in Table 4, in the base case, the manufacturing cost (4.07 EUR/kg) was higher than the set selling price of SA (2.93 EUR/kg for bio-based, 2.50 EUR/kg for fossil-based, Table 2). Therefore, all the profitability indicators were negative, and PBP cannot be suggested, resulting in a negative NPV at a 10% rate of discount.
When glucose is replaced with candy waste, the cost of manufacturing is significantly reduced compared to that of the base case (2.57 EUR/kg, Table 4—alternative 1). In that case, however, the NPV was calculated to be EUR -0.60 MM when the discount rate was set to 10%. As shown in Figure 3a, the IRR was only 7.87. Although, the net profit can be obtained using candy waste when the discount rate is set to 10%.
In some TEC studies producing bio-SA using residual resources, it has been reported that the minimum selling prices (MSPs) exceeded the market price (2.93 EUR/kg). In the case of using the wine waste streams, the MSP was 4.42 EUR/kg, which is well above the market price [37]. Since the pretreatment process, which separated ethanol from the liquid feedstock, extracted sugar, and then performed enzyme hydrolysis on the solid feedstock, which must be added before fermentation, the MSP of the process using waste has been found to increase. The authors suggested that the MSP of SA can be reduced by selling grape seed oil, crude phenolic extract, calcium tartrate, and crude tannin extract, which were by-products produced in each pretreatment process.
Other processes also sought to reduce the MSP of SA through the sale of co-products. When using the organic fraction of municipal solid waste (OFMSW) as a feedstock to produce SA, it was reported that MSPs below the market price could be obtained when lipids/fats and proteins extracted from OFMSW were used as co-products [47].
When using biogas as a CO2 source, an increase in the manufacturing cost was observed. However, more income from selling biomethane and the credit for reducing CO2 emissions resulted in a positive NPV (EUR 0.32 MM). IRR increased to 11.11 (Figure 3b) and PBP also decreased to 8.56 years. The gross profit and net profit increased up to EUR 0.47 and EUR 0.61 MM, respectively. Since the process proposed in this study is not a full-scale process, the biomethane throughput was not large enough.

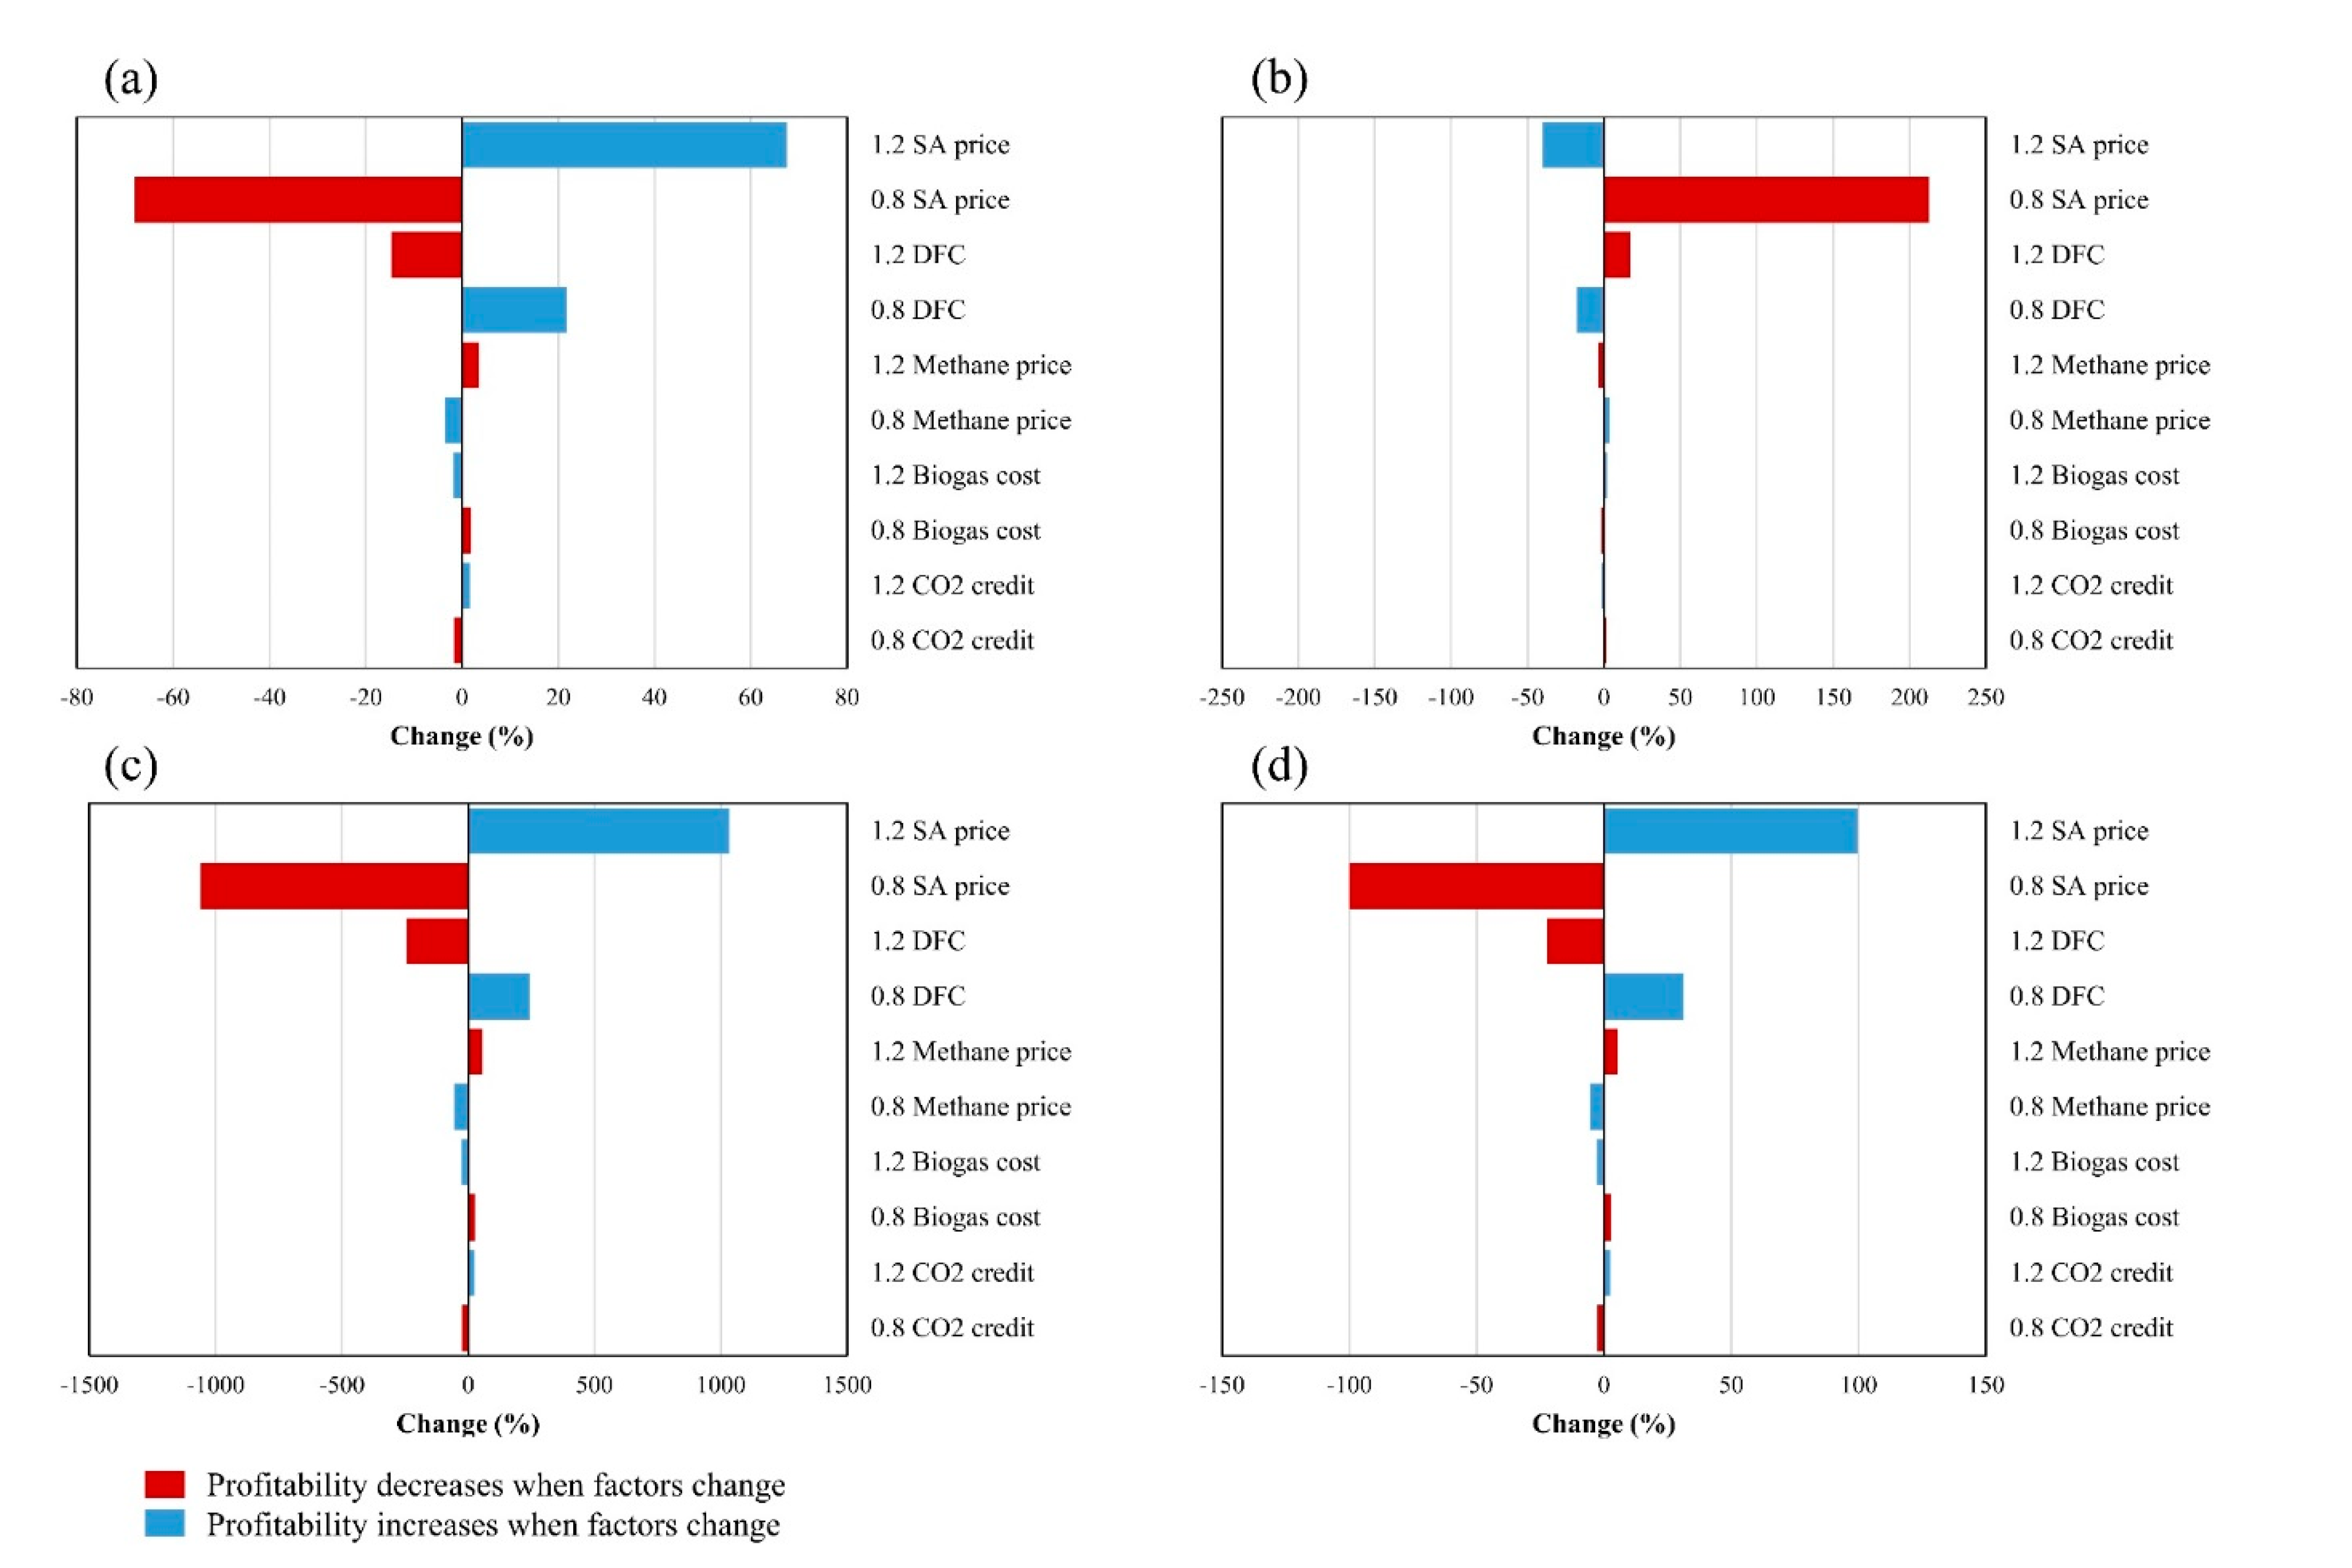
3.2.4. Sensitivity Analysis

A sensitivity analysis was performed by varying the following parameters: the SA selling price, CO2 emission credit, and the biomethane selling price (Figure 4). The SA selling price, DFC, biomethane selling price, biogas purchasing price, and CO2 emission credit were influential in that order. Klein et al. [5] reported in the profitability analysis of the process to produce SA using pentose by integrating it into sugarcane biorefinery, suggesting 2.26 EUR/kg as a minimum selling price of SA. In process design alternative 2, when reducing the SA price to 2.34 EUR/kg (−20%), the NPV decreased to a minus value (EUR −0.31 MM, Figure 4c). IRR and ROI decreased significantly (Figure 4a,d) and the PBP increased by 212% (Figure 4b). On the other hand, an increase of 20% (3.52 EUR/kg) in the selling price resulted in an increase of up to EUR 0.36 MM in the NPV. The ROI and IRR increased by 67% and 99%, respectively (Figure 4a,d). The PBP decreased to 5.11 years. This result shows that it cannot profit from lower SA prices. Thus, the selling price of SA established in this case was close to MSP, since SA is an important chemical intermediate in the production of various chemicals; however, it is predicted that demand and price will steadily increase in the future [48]. The NPV only increased to EUR 0.49 MM by increasing the selling price of biomethane to 0.85 EUR/Nm3 (Figure 4c). This result shows that the sales of SA were a major rate-generation factor in this process and that the sales of biomethane were a secondary factor.
DFC was the second-most influential factor in profitability. NPV decreased to a minus value (EUR −0.46 MM) when DFC increased by 20%. But it still showed a positive value (EUR 0.13 MM) when DFC increased by 5%.
An increase in the purchase cost of biogas did not significantly affect the profitability of the process, provided it did not exceed the selling price of biomethane. As a biogas upgrading system, process design alternative 2 could contribute toward reducing CO2 emissions. The Danish government has announced that it will impose an emission tax of DKK 750 (about EUR 100) per ton of CO2 [31]. Therefore, a credit equivalent to the reduced CO2 emission was imposed on this process. Given the serious awareness of climate change and the goal of zero carbon emissions, the credit for reducing CO2 emissions is unlikely to diminish in the future. When CO2 credits increased by 20%, the NPV of the process corresponded to EUR 0.40 MM, which is an increase of over 20% (Figure 4c). This result shows the importance of national support for the biochemical industry.

4. Conclusions

As with any other fermentation process, the SA production process also has feedstock challenges. Through a techno-economic analysis, it was shown that the process could not be profitable using glucose, but it could create a profit using candy waste when the biogas was supplied as a CO2 source. Replacing the CO2 supply with biogas could bring additional benefits. The CO2 emission tax can be expected to have a positive impact on the development of this emerging technology. The total capital investment and the total production costs for a facility producing 1000 tSA/year were estimated to be 5,211,000 and 2,339,000 EUR/year, respectively. The total revenue was calculated to be 2,811,000 EUR/year, while the revenue due to the produced biomethane, namely, 198,150 Nm3, corresponded to 205,284 EUR/year. The return on investment, payback period, and internal rate of return of the project were found to be 11.68%, 8.56 years, and 11.11%, respectively. The sensitivity analysis revealed that the profitability is strongly affected by the SA price. Throughout this study, it was concluded that substrate replacement could not lead to victory in price competitions with fossil-based SA, but it was confirmed that the SA production process proposed in this study could bring profitability.

Supplementary Materials

The following supporting information can be downloaded at: https://www.mdpi.com/article/10.3390/en16073227/s1, Table S1. Equipment specification and cost. Table S2. Purchase cost of raw materials and annual utilization of each case. Table S3. Deterministic price of utility, consumable, wastewater treatment, and annual utilization of each case. Refs [49,50,51] are cited in Supplementary Materials.

Author Contributions

Conceptualization, P.T.; Methodology, M.A.-M.; Software, H.K. and B.-I.S.; Validation, H.K. and M.A.-M.; Formal analysis, B.-I.S.; Investigation, P.T.; Resources, I.A. and M.A.-M.; Data curation, H.K.; Writing—original draft, H.K.; Writing—review & editing, B.-I.S., P.T., I.A. and M.A.-M.; Visualization, P.T.; Supervision, B.-I.S., M.A.-M. and P.T.; Project administration, M.A.-M. All authors have read and agreed to the published version of the manuscript.

Funding

This project has received funding from the European Union’s Horizon 2020 Research and Innovation Program Neosuccess under the grant agreement No. (950921) and by the National Research Foundation of Korea (NRF) grant funded by the Korean government (MSIT) (No.202200000002117) and the Korea Environment Industry and Technology Institute (KEITI) through the development of demonstration technology for energy conversion using waste resources program, funded by Korea Ministry of Environment (MOE) (RE202201941).

Data Availability Statement

The data presented in this study are available on request from the corresponding author.

Conflicts of Interest

The authors declare no conflict of interest.

Abbreviations

SAsuccinic acid
NPVnet present value
IRRinternal rate of return
PBPpayback period
ROIreturn on investment
DFCdirect fixed capital
TCItotal capital investment
MSPminimum selling prices

References

  1. Mancini, E.; Mansouri, S.S.; Gernaey, K.V.; Luo, J.; Pinelo, M. From second generation feed-stocks to innovative fermentation and downstream techniques for succinic acid production. Crit. Rev. Environ. Sci. Technol. 2020, 50, 1829–1873. [Google Scholar] [CrossRef]
  2. Bio-Succinic Acid Market Size, Share & Trends Analysis Report by Application. Available online: https://www.grandviewresearch.com/industry-analysis/bio-succinic-acid-market (accessed on 10 March 2023).
  3. Succinic Acid Market Size, Share & Trends Analysis Report by Type. Available online: https://www.grandviewresearch.com/industry-analysis/succinic-acid-market (accessed on 10 March 2023).
  4. Stylianou, E.; Pateraki, C.; Ladakis, D.; Cruz-Fernández, M.; Latorre-Sánchez, M.; Coll, C.; Koutinas, A. Evaluation of organic fractions of municipal solid waste as renewable feedstock for succinic acid production. Biotechnol. Biofuels 2020, 13, 1–16. [Google Scholar] [CrossRef] [PubMed] [Green Version]
  5. Klein, B.C.; Silva, J.F.; Junqueira, T.L.; Rabelo, S.C.; Arruda, P.V.; Ienczak, J.L.; Mantelatto, P.E.; Pradella, J.G.C.; Junior, S.V.; Bonomi, A. Process development and techno-economic analysis of bio-based succinic acid derived from pentoses integrated to a sugarcane biorefinery. Biofuels Bioprod. Biorefining 2017, 11, 1051–1064. [Google Scholar] [CrossRef]
  6. Sardon, H.; Mecerreyes, D.; Basterretxea, A.; Averous, L.; Jehanno, C. From lab to market: Current strategies for the production of biobased polyols. ACS Sustain. Chem. Eng. 2021, 9, 10664–10677. [Google Scholar] [CrossRef]
  7. Gadkari, S.; Kumar, D.; Qin, Z.H.; Lin CS, K.; Kumar, V. Life cycle analysis of fermentative production of succinic acid from bread waste. Waste Manag. 2021, 126, 861–871. [Google Scholar] [CrossRef]
  8. Okoro, O.V.; Shavandi, A. An assessment of the utilization of waste apple slurry in bio-succinic acid and bioenergy production. Int. J. Environ. Sci. Technol. 2022, 19, 1323–1334. [Google Scholar] [CrossRef]
  9. Ghayur, A.; Verheyen, T.V.; Meuleman, E. Techno-economic analysis of a succinic acid biorefinery coproducing acetic acid and dimethyl ether. J. Clean. Prod. 2019, 230, 1165–1175. [Google Scholar] [CrossRef]
  10. Stylianou, E.; Pateraki, C.; Ladakis, D.; Vlysidis, A.; Koutinas, A. Optimization of fermentation medium for succinic acid production using Basfia succiniciproducens. Environ. Technol. Innov. 2021, 24, 101914. [Google Scholar] [CrossRef]
  11. Lawson, N.; Alvarado-Morales, M.; Tsapekos, P.; Angelidaki, I. Techno-economic assessment of biological biogas upgrading based on danish biogas plants. Energies 2021, 14, 8252. [Google Scholar] [CrossRef]
  12. Gunnarsson, I.l.B.; Alvarado-Morales, M.; Angelidaki, I. Utilization of CO2 fixating bacterium Actinobacillus succinogenes 130Z for simultaneous biogas upgrading and biosuccinic acid production. Environ. Sci. Technol. 2014, 48, 12464–12468. [Google Scholar] [CrossRef] [Green Version]
  13. EBA Biogas Trends for This Year. Available online: https://www.europeanbiogas.eu/biogas-trends-for-this-year/ (accessed on 23 December 2022).
  14. Saxena, R.K.; Saran, S.; Isar, J.; Kaushik, R. Production and applications of succinic acid. In Current Developments in Biotechnology and Bioengineering; Elsevier: Amsterdam, The Netherlands, 2017; pp. 601–630. [Google Scholar]
  15. Neosuccess Project. Available online: https://neosuccess-project.eu/ (accessed on 10 March 2023).
  16. Vigato, F.; Angelidaki, I.; Woodley, J.M.; Alvarado-Morales, M. Dissolved CO2 profile in bio-succinic acid production from sugars-rich industrial waste. Biochem. Eng. J. 2022, 187, 108602. [Google Scholar] [CrossRef]
  17. Athimulam, A.; Kumaresan, S.; Foo, D.C.Y.; Sarmidi, M.R.; Aziz, R.A. Modelling and optimization of Eurycoma longifolia water extract production. Food Bioprod. Process. 2006, 84, 139–149. [Google Scholar] [CrossRef] [Green Version]
  18. Ernst, S.; Garro, O.A.; Winkler, S.; Venkataraman, G.; Langer, R.; Cooney, C.L.; Sasisekharan, R. Process simulation for recombinant protein production: Cost estimation and sensitivity analysis for heparinase I expressed in Escherichia coli. Biotechnol. Bioeng. 1997, 53, 575–582. [Google Scholar] [CrossRef]
  19. Villadsen, J. Kinetics of Bio-Reactions. In Fundamental Bioengineering; John Wiley & Sons: Hoboken, NJ, USA, 2015; pp. 183–232. [Google Scholar]
  20. Dickson, R.; Mancini, E.; Garg, N.; Woodley, J.M.; Gernaey, K.V.; Pinelo, M.; Liu, J.; Mansouri, S.S. Sustainable bio-succinic acid production: Superstructure optimization, techno-economic, and lifecycle assessment. Energy Environ. Sci. 2021, 14, 3542–3558. [Google Scholar] [CrossRef]
  21. Karp, E.M.; Cywar, R.M.; Manker, L.P.; Saboe, P.O.; Nimlos, C.T.; Salvachúa, D.; Wang, X.; Black, B.A.; Reed, M.L.; Michener, W.E.; et al. Post-Fermentation Recovery of Biobased Carboxylic Acids. ACS Sustain. Chem. Eng. 2018, 6, 15273–15283. [Google Scholar] [CrossRef]
  22. Denmark Corporate Tax Rate|1981–2019 Data|2020–2021. Forecast|Historical|Chart. Available online: https://tradingeconomics.com/denmark/corporate-tax-rate (accessed on 25 August 2022).
  23. Inflation in Denmark. Available online: https://www.focus-economics.com/country-indicator/denmark/inflation (accessed on 23 December 2022).
  24. Chemanalyst. Available online: https://www.chemanalyst.com (accessed on 23 December 2022).
  25. IMarc. Available online: https://www.imarcgroup.com (accessed on 23 December 2022).
  26. GlobeNewswire. Available online: https://www.globenewswire.com (accessed on 23 December 2022).
  27. Simga-Aldrich. Available online: https://www.sigmaaldrich.com/DK/en/product/sial/573663 (accessed on 23 December 2022).
  28. Alibaba. Available online: https://www.alibaba.com/product-detail/High-Quality-Poly-4-vinylpyridine-CAS_10000008171334.html (accessed on 23 December 2022).
  29. Ioannidou, S.M.; Pateraki, C.; Ladakis, D.; Papapostolou, H.; Tsakona, M.; Vlysidis, A.; Kookos, I.K.; Koutinas, A. Sustainable production of bio-based chemicals and polymers via integrated biomass refining and bioprocessing in a circular bioeconomy context. Bioresour. Technol. 2020, 307, 123093. [Google Scholar] [CrossRef]
  30. IEA. Outlook for Biogas and Biomethane: Prospects for Organic Growth; International Energy Agency: Paris, France, 2020. [Google Scholar]
  31. PwC. Rapport: Forslag Til Beskatning af Udledning af CO2. 2022. Available online: https://www.pwc.dk/da/services/2022/gron-omstilling-1-delrapport.pdf (accessed on 30 August 2022).
  32. Lin, S.K.C.; Du, C.; Blaga, A.C.; Camarut, M.; Webb, C.; Stevens, C.V.; Soetaert, W. Novel resin-based vacuum distillation-crystallisation method for recovery of succinic acid crystals from fermentation broths. Green Chem. 2010, 12, 666–671. [Google Scholar] [CrossRef]
  33. Chanda, M.; O’Driscoll, K.F.; Rempel, G.L. Rempel, Sorption of phenolics and carboxylic acids on polybenzimidazole. React. Polym. Ion Exch. Sorbents 1985, 4, 39–48. [Google Scholar] [CrossRef]
  34. Towler, G.; Sinnott, R. Chemical Engineering Design Principles, Practice and Economics of Plant and Process Design; Butterworth-Heinemann: Oxford, UK, 2008. [Google Scholar]
  35. Peters, M.S.; Timmerhaus, K.; West, R. Plant Design and Economics for Chemical Engineers; McGraw-Hill Education: New York, NY, USA, 2003. [Google Scholar]
  36. Kim, H.; Choi, O.; Jeon, B.S.; Choe, W.S.; Sang, B.I. Impact of feedstocks and downstream processing technologies on the economics of caproic acid production in fermentation by Megasphaera elsdenii T81. Bioresour. Technol. 2020, 301, 122794. [Google Scholar] [CrossRef]
  37. Ioannidou, S.M.; Filippi, K.; Kookos, I.K.; Koutinas, A.; Ladakis, D. Techno-economic evaluation and life cycle assessment of a biorefinery using winery waste streams for the production of succinic acid and value-added co-products. Bioresour. Technol. 2022, 348, 126295. [Google Scholar] [CrossRef]
  38. Efe, Ç.; van der Wielen, L.A.M.; Straathof, A.J.J. Techno-economic analysis of succinic acid production using adsorption from fermentation medium. Biomass Bioenergy 2013, 56, 479–492. [Google Scholar] [CrossRef]
  39. Taylor, R.; Nattrass, L.; Alberts, G.; Robson, P.; Chudziak, C.; Bauen, A.; Libelli, I.M.; Lotti, G.; Prussi, M.; Nistri, R.; et al. From the Sugar Platform to Biofuels and Biochemicals: Final Report for the European Commission Directorate-General Energy; E4tech/Re-CORD/Wageningen UR: London, UK, 2015. [Google Scholar]
  40. Jansen, M.L.; van Gulik, W.M. Towards large scale fermentative production of succinic acid. Curr. Opin. Biotechnol. 2014, 30, 190–197. [Google Scholar] [CrossRef] [PubMed]
  41. Nghiem, N.P.; Kleff, S.; Schwegmann, S. Succinic acid: Technology development and commercialization. Fermentation 2017, 3, 26. [Google Scholar] [CrossRef]
  42. Ferone, M.; Raganati, F.; Olivieri, G.; Marzocchella, A. Bioreactors for succinic acid production processes. Crit. Rev. Biotechnol. 2019, 39, 571–586. [Google Scholar] [CrossRef] [PubMed]
  43. Pateraki, C.; Patsalou, M.; Vlysidis, A.; Kopsahelis, N.; Webb, C.; Koutinas, A.A.; Koutinas, M. Actinobacillus succinogenes: Advances on succinic acid production and prospects for development of integrated biorefineries. Biochem. Eng. J. 2016, 112, 285–303. [Google Scholar] [CrossRef]
  44. BASF. Succinity Produces First Commercial Quantities of Biobased Succinic Acid. Available online: http://news.bio-based.eu/succinity-produces-first-commercial-quantities-biobased-succinic-acid/ (accessed on 23 December 2022).
  45. Hafyan, R.H.; Bhullar, L.; Putra, Z.A.; Bilad, M.R.; Wirzal, M.D.H.; Nordin, N.A.H.M. Sustainability assessment of levulinic acid and succinic acid production from empty fruit bunch. In IOP Conference Series: Materials Science and Engineering; IOP Publishing: Bristol, UK, 2020. [Google Scholar]
  46. Baroi, G.N.; Gavala, H.N.; Westermann, P.; Skiadas, I.V. Fermentative production of butyric acid from wheat straw: Economic evaluation. Ind. Crops Prod. 2017, 104, 68–80. [Google Scholar] [CrossRef] [Green Version]
  47. Ladakis, D.; Stylianou, E.; Ioannidou, S.M.; Koutinas, A.; Pateraki, C. Biorefinery development, techno-economic evaluation and environmental impact analysis for the conversion of the organic fraction of municipal solid waste into succinic acid and value-added fractions. Bioresour. Technol. 2022, 354, 127172. [Google Scholar] [CrossRef]
  48. Cheng, K.K.; Zhao, X.B.; Zeng, J.; Zhang, J.A. Biotechnological production of succinic acid: Current state and perspectives. Biofuels Bioprod. Biorefining 2012, 6, 302–318. [Google Scholar] [CrossRef]
  49. Independent Chemical Information Service. Available online: https://www.icis.com/chemicals (accessed on 23 December 2022).
  50. Energy Information Administration. Available online: https://www.epa.gov/ghgemissions/sources-greenhouse-gas-emissions (accessed on 23 December 2022).
  51. Turton, R.; Bailie, R.C.; Whiting, W.B.; Shaeiwitz, J.A. Analysis, Synthesis and Design of Chemical Processes. Pearson Education: New York, NY, USA, 2008. [Google Scholar]
Figure 1. Process flowsheet of the succinic acid fermentation plant. Unit procedures included in the fermentation section are marked in red, and unit procedures included in the purification section are marked in black. Biogas and candy waste feeds are shown in green, and methane and succinic acid products in blue. The color of the lines matched the unit procedures, but the candy waste feed line was shown in black bold for emphasis.
Energies 16 03227 g001
Figure 2. Annual manufacturing cost composition for each process design flowsheet.
Energies 16 03227 g002
Figure 3. Cumulative cash flow diagrams at different discount rates for (a) process design 1 and (b) process design 2.
Energies 16 03227 g003
Figure 4. Sensitivity analysis tornado plots of (a) return on investment, (b) payback period, (c) net present value, and (d) internal rate of return.
Energies 16 03227 g004
Table 1. Summary of the plant’s characteristics—base-case design.
ItemAssumption
Plant locationDenmark
Capacity1.0 kt per year
Operative2022
Raw materialGlucose
FermentationAnaerobic fermentation (24 h batch)
MicroorganismActinobacillus succinogenes 130Z
Downstream recoveryIon exchange and crystallization
Plant lifetime20 years
Construction period1 year
Discount rate10%
Income tax22%
Inflation rate8%
DepreciationStraight line, 5%/year
Table 2. Values used in the techno-economic analysis.
Raw MaterialsUnitsPurchasing PriceReferences
GlucoseEUR/kg1.089[20]
CO2EUR/kg0.033[20]
BiogasEUR/kg0.172[11]
AmmoniaEUR/kg0.140[24]
Calcium chlorideEUR/kg0.160[25]
Magnesium chlorideEUR/kg0.077[24]
MethanolEUR/kg0.168[24]
Potassium phosphate dibasicEUR/kg1.473[25]
Sodium chlorideEUR/kg0.154[25]
Sulfuric acidEUR/kg0.049[25]
Yeast extractEUR/kg1.611[26]
ConsumablesUnitsPurchasing priceReferences
Activated carbonEUR/kg2.800SuperPro DB
DOWEX G-26EUR/kg56.820[27]
Poly(4-vinylpyridine) (PVP)EUR/kg600.000[28]
ProductsUnitsSelling priceReferences
Bio-based succinic acidEUR/kg2.930[29]
Succinic acidEUR/kg2.500[4]
MethaneEUR/kg0.993[30]
BenefitUnitTaxReferences
CO2 emission taxEUR/kg0.111[31]
Table 3. Capital investment estimate summary.
Cost ItemsEstimation MethodsCosts (×103 EUR)
Base CaseAlternative 1Alternative 2
Equipment purchase cost (PC) 165617061706
Direct cost (DC)PC + A + B + C + D + E + F + G + H364737543754
    Installation (A) 617632632
    Piping (B)0.16 × PC265273273
    Instrumentation (C)0.10 × PC166121171
    Insulation (D)0.03 × PC505151
    Electrical facilities (E)0.10 × PC166171171
    Buildings (F)0.13 × PC215222222
    Yard improvement (G)0.09 × PC149154154
    Auxiliary facilities (H)0.22 × PC364375375
Indirect cost (IC)I + J401413413
    Engineering (I)0.06 × DC219225225
    Construction (J)0.05 × DC182188188
Other costs (OC)K + L607625625
    Contractor’s fee (K)0.05 × (DC + IC)202208208
    Contingency (L)0.10 × (DC + IC)405417417
Direct fixed capital (DFC)DC + IC + OC465647924792
    Working capital (M)Estimated to cover 30 days expense297175180
    Startup cost (N)0.05 × DFC233240240
Total investment DFC + M + N518552065211
Investment charged to the project 518552065211
Table 4. Techno-economic indicator representing process profitability.
Indicators UnitsBase CaseProcess Design Alternative 1Process Design Alternative 2
Cost of manufactureEUR/kg4.072.572.64
Total capital investmentEUR MM 5.195.215.21
Net present valueEUR MM −10.83−0.600.32
Internal rate of return%-7.8711.11
Payback periodyears-10.498.56
Gross profitEUR MM −1.010.330.47
Net profitEUR MM −0.770.500.61
Disclaimer/Publisher’s Note: The statements, opinions and data contained in all publications are solely those of the individual author(s) and contributor(s) and not of MDPI and/or the editor(s). MDPI and/or the editor(s) disclaim responsibility for any injury to people or property resulting from any ideas, methods, instructions or products referred to in the content.

