1. Introduction
The shift to electric vehicles (EVs) is seen as an effective means to reduce the greenhouse gas emissions of road vehicles. The development of EVs is an essential instrument in the European Energy Roadmap 2050, which prescribes a 80–95% reduction of GHG emissions by 2050, with reference to the levels of 1990 [
1]. The European Union has promulgated measures towards sustainable and intelligent transportation, aiming to achieve 90% CO
2 reduction by 2050. China, Korea and USA, have also adopted similar GHG reduction plans [
2]. The rapid electrification of the worldwide car fleet requires a widely dispersed network of charging stations and a growing appetite for charging power. Das et al. [
3] reviewed the standards associated with grid integration of EVs. They also proceeded with an evaluation of EV charging infrastructure. The stochastic patterns of charging behaviours cause an increasing burden to the electricity grid, thereby causing unprecedented fluctuations of the load curve. The upcoming difficulties and increasing costs associated with electricity production will require a rapid development of smart grids and city networks. An important strategy in this respect is the design and incentivisation of smart micro-grids established in nearly zero-energy buildings (nZEB). Such micro-grids may be self-sufficient to a significant extent, optimally controlling their electricity transactions with the grid to add to its stability and resilience. The nZEB is a building with high energy performance. Moreover, the small amounts of energy required per m
2 are mainly covered by renewable sources. These are mostly produced on-site [
4]. According to the EU standards, an nZEB building requires only 20–30 kWh/m
2 y net primary energy from the network [
5]. They combine a very good shell insulation with smart features controlled by the building’s management system. Space heating and cooling is usually implemented by efficient heat pumps. On-site electricity production is usually attained by efficient rooftop PV panels. Article 9 of the Energy Performance of Buildings Directive 2010/31/EU (EPBD) [
6] now requires all new buildings to be nZEBs. Despite significant overall progress, wide differences can be observed in this article’s implementation across member states [
7]. This type of building is usually based on a sizable rooftop PV installation and reduced-size heating, ventilation and air conditioning (HVAC) equipment. This is made possible by the high insulation and shading measures of the building shell and the use of high-efficiency, ground or dual-source heat pumps [
8]. This mode of energy system design may leave large amounts of PV electricity available for dispatch to a smart grid to cover other electricity needs inside or outside of the building. Several research works have studied frameworks suitable for bilevel optimization for commercial buildings integrated in a smart distribution grid. These studies are supported by measurements and simulations of buildings and the underlying distribution grid. This takes into account operational constraints and mutual information exchange [
9]. On the other hand, the high variability of PV electricity and its concentration during the daytime only require a significant amount of electricity storage capacity for optimal dispatch. In the case of commercial, industrial, governmental and office buildings, this capacity can be provided by the aggregate storage of the employees’ electric vehicles, which connect to the smart grid during working hours for charging and, if allowed, for discharging. This opportunity for electricity storage is becoming increasingly available thanks to the rapid increase in numbers of EVs. EV charging infrastructure should combine fast motorway chargers with slow home chargers [
10] or chargers installed in the parking spaces of commercial buildings [
11]. The increasing power demand for charging and its stochastic nature result in power fluctuations. Keeping grid stability and the balance of supply and demand increases ancillary power requirements. A certain degree of demand-side management becomes necessary. Proper power system operation strategies are necessary to match the increased renewables in the system and make the power peaks induced by charging sustainable. Wu et al. [
12] reviewed innovative solutions with EV charging stations, with added insight into power system design architectures. They also examined energy storage and optimal control strategies in micro-grids. They focused on the hierarchical control with decoupled control objectives in different microgrid layers. Grid-efficient charging is critical to the success of EVs’ integration. New and oncoming legislation tends to charge higher prices to EV owners for unconditional charging [
13]. Engel et al. estimated a 30% local peak load increase and a steeper evening ramp in a residential feeder circuit of 150 homes [
14]. Optimal PV generation and EV load-matching would further relax such effects. Fachrizal [
15] applied load-matching to optimize PV–EV sizing for PV powered chargers. Casella et al. [
16] compared optimization models for PV charging–EV integration. They aimed for optimal sizing and positioning of charging stations and the optimal scheduling of EVs in smart grids, exploiting vehicle-to-grid (V2G) capabilities. Office buildings designed or retrofitted as nZEBs have been extensively studied in the past [
17,
18,
19]. The integration of an nZEB commercial or office building with EV charging presents a challenging option capable of significantly reducing the EV operating cost per km and better modulating the burden to the grid. However, these electricity sources are not able to support optimal dispatch due to their time slot limitations and stochastic nature. Stable and reliable operation of an EV charging micro-grid requires a robust coordinated controller. This automatically allocates the instantaneous power to maintain system frequency and bus voltage. It responds quickly to load disturbances with the local storage that could be in the form of EV batteries. A local controller can also improve the power quality of an EV charging system by reducing bad harmonics produced during the battery-charging process [
20,
21,
22]. Charging systems can be classified in three main categories: DC micro-grid, AC micro-grid, and hybrid micro-grid [
23].
If the grid becomes overloaded, a micro-grid may support it with resilient power. This type of energy hub can run independently, and is occasionally connected to the main grid [
24,
25]. Advanced micro-grid design is a vivid research area addressing the complex trade-offs between risk tolerance and investment payback [
26]. The first step is the feasibility study for this type of micro-grid [
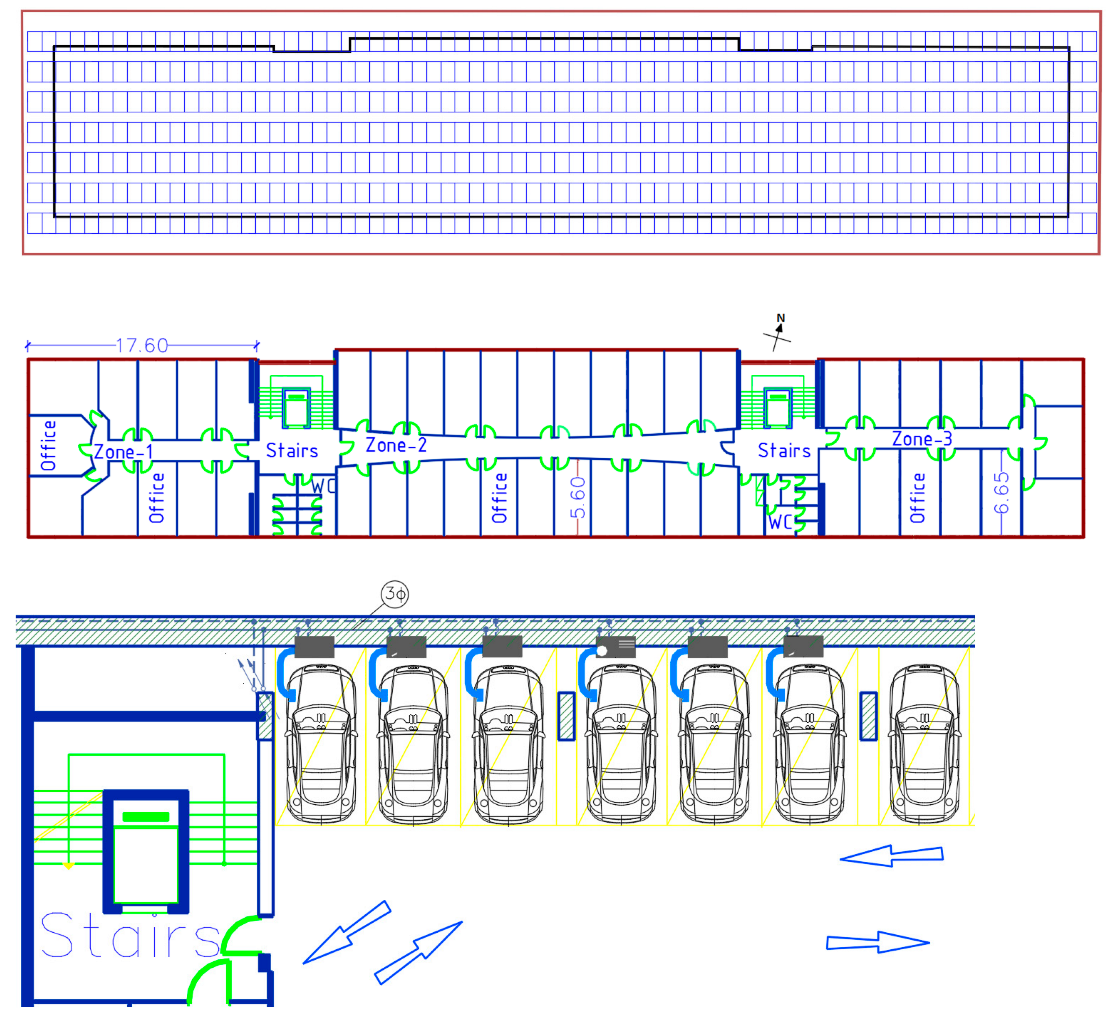
27]. The inherently limited dispatchability of renewable power generation can be increased by introducing a fully controllable electricity source in the form of the internal combustion engine-powered generator. These gensets are always present in the buildings to safeguard emergency electricity supply to several vital services in the building. Currently, these gensets are diesel-powered, and operated only during electricity grid failures. An important step to provide this essential power source to the micro-grid can be taken first by shifting to natural gas for the fuelling of the genset’s engine, and second by optimally sizing the genset based on a system’s operation and control study. The proposed approach is demonstrated here with the example of a smart micro-grid on an nZEB office building (
Figure 1) with a 218 kWp rooftop PV installation, a natural gas-fuelled optimally sized genset and exploitation of an aggregate usable EV storage capacity in the range of 2000 kWh during the day. This preliminary study would assist optimal dispatch of the different power sources to support the building’s autonomy, and export to the grid during the morning and evening ramp of the Greek electricity grid.
This work is structured in four sections.
Section 2 presents a brief overview of the building and HVAC system’s simulation, the rooftop PV modelling and the input data for the transient simulation. The dispatch logic of the different power sources and the modelling of the genset’s and EV batteries’ performance is examined.
Section 3 presents simulation results on a transient, seasonal and annual basis, along with a correlation to the needs of the external network. Finally,
Section 4 presents the conclusions and future work.
2. Materials and Methods
The feasibility and optimal sizing of a micro-grid for the specific nZEB building is studied by building energy simulation. This type of energy simulation study is routinely applied today for optimal component sizing and assessment of the effect of climatic conditions, operating schedules and controls. The TRNSYS environment is capable of reliably modelling the transient performance of complex energy systems [
28]. The TRNSYS simulation engine solves the resulting system of equations stemming from the component models and their interconnections. Its performance against test results for ground-source heat pump simulations is examined in detail in [
29]. The comparative performance of TRNSYS against other standardized building energy simulation software is discussed in [
30]. The structure of the various sub-systems’ models employed in the transient simulations, the building’s details and schedules, and the specific scenarios of availability of the employees’ EVs in the building’s internal grid are briefly discussed in this section.
The sizing of the building’s and energy system’s components is decided as follows. Tthe building is an nZEB design and its HVAC system is supported by a high efficiency, ground-source heat pump. The maximum available rooftop space is allocated to the installation of high-efficiency PV panels (
Figure 1). The average number of electric cars that are connected during weekdays to the building’s charging lots is forty. These belong to employees who agree with bi-directional connection to the micro-grid. The office building (
Figure 1) with a 1340 m
2 trace (84 × 16 m) has four stories with office spaces and meeting rooms, plus a ground floor with a reception space, auditoriums and meeting rooms. Important data on the building’s shell insulation are listed in the
Appendix A. The maximum number of occupants during the weekdays reaches 150, with a normal number of two employees per regular office (
Figure 1). The 18-zone building has a very well-insulated shell, with energy-efficient windows (low-e) and automatic shading devices for the summer. This results in cooling loads that are only a little higher than the heating loads. The total building floor area is 6700 m
2, with 5750 m
2 of conditioned zones. The ceiling height is 3 m in all stories. A total of eighty parking places exist in the basement. Half of them operate as charging lots for EVs, and are equipped with bi-directional chargers [
31]. A total of 525 photovoltaic panels, facing SSW at a 20-degree tilt angle, are installed on the level roof (
Figure 1). Each panel has a 415 Wp nominal output (the technical characteristics are listed in
Appendix A) [
32], resulting in a peak of 218 kW. Climatic data are inserted by means of a typical meteorological year (TMY) for Volos (8760 h). This includes hourly input values of ambient DB temperature, relative humidity, wind direction and speed, and the total/ direct solar horizontal radiation. A water-to-water heat pump (GSHP), (technical data listed in the
Appendix A), exploits a ground network of 80 boreholes, ∅200 mm × 80 m depth. The heat pump’s rated supply is 210 kW for heating at 7 °C, and 195 kW for cooling at 35 °C DB ambient conditions. It feeds a hydronic network with fan coil units inside offices and air-handling units for ventilation of larger spaces. Efficient LED lighting and high-efficiency electrical equipment is adopted. The water–water heat pump is modeled by Type 668 [
33]. The performance of the vertical U-tube ground heat exchanger loop is modeled by Type 557a [
33]. With regard to the PV panels, the De Soto et al. [
34] model is employed to reconstruct the I–V curves by fitting the manufacturer’s data. The consumption of EVs ranges between 130–260 Wh/km depending on speed and ambient temperature. City driving at warm temperatures attains the lowest consumption. The battery charging task for the forty employees’ EVs during the weekdays is completely fulfilled by the charging lots; this corresponds to daily city driving to work, plus an equivalent distance during the rest of the day. This is assumed to be 50 km for 22 working days, with an average consumption of 190 Wh/km (including charging losses). The cars’ consumption during the weekends is fed by charging outside the building’s grid. The total requirement for 40 cars amounts to about 100,000 kWh. The building’s charging lots are equipped with level 2, 7.1 kW, three-phase chargers that can fully charge an 82 kWh battery in 11 h. Accurate estimation of the state of charge, capacity, and power fade behaviour of Li-Ion batteries is a vivid research area [
35]. In this work, a battery model relating battery voltage, current, and state of charge based on Hyman equations is employed [
36]. A constant charging efficiency of 0.9 is assumed for simplicity. Regarding the battery capacity dispatch, the most popular control strategies include load-following, cycle-charging, or combinations thereof [
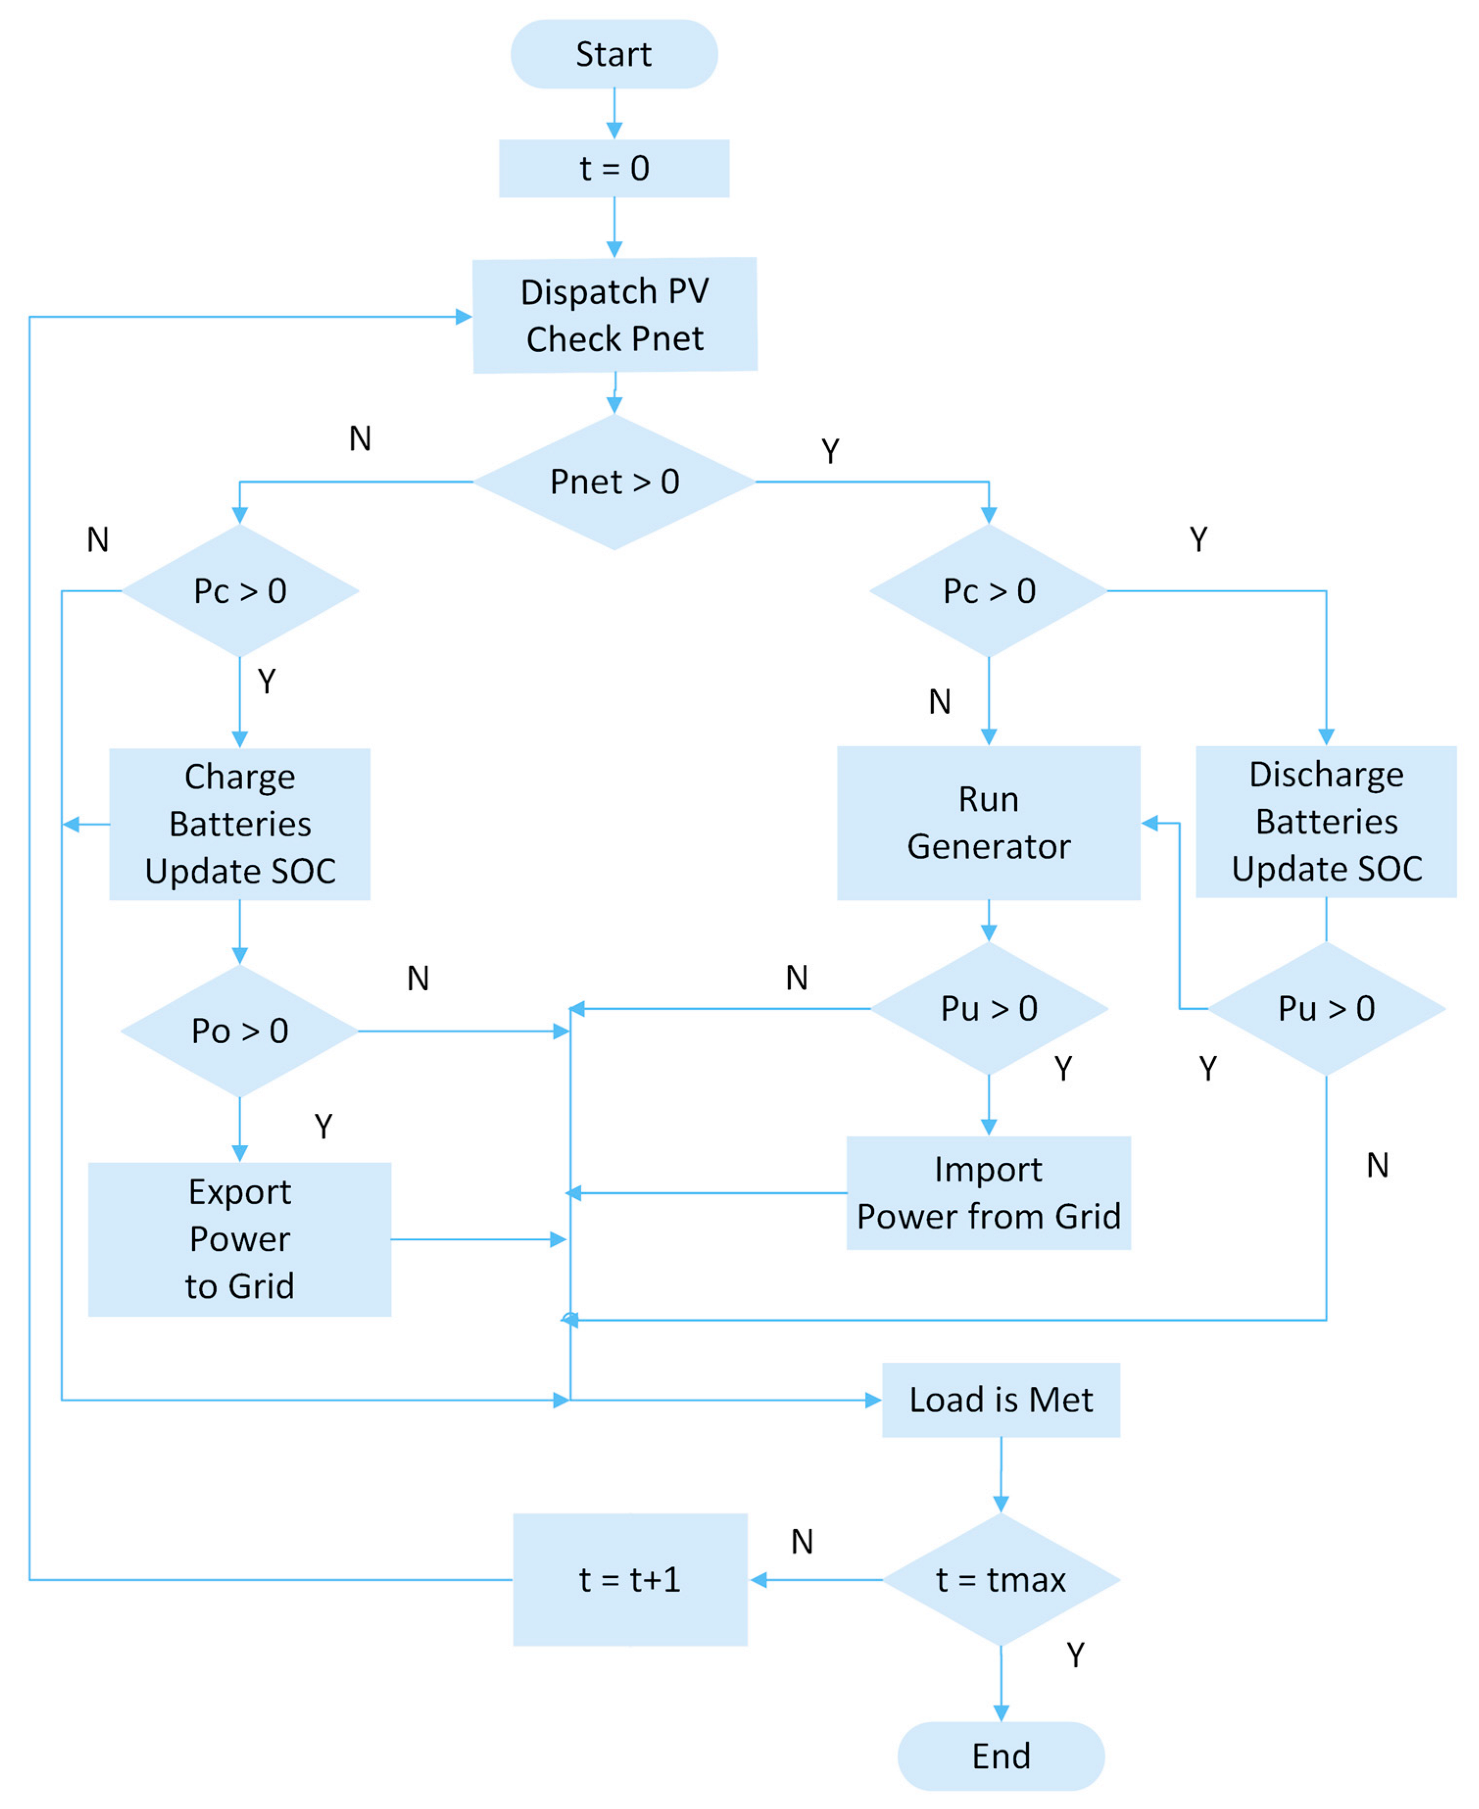
37]. The conventional generator here is the natural gas-powered Genset. The low limit of the battery fractional state of charge is optimized to 0.36, and the charge-to-discharge limit is set to 0.50 at the inverter’s control unit that regulates the PV output. As long as battery
SOC is below 0.50, first priority is given to recharging the battery rather than sending PV output to other buildings’ electrical loads.
Figure 2 presents the dispatch logic and constraints. The available charge (
) and discharge power (
) of the storage depends on its state of charge at a specified time (
). This is defined as the ratio between the remaining capacity at that time (
) to the maximum battery capacity (
) [
38]. The battery discharge power is affected by the C-rate. This is a measure of the power that can be discharged in one hour relative to the maximum capacity and is assumed to be 1-C.
Besides
SOC and C-rate, the max discharge power depends on the minimum
SOC (
) to be maintained:
In these relations,
and
are in percent,
is in kWh, and
, and
are in kW. The power generation system consists of the PV array, the EV battery storage and the positive or negative import (or export) to the grid. Each of these is dispatched sequentially to meet the building’s load. The selected dispatch strategy is followed, resulting in zeroing the unmet load. The variable PV generated power is dispatched first. The resulting net required load
(kW) is calculated as follows:
Here,
is the required load (kW),
is the PV generation (kW),
is the PV inverter’s efficiency (%), and
is the DC power generated by the PV array (kW). The net required load can be zero, negative, or positive. A zero value indicates that the required load is satisfied precisely by the PV production. A negative value points to excess power produced by the PV system. This power can be employed to charge the battery if
SOC < 1. Otherwise, the excess power is exported (
Figure 2). A positive value points to the existence of additional load. This can be met by battery discharging if
SOC > 0.36 and the batteries are connected, or by importing electricity from the network. The battery’s power set point
in
is determined as follows:
Here,
and
are the battery’s inverter and rectifier efficiency.
is negative if the battery discharges, and positive if it is charged. The generator’s dispatch power
is determined by the unmet load and the required power to charge the battery. This is compared with the rated GenSet power
.
At each battery or GenSet dispatching step, the unmet load
is calculated:
At the final check of each time step, any quantity of unmet power is imported from the grid if it does not exceed the maximum permissible rate of imported power:
The following assumptions are made for battery charging rules and schedules:
An average of 40 car batteries stay connected to the building’s network between 9:00 and 17:00 on workdays. The maximum allowable charging power is limited to 160 kW. No employee car batteries are connected on weekends.
While connected, batteries are charged only by the PV inverter. During working hours, the EV batteries are allowed to discharge, e.g., in order to cover the buildings electrical loads during cloudy days of peaks. Allowed discharging is limited to 50 kW. Discharging of the batteries for car motion takes place when disconnected from the building’s grid.
Since battery discharging inside the building’s smart grid reduces the battery’s lifetime, each employee may grant permission for discharging of his car based on specific benefits. Indicative benefits could include the deduction of the electricity supplied to the network, multiplied by a factor of 1.5, from his monthly in-house charging bill. The effects of this type of policy on system size optimization of micro-grid components can be conveniently carried out based on simulation results.
3. Results
The transient evolution: at 0.1 h time step of the aggregate battery state of charge, power dispatched from the GenSet, power from the grid, power for EV charging and power exported to the grid are selected from the simulation results to describe the electrical system’s behaviour. The power surplus available for EV charging and exportation to the grid is computed as the difference between electric power that is produced and consumed by the building’s HVAC system, lighting and electric appliances. This is managed by the smart network and partially allocated to the charging of employees’ EVs; the remaining quantity is exported to the electricity grid.
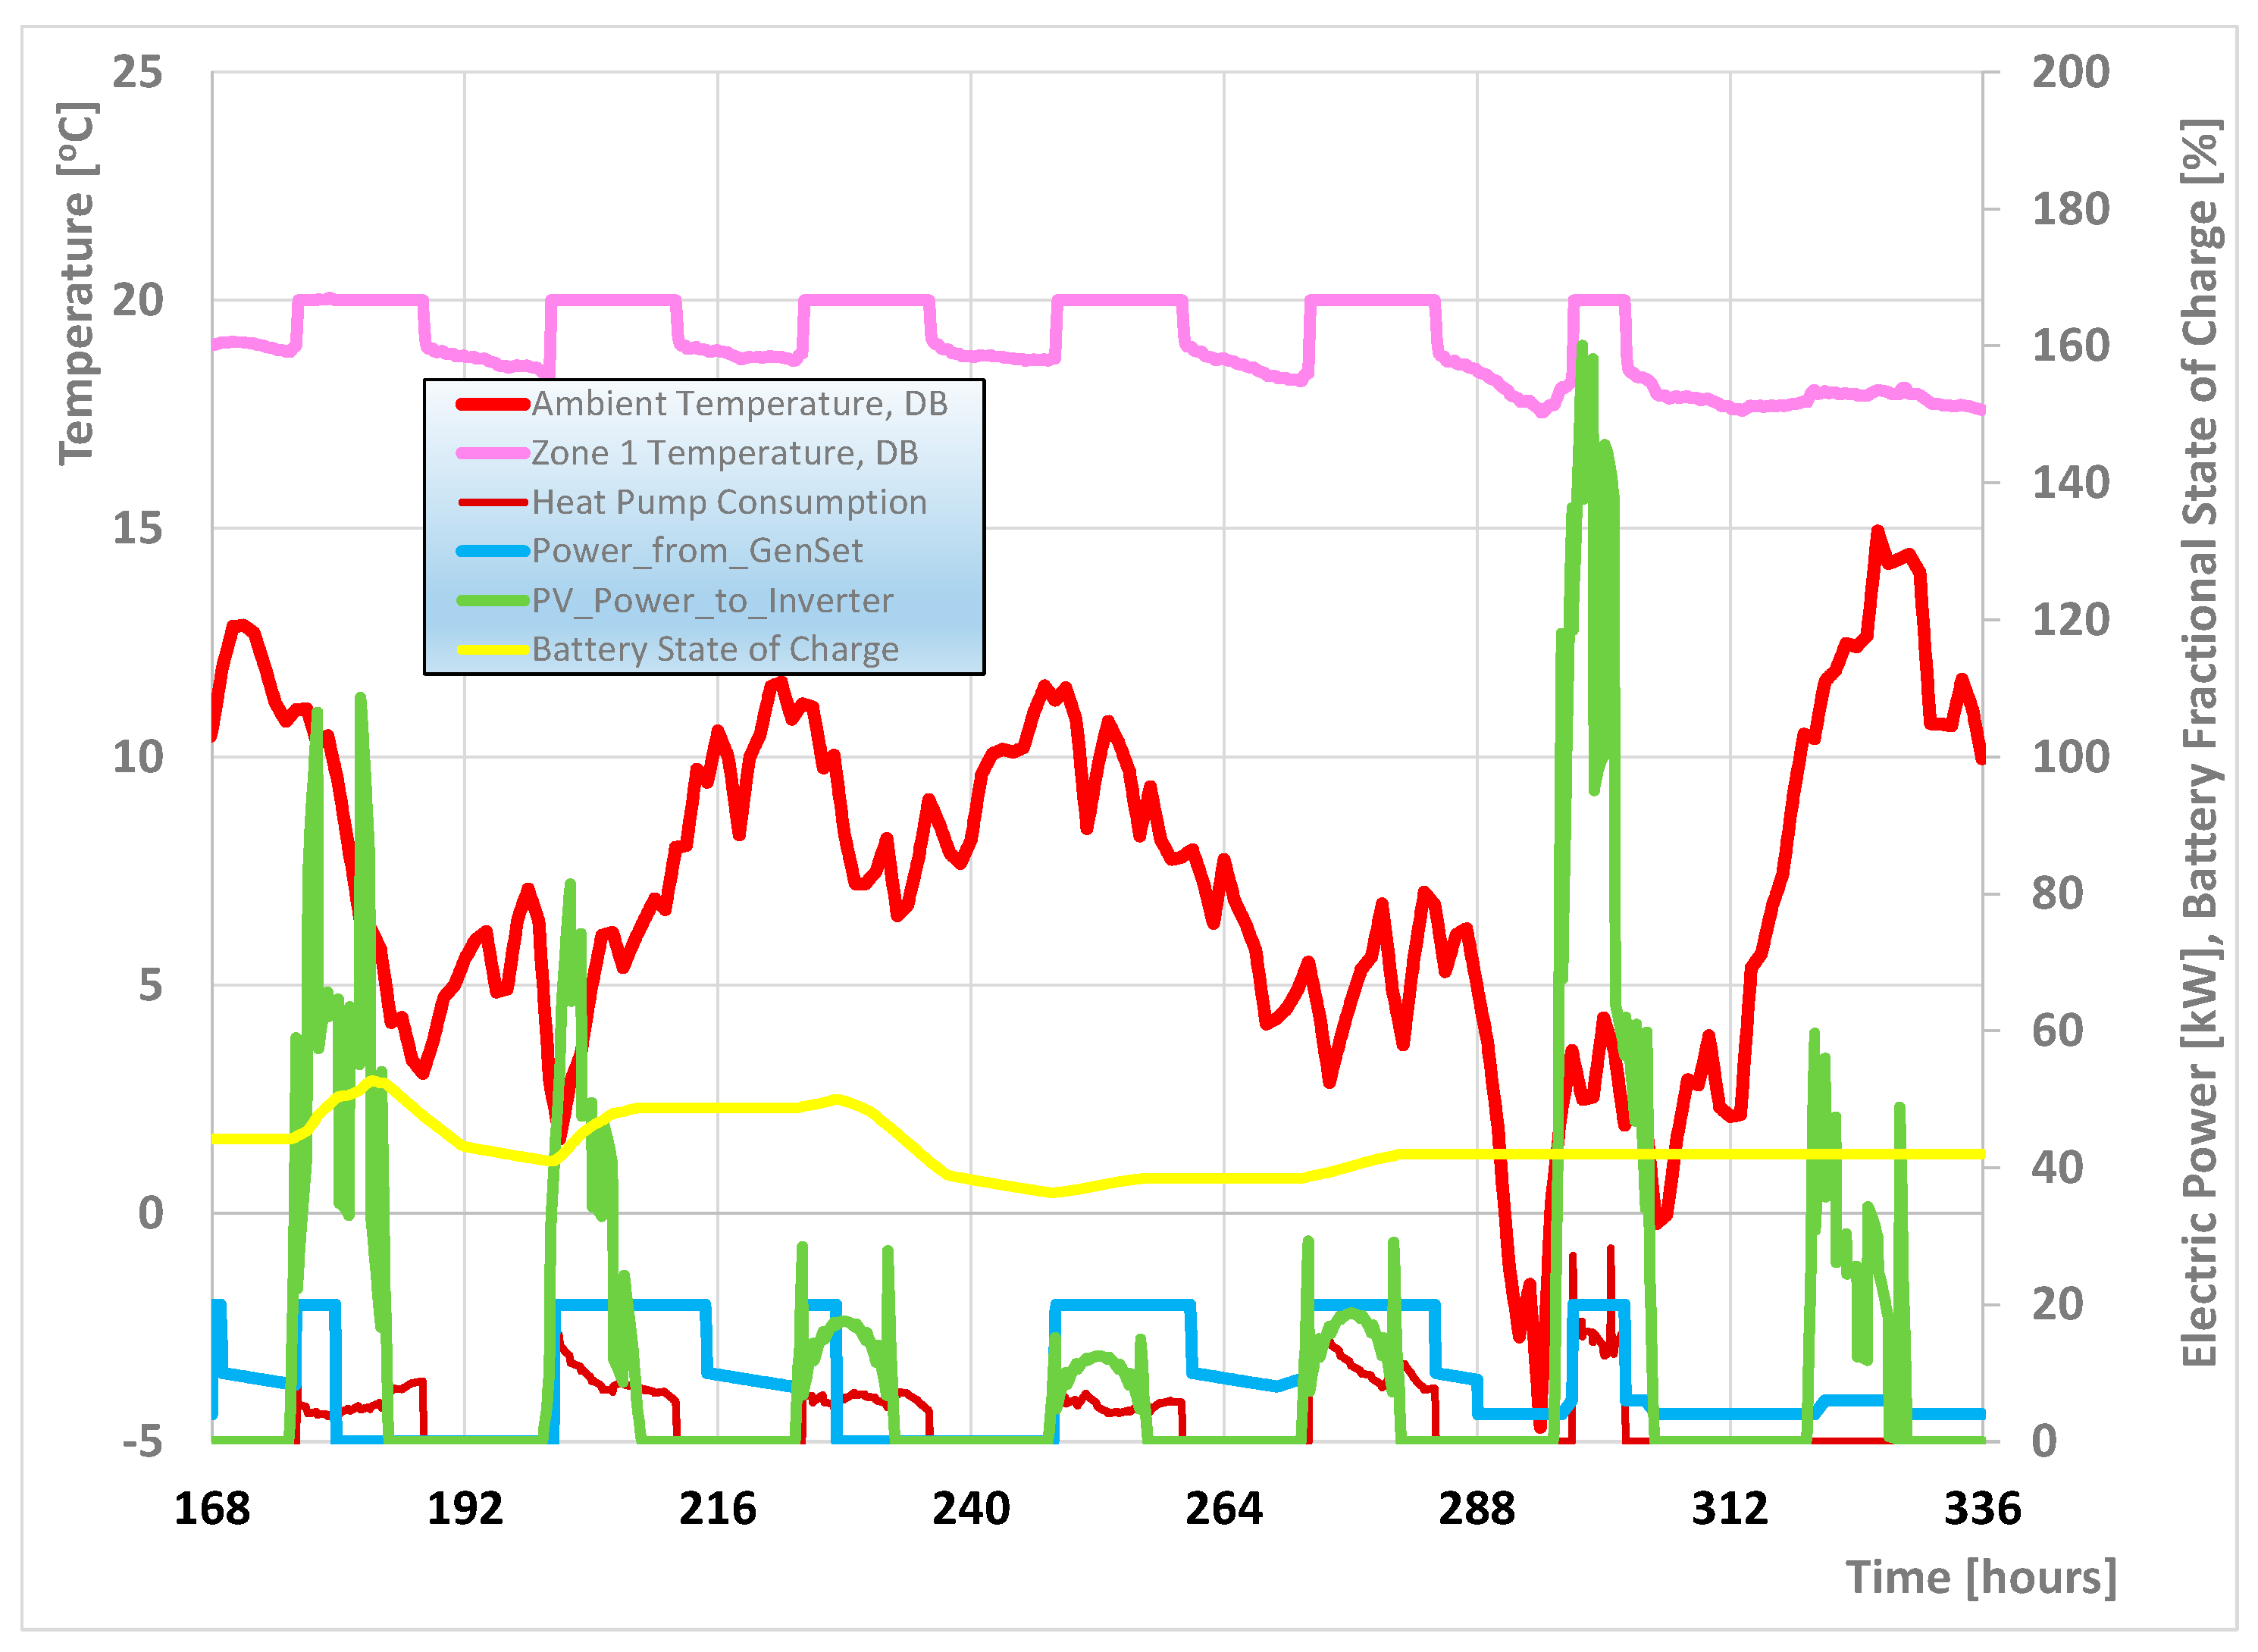
Starting from a small generator set rated at 20 kW, a transient simulation is carried out to allow an assessment of the system’s behaviour.
Figure 3 presents an overview of the system’s performance during the second week of January. A frequent use of the Genset is observed during the day, due to the batteries’ low average state of charge and the low photovoltaic production. Engine operation is at full load during a significant part of this time. As long as the battery charge exceeds the limits set by the smart grid, their batteries are allowed to discharge to partly cover electricity needs of the building. This is observed by the shut-off of the Genset observed in specific intervals in Figure. During the weekend (right side of the figure), the car batteries are no longer present in the system. The aggregate battery charge is considered to remain unchanged during the weekend. Thus, no battery capacity is available to cover the reduced electricity needs of the building. These needs are seen to be covered by operation of the Genset at part load.
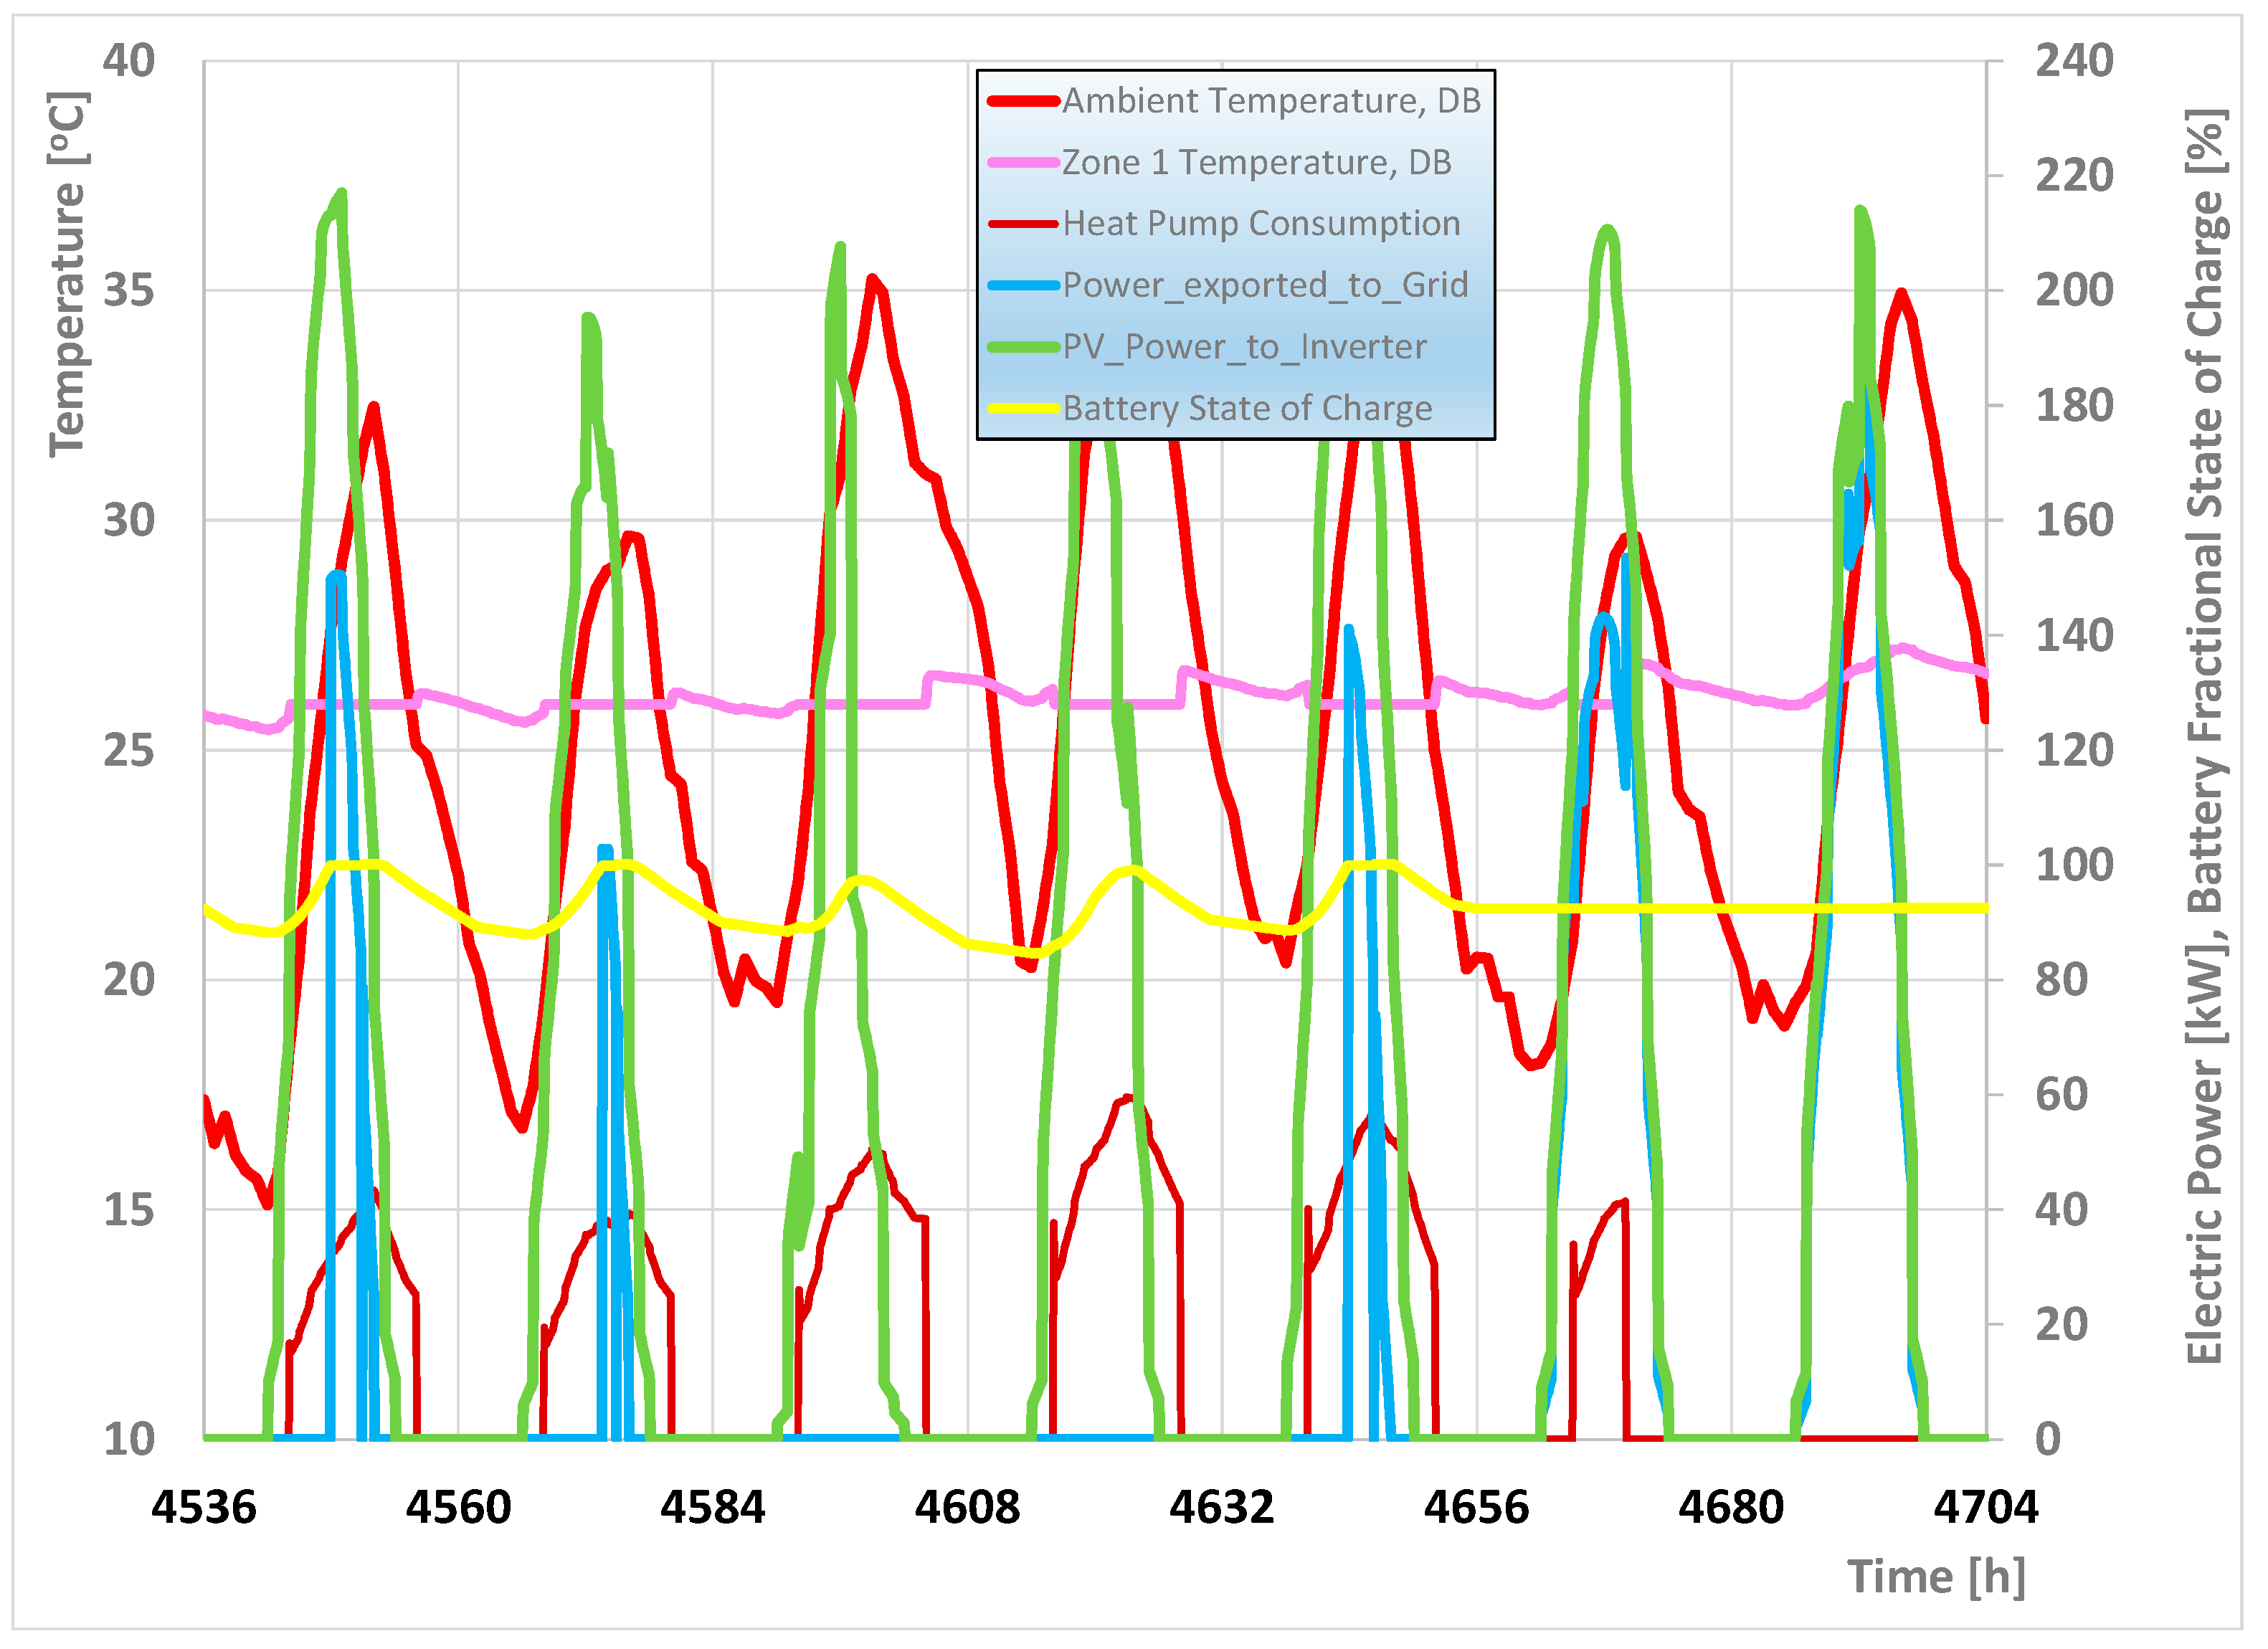
The rooftop PV production is significantly reduced during the third, fourth and fifth days of the week. Thus, the battery charging observed during these days is very limited. The system’s behaviour will be very different during the hot, sunny summer months. This can be observed in the example of the system’s operation during the second week of July, presented in
Figure 4.
During this season, photovoltaic production is very high, aided by the high percentage of sunshine and the small tilt angle of the photovoltaic panels. As a result, the state of charge of the batteries stays at high levels, reaching 100% at noon hours, as seen in
Figure 4. Significant quantities of electricity surplus are exported to the grid in these cases, as shown for Monday, Tuesday and Friday in the figure. The electricity exported to the grid is much greater during Saturday and especially Sunday. This behaviour is due to the lack of car batteries connected to the system during the weekend, as explained above.
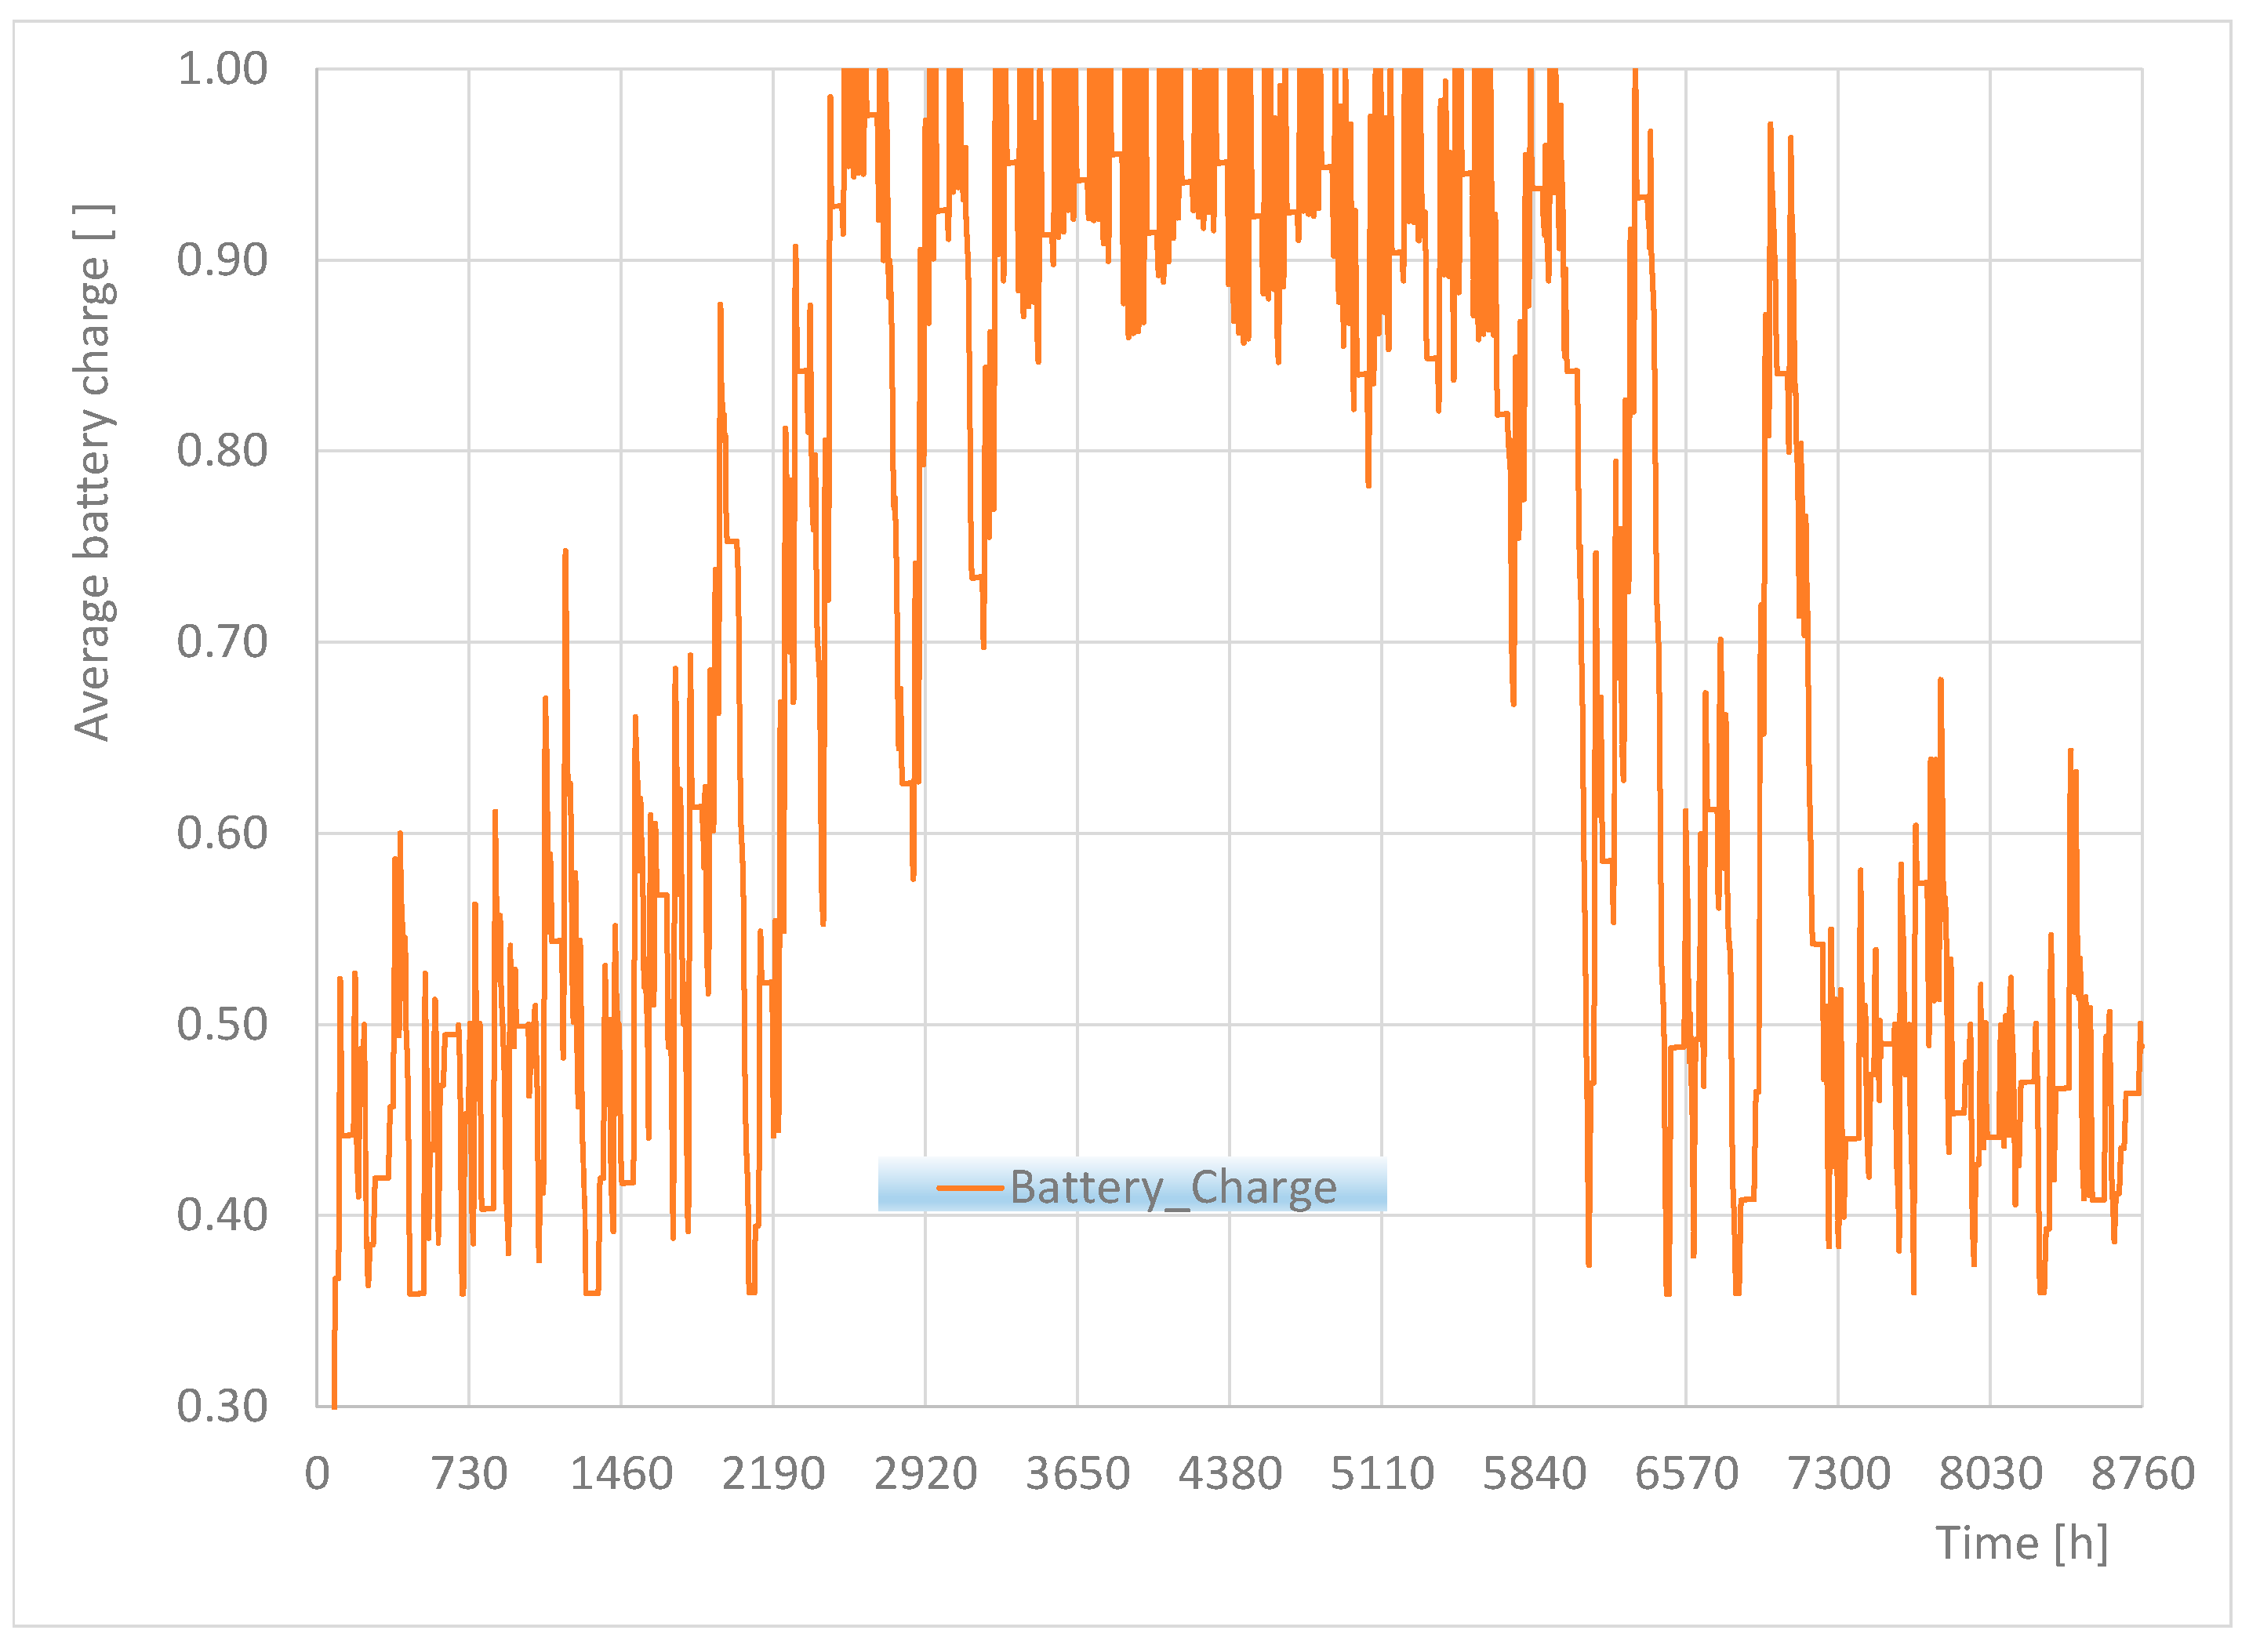
The year-round behaviour of the average battery state of charge is interesting to observe. As seen in the diagram of
Figure 5, the batteries, assumed to start at zero charge (a rough assumption made for the sake of simplification), quickly move above the minimum charging levels set. They stay close to 50% levels during the winter months. Afterwards, the charging levels increase in spring due to the reduced HVAC electricity needs and the increase in PV production. During the late spring and all summer, they reach 100% capacity during the day, mainly due to the maximized PV production. During the autumn, their charging levels fluctuate according to the PV production. Finally, with the advent of winter, charging levels drop to 50% or less.
Having presented an overview of the system’s transient behaviour, it is interesting to shift to the annual energy balances of the nZEB building equipped with the 20 kW capacity Genset.
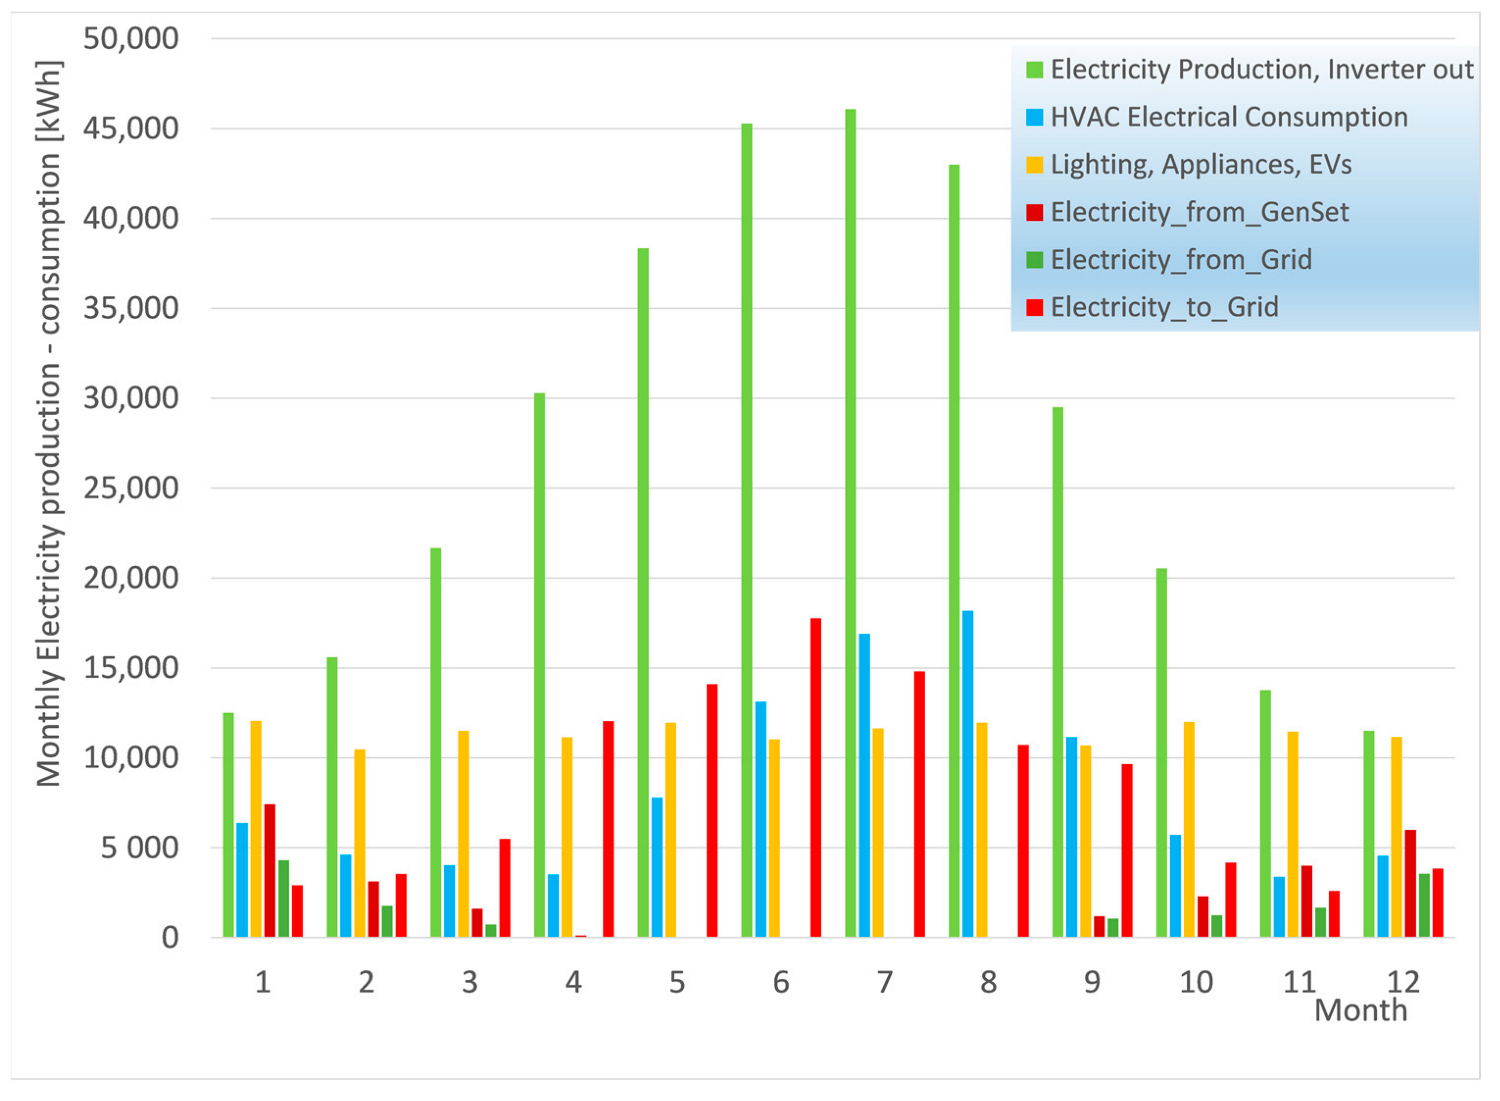
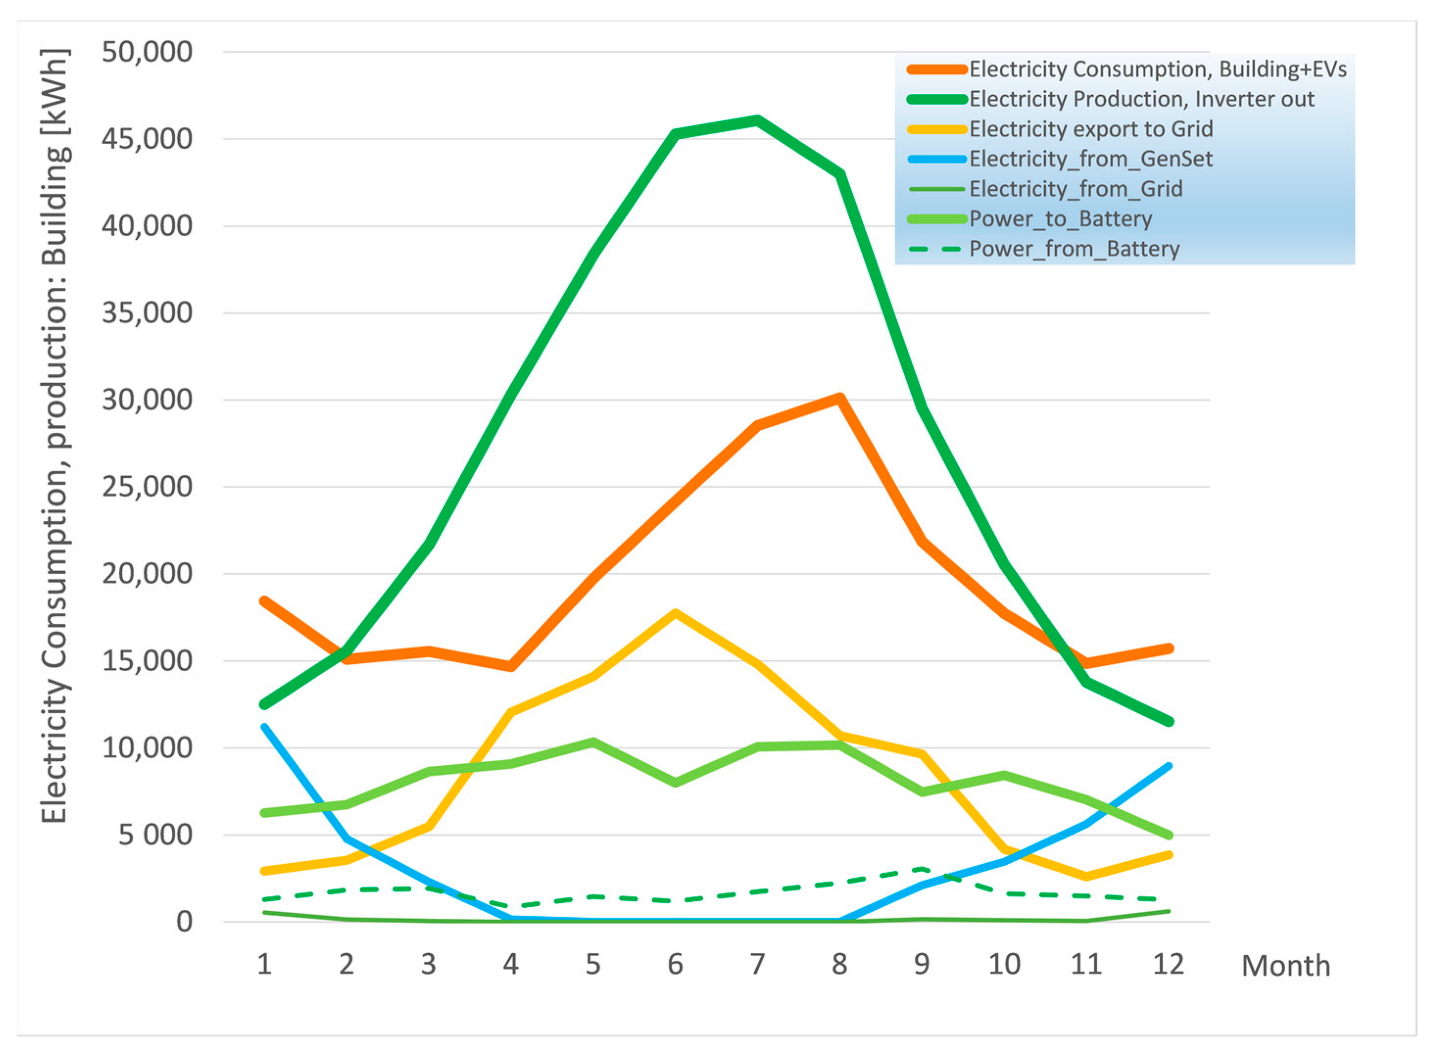
Figure 6 presents the evolution of the monthly rooftop PV electricity production, with the maximum observed in June and July, at 45,000 and 46,000 kWh/month, respectively, and the lowest in December, at around 12,000 kWh.
The electricity consumption of the HVAC system, mainly determined by the respective consumption of the heat pump, is seen to vary according to the weather conditions. It is negligible in the neutral months. The lighting and electrical appliances consumption is of the order of 4000 kWh/month. Annual electricity consumption is 147,000 kWh, or 26 kWh/m
2 y. This corresponds to 75.5 kWh/m
2 y primary energy consumption. The nZEB building limit set by European legislation is 80–90 kWh/m
2 y total primary energy consumption [
5]. The total annual PV electricity production is predicted to be 328,000 kWh. The Genset contributes a total of 25,800 kWh to the building’s energy system. The total annual imports from the grid are 14,400 kWh, and exports are 102,000 kWh, respectively. Thus, the building’s self-production significantly exceeds its annual electricity consumption, which is in line with its nZEB character. The significant electricity quantities that become available for EV charging and export to the network need to be optimally managed by a smart micro-grid.
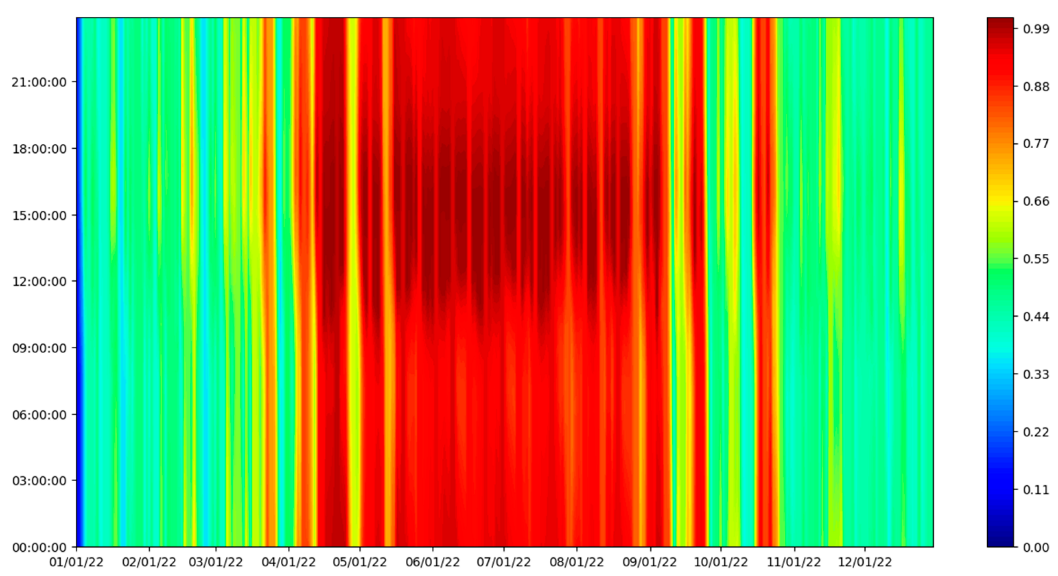
Further, it is interesting to observe the hourly and daily evolution of the average batteries’ state of charge as it evolves during the year, as presented in
Figure 7. The batteries are assumed to start with near zero charge. They are observed to quickly charge from the PV electricity and soon reach the threshold, allowing them to discharge outside and inside the building’s micro-grid. Starting from the middle of March, the batteries are seen to fully charge during the daily hours, with a lot of sunshine and discharge during the afternoon as they stay connected to the building’s micro-grid (until 18:00 h), and later in the evening during the cars’ use outside the building.
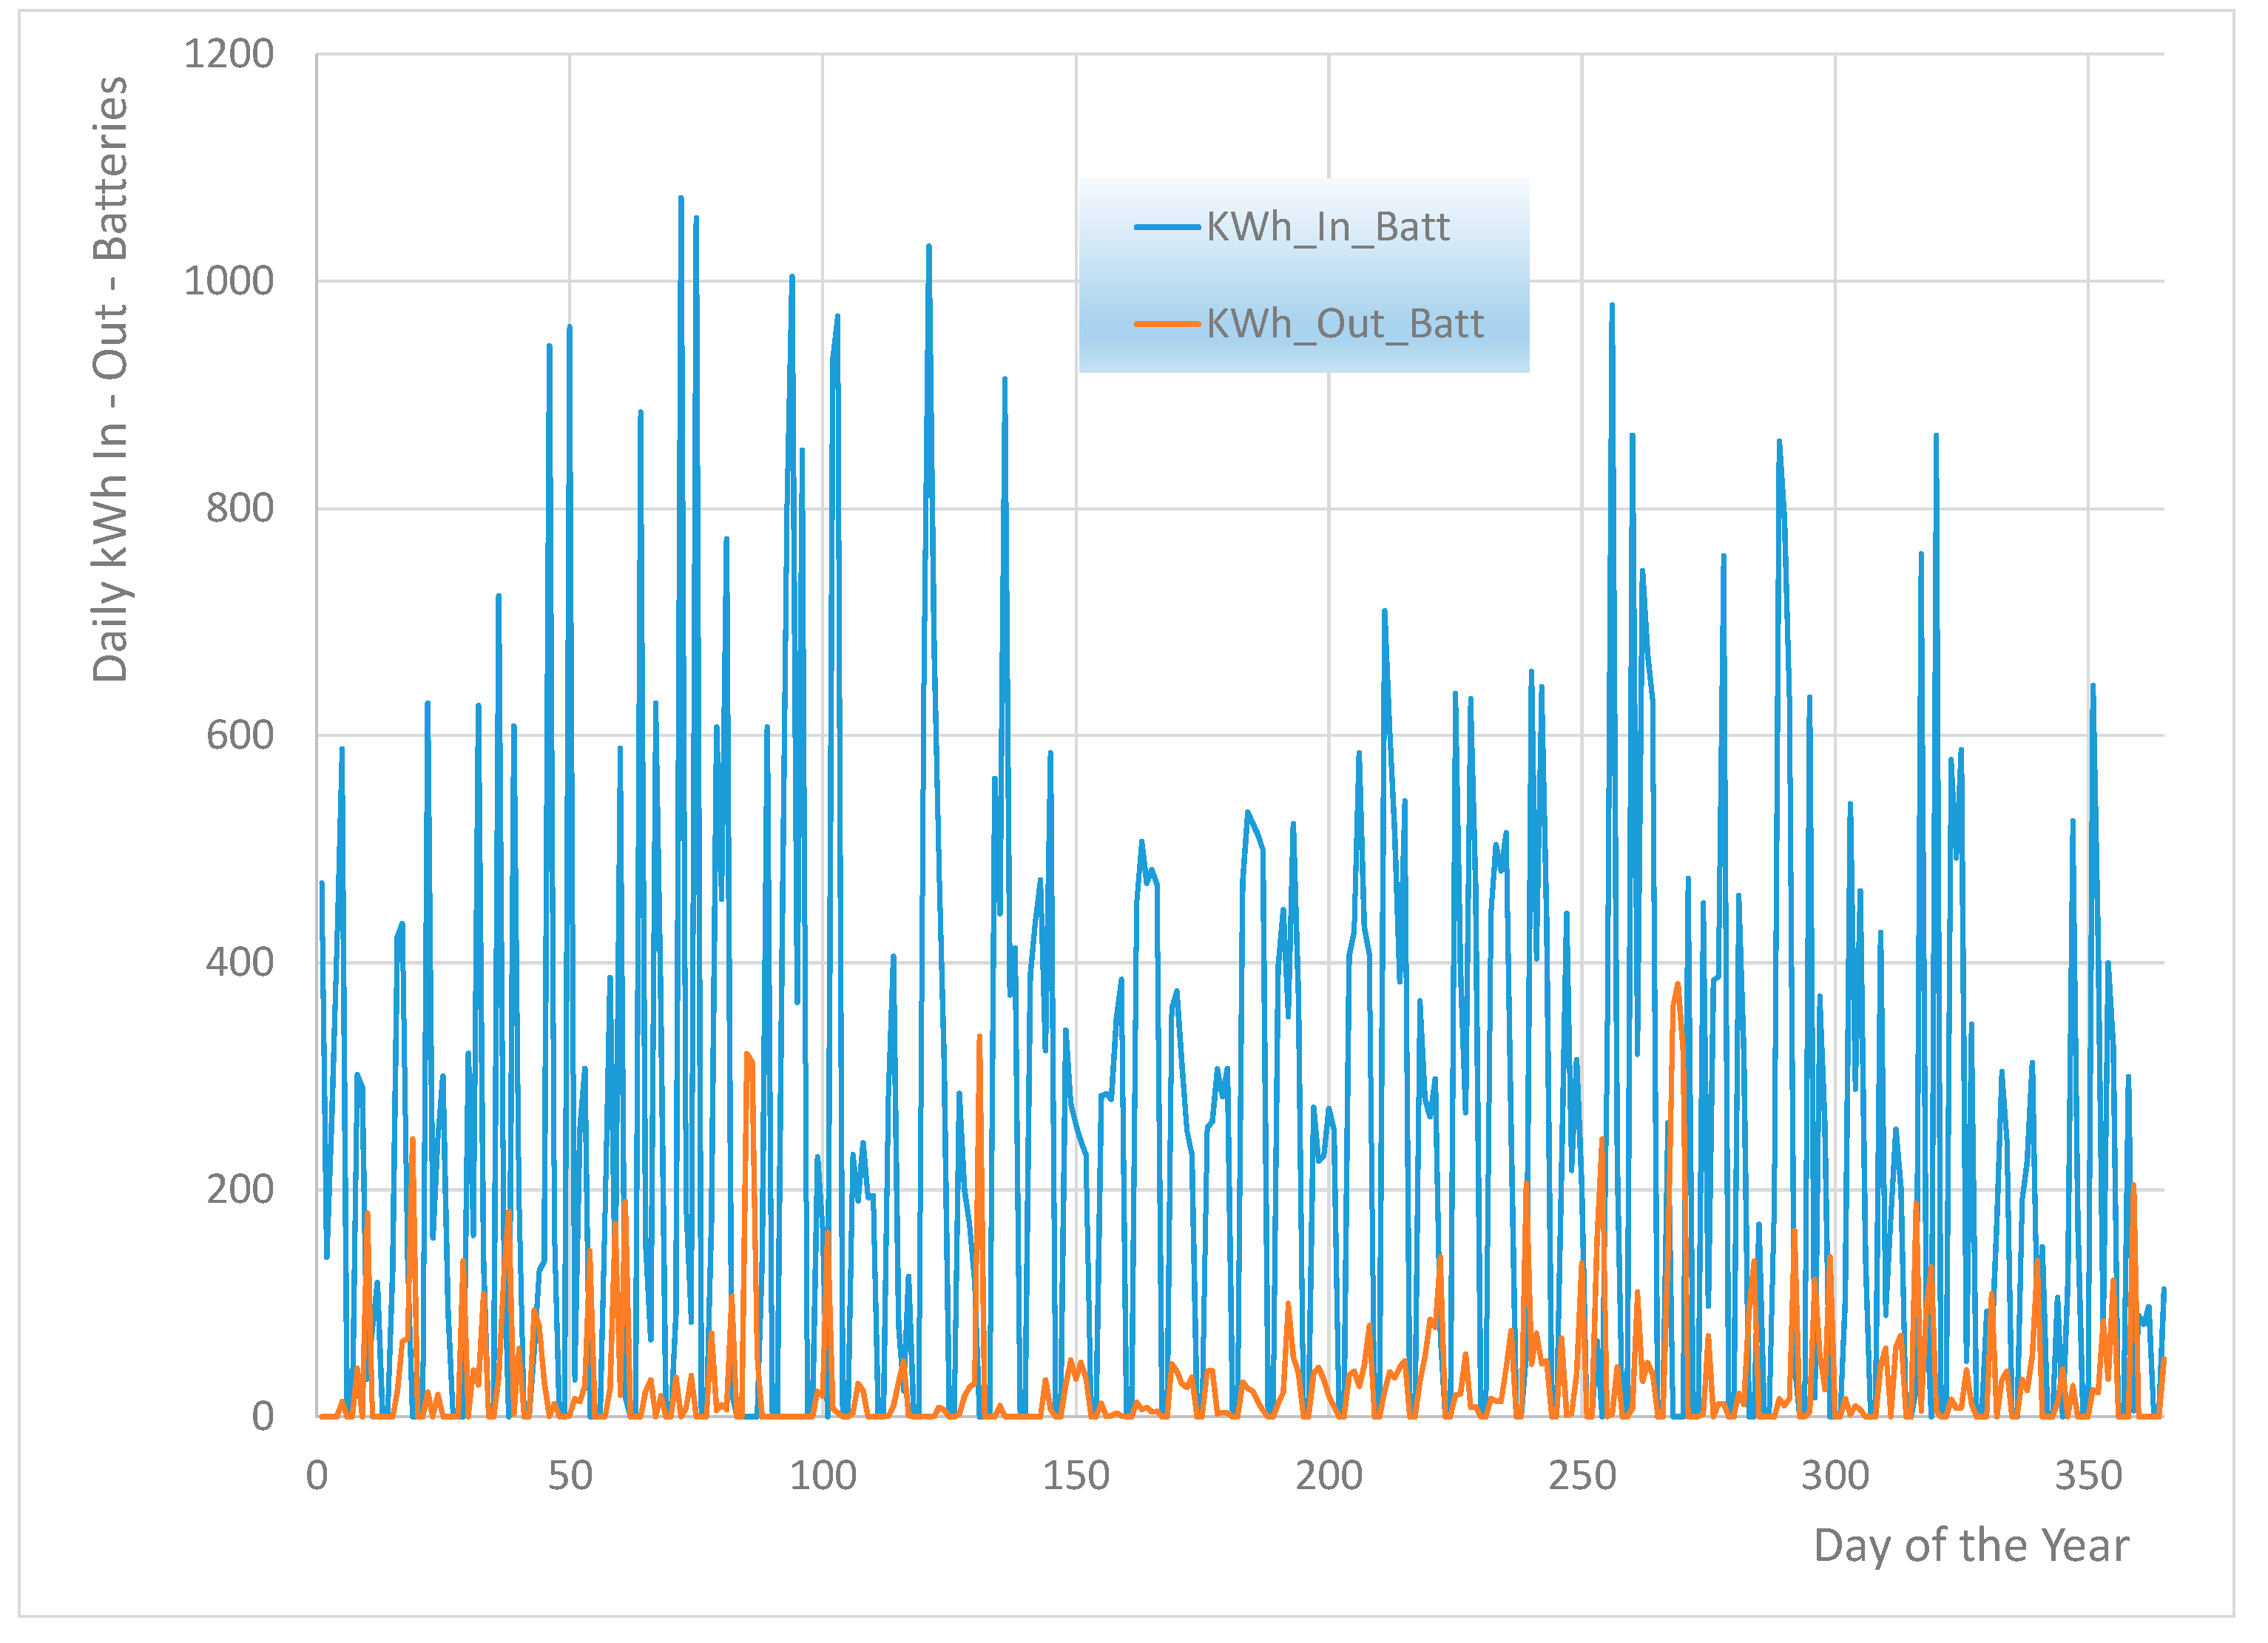
The batteries are observed to stay at a lower SOC and further discharge during days with low sunshine. Further, it is interesting to observe on a daily basis the electricity consumed to charge the EV batteries compared to the electricity supplied to the system, when necessary, by discharging EV batteries during the periods that the employees’ cars remain connected to the bi-directional chargers.
The situation is presented in
Figure 8. For the specific assumptions pertaining to the simulation in this figure, the total electrical energy stored in the batteries’ aggregate for charging amounts to 103,000 kWh. On the other hand, the total energy exported from the EVs’ batteries to the internal grid by discharging amounts to 11,500 kWh. That is, the net electrical energy sold to the EVs’ owners is 91,500 kWh. There are two critical parameters affecting the electrical energy supplied to the micro-grid by the discharging of the connected EVs: (i) the minimum allowed state of charge in the EV batteries,
and (ii) the power rating of the generator,
Pmax. These two parameters were optimized based on an objective function that takes into account the following facts:
The electricity sold to the micro-grid by discharging the EV batteries would cost 50% more than the electricity received from the car chargers.
The imported electricity from the grid should be minimized.
The usage factor for the Genset should be kept to high levels, that is, the natural gas-fuelled engine should be operated at high loads to attain high thermal efficiency (since it works as an SI engine). The simultaneous and Pmax optimization is carried out by means of the TRNSYS GenOpt module and produces optimal values of and Pmax = 50 kW (60 kVA generator).
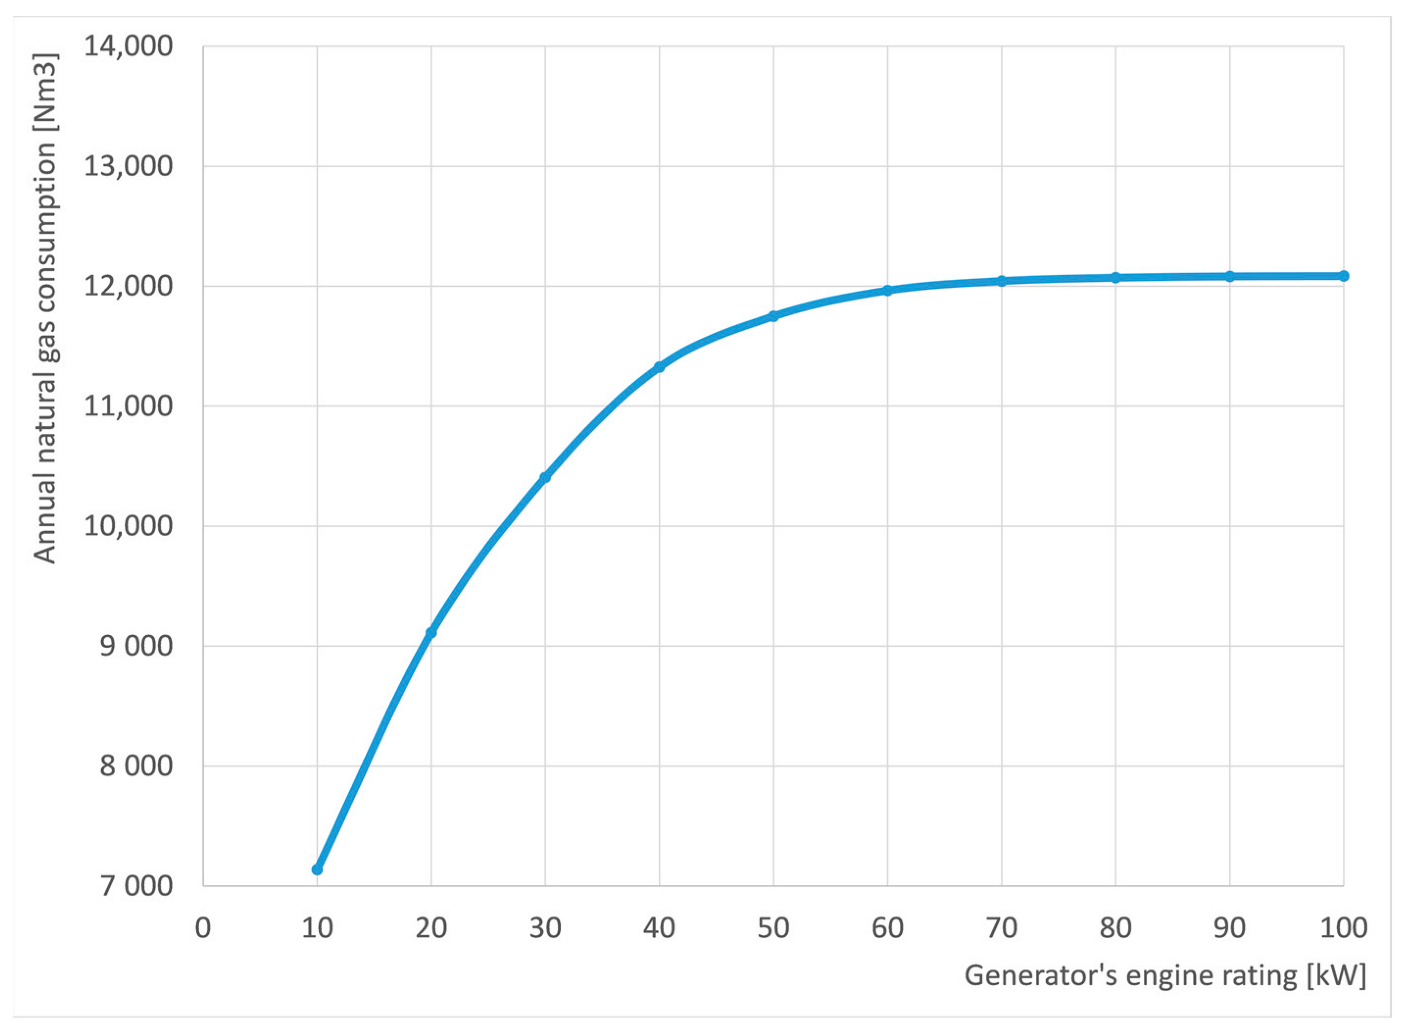
The annual natural gas consumption of the generator is seen in
Figure 9 to rise rapidly at a low engine rating and more slowly as the engine’s rating approaches 50 kW. Beyond this rating, the gas consumption is stabilized. On the other hand, the GenSet engine is a natural gas-fuelled, spark-ignited engine. This type of engine is characterized by a significant loss of efficiency at low loads. For this reason, a smaller engine would consume less natural gas Nm
3/kWh, since it would operate at higher average load levels. On the other hand, a building of this size and electricity consumption profile would require a GenSet of at least a 50 kW rating for backup purposes. As a next step,
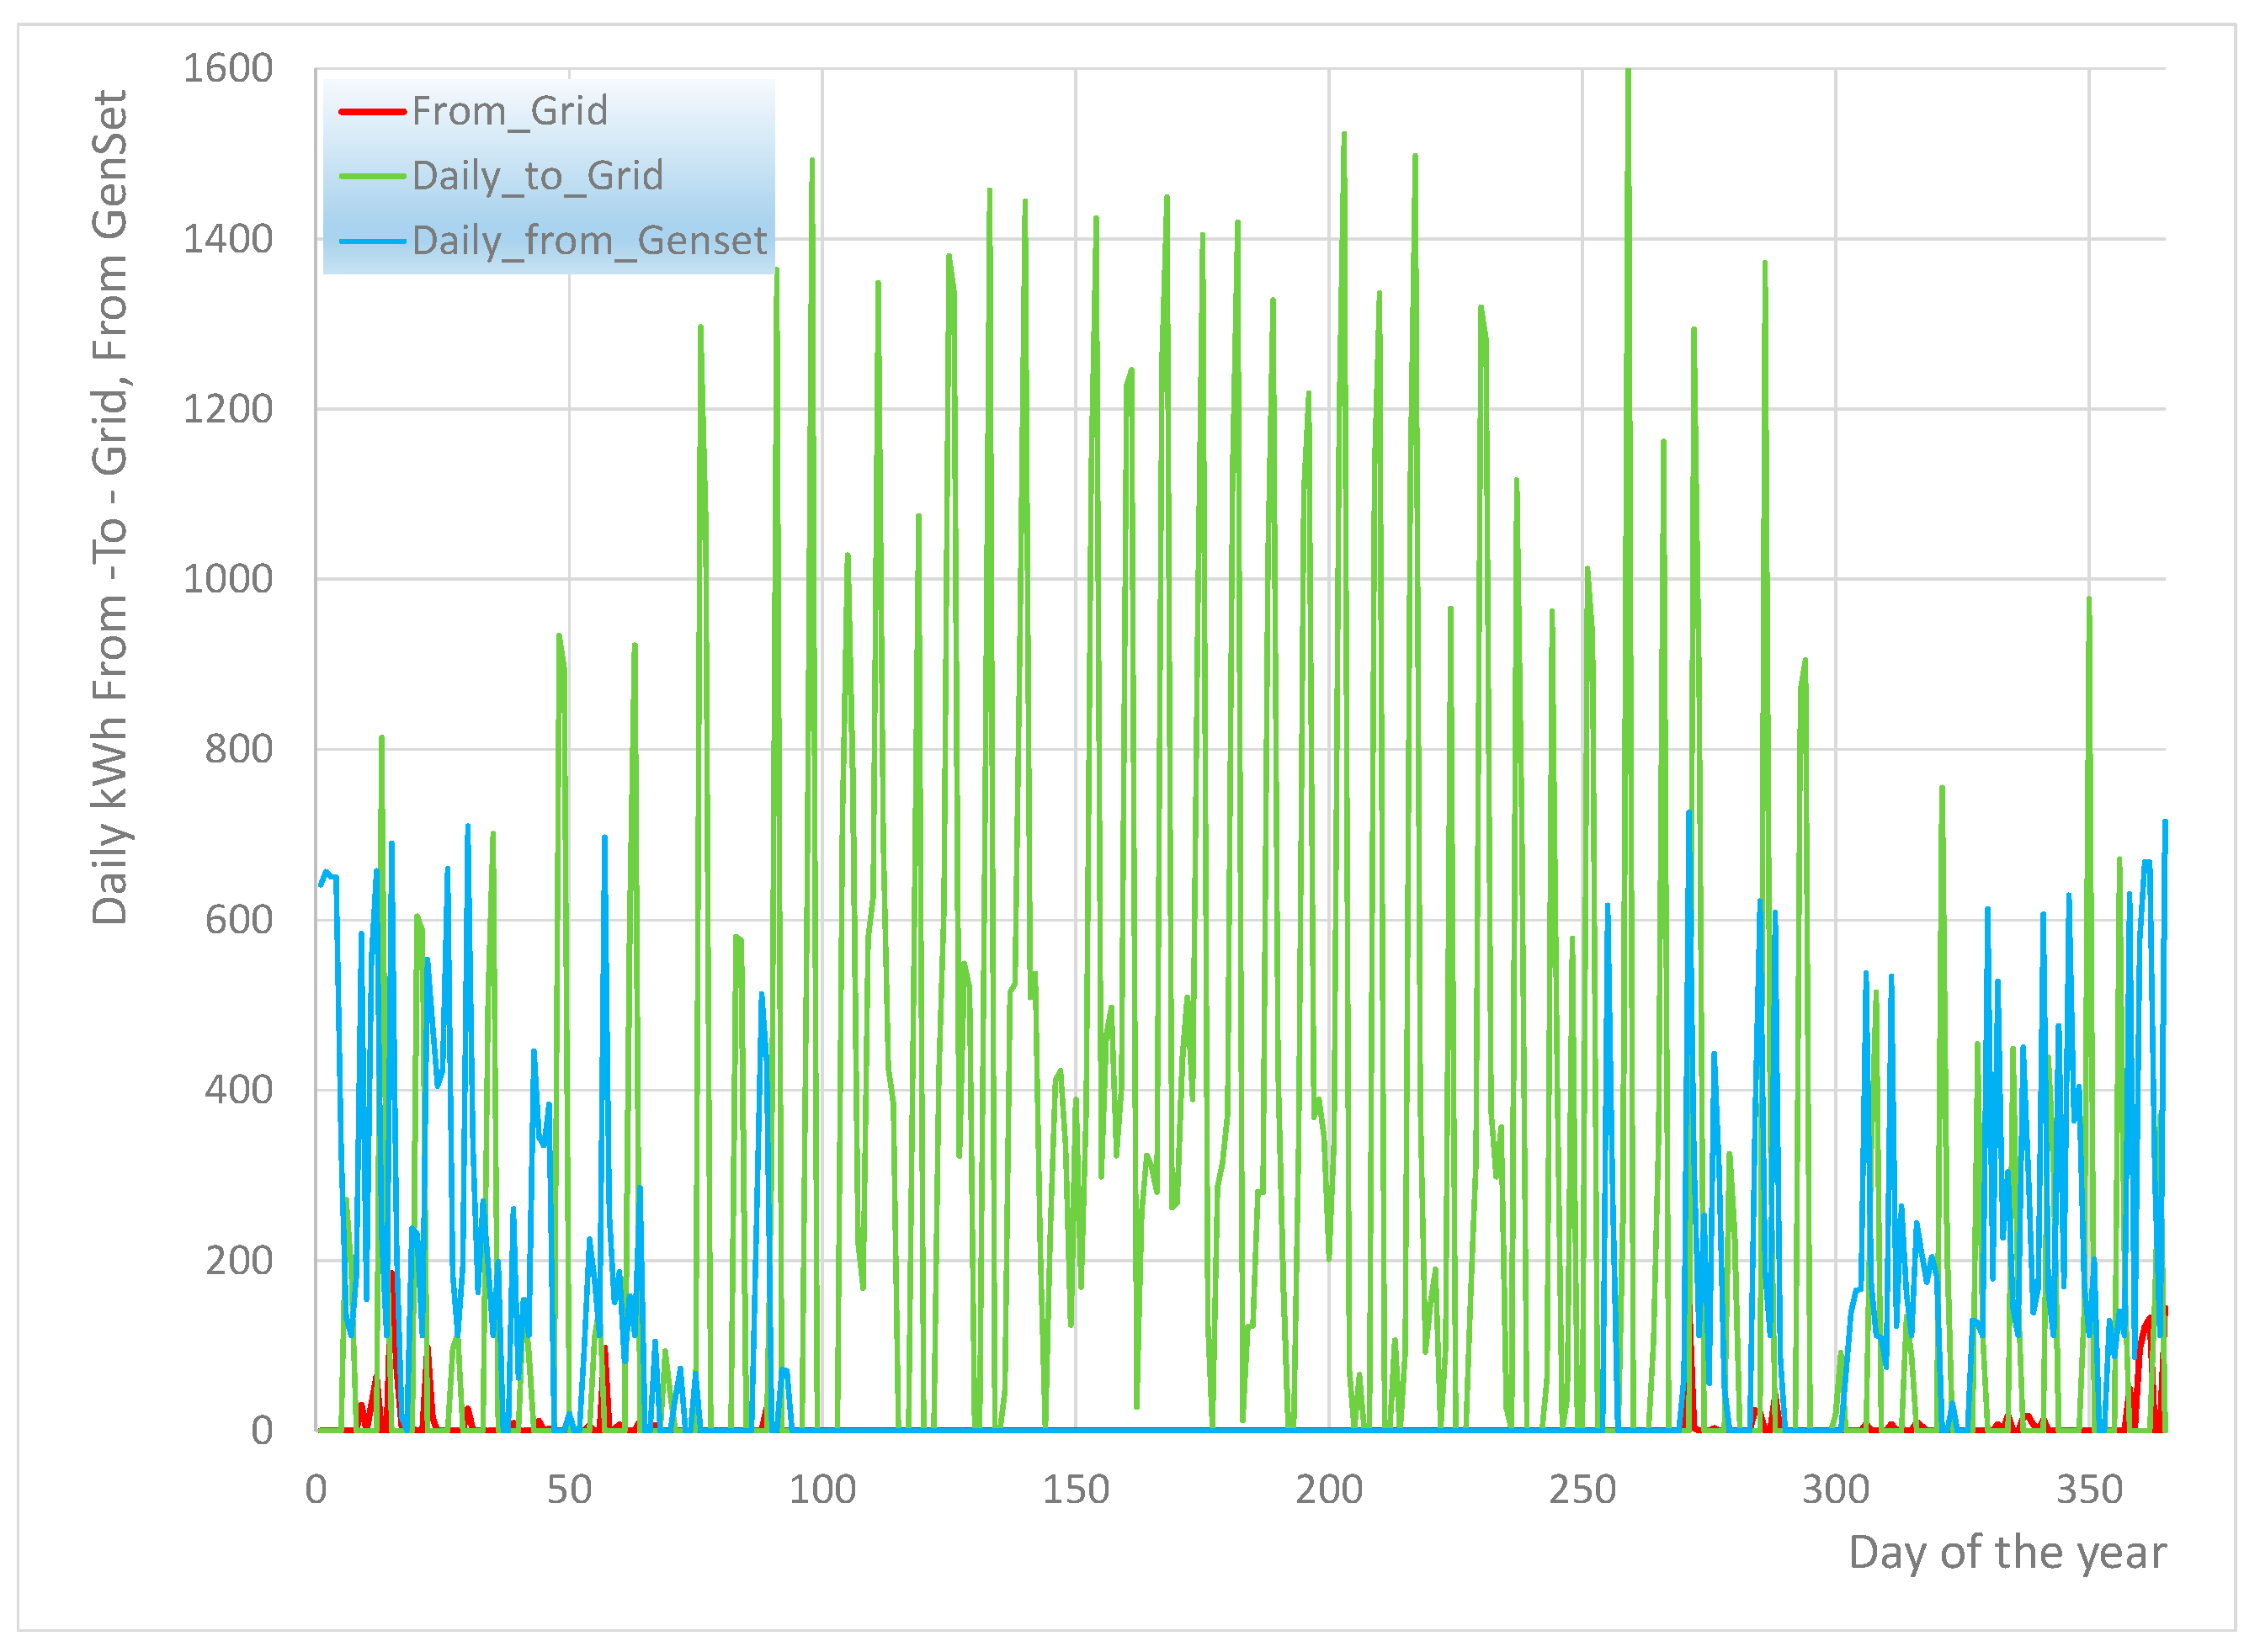
Figure 10 presents the evolution of the daily electrical energy input from the generator, the electricity input from the external grid, and the electricity export to the grid during the year.
The 60 kVA generator is seen to operate at a high load during the first days of January, since the batteries start off discharged, the building’s needs for heating are high and the insolation is low in the winter. Importation of additional, small quantities from the grid is necessary during some cold and cloudy days of January. From March, a steady surplus of PV electricity is observed, and significant amounts of electricity are exported daily to the grid. During mid-summer, the electricity quantities exported become lower, due to the increased heat pump consumption needed to meet the high cooling loads of hot days. The GenSet operates again in late November and December, since the batteries’
SOC has dropped significantly (
Figure 5).
Overall, one can observe in the monthly quantities presented in
Figure 11 that the major electricity exportation to the grid takes place in April, May and June, whereas the GenSet is mainly operated in December, January and February. A significant quantity remains available for export to the grid during the months of July and August, in which the maximum demand of the Greek system is observed. However, it is necessary to explore this further with the hourly evolution of export quantities to see whether they assist the Greek system in the morning and evening ramp during the most demanding months.
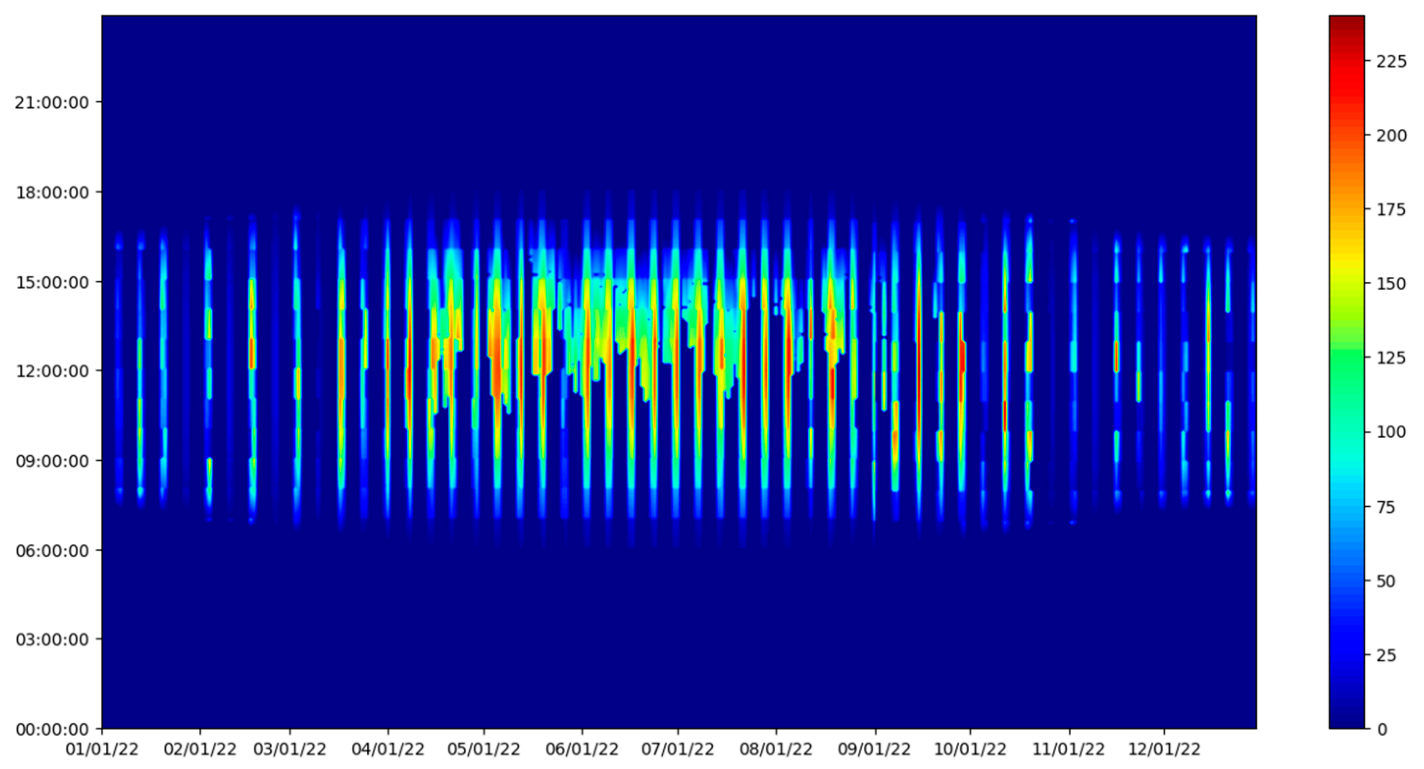
To this end, the hourly distribution of the power levels exported to the grid is presented in
Figure 12 as function of the day of year. As already mentioned, the highest power levels are exported in the morning-to-noon hours during April and May, and peak at 200 kW. During July and August, the peak power levels exported may reach or exceed 200 kW during a narrower hourly window. Of course, as already discussed, significant electricity exports are observed during the weekends, throughout the year.
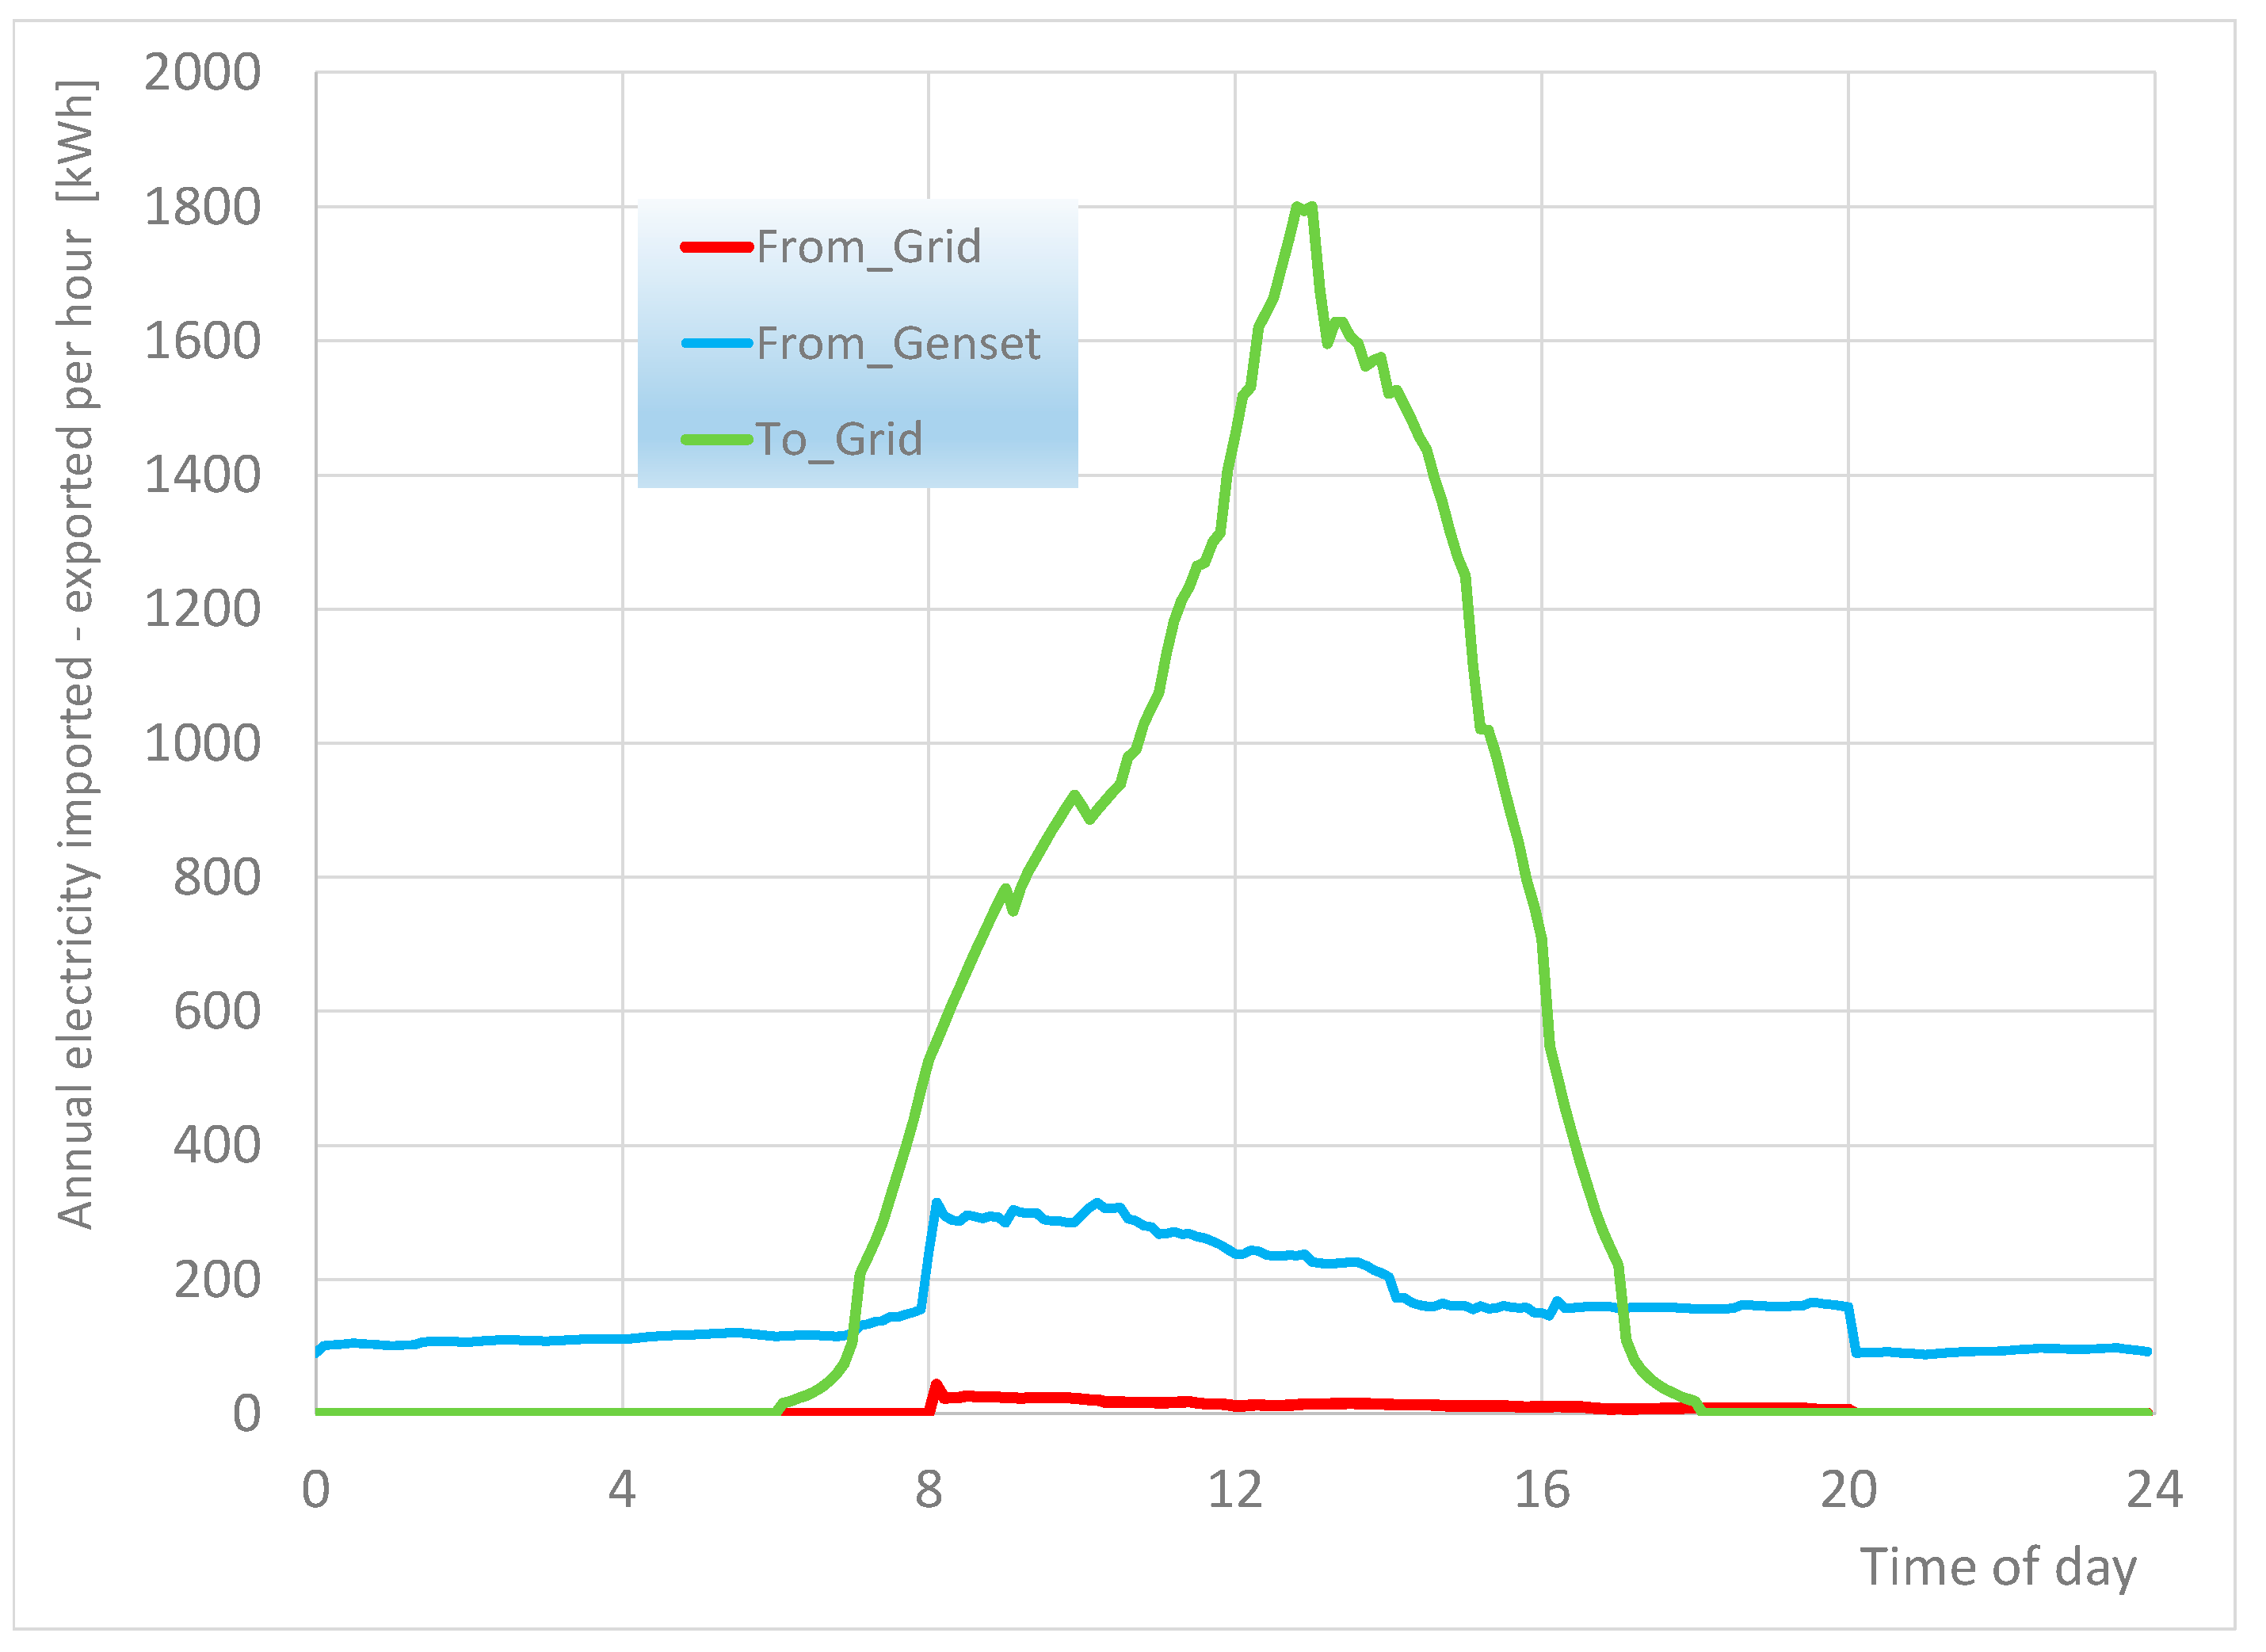
Next, the integration of the annual electricity dispatched from the GenSet, the electricity imported and exported to the grid for each time slot of the day, produces the diagram of
Figure 13. The total yearly electricity quantity exported to the grid for a specific hour of the day reaches 1800 kWh at about 13:00.
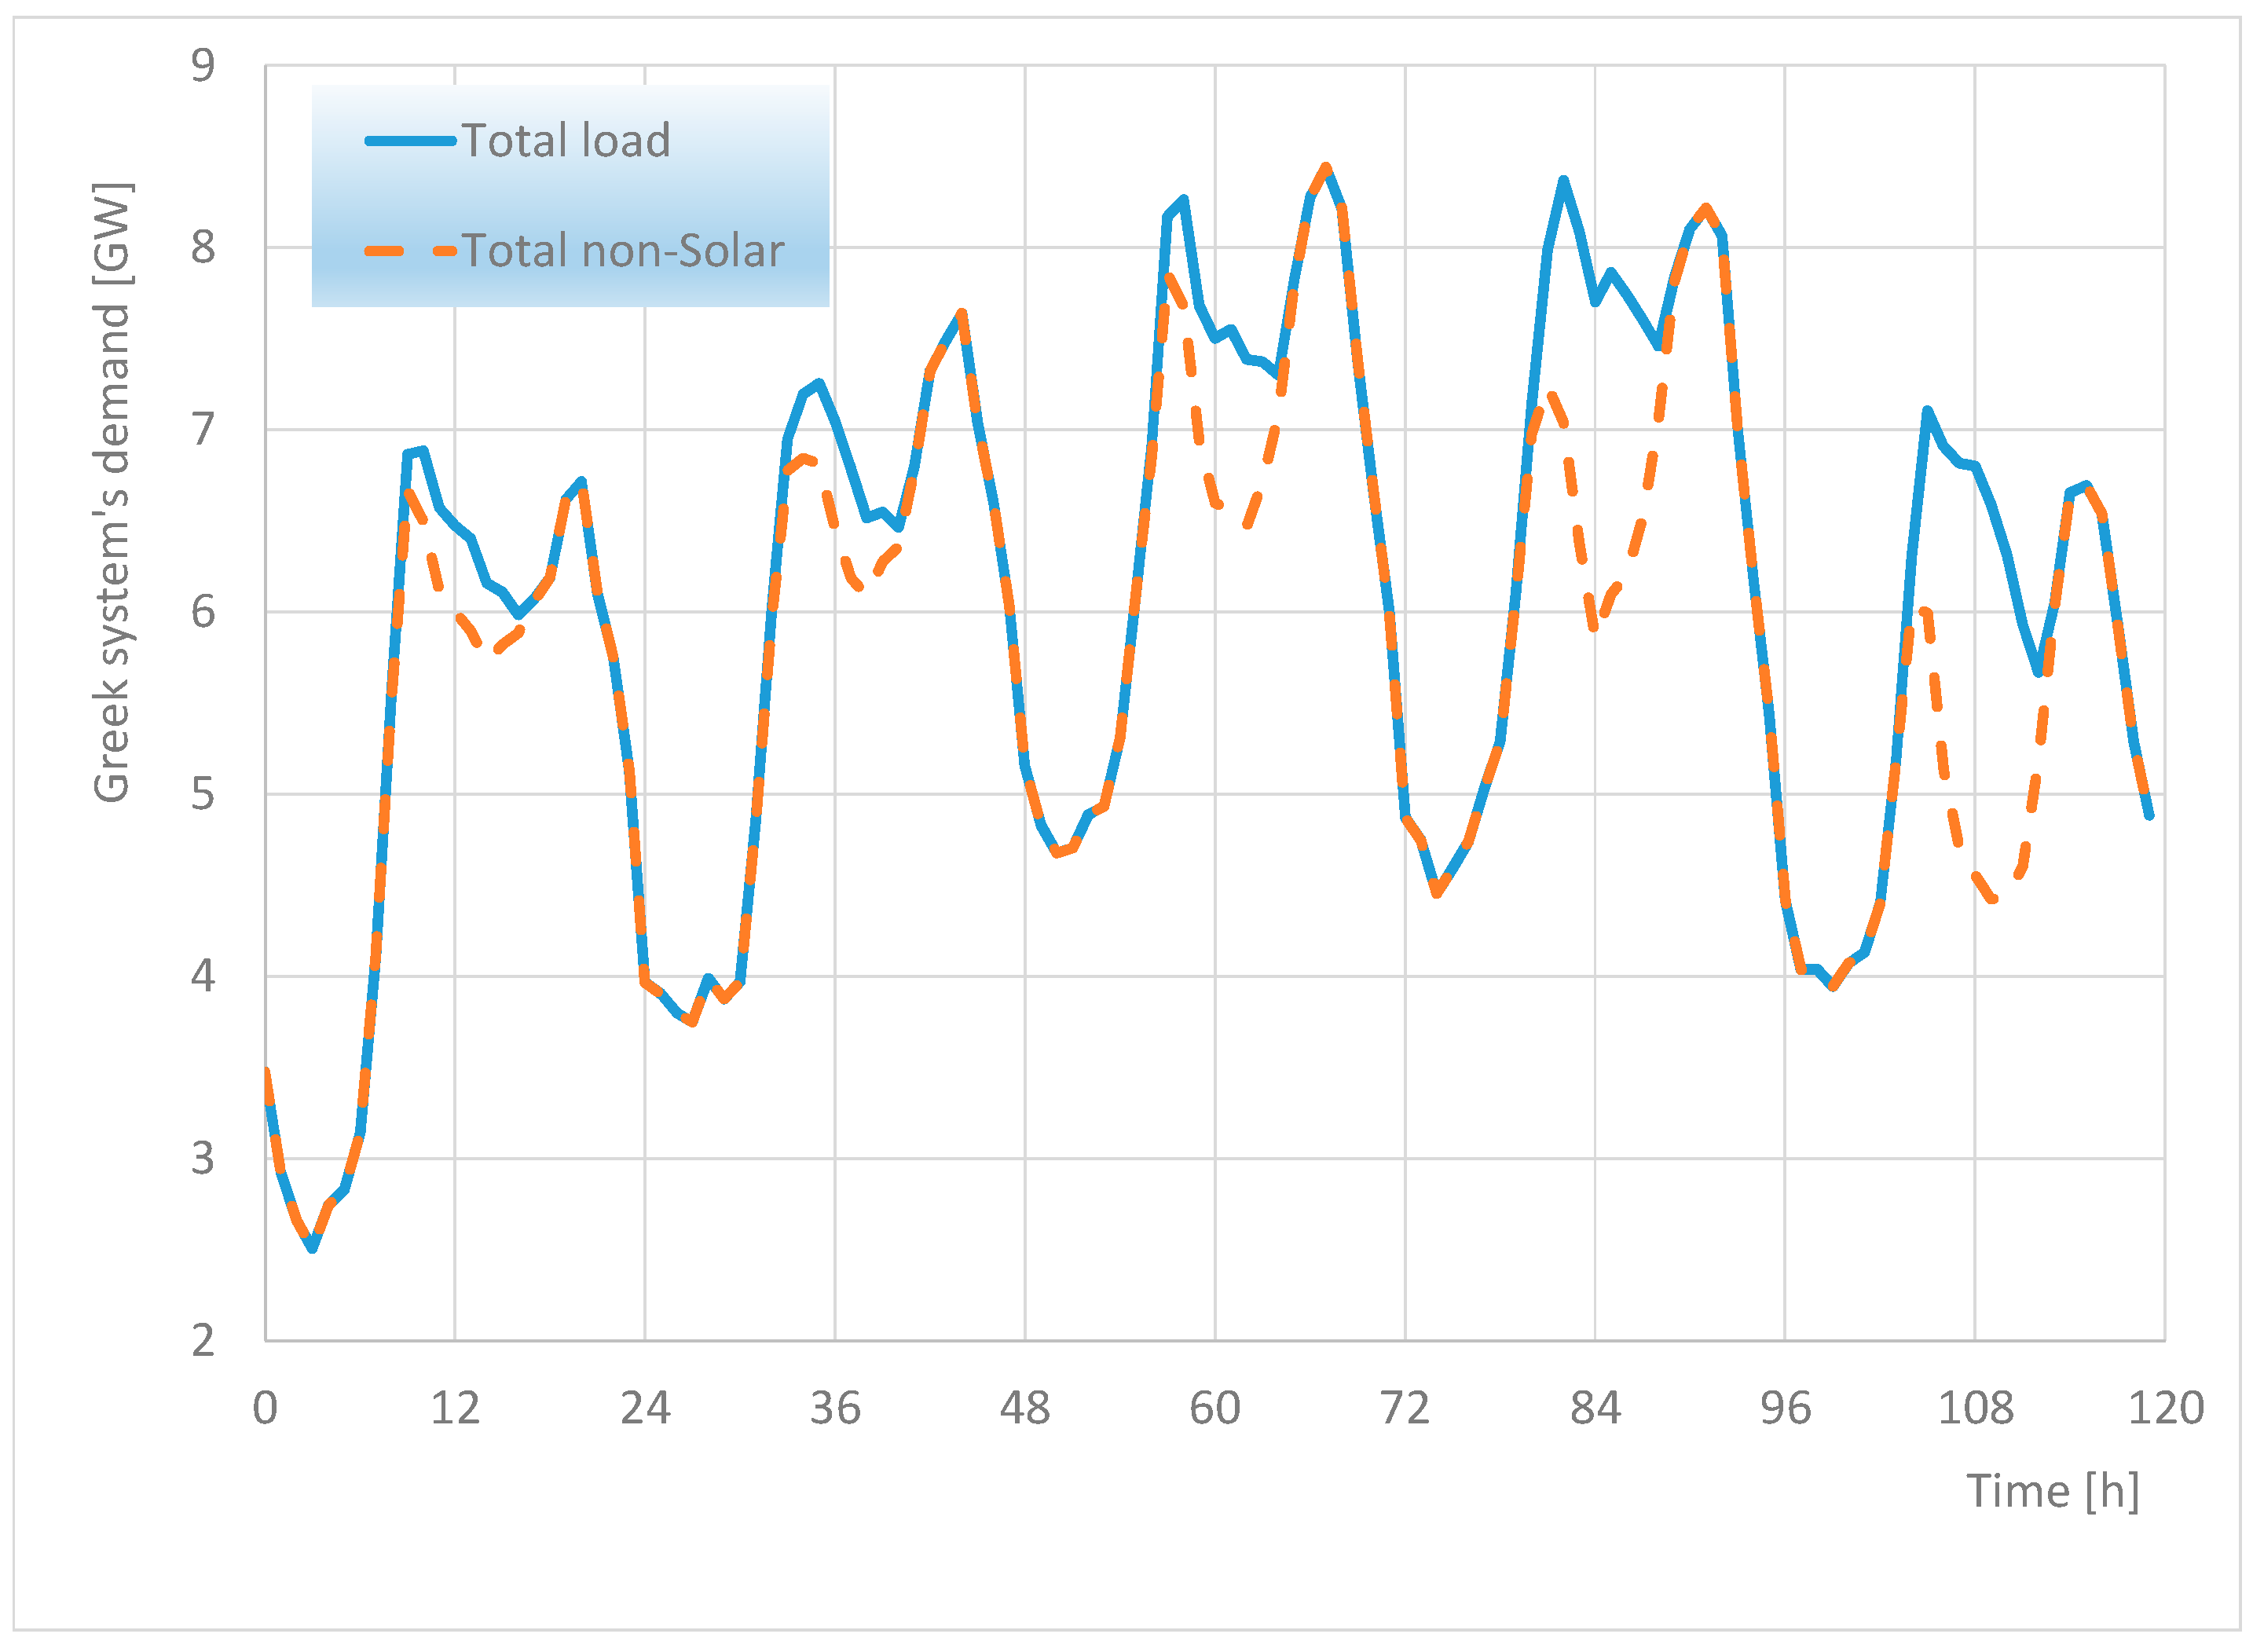
With regard to the requirements of the external grid,
Figure 14 presents the average hourly fluctuation of the Greek system’s demand over 10 days in the beginning of July 2022. On working days, the morning ramp starts at 6:00 in the morning. When one subtracts the photovoltaic production of the Greek system, meeting the ramp during the first three weekdays, as shown in
Figure 14, requires a total of 1 GW units’ power to be connected and dispatched to the grid during a 2 h period. On the other hand,
Figure 14 indicates that when one subtracts the electricity supplied by the photovoltaics, the Greek system demonstrates a steep early afternoon ramp in the period from 17:00–19:00, which requires an additional 1 GW units’ power to be connected and dispatched to the grid. The ability of the building’s internal grid to export electricity during this period is beneficial to the external grid. For comparison,
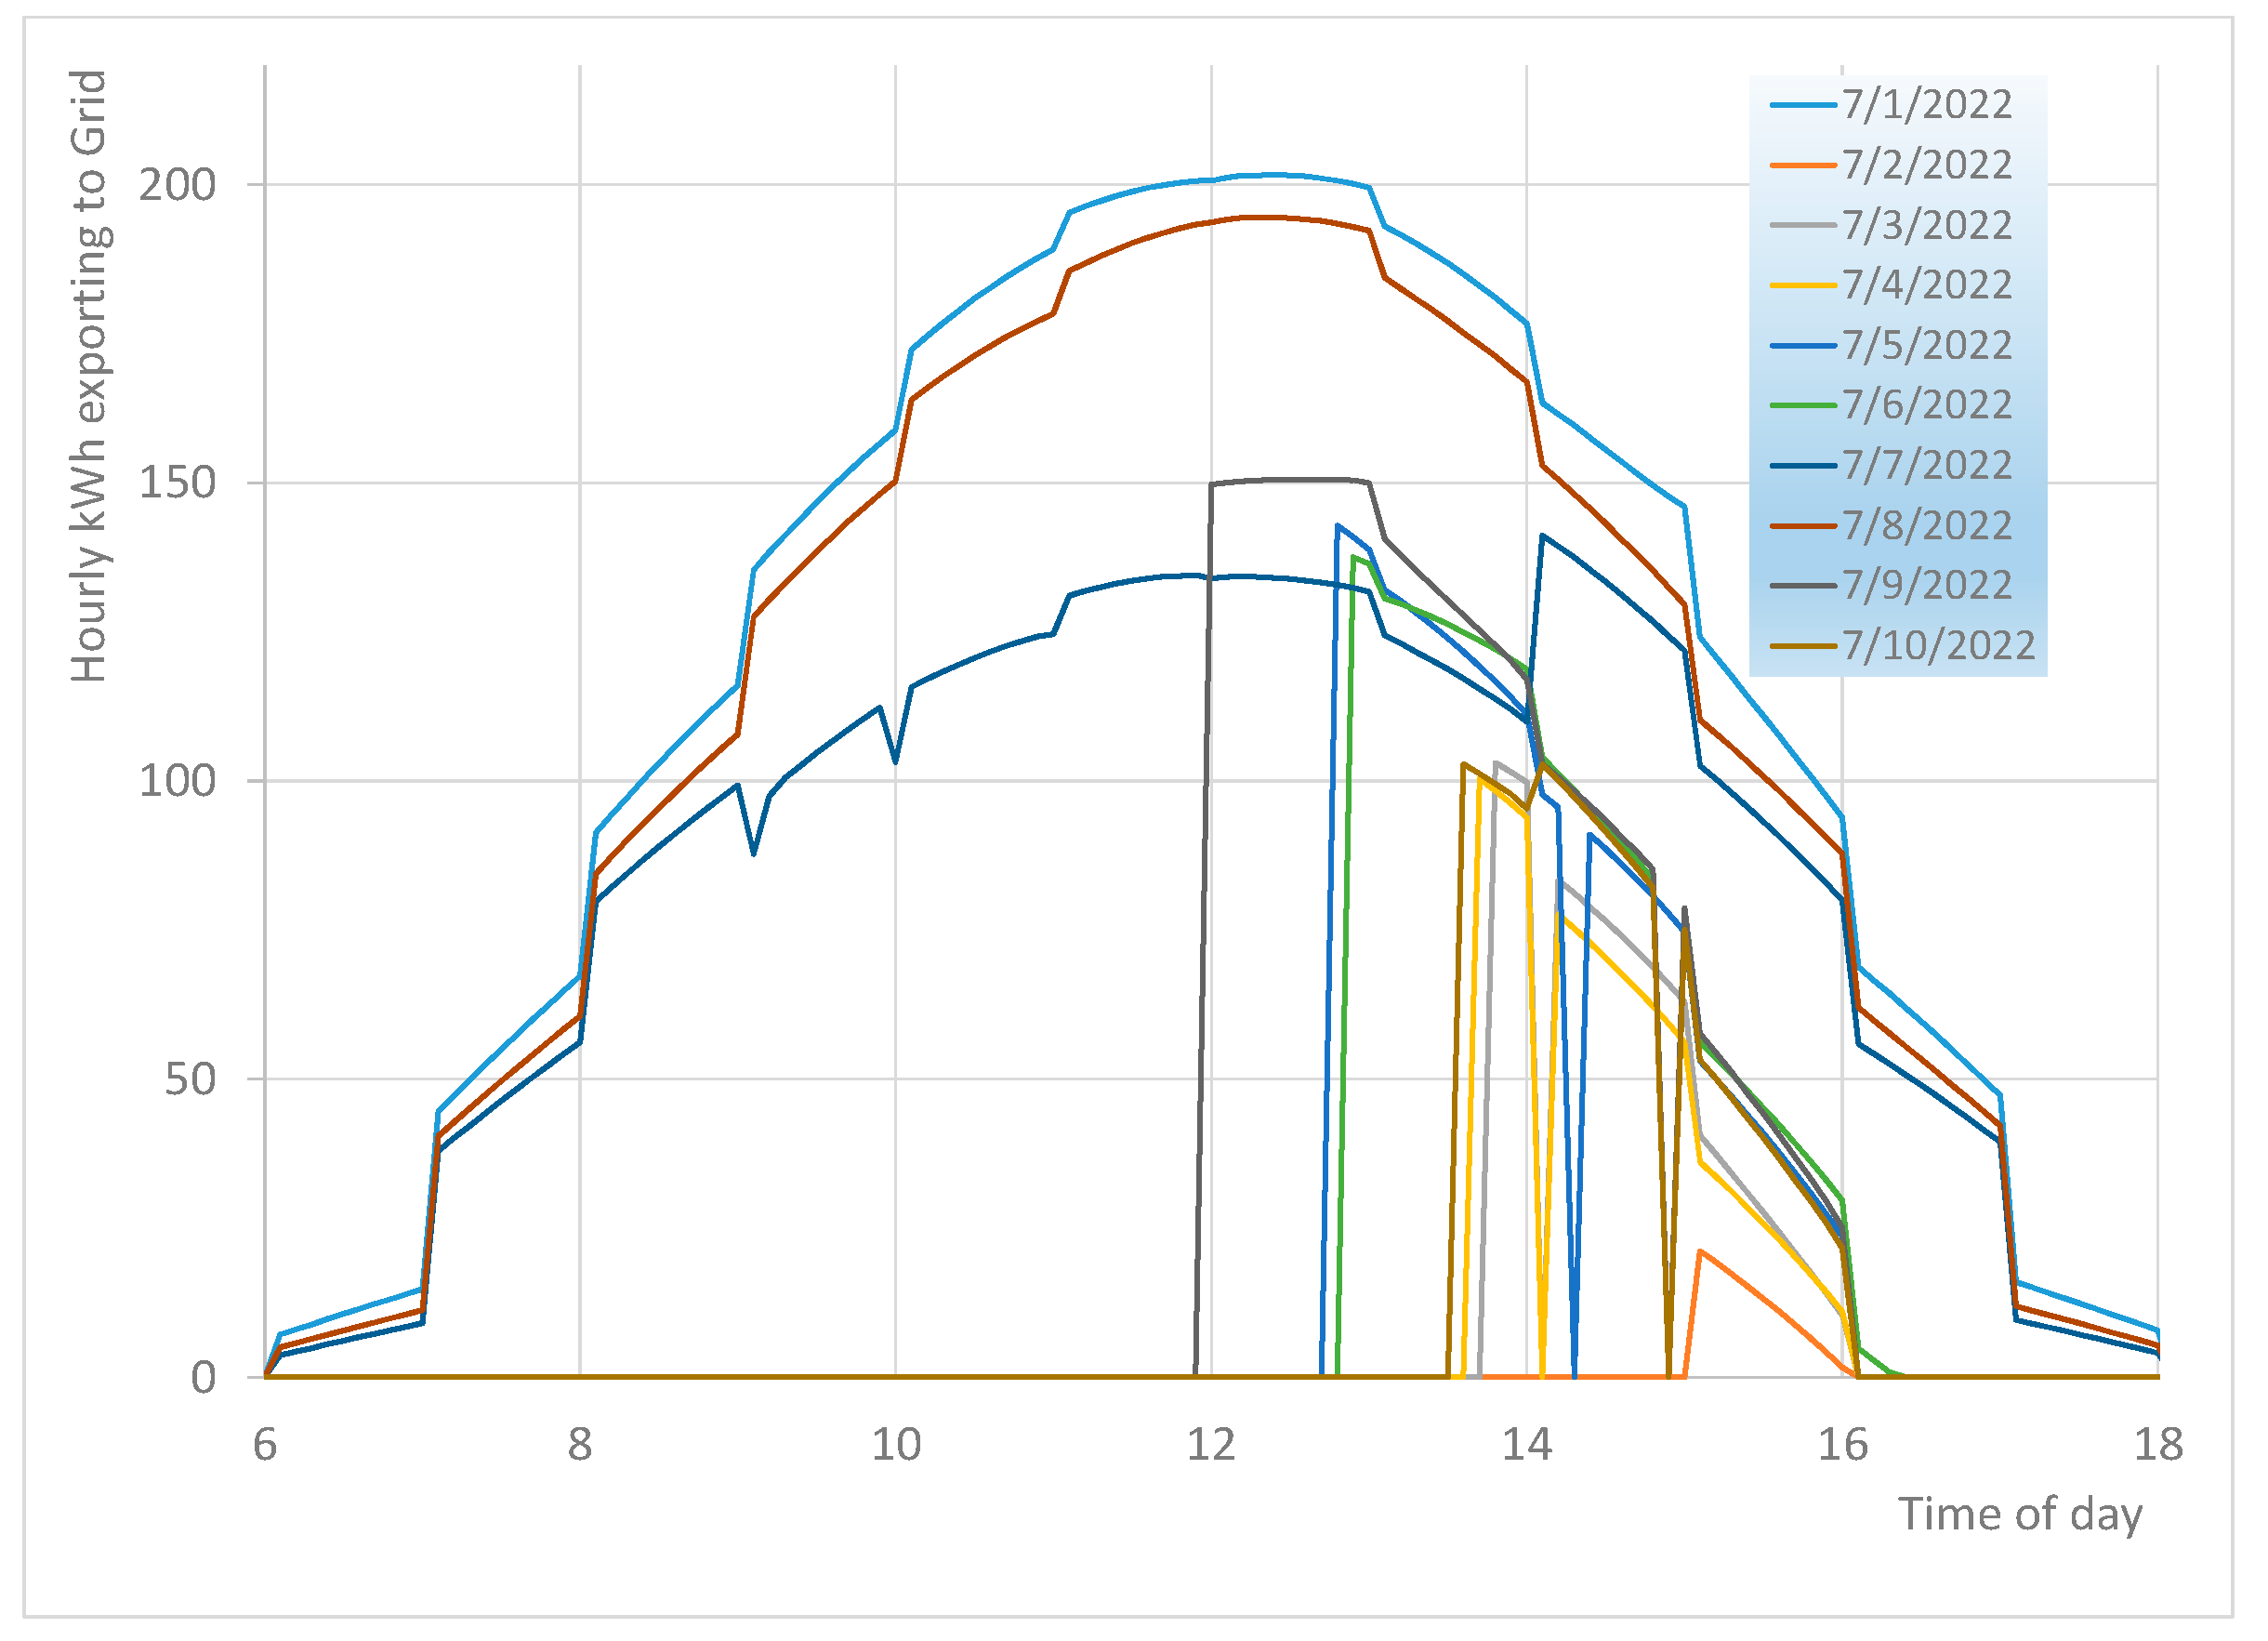
Figure 15 presents the hourly distribution of electricity exported to the grid, as computed for the first 10 days of July of the typical meteorological year. During working days, the building’s internal grid starts to export electricity after noon, which is not very favourable for the external grid to assist it in addressing the morning ramp. However, during the weekends, due to the low building energy requirements, electricity is exported from the early morning hours, as seen in
Figure 15. This is beneficial for the external grid. The same remarks can be made regarding the late afternoon ramp, which is supported to a certain extent by electricity exports during the weekend. However, electricity export during the weekdays does not generally occur after 16:00.
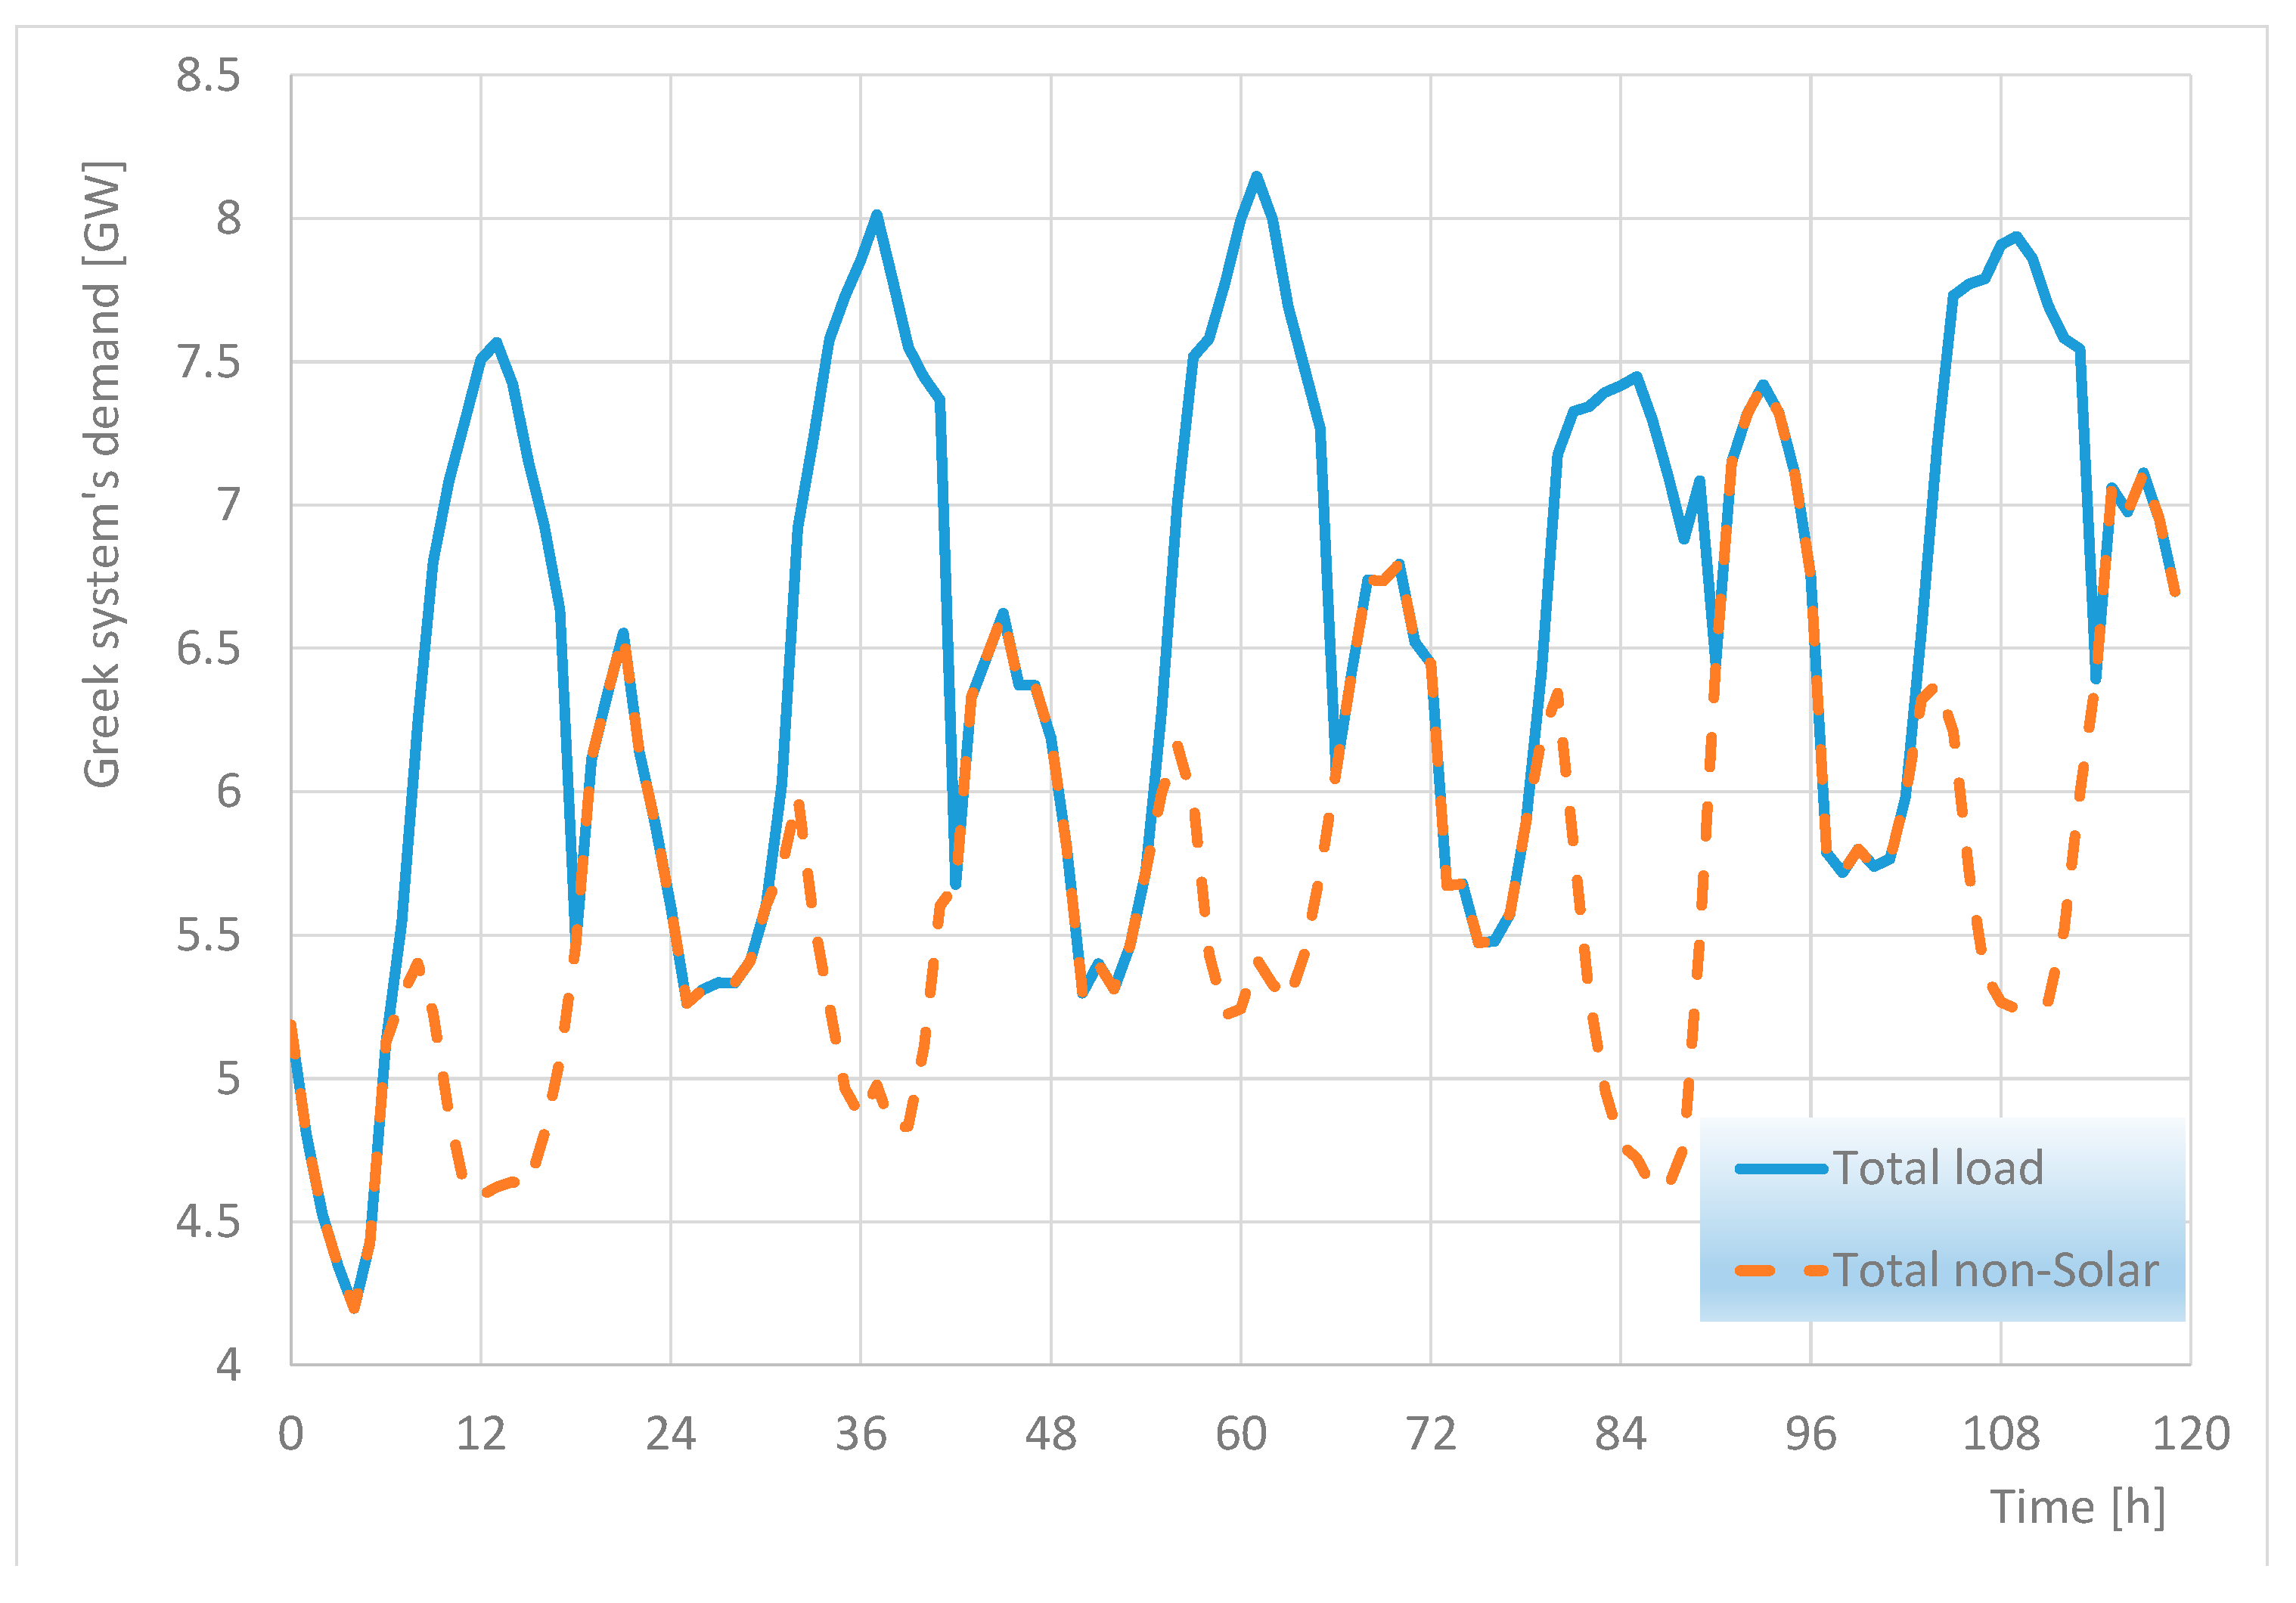
The respective performance of the Greek system during the winter highs in electricity consumption is examined in the example of
Figure 16, which presents the hourly variation in demand in the Greek system during the second week of January 2022.
The specific diagram concerns the five working days of this week. The morning ramp starts at about 6:00 h. When one subtracts the (very low in the specific time slot) photovoltaic production of the Greek system, meeting the ramp requires a total of about 3 GW units’ power to be connected and dispatched to the grid during a 4 h period. As already mentioned, the micro-grid is not capable of exporting electricity during this period. On the contrary, the micro-grid needs additional electricity to cover its internal needs during these last days of December, because the EV batteries are at a low
SOC and PV production is at relatively low levels. As seen in
Figure 17, for a similar winter period, the major part of the additional electricity is dispatched by the GenSet, which is operated for almost the whole day, at variable load levels ranging from 10% to full load.
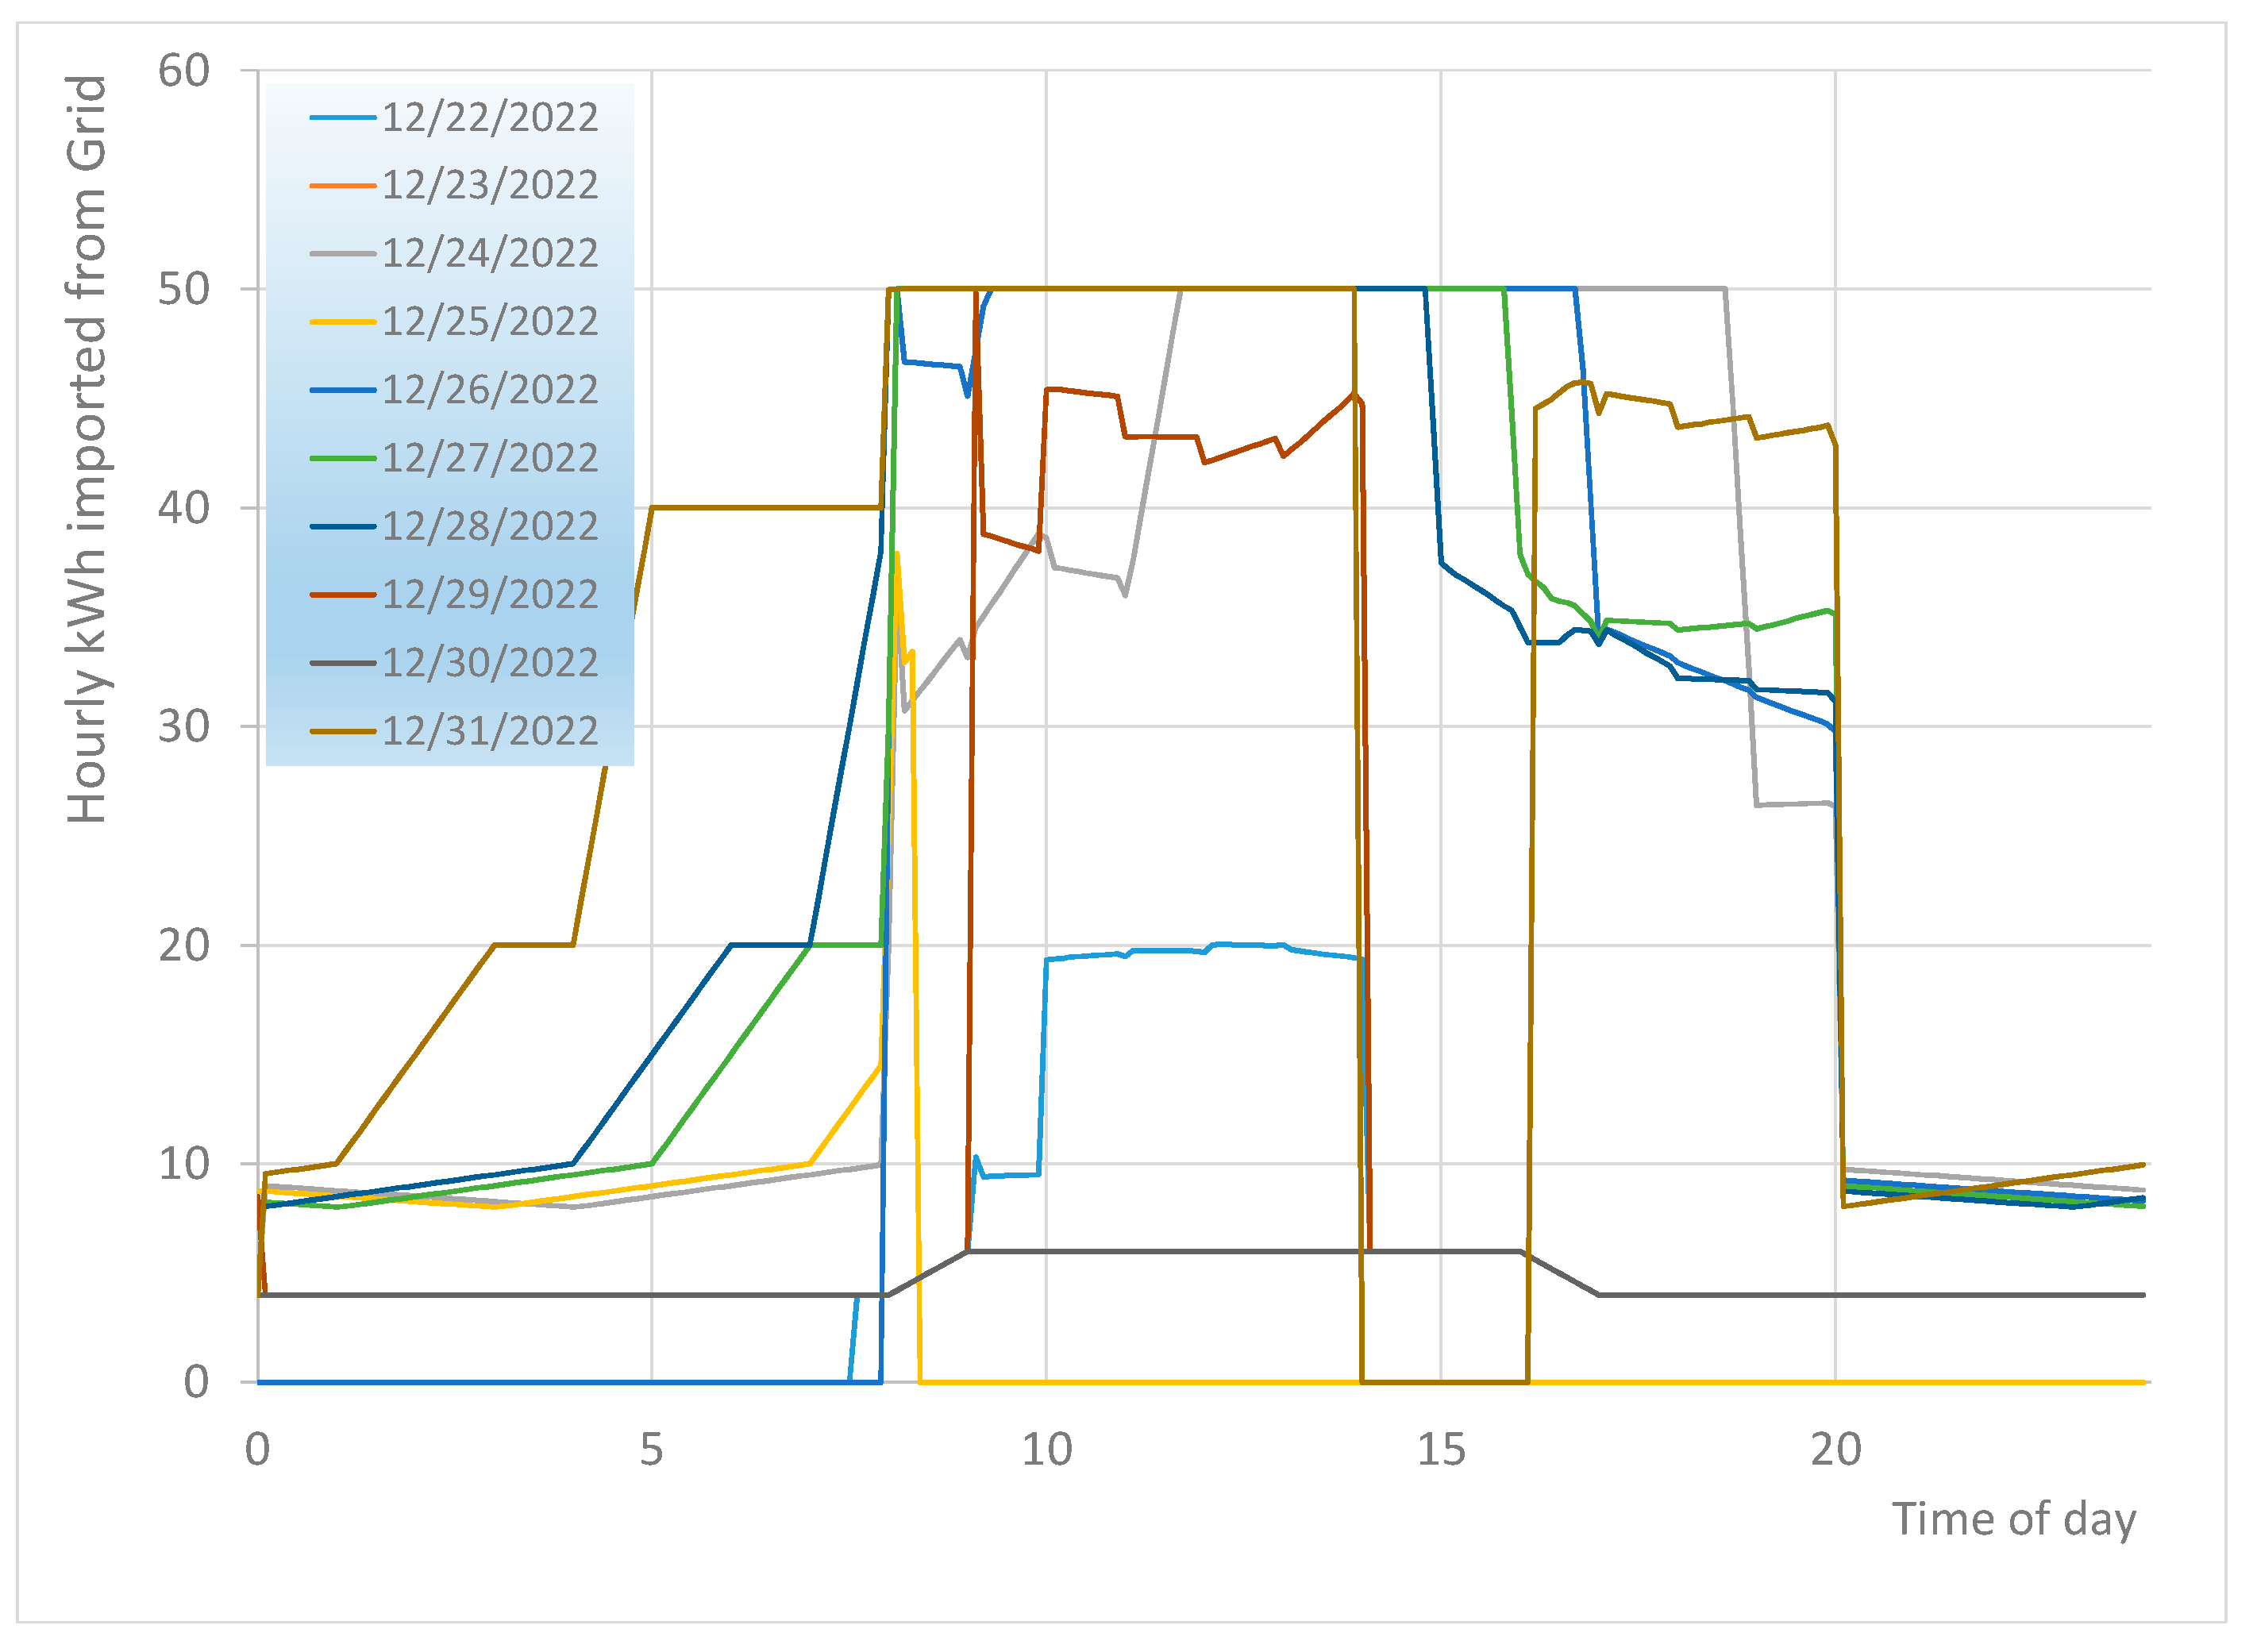
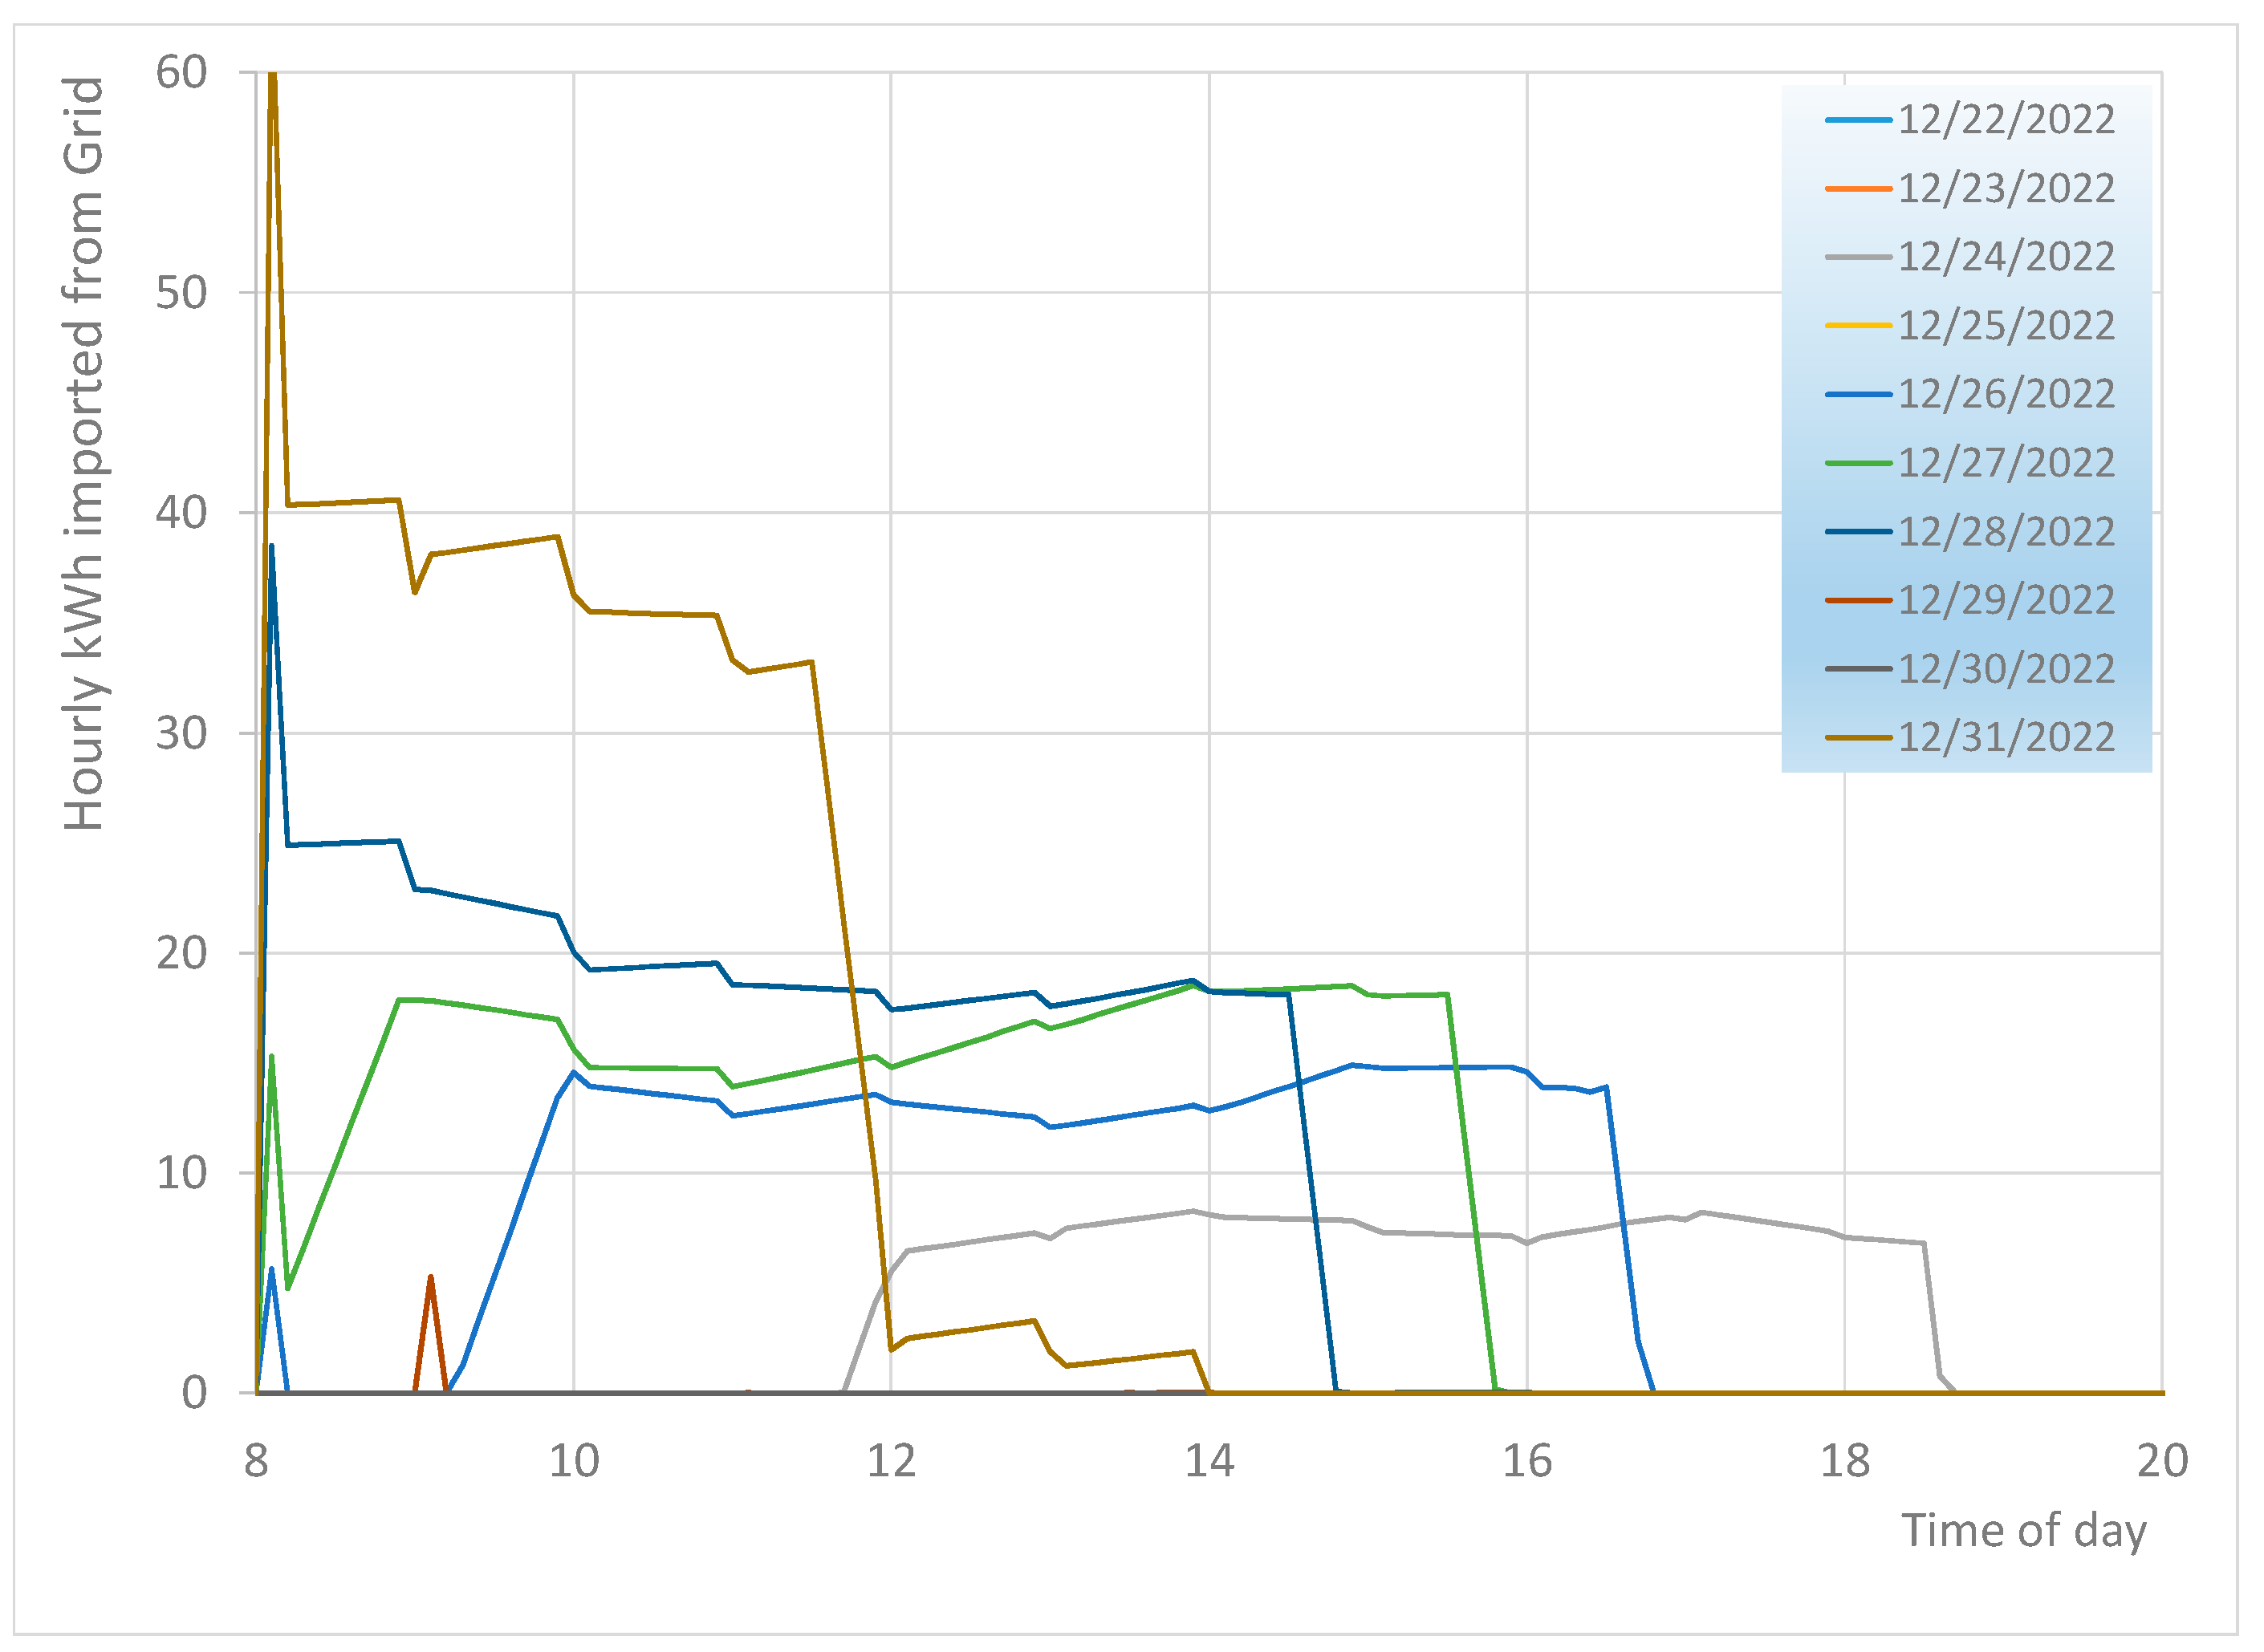
Operation at the full load of the specific GenSet cannot fully address the internal demand for a few hours on most days in this period. For this reason, it is necessary to import additional electricity from the grid during these hours. As seen in
Figure 18, the additional power imported usually does not exceed 30 kW, with the exception of the last day of the year (31.12), where a peak of 60 kW is required for a few minutes around 8:00 in the morning, and about 40 kW is required before noon.
After 12:00, the imported power levels are kept below 20 kW. As seen by a comparison with
Figure 16, this period is beyond the steep morning ramp of the Greek system for the specific period (06:00–08:00). The aforementioned results can be employed in system identification in order to support the design of a smart micro-grid to manage the interaction of the specific building’s energy system with the external grid.


