Article

Evaluation of Electric Power Quality in the Ship-Integrated Electrical Power System with a Main DC Bus and Power Semiconductor Electric Drives as Part of the Electric Propulsion Complex

1
Education and Scientific Institute of Automatics and Electrical Engineering, National University of Shipbuilding Named after Admiral Makarov, 54007 Mykolaiv, Ukraine
2
Department of Electrical Engineering, Information and Measurement Technologies, Chernihiv Polytechnic National University, 14030 Chernihiv, Ukraine
*
Authors to whom correspondence should be addressed.
Energies 2023, 16(7), 2961; https://doi.org/10.3390/en16072961
Submission received: 26 February 2023 / Revised: 18 March 2023 / Accepted: 21 March 2023 / Published: 23 March 2023
(This article belongs to the Special Issue Advances in Shipboard Power Systems)

Abstract

:
The relevance of the work is connected to the energy efficiency of specialized vessels of the technical fleet. The purpose of the study was to determine and evaluate the power quality indicators associated with the non-sinusoidal shape of the voltage and current curves in the electrical power system of the marine platform support vessel, which contains powerful semiconductor propulsion electric drives, taking into account the inherent and parasitic parameters of the power three-phase cable lines. A simplified one-line diagram of an electric power system with a DC main bus was the object of the study, which was compiled as a result of the analysis of analog systems typical for the indicated type of vessels. The phenomenon of voltage and current distortion caused by the presence of higher harmonics generated by power semiconductor converters in a three-phase ship network was the subject of the research. For the experimental study of the quality of electric power according to the simplified one-line scheme of the electric power system in MATLAB Simulink, its model was created. Based on the proven methods of calculating the ship’s electrical equipment, a methodology was developed for the reliable determination of model parameters. According to the results of the experiment in MATLAB Simulink, qualitative and quantitative indicators were obtained regarding the non-sinusoidality of the linear voltage and current of the three-phase network (curve shapes, amplitude spectra, distortion coefficients), and their comparative analysis with the current norms and standards was performed. In contrast to the previous ones, the methodology for assessing the quality of electricity in the studied electric power system takes into account its circuit, mode features, and the presence of a parasitic capacitance “phase to ground” of a three-phase network, and it can be used in solving similar non-trivial tasks for various similar structurally modified systems.

1. Introduction

Achieving a maximum efficiency of sea and inland water transport with electric propulsion complexes (EPCs) or hybrid diesel-electric propulsion complexes (HDEPCs) requires comprehensively justified decisions at the stages of their conceptual development, engineering design, implementation, testing, launch, operation, and modernization [1,2]. At each of these stages, the issues of assessing and ensuring the electric power quality (EPQ) in shipboard power systems are of key importance, as they are directly related to the issues of power losses and indirectly to issues of excess fuel consumption during its production and relevant environmental aspects [2,3,4,5,6,7,8,9].
Specialized offshore marine platform supply vessels (MPSVs) play a key role in the world’s maritime industry [1,10]. They have increased seaworthiness and a high dynamic response to external disturbances. The indicated properties are achieved, in particular, due to the combination of the principles and technologies of dynamic positioning (DP) with the concept of HDEPCs or EPCs. Generally accepted classes of vessels from DP are listed in Table 1 [2,11,12]. Such decisions are aimed at the preservation and rational distribution of resources of the ship electric power plant (SEPP) and electric propulsion installations (EPIs) with semiconductor electric drives for the main motion (SEDMMs) and semiconductor electric drives for dynamic positioning thrusters (SEDDTs).
On the MPSV with the HDEPC, the mechanical drive of the thrusters from the diesel engine is used mainly in the modes of long transitions (with sufficient power reserve) at a constant cruising speed, and the SEDMMs and SEDDPTs are mainly used in the modes of maneuvering, passing through narrows, dynamic positioning, etc. The most rational use of diesel-generator units (DGUs) of the SEPP and EPI is observed at low and medium speeds of movement. The most economic and ecological compared to all existing types are MPSVs with EPC [13,14]. In addition, avoiding direct shaft lines for the mechanical transmission to propellers from the engine room increases the robustness of their propulsion systems [15,16,17,18]. In one case or another, the nature and modes of operation of the EPI are determined by the rapidly changing modes of operation of the vessel and the external navigational environment. In the electric power systems of the vast majority of MPSVs with EPCs, all consumers, along with SEDMMs and SEDDPTs, are powered by a single network of regular generators (microgrid) [14,15]. At the same time, the installed power of the EPI correlates with the total power of other consumers in the ratio of approximately 3/1, and is close, according to the order, to that cumulatively generated in the microgrid [2]. Under such conditions and in the presence of a number of specific circumstances [2], power semiconductor converters (PSCs) [2,3,4,6] as part of the electric drives of the main motion and dynamic positioning [2] significantly affect the reduction in the electric power quality indicators (EPQIs) of the second group (characterizing the non-sinusoidal nature of the curve, asymmetry, voltage fluctuations) [2,19,20].
The efficiency of the ship electric power system (SEPS) is generally determined by the EPQ of its network. The reduction in EPQI in the SEPS and the related losses cause heavy losses in two components: electromagnetic and technological [2,21]. Both components are evaluated economically. The first is primarily determined by changes in active power losses and shortening the life of electrical equipment. The second is due to the influence of electromagnetic interference (EMI) on reducing the productivity of electrical installations close to the occurrence of failures and rejections [4,7,19,20].
In order to determine the possible risks associated with the impact of low EPQ on the ship’s performance and survivability as a whole, it is of interest to study an integrated electric power system with a DC main bus (Figure 1), which is typical for MPSVs with DP. By analogy with [17], it is expedient to carry out the research using the MATLAB model, but with a slightly different task: to estimate the EPQI in the SEPS of the MPSV, assuming the circuit and mode features of the system, as well as the cable line (CL) parameters.

2. Development of a MATLAB Model of the SEPS of the MPSV with EPC

2.1. Structure and Parameters of the SEPS of the MPSV with EPC

In the presented SEPS, the leveling of strict requirements for phase and frequency synchronization of synchronous generators (SGs) allows for removing restrictions on the fixed speed of rotation of the DGU. The conditions for the most rational fuel consumption are achieved due to the regulation of the DGU depending on the system total load. Other advantages of such SEPSs include the relatively low weight and size indicators of electrical equipment, the level of power losses, as well as the simplified integration with energy storage systems (ESSs). [22,23,24,25]. Estimated fuel savings on ships with such SEPSs when operating primary diesel engines (DEs) at optimal speeds are approximately 20–27% [26]. At the same time, ESSs allow for somewhat relieving the DGU when working in peak load modes and thus reducing mechanical and thermal stresses in the system.
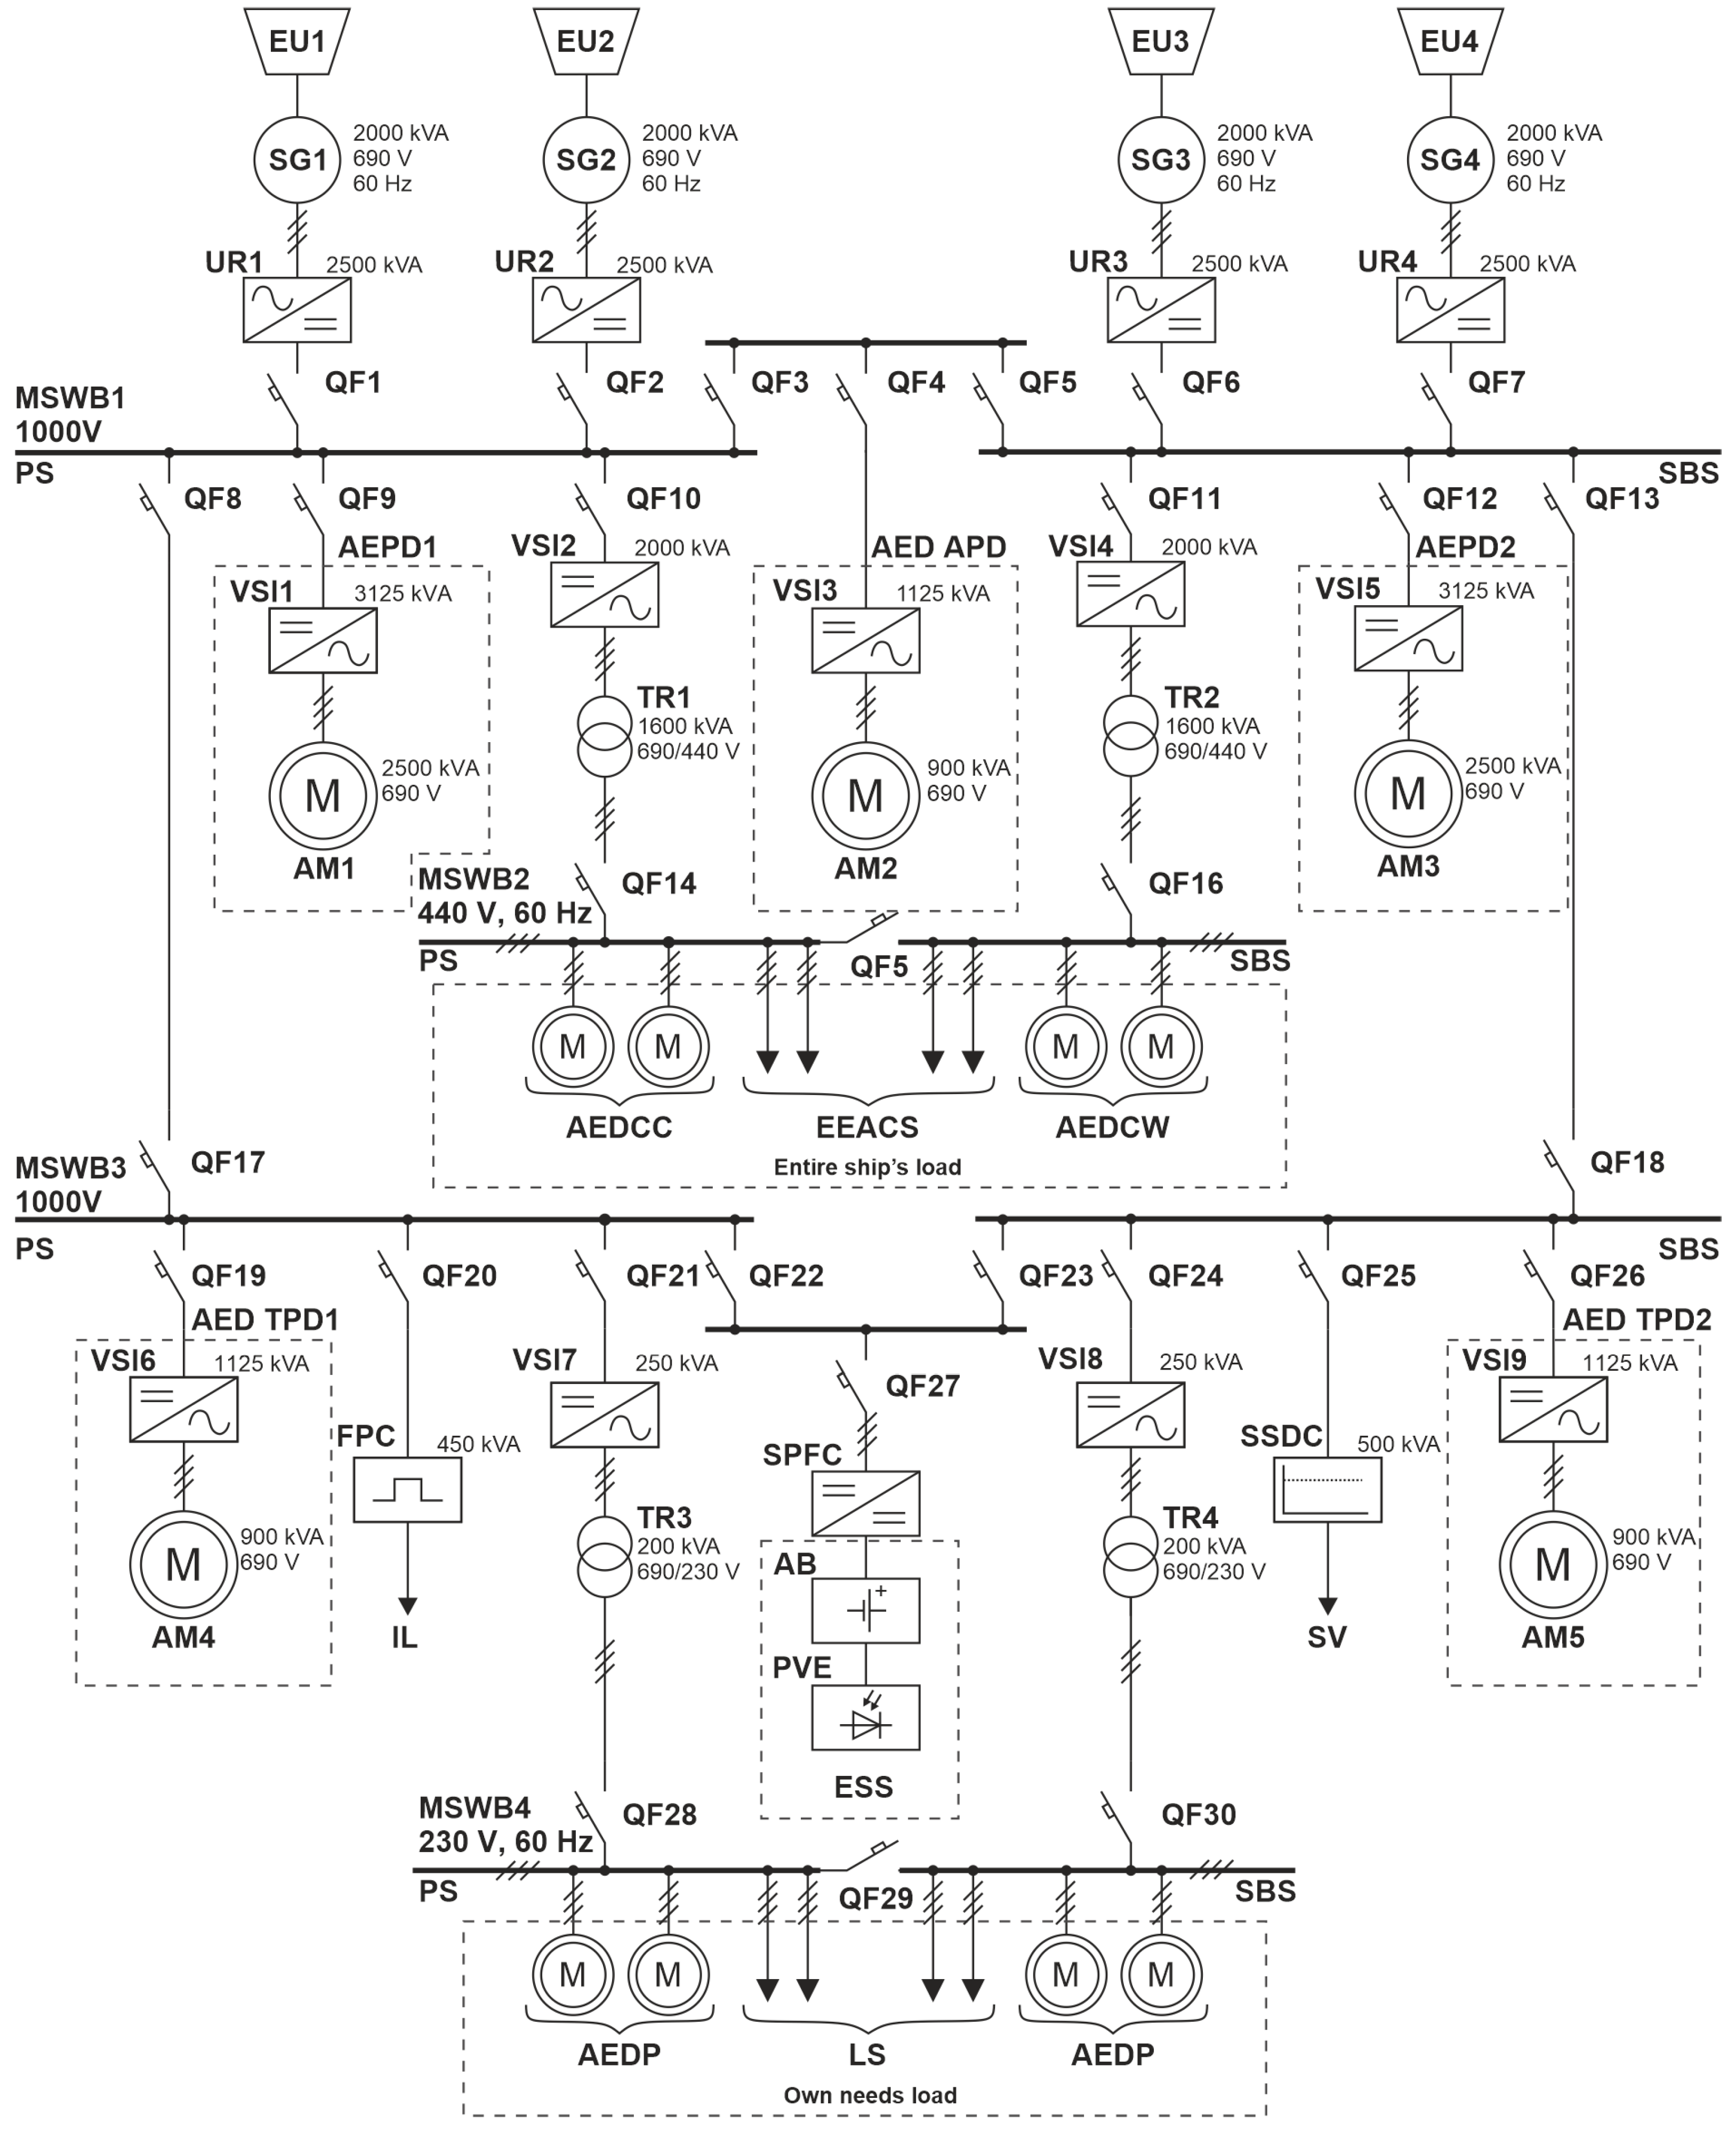
The basis of the SEPS in Figure 1 consists of DC bus systems MSWB1,3 with a nominal voltage of U L N   M S W B 1 , 3 = 1000 V and AC MSWB2,4 with linear nominal voltages of U L N   M S W B 2 = 440 V and U L N   M S W B 4 = 230 V. The power supply in the ship’s power plant is four synchronous generators (SG1-4) with an installed full nominal power of S N   SG   Σ = 4 × 2000 kVA. The linear nominal voltage of each generator is U L N   S G = 690 V.
A group of PSCs for system purposes (PSC SP1)—uncontrolled rectifiers (UR) UR1-4 with the installed full nominal power of S N   UR 1 - 4   Σ = 4 × 2500 kVA—provides DC voltage to MSWB1,3 through switches QF1,2,6,7 and QF8,13,17,18. For the AC voltage feeding MSWB2 from MSWB1 through QF10,11 and QF14,16, voltage source inverters (VSIs) with pulse width modulation (PWM)—VSI2,4 ( S N   VSI 2 , 4   Σ = 2 × 2000 kVA)—in groups with step-down transformers TR1,2 ( S N   TR 1 , 2   Σ = 2 × 1600 kVA, U L N W   TR 1 , 2 = 690 / 440 V) are used.
For the AC voltage feeding MSWB4 from MSWB3 through QF21,24 and QF28,30—VSI7,9 ( S N   VSI 7 , 9   Σ = 2 × 250 kVA)—in groups with step-down transformers TR3,4 ( S N   TR 3 , 4   Σ = 2 × 200 kVA, U L N W   TR 3 , 4 = 690 / 230 V) are used. Converters VSI2,4,7,9 in a set with transformers TR1,2,3,4 belong to the second group of PSCs SP2. The main power loads on the MSWB1 in the SEPS are the main propulsive installation based on frequency-regulated asynchronous electric propulsion drives (AEPD1,2) according to the “VSI with PWM—asynchronous motor (AM)” scheme ( S N   VSI 1 , 5   Σ = 2 × 3125 kVA, S N   AM 1 , 3   Σ = 2 × 2500 kVA) and the asynchronous electric drive (AED) with frequency control of the azimuth propulsion device (APD) according to a similar scheme with S N   VSI 3   = 1125 kVA and S N   AM 2   = 900 kVA.
The AEDs of tunnel propulsion devices (TPD1,2) ( S N   VSI 6 , 10   Σ   = 2 × 1125 kVA, S N   AM 4 , 5   Σ   = 2 × 900 kVA) are connected to MSWB3, which are similar in terms of power and schematic implementation to the previous ones. In addition to the electric drives of the thrusters, frequency pulse converters (FPCs) S N   FPC   Σ   = 450 kVA, stabilized direct current sources (SSDCs) S N   SSDC   Σ   = 500 kVA, and energy storage systems (ESSs) S N   ESS   Σ   = 750 kVA with stabilized frequency pulse converters (SFPCs) are connected to MSWB3.
Ship-wide loads (with a total capacity of S ESL   Σ   = 1250 kVA)—AED of cargo cranes (AEDCC) and AED of cargo winches (AEDCW), and electrical equipment of air conditioning systems (EEACS)—are connected to MSWB2, and self-needs loads (with a total capacity of S ONL   Σ   = 175 kVA)—AED of pumps and lighting systems (LS)—are connected to MSWB4.
The sectioning of MSWB1,3 and MSWB2,4 using switches QF3,5 and QF22,23, and QF5 and QF29, respectively, allows one to reserve the power of DGU1-4 in the case of changes in the level of loads on the buses of the corresponding boards. By using an adjustable SFPC in a complex with ESSs, based on accumulator batteries (ABs) and photovoltaic elements (PVEs), short-term stabilization of the constant voltage on the MSWB3.1 buses during transient modes of the SEPS is simultaneously achieved, as well as indirect regulation of the active/reactive power on the AC bus current of MSWB2,4 [22]. According to the scheme (Figure 1), it is possible to identify the most powerful consumers in the SEPS of the MPSV, which are listed in Table 2 with their main operation modes.

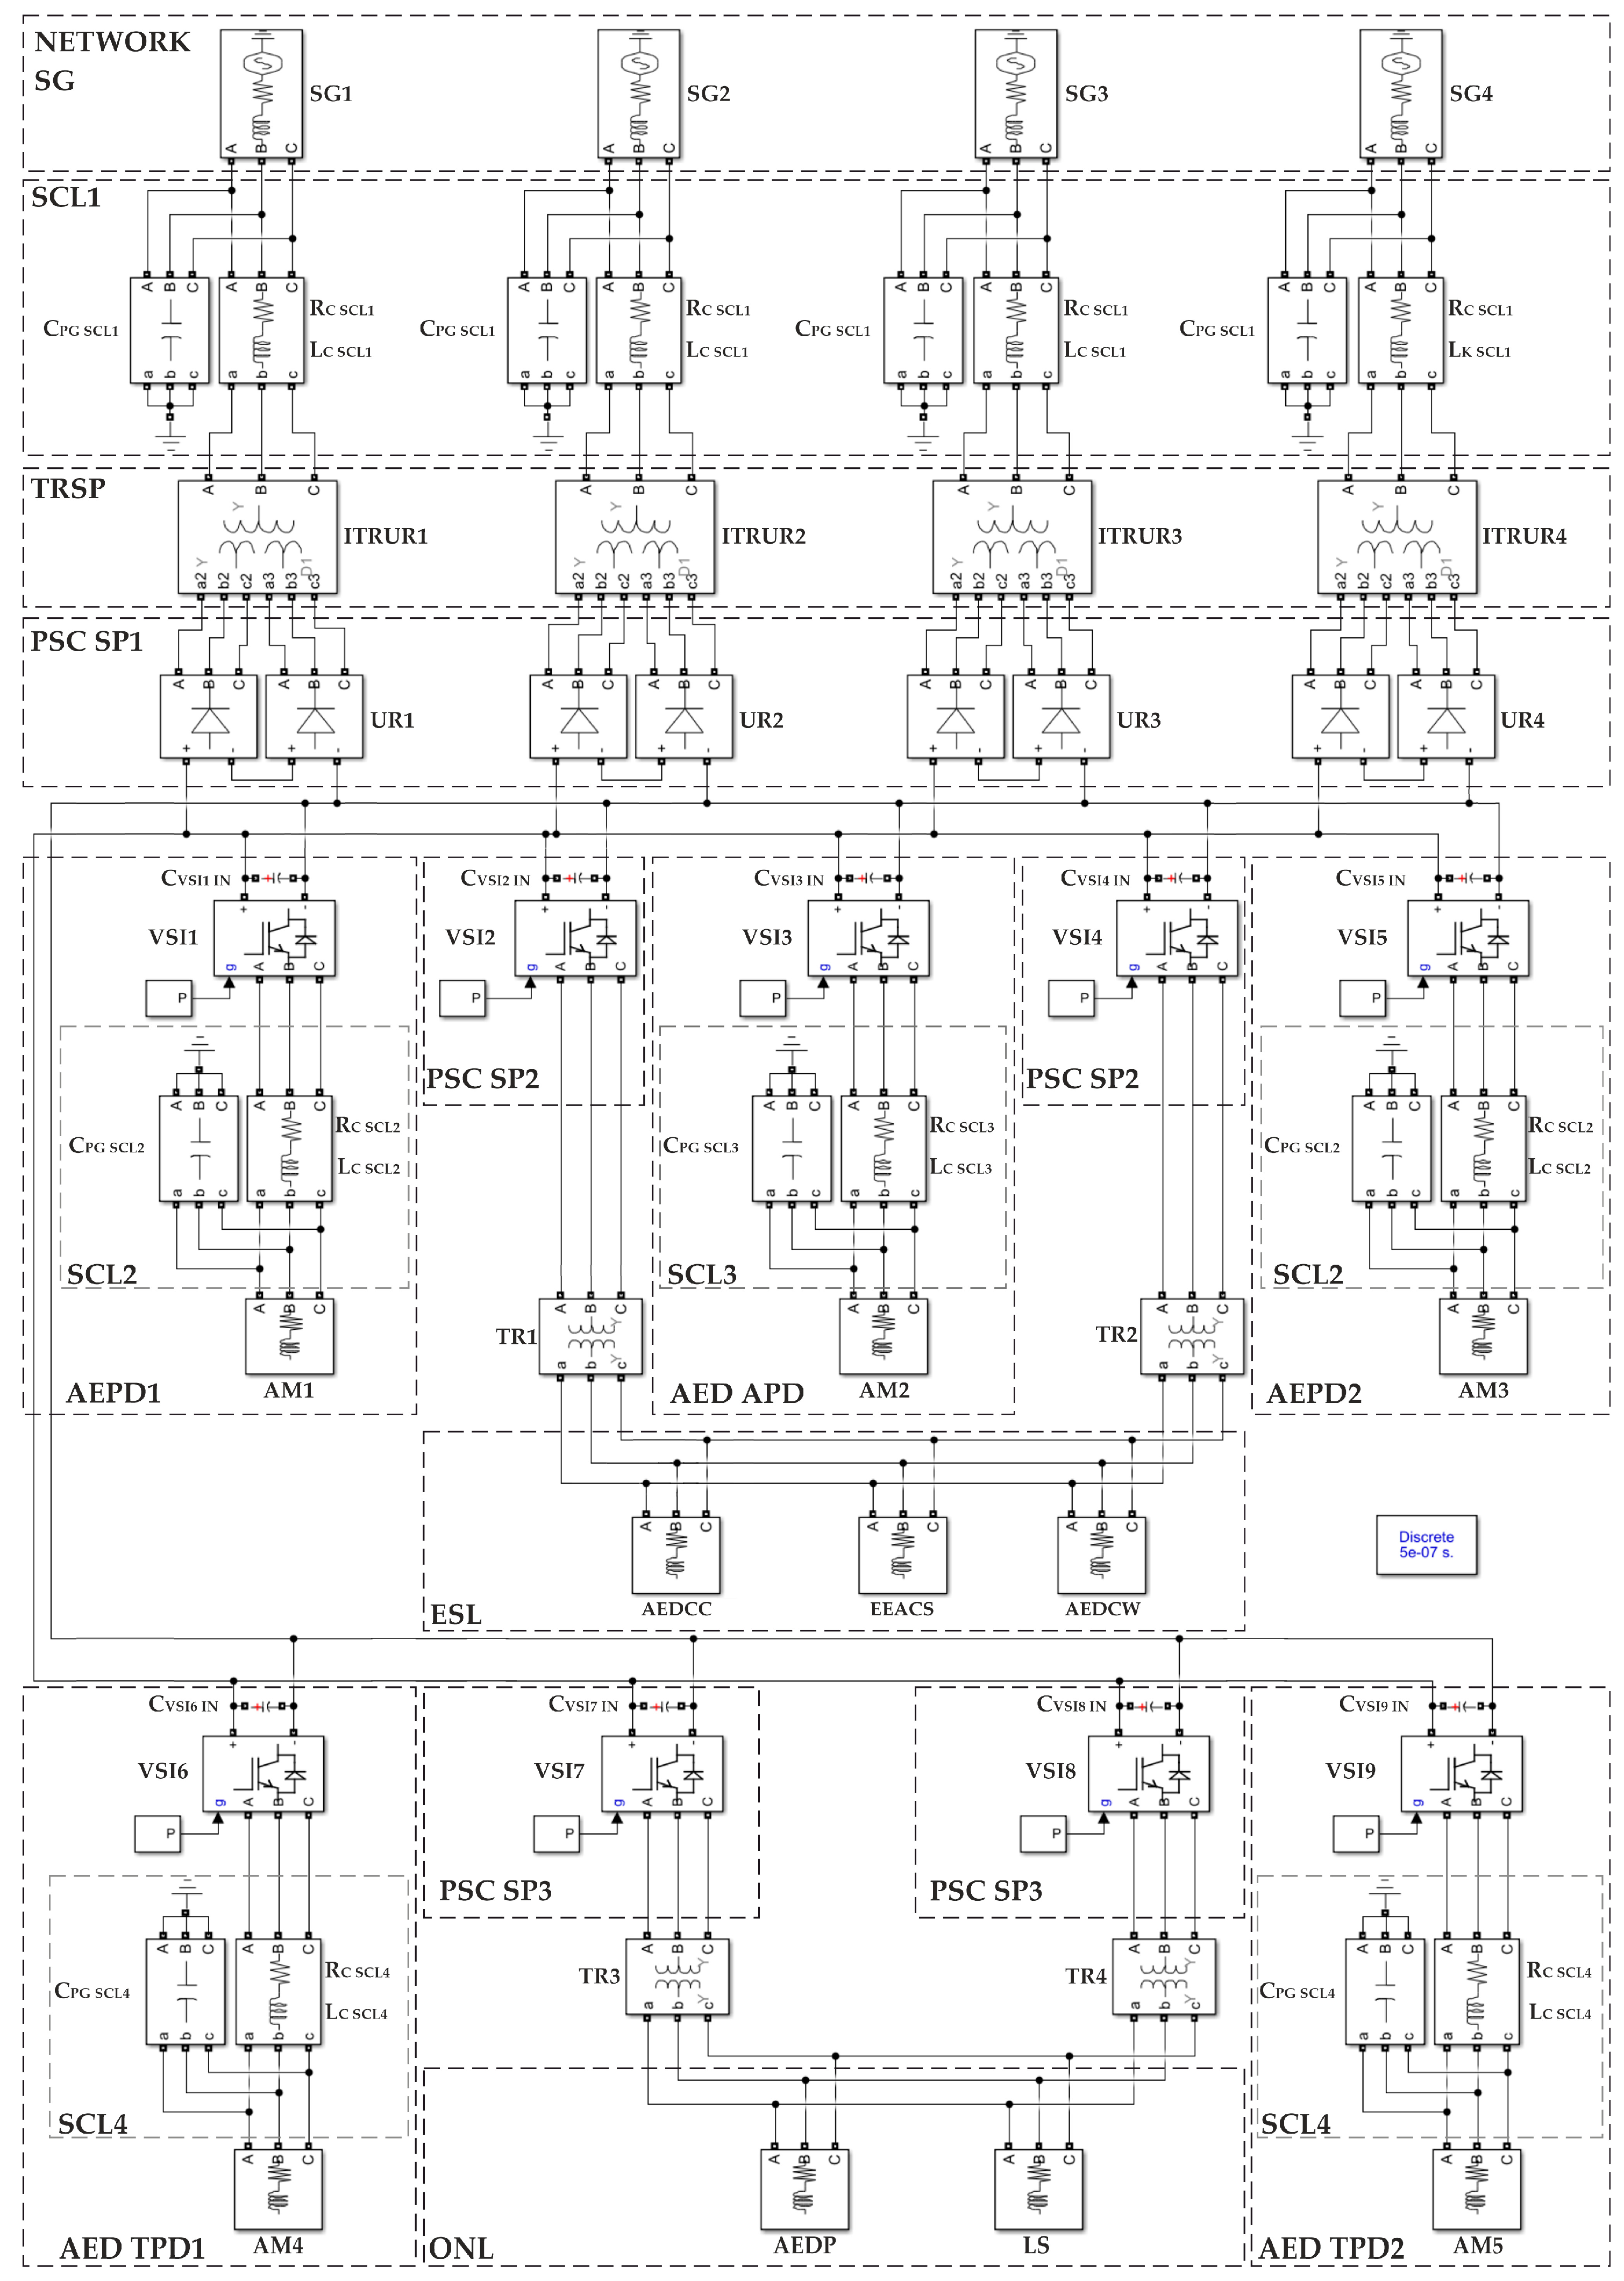
2.2. SEPS Model Structure of the MPSV with EPC and Methodology for Derivation of Its Parameters

For the analysis of EPQI in the electric power system of the MPSV, according to the diagram in Figure 1, a MATLAB model is developed, which is shown in Figure 2.
Emphasis in this work is focused on the study of the influence of the most powerful power semiconductor converters in the propulsion electric drives of ships with dynamic positioning on the electricity quality indicators, related to the non-sinusoidal shape of the voltage and current curves of the SEPS. Therefore, the insignificant effect of the converters, which are part of the radio communication and radio navigation complex and have several orders of magnitude less power, is neglected. The corresponding low-power SSDC and pulse converters are shown among consumers in the single-line scheme of the SEPS (Figure 1), but in the MATLAB model (Figure 2), they are not taken into account.
Based on the SEPS scheme (Figure 1), the following parameters of a single SG for the model are chosen: full nominal power S N   S G = 2000 kVA, nominal linear voltage U L N   S G = 690 V, and output voltage frequency f S G = 60 Hz. As a basic version of the generator, the MARELLI Generator MJBM630-SC8 (SG clear-pole, 4 pairs of poles, 900 rpm) is taken [27]. In Figure 2, SGs are represented by identical “3-phase voltage source” blocks. According to their reference data, the power factor cos φ = 0.8 is chosen, as well as super-transitional resistances along the longitudinal and transverse axes, respectively, x d = 0.15 hp and x q = 0.15 hp [21,28]. The nominal active and reactive powers of SG are:
P N   S G = S N   S G cos φ = 1600   kVA ,   Q N   S G = S N   S G P N   S G = 400   kVA .
The phase voltage of generators is U P N   S G = U L N   S G / 3 = 400 V. The inductive resistance, inductance, and active resistance of each SG are determined as follows, respectively [21]:
X L   S G = 3 U P N   S G / 2 S N   S G x d + x q = 0.036   Ohm ;
L S G = X L   S G / 2 π f S G = 9.47 10 5 H ;   R S G = 0.1 X L   S G = 3.57 10 3   Ohm .
Sections of cable lines (SCL1) from the network of generators SG1-4 to PSC1-4 of system purposes in Figure 2 are shown as “Three-phase series RLC branch” blocks. Based on the technical indicators of the MPSV (typical project), the length of the specified sections equal to 12 m is chosen [1]. The linear current in SCL1 is determined by the ratio:
I L N   S C L 1 = P N   S G / 3 U L N   S G η cos φ .
Accepting the efficiency coefficient of the cable efficiency η = 0.98 and taking into account that cos φ = 0.8 [21], from (1), we obtain I L N   S C L 1 = 1700 A. As a basic option, for SCL1, a 3-phase shielded cable LKSM-HF FLEX 0.6/1 kV 3 × 185 mm2 [29] is chosen with a nominal current of I C   N = 300 A. Taking into account the calculated value I L N   S C L 1 , it is assumed that each SG in the scheme (Figure 2) is connected to the corresponding one by an input step-down transformer of an UR (URT) by 6 phase-parallel-connected sections of the mentioned type of 3-phase cable, each 12 m long. Taking into account [28], we can write down the ratio for determining the parameters of SCL1 cables, which are included in the SEPS model (Figure 2). The ratios for calculating the active, inductive resistance (Ohm) and the inductance of cables (H) in the composition of SCL1 have the following forms:
r C   S C L 1 = r 1 M l C   S C L 1 n S C L 1 ;
X L C   S C L 1 = X L 1 M l C   S C L 1 n S C L 1 ;
L C   S C L 1 = X L C   S C L 1 2 π f ,
where r 1 M and X L 1 M are active and inductive resistances of 1 m of cable, respectively, reduced to one phase, Ohm/m [28,29]; l C   S C L 1 is the length of the section SG to URT, m; n S C L 1 is the number of parallel sections of the cable on section SG to URT; f = f S G is the generator voltage frequency, Hz.
According to the conditions of electrical installation and electrical safety [
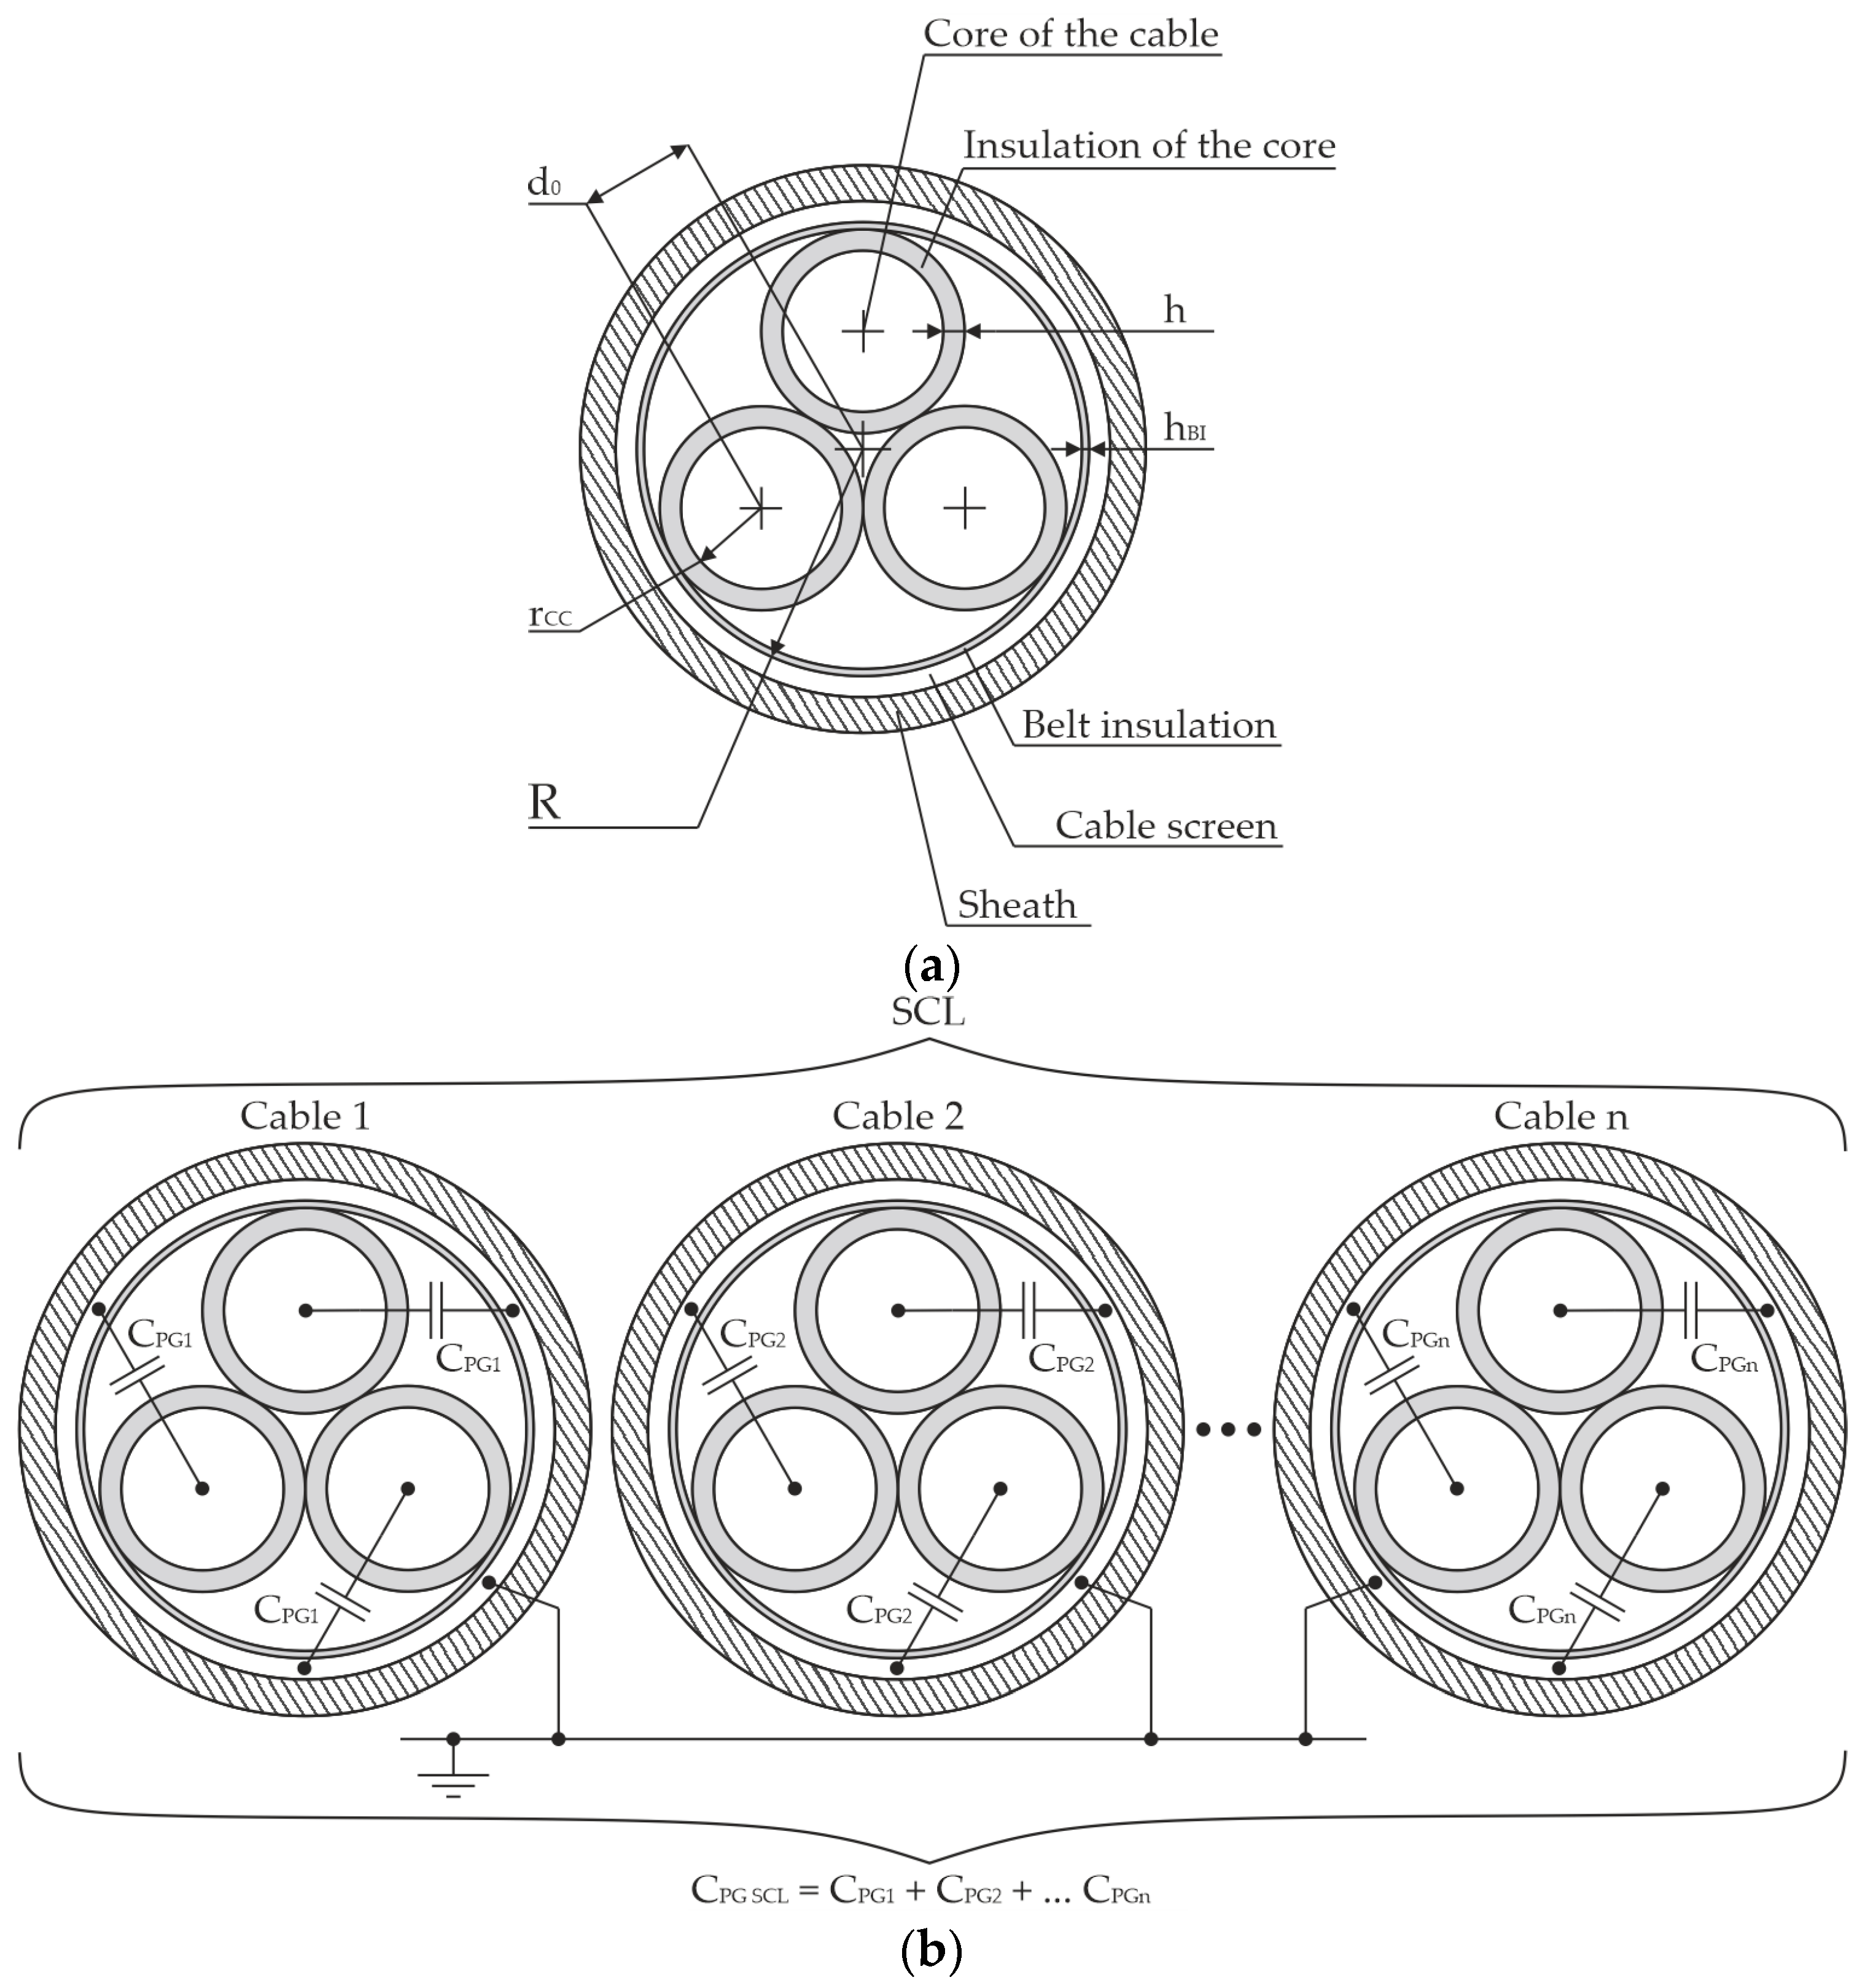
30], the shield provided by the design of LKSM-HF FLEX 0.6/1 kV 3 × 185 mm2 has a galvanic connection with the ship’s hull. The running capacity “phase to ground” (F/m) of such a cable is determined by the ratio [30]:
C S C   P G = 0.056 ξ 10 9 ln R 6 d 0 6 / 3 R 3 d 0 2 r C C ,
where ξ —dielectric constant of insulation; R —radius of the inner surface of the screen, mm; d 0 —distance between the longitudinal axis of the cable and the axis of the core, mm; r C C —core radius of the HF FLEX 0.6/1 kV cable 3 × 185 mm2, mm;
d 0 = 2 r C C + h / 3 ;
R = d 0 + r C C + h + h B I ,
where h —cable core insulation thickness, mm; h B I —belt insulation thickness, mm;
r C C = S C C π ,
where S C C —cross-sectional area of the cable, mm2.
Taking [30] into account, for our conditions, the “phase-to-ground” capacitance of SCL1 (F) between SG and URT is determined by the ratio:
C P G   SCL 1 = C S C   P G n S C L 1 l C   S C L 1 .
The model also takes into account sections of cable lines between power semiconductor converter (VSI) EPCs and asynchronous motors as part of the AGED1,2, AED APD, and AED TPD1,2, respectively: SCL2—75 m (VSI 1.5-AM1.3), SCL3—45 m (VSI 3-AM2), and SCL4—55 m (VSI 6,9-AM4,5). A typical design of a 3-phase power shielded cable is shown in Figure 3a. Parasitic capacitances of the “phase-to-ground” section of the cable line are shown in Figure 3b. Based on (1) the ratio for the linear current (A) in each section:
I L N   S C L 2 = P N   VSI 1 , 5 / 3 U L N   VSI 1 , 5 η cos φ ;
I L N   S C L 3 = P N   VSI 3 / 3 U L N   VSI 3 η cos φ ;
I L N   S C L 4 = P N   VSI 6 , 9 / 3 U L N   VSI 6 , 9 η cos φ ,
where P N   VSCI 1 , 3 , 5 , 6 , 9 —nominal active powers of VSI 1,3,5,6, and 9, respectively; η = 0.98 ; cos φ = 0.8 .
Assuming P N   VSI = S N   VSI cos φ and according to the scheme (Figure 1), S N   VSI 1 , 5 = 3125 kVA, S N   VSI 3 , 6 , 9 = 1125 kVA, and U L N   VSI 1 , 3 , 5 , 6 , 9 = 690 V, from (10) to (12), we have I L N   S C L 2 = 2670 A, I L N   S C L 3 = 960 A, and I L N   S C L 4 = 960 A.
Taking into account the nominal values of the linear currents for switching VSIs and AMs on SCL2,9, phase-parallel-connected sections of the LKSM-HF FLEX 0.6/1 kV 3 × 185 mm2 ( I C   N = 300 A) are chosen, and on SCL3 and SCL4—5 sections of the LKSM-HF FLEX 0.6/1 kV 3 × 95 mm2 cable connected in phase-parallel are chosen ( I C   N = 200 A) [29]. In the same way to determining the parameters of SCL1 cables, it is possible to obtain ratios for SCL2,3,4.
Based on (2)–(4), the active, inductive resistance and inductance of the cables in the composition of SCL2,3,4 are as follows:
r C   S C L 2 = r 1 M l C   S C L 2 n S C L 2 ;   r C   S C L 3 = r 1 M l C   S C L 3 n S C L 3 ;   r C   S C L 4 = r 1 M l C   S C L 4 n S C L 4 ;
X L C   S C L 2 = X L 1 M l C   S C L 2 n S C L 2 ;   X C   S C L 3 = X L 1 M l C   S C L 3 n S C L 3 ;   X C   S C L 4 = X L 1 M l C   S C L 4 n S C L 4 ;
L C   S C L 2 = X L C   S C L 2 2 π f ;   L C   S C L 3 = X L C   S C L 3 2 π f ,   L C   S C L 4 = X L C   S C L 4 2 π f ,
where r 1 M and X L 1 M —active and inductive resistances of 1 m of cable (according to the type selected for SCL), respectively, reduced to 1 phase, Ohm/m; l C   S C L 2 , l C   S C L 3 , and l C   S C L 4 and n S C L 2 , n S C L 3 , and n S C L 4 —lengths (m) and the number of parallel sections of cable in the corresponding areas, respectively; f = f V S I 1 = f V S I 3 = f V S I 5 = f V S I 6 = f V S I 9 —output frequency of the PSC EPC, Hz.
Based on (9), the “phase-to-ground” capacity of SCL2-4 is determined by the ratios:
C P G   SCL 2 = C S C   P G n SCL 2 l C   SCL 2 ;   C P G   SCL 3 = C S C   P G n SCL 3 l C   SCL 3 ;   C P G   SCL 4 = C S C   P G n SCL 4 l C   SCL 4 ,
where C S C   P G = C S C   P G and C S C   P G is determined from (5) by taking into account ξ , R , d 0 , and r C C for the cable LKSM-HF FLEX 0.6/1 kV 3 × 95 mm2 in the respective areas.
In the MATLAB model (Figure 2), dual-bridge 12-pulse Urs as part of the PSC SP1 group are implemented on the basis of the “Universal bridge (Diodes)” blocks with phase-shifting three-winding transformers URTs (Figure 2) on the basis of the “Three-phase transformer (Three Windings)” blocks with the “Y-Y-Δ” windings connection.
Taking into account [21,31], the active, inductive resistance (Ohm) and inductance (H) of the URT for our case are determined as follows:
—For “Y” windings connection:
R Y   ITRURw = 0.1 U L N   ITRURw 2 U S C   ITRUR S N   ITRUR ;   X L Y   ITRURw = U L N   ITRURw 2 U S C   ITRUR S N   ITRUR ; L Y   ITRURw = X L Y   ITRURw 2 π f ;
—For “Δ” windings connection:
R Δ   ITRURw = 0.3 U L N   ITRURw 2 U S C   ITRUR S N   ITRUR ;   X L Δ   ITRURw = 3 U L N   ITRURw 2 U S C   ITRUR S N   ITRUR ;   L Δ   ITRURw = 3 X L Δ   ITRURw 2 π f ;
S N   ITRUR —full rated power of the transformer, VA; U LN   ITRURw —linear nominal voltage of the transformer winding, V; U SC   ITRUR —transformer short-circuit voltage, hp.
VSIs with PWM as part of the PSC SP2,3 and EPC groups (AGED1,2, AED APD, AED TPD1,2) in the model scheme are implemented according to a 3-phase bridge scheme based on “Universal Bridge (IGBT/Diodes)” blocks with external control from the PWM signal generator—the “PWM Generator (2-level)” block. In VSI blocks with PWM, 2-level voltage modulation is used with frequency f V S I   P W M = 2000 Hz.
The input capacitances (F) of VSIs with PWM1-9 are determined by the ratio of [32]
C V S I   IN = U d   V S I   IN τ 3 r PL   VSI Δ U C   V S I   I N 1 ln 2 ,
where U d   V S I   I N ( 6 2 U L N   ITRURw 21 ) / π —rectified voltage at the input of the VSI (at the output of the 12-pulse UR in the composition of PSC SP 1 [33]), V; Δ U C   V S I   IN 0.1 U d   V S I   I N —allowable voltage increase on the input capacitor VSI, V; τ = L P L   V S I / r P L   V S I —time constant of the load cycle VSI, c ( L P L   V S I —load phase inductance, H; r PL   V S I —active resistance of the load phase, Ohm) [32].
r P L   VSI = Z P L   VSI cos φ .
The total resistance of the load phase (Ohm) is determined by the ratio:
Z P L   VSI = r P L   VSI 2 + X L P L   VSI 2 = U N P L   VSI / I N P L   VSI .
The voltage (V) and current (A) in the VSI phase have the form:
U N P L   VSI = U d   VSI   I N M 2 ;   I N P L   VSI = S N   VSI 3 U N P L   VSI ,
where M —VSI modulation index; S N   V S I —full power of VSI, VA.
The inductive resistance (Ohm) and phase inductance (H) of the VSI are:
X L P L   VSI = Z P L   VSI 2 r P L   VSI 2 ;
L P L   VSI = X L P L   VSI / 2 π f U   VSI   OUT .
Groups of step-down 3-phase transformers with “Y-Y” windings of system purposes TR1,2 and TR3,4 are implemented in the model based on the “Three-phase transformer (Two Windings)” blocks. By analogy with (17), the active, inductive resistance (Ohm) and inductance (H) of the transformer winding are determined by the ratios:
R TRw = 0.1 U L N   T R w 2 U S C   T R S N   T R ;
X L   TRw = U L N   T R w 2 U S C   T R S N   T R
L TRw = X L   TRw 2 π f
where S N   T R —transformer full nominal power, VA; U LN   TRw —transformer winding linear nominal voltage, V; U SC   TR —transformer short-circuit voltage, hp.
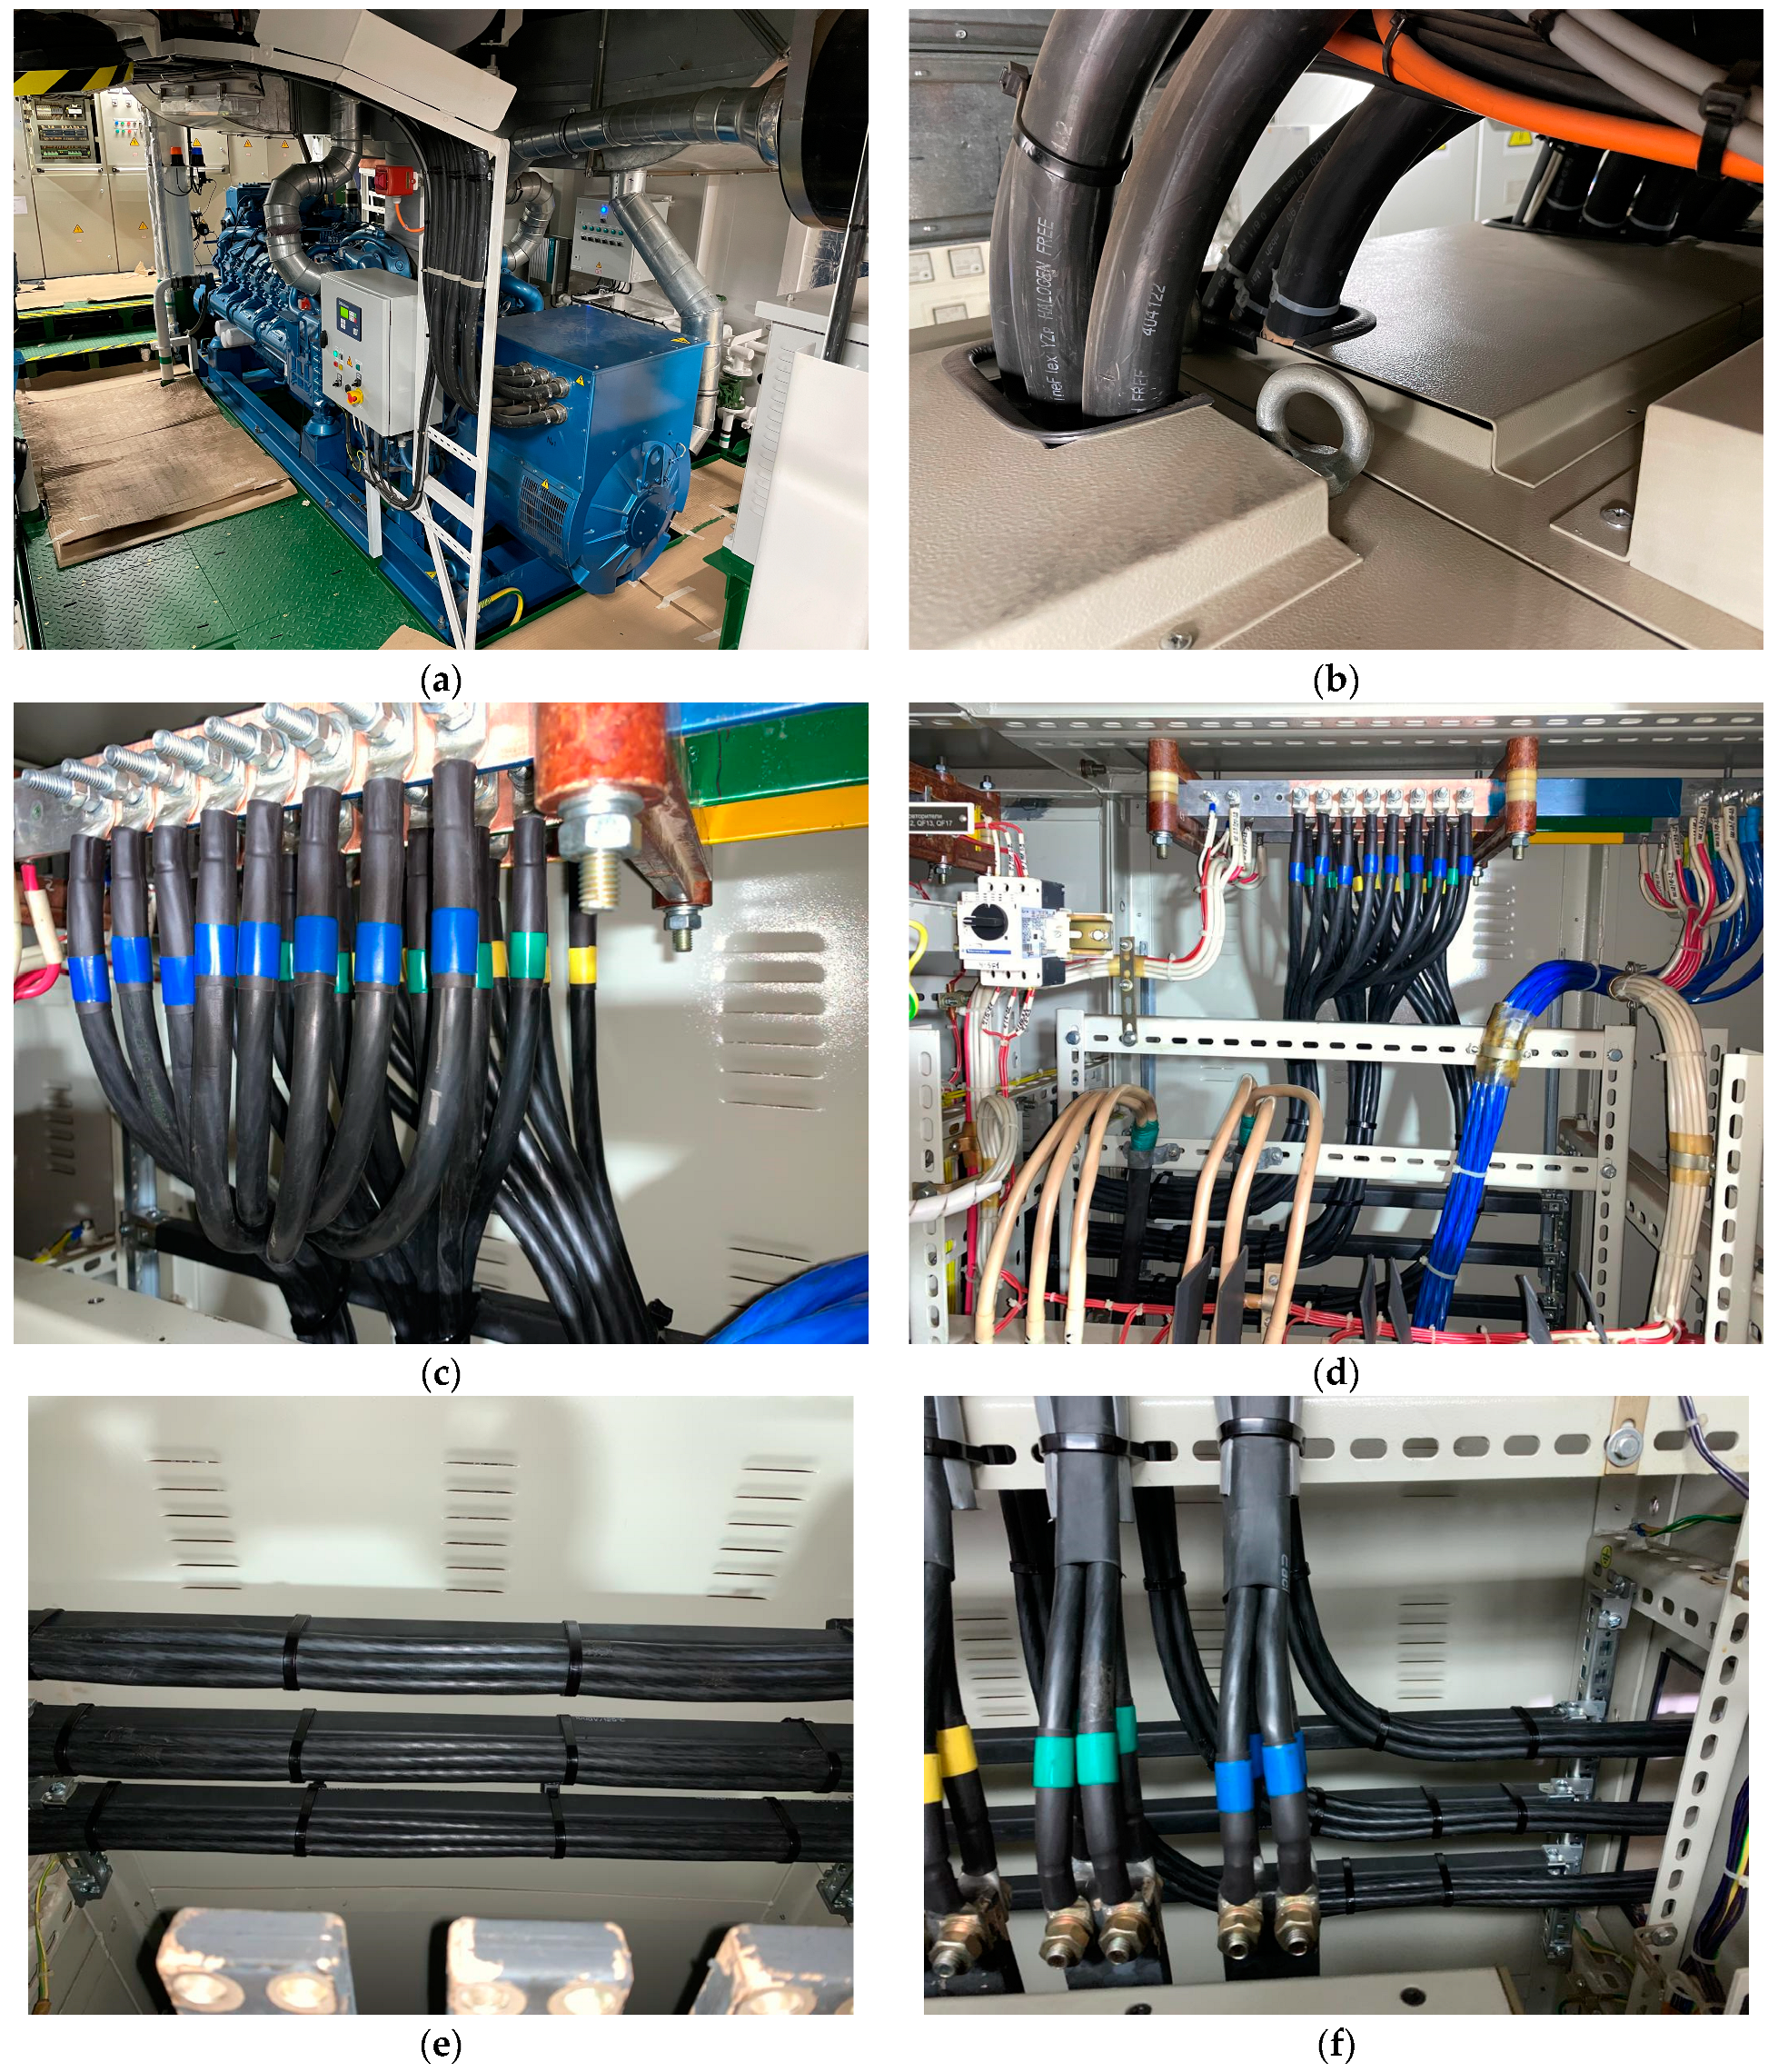
For better understanding, Figure 4 shows external cable connections of Ukrainian-made power electrical equipment (designed and built in Mykolaiv) for vessels.

3. Results

The methodology for determining the parameters of the basic blocks of the MATLAB model (Figure 2), which is proposed in the paper (point Section 2.2), is based on proven methods of calculating electrical equipment and is adapted to specific tasks related to the study of EPQIs in the SEPS of the MPSV, taking into account the parasitic capacitance “phase to ground” of power cable lines (PCLs).

3.1. Calculation of the MATLAB Model Parameters for SEPS of MPSV According to the Improved Methodology

Numerical results regarding the determination of the model parameters are obtained by taking into account the actual ratings of the electrical equipment of the SEPS of the MPSV (Figure 1), passport, and reference information.
For SCL1-4 based on (2)–(4), (6)–(8), (9), and (13)–(16) with LKSM-HF FLEX 0.6/1 kV 3 × 185 mm2 ( S C C = 185 mm2, R = 23.96 mm, d 0 = 12.36 mm, r C C = 7.7 mm), LKSM-HF FLEX 0.6/1 kV 3 × 95 mm2 ( S C C = 95 mm2, R = 19.21 mm, d 0 = 9.81 mm, r C C = 5.5 mm), r 1 M = 0.125 10 3 Ohm/m, and X L 1 M = 0.073 10 3 Ohm/m [28], ξ = 2.3 2.8 (accepted 2.5), h = 3 mm, and h B I = 0.9 1 mm (accepted 0.9 mm) [30] for both cables; the results are shown in Table 3. The voltage frequency for all segments is f = f S G = f V S I 1 , 3 , 5 , 6 , 9 = 60 Hz.
For the primary winding w1 (connection “Y”) and secondary windings w21 and w22 (connection «Y», «Δ») URTs based on (17) and (18) at S N   U R = 2500 kVA and U S C   I T R U R = 0.05 hp, the results are shown in Table 4.
Input capacitances of VSIs with PWM based on (19) with M = 0.78 and f U   VSI   OUT = 60 Hz: C V S I 1 , 5   IN = 16 , 540 10 6 F; C V S I 3 , 6 , 9   IN = 5953 10 6 F; C V S I 2 , 4   IN = 10 , 580 10 6 F; C V S I 7 , 8   IN = 1322 10 6 F. For primary windings w1 (connection “Y”) and secondary windings w2 (connection “Y”) of step-down transformers TR1,2 and TR3,4 (Figure 1) based on (25)–(27) for S N   T R 1 , 2 = 1600 kVA, S N   T R 3 , 4 = 200 kVA, U S C   T R 1 , 2 = 0.05 hp, and U S C   T R 3 , 4 = 0.05 hp, the results are shown in Table 5.

3.2. The Modeling Results for EPQI Assessment in the SEPS of MPSV in MATLAB Simulink

The SEPS of MPSV modeling was performed to determine the characteristics of the line voltage and current generated by the SG VSI as part of the PSC EPC, on MSWB1,2,3,4 in the time and frequency domains in order to estimate the EPQI in the corresponding sections in operating modes 1–4 of the system. Graphical simulation results for the most indicative (in terms of SEPS loading) mode 1 are shown in Figure 5, Figure 6, Figure 7, Figure 8, Figure 9, Figure 10, Figure 11 and Figure 12. The numerical results of model measurements for all modes (1–4) are summarized in Table 6.
The analysis of the modeling results for the EPQ assessment in SEPSs (Figure 1) revealed that in all considered modes 1–4, the linear voltage and current SG1-4, U L   SG and I L   SG (Figure 5a), are non-sinusoidal ( К N U   SG 1 4 = 5.08 % 6.65 % , К N I   SG 1 4 = 8.48 % 10.30 % , respectively) as a result of the impact of PSC SP1 (UR1-4) (Figure 1 and Figure 2) on the spectra of U L   S G ν and I L   S G ν , respectively.
From Figure 5a–c and Table 6 (for all modes), it is obvious that the values of К N U   SG and К N I   SG are lower than the values of К N U   UR and К N I   UR , respectively, at the inputs of UR1-4, which in turn are in the ranges of К N U   UR 1 4 = 7.22 % 9.47 % and К N I   UR 1 4 = 24.47 % 26.20 % , respectively. This fact is explained by the effect of the inductance of three-winding power transformers UR1-4 with resistance X L   ITRUR on the reduction in harmonics generated in the network by uncontrolled rectifiers U L   U R ν and I L   U R ν with the orders ν = p k ± 1 , where p is the pulse rate of the rectifier and k = 0 , 1 , 2 , 3 . Figure 7a shows the current I Л   Н В , consumed by UR1-4, which has a form corresponding to the presence of a significant capacity in the load. In this case, these are the capacitors at the input of VSI1-4 with PWM C V S I 1 - 5 , 7 , 8   IN . The shape of the voltage on MSWB2 U L   MSWB 2 (Figure 9a) is determined by the output voltage of VSI2,4 with PWM (for the modes 1–4 К N U   M S W B 2 = 84.88 % 88.68 % ). At the same time, the form of the current І L   MSWB 2 MSWB2 (Figure 9a) is near to sinusoidal due to the significant inductance in the transformers TR1,2 with the inductive resistances X L   T R 1 , 2 .
MSWB4 (Figure 10a) has the shapes of linear voltage and current, U L   MSWB 4 and I L   MSWB 4 , respectively, which are similar to those of MSWB2.
Analysis of linear voltage AM1,3 U L   AM 1 , 3 as part of the AGED and linear voltage AM2 U L   AM 2 as part of the AED APD, respectively, from Figure 11a and Figure 12a, indicates their forms, typical for the power supply from VSI1,5 and VSI3 with PWM. The shapes of linear current AM1,3 I L   AM 1 , 3 and linear current AM2 I L   AM 2 are close to sinusoidal due to the significant self-inductance of asynchronous motors with inductive resistances X L   AM 1 , 3 and X L   A M 2 , respectively.
In modes 1–4 for voltages and currents AM1.3 and AM2 (Figure 11a–e and Figure 12a–e, respectively), there are the following boundary distributions of non-sinusoidal coefficients: К N U   A M 1 , 3 = 122.06 % 123.42 % , К N I   A M 1 , 3 = 6.31 % 6.32 % , К N U   A M 2 = 98.13 % 98.22 % , and К N I   A M 2 = 6.32 % 6.33 % , respectively.
The analysis of the amplitude spectra U L   A M 1 , 3 ν and U L   A M 2 ν shows that the greatest contribution to the formation of values К N U   A M 1 , 3 and К N U   A M 2 makes the highest harmonic components in the frequency range of 0–6 kHz (Figure 11b and Figure 12b). However, in Figure 11d and Figure 12d, in the ranges of 390–420 kHz (for U Л   A Д 1 , 3 ν ) and 570–600 kHz (for U L   A M 2 ν ), there are spikes of amplitudes at frequencies close to resonance in CLs, which add their percentage to the final values of К N U   A M 1 , 3 and К N U   A M 2 .
According to the diagram (Figure 2), it is clear that the resonances in CLs between VSIs with PWM and AMs are caused by the presence of resonant circuits formed by their own inductances L C   SCL 2 , 3 and parasitic capacitances C P G   SCL 2 , 3 . The analysis of the I L   A M 1 , 3 ν and I L   A M 2 ν spectra (Figure 11c,e and Figure 12c,e) shows that the largest amplitudes of the harmonics are in the range of 0–6 kHz. At higher frequency, the amplitudes drop to zero. It should be noted that U L   A M 1 , 3 and U L   A M 2 shapes in Figure 11a and Figure 12a testify to the presence of significant (about 1.5 times) high-frequency pulse overvoltages due to wave processes in CL between VSIs with PWM and AMs. The reasons for this phenomenon are: high switching frequency of the semiconductor valves of the VSI with high current and voltage growth rates ( d i / d t and d u / d t , respectively); the presence of a “phase-to-ground” parasitic capacitance of CL, C PG   SCL 1 , 3 and C P G   SCL 2 ; the discrepancy in the values of wave resistances of VSIs with PWM (voltage source) and AMs (voltage sink)— Z V S I   PWM and Z A M , respectively [34,35]. Regular overvoltages of such a level and nature in practice usually lead to accelerated thermal aging of the stator winding’s insulation and, accordingly, to the AM service life reduction (by about 50%) [34,35]. In addition, the voltage fluctuations U L   A M 1 , 3 and U L   A M 2 in Figure 11a and Figure 12 are caused by the parasitic capacitances of the power cables. Moreover, the range of oscillations U L   A M 1 , 3 in SCL2 between AM1,3 and VSI1,5 is noticeably larger, compared to SCL3 between AM2 and VSI3. This is due to the difference in cable designs, their length, and the “phase-to-ground” parasitic capacitance: SCL2 ( l C   SCL 2 = 75 m, C PG   SCL 2 = 7.04 10 8 F) and SCL3 ( l C   SCL 3 = 45 m, C PG   SCL 3 = 2.13 10 8 F).

4. Discussion

The integrated DC systems on ships have attracted considerable attention from researchers, manufacturers, and operators due to the unique innovative opportunities in their application. Thus, a high energy efficiency of the ship as a whole is achieved with a simultaneous emissions reduction, as the sources of electricity production (diesel generators) are separated from consumers by the main DC bus and can operate at an optimized frequency of rotation depending on the load.
The DINA STAR support vessel of the MYKLEBUSTHAUG offshore platform with an ABB propulsion system was the first to have a DC main bus. The basis of such an architecture is the SG-UR-VSI system with PWM-AM, in which almost the entire flow of electricity produced by generators passes through semiconductor converters that distort the forms of currents and voltages. Therefore, a general condition for the successful operation of integrated SEPSs with the main DC bus is the assessment and provision of electric power quality indicators and electromagnetic compatibility (EPQ and EMC) with the solution of relevant theoretical issues. Today, this topic is considered in a limited number of works [36,37,38,39,40,41,42].
In [4], generalized analytical expressions and graphic dependences were obtained for determining non-sinusoidal indicators of SG voltages and currents in the low-frequency region, as well as the power factor of the UR-VSI system with an idealized capacitive smoothing filter. The specified results were obtained on the basis of some simplifications and assumptions and therefore did not take into account the number of essential modes, structural, and parametric features of integrated ship DC systems.
A distinctive feature of the presented research is the consideration of the following factors that have a decisive influence on EPQ and EMC in real integrated ship DC systems:
  • Features of operating modes;
  • A consolidated structure containing a large number of sources and consumers of electricity, including the propulsion complex and general ship loads;
  • Intrinsic parameters of cable lines, primarily “phase-to-ground” capacitances, which cause additional voltage distortions and resonance phenomena in the high-frequency region of the spectrum;
  • The high order of differential equations embedded in the MATLAB Simulink model makes it possible to reliably describe the processes in the system with a proportionality of generated and consumed power.
The specified approach made it possible to create an adequate model of an integrated ship system with a propulsive complex and perform model experiments in MATLAB to study EPQ indicators under typical operational modes. In the future, the main results of the research can be used in the development of effective means of ensuring EMC conditions at common connection points (CCPs) of system elements, taking into account the influence of parasitic capacitances of cable lines.
The EPQI assessment was performed in the following frequency ranges:
  • Low frequency—0–2 kHz;
  • Intermediate—2–9 kHz;
  • High frequency—9–150 kHz;
  • High frequency—150 kHz–30 MHz.
It should be noted that harmonics standards exist only for the first (IEC 6100; IEEE 519; IEEE 1547), third, and fourth (CISPR 14; CISPR 15) ranges indicated above. In the first range, both voltage and current harmonics are normalized, and in the third and fourth—only voltage harmonics. In the first range, non-sinusoidal indicators are defined as harmonic coefficients (individual and integral—THD) as a percentage of the main. In the third and fourth bands, harmonic levels are determined in dB. An amplitude of 1 μV is taken as zero decibels. For the second range, there are currently no standards [40].
Discussing the main results of the model experiment and their novelty, it is necessary to consider in more detail the EPQIs that relate to certain groups of elements in the system: SG, EPC, SWL, and LON.
Corresponding results regarding SG are presented for the most indicative mode 1 in Figure 5 and Table 6. Thanks to the use of the 12-pulse UR scheme, the voltage and current of the generator, whose shape is close to sinusoidal, do not contain harmonics of orders 5, 7, 17, 19, 29, and 31, …. Integral indicators THD U   SG 1 4   К N U   SG 1 4 and THD I   SG 1 4   К N I   SG 1 4 of harmonics of the generator voltage and current are 6.1% and 9.2%, respectively, at an SG load of 84.4% of nominal. In the spectra (especially current) of SG, there is an intense decrease in harmonic amplitudes with increasing frequency, so the specified spectra are almost entirely contained in the low-frequency range.
The modeling results analysis (Figure 9, Table 6) shows that low-frequency and intermediate-range harmonics (0–9 kHz) cause the determining influence on the integral indicators THD U   M S W B 2   К N U   M S W B 2 and THD I   M S W B 2   К N I   M S W B 2 of general ship consumers in the absence of significant “phase-to-ground” parasitic capacitance. Thus, as the frequency increases, there is a gradual harmonics amplitude decrease, and in mode 1, the highest values are reached by THD U   M S W B 2   К N U   M S W B 2 of the voltage on the MSWB2 buses (88.7%) and THD I   M S W B 2   К N I   M S W B 2 of currents consumed by the MSWB2 load (5.97%).
Similar results have been obtained from the EPQI study of consumers of their own needs, connected to MSWB4 with a short cable with negligible “phase-to-ground” parasitic capacitance (Figure 10, Table 6). The forms of the corresponding voltages and currents and the nature of their spectra are similar to those obtained for general ship consumers; therefore, the values of integral indicators in mode 1 are quite close to the previous ones: THD U   M S W B 4   К N U   M S W B 4 = 84.8 % ; THD I   M S W B 4   К N I   M S W B 4 = 5.7 % .
On the other hand, the EPQI, the nature of the processes, and the voltage and current spectra of the AM1,3 and AM2 engines as part of the asynchronous electric drives of the propulsive complexes differ significantly due to the influence of the “phase-to-ground” parasitic capacitance of long cable connections (Figure 11 and Figure 12).
For example, for AM1,3 and AM2, it is in the fourth high-frequency range that a resonant increase in voltage harmonics is observed, respectively, at frequencies of about 408 kHz and 582 kHz. The amplitudes of the specified harmonics reach 160 V and 50 V, i.e., 164 dB and 154 dB, respectively, which significantly exceed the permissible standards [43]. The maximum values of AM1,3 and AM2 voltage harmonics in the first low-frequency range for both engines are 250 V. Integral indicators for AM1,3 are calculated accordingly: THD U   A M 1 , 3   К N U   A M 1 , 3 = 123.4 % and THD I   A M 1 , 3   К N I   A M 1 , 3 = 6.3 % ; for AM2: THD U   A M 2   К N U   A M 2 = 98.1 % and THD I   A M 2   К N I   A M 2 = 6.3 % .
The damage caused by high-frequency voltage harmonics consists of the accelerated aging of insulation and premature failure of electrical equipment, as well as malfunctions of control systems due to the action of conductive and induced EMI [34,35].
In view of the above, the actual direction of future research should be the improvement of the theory of group anti-interference filters intended for installation in CCPs of consumers for their own needs, taking into account the parasitic parameters of the filters in the high-frequency region.
In order to actively implement the latest developments of unified ship electrical power systems with DC main buses without harming the safety of the ship and crew, a unified standardization of voltage levels, power quality indicators for sources (synchronous generators), the most powerful consumers—propulsion complexes, and separate groups of ship-wide consumers is necessary in the future, as well as new safety rules and acceptable solutions for protection against short circuits on the main buses.

5. Conclusions

The paper studies a set of theoretical and practical issues regarding the assessment of electromagnetic compatibility indicators (electric power quality), namely the level of higher harmonics in an integrated ship system with a common DC main bus, to which sources—synchronous generators—are connected through uncontrolled rectifiers. The asynchronous motors of the propulsive complex, as well as other consumers, receive power from the same bus through VSI with PWM. Due to the use of this architecture and advances in power electronics, designers have successfully solved a number of problems in creating unique, innovative commercial vessels and warships. At the same time, the need to prevent possible complications due to the use of powerful semiconductor converters requires the creation of new design methodologies and refined mathematical and computer models that assume the specific features of integrated ship DC systems.
Some main conclusions obtained in the work can be stated as follows:
1.
The transition to the architecture of an integrated ship system with a DC main bus allows, due to fuel savings, for increasing the efficiency of the ship as a whole by 20%, reducing the weight and volume of on-board electrical equipment by 30%.
2.
The most important condition for the further successful use of the advantages of integrated ship DC systems is to solve the problem of EMC by improving the methods of evaluating a wide range of harmonics, taking into account circuit and mode features that affect the THD of voltages and currents. Such features include: a complex structure of the system containing numerous semiconductor converters with different power schemes and control algorithms; the presence of their own parameters of cable lines, primarily capacitances, which cause additional distortions and resonance phenomena in the high-frequency range.
3.
To solve the main task, an adequate model of the system was created in the MATLAB Simulink environment, the parameters of its elements were determined, and a model experiment was performed. Based on the results of the conducted experiment, a detailed analysis of electric power quality indicators was performed, which relate to certain groups of elements in the system: synchronous generators, electric propulsion complexes, ship-wide consumers, and consumers of their own needs.

Author Contributions

Conceptualization, methodology, data curation, project administration: D.Z.; validation, formal analysis, investigation: D.Z., O.Z., M.K. and S.S.; writing—original draft preparation: D.Z. and M.K.; writing—review and editing: S.S.; supervision: D.Z. and O.Z. All authors have read and agreed to the published version of the manuscript.

Funding

This research was partically funded by Ministry of Education and Science of Ukraine (research project #0123U100975).

Data Availability Statement

The data presented in this study are available on request from the corresponding author.

Acknowledgments

The authors thank the National University of Shipbuilding named after Admiral Makarov and Chernihiv Polytechnic National University for support.

Conflicts of Interest

The authors declare no conflict of interest. The funders had no role in the design of the study; collection, analyses, or interpretation of data; in the writing of the manuscript, or in the decision to publish the result.

Nomenclature

The following nomenclature is used in this manuscript:
EPCelectric propulsion complex
HDEPChybrid diesel-electric propulsion complex
EPQelectric power quality
MPSVmarine platform supply vessel
DPdynamic positioning
SEPPship electric power plant
EPIelectric propulsion installation
SEDMMsemiconductor electric drive for the main motion
SEDDPTsemiconductor electric drive for dynamic positioning devices
DGUdiesel-generator unit
PSCpower semiconductor converter
EPQIelectric power quality indicator
SEPSship electric power system
EPQelectric power quality
EMIelectromagnetic interference
CLcable line
SGsynchronous generator
ESSenergy storage system
DEdiesel engines
PSC SPpower semiconductor converter for system purposes
URuncontrolled rectifier
VSIvoltage source inverter
PWMpulse-width modulation
AMasynchronous motor
TRtransformer
FPCfrequency pulse converter
SSDCstabilized source of direct current
SFPC stabilized frequency pulse converter
AEDCCasynchronous electric drive of cargo cranes
AEDCWasynchronous electric drive of cargo winches
EEACSelectrical equipment of air conditioning systems
AEDPasynchronous electric drive of pumps
LSlighting system
ABaccumulator battery
PVEphotovoltaic element
SCLsegment of the cable line
ERefficiency ratio
MSWB1,3direct current main switchboard
MSWB2alternating current main switchboard
MSWB4alternating current main switchboard
TRSPtransformer for system purpose
EUengine unit
PSport side
SBSstarboard side
QFautomatic breaker
U N   MSWB 1 , 3 MSWB1,3 nominal voltage
U L N   MSWB 2 MSWB2 linear nominal voltage
U L N   MSWB 4 MSWB4 linear nominal voltage
U L N   SG linear nominal voltage of the synchronous generator
S N SG nominal full power of the synchronous generator
S N UR nominal full power of the uncontrolled rectifier
S N VSI nominal full power of the voltage source inverter
S N TR nominal full power of the transformer
S N   AM nominal full power of the asynchronous motor
S N FPC   Σ   nominal total full power of frequency pulse converter
S N   SSDC   Σ   nominal total full power of stabilized source of direct current
S N   ESS   Σ   nominal total full power of the energy storage system
S ESL   Σ   the total full capacity of the entire ship’s load
S ONL   Σ   the total full capacity of own needs load
f S G frequency of the output voltage of synchronous generator
cos φ power factor
x d supertransient resistance of the synchronous generator along the longitudinal axis
x q supertransient resistance of the synchronous generator along the transverse axis
P N   SG nominal active power of the synchronous generator
Q N   SG nominal reactive power of the synchronous generator
U P N   SG phase nominal voltage of the synchronous generator
X L   SG inductive resistance of a synchronous generator
L S G inductance of a synchronous generator
R S G active resistance of a synchronous generator
I L N   SCL nominal linear current of the segment of the cable line
η efficiency ratio of the cable
ITRURinput transformer of uncontrolled rectifier
r C   SCL active resistance of the cable in a segment of the cable line
X L C   SCL inductive resistance of the cable in a segment of the cable line
L C   SCL inductance of the cable in a segment of the cable line
r 1 M specified active resistance of one meter of cable
X L 1 M specified inductive resistance of one meter of cable
l C   SCL the length of the cable in the segment of cable line
n SCL the number of parallel cables in the segment of cable line
f voltage frequency
C S C   PG specified phase-to-ground capacitance of the cable
ξ dielectric constant of the cable insulation
R the radius of the inner surface of the cable screen (shield)
d 0 the distance between the longitudinal axis of the cable and the axis of the core
r C C radius of the cable core
h thickness of the cable core insulation
h B I thickness of the belt insulation
S C C cross-sectional area of the cable core
C P G   SCL Phase-to-ground capacitance of the cable in the segment of cable line
P N   VSI nominal active power of the voltage source inverter
S N   VSI nominal full power of the voltage source inverter
U L N   VSI nominal linear voltage of the voltage source inverter
I C   N nominal current of the cable
PSC EPCpower semiconductor converter of the electric propulsion complex
ESLentire ship’s loads
ONLown needs loads
f V S I output frequency of the voltage source inverter of electric propulsion complex
S N   ITRUR nominal full power of the uncontrolled rectifier input transformer
U LN   ITRURw linear nominal voltage of the windings of uncontrolled rectifier input transformer
U SC   ITRUR short-circuit voltage of the uncontrolled rectifier input transformer
R Y   ITRURw active resistance of the windings of uncontrolled rectifier input transformer for the connection in a “star”
X L Y   ITRURw inductive resistance of the windings of uncontrolled rectifier input transformer for the connection in a “star”
L Y   ITRURw inductance of the windings of uncontrolled rectifier input transformer for the connection in a “star”
R Δ   ITRURw active resistance of the windings of uncontrolled rectifier input transformer for the connection in a “delta”
X L Δ   ITRURw inductive resistance of the windings of uncontrolled rectifier input transformer for the connection in a “delta”
L Δ   ITRURw inductance of the input transformer of uncontrolled rectifier windings for connection in a “delta”
C V S I   IN input capacitance of the voltage source inverter
U d   VSI   IN rectified voltage at the input of the voltage source inverter
Δ U C   VSI   IN allowable voltage increment on the input capacitance of VSI
τ time constant of the voltage source inverter load circuit
L P L   VSI inductance in the phase load of the voltage source inverter
r P L   VSI active resistance in the phase load of the VSI
Z P L   VSI total resistance in the phase load of the VSI
U N P L   VSI nominal voltage in the phase load of the VSI
I N P L   VSI nominal current in the phase load of the VSI
S N   VSI nominal full power of the voltage source inverter
M PWM index of the voltage source inverter
X L P L   VSI inductive resistance in the phase load of the VSI
L P L   VSI inductance in the phase load of the voltage source inverter
R TRw active resistance of the transformer winding
S N   TR nominal full power of the transformer
U LN   TRw linear nominal voltage of the transformer windings
U SC   TR Short-circuit voltage of the transformer
X L   T Rw inductive resistance of the transformer windings
L TRw inductance of the transformer winding
LFBlow-frequency band
HFBhigh-frequency band
THD U   К N U total harmonic distortion of voltage
THD I   К N I total harmonic distortion of current
p number of pluses of uncontrolled rectifier
k dimensionless coefficient
ν harmonic order
AED APDasynchronous electric drive of the azimuth propulsion device
AEPD1,2asynchronous electric propulsion drives
AED TPD1,2asynchronous electric drives of the tunnel propulsion devices

References

  1. Kamala, S.; Chauhan, P.J.; Panda, S.K.; Wilson, G.; Liu, X.; Gupta, A.K. Methodology to qualify marine electrical propulsion system architectures for platform supply vessels. IET Electr. Syst. Transp. 2018, 8, 152–165. [Google Scholar] [CrossRef]
  2. Zhook, A.K.; Zhook, D.A. Complex rating and power quality providing in ac/dc electric power system of drilling vessel «Gazprom–1». In Proceedings of the 5th International Scientific and Technical Conference on Unconventional Electromechanical and Electrical Systems UEES’01, Międzyzdroje, Poland, 5–8 September 2001; Volume 2, pp. 551–556. [Google Scholar]
  3. Zhuk, O.; Zhuk, D.; Diakonov, O. Input Voltages and Currents Distortion and Power Factor of Frequency Converters. In Proceedings of the 2020 IEEE 40th International Conference on Electronics and Nanotechnology (ELNANO), Kyiv, Ukraine, 22–24 April 2020; pp. 791–796. [Google Scholar]
  4. Zhuk, O.; Zhuk, D.; Kryvoruchko, D. Voltage Harmonic Distortion in Autonomous Electric Power System with an Adjustable Power Line Conditioner. In Proceedings of the 2018 IEEE 3rd International Conference on Intelligent Energy and Power Systems (IEPS), Kharkiv, Ukraine, 10–14 September 2018; pp. 33–38. [Google Scholar] [CrossRef]
  5. Zhuk, O.; Zhuk, D.; Kryvoruchko, D.; D’yakonov, O. Control of Improved Hybrid Power Line Conditioner. In Proceedings of the 2018 IEEE 38th International Conference on Electronics and Nanotechnology (ELNANO), Kyiv, Ukraine, 24–26 April 2018; pp. 605–610. [Google Scholar]
  6. Zhuk, O.K.; Zhuk, D.O.; Kryvoruchko, D.V. Controlled Hybrid Filter Compensation Device. Utility Model Patent #120790, 27 November 2017. Bulletin No. 22/2017. Available online: https://sis.ukrpatent.org/uk/search/detail/743870/ (accessed on 25 February 2023).
  7. Zhuk, O.; Zhuk, D.; Kryvoruchko, D.; Stepenko, S. An improvement of compensators of complete power non-active components in autonomous electric power systems. In Proceedings of the 2016 2nd International Conference on Intelligent Energy and Power Systems (IEPS), Kyiv, Ukraine, 7–11 June 2016. [Google Scholar] [CrossRef]
  8. Zhuk, A.K.; Zhuk, D.A.; Krivoruchko, D.V.; Stepenko, S.A. Controlled filter-compensating gear for the autonomous electric power system with high-power converters. Tech. Electrodyn. 2016, 2016, 32–34. [Google Scholar]
  9. International Maritime Organization (IMO). Prevention of Air Pollution from Ships (MARPOL 73/78 Annex VI); Technical report; IMO: London, UK, 2004. [Google Scholar]
  10. Satpathi, K.; Balijepalli, V.M.; Ukil, A. Modeling and Real-Time Scheduling of DC Platform Supply Vessel for Fuel Efficient Operation. IEEE Trans. Transp. Electrif. 2017, 3, 762–778. [Google Scholar] [CrossRef] [Green Version]
  11. IMCA. MSC/Circular.645—Guidelines for Vessels with Dynamic Positioning Systems—(Adopted on 6 June 1994); IMCA: London, UK, 1994. [Google Scholar]
  12. IMCA. MSC.1/Circular.1580—Guidelines for Vessels and Units with Dynamic Positioning (DP) Systems—(16 June 2017); IMCA: London, UK, 2017. [Google Scholar]
  13. Reusser, C.A.; Young, H.A.; Perez Osses, J.R.; Perez, M.A.; Simmonds, O.J. Power Electronics and Drives: Applications to Modern Ship Propulsion Systems. IEEE Ind. Electron. Mag. 2020, 14, 106–122. [Google Scholar] [CrossRef]
  14. Ginn, H.; Cuzner, R. The Shipboard Integrated Power System [About This Issue]. IEEE Electrif. Mag. 2015, 3, 2–3. [Google Scholar] [CrossRef]
  15. Kim, S.-Y.; Choe, S.; Ko, S.; Sul, S.-K. A Naval Integrated Power System with a Battery Energy Storage System: Fuel efficiency, reliability, and quality of power. IEEE Electrif. Mag. 2015, 3, 22–33. [Google Scholar] [CrossRef]
  16. Michalopoulos, P.; Kanellos, F.D.; Tsekouras, G.J.; Prousalidis, J.M. A Method for Optimal Operation of Complex Ship Power Systems Employing Shaft Electric Machines. IEEE Trans. Transp. Electrif. 2016, 2, 547–557. [Google Scholar] [CrossRef]
  17. Zahedi, B.; Norum, L.E. Modeling and Simulation of All-Electric Ships With Low-Voltage DC Hybrid Power Systems. IEEE Trans. Power Electron. 2013, 28, 4525–4537. [Google Scholar] [CrossRef]
  18. Skjong, E.; Volden, R.; Rodskar, E.; Molinas, M.; Johansen, T.A.; Cunningham, J. Past, Present, and Future Challenges of the Marine Vessel’s Electrical Power System. IEEE Trans. Transp. Electrif. 2016, 2, 522–537. [Google Scholar] [CrossRef] [Green Version]
  19. Babii, O.V.; Bilokurets, A.O. Rules of Classification and Construction of Sea Vessels; Register of Shipping of Ukraine: Kyiv, Ukraine, 2020; Volume 2, p. 792. Available online: http://91.203.91.178/books/PCBSSt2_2020.pdf (accessed on 25 February 2023).
  20. ABS. Guidance Notes on Control of Harmonics in Electrical Power Systems; ABS: Houston, TX, USA, 2006.
  21. Anisimov, Y.; Vasiliev, E. Electromagnetic Compatibility of Semiconductor Converters and Ship Electrical Installations; Shipbuilding: Saint Petersburg, Russia, 1990; 264p. [Google Scholar]
  22. Banaei, M.R.; Alizadeh, R. Simulation-Based Modeling and Power Management of All-Electric Ships Based on Renewable Energy Generation Using Model Predictive Control Strategy. IEEE Intell. Transp. Syst. Mag. 2016, 8, 90–103. [Google Scholar] [CrossRef]
  23. Kumm, W.H. Marine and naval applications of fuel cells for propulsion: The process selection. J. Power Source 1990, 29, 169–179. [Google Scholar] [CrossRef]
  24. Chan, C.C.; Bouscayrol, A.; Chen, K. Electric, Hybrid, and Fuel-Cell Vehicles: Architectures and Modeling. IEEE Trans. Veh. Technol. 2010, 59, 589–598. [Google Scholar] [CrossRef]
  25. Soman, R.; Steurer, M.M.; Toshon, T.A.; Faruque, M.O.; Cuzner, R.M. Size and Weight Computation of MVDC Power Equipment in Architectures Developed Using the Smart Ship Systems Design Environment. IEEE J. Emerg. Sel. Top. Power Electron. 2017, 5, 40–50. [Google Scholar] [CrossRef]
  26. ABB. The step forward. In Onboard DC Grid; Technical Report; ABB: Zürich, Switzerland, 2014. [Google Scholar]
  27. Three Phase Synchronous Generators. 160–900 Frame Sizes Industrial/Marine Applications. Marelli Generators: Milan, Italy. Available online: https://www.rimor.eu/wp-content/uploads/documenti/Generatori_sincroni_trifase_01-2.pdf (accessed on 25 February 2023).
  28. Industry Standard 6181-81; Ship Electric Power Systems. Methods for Calculating Transient Processes: Moscow, Russia, 1981.
  29. HELKAMA. HELKAMA: Ship Cables, 1/2013.—76 p. (HELKAMA: Cудoвые Кaбели, 1/2013—76 с); HELKAMA: Helsinki, Finland, 2013. [Google Scholar]
  30. Grave, V.; Romanovsky, V.; Ushakov, V. Electric Fire Safety of High-Voltage Ship Electric Power Systems; Elmor: St. Petersburg, Russia, 2003; 160p. [Google Scholar]
  31. Gerasimenko, A. Transmission and Distribution of Electrical Energy, 4th ed.; Gerasimenko, A., Fedin, V., Eds.; KNORUS: Moscow, Russia, 2014; 648p. [Google Scholar]
  32. Chizhenko, I.; Rudenko, V.; Senko, V. Fundamentals of Converting Technology; Textbook for the specialty “Industrial Electronics” Higher School: Moscow, Russia, 1980; 430p. [Google Scholar]
  33. Rozanov, Y.K. Fundamentals of Power Electronics; Energoatomizdat: Moscow, Russia, 1992; 296p. [Google Scholar]
  34. Zhuk, D. Protection of asynchronous motor from overvoltages in the system of variable-frequency electric drive, taking into account the cable line. Electrotech. Comput. Syst. 2001, 57, 40–44. [Google Scholar]
  35. Zhuk, D.; Zhuk, O. Impact of cable line parameters on pulsed surges in asynchronous frequency controlled electric drives. Electrotech. Comput. Syst. 2005, 65, 39–42. [Google Scholar]
  36. Kanellos, F.D.; Prousalidis, J.; Tsekouras, G.J. Onboard DC grid employing smart grid technology: Challenges, state of the art and future prospects. IET Electr. Syst. Transp. 2015, 5, 1–11. [Google Scholar] [CrossRef]
  37. Satpathi, K.; Ukil, A.; Nag, S.S.; Pou, J.; Zagrodnik, M.A. DC Marine Power System: Transient Behaviour and Fault Management Aspects. IEEE Trans. Ind. Inform. 2018, 15, 1911–1925. [Google Scholar] [CrossRef]
  38. Sulligoi, G.; Bosich, D.; Giadrossi, G.; Zhu, L.; Cupelli, M.; Monti, A. Multiconverter Medium Voltage DC Power Systems on Ships: Constant-Power Loads Instability Solution Using Linearization via State Feedback Control. IEEE Trans. Smart Grid 2014, 5, 2543–2552. [Google Scholar] [CrossRef]
  39. Peng, C.; Song, X.; Huang, A.Q.; Husain, I. A Medium-Voltage Hybrid DC Circuit Breaker—Part II: Ultrafast Mechanical Switch. IEEE J. Emerg. Sel. Top. Power Electron. 2017, 5, 289–296. [Google Scholar] [CrossRef]
  40. Kumar, D.; Zare, F.; Ghosh, A. DC Microgrid Technology: System Architectures, AC Grid Interfaces, Grounding Schemes, Power Quality, Communication Networks, Applications, and Standardizations Aspects. IEEE Access 2017, 5, 12230–12256. [Google Scholar] [CrossRef]
  41. Zahedi, B.; Norum, L.E.; Ludvigsen, K.B. Optimized efficiency of all-electric ships by dc hybrid power systems. J. Power Source 2014, 255, 341–354. [Google Scholar] [CrossRef]
  42. Nebb, O.C.; Zahedi, B.; Lindtjorn, J.O.; Norum, L. Increased fuel efficiency in ship LVDC power distribution systems. In Proceedings of the 2012 IEEE Vehicle Power and Propulsion Conference, Seoul, Republic of Korea, 9–12 October 2012; pp. 564–568. [Google Scholar]
  43. IEC 61000-4-30 International Standard; Electromagnetic Compatibility (EMC)—Part 4-30: Testing and Measurement Techniques—Power Quality Measurement Methods. International Electrotechnical Commission: Geneva, Switzerland, 2021.
Figure 1. Single-line diagram of an integrated electric power system with the main direct current bus of MPSV with EPC.
Energies 16 02961 g001
Figure 2. A scaled MATLAB model of SEPS with a main DC bus of MPSV with EPC.
Energies 16 02961 g002
Figure 3. Cross-section of the cable core (a) and the capacity of the cable line section (SCL) (b).
Energies 16 02961 g003
Figure 4. Installation methods and types of connection of cable lines:connection of cabel line to SG (a) and UR (b), connection to MSWB (c,d), laying out the SCL at vessel (e,f).
Energies 16 02961 g004
Figure 5. Waveforms of linear voltage and current of SG (a), amplitude spectra of harmonics of linear voltage (b) and current (c) of SG in mode 1.
Energies 16 02961 g005
Figure 6. Waveforms of linear voltage and current at the URT input (a), amplitude spectra of harmonics of linear voltage (b) and current (c) at the URT input in mode 1.
Energies 16 02961 g006
Figure 7. Waveforms of linear voltage and current at the input of HV (secondary winding URT) (a), amplitude spectra of linear voltage (b) and current (c) at the inputs UR1,2,3,4 in mode 1.
Energies 16 02961 g007
Figure 8. Waveforms of constant voltage and current MSWB1,3 in mode 1.
Energies 16 02961 g008
Figure 9. Waveforms of linear voltage and current of MSWB2 (a), amplitude spectra of harmonics of linear voltage (b) and current (c) of MSWB2 in mode 1.
Energies 16 02961 g009
Figure 10. Waveforms of linear voltage and current of MSWB4 (a), amplitude spectra of harmonics of linear voltage (b) and current (c) of MSWB4 in mode 1.
Energies 16 02961 g010aEnergies 16 02961 g010b
Figure 11. Waveforms of linear voltage and current of AM1,3 as part of AGED (a); amplitude spectra of harmonics of linear voltage (b,d) and current (c,e), respectively, in the LFA and HFA of the AM1,3 AGED region in mode 1.
Energies 16 02961 g011
Figure 12. Waveforms of linear voltage and current of AM2 as part of AGED (a); amplitude spectra of harmonics of linear voltage (b,d) and current (c,e), respectively, in the LFA and HFA of the AM2 AGED region in mode 1.
Energies 16 02961 g012
Table 1. IMO DP Classification.
IMO DP ClassABS DP ClassLRS DP ClassDNV DP Class
-DPS-0DP (CM)DPS 0 DYNPOS-AUTS
Class 1DPS-1DP (AM)DPS 1 DYNPOS-AUT
Class 2DPS-2DP (AA)DPS 2 DYNPOS-AUTR
Class 3DPS-3DP (AAA)DPS 3 DYNPOS-AUTRO
Table 2. Distribution of the level of electrical loads in different operation modes.
Operation ModeTypes and Levels of SEPS Loads
SEDMM (AGED)SEDDPT (AED TPD1,2, AED APD)General Vascular LoadsLoad of Own Needs Pulse Load
1.
Crossing the sea
HighLowMediumHighHigh
2.
Dynamic positioning
LowHighMediumHighHigh
3.
Special operations at sea
MediumHighHighHighHigh
4.
Operations in the port
--HighMediumHigh
Table 3. Results of parameters’ calculation for SCL1-4.
ParametersSCL1SCL2SCL3SCL4
segment length l C   S C L 1 = 12 m l C   S C L 2 = 75 m l C   S C L 3 = 45 m l C   S C L 4 = 55 m
parallel cables number n S C L 1 = 6 , n S C L 2 = 9 n S C L 3 = n S C L 4 = 5
cable active resistance r C   S C L 1 = 0.25 10 3 Ohm r C   S C L 2 = 1.041 10 3 Ohm r C   S C L 3 = 2.187 10 3 Ohm r C   S C L 4 = 2.673 10 3 Ohm
cable inductive resistance X L C   S C L 1 = 0.146 10 3 Ohm X L C   S C L 2 = 0.608 10 3 Ohm X L C   S C L 3 = 0.657 10 3 Ohm X L C   S C L 4 = 0.803 10 3 Ohm
cable inductance L C   S C L 1 = 0.387 10 6 H L C   S C L 2 = 1.613 10 6 H L C   S C L 3 = 1.74 10 6 H L C   S C L 4 = 2.13 10 6 H
cable “p2g” capacitance C P G   S C L 1 = 7.5096 10 9 F C P G   S C L 2 = 7.037 10 8 F C P G   S C L 3 = 2.13 10 8 F C P G   S C L 4 = 2.604 10 8 F
Table 4. Results of parameters’ calculation for ITRUR.
Winding ParametersITRURw1ITRURw21ITRURw22
voltage U L N   I T R U R w 1 = 690 V U L N   I T R U R w 21 = 380 V U L N   I T R U R w 22 = 380 V
active resistance R Y   I T R U R w 1 = 0.952 10 3 Ohm R Y   I T R U R w 21 = 0.288 10 3 Ohm R Δ   I T R U R w 22 = 0.866 10 3 Ohm
inductive resistance X L Y   I T R U R w 1 = 9.522 10 3 Ohm X L Y   I T R U R w 21 = 2.888 10 3 Ohm X L Δ   I T R U R w 22 = 8.664 10 3 Ohm
inductance L Y   I T R U R w 1 = 2.525 10 5 H L Y   I T R U R w 21 = 7.66 10 6 H L Δ   I T R U R w 22 = 2.298 10 5 H
Table 5. Results of parameters’ calculation for TR1-4.
Winding
Parameters
TR1,2 w1TR1,2w2TR3,4 w1TR3,4w2
voltage U L N   T R 1 , 2 w 1 = 690 V U L N   T R 1 , 2 w 2 = 440 V U L N   T R 3 , 4 w 1 = 690 V U LN   T R 3 , 4 w 2 = 230 V
active resistance R TR 1 , 2 w 1 = 1.48 10 3 Ohm R TR 1 , 2 w 2 = 0.605 10 3 Ohm R T R 3 , 4 w 1 = 0.0119 Ohm R T R 3 , 4 w 2 = 0.00132 Ohm
inductive resistance X L   TR 1 , 2 w 1 = 14.8 10 3 Ohm X L   T R 1 , 2 w 2 = 6.05 10 3 Ohm X L   T R 3 , 4 w 1 = 0.119 Ohm X L   T R 3 , 4 w 2 = 0.0132 Ohm
inductance L TR 1 , 2 w 1 = 3.946 10 5 H L TR 1 , 2 w 2 = 1.604 10 5 H L T R 3 , 4 w 1 = 0.315 10 3 H L T R 3 , 4 w 2 = 0.035 10 3 H
Table 6. A table of loads and results of EPQ measurements in the SEPS of MPSV in operation modes 1–4 based on the MATLAB model (Figure 2).
ModeTotal Generated PowerPSC SP1PSC EPCESLONLTotal Power Consumption
K NU ,   %
K NI ,   %
S N   S G Σ ,   kVA
SUR∑, kVAUdUR, VIdUR∑, ASPSC EPC∑, kVASESL∑, kVAUL ESL, VIL ESL∑, ASONL∑, kVAUL ONL, VIL ONL∑, A
S N ,   kVA
SG1,2,3,4ВИХUR1,2,3,4ВХMSWB2MSWB4AM1,3AM2SG1,2,3,4ВИХUR1,2,3,4ВХMSWB2MSWB4AM1,3AM2
16000750010001930430062544046214023019750656.118.7088.6784.84123.4298.139.1425.115.975.726.316.32
24000500010001495316062544046014023019639256.659.4788.6884.85122.6898.228.4824.475.975.726.326.33
360007500100022454660112544082414023019659256.559.4784.8884.85122.0698.218.5224.515.725.726.326.33
4200025001000469-11254408359023012812155.087.2284.8887.87--10.3026.205.725.92--
Disclaimer/Publisher’s Note: The statements, opinions and data contained in all publications are solely those of the individual author(s) and contributor(s) and not of MDPI and/or the editor(s). MDPI and/or the editor(s) disclaim responsibility for any injury to people or property resulting from any ideas, methods, instructions or products referred to in the content.

