Article

Anaerobic Digestion of Dairy Effluent in New Zealand, Time to Revisit the Idea?

School of Engineering, University of Waikato, Private Bag 3105, Hamilton 3240, New Zealand
*
Author to whom correspondence should be addressed.
Energies 2023, 16(6), 2859; https://doi.org/10.3390/en16062859
Submission received: 7 February 2023 / Revised: 28 February 2023 / Accepted: 16 March 2023 / Published: 20 March 2023

Abstract

:
The anaerobic digestion of New Zealand low-input dairy farms has previously been evaluated for energy production, but farming systems have recently become more intensive with increased feed supplementation and feed replacement; therefore, we are studying how these changes affect the overall energy production for water heating. A combination of literature review, surveys, chemical analyses, biomethane potential analysis, and modeling were used for this study. On a case study farm with a solid separator, it was found that 558 MJ/day and 176–861 MJ/day could be produced with the solid and liquid portions of effluent, respectively. There is enough biogas to satisfy the dairy farm’s water heating requirements with a tankless water heater.

1. Introduction

New Zealand produces 21,000 to 22,000 tons of milk per year and is one of the top 10 milk-producing countries in the world [1,2]. A total of 22% of milk production is in the Waikato region on the North Island, followed by North Canterbury at 14.7% on the South Island. Most New Zealand cows have a dry period where they are not being milked between May and August and are mainly grass-fed, but may receive additional feed to supplement/replace what is grazed from the paddocks, e.g., to increase milk production, to extend lactation, or to feed the cows during winter, when cows may be kept under cover off the paddocks due to the cold climate or high rainfall. The milk production systems in New Zealand are categorized into five groups based on the amount of imported feed and supplementation used on the farm (Table 1) [3].
Traditionally, New Zealand farms have been pasture-based (System 1). Cow manure was only collected during milking time, and the dry matter content of the generated effluent was less than 1% [4]. This has changed in recent years with the increased use of feed supplementation. In 2017, it was reported that 47% of dairy farms in the Waikato region had a feed pad [5]. Another change has been the increased use of concrete structures to keep the cows off the paddocks in winter to avoid degrading the pasture by pugging. On average, cows are spending 2 to 4 hours more per day in the paddock than previously. This means that effluent must be collected from these additional structures. With the use of a feed pad, feed waste is also entering the effluent system. According to DairyNZ [6], the amount of feed waste from the commonly fed supplements can range from 5% to 30% of the supplement fed. Before 2005, effluent solid separators were not used. Recent statistics suggest that 81% of farmers have a pond where effluent is collected, and 12% of farms contain a solid separator unit, of which 9.5% are passive (in this paper, we refer to them as weeping walls) and 2.5% are mechanical [5]. Solid separators are recommended for effluent treatment in the following cases: a large herd (e.g., over 500 cows), an intensive feeding system, and regular use of a standoff or feed pad [7]. All these changes have resulted in an increase in manure and feed waste collection and solid content in dairy effluent, which must be treated prior to discharge or irrigation on land, with associated energy costs in terms of pumping.
Energy consumption on a dairy farm is substantial, with the average electricity use per farm per year around 73,900 kwh, of which 24% is for water heating, 22% for water pumping, 17% for refrigeration, 15% for vacuum pumping, 3% for milk pumping, 9% for effluent pumping, 2% for lighting, and the remaining 8% for other uses [8]. In terms of water heating, this results in 17,726 kwh of electricity being used every year, which at the current price of 0.30 NZD $/kwh adds up to NZD $5300 per year in operating costs for water heating alone and NZD $22,170 per year overall. A typical 400-cow dairy farm in New Zealand generates 154 tons of milk solids per year, and according to AgFirst’s annual financial survey, it needs to earn NZD $8.48/kg MS to break even, or $1.3 million per year in 2022. At a forecasted milk solids price of NZD $8.75–$10/kg MS, the typical farm will have an operating profit of between NZD $42,000 and NZD $234,000 per year. With inflation for dairy farmers at 16.5% up to June 2022 and the cost of fertilizer being high, working expenses had increased by NZD $1.56/kg MS, therefore any effort to reduce operating costs is worthwhile.
In other milk-producing countries, energy consumption on a dairy farm can be offset by using anaerobic digestion (AD) to treat dairy effluent and produce biogas for heat and energy production. During AD, bacteria decompose organic matter in four stages: hydrolysis, acidogenesis, acetogenesis, and methanogenesis. Essentially, bacteria break down carbohydrates, proteins, and lipids and produce biogas. The average composition of the biogas can range from 50% to 60% methane (CH4), 50% to 40% carbon dioxide (CO2), hydrogen sulfide, and water vapor. The composition of the biogas varies depending on the organic matter being digested [9]. In practice, anaerobic digestion of dairy effluent is not commonly found on New Zealand farms. While studies analyzing the use of anaerobic digestion of effluent from farming systems 1–3 in New Zealand have been performed, some of these have not supported the technology because there was not enough solid recovery or biogas production to justify the expenditure of installing a generator powered by the biogas. These studies, however, did not evaluate the relatively recent changes in farming behavior and increases in effluent solids collection or the existing farm infrastructure, which could be easily transformed into an anaerobic digestor.
Both the solid and liquid fractions of the effluent produced by a solid separator can be anaerobically digested. The liquid fractions can be digested more easily at lower temperatures and with shorter hydraulic retention times [10]. This advantage is hindered by the fact that approximately half of the volatile solids (VS) remain in the solid fraction of the effluent [11], hence the biogas production is lower. For this reason, we are interested in evaluating the digestion of both liquid and solid fractions of effluent. While researchers [11,12,13] have focused on the digestion of the liquid fraction of the effluent, no research on the methane production from both fractions of dairy effluent was found. This is important because effluent solids retained by weeping walls are uncovered and are in an anoxic/anaerobic state; hence, methane emissions from the weeping walls could be substantial. For substrates with a high solid content, a process called dry anaerobic digestion can be used. Dry anaerobic digestion is performed without mixing the substrate. Most of the studies performed have used substrates with a total solid content higher than 20%. Nevertheless, some researchers, such as Massé et al. [14], were successful at digesting dairy effluent with a total solid (TS) content that varied between 8.7% and 10.3%. They found that digesting dairy effluent in a psychrophilic dry anaerobic digester offered savings in terms of construction costs and energy expenses from mixing and heating and, therefore, could obtain a greater overall energy output than a mesophilic or thermophilic liquid or solid digester.
There are many applications for the biogas produced by anaerobic digestion on a dairy farm, such as producing electricity with a generator for refrigeration, heating, lighting, and running the pumps; or burning it directly for water heating. On a dairy farm, hot water is used to clean the milking lines, milking cups, and the milk vat. The amount of water used depends on the number of cups, vat size, and cleaning procedure. Research conducted by Morrison et al. [15] showed that in New Zealand, the amount of energy required to heat water from 10 °C to 85 °C and hold it at that temperature is approximately 0.1 kwh/litre per day using an electric water heater. Electrical water heating is the most common way of heating up water on NZ dairy farms, but since (1) electrical water heating systems are known to lose energy on standby overnight heating at 85 °C, (2) energy generators require substantial capital expenditure and biogas volume, and (3) heating is the most efficient way of using biogas, we are evaluating the use of continuous gas flow water heaters that run with the biogas produced on the dairy farm.
Continuous gas flow heaters are also known as gas-fired tankless water heaters (GFTWH) [16] or tankless gas water heaters (TGWH) [17]. Despite the name, the principle is the same: hot water on demand. These can work with liquified petroleum gas (LPG) or natural gas (NG). The working principle is that the thermal energy from a flame is captured by heating fins, which exchange the heat with the flowing water [16]. According to Bohac et al. [18], this technology is the most efficient conventional method of heating water with natural gas.
This paper will revisit anaerobic digestion and whether it is feasible to generate sufficient biogas to meet water heating needs. This study will review previous studies on biogas production from dairy farms in New Zealand and obtain information for systems 4 and 5 farms and the liquid and solid fractions of effluent to determine the feasibility of using the biogas to heat up water. A complete profile of characteristics for both fractions of effluent will be examined. Therefore, as part of our research, we are providing volatile solids, total solids, total nitrogen, total ammoniacal nitrogen, nitrate, and nitrite, total Kjeldahl nitrogen, carbonaceous biochemical oxygen demand, chemical oxygen demand, total carbon, lipids, carbohydrates, proteins, tannin, volatile fatty acids, neutral detergent fiber, and acid detergent fiber.

2. Materials and Methods

2.1. Literature Review

A thorough literature review was conducted and found a combination of scientific articles and government reports that evaluated the applicability of anaerobic digestion to New Zealand dairy farms. Some of these studies provide experimental information [19,20,21], theoretical information [22,23], or a combination of both [24]. The findings from these studies and the respective farming configurations are summarized in Table 1. We found that none of these studies refer to the anaerobic digestion of the liquid and solid portions of dairy effluent separately. In addition, the studies found in the literature evaluated farming systems 1, 2, and 3. Since there was no information about the AD of farming systems 4 and 5, we had to collect it. The data consisted of surveys and effluent samples, which were sent to Hill Laboratories for chemical analysis.

2.2. Surveys

The surveys included questions about milk production, cow weight, herd size, feed, farming systems, water use, effluent treatment systems used, cleaning procedures, and energy use on the farm.
In addition, effluent samples were collected from different parts of the system to determine the solid distribution accordingly. Effluent samples were taken and sent the same day to Hill Laboratories for analysis. The chemical analysis included dry matter, total solids, chemical oxygen demand (COD), total nitrogen, total phosphorus, total potassium, total calcium, total magnesium, total sodium, pH, and density. While the farmers gave us data about daily washdown volumes, the effluent tests gave us values for mass distribution.

2.3. Site Selection

From the farm analyses, we selected a farm that had a passive solid separator and a flexitank© also known as a bladder tank. The site was in Awakeri, in the Bay of Plenty region. The farming system has 5 with 410 cows. The breed is kiwi-cross, and the lactation period is 300 days. The cows are milked twice a day and spend approximately 4 h a day between the yard and the milking shed. There is a feed pad where cows spend 2 h every day. The rest of the time, the cows are in the paddocks. The milking shed, yard, and feed pad are washed with both recycled and clean water. The diet fed at the time of the experiment was as follows: 14 kg/cow day of grass, 2 kg/cow day of maize, 2 kg/cow day of palm kernel extract (pke), and 1 kg/cow day of distilled dried grains (ddg).

2.4. Sample Collection

Liquid samples were collected from the end of the weeping wall after solid separation had occurred. Solid samples were taken from different points of the weeping wall and at different depths and mixed with a shovel to obtain a representative sample. Samples were sent to three different laboratories for analysis: Hill Laboratories, Eurofins, and Watercare. Samples were dropped off at Hill Laboratories on the same day for analysis, and the rest were kept in refrigeration until the following day, when they were sent to the other laboratories. Hill Laboratories conducted an analysis of dry matter (US EPA 3550), total nitrogen and carbon (Elementar Analyser), ammonium (APHA 4500-NH3H (modified), carbonaceous biochemical oxygen demand (cBOD) (incubation and DO meter), chemical oxygen demand (COD) (acid digestion and colorimetry), and oil and grease (APHA 5520 E) on solid samples. For liquid samples, Hill Laboratories performed an analysis of total and volatile solids (APHA 2540 B and 2540 E), total nitrogen, total ammoniacal nitrogen (APHA 4500-NH3H), nitrate and nitrite (APHA 4500-NO3), cBOD (APHA 5210 B), COD (APHA 5220 D), total carbon (APHA 5310 C), oil and grease (APHA 5520 D), tannin (APHA 5550 B), and a volatile acid profile (ion chromatography). Eurofins provided analysis of neutral detergent fiber and acid detergent fiber of solid and liquid samples (ANKOM Technology Method gravimetry method). Watercare provided analysis following APHA standards for total Kjeldahl nitrogen, total solids, volatile solids, and volatile fatty acids of solid samples.

2.5. Biomethane Potential Experiment

Biochemical methane potential analysis was carried out following the method used by Angelidaki et al. [25] with some modifications: no mixing, psychrophilic temperature used, and no added inoculum. Since the addition of inoculum, if not treated properly, can mask the gas production from the system and there is inoculum already present in our substrate, we decided not to add any external inoculum and obtain a representation of the biogas production with the existing inoculum to substrate ratio. Reducing substrate particle size and homogenizing can lead to an increase in the rate of gas production and or yield and result in sources of error when comparing them to full-scale processes [26], therefore we took representative samples and mixed them without homogenizing.
Samples were placed in sealed 500-mL Schott bottles with tigon tubing and checked for pressure tightness. Then they were flushed with nitrogen gas. The solid and liquid portions of effluent were digested separately. Liquid digesters were filled with 400 mL of the substrate. A total of 2 conditions were evaluated, psychrophilic and mesophilic; therefore, 3 digesters were kept at 24 °C and the other 3 at 35 °C. There were 3 solid digesters, and the substrate added was as follows: S1 = 318 g, S2 = 308 g, and S3 = 318 g. They were evaluated under psychrophilic conditions. The total biogas was measured by volumetric displacement. The biogas volume produced was measured once a day. Atmospheric pressure and gas temperature were measured, and biogas production was adjusted to standard conditions of 273.15 K and 1 atm. Once data was obtained from the solid digesters, these were flushed with nitrogen gas and continued to be studied for an additional 25 days.

2.6. Biogas Analysis

Once the daily biogas production of the liquid digesters was less than 1% of the previous days, the experiments were paused. A Geotech Biogas Analyzer G5000 was used to measure the composition. The biogas samples were obtained from the headspace of the container and diluted with N2 to obtain enough gas to be run in triplicate. Total and volatile solids were analyzed before and after the trial following APHA standards at the University of Waikato lab. This was carried out to ensure that the results obtained were consistent and could be compared.

2.7. Process Modelling

The information obtained in batch conditions is not easily transferred to real-life conditions [26]. Therefore, we used the information from the batch conditions as a batch and followed the advice from Ward et al. [26] in order to use this information properly in the modeling process. The main difference to keep in mind is the dynamics of the biochemical environment within the anaerobic digestion process. In a batch operation, some molecules, such as sugars and amino acids, increase as the carbohydrates and proteins are hydrolyzed and they decrease as they are converted into volatile fatty acids [26]. Contrary to this, in a continuous process, the substrate is constantly added in smaller loads [26], which leads to a steady state with small fluctuations in the amounts of intermediate and product molecules.
The results of the biomethane potential experiments were used as a basis to derive the reaction kinetic parameters necessary to calculate the performance of a scaled-up reactor design. The quantitative basis for the reaction is the Buswell formula:
C n H a O b + ( n 2 a 4 b 2 ) H 2 O ( n 2 + a 8 b 4 ) C H 4 + ( n 2 a 8 + b 4 ) C O 2
where the stoichiometric constants a, b, and n are unique to the feedstock used. In this work, we assume n = 17, a = 32, and b = 9, giving a molar mass for the biomass of 362 g/mol.
Reactor sizing is based on reaction kinetics. Three types of reactor configurations are the most common for digesters, including dry batch reactors, CSTR, and dry continuous reactors. The CSTR-type model is the most applicable to the real-world scenario being studied and will be the basis for the modeling used in this paper.
The best-known mechanism for the breakdown of organic materials into methane occurs in the four-stage processes of hydrolysis, acidogenesis, acetogenesis, and methanogenesis. Each of these processes influences the overall kinetics of biogas production and can account for normal degradation behavior and other behaviors such as delayed degradation and inhibited degradation.
It can be presumed that side reactions occur in which the terminating product in this sequence of reactions is not reached. At this point, we introduce the concept of the maximum biomass yield, Ymax. This is defined as the fraction of methane produced against the theoretical stoichiometric full conversion of the substrate, CnHaOb.
There are many examples of simplifications of the four-stage reaction sequence in the literature. In this study, we use the first-order reaction (or sequential first-order simplification) for the main and side reactions given by
d C B d t = k 1 C B k 2 C B
Letting N1 equal the stoichiometric coefficient of methane in Equation (1), we obtain equations for the rate of production of methane as follows:
d C C H 4 d t = k 1 C B N 1
and production of by-products:
d C X d t = k 2 C B N 2
Taking a stoichiometric balance of 1 mole of biomass creating N1 moles of CH4, the mass balance for biomass and methane species and by-products is
C B 0 = C B + C C H 4 N 1 + C X N 2
Substituting the mass balance and solving the system of differential equations with boundary conditions of CB = CB0 at t = 0, and CCH4 and CX = 0, the methane evolution in a batch system is given by
C C H 4 = C B 0 N 1 k 1 k 1 + k 2 ( 1 e ( k 1 + k 2 ) t )
The Ymax is the fractional yield of biogas obtained from batch experiments of cumulative biogas measurements taken at long (steady state) reaction times. From the above equation, the fractional yield must be
φ = k 1 k 1 + k 2
When Y and k1 from experiments are known, k2 can then be deduced.
By obtaining the biogas degradation kinetic parameters k1 and k2, we can develop a reactor design methodology to envisage large-scale CSTR production. Rearranging Equation (6) allows us to determine k1 and k2, i.e.,
l n ( 1 Y Y m a x ) = ( k 1 + k 2 ) t
Thus, a plot of ln(1 − Y/Ymax) versus t gives a straight line of slope k1 + k2. Finally, if the fractional yield is known from analysis at the conclusion of the BMP test, and we assume that the fractional yield of evolved biogas is constant with time, the value of k1 is
k 1 = φ ( k 1 + k 2 )
and it follows that k2 can be determined.
For an industrial-scale CSTR, we assume the following:
  • Solid retention time and hydraulic retention time HRT are equal;
  • The gas phase leaves separately from the solid/liquid phases.
Thus, we can eliminate the gas expansion effects on the production rate in the reactor.
Based on these kinetic parameter data, we can estimate the gas production from a CSTR reactor. For practical purposes, the degree of freedom for reactor choice is simply an economic decision based on the reactor volume of choice. Up to a certain extent, full conversion of the VS is achieved with an infinitely sized reactor, but with a considerable economic penalty. Thus, a trade-off should be made as to the reactor volume of choice which best balances the gas requirement and the available space and resources for the reactor vessel. Hence, the extent of the process modeling provided in this paper serves to provide the tools and insight needed to make such a decision.
For CSTR sizing, the relationship between biomass to biogas conversion and HRT for the assumed first-order reaction is
X B 1 = k 1 τ 1 + k 1 τ
where τ is the hydraulic retention time, and the conversions are related to the concentration of methane as CCH4 = N1CB,0(1 − XB1). The well-known CSTR relationship relating reactor volume to HRT is
τ = V C S T R υ
where v is the flow rate through the reactor, and VCSTR is the reactor volume. The concentration of biogas CCH4 exiting the reactor as a function of CSTR size is
C C H 4 = N 1 C B , 0 k 1 V C S T R υ + k 1 V C S T R
At this point, the basis for the product concentration is still the liquid phase. Considering that the reactor contents separate into two phases, we need to determine the biogas volumetric production rate, QCH4, independent of the liquid reaction phase. This can be calculated as follows:
Q C H 4 = C C H 4 υ R T P
where P and T are the reactor pressure and temperature, respectively, and R is the universal gas constant.

3. Results and Discussion

3.1. Literature Review

Different approaches to estimating biogas production from dairy farms in New Zealand have been conducted. These are summarized in Table 2, and the findings are in Table 3. Theoretical data offer an estimation of biogas production, but experimental information offers more relevant data for the substrate being studied. Only two published articles provided information about the anaerobic digestion of dairy effluent, those by Park and Craggs [20] and Craggs et al. [19]. These focused on pasture-based farms (system 1) and covered anaerobic ponds as reactors. To find the biogas production per area, a section of the pond was covered with plastic. The results of studies [19,20] suggest that there was more biogas produced on a farm with fewer cows than the other. Even though they are both pasture-based farms, additional diet information is not available. The difference in biogas production was attributed to solids accumulation in the bottom of the pond generating higher amounts of biogas than expected. A lab biomethane potential analysis would be required in order to determine the actual biogas production from the total solids concentration.
Biogas production from six dairy farms was studied by the National Institute of Water and Air (NIWA) [23]. The farms without a feed pad had between 270 and 700 cows, but no diet information was available. The farms with feed pads had 400, 650, 1400, and 1400 cows. Some of the assumptions used to calculate biogas production are from the American Agricultural Handbook: 4.4 kg feces/cow (500 kg)/day, a volatile solids content of 70%, the manure collected during milking is 12.5% solids, the feed pad is used in the winter (1.5 to 2 h) and fed 0.6–2 tons of dry matter/cow of mainly maize silage, and it was assumed the feed wastage was 2% and the volatile solids of the feed waste were 70%.
The farms containing 400, 650, and 700 cows and feed pads were feeding 6–10% of the total diet on the feed pad for the winter months only. The feed was maize silage, but it was not specified if it was grown on the farm or not, which is part of the requirements of DairyNZ to categorize the farms in systems. Considering these cows are only in the feed pad in the winter and only 10% or less is fed in the feed pad, we categorized them as system 2 farms. There is one farm with 1400 cows, which feeds approximately 35% of the cows on the feed pad for 9 months of the year. The type of feed fed was not specified; therefore, it was not possible to categorize this farm according to DairyNZ farming system guidelines.
With a covered anaerobic pond (CAP), Craggs et al. [23] found that 29–185 MWh/year could be produced for 270–1400 cow farms, respectively. They also found the energy generation for a plug-flow digester to be 26–261 MWh/year. The specific values of MJ/cow are specified in Table 2.
In a theoretical study, Stewart and Trangm [22] looked at four different scenarios: a 500-cow farm where 10% and 60% of the effluent were collected, and a 900-cow farm where 10% and 60% of the effluent were collected. The farms where 60% of effluent was collected assumed cows spent time housed or on a feed pad. The assumptions around the volume of effluent captured are summarized in Table 2. Other assumptions that were made in this study are: 35 kg/day of raw manure per cow, 13% of it is total solids, the equivalent to 4.5 kg/cow day. The energy values available are summarized in Table 2.
Hartman [24] studied three farms in which effluent was collected from the feed pad and milking shed. This study was based on theoretical assumptions and lab testing of the volatile solid content of the dairy effluent collected. Hartman found the volatile solids to be 0.2, 0.2, and 0.6% for 350, 550, and 950 cow farms, respectively. This value was obtained with the assumption that 4 kg of VS/cow/day is produced. The respective effluent production was 14, 120, and 55 m3/day for the 350, 550, and 950 cow farms, respectively (Table 2). Some of the assumptions used in this study were: 12–15% of the volatile solids were recovered for anaerobic digestion; the energy per unit of volatile solids used was 7 MJ/kg VS. With the recovery rates of volatile solids, they found that they were able to use the biogas for the production of 23%, 64%, and 49% of the farm’s energy consumption with 350, 550, and 950 cows, respectively.
Based on the literature review, different values of energy production were found (Table 3). Hartman [24] obtained 0.2, 0.3, and 0.01 MJ/cow/day for 950, 550, and 350 cow farms, which is quite different from what was published by Craggs [23], who obtained an amount of 2.1 to 6.7 MJ/cow/day. This could be due to the fact that Craggs et al. [23] used theoretical values based on dry weight values from the American Agricultural Handbook, where the diets used in the United States of America are imported feed whereas New Zealand farms are pasture-based. Craggs et al. [23] assumed the percentage of volatile solids is 70% of the total solids for both feed waste and effluent, which does not capture all the variances that exist within dairy effluent and feed waste in New Zealand. Feed wastage is assumed to be 2%, but the New Zealand-based industry [6] shows that feed wastage can be between 5% and 30% depending on the type of feed. Another assumption by Craggs et al. [23] was a controlled temperature for a covered anaerobic pond, while other studies [19,20] looked at the annual temperature variances and found 1.5 and 2.3 MJ/cow/day, respectively, for pasture-based farms, which are lower than that found by Craggs et al. [23], who obtained 2.4 and 3 MJ/cow/day for pasture-based farms and 2.1 to 4.6 MJ/cow/day for farms with feed pads. The authors [19,20] mention the possibility of solid accumulation in the covered anaerobic ponds before the study was conducted. Another possibility for the difference was the methane content used for the biogas, which was lower than the 80% methane content found in the study [20], which was suggested could be due to the absorption of CO2 into the pond water.
Table 2. Summary of the literature review.
SourceAD SystemFarming SystemYearTypeType of Data
[20]CAP12007Published articleExperimental
[24]Tank digester32007Industrial reportTheoretical and experimental
[23]CSTR, PFR, CP1, 2, 32006Government reportTheoretical
[19]CAP1 2008Published articleExperimental and theoretical
[22]CAP and tank digester1, 22008Government reportTheoretical
[21]PFR, 3 stage digesterN/A2016Master’s thesisLab-scale experimental
Table 3. Summary of findings of anaerobic digestion in New Zealand farms.
AuthorCowsTypeEffluent Volume CollectedTotal SolidsVolatile SolidsBiogas
Conversion
Daily Methane ProductionEnergy ProductionElectricity ProductionEnergy Production per Cow
Head m3/daykg/dkgVS/m3m3/kgVSm3/dayMJ/daykwh/dayMJ/day cow
[20]1000CAP39N/A2.00.740.71507122 d1.5
[19]700CAPN/AN/A0.046 e0.26451612135 d2.3
[22]500N/A42.5225N/A205 a3145394 d0.9
500N/A42.51365N/A205 a1902750571 d5.5
900N/A76.5405N/A205 a56816169 d0.9
900N/A76.52430N/A205 a33948961016 d5.4
[24]950N/A5519.65.7N/AN/A197.5550.2
550N/A1207.71.7N/AN/A142.8400.3
350N/A146.51.8N/AN/A3.510.01
[23]270CAP124.64 c85 b0.34196421782.4
PFR4.64 c0.54289472633.5
400CAP94.64 c158 b0.343511833293.0
PFR4.64 c0.545117244794.3
650CAP1054.64 c381 b0.348528747984.4
PFR4.64 c0.54124419211656.4
700CAP264.64 c192 b0.344314544042.1
PFR4.64 c0.546321305923.0
1000CAP234.64 c320 b0.347124016672.4
PFR4.64 c0.5410435169773.5
1400CAP554.64 c849 b0.34190642417854.6
PFR4.64 c0.54276933225926.7
a The authors assumed that the conversion ratio was 205 L Biogas/kgTS; b kg/d of VS (daily average VS load on operating months); c the authors assumed the dry weight of total waste to be 4.64 kg/cow (500 kg)/d; 12.5% of waste is collected from the dairy shed; 2% of feed wastage was given by the farmers; and the percentage of VS in feed was 70%; d based on the assumption that 3.0 kwh electricity equals 1 m3 of pure methane; e authors weren’t able to measure the flow rate of effluent or volatile solids content, therefore they assumed 0.3 kgVS/cow per day captured on milking shed and divided this per pond size 4600 m3 to find 0.046 kgVS/m3 per day.

3.2. Surveys and Lab Results

The previous studies on anaerobic digestion of dairy effluent in New Zealand did not evaluate the solid and liquid fractions from a solid separation unit because most of the studies were conducted between 2006 and 2008, when system 5 farms were not common. Therefore, we evaluated the dry matter, total nitrogen, and chemical oxygen demand at the milking shed, yard, feed pad, and weeping wall solid and liquid fractions on five different systems and five farms. The averages and standard deviations of the results for every stage of the effluent collection and solids separation system are summarized in Table 4. The milking shed had the lowest dry matter of 2.2 kg/m3 and COD of 2200 g O2/m3, partly because cows only spend between 7 and 10 min in this area [15], generally less defecation occurs in the milking shed, and there is a high volume of wash water used to clean the shed. The end of the feed pad had a dry matter content of 31 kg/m3 and a COD of 18,400 g O2/m3 because this contained manure and feed waste, while the solids retained by the weeping wall had a dry matter content of 140 kg/m3 but a very high COD of 182 g O2/kg DW or 25,480 g O2/m3, presumably because of the higher proportion of volatile solids in the solid fraction. The standard deviation in results was typically 30–50% of the measured averages, which can be expected due to differences in feed, the volume of wash water used, and the time of day and climate conditions at which the samples were collected.
A study performed on a pasture-based farm with 500 cows in New Zealand in 2003 [27] found an average value of COD of 9600 g/m3 from yard effluent, whereas we found 14,600 g/m3, again due to the higher solids content in the yard waste that we sampled. It could also be due to the difference in diet since their study was on a pasture-based farm.
A study completed by AgResearch [28] found that the solids in the weeping consisted of 11% to 38% DM, whereas we found an average of 14% DM. From the values found for the liquid and solid fractions, 78.5% of the solids from the influent were retained in the weeping wall (Table 5).
Rico et al. [12] used coagulation and flocculation and compared a mesh screen and a filter press for solid separation from dairy farm effluent. The screening resulted in a solid fraction with a total solid concentration of 50 kg/m3, while the liquid portion had a concentration of 20 kg/m3. In a pilot-scale study where a screw press separator was used, 82% of the incoming solids were retained in the solid fraction and 18% in the liquid fraction, which resulted in a solid fraction with 25.3% TS and a liquid fraction with 5.8% TS [11]. With a passive solid separator, we found the TS content of the solid fraction to be 14% and 0.77% for the liquid portion (Table 4 and Table 5). Longhurst et al. [29] reported average %DM values for retained solids of 13.5% for static screens, 20.1% for weeping walls, and 25.3% for mechanically separated solids from New Zealand dairy effluent. Our results for the system 5 farms surveyed were closer to the results Longhurst et al. obtained for static screens and could be a reflection of the greater waste feed content in the system 5 effluent retaining greater water content behind the weeping wall. The method of solid separation used has an impact on biogas generation. Studies in Spain and the United States of America have evaluated the biogas production from different solid separation units, and Møller et al. [30] found that biogas potential increases with decreasing particle size and an increase in the specific surface area of the particles in the effluent.

3.3. Weeping Wall Characterization

While reviewing the literature, it seems that the volatile fatty acid profile for New Zealand dairy effluent was performed only for the yard effluent from a pasture-based farm [27]. The distribution of lipids, carbohydrates, and proteins was not studied previously, and a complete profile for both fractions has never been published in New Zealand. Therefore, the solid and liquid fractions collected from the weeping wall were characterized before performing the biomethane potential analysis (Table 6) and to compare the theoretical biogas production from different indicators such as chemical oxygen demand, biochemical oxygen demand, and volatile solids. VS made up 54% of the TS of the liquid fraction while making up 71% of the TS for the solid fraction. TN was 9% of the TS in the liquid fraction but only 2.7% of the TS in the solid fraction, while organic N was 3.4% of the TS in the liquid and 0.6% of the TS in the solid fraction. In both cases, this was due to the much greater amounts of NDF and ADF in the retained solids fraction compared to the liquid fraction, which also meant that on a dry basis, the biological and chemical oxygen demand was lower in the sludge than in the liquid. The mass fraction of organic carbon in the liquid and solid fractions was similar at 38% and 41% of the TS, respectively. Acetic, propionic, and butyric acids were 6%, 4%, and 0.2% of TS in the liquid fraction and 2.4%, 2.6%, and 0.8% of TS in the solids fraction, while oils and grease were 9.4% of TS in the liquid fraction and 1.4% of the TS in the solid fraction. The carbon-to-nitrogen ratio (C/N) for liquid from the weeping wall was 4.7:1, while in the retained solids it was 14:1. This is similar to the other literature that reports C/N ratios of 12–30 [28].
The separation performance of the weeping wall sampled was good, with 79% of the TS and 82% of the VS being retained by the wall. 99% of the ADF and NDF were retained, as were 77% of the total carbon and 53% of the total nitrogen. For ammoniacal nitrogen, 60% was retained, this could be due to the breakdown of organic nitrogen inflating this value, while 35% of the COD and 67% of the BOD were retained.

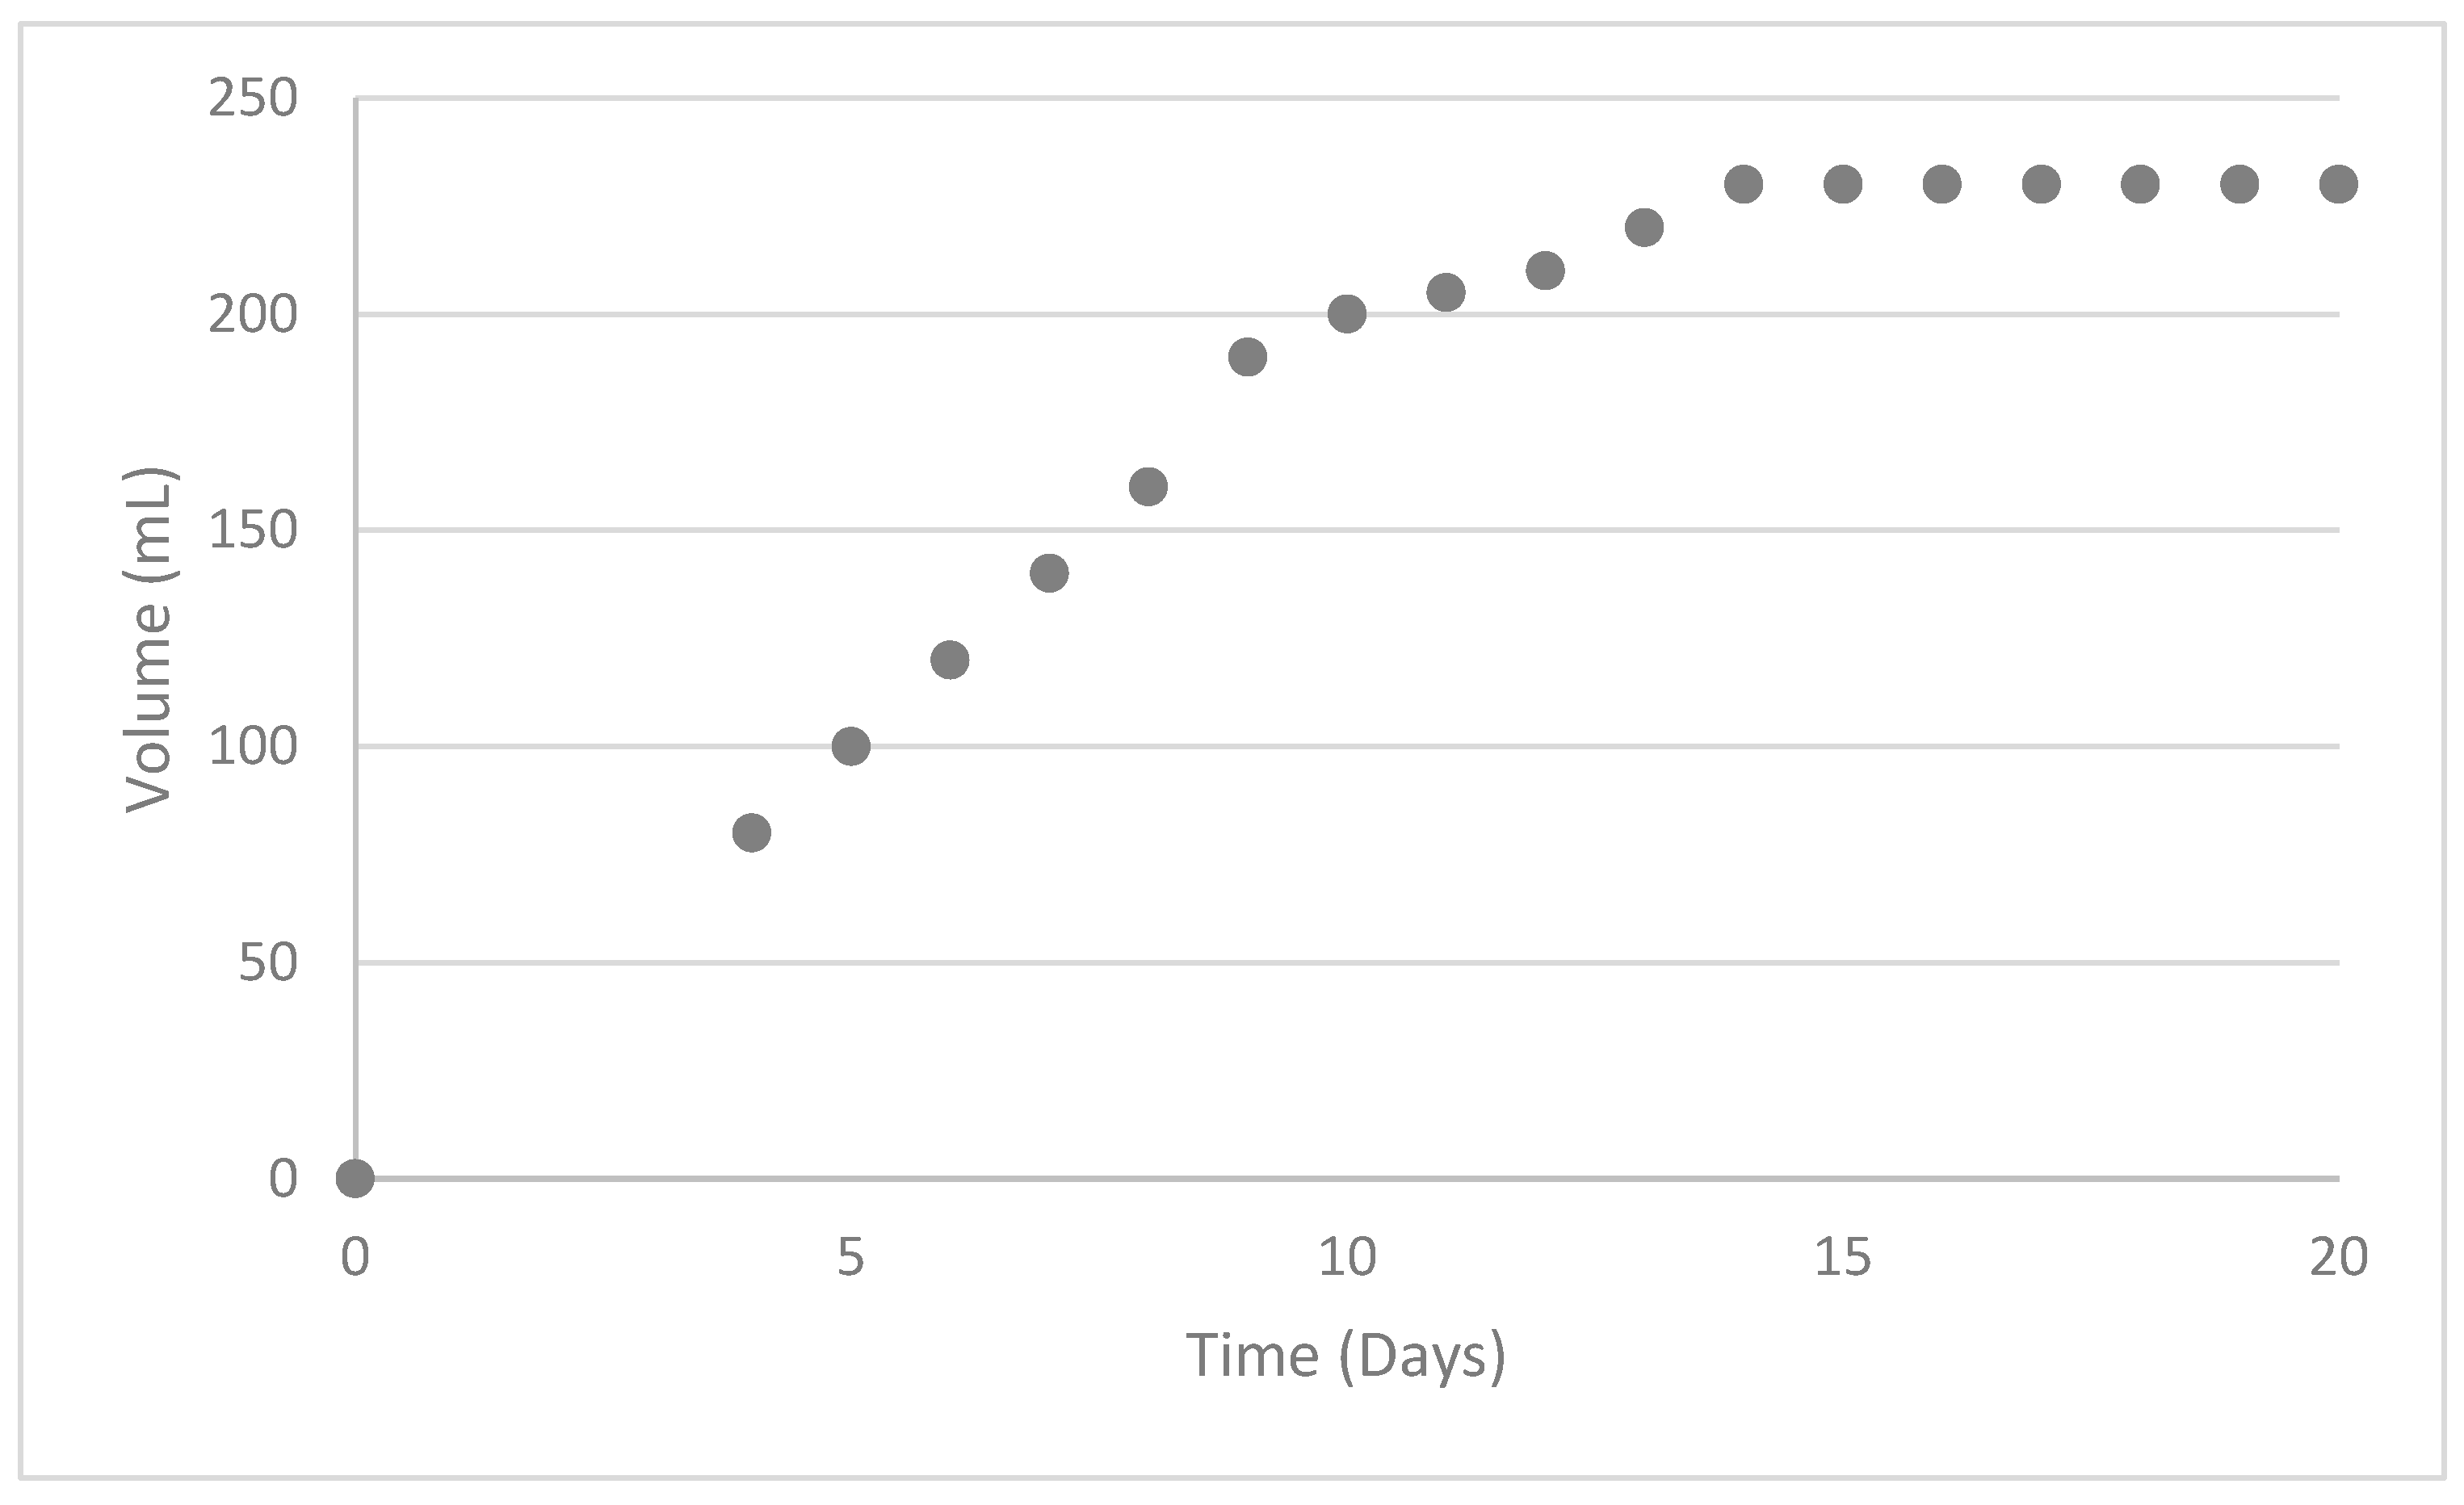
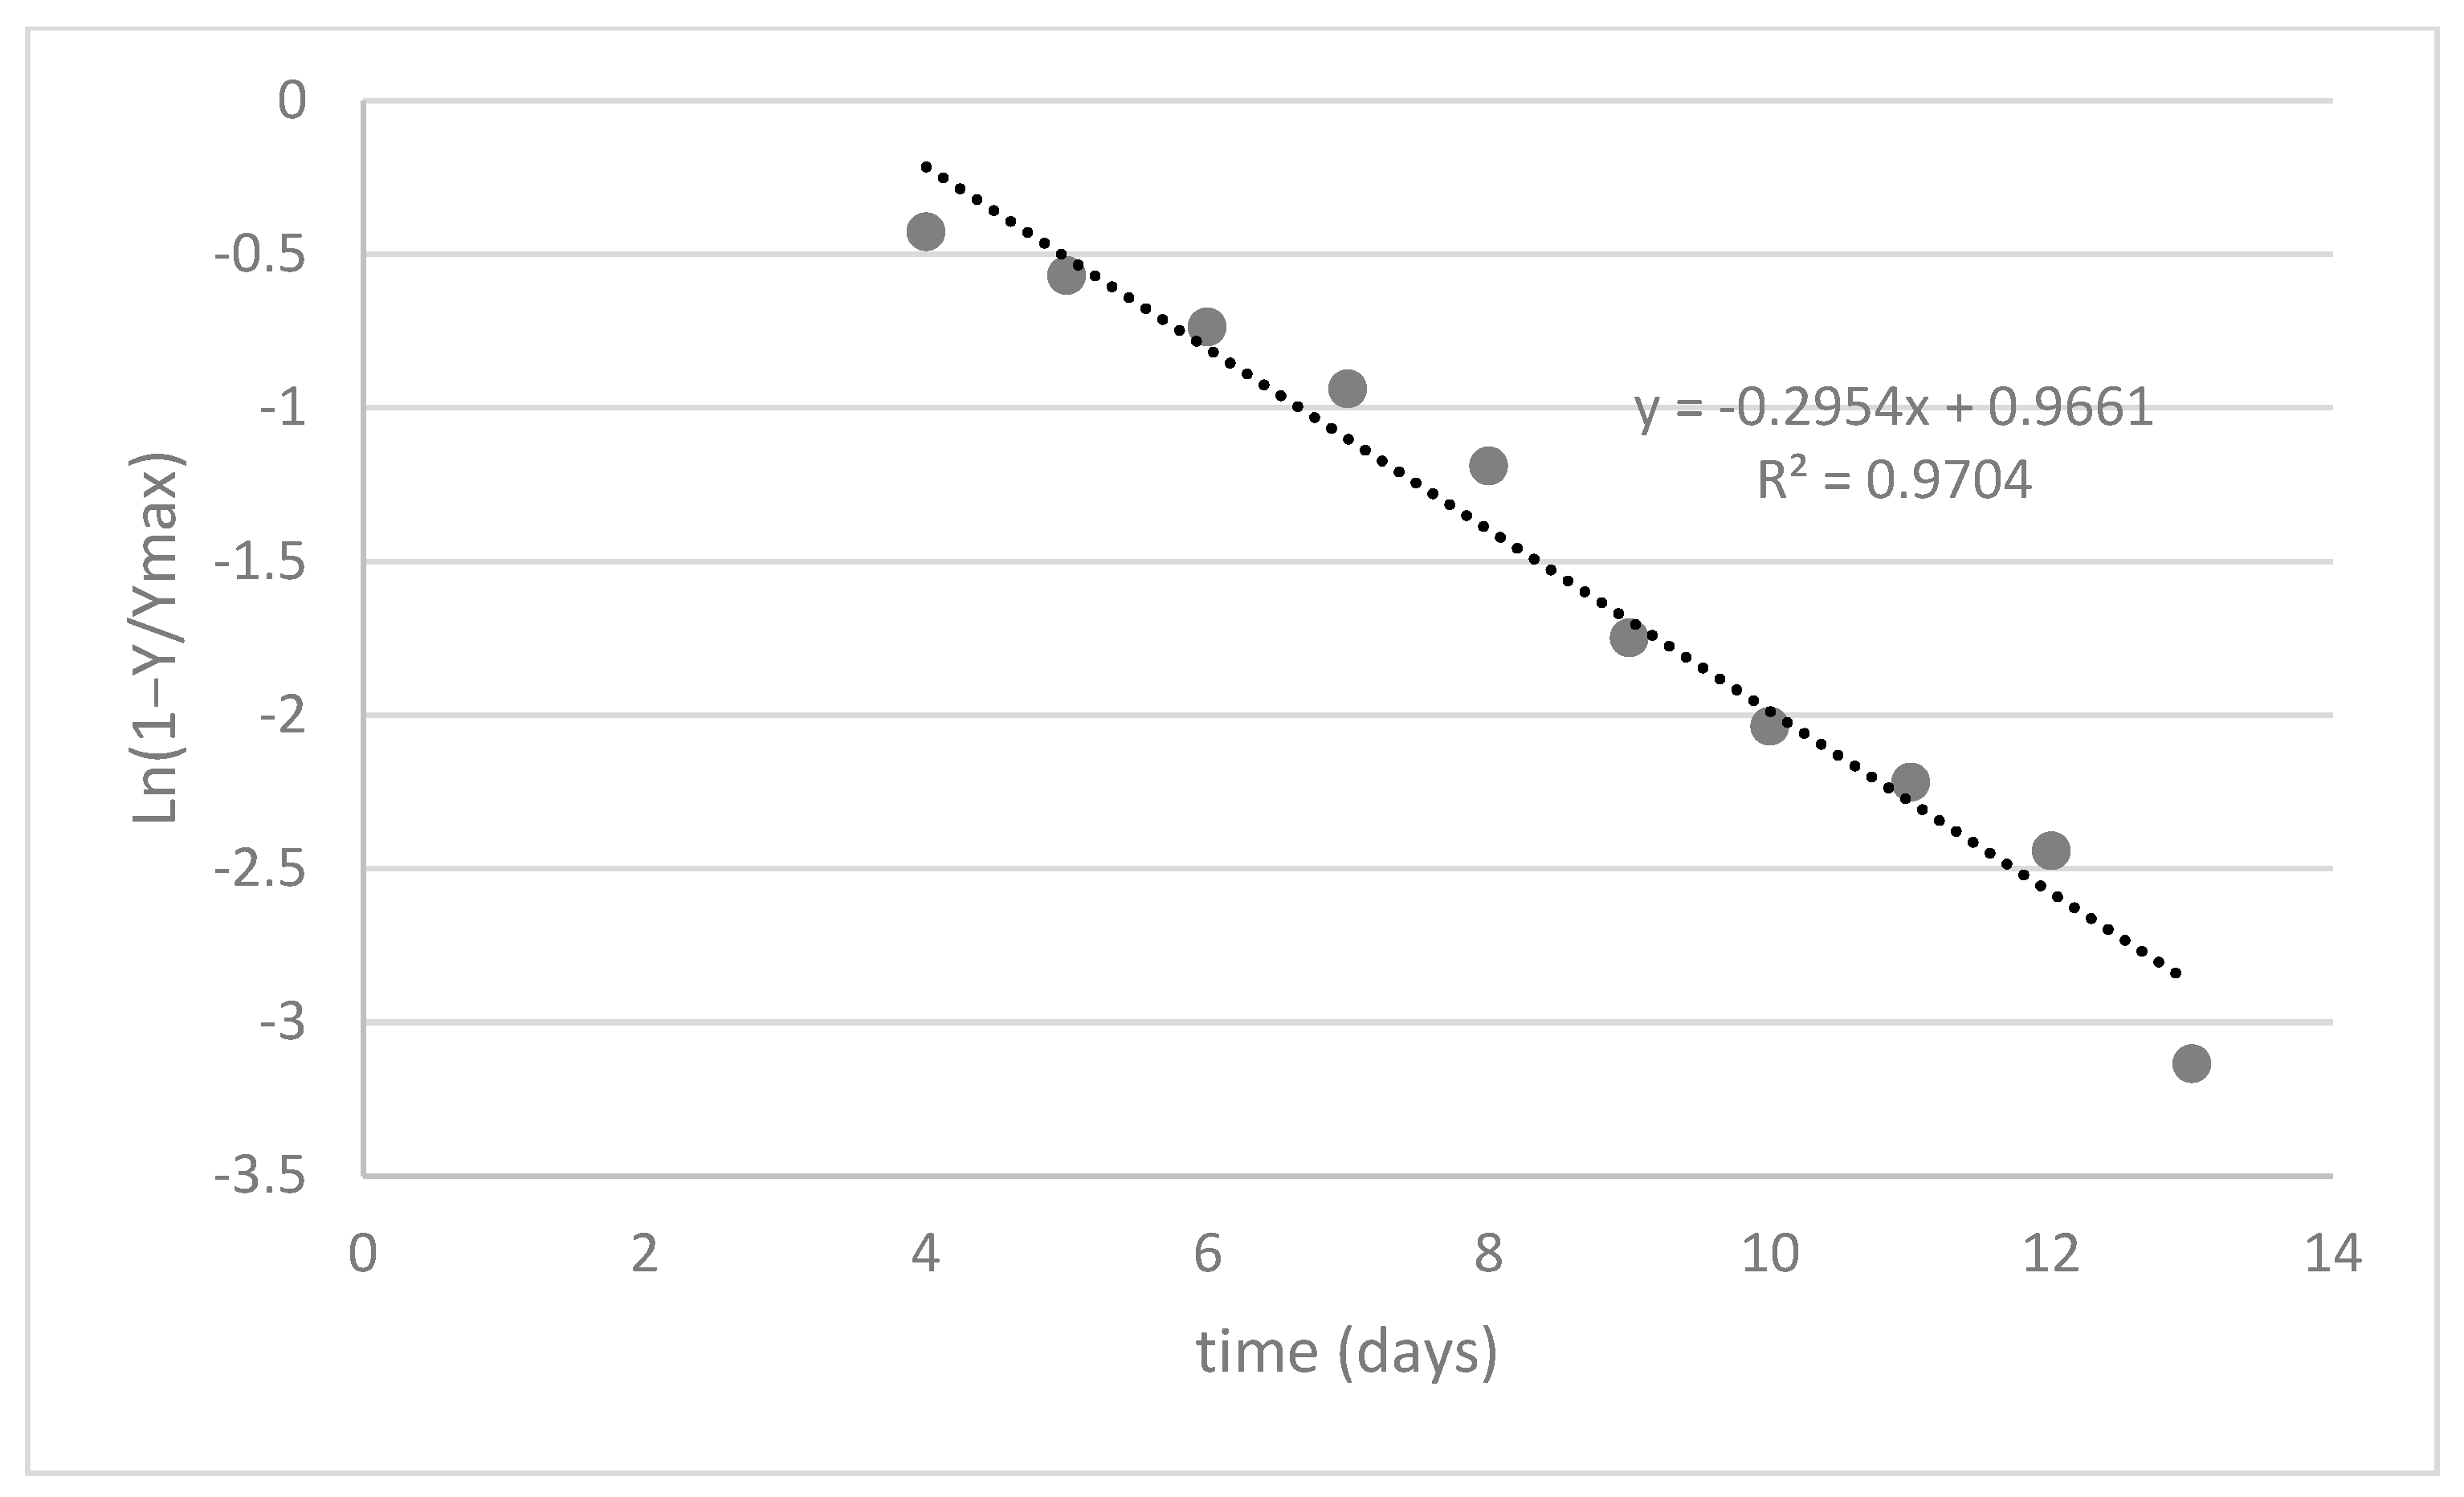
3.4. Biogas Production

The biogas production from the sludge and liquid is summarized in Table 7. 47–53% of the VS was removed from the liquid samples, with a high methane concentration of 85–86% and gas production of 121–144 NmL/g VS applied. The sludge, while having a much higher gas production of 898–2055 NmL, gas production was only 19–65 NmL/g VS applied. The mass of the VS present was so high that there was a negligible difference in the VS measured in the substrate after the experiment. As a quality check, the digesters were pressure checked before and after the experiment, and it was found that one of the liquid and sludge vessels at 24 °C and one of the liquid vessels at 35 °C lost pressure, so results from these vessels were neglected. After measuring the methane content of all the digesters, the vessels containing sludge as a substrate were purged with nitrogen and allowed to run for longer. The biogas production from these vessels was steady at 61 to 83 mL/day.
Massé and Cata Saady [14] also trialed dry psychrophilic anaerobic digestion with an effluent similar in composition to our study and achieved a similar gas production on the basis of starting COD. They used a composition of 12.5–16.2% TS, 11.2–14.3% VS, 1.54–11.2 g/kg acetate, 0.46–1.5 g/kg propionate, and 0.10–2.36 g/kg butyrate. They obtained a methane production of 162 to 262 NmL CH4/gVS and 110.3 NmL CH4/gCOD for a 21-day cycle. The daily production was between 8 and 12.5 NmL CH4/g VS/day. In comparison, we found an average production of 20–65 NmL CH4/gVS and 124–354 NmL CH4/gCOD. In their case, they were adding substrate daily to their reactors, while our anaerobic digestion was batch-only with a single starting dose of the substrate.
Lo et al. [13] found that the liquid fraction of screened manure containing 3.78% TS produced 213 mL CH4/g vs. in a mesophilic reactor with continuous mixing and 20 days HRT, which was more than our study using a psychrophilic batch reactor, which produced 121 mL CH4/g VS.
In another study, Rico et al. [12] also used the liquid fraction of screened manure for anaerobic digestion. The composition of the liquid was similar to our study with 7.3% fat, 18.5% protein, and 29.4% carbohydrates on a dry basis (our study was 9% lipid, 21% protein, and 25% carbohydrates), and they generated 371.1 NmL CH4/g VS at 35 °C in a continuous stirred reactor with a 45-day hydraulic retention time. Their manure had a higher fraction of volatile fatty acids than our study. Rico et al. [12] found that increasing the active biomass seeded increases the amount of substrate used in the methanogenesis process, lessening the substrate used for growth, and therefore the methanogenic productivity increases. The inoculum-to-substrate ratio used in their study was 0.33.

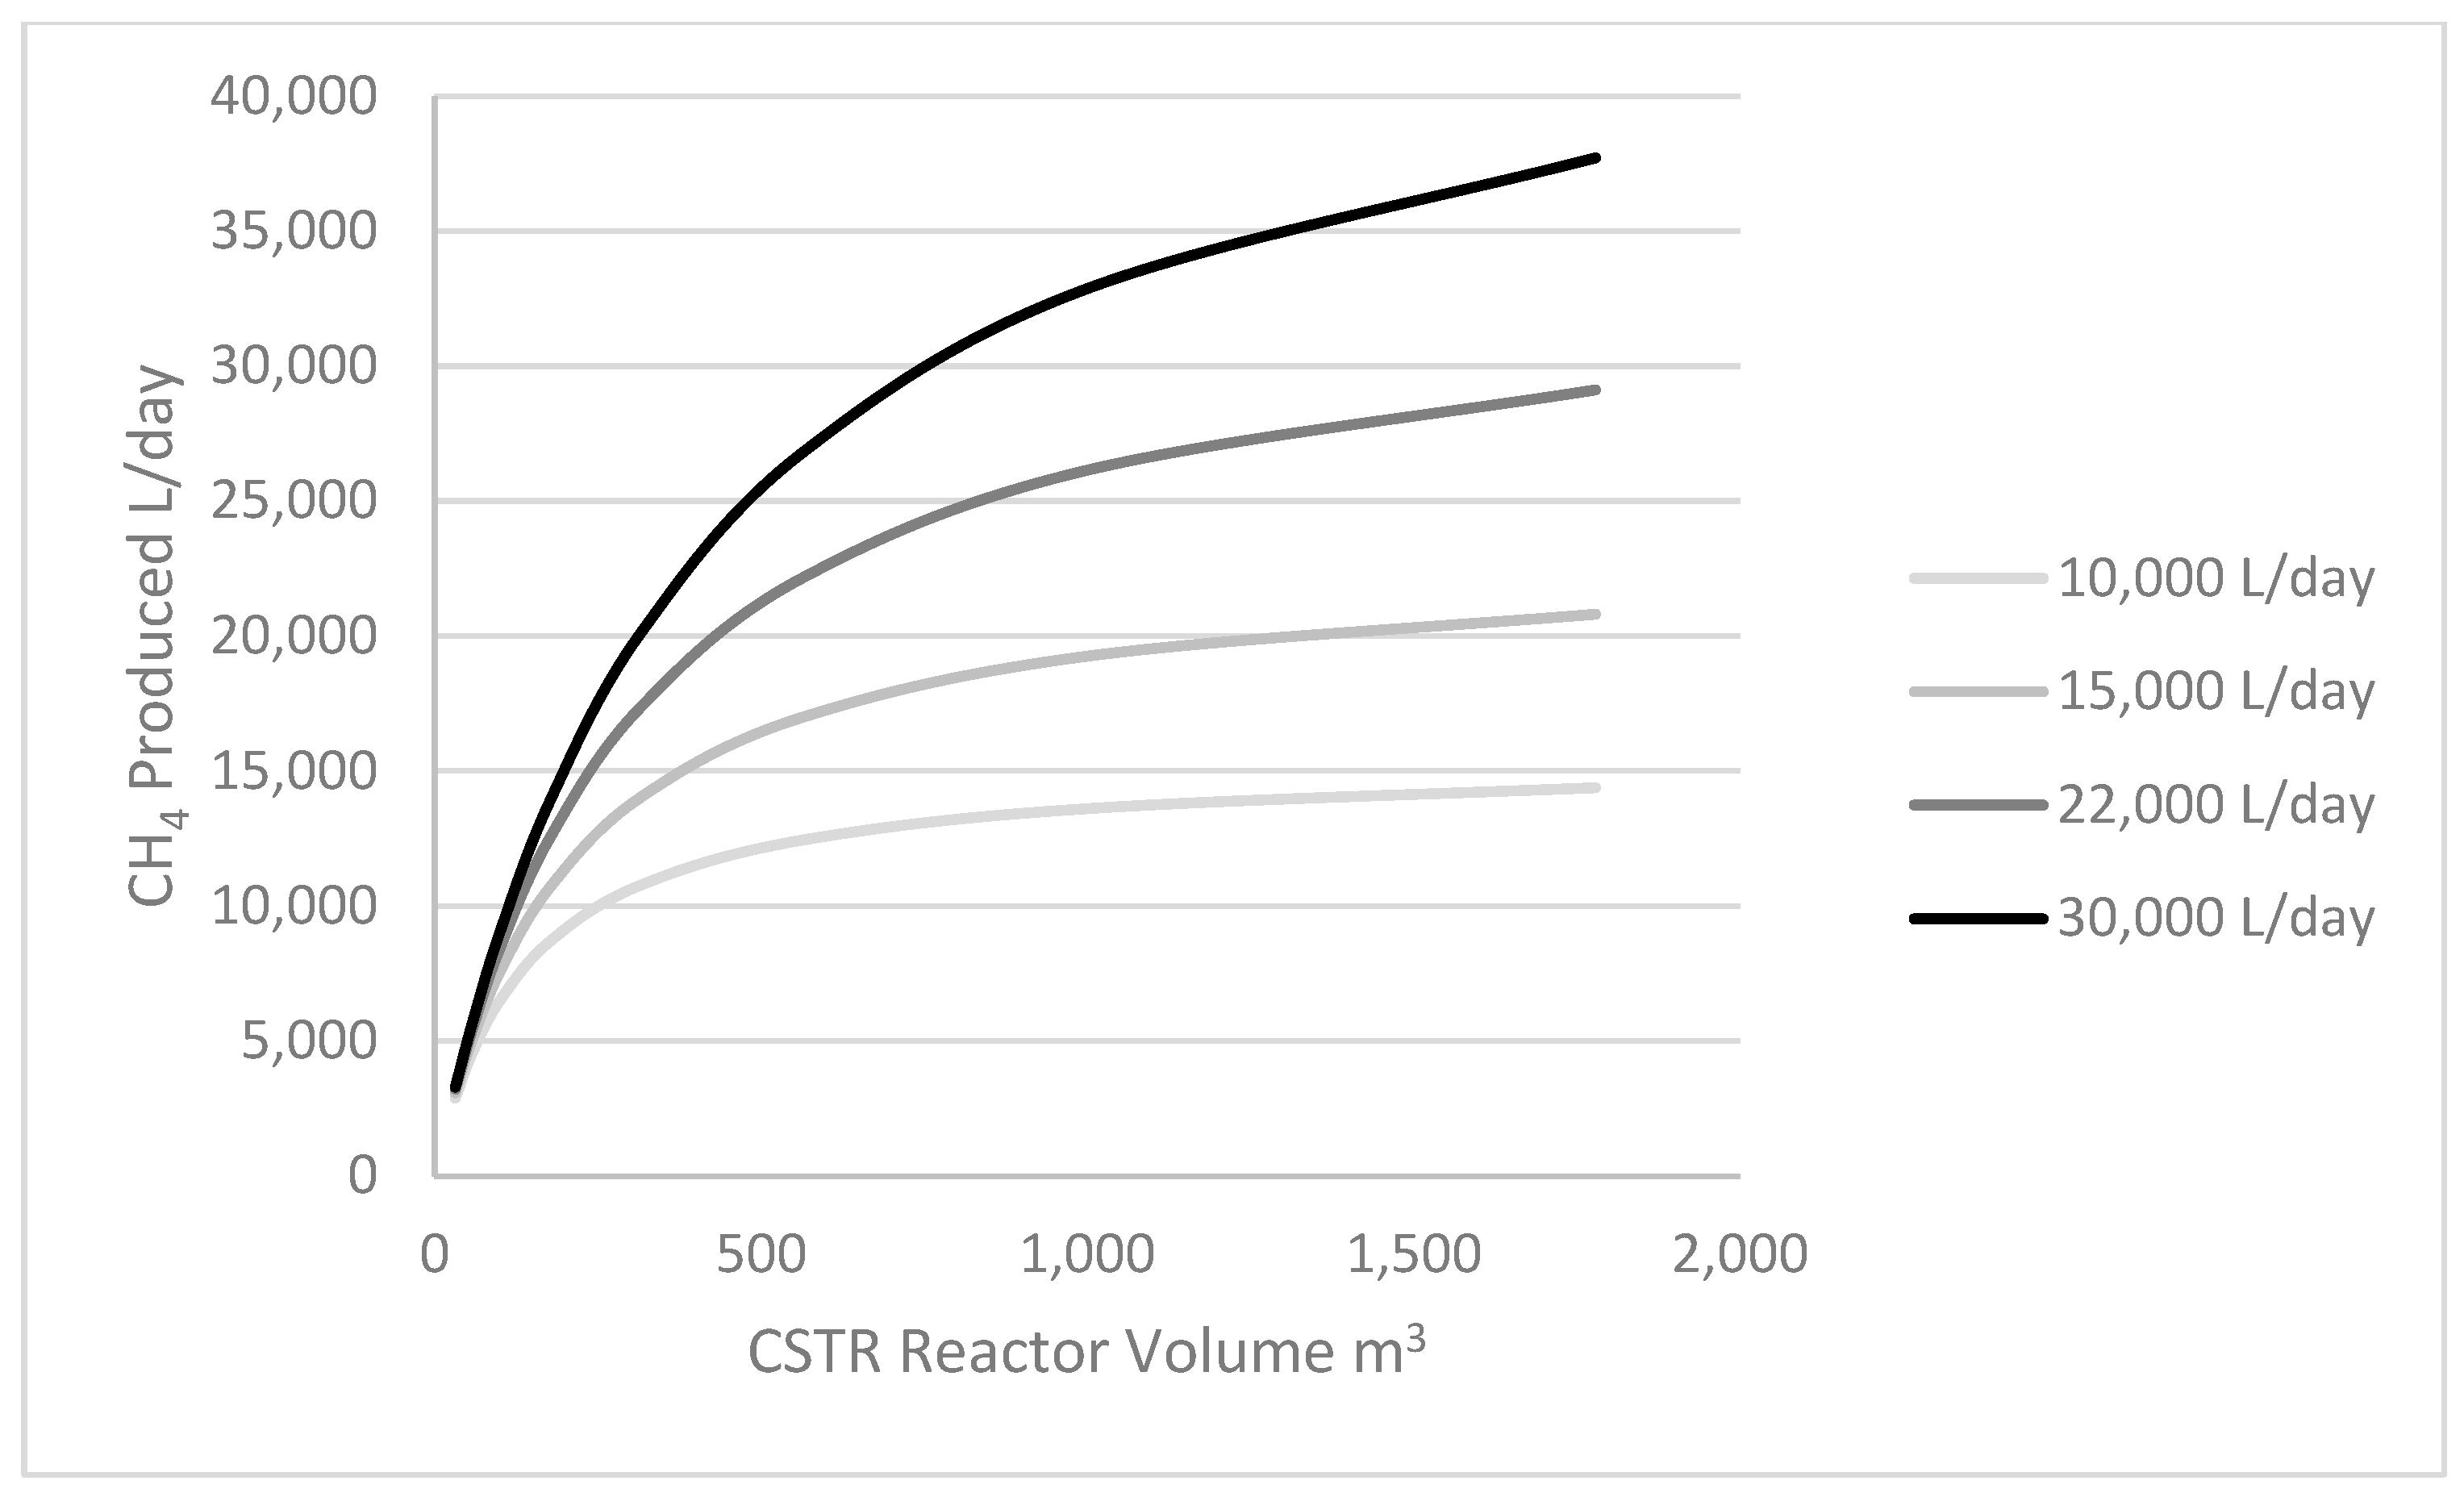
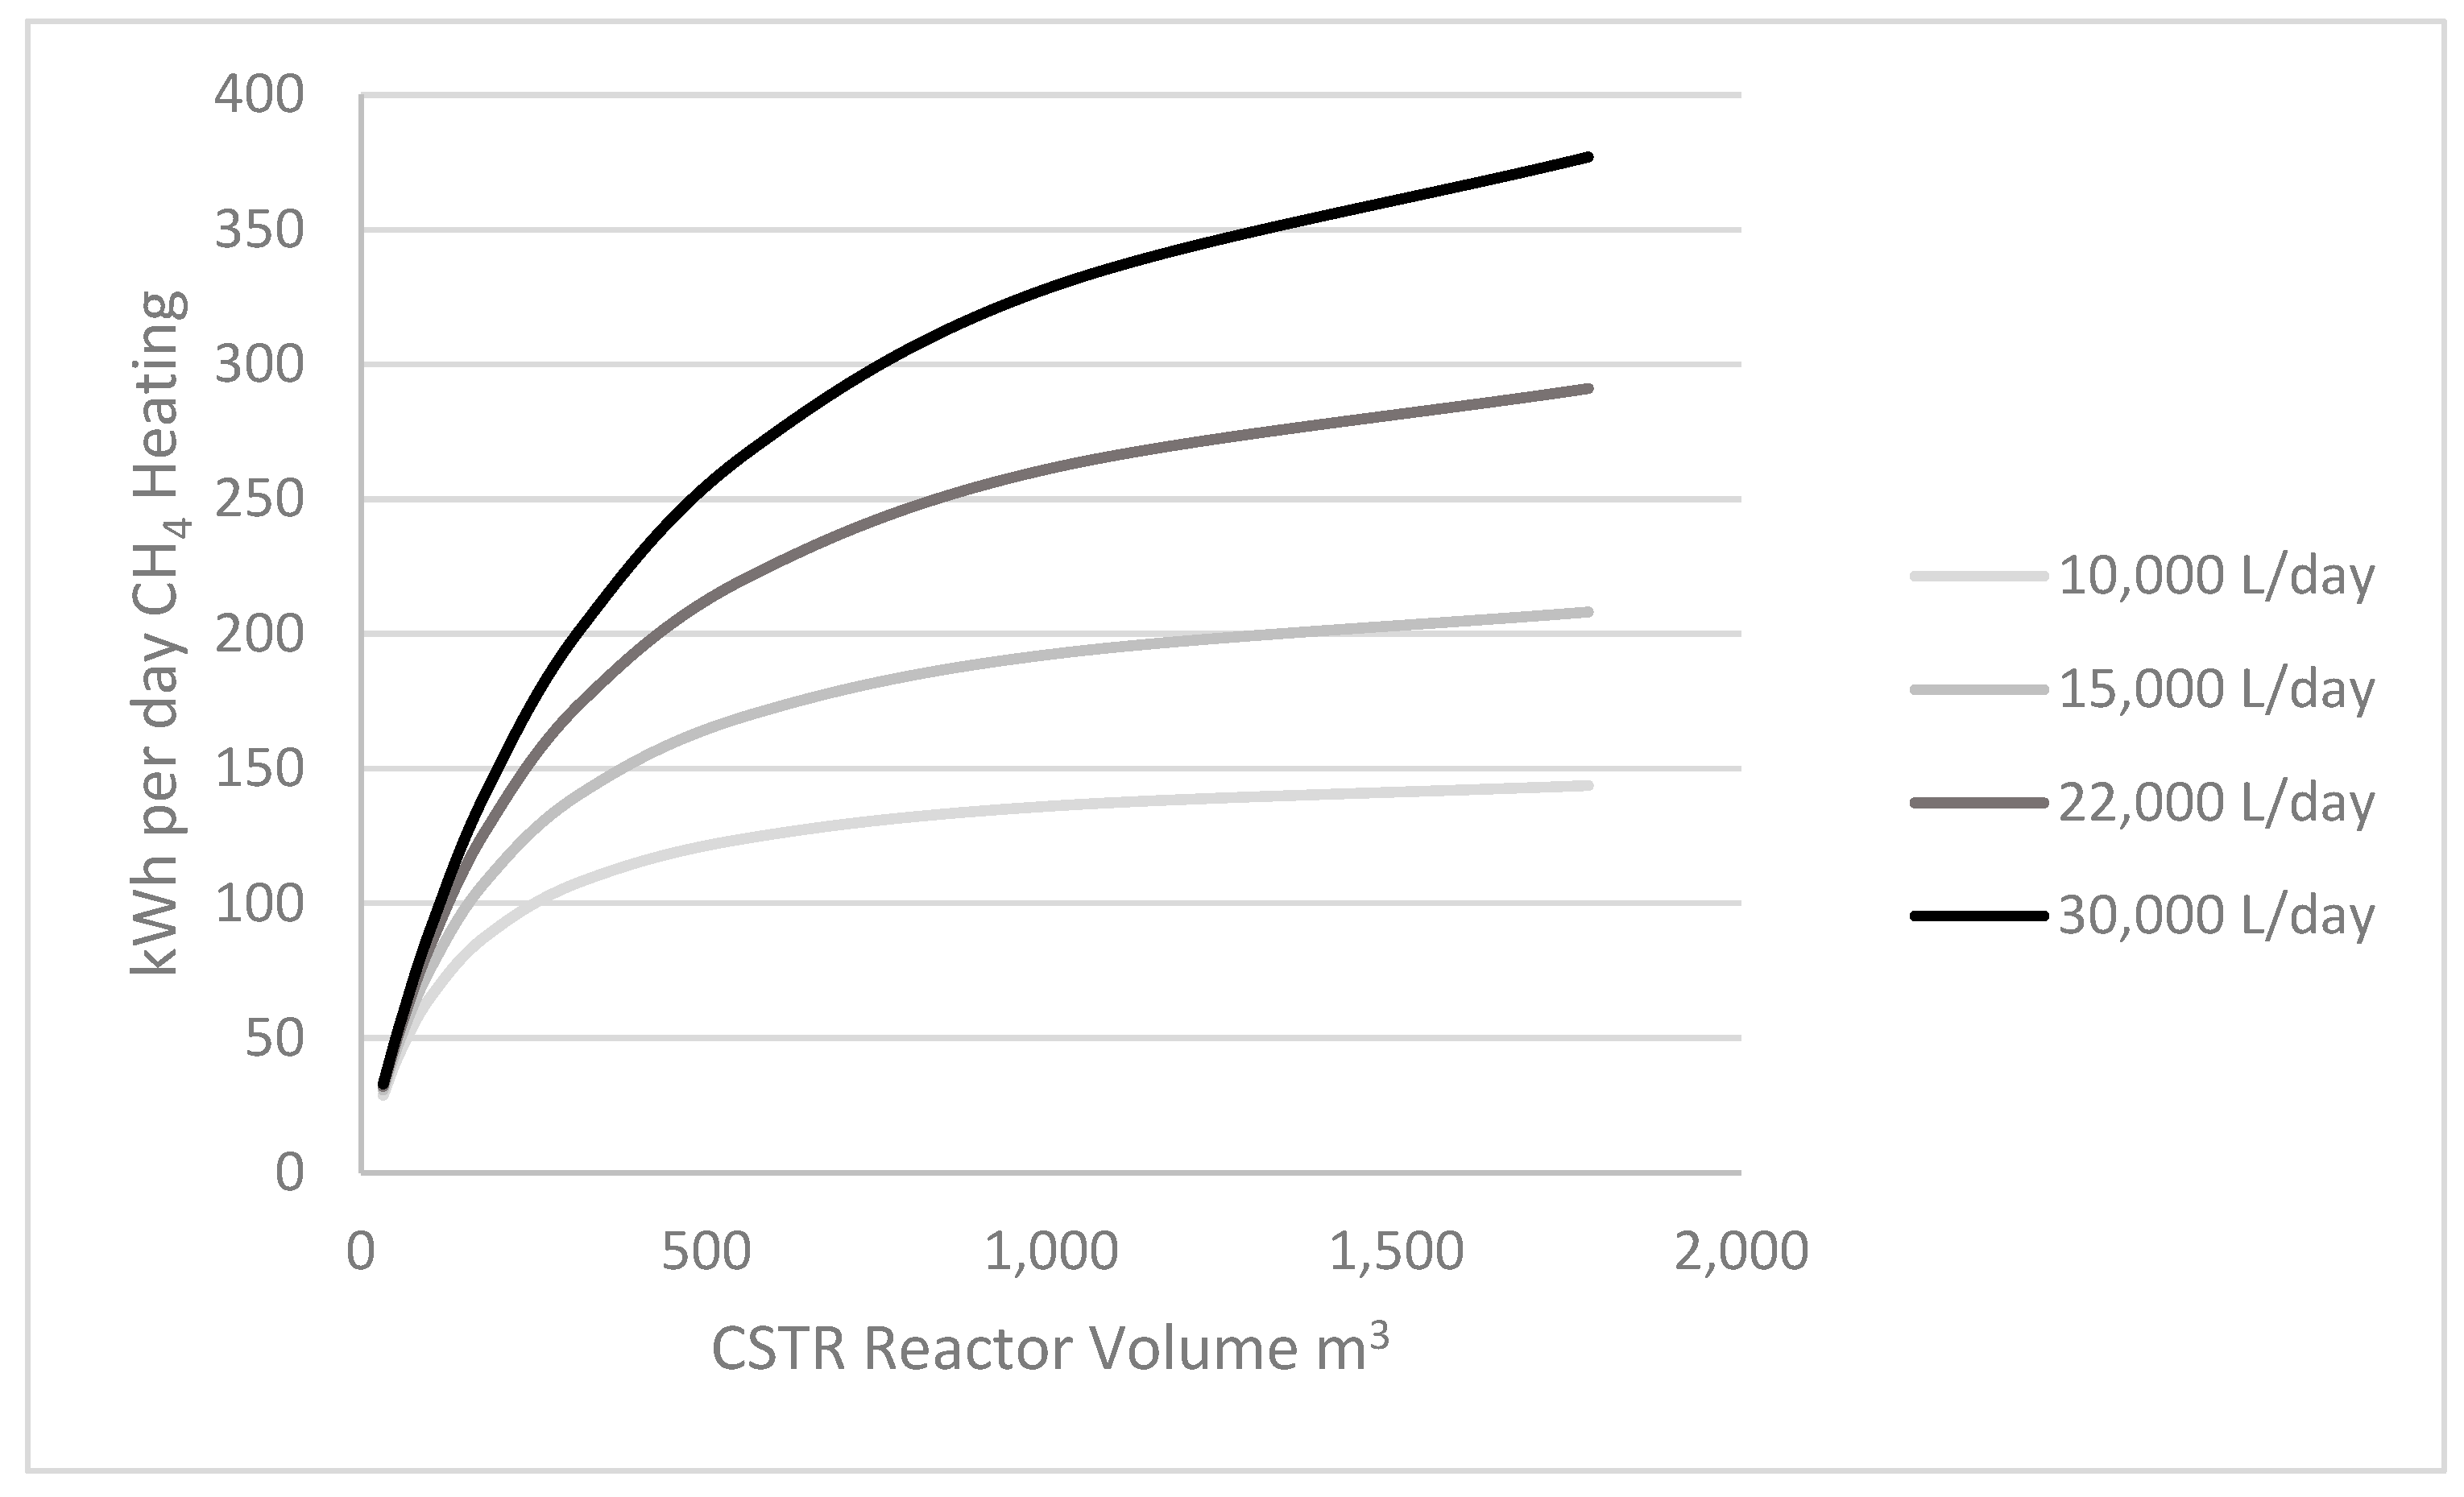
3.5. Process Modelling

Key digester kinetic parameters were derived from the biomethane potential experiments performed in the lab using farm samples. An example of the raw data is presented in Figure 1. The subsequent plot (Figure 2) of ln(1 − Y/Ymax) versus t determined that k1 + k2 = 0.295. For this BMP test, L1.24, the fractional yield was 50%. Thus, k1 was determined from Equation (9) to be 0.1475 day−1 and k2 to be 0.1475 day−1.
We can apply Equations (12) and (13) to generate Figure 3, which illustrates the biogas production for various reactor sizes and feed flow rates. Here we assume 1.85 g/L of vs. in the feed. Methane production estimated based on the biomethane potential experiments is within the ranges reported in Table 3, which is approximately 1 L of methane per L of effluent per day.
Assuming a calorific value of heating of 0.01 kWh per L of CH4, we obtained the following figure (Figure 4):
The feed flow rate and reactor volume both impact daily heating production, with the maximum methane output increasing with reactor size and effluent loading. A farm generating 30,000 L of liquid effluent per day from the weeping wall could potentially generate 320 kWh per day of heating.
Theoretical methane production can be calculated through physical and chemical analyses. These provide valuable information but are not as accurate as a BMP analysis. We used these analyses to compare our results. In terms of chemical oxygen demand, it is assumed that 1 g of COD is equivalent to a potential of 350 mL of methane. Based on this analysis, the liquid portion could provide 21 m3 CH4/day and the solid portion 11 m3 CH4/day. Total organic carbon (TOC) provides information on biogas production; it is assumed that 1 mol of organic carbon produces 1 mol of biogas or 1.86 L of biogas per gram of TOC. In regard to this parameter, 52 m3 of biogas/day and 170 m3 of biogas/day for liquid and solid portions, respectively, would be produced. Different studies have provided estimations of methane production from carbohydrate, lipid, and protein content [31,32,33,34]. The average content is as follows: 700, 1250, and 700 L biogas/kg substrate and methane content of 50%, 68%, and 70%, respectively, for carbohydrates, lipids, and proteins in dairy effluent. Based on this, it was found that 66 m3 CH4/day and 18 m3 CH4/day for the solid and liquid portions, respectively, could be produced.
From our BMP experiments, which were in a batch reactor, it was calculated that 1.36 MJ/cow day could be produced for the solid fraction. For the liquid fraction, this was estimated to be 0.4 MJ/cow day in psychrophilic conditions. From the CSTR modeling, it was found that a 1000 m3 flexitank with an organic loading rate of 1.85 kg VS/m3 d and a flow feed rate of 22 m3/day would produce the equivalent of 23.8 m3 of CH4, which is close to the theoretical values given in the previous paragraph. The methane concentration in the liquid portion found in our study was 85%, which is the equivalent of 1.3 m3 biogas/m3 effluent. This is similar to a study performed by Rico et al. [11], in which they used the liquid portion of dairy effluent after it had been screened and pressed into a CSTR reactor, with OLR ranging from 2.0 to 4.5 kg VS/m3 d, and obtained stable biogas productions of 0.66 to 1.47 m3/m3 d [11]. Our results are within this range for a CSTR reactor with a liquid portion of dairy effluent.

3.6. Case Study: Application of Methane for Water Heating on a System 5 Farm

We used the information obtained in the lab to calculate the potential use of the biogas for water heating on the farm we obtained the samples from. The necessary data for theoretical calculations are summarized in Table 8. Some of these values were calculated based on the information that the farmer had at the time, e.g., the time that cows spent in structures and washdown water.
The feed wastage was calculated from a diet consisting of 2 kg of maize silage, 2 kg of palm kernel extract (PKE), and 1 kg of dried distiller grains (DDG) fed on the feed pad at the time of the experiment. The industry values [6] for maize silage waste were 10–20%; we used an average of 15%; the value for PKE wastage is 15%; and the value for DDG is not provided by DairyNZ, but we assumed the same wastage value as PKE since it has a similar physical composition and cows behave in the same way when they eat this type of feed.
According to Morison et al. [15], the New Zealand Food Safety Authority recommends the following: “The minimum quantity of hot water available shall be 10 L per set of cups and 2% of the vat volume with a minimum volume for vats of 120 L”. In addition, the electricity used to go from 10 to 85 °C is 0.1 kwh per liter per day [15]. We applied these theoretical data to our chosen site. The farmer data were as follows: 40 cups, 16 m3 vat size, use approximately 600 L of hot water per day. If the water was heated with electricity, it would cost NZD $4620.6 per year, assuming an industrial price of NZD $0.25/kwh [36]. The same amount of energy produced from natural gas would be equivalent to NZD $675/year, assuming an industrial price of NZD $0.0366/kwh and a continuous water heating system with 83% efficiency [36]. The value for heating with electricity is similar to the one found by Bowler et al. [8], who suggested that the 17,736 kwh/year used on water heating per year at 0.30 NZD $/kwh would result in NZD $5321/year spent on water heating. If we assume the price per kwh to be the same, then the result would be NZD $5400/year.
While looking at the existing literature and using their assumptions, we found the worst-case scenario to be 245 MJ/day produced from liquid effluent [24]. The best case scenario would be 1280 MJ/day from the liquid component, based on [19]. While looking at our results, two points of reference can be drawn. For the liquid portion, BMP tests suggest production of 176 MJ/day, while CSTR models 861 MJ/day. For the solid portion, the 42-day BMP analysis suggests that 558 MJ/day could be produced. The energy required to heat up 600 L of water per day based on a continuous water heater with 83% efficiency is 221 MJ/day. This means that the following scenarios could provide enough energy for water heating on the farm: (1) AD of the solid portion of effluent only; and (2) AD of both the liquid and solid portions, but not the liquid fraction by itself.

4. Conclusions

Based on the review of literature data and our more up-to-date information, it is possible to conclude that there is enough biogas production on a system 5 farm to use a tankless water heater to fulfill the water heating requirements. Future analysis should focus on CSTR modeling of the anaerobic digestion of the solid component of dairy effluent, testing the structures on a real-world scale, an economic analysis of the system and biogas purification, and a life cycle analysis.

Author Contributions

Methodology, M.H.-C. and P.K.; Software, P.K.; Investigation, M.H.-C.; Data curation, P.K.; Writing—original draft, M.H.-C.; Writing—review and editing, M.L.; Supevision, M.L. and P.K. All authors have read and agreed to the published version of the manuscript.

Funding

This research received no external funding.

Data Availability Statement

Data is contained within the article.

Conflicts of Interest

The authors declare no conflict of interest.

References

  1. LIC. NZ Dairy Industry. Available online: https://licnz.com/about/nz-dairy-industry/ (accessed on 7 September 2022).
  2. Shahbandeh, M. Leading Producers of Cow Milk Worldwide 2021, by Country; Statista: Hamburg, Germany, 2022. [Google Scholar]
  3. DairyNZ. The 5 Production Systems. Available online: https://www.dairynz.co.nz/business/the-5-production-systems/ (accessed on 24 March 2020).
  4. Wallace, D.F.; Johnstone, P.R. Dairy Effluent—Composition, Application and Release; Research, P.F., Ed.; The New Zealand Institute for Plant & Food Research Limited: Auckland, New Zealand, 2010. [Google Scholar]
  5. Rollo, M.; Ledgard, S.; Longhurst, B. Trends in Dairy Effluent Management; Ministry for Primary Industries: Wellington, New Zealand, 2017. [Google Scholar]
  6. DairyNZ. Common Feed Supplements. Available online: https://www.dairynz.co.nz/feed/supplements/common-feed-supplements/ (accessed on 24 March 2020).
  7. DairyNZ. Farm Dairy Effluent (FDE) Systems; DairyNZ: Hamilton, New Zealand, 2014. [Google Scholar]
  8. Bowler, L. Energy Use on the Dairy Farm; DairyNZ: Hamilton, New Zealand, 2015. [Google Scholar]
  9. Gupta, S.K.; Mittal, M. Effect of Biogas Composition Variations on Engine Characteristics Including Operational Limits of a Spark-Ignition Engine. J. Eng. Gas Turbines Power 2019, 141, 101002. [Google Scholar] [CrossRef]
  10. Liao, P.H.; Lo, K.V.; Chieng, S.T. Effect of liquid—Solids separation on biogas production from dairy manure. Energy Agric. 1984, 3, 61–69. [Google Scholar] [CrossRef]
  11. Rico, C.; Rico, J.L.; Tejero, I.; Muñoz, N.; Gómez, B. Anaerobic digestion of the liquid fraction of dairy manure in pilot plant for biogas production: Residual methane yield of digestate. Waste Manag. 2011, 31, 2167–2173. [Google Scholar] [CrossRef] [PubMed]
  12. Rico, J.; García, H.; Rico, C.; Tejero, I. Characterisation of solid and liquid fractions of dairy manure with regard to their component distribution and methane production. Bioresour. Technol. 2007, 98, 971–979. [Google Scholar] [CrossRef] [PubMed]
  13. Lo, K.; Bulley, N.; Liao, P.; Whitehead, A. The effect of solids-separation pretreatment on biogas production from dairy manure. Agric. Wastes 1983, 8, 155–165. [Google Scholar] [CrossRef]
  14. Massé, D.I.; Cata Saady, N.M. Psychrophilic dry anaerobic digestion of dairy cow feces: Long-term operation. Waste Manag. 2015, 36, 86–92. [Google Scholar] [CrossRef] [PubMed]
  15. Morison, K.; Gregory, W.; Hooper, R. Improving Dairy Shed Energy Efficiency; University of Canterbury Campus: Christchurch, New Zealand, 2007; p. 122. [Google Scholar]
  16. Hohne, P.A.; Kusakana, K.; Numbi, B.P. A review of water heating technologies: An application to the South African context. Energy Rep. 2019, 5, 1–19. [Google Scholar] [CrossRef]
  17. Quintã, A.F.; Ferreira, J.A.; Ramos, A.; Martins, N.A.; Costa, V.A. Simulation models for tankless gas water heaters. Appl. Therm. Eng. 2018, 148, 944–952. [Google Scholar] [CrossRef]
  18. Bohac, D.; Schoenbauer, B.; Hewett, M.; Lobenstein, M.S.; Butcher, T. Actual Savings and Performance of Natural Gas Tankless Water Heaters; Center for Energy and Environment: Minneapolis, MN, USA, 2010. [Google Scholar]
  19. Craggs, R.; Park, J.; Heubeck, S. Methane emissions from anaerobic ponds on a piggery and a dairy farm in New Zealand. Aust. J. Exp. Agric. 2008, 48, 142–146. [Google Scholar] [CrossRef]
  20. Park, J.B.; Craggs, R.J. Biogas production from anaerobic waste stabilisation ponds treating dairy and piggery wastewater in New Zealand. Water Sci. Technol. 2007, 55, 257–264. [Google Scholar] [CrossRef] [PubMed]
  21. Yenamandra, A. Sustainable Energy for New Zealand Dairy Farms by Anaerobic Digestion of Dairy Farm Effluent. In School of Engineering; University of Waikato: Hamilton, New Zealand, 2016; p. 159. [Google Scholar]
  22. Stewart, D.; Trangm, B. Methane from Animal Waste Management Systems; MWH New Zealand Limited: Christchurch, New Zealand, 2008; p. 29. [Google Scholar]
  23. Craggs, R. Potential Energy Recovery by Anaerobic Digestion of Dairy Farm Waste; NIWA: Hamilton, New Zealand, 2006. [Google Scholar]
  24. Hartman, K. Dairy Digester Feasibility Assesment: Solids Availability and Energy Demand; Distributed Energy and Waste Systems: Auckland, New Zealand, 2007. [Google Scholar]
  25. Angelidaki, I.; Alves, M.M.; Bolzonella, D.; Borzacconi, L.; Campos, J.L.; Guwy, A.J.; Kalyuzhnyi, S.; Jenicek, P.; Van Lier, J.B. Defining the biomethane potential (BMP) of solid organic wastes and energy crops: A proposed protocol for batch assays. Water Sci. Technol. 2009, 59, 927–934. [Google Scholar] [CrossRef] [PubMed] [Green Version]
  26. Ward, A.J.; Feng, L.; Moset, V.; Moller, H.B. Estimation of Methane Yields in Continuous Biogas Reactors Using Kinetic and Mass Flow Models. Chem. Eng. Technol. 2018, 41, 761–767. [Google Scholar] [CrossRef]
  27. Ellwood, B.; Mason, I. Characteristics of farm dairy yard wastewater related to biological nutrient removal. Trans. ASAE 2003, 46, 825. [Google Scholar] [CrossRef]
  28. AgResearch. Characterising Dairy Manures and Slurries; AgResearch: Lincoln, New Zealand, 2011. [Google Scholar]
  29. Longhurst, R.D.; Rajendram, G.; Miller, B.; Dexter, M. Nutrient content of liquid and solid effluents on nz dairy cow farms. In Science and Policy: Nutrient Management Challenges for the Next Generation; Currie, L.D., Hedley, M.J., Eds.; Massey University: Palmerston North, New Zealand, 2017; p. 9. [Google Scholar]
  30. Møller, H.B.; Sommer, S.G.; Ahring, B.K. Methane productivity of manure, straw and solid fractions of manure. Biomass Bioenergy 2004, 26, 485–495. [Google Scholar] [CrossRef]
  31. Baserga, U. Land wirtschaftliche Co-Vergärungs-Biogasanlagen. FAT-Berichte Nr. 512, Eidg. Forschungsanstalt für Agrarwirtschaft und Landtechnik, Tänikon, Schweiz. In An Analysis of Available Mathematical Models for Anaerobic Digestion of Organic Substances for Production of Biogas, Proceedings of the International Gas Union Research Conference, San Diego, CA, USA, 8–11 November 1998; IGRC: Paris, France, 1998. [Google Scholar]
  32. Ingenieure, V.D. VDI 4630: Fermentation of Organic Materials: Characterisation of the Substrate, Sampling, Collection of Material Data, Fermentation Tests; Beuth Verlag: Berlin, Germany, 2016. [Google Scholar]
  33. Weissbach, F. Evaluation of the renewable primary products for biogas production. Part I: Gas production potential of the fermentable nutrients. Pflanzenbauwissenschaften 2009, 13, 72–85. [Google Scholar]
  34. Weiland, P. Fundamentals of Methane Fermentation-Biology and Substrates; Grundlagen der Methangaerung-Biologie und Substrate; Biogas als regenerative Energie–Stand und Perspektiven; VDI-Bericht: Duesseldorf, Germany, 2001. [Google Scholar]
  35. Northland Regional Council. Effluents from Feeds Pads, Stand-off Areas and Other Sources; Northland Regional Council: Dargaville, New Zealand, 2011. [Google Scholar]
  36. Ministry of Business, Innovation & Employment. Energy Prices; BA Energy, Ed.; Ministry of Business, Innovation & Employment: Wellington, New Zealand, 2022; Available online: https://www.farmersweekly.co.nz/special-report/dairy-input-costs-special-report/costs-put-the-squeeze-on-dairy/ (accessed on 3 January 2023).
Figure 1. Methane volume production over time.
Energies 16 02859 g001
Figure 2. Plot revealing kinetic parameters for the L1.24 dataset.
Energies 16 02859 g002
Figure 3. Daily methane production at different volumes and feed flow rates.
Energies 16 02859 g003
Figure 4. The biogas daily calorific heating is generated for different reactor volumes and effluent loads.
Energies 16 02859 g004
Table 1. Farming systems in New Zealand [3].
SystemDescription
1Grass-fed; no feed is imported. No supplementation is fed to the herd except what is grown in a paddock.
2Feed imported, either for supplementation or for dry cows. A total of 4–14% of feed is imported. There is a large variation in feed as, in high rainfall areas and cold climates such as Southland, most of the cows are wintered under cover away from the paddocks.
3Feed is imported to extend lactation (typically autumn feed) and for dry cows. 10–20% of total feed is imported. In the Westland region, feed to extend lactation may be imported in the spring rather than autumn.
4Feed is imported and used at both ends of lactation and for dry cows. 20–30% of total feed is imported onto the farm.
5The imported feed is used all year, throughout lactation, and for dry cows. 25–40% (but it can be up to 55%) of total feed is imported.
Table 4. Chemical analysis of effluent at different stages of the milking and treatment systems.
Milking ShedYardEnd of Feed PadLiquid Weeping WallSolid Weeping Wall
StateAqueousAqueousAqueousAqueousSlurry
Dry matter (kg/m3)2.215.7317.7140
Stdev0.84.517.52.91.5
Total nitrogen (kg/m3)0.074.51.30.43.4
Stdev0.030.070.80.20.4
COD (g O2/m3)220014,60018,400600025,480
Stdev1100-370027005320
COD (g O2/kg DW) a667930594779182
Stdev333-11935138
a Chemical oxygen demand—COD and DW—dry weight.
Table 5. Solid distribution in a solid separator.
Influent LiquidRetained
Solids concentration (kg/m3)14.133.3140
% of incoming solids10021.5%78.5%
Table 6. Characterization of liquid and solid effluents.
CharacteristicLiquidSolid
Volatile Solids (VS)1850 g/m371% of TS
Total Solids (TS) 3300 g/m314%
Total Nitrogen 290 g/m32.7 g/100 g DW a
Total Ammoniacal-N 178 g/m321 g/kg DW
Nitrate-N + Nitrite-N<0.10 g/m3N/A
Total Kjeldahl Nitrogen 290 g/m320 g/kg DW
Biochemical Oxygen Demand b 720 g O2/m316.4 g O2/kg
Chemical Oxygen Demand 3000 g O2/m3130 g O2/kg DW
Total Carbon 1380 g/m338 g/100 g DW
Oil and Grease 310 g/m31960 mg/kg
Tannin 152 g/m3N/A
Total VFA (as acetic acid) 320 g/m3N/A
Formic Acid<5 g/m3N/A
Acetic Acid200 g/m33.4 g/kg
Propionic Acid137 g/m33.7 g/kg
Butyric Acid 7 g/m31.1 g/kg c
NDF14.7% DM d58% DM
ADF9.5% DM51% DM
a DW—dry weight; b carbonaceous biochemical oxygen demand (cBOD5); c present as n-Butyric acid; i-butyric acid was <10 mg/kg. d units are in percentage of DM; DM—dry matter.
Table 7. Summary of findings from biomethane potential analysis.
SampleSubstrateVS a a (g)VS r b %Biogas
(NmL) c
CH4
%
NmL CH4
/gVSa
NmL CH4/
gVSr
TBMP
(NmL/gVS)
S.d18 d319 g31.7-89868%19.35-3020
S.D42 e319 g31.7-205568%65-3020
L.24400 mL0.7453%19685%121254500
L.35400 mL0.7447%22686%144336500
a Volatile solids added at the start of the experiment; b volatile solids removed at the time the experiments stopped; c NmL—normal ml have been adjusted to a standard pressure of 1 atm and a temperature of 273.15 K. d S.d18 = 18 days; e S.d42 = 42 days.
Table 8. Farm characteristics.
Characteristic
Herd size410 cows
Time spent on structures6 h
Lactation300 days
Washdown water 36 m3/day
Raw manure from herd5.6 m3/day a
Feed wastage348.5 kg/day b
Raw effluent dry matter26% c
Daily solid effluent generated2400 kg/day
Daily liquid effluent generated22 m3/day d
a Assumption of 3.4 L/cow hours, based on 16 active hours per day [35]. b Feed wastage calculated from DairyNZ values of wastage per type of feed [6] and the known diet; c value from [28]. d A total of 20 m3 of the washdown are recycled daily so they are not included in the total generated daily.
Disclaimer/Publisher’s Note: The statements, opinions and data contained in all publications are solely those of the individual author(s) and contributor(s) and not of MDPI and/or the editor(s). MDPI and/or the editor(s) disclaim responsibility for any injury to people or property resulting from any ideas, methods, instructions or products referred to in the content.

