Article

Experimental Investigation of High-Pressure Liquid Ammonia Injection under Non-Flash Boiling and Flash Boiling Conditions

1
State Key Laboratory of Automotive Safety and Energy, Tsinghua University, Beijing 100084, China
2
Mechanical and Aerospace Engineering Department, Brunel University, Kingston Lane, Uxbridge, London UB8 3PH, UK
*
Author to whom correspondence should be addressed.
Energies 2023, 16(6), 2843; https://doi.org/10.3390/en16062843
Submission received: 7 February 2023 / Revised: 6 March 2023 / Accepted: 15 March 2023 / Published: 18 March 2023

Abstract

:
Liquid ammonia is an ideal zero-carbon fuel for internal combustion engines. High-pressure injection is a key technology in organizing ammonia combustion. Characteristics of high-pressure liquid ammonia injection is lack of research. Spray behaviors are likely to change when a high-pressure diesel injector uses liquid ammonia as its fuel. This study uses high-speed imaging with a DBI method to investigate the liquid penetration, width, and spray tip velocity of high-pressure liquid ammonia injection up to 100 MPa. Non-flash and flash boiling conditions were included in the experimental conditions. Simulation was also used to evaluate the results. In non-flash boiling conditions, the Hiroyasu model provided better accuracy than the Siebers model. In flash boiling conditions, a phenomenon was found that liquid penetration and spray tip velocity were strongly suppressed in the initial stage of the injection process, this being the “spray resistance phenomenon”. The “spray resistance phenomenon” was observed when ambient pressure was below 0.7 MPa during 0–0.05 ms ASOI and was highly related to the superheated degree. The shape of near-nozzle sprays abruptly changed at 0.05 ms ASOI, indicating that strong cavitation inside the nozzle caused by needle lift effects is the key reason for the “spray resistance phenomenon”.

1. Introduction

In recent years, there has been a global consensus to reduce carbon emissions. Researchers on engine development and power engineering have been exerting considerable effort to replace fossil fuels [1,2,3]. Liquid ammonia is an ideal fuel to achieve zero carbon emissions for internal combustion engines and other power applications because ammonia does not contain any carbon and is easy to store and transport [4,5,6]. Moreover, ammonia can be synthesized using hydrogen, which can be produced using renewable energy sources [7]. Ammonia contains nitrogen, which can cause NOX emission at low engine loads, but in high engine loads, the NOX emissions decrease because of the low combustion temperature of ammonia [8,9]. The NOX emissions of ammonia can be decreased by optimizing injection strategies [10,11] and can be removed with unburned ammonia in a selective catalytic reduction (SCR) system [12]. Therefore, the NOX emissions of liquid ammonia are not a severe problem. In direct injection engines, fuel should be mixed with air and distributed in the entire combustion chamber to realize superior combustion performance. Hence, the injection pressure of liquid ammonia should be increased to achieve rapid distribution and atomization in combustion chambers, particularly in large-bore engines.
Liquid ammonia is a liquefied fuel gas. Liquefied fuel gases, such as liquid ammonia, liquid propane, and liquefied petroleum gas (LPG), have higher saturation pressure and lower viscosity and density than diesel and gasoline. Differences in physical properties can cause large differences in spray and evaporation [13]. Li et al. discovered the flash boiling phenomenon and clarified the satiations of fuel and ambient temperatures that cause flash boiling and significant spray expansion [14]. Soo et al. studied the spray characteristics of LPG and other conventional liquid fuels using a GDI injector up to 15 MPa in addition to discovering the flash boiling phenomenon [15,16]. The expansion caused by flash boiling changes spray characteristics significantly. Liquid CO2 can also be superheated in high ambient pressure, in which the explosion of bubbles improves atomization [17,18,19]. However, atomization quality decreases with the interaction of sprays of multi-hole GDI injectors, causing the spray collapse phenomenon [20,21,22,23,24]. Zhang et al. compared high-pressure liquid ammonia and diesel injection up to 50 MPa in non-flash boiling conditions [10]. They found that there was no essential difference in non-flash boiling conditions except liquid penetration and spray cone angle differences caused by different fuel properties. Kim et al. investigated the spray characteristics of LPG with different injection pressures [25]. The results demonstrated that spray penetration decreases with an increase in injection pressure. Lee et al. compared the spray characteristics of LPG, dimethyl ether, and dodecane [26,27]. Their experiments demonstrated that LPG gasified faster than dodecane because of the flash boiling of LPG. Its spray characteristics were more sensitive to ambient temperature and pressure than dodecane. Beroun et al. tested LPG injection in the intake manifold of an engine and explained that the extreme low temperature generated in the spray caused injector tip icing [28]. Angelilli et al. noticed that liquid ammonia also has a cooling effect because of its large latent heat, preventing droplets from boiling in hot environments [29]. Ainsalo et al. compared the spray characteristics of liquid propane with other conventional liquid fuels [30]. They found that the spray penetration of liquid propane is lower than other liquid fuels. High injection pressure up to 100 MPa increases the difference in spray penetration between liquid propane and other liquid fuels. Zhang et al. found that high pressure supercritical propane jets up to 12 MPa can generate Mach disks [31]. Flash boiling of fuel also causes injector tip wetting. The closing time of LPG was shorter than other liquid fuels because of its low viscosity. Yeom et al. conducted LPG injection up to 0.8 MPa using the GDI injector. They found that vapor generated inside the rail causes the “vapor lock” phenomenon, making the engine hard to restart [32]. Cheng et al. tested the spray characteristics of high-pressure liquid ammonia injection up to 100 MPa using a hollow cone piezo injector [33]. The experiment demonstrated that the spray penetration and area of liquid ammonia are higher than those of methanol and ethanol because of its low viscosity and density. Zhang et al. used schlieren technology to investigate gas ammonia injections up to 0.8 MPa [34]. They found that the spray tip penetration of gas ammonia is similar to methane, while the equivalence ratio of gas ammonia is lower than methane. Overall, liquid ammonia can be treated as a typical liquefied fuel gas in the field of sprays. Experimental results in the literature have shown that the flash boiling of liquefied fuel gas completely changes the spray characteristics. Liquefied fuel gas also generates “vapor lock” inside the injection system, blocking the injection process. Although liquid ammonia was not found to have essential differences with diesel in non-flash boiling conditions, the spray characteristics still have differences caused by different fuel properties. Furthermore, high-pressure injection enlarges the difference in spray characteristics between liquefied fuel gas and conventional liquid fuels. More studies are needed to clarify the effects of high injection pressure on liquefied fuel gas spray.
Similar to liquid propane and LPG, liquid ammonia has come into view in recent years. Owing to its high ignition temperature (651 °C) and narrow flammable limit (15% to 28%) [6], most studies on high-pressure liquid ammonia injection are within the field of dual fuel combustion. Scharl and Sattelmayer used a pilot diesel flame to ignite a high-pressure liquid ammonia spray up to 53 MPa [35]. They found that the interaction angle between the diesel jet and liquid ammonia jet strongly affected the ignition delay and heat release rate of ammonia combustion. The visualized experiment demonstrated more information on the spray and flame characteristics [36]. They also revealed that the instability of ammonia flame is mainly caused by the difficulty of achieving a good quality of the fuel-air mixture. Zhang et al. conducted diesel-ammonia dual fuel injections in an optic engine [10]. Liquid ammonia was injected into the combustion chamber at high pressure up to 65 MPa. The use of different injection timings of ammonia and diesel can achieve premixed and diffusive combustion of ammonia and also strongly affect the heat release rate and thermal efficiency. Ichikawa et al. designed and tested a unique injector that can achieve a supporting fuel/liquid NH3/supporting fuel three-layer spray [37]. C16H34 was used as the supporting fuel and promoted the combustion of NH3. Mao et al. used polyoxy-methylene dimethyl ethers (PODE) to replace diesel as a pilot fuel [38]. PODE can ignite ammonia without producing large amounts of soot. In summary, the interaction of diesel and liquid ammonia sprays and the mixture formation of ammonia and air are keys to reaching high-efficiency ammonia combustion. Hence, models should be designed to predict the spray characteristics of high-pressure liquefied fuel gas sprays, particularly liquid ammonia.
For model predictions of liquefied fuel gas, Li et al. investigated high-pressure liquid ammonia sprays up to 30 MPa and compared them with the Hiroyasu model [39]. The results show that the spray penetration deviation of the modeled and experimental values rapidly increased when the superheat degree exceeded 5. Kim et al. used the KH-RT model coupled with the flash breakup and modified gas-jet models to predict the spray characteristics of liquid propane sprays up to 10 MPa [40]. Details of the flash breakup model are discussed in [41]. They found that only using the flash breakup model cannot predict the spray shape of liquid propane sprays. The modified gas-jet model can improve the accuracy of predictions, but the deviations in the model and experiment are still larger than those for conventional liquid fuel. Guo et al. used the homogeneous relaxation model (HRM) to analyze the shock structure of liquid propane sprays [42]. The shock structure in simulation was found to be relatively similar to the experiment result. Scharl et al. validated the Musculus and Kattke 1D control volume model in high-pressure liquid ammonia injection up to 53 MPa [36,43]. Liquid and vapor penetrations fit well with the 1-D model. In current research, the applicability of spray models in high-pressure liquefied fuel gas cannot be validated for lack of experimental data.
In summary, owing to the utility of ammonia in large-bore diesel engines, the requirements for spray formations of liquid ammonia are different from other light fuels. The injection pressure of liquid ammonia needs to be increased to rapidly reach adequate atomization away from the nozzle. However, the characteristics of liquid ammonia sprays under high injection pressures are not clear because most of the visualized research on liquid ammonia and other liquefied fuel gases was conducted below 53 MPa. The effects of flash boiling on high-pressure injections are not clear either. In the conducted research, we visualized experiments of high-pressure liquid ammonia injection up to 100 MPa and performed analysis under non-flash and flash boiling conditions. In non-flash boiling conditions, the Siebers model and Hiroyasu model were chosen to be compared with the experiment. In flash boiling conditions, the spray tip velocity was strongly suppressed in the initial stage of injections, which is called the “spray resistance phenomenon” in this paper. The reason of the “spray resistance phenomenon” is that the needle lift effect caused cavitation inside the nozzle, generating a large amount of vapor that blocked the nozzle hole. The results of these experiments are beneficial as numerical research and also towards the design of injection systems.

2. Materials and Methods

2.1. Experimental Setup

A high-pressure chamber and high-speed camera were used to conduct the visualized experiment in this paper. The experimental apparatus is shown in Figure 1. The product model of the high-speed camera was Photron SA-Z. The product model of the LED light source was Godox VL300. A modified high-pressure pneumatic fluid pump was used to achieve high injection pressure up to 100 MPa. The key parameters of the experimental conditions are shown in Table 1. A diesel injector was used to inject liquid ammonia. The diameter of the nozzle hole was 0.168 mm, which was provided by the manufacturer of the injector (https://www.nydk.cn/, accessed on 20 July 2022). The visualized diagnostics were conducted in a high-pressure constant volume chamber. The working pressure of the constant volume chamber was 15 MPa and the volume was 1.7 L, which were enough for the experiment.
Experiments were carried out at room temperature (300 K). The experimental conditions, including ambient pressure (Pamb), ambient density (ρamb), and injection pressure (Pinj), are shown in Table 2. The fuel was high-purity liquid ammonia (99.9999%). The saturation pressure of ammonia at room temperature is 1.06 MPa, according to the NIST database [44]. Above the saturation pressure, liquid ammonia spray and droplets undergo conventional evaporation. Below Pamb 1 MPa, the liquid core and droplets become superheated and generate a very large number of internal bubbles. The liquid ammonia spray expands considerably because of rapid vapor generation and bubble explosion, defined as flash boiling. Additionally, Pamb 1 MPa is classified as non-flash boiling conditions because the local saturation pressure in the nozzle is lower than 1.06 MPa. The cooling effect of ammonia evaporation in injector fuel return decreases the local saturation pressure of liquid ammonia. The experimental result in this paper also demonstrated non-flash boiling behaviors at Pamb 1 MPa. As a result, cases 1–9 and 22–23 are flash boiling conditions, and cases 10–21 are non-flash conditions. The distribution of Pamb is more intensive between 0.1 and 1.0 MPa because flash boiling changes the spray characteristics significantly. In order to find the transition point caused by flash boiling, Pamb is more intensive between 0.1 and 1.0 MPa. Furthermore, each case was repeated 10 times to ensure the repeatability of experiments.

2.2. Images and Data Processing Method

Spray characteristics can be obtained via image processing [22,31,39]. The image processing process is shown in Figure 2. The raw images were processed using black-white inversion and background subtraction. After that, the nozzle and speckles were removed from the image. Then, the image was binarized using the adaptive threshold. The liquid penetration and spray width were measured as shown in Figure 2c.
The spray tip velocity (V) is calculated by liquid penetration (L) as Equation (1).
V ( t ) = L ( t + Δ t ) Δ t

2.3. Modeling

Given the limited validation of the applicability of spray models towards high-pressure liquefied fuel gas, the Siebers and Hiroyasu models were selected to be tested in this paper.
The correlation of the Siebers model is presented as Equations (2)–(4) [45].
t ˜ = L ˜ 2 + L ˜ 4 1 + 16 L ˜ 2 + 1 16 ln 4 L ˜ + 1 + 16 L ˜ 2
The short time limit is as follows:
lim t ˜ 0 L ˜ = t ˜
The long time limit is as follows:
lim t ˜ L ˜ = t ˜ 1 / 2
where t ˜ and L ˜ represent the dimensional time and dimensional spray liquid penetration, respectively, which are calculated using Equations (5) and (6), respectively.
t ˜ = t t +
L ˜ = L L +
where t+ and L+ are the time and coordinate scales presented as Equations (7) and (8):
t + = d f ρ f / ρ amb a tan θ / 2 V f
L + = d f ρ f / ρ amb a tan θ / 2
where
d f = C a d 0
V f = C v 2 Δ P ρ f
In the preceding equations, θ is the spray cone angle, Ca is the contractive coefficient, Cv is the velocity coefficient, and a is a constant value, which is 0.66.
Apart from the Siebers model, the Hiroyasu model is another well-known 1D model in predicting liquid penetration. The Hiroyasu model is presented as Equations (11)–(13) [46]. In particular, L (m) is the liquid penetration, ΔP (Pa) is the pressure difference of Pamb and Pinj, ρf (kg/m3) is the density of fuel, ρamb (kg/m3) is the density of ambient gas, d0 (m) is the nozzle hole diameter, and t (s) is time, which is time after the start of injection (ASOI).
When 0 < t < tbreak,
L = 0.39 2 Δ P ρ f t
When ttbreak,
L = 2.95 Δ P ρ amb 1 / 4 d 0 t
where
t break = 29 ρ f d 0 ρ amb Δ P 1 / 2

3. Results and Discussion

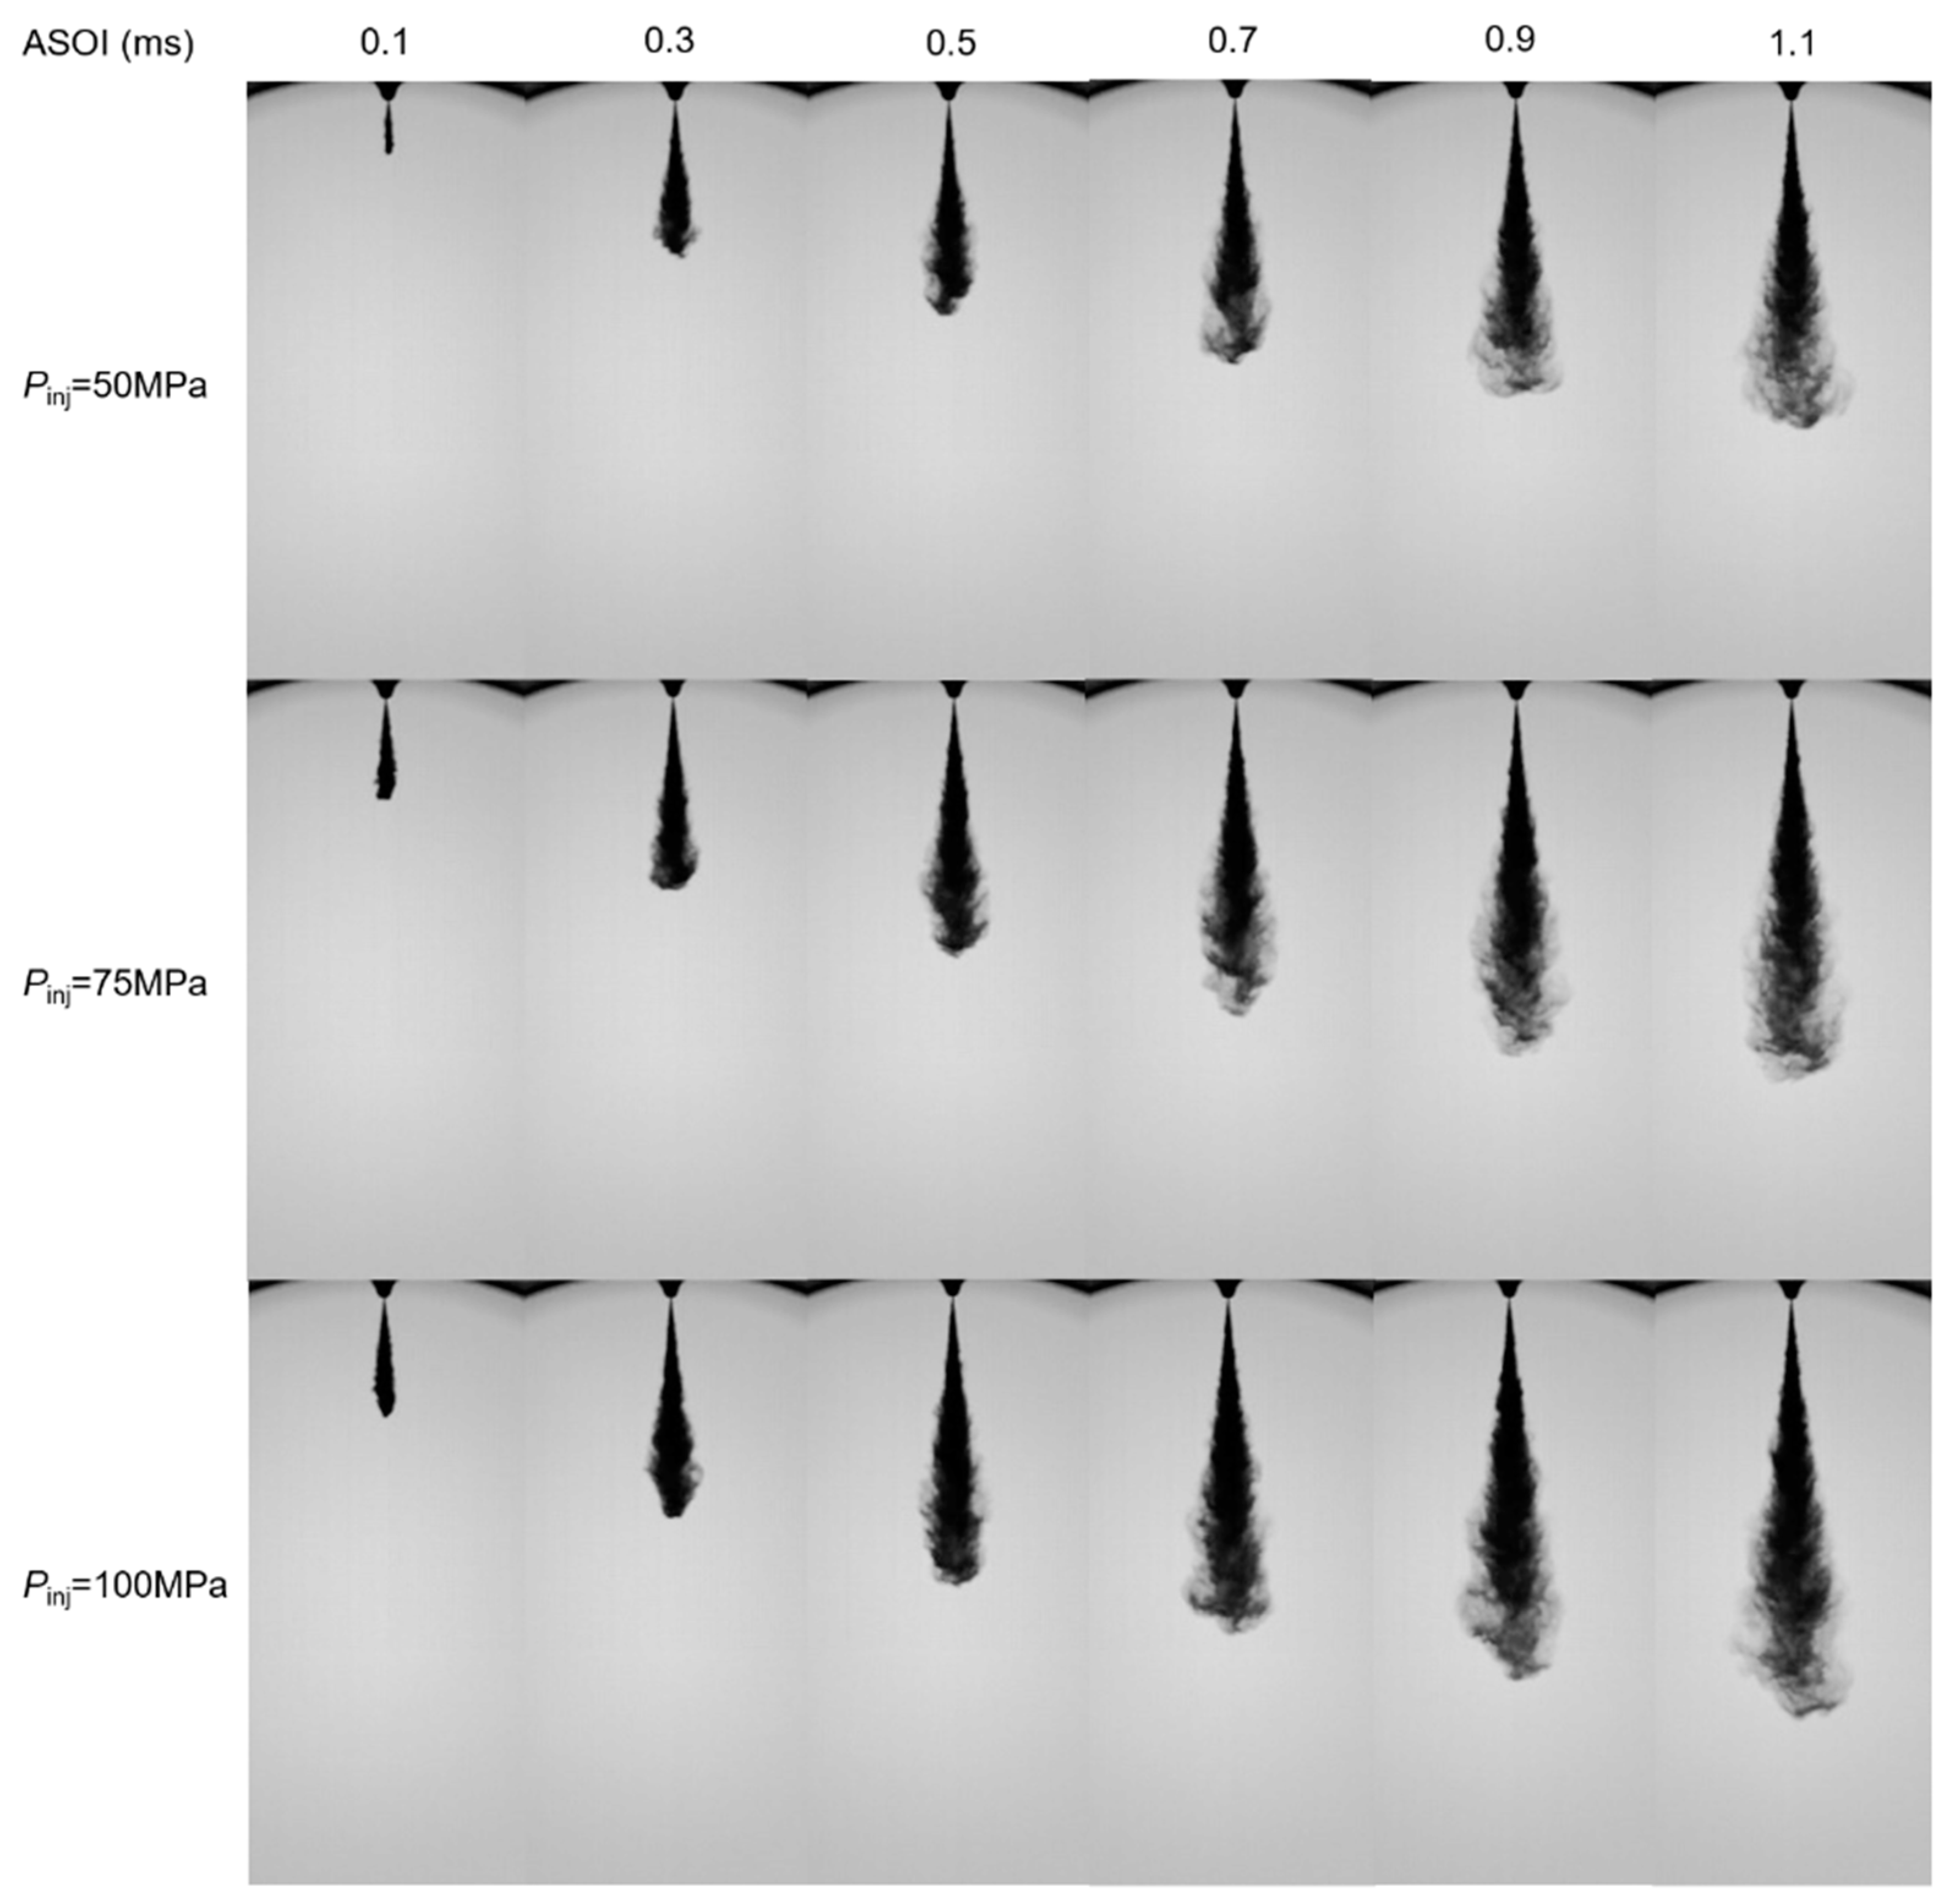
3.1. Non-Flash Boiling Spray

Several experiments were conducted under non-flash boiling at the ambient pressure of 1–4 MPa. The group of spray images at different time ASOIs is shown in Figure 3. The pattern of high-pressure ammonia spray is similar to that of high-pressure diesel injection. In this regard, liquid penetration was measured and examined using the Siebers and Hiroyasu models.

3.1.1. Discussion of the Siebers Model

The penetration predictions using the Siebers model are compared in Figure 4. After injection, the spray continues to grow until the liquid penetration exceeds the visible area of the window. Liquid penetration increased with an increase in Pinj and decrease in Pamb. The Siebers model predicted higher liquid penetration when Pamb ranged from 1 MPa to 4 MPa. Sprays were fully developed when approaching the window limit of 70 mm. At that time, the error of the Siebers model changed from 37% to 28% when Pamb changed from 1 to 4 MPa at Pinj 50 MPa. When the Pinj equaled 100 MPa, the error of the Siebers model changed from 20% to 23% with the increase in Pamb from 1 to 4 MPa. When Pamb and Pinj increased, the error of the Siebers model decreased. That means the Siebers model can predict more accurately in high Pamb and Pinj conditions than low Pamb and Pinj conditions.

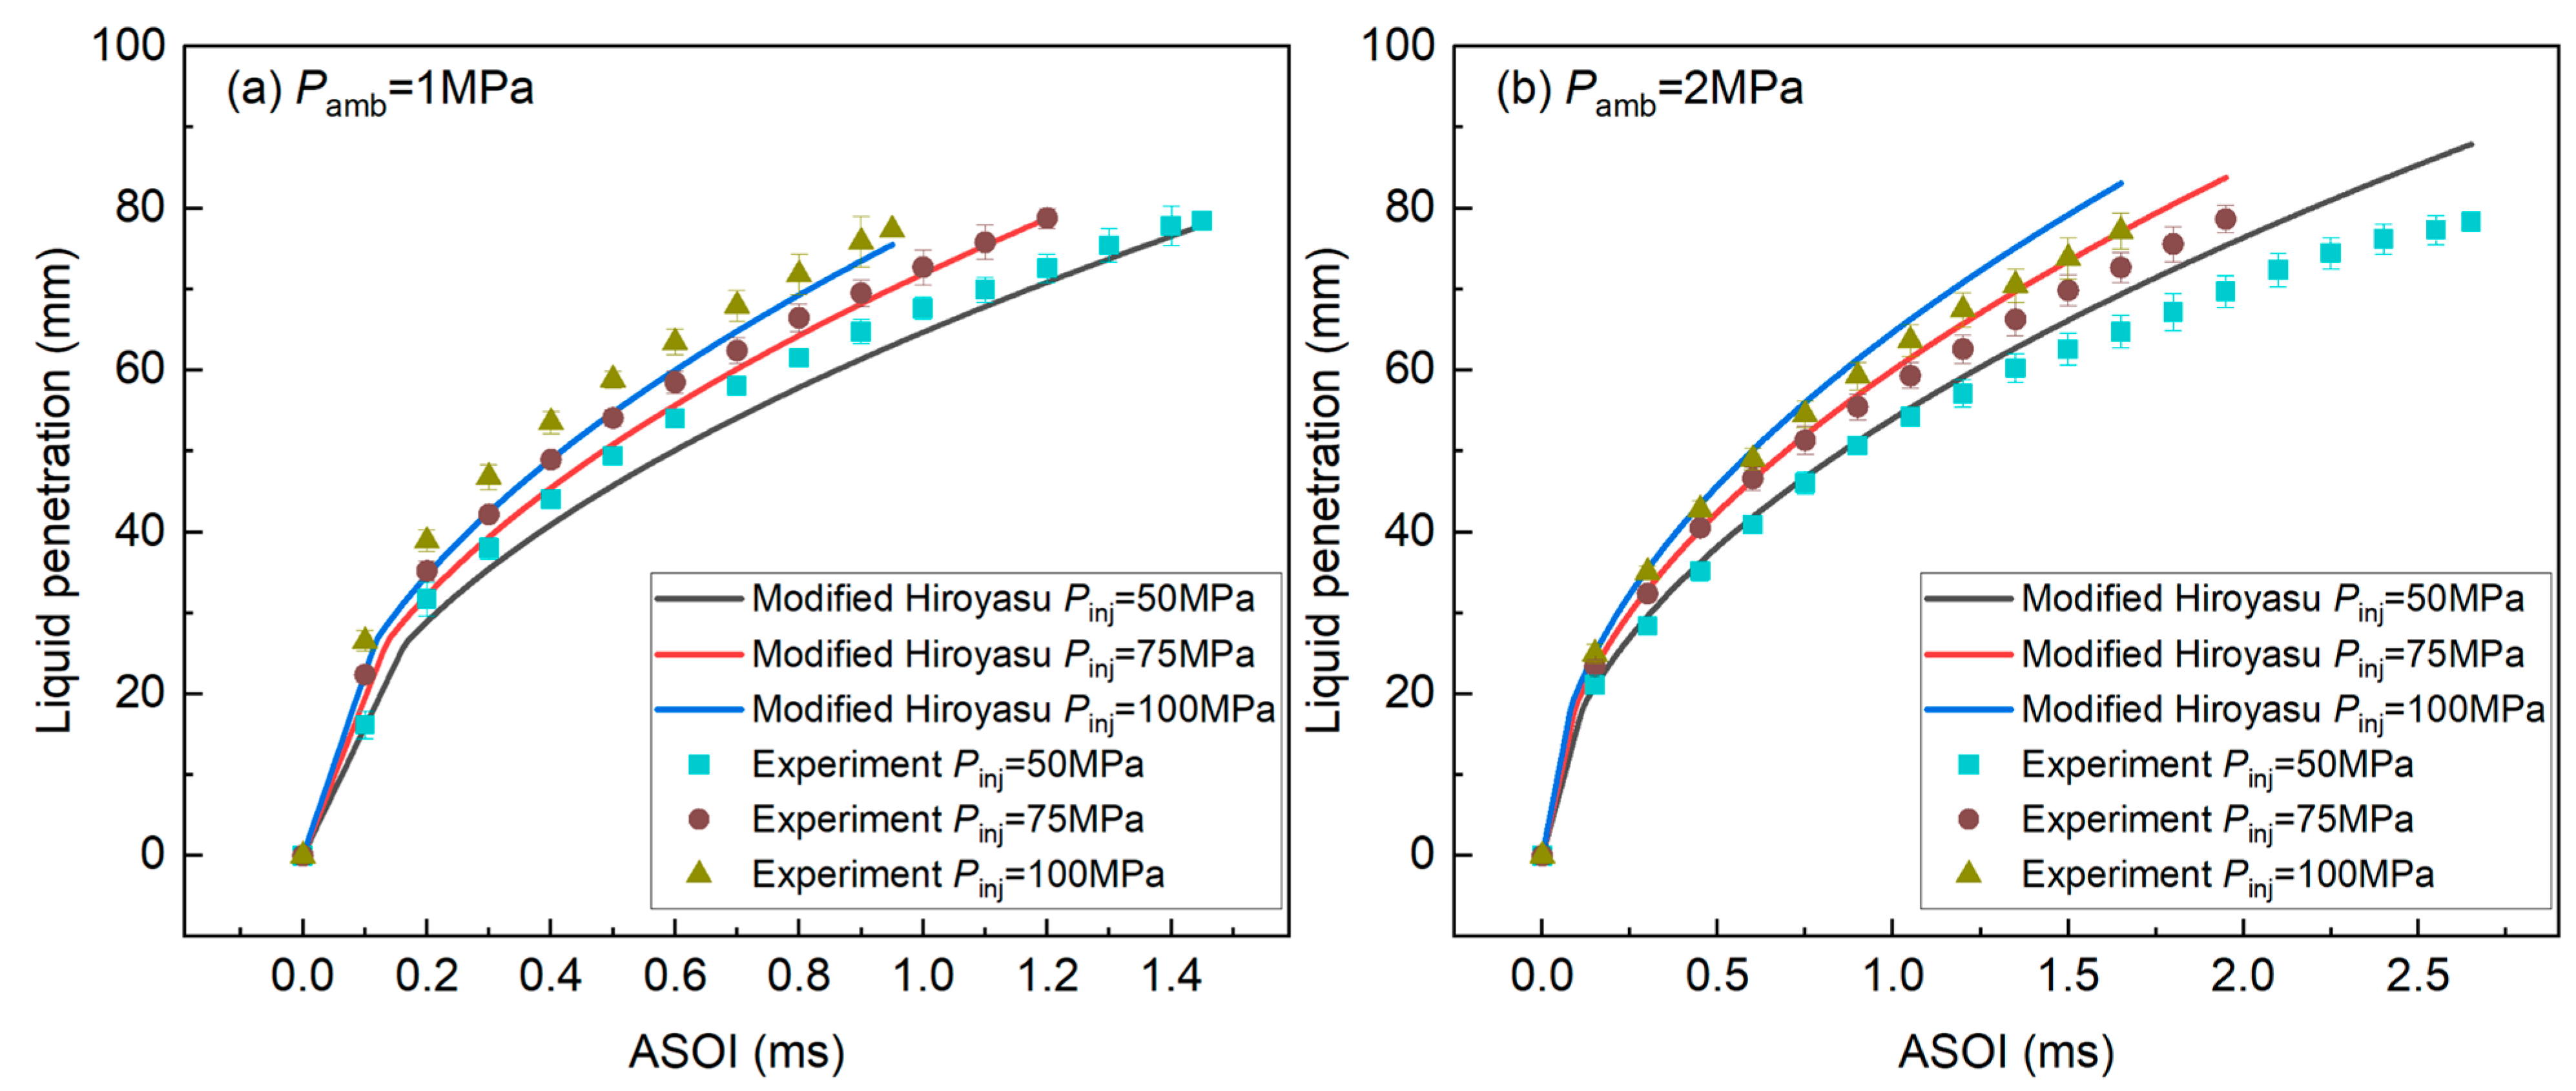
3.1.2. Discussion of the Hiroyasu Model

The Hiroyasu model gave different accuracies at different ambient pressures. Liquid penetration and model-predicted liquid penetration are shown in Figure 5. When Pamb ranged from 1 MPa to 3 MPa, the model prediction value of penetration was lower than the experiment penetration. When the spray moved to 70 mm away from the nozzle, the error of the Hiroyasu model changed from 17% to 1% when Pamb changed from 1 to 3 MPa at Pinj 50 MPa. When the Pinj equaled 100 MPa, the error of the Hiroyasu model changed from 18% to 5% with the increase in Pamb from 1 to 3 MPa. When Pamb was equal to 4 MPa, the Hiroyasu model could precisely predict the penetration, and the error was less than 3% in all of the Pinj. The accuracy of the Hiroyasu model was highly dependent on ambient pressure. Comparison of model predictions and experiment results found that the accuracy of the Hiroyasu model highly depends on Pamb. Furthermore, injection pressure did not affect the model accuracy obviously. Compared with the Siebers model, the Hiroyasu model presented better accuracy under all experimental conditions in this paper.
However, the Hiroyasu model could not provide optimal prediction using default model parameters when Pamb was equal to 1 MPa and 2 MPa. The Hiroyasu model could better fit the experiment data with a slight modification [47]. The modified Hiroyasu model is presented as Equations (14)–(16). As shown in Figure 6, the modified Hiroyasu model demonstrated better accuracy than the default model. The error was less than 10% under all of the Pinj.
When 0 < t < tbreak,
S = 0.39 2 Δ P ρ f t
When ttbreak,
L = 2.95 Δ P ρ amb 0.26 d 0 t
where
t break = 29 ρ f d 0 ρ amb 0.52 Δ P 0.48

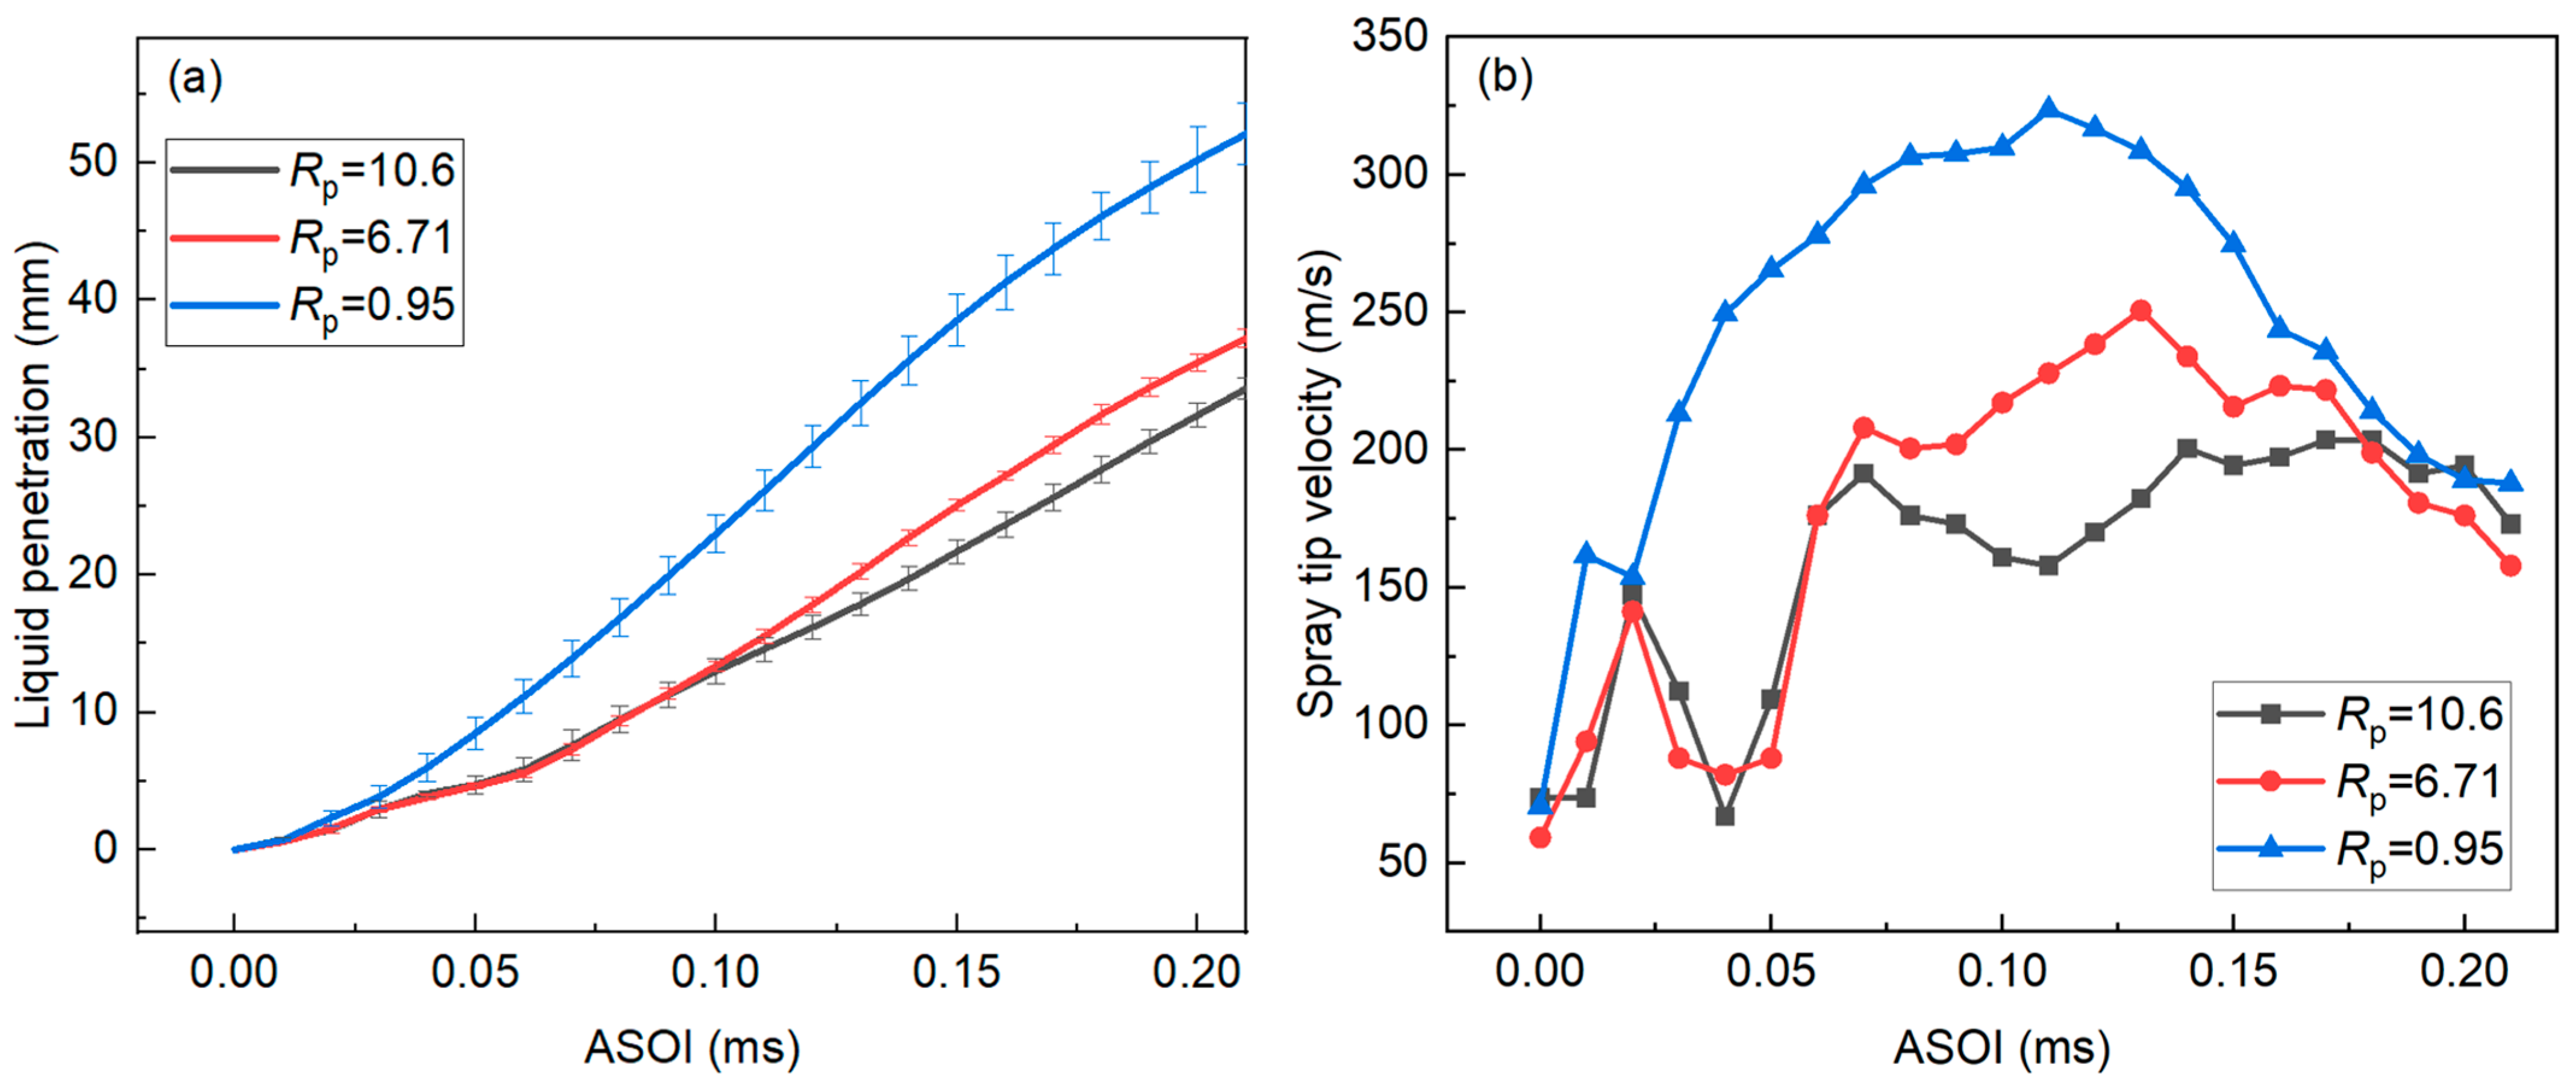
3.2. Flash Boiling Spray and “Spray Resistance Phenomenon”

The liquid penetrations of flash boiling and non-flash boiling conditions are shown in Figure 7. Flash boiling happens when Pamb is equal to 0.1 MPa, and other Pamb create non-flash boiling conditions. Obviously, the trend in Pamb 0.1 MPa is different than that in Pamb 1–4 MPa. In the initial stage of spray development from 0 to 0.2 ms ASOI, the liquid penetration under flash boiling conditions was lower than under non-flash boiling conditions, although the ambient density under flash boiling conditions was markedly lower than under non-flash boiling conditions. The trend in Pamb 0.1 MPa was different for all injection pressures because Pamb 0.1 MPa created flash boiling conditions. The possible reason for this is that, at Pamb 0.1 MPa, liquid ammonia experiences strong cavitation inside the injector nozzle in the initial stage of injector needle lifting, which blocks the nozzle, resulting in a different tendency with a shorter penetration than other non-flash boiling conditions in the initial stage. In this paper, the phenomenon of the liquid penetration becoming abnormally shortened at lower ambient density is hereafter called the “spray resistance phenomenon”. The details of the “spray resistance phenomenon” are discussed in Section 3.2.1 and Section 3.2.2.

3.2.1. Results of Different Conditions

As shown in Figure 7a–c, Pinj is easily excluded from the possible factors of the “spray resistance phenomenon” because it happens in a large range of Pinj from 50 MPa to 100 MPa. The key factor of the “spray resistance phenomenon” is Pamb.
The spray development process under flash boiling conditions is shown in Figure 8. At ASOI from 0 to 0.16 ms, liquid penetration became longer with an increase in Pamb. After ASOI 0.21 ms, liquid penetration became shorter with an increase in Pamb. Moreover, the near nozzle region of the spray substantially expanded in the flash boiling conditions, particularly in Pamb equal to 0.1 MPa. Detailed information regarding flash boiling liquid penetration is shown in Figure 9. The liquid penetration curves are completely separated into two areas. The “spray resistance phenomenon” happened when Pamb was below or equal to 0.7 MPa, which is only 0.3 MPa lower than the saturation pressure of ammonia. In addition, the reach-up times in Figure 8 and Figure 9 are different from that in Figure 7c because the frame rates in Figure 8 and Figure 9 are 100,000 FPS, relatively above 20,000 FPS in Figure 7. This resulted in better accuracy in terms of original time.
We compare the results in this paper with the literature of Ainsalo et al. [30], Li et al. [39], and Kapusta et al. [48] in Figure 10. These experiments in the literature were conducted under the same Pamb as this research. The fuels in the literature are liquefied fuel gases that are comparable with the liquid ammonia in this research, also capable of producing flash boiling. In Figure 10a, Ainsalo et al. [30] investigated high-pressure propane sprays using a diesel injector. As we put their data together, results demonstrate that the “spray resistance phenomenon” also happened because the liquid penetration of Pamb 0.1 MPa being lower than Pamb 3.1 MPa in the initial state. However, they did not conclude or analyze the phenomenon in detail. In Figure 10b, Li et al. [39] and Kapusta et al. [48] studied liquid ammonia and propane sprays using GDI injectors. Although all the Pamb were in flash boiling conditions, results in the literature indicated different trends in this research. Although Pinj in this research is higher than that in the literature, the spray penetration is shorter than that in the literature in the initial state of injection. The reason for this difference is that the experiments in the literature used a GDI injector, but this research used a diesel injector. The cavitation generated inside the sac volume of diesel injectors is a possible reason for the difference in spray penetration.
Flash boiling can generate substantial expansion of near-nozzle sprays, resulting in larger spray width than in non-flash boiling conditions. Aerodynamic resistance becomes larger with increase in spray width. The spray widths in flash boiling conditions are shown in Figure 11. Moreover, spray width increased sharply when Pamb was below 0.3 MPa. When Pamb ranged from 0.3 MPa to 1 MPa, spray width changed slightly. Spray width can affect liquid penetration but it is not a key factor. Although spray width increased with a decrease in Pamb, the “spray resistance phenomenon” still could not be explained by the increase in spray width. The reason for this is that the Pamb turning point of liquid penetration and spray width do not match. At 0.2 ms ASOI, the spray width increased 17% when Pamb decreased from 1.0 MPa to 0.5 MPa, but it increased 39% when Pamb decreased from 0.5 MPa to 0.1 MPa.
Spray tip velocity can provide additional information on the differences between flash boiling and non-flash boiling conditions because it fundamentally controls the liquid penetration. Spray tip velocity under different Pamb at the initial stage of 0–0.1 ms is shown in Figure 12a,c. Moreover, spray tip velocity clearly separated into two areas from ASOI 0–0.06 ms. At 0–0.05 ms ASOI, sprays under Pamb 0.8–1.0 MPa kept accelerating, while sprays under Pamb 0.1–0.7 MPa kept fluctuating at low velocity. Velocity differences in Pamb 0.1–0.7 MPa and 0.8–1.0 MPa resulted in immense liquid penetration difference at the initial stage of injections. Figure 12b,d present the spray tip velocity at ASOI 0.1–0.29 ms, at which time the sprays were fully developed. The spray tip velocity decreased normally with the increase in Pamb.
The separation of Pamb is more distinct under average velocity, which is calculated as Equation (17). The average spray tip velocities in the acceleration and stable stages are shown in Figure 13. The turning point is highly visible in Figure 13a, which is between Pamb 0.7 and 0.8 MPa. In the initial acceleration stage of spray development, spray tip velocity is mainly dependent on the situation of flash boiling. In the fully developed stable stage, spray tip velocity is mainly dependent on ambient density.
V avg = L t 2 L t 1 t 2 t 1

3.2.2. Analysis on “Spray Resistance Phenomenon”

Ambient pressure and density change simultaneously for the same ambient gas component, so the effect of each factor cannot be clearly revealed. To address such a defect, three different ambient gases (i.e., CO2, N2, and He) were used to separate the effects of pressure and density. Figure 14 shows the liquid penetration and spray tip velocity under the same ambient density. In this section, ambient density (ρamb) equal to 1.773 kg/m3 throughout the three experiment conditions excludes the effect of ρamb on spray characteristics. Hence, the change in Pamb only affects the superheat degree (Rp). The Rp is expressed by Equation (18). If Rp > 1, then sprays will enter the superheat state and become flash boiling spray. The higher the Rp, the stronger expansion is produced to change the spray characteristics.
R p = P sat P amb
As shown in Figure 14a, liquid penetration becomes shorter with an increase in Rp. The effect of Rp on the spray tip velocity in Figure 14b is considerably clear. For the non-flash boiling condition under Rp equal to 0.90, spray tip velocity increased mainly when ASOI ranged from 0 to 0.1 ms. For flash boiling conditions under Rp equal to 6.3 and 10, spray tip velocities were strongly suppressed in ASOI 0–0.05 ms. During ASOI 0.05–0.15 ms, the degree of velocity suppression increased with Rp. When ASOI reached 0.2 ms, spray tip velocities under three different Rp became closer because spray tip velocity mainly depended on ρamb at that time. In summary, the “spray resistance phenomenon” is highly related to Rp. A strong suppression of spray tip velocity happened during the initial stage when ASOI ranged from 0 to 0.05 ms.
The pattern of spray tip velocity can be explained by near-nozzle spray structures. The initial stage of spray development during 0–0.1 ms is shown in Figure 15. The shape of the near-nozzle spray suddenly changed during ASOI 0.4–0.6 ms. At ASOI 0.4 ms, the near-nozzle spray behaved similar to a hemispheric shape. That is, the spray significantly expanded at the nozzle exit. At ASOI 0.6 ms, the near-nozzle spray behaved similar to a bell shape, meaning the spray expansion intensity decreased. The near-nozzle shape changed at ASOI 0.5 ms. The turning point of the spray tip velocity was also ASOI 0.5 ms. That is, the spray suddenly accelerated when the near-nozzle spray shape changed. Furthermore, the tremendous expansion of near-nozzle spray in ASOI 0–0.5 ms is the most possible reason for the “spray resistance phenomenon”.
Given the information we obtained, we can locate the fundamental reason for the “spray resistance phenomenon” in the needle lift effect of the diesel injector. Soteriou et al. reported that a diesel injector can produce cavitation inside the nozzle [49,50]. Guo et al. used a transparent nozzle to conduct a visual study of the flow state of the diesel injector [51]. In the initial and end stages of fuel injection, the low needle lift was found to cause cavitation inside the nozzle. Bubbles exploded at the exit of the nozzle, significantly enlarging the spray cone angle. Gavaises et al. used a transparent nozzle to investigate the cavitation of cylindrical and tapered nozzle holes [52]. They found that the tapered nozzle hole can suppress the geometry-induced cavitation, but it also generates another type of cavitation called “string cavitation.” String cavitation can extend to the nozzle exit to change the flow behavior significantly. In summary, cavitation is often produced at the initial and end stages of the injection process because of low needle lift. Furthermore, fluid inside the cavitation area is mainly composed of fuel vapor. Fuel vapor takes up a large part of the cross-section area, causing a mass flow rate decrease.
On the basis of the preceding information, we speculate that cavitation appeared inside the nozzle because the saturation pressure of ammonia is markedly higher than gasoline, diesel, or other familiar liquid fuels. In the flash boiling process, the diesel injector generates a large amount of bubbles inside the nozzle hole. Moreover, at the initial stage of the flash boiling spray, cavitation appeared inside the sac volume and nozzle hole increased the vapor generation inside the nozzle. A huge amount of vapor generation took up a large part of volume inside the nozzle and blocked the liquid ammonia flow, causing the “spray resistance phenomenon”. Lastly, the near-nozzle flow drastically expanded because of the explosion of a massive amount of bubbles.

3.3. Uncertainty of Results

The uncertainty of the liquid penetration was evaluated by Moffat’s method in Equation (19) [53], where the total uncertainty of liquid penetration (UL) consists of bias limit (B), precision index (S), and multiplier (tp). The multiplier tp is a value of t-distribution of N − 1 freedom degree in a 95% confidence interval, where N is the number of experiment repetitions. In this paper, each case of experiments was repeated 10 times, and tp is equal to 2.262.
U L = B 2 + t p S 2
The B and S are expressed as Equations (20) and (21), where Xi is the variable of liquid penetration (L), Bi is the bias limit of the variable Xi, SL is the standard deviation of L, and n is the number of variables. The ∂L(Xi)/∂Xi term represents the sensitivity of variable Xi to L.
B = i = 1 n L X i X i B i 2
S = S L N
For the precision index S, the maximum SL in the initial stage (0–0.2 ms) is 1.8 mm, so that S is equal to 0.57 mm. For the bias limit (B), the variables of L include the error in spray edge recognition, reference meter, injection pressure (Pinj) and ambient pressure (Pamb). The error in spray recognition was less than 5 pixels, which resulted in a 0.55 mm deviation in liquid penetration (L) because the image scale was 0.11 mm per pixel. The measurement error in the reference meter was 0.02 mm, which resulted in a 0.02 mm deviation in L. The error in injection pressure (Pinj) was ±5 MPa, resulting in a 0.22 mm deviation when Pinj was 100 MPa. The error in ambient pressure (Pamb) was ±0.001 MPa, resulting in a 0.15 mm deviation. Based on the above analysis, the total uncertainty in liquid penetration (UL) was 1.60 mm. That means the deviation of L was about 5.3% in the initial stages of the injections.

4. Conclusions

High-pressure liquid ammonia injection is a key issue in mixture preparation for combustion, especially in large-bore engines. Liquid ammonia very easily forms flash boiling sprays, which causes a large amount of spray expansion and significantly changes spray characteristics. However, the effects of the flash boiling of liquid ammonia are not clear under high injection pressures. To understand the sprays of liquid ammonia clearly, high-pressure liquid ammonia injections up to 100 MPa were investigated, both in non-flash boiling and flash boiling conditions. In the non-flash boiling condition, the Hiroyasu model demonstrated better accuracy in liquid penetration predictions. In the flash boiling condition, the spray tip velocity was strongly suppressed in the initial stage of injections, which is called as the “spray resistance phenomenon”. The “spray resistance phenomenon” was observed when Pamb was below 0.7 MPa and was highly correlated with Rp. The reason for the “spray resistance phenomenon” is that the needle lift effect caused cavitation inside the nozzle and generated extra vapor in flash boiling sprays. A large amount of vapor generation blocked the nozzle hole so that the mass flow rate and spray tip velocity decreased significantly in the initial stage.
The discovery of the “spray resistance phenomenon” reminds us that liquid ammonia can produces strong cavitation inside the nozzle in the initial state of injection, particularly in diesel injectors. The results of these experiments also provide valuable experimental data for high-pressure liquid ammonia injections. The effects of the “spray resistance phenomenon” are important in designing fuel supply systems. Injectors should be optimized to eliminate or suppress strong vapor generation inside the nozzle. In future research, visualized experiments using transparent nozzles will be helpful to reveal the mechanism of the “spray resistance phenomenon” more clearly.

Author Contributions

Conceptualization, Y.F., X.M., and Z.W.; methodology, Y.F.; software, Y.F.; validation, Y.F. and X.M.; formal analysis, Y.F.; investigation, Y.F., Y.Z., and K.Z.; resources, X.M. and Y.Z.; data curation, Y.F.; writing—original draft preparation, Y.F.; writing—review and editing, Y.F., X.M., and Z.W.; visualization, Y.F.; supervision, X.M., Y.L., and Z.W.; project administration, X.M., S.S., Z.W., and C.J.; funding acquisition, X.M., S.S., Z.W., and C.J. All authors have read and agreed to the published version of the manuscript.

Funding

This research was funded by the National Natural Science Foundation of China (Grant No. 51976100, Grant No. 52211530098 and Grant No. T2241003), and the Royal Society International Exchanges 2021 Cost Share (NSFC) Scheme, Ref: IEC\NSFC\211348.

Institutional Review Board Statement

Not applicable.

Informed Consent Statement

Not applicable.

Data Availability Statement

Not applicable.

Acknowledgments

This research is supported by the State Key Laboratory of Automotive Safety and Energy (Grant No. ZZ2021-034).

Conflicts of Interest

The authors declare no conflict of interest.

Nomenclature

ASOIAfter start of injection
aConstant value in Siebers model
BBias limit
BiBias limit of variable Xi
CaContractive coefficient
CvVelocity coefficient
DBIDiffused back-illumination
d0Nozzle hole diameter
dfEffective nozzle hole diameter
LLiquid penetration
L ˜ Dimensional liquid penetration
L+Coordinate scale
NNumber of experiment repetitions
nNumber of variables
PambAmbient pressure
PinjInjection pressure
PsatSaturation pressure
RpSuperheat degree
SPrecision index
SLStandard deviation of L
TambAmbient temperature
TfFuel temperature
tTime
tbreakBreakup time
tpValue of t-distribution
t ˜ Dimensional time
t+Time scale
ULUncertainty of L
VSpray tip velocity
VavgAverage velocity
VfFuel velocity
XiVariable that affects L
ΔPPressure difference
ΔtTime interval
θSpray cone angle
ρambAmbient density
ρfFuel density

References

  1. Ma, X.; Jiang, C.; Xu, H.; Richardson, S. In-Cylinder Optical Study on Combustion of DMF and DMF Fuel Blends. In Proceedings of the SAE 2012 World Congress & Exhibition, Detroit, MI, USA, 26 April 2012. [Google Scholar]
  2. He, X.; Li, Y.; Sjöberg, M.; Vuilleumier, D.; Ding, C.-P.; Liu, F.; Li, X. Impact of coolant temperature on piston wall-wetting and smoke generation in a stratified-charge DISI engine operated on E30 fuel. Proc. Combust. Inst. 2019, 37, 4955–4963. [Google Scholar] [CrossRef]
  3. Ma, X.; Ma, Y.; Wang, Z.; Mao, J.; Liu, H.; Su, F.; Wang, J. Optical study on multi-time ignition mixed-mode combustion with gasoline and PODE. Fuel 2023, 335, 126910. [Google Scholar] [CrossRef]
  4. Kolodziejczyk, B. Unsettled Issues Concerning the Use of Green Ammonia Fuel in Ground Vehicles. SAE Technical Paper; USA. 2021. Available online: https://www.sae.org/publications/technical-papers/content/EPR2021003/ (accessed on 12 October 2022).
  5. Kolodziejczyk, B. Unsettled Economic, Environmental, and Health Issues of Ammonia for Automotive Applications. SAE Technical Paper; USA. 2021. Available online: https://www.sae.org/publications/technical-papers/content/epr2021022/ (accessed on 12 October 2022).
  6. De Vries, N.; Okafor, E.C.; Gutesa-Bozo, M.; Xiao, H.; Valera-Medina, A. Chapter 6—Use of Ammonia for Heat, Power and Propulsion. In Techno-Economic Challenges of Green Ammonia as an Energy Vector; Valera-Medina, A., Banares-Alcantara, R., Eds.; Academic Press: Cambridge, MA, USA, 2021; pp. 105–154. [Google Scholar]
  7. Jiang, L.; Fu, X. An Ammonia–Hydrogen Energy Roadmap for Carbon Neutrality: Opportunity and Challenges in China. Engineering 2021, 7, 1688–1691. [Google Scholar] [CrossRef]
  8. Reiter, A.J.; Kong, S.-C. Demonstration of Compression-Ignition Engine Combustion Using Ammonia in Reducing Greenhouse Gas Emissions. Energy Fuels 2008, 22, 2963–2971. [Google Scholar] [CrossRef]
  9. Niki, Y.; Nitta, Y.; Sekiguchi, H.; Hirata, K. Diesel Fuel Multiple Injection Effects on Emission Characteristics of Diesel Engine Mixed Ammonia Gas Into Intake Air. J. Eng. Gas Turbines Power 2019, 141, 061020. [Google Scholar] [CrossRef]
  10. Zhang, Z.; Long, W.; Dong, P.; Tian, H.; Tian, J.; Li, B.; Wang, Y. Performance characteristics of a two-stroke low speed engine applying ammonia/diesel dual direct injection strategy. Fuel 2023, 332, 126086. [Google Scholar] [CrossRef]
  11. Niki, Y.; Nitta, Y.; Sekiguchi, H.; Hirata, K. Emission and Combustion Characteristics of Diesel Engine Fumigated with Ammonia. In Proceedings of the ASME 2018 Internal Combustion Engine Division Fall Technical Conference, San Diego, CA, USA, 7 November 2018. [Google Scholar]
  12. Niki, Y.; Yoo, D.-H.; Hirata, K.; Sekiguchi, H. Effects of Ammonia Gas Mixed Into Intake Air on Combustion and Emissions Characteristics in Diesel Engine. In Proceedings of the ASME 2016 Internal Combustion Engine Division Fall Technical Conference, Greenville, SC, USA, 12 October 2016. [Google Scholar]
  13. Gong, Y.; Xiao, G.; Ma, X.; Luo, K.H.; Shuai, S.; Xu, H. Phase transitions of multi-component fuel droplets under sub- and supercritical conditions. Fuel 2021, 287, 119516. [Google Scholar] [CrossRef]
  14. Li, Y.; Guo, H.; Zhou, Z.; Zhang, Z.; Ma, X.; Chen, L. Spray morphology transformation of propane, n-hexane and iso-octane under flash-boiling conditions. Fuel 2019, 236, 677–685. [Google Scholar] [CrossRef]
  15. Soo Yu, Y.; Shin, D.; Jeong, M.; Park, J.; Park, S. Effect on flash boiling spray characteristics in the far-field and near-field and nozzle tip wetting with multi-hole LPDI injector. Appl. Therm. Eng. 2023, 219, 119676. [Google Scholar] [CrossRef]
  16. Soo Yu, Y.; Yang, S.; Jeong, M.; Kim, H.; Yi, H.; Hwan Park, J.; Park, S. Experimental investigations on the spray structure and nozzle tip wetting using various fuels with an LPDI injector. Fuel 2022, 318, 123719. [Google Scholar] [CrossRef]
  17. Shen, Y.J.; Lin, T.C.; Wang, M.R. Production of Carbon Dioxide Snow by Flash-Atomization for Material Cleaning Process. Adv. Mater. Res. 2012, 569, 282–285. [Google Scholar] [CrossRef]
  18. Shariatnia, S.; Asadi, A.; Jarrahbashi, D. Experimental analysis of supercritical-assisted atomization. Phys. Fluids 2021, 33, 013314. [Google Scholar] [CrossRef]
  19. Kim, H.; Kim, C.; Lim, H.; Song, J. Spray Formation of a Liquid Carbon Dioxide-Water Mixture at Elevated Pressures. Energies 2016, 9, 948. [Google Scholar] [CrossRef] [Green Version]
  20. Xu, Q.; Pan, H.; Gao, Y.; Li, X.; Xu, M. Investigation of two-hole flash-boiling plume-to-plume interaction and its impact on spray collapse. Int. J. Heat Mass Transf. 2019, 138, 608–619. [Google Scholar] [CrossRef]
  21. Wu, S.; Xu, M.; Hung, D.L.S.; Li, T.; Pan, H. Near-nozzle spray and spray collapse characteristics of spark-ignition direct-injection fuel injectors under sub-cooled and superheated conditions. Fuel 2016, 183, 322–334. [Google Scholar] [CrossRef]
  22. Payri, R.; Javier Salvador, F.; Marti-Aldaravi, P.; Vaquerizo, D. ECN Spray G external spray visualization and spray collapse description through penetration and morphology analysis. Appl. Therm. Eng. 2017, 112, 304–316. [Google Scholar] [CrossRef]
  23. Khan, M.M.; Helie, J.; Gorokhovski, M.; Sheikh, N.A. Experimental and numerical study of flash boiling in gasoline direct injection sprays. Appl. Therm. Eng. 2017, 123, 377–389. [Google Scholar] [CrossRef]
  24. Guo, H.; Ding, H.; Li, Y.; Ma, X.; Wang, Z.; Xu, H.; Wang, J. Comparison of spray collapses at elevated ambient pressure and flash boiling conditions using multi-hole gasoline direct injector. Fuel 2017, 199, 125–134. [Google Scholar] [CrossRef]
  25. Kim, K.B.; Kim, Y.J.; Lee, K.H.; Lee, K.S. Experimental approaches to investigating liquefied lpg spray characteristics. At. Sprays 2010, 20, 553–564. [Google Scholar]
  26. Lee, S.W.; Kusaka, J.; Daisho, Y. Spray characteristics of alternative fuels in constant volume chamber (comparison of the spray characteristics of LPG, DME and n-dodecane). Jsae Rev. 2001, 22, 271–276. [Google Scholar] [CrossRef]
  27. Lee, S.W.; Daisho, Y. Spray characteristics of directly injected lpg. Int. J. Automot. Technol. 2004, 5, 239–245. [Google Scholar]
  28. Beroun, S.; Brabec, P.; Dittrich, A. Injection of Liquid LPG Thermodynamics. In Proceedings of the 22nd International Conference on Engineering Mechanics, Svratka, Czech Republic, 9–12 May 2016; pp. 62–65. [Google Scholar]
  29. Angelilli, L.; Hernández Pérez, F.E.; Im, H.G.; Ciottoli, P.P.; Valorani, M. Evaporation and clustering of ammonia droplets in a hot environment. Phys. Rev. Fluids 2022, 7, 114301. [Google Scholar] [CrossRef]
  30. Ainsalo, A.; Sallinen, R.; Kaario, O.; Larmi, M. Optical Investigation of Spray Characteristics for Light Fuel Oil, Kerosene, Hexane, Methanol, and Propane. At. Sprays 2019, 29, 521–544. [Google Scholar] [CrossRef]
  31. Zhang, Z.; Li, Y.; Ma, X.; Ding, H.; Xu, H.; Wang, Z.; Shuai, S. Characteristics of trans-critical propane spray discharged from multi-hole GDI injector. Exp. Therm. Fluid Sci. 2018, 99, 446–457. [Google Scholar] [CrossRef]
  32. Yeom, K.; Park, J.; Bae, C.; Park, J.; Kim, S. Anti-vapor Lock of a Top-Feed Injector for a Liquefied Petroleum Gas Liquid-Phase Injection Engine. Energy Fuels 2009, 23, 876–883. [Google Scholar] [CrossRef]
  33. Cheng, Q.; Ojanen, K.; Diao, Y.; Kaario, O.; Larmi, M. Dynamics of the Ammonia Spray Using High-Speed Schlieren Imaging. SAE Int. J. Adv. Curr. Pract. Mobil. 2022, 4, 1138–1153. [Google Scholar] [CrossRef]
  34. Zhang, Z.; Li, T.; Chen, R.; Wang, N.; Wei, Y.; Wu, D. Injection characteristics and fuel-air mixing process of ammonia jets in a constant volume vessel. Fuel 2021, 304, 121408. [Google Scholar] [CrossRef]
  35. Scharl, V.; Sattelmayer, T. Ignition and combustion characteristics of diesel piloted ammonia injections. Fuel Commun. 2022, 11, 100068. [Google Scholar] [CrossRef]
  36. Scharl, V.; Lackovic, T.; Sattelmayer, T. Characterization of ammonia spray combustion and mixture formation under high-pressure, direct injection conditions. Fuel 2023, 333, 126454. [Google Scholar] [CrossRef]
  37. Ichikawa, Y.; Niki, Y.; Takasaki, K.; Kobayashi, H.; Miyanagi, A. NH3 combustion using three-layer stratified fuel injection for a large two-stroke marine engine: Experimental verification of the concept. Appl. Energy Combust. Sci. 2022, 10, 100071. [Google Scholar] [CrossRef]
  38. Mao, J.; Ma, X.; Ma, Y.; Wang, Z.; Zhang, Y.; Shuai, S. Optical diagnostic on HCII combustion characteristics for NH3-PODE3 dual fuel engine. J Automot. Saf. Energy 2022, 13, 509–516. [Google Scholar]
  39. Li, S.; Li, T.; Wang, N.; Zhou, X.; Chen, R.; Yi, P. An investigation on near-field and far-field characteristics of superheated ammonia spray. Fuel 2022, 324, 124683. [Google Scholar] [CrossRef]
  40. Kim, T.; Kim, D.; Park, S. Numerical approach to analyze propane flash boiling spray using modified gas-jet model. Appl. Therm. Eng. 2019, 162, 114255. [Google Scholar] [CrossRef]
  41. Kim, T.; Park, S. Modeling flash boiling breakup phenomena of fuel spray from multi-hole type direct-injection spark-ignition injector for various fuel components. Energy Convers. Manag. 2018, 160, 165–175. [Google Scholar] [CrossRef]
  42. Guo, H.; Nocivelli, L.; Torelli, R. Numerical study on spray collapse process of ECN spray G injector under flash boiling conditions. Fuel 2021, 290, 119961. [Google Scholar] [CrossRef]
  43. Musculus, M.P.B.; Kattke, K. Entrainment Waves in Diesel Jets. SAE Int. J. Engines 2009, 2, 1170–1193. [Google Scholar] [CrossRef]
  44. NIST Reference Fluid Thermodynamic and Transport Properties Database (REFPROP) Version 10. Available online: https://www.nist.gov/srd/refprop (accessed on 12 October 2022).
  45. Naber, J.D.; Siebers, D.L. Effects of Gas Density and Vaporization on Penetration and Dispersion of Diesel Sprays. SAE Int. 1996, 105, 82–111. [Google Scholar]
  46. Hiroyasu, H.; Kadota, T.; Arai, M. Supplementary Comments: Fuel Spray Characterization in Diesel Engines. In Combustion Modeling in Reciprocating Engines; Prenum Press: New York, UK, 1980; pp. 369–408. [Google Scholar]
  47. Mancaruso, E.; Sequino, L.; Vaglieco, B.M. First and second generation biodiesels spray characterization in a diesel engine. Fuel 2011, 90, 2870–2883. [Google Scholar] [CrossRef]
  48. Kapusta, Ł.J.; Bachanek, J.; Jiang, C.; Piaszyk, J.; Xu, H.; Wyszyński, M.L. Liquid Propane Injection in Flash-Boiling Conditions. Energies 2021, 14, 6257. [Google Scholar] [CrossRef]
  49. Soteriou, C.; Andrews, R.; Smith, M. Further Studies of Cavitation and Atomization in Diesel Injection. SAE Int. 1999, 108, 902–919. [Google Scholar]
  50. Soteriou, C.; Andrews, R.; Smith, M. Direct Injection Diesel Sprays and the Effect of Cavitation and Hydraulic Flip on Atomization. SAE Int. 1995, 104, 128–153. [Google Scholar]
  51. Guo, M. Transient Characteristics of Special Flow Phenomena in Diesel Injector Nozzles and Their Effects on Spray. Ph.D. Thesis, Jiangsu University, Zhenjiang, China, 2019. [Google Scholar]
  52. Gavaises, M.; Andriotis, A.; Papoulias, D.; Mitroglou, N.; Theodorakakos, A. Characterization of string cavitation in large-scale Diesel nozzles with tapered holes. Phys. Fluids 2009, 21, 9. [Google Scholar] [CrossRef]
  53. Moffat, R.J. Describing the uncertainties in experimental results. Exp. Therm. Fluid Sci. 1988, 1, 3–17. [Google Scholar] [CrossRef] [Green Version]
Figure 1. Schematic of the experimental apparatus.
Energies 16 02843 g001
Figure 2. Image processing of sprays: (a) raw image, (b) black–white inversion and background subtraction, (c) binarization.
Energies 16 02843 g002
Figure 3. Spray images at different injection pressures, Pamb = 4 MPa. Fuel: liquid ammonia.
Energies 16 02843 g003
Figure 4. Liquid penetration in the Siebers model prediction and experiments; fuel: liquid ammonia; (a) Pamb = 1 MPa, (b) Pamb = 2 MPa, (c) Pamb = 3 MPa; (d) Pamb = 4 MPa.
Energies 16 02843 g004
Figure 5. Liquid penetration in the modified Hiroyasu model prediction and experiments; fuel: liquid ammonia; (a) Pamb = 1 MPa, (b) Pamb = 2 MPa, (c) Pamb = 3 MPa; (d) Pamb = 4 MPa.
Energies 16 02843 g005
Figure 6. Model predictions of the modified Hiroyasu model; (a) Pamb = 1 MPa, (b) Pamb = 2 MPa.
Energies 16 02843 g006
Figure 7. Liquid penetration in flash boiling and non-flash boiling conditions; (ac) Pinj = 50–100 MPa, fuel: liquid ammonia.
Energies 16 02843 g007
Figure 8. Spray images in flash boiling conditions, Pinj = 100 MPa; fuel: liquid ammonia.
Energies 16 02843 g008
Figure 9. Liquid penetration in flash boiling conditions in detail; Pinj = 100 MPa; fuel: liquid ammonia.
Energies 16 02843 g009
Figure 10. Comparison with the literature: (a) Ainsalo et al. [30], Pinj = 100 MPa, fuel: liquid propane; (b) Li et al. [39], Pinj = 30 MPa, fuel: liquid ammonia; Kapusta et al. [48], Pinj = 14 MPa, fuel: liquid propane.
Energies 16 02843 g010
Figure 11. Spray width in flash boiling conditions, Pinj = 100 MPa; fuel: liquid ammonia.
Energies 16 02843 g011
Figure 12. Spray tip velocity, Pinj = 100MPa; (a,c) ASOI 0–0.1 ms; (b,d) ASOI 0.1–0.29 ms.
Energies 16 02843 g012
Figure 13. Average spray tip velocity, (a) acceleration stage, (b) stable stage, Pinj = 100 MPa.
Energies 16 02843 g013
Figure 14. Effects of different superheat degrees on liquid penetration and spray tip velocity in the same ambient density, ρamb = 1.773 kg/m3, Pinj = 100 MPa; (a) liquid penetrations; (b) spray tip velocity.
Energies 16 02843 g014
Figure 15. Near-nozzle spray structure, Pamb = 0.1 MPa, Pinj = 100 MPa; ambient gas: N2.
Energies 16 02843 g015
Table 1. Key parameters of experimental conditions.
ItemsParameters
Ambient temperature (Tamb, K)300
Ambient pressure (Pamb, MPa)0.1–4.0
Injection pressure (Pinj, MPa)50–100
Injection duration (ms)2
Fuel temperature (Tf, K)300
FuelLiquid ammonia (99.9999%)
Fuel saturation pressure (MPa)1.06 (in room temperature 300 K) [44]
Injector typeSingle-hole diesel injector
Nozzle hole diameter (mm)0.168
Visualized diagnostics technologyDiffused back-illumination
Test chamber volume (L)1.7
Chamber working pressure (MPa)15
Table 2. Experimental cases.
CasesPamb (MPa)ρamb (kg/m3)Pinj (MPa)Ambient GasSpray Condition
10.11.1233100N2
20.22.247100N2
30.33.371100N2
40.44.4954100N2
50.55.6202100N2Flash boiling
60.66.7453100N2
70.77.8707100N2
80.88.9965100N2
90.910.122100N2
101.011.24950N2
111.011.24975N2
121.011.249100N2
132.022.52350N2
142.022.52375N2
152.022.523100N2Non-flash boiling
163.033.80850N2
173.033.80875N2
183.033.808100N2
194.045.08750N2
204.045.08775N2
214.045.087100N2
220.11.773100CO2Flash boiling
230.1581.773100N2
241.1111.773100HeNon-flash boiling
Disclaimer/Publisher’s Note: The statements, opinions and data contained in all publications are solely those of the individual author(s) and contributor(s) and not of MDPI and/or the editor(s). MDPI and/or the editor(s) disclaim responsibility for any injury to people or property resulting from any ideas, methods, instructions or products referred to in the content.

