Article

Categorizing 15 kV High-Voltage HDPE Insulator’s Leakage Current Surges Based on Convolution Neural Network Gated Recurrent Unit

1
Department of Electronic Engineering, National Kaohsiung University of Science and Technology, Kaohsiung 800, Taiwan
2
Department of Electronic—Electrical Engineering, Nha Trang University, Nha Trang 650000, Vietnam
3
Department of Business Intelligence, National Kaohsiung University of Science and Technology, Kaohsiung 800, Taiwan
4
Faculty of Economics and Management, Thai Binh Duong University, Nha Trang 650000, Vietnam
*
Author to whom correspondence should be addressed.
Energies 2023, 16(5), 2500; https://doi.org/10.3390/en16052500
Submission received: 12 February 2023 / Revised: 26 February 2023 / Accepted: 1 March 2023 / Published: 6 March 2023

Abstract

:
The leakage currents are appropriate for determining the contamination level of insulators in the power distribution system, which are efficiently cleaned or replaced during the maintenance schedule. In this research, the hybrid convolution neural network and gated recurrent unit model (CNN-GRU) are developed to categorize the leakage current pulse of the 15 kV HDPE insulator in the transmission towers in Taiwan. Many weather parameters are accumulated in the online monitoring system, which is installed in different transmission towers in coastal areas that suffer from heavy pollution. The Pearson correlation matrix is computed for selecting the high correlative features with the leakage current. Hyperparameter optimization is employed to decide the enhancing framework of the CNN-GRU methodology. The performance of the CNN-GRU is completely analyzed with other deep learning algorithms, which comprise the GRU, bidirectional GRU, LSTM, and bidirectional LSTM. The developed CNN-GRU acquired the most remarkable improvements of 79.48% CRE, 83.54% validating CRE, 14.14% CP, 20.89% validating CP, 66.24% MAE, 63.59% validating MAE, 73.24% MSE, and 71.59% validating MSE benchmarks compared with other methodologies. Therefore, the hybrid CNN-GRU methodology provides comprehensive information about the contamination degrees of insulator surfaces derived from the property of leakage currents.

1. Introduction

The insulators installed in severe environments near the sea or industrial areas commonly cause flashovers and disruptions in the transmission power line. These insulators are contaminated by salt fog or dust, which increase the electrical conductivity on the surface because of equivalent salt deposit density (ESDD) and non-soluble deposit density (NSDD). Many electrical power companies have developed insulator monitoring systems to evaluate the pollution severity of insulators, which provide the maintenance procedures for periodical washes [1,2,3,4]. The insulator monitoring technologies combined with leakage current prediction are the most appropriate methods to continuously measure without interruption of the transmission lines [5,6,7,8].
Many laboratory experiments and research proved that the prediction of the insulator leakage current could be utilized to determine the process of contaminative levels on the insulator surface [9,10,11]. The insulator leakage currents are affected by the environmental parameters and the contaminative levels on the insulator surface [12,13,14]. Research on leakage current prediction has been accomplished using many neural networks (NN) and mathematical models with environmental features. Li et al. enhanced the neural network model to predict the ESDD in the security stage [15]. The 10-set training and validating data were recorded from the laboratory experiments, and the accurate predictions were reliable for practical applications. Zhao et al. employed linear and nonlinear regressive methods to predict the leakage current of the insulator from the environmental variables [16]. The eight-month data were utilized to evaluate the regressive model, which needed to adjust the coefficients in the actual applications. Ali et al. implemented the leakage current prediction on silicone rubber insulators by a neural network [17]. The predicted leakage current with the feed-forward backpropagation neural network obtained less than 12% in the tested cases. Ayman et al. employed the Gaussian radial basis function NN to forecast the leakage current of non-ceramic insulators in the salt fog condition [18]. The proposed algorithm acquired a 3.5–5.3% accuracy with a random optimizing algorithm in the identical insulators. Felix et al. proposed the linear stochastic and statistical flashover prediction with a signature analysis tool [2]. The digitized samples of leakage current were collected offline for statistical investigation of the leakage current envelope with a new twist method [19]. In the previous research, Phuong et al. employed the particle-swarm-optimization-based backpropagation NN to forecast the leakage current of 69 kV and 161 kV high-voltage insulators [20]. The enhanced algorithm combined with the surface spark discharge data improved the effectiveness and accuracy of the predicting application, which were 8.35 × 10⁻⁴ MSE, 8.92% MAPE, and 0.0857% R square. Santos and Holtzhausen proposed a novel method to classify the leakage current with different weather variables and the cumulative pollution index [21]. The authors utilized the random forest methodology to predict the leakage current of ceramic and RTV silicone-coated insulators in twenty-two consecutive months, which obtained a higher accuracy. Jahromi et al. proposed an NN to forecast the leakage current in the early aging interval [22]. The two-layer feed-forward backpropagation achieved a higher performance with a 15% maximum error with the data from 15 kV commercial silicon rubber insulators. Pinotti and Meyer proposed the mathematical models with the validation of the least squares method and statistical hypothesis testing to predict the leakage current with reasonable accuracy [23]. The prediction method utilized the weather data, which included temperature, pressure, humidity, wind speed, and rain for 25 kV distribution insulators. Hadi et al. proposed a statistical method to predict flashover occurrence by utilizing the harmonic components of leakage current [24]. The ratio between the fifth and third harmonic components combined with geometric distribution was proposed to approximately predict the contaminative level of insulators. Sheik et al. proposed the salt contaminant accumulation prediction by utilizing the feed-forward backpropagation neural network and statistical data of the leakage current [25]. The research utilized the statistical character of leakage current to predict the contaminant level and provide the pre-warning of flashover. Ali et al. extracted the ESDD, NSDD, wetting rate and pollution level to effectively evaluate the insulator condition [26]. These proposed indicators could provide more critical information about the insulator condition and the leakage current characteristic, which can be implemented in the monitoring system or prototype application. Volat et al. deployed the ANN to evaluate the leakage current development through the melting session [27]. The ANN was integrated into the monitoring system to forecast the appearance of the discharge phenomenon for protection with an average delay of 9 min. Zahra et al. developed the real asymmetric contamination to evaluate the leakage current of the 20 kV polymeric insulator [28]. The experiment illustrated that the various parameters of contamination layers were crucial for the electrical conductivity of insulators. The data from the non-uniform fan-shaped contamination were utilized in ANN to predict the leakage current, which achieved less than 5% relative error. Hui proposed the prediction theory with an extreme value risk function to forecast the leakage current by calculating the probability density function [29]. The developed method could predict the evolutional trend of the leakage current, which provided more information on flashover prevention procedures. Li et al. extracted three main statistical characteristics of leakage current, which were utilized in the ANN for predicting the ESDD level on the insulator surface [30]. The predicted performance was less than 0.035 mg/cm2, which was appropriate for the pre-warning system before the flashover. In another study, the leakage current was predicted by utilizing the multi-regression model with the weather parameters in 10-min intervals [31]. Nameer and Ayman proposed the Bayesian neural network to predict the first and third harmonic components in the salt fog environment [32]. The research results proved that the nonlinear autoregressive neural network achieved the highest performance in terms of prediction error. The developed method was integrated into the condition monitoring system to prevent flashover accumulation. Wang et al. proposed a deeper mathematical model to predict the leakage current of 110 kV insulators based on the relative humidity [33]. The experiment results proved the strong correlation between the leakage current and the environmental features, especially the temperature and relative humidity. Suhas et al. classified the contamination levels based on the short-time modified Hilbert transform, which combined with local characteristic current waveform [34]. The comparable performance was better than the literature review, which included ANN, neuro Fuzzy classifier, and Rough set classifier, and could be implemented in many applications with 95% overall classification accuracy. Abouzeid et al. developed a non-intrusive algorithm to predict the ESDD on silicone rubber insulators [35]. The proposed method achieved an overall predicting improvement from 68% to 95% compared with KNN, polynomial, and fuzzy neuro methodologies. Sun et al. developed the least square SVM (LSSVM) and exploratory factor analysis (EFA) for the contamination level of the distribution insulator [36]. The research utilized the air pollution parameters and meteorological parameters as input factors to predict the ESDD and NSDD values. The effectiveness of EFA and LSSVM outperformed other traditional models in different evaluation indexes. Therefore, many researchers have proved the accuracy and effectiveness of utilizing the weather parameter to predict the insulator leakage current for evaluating the contaminative level.
Recently, with the development of computational resources and accurate sensor devices, deep learning methods which require more accumulated data are widely proposed for many applications, especially computer vision, language processing, and sequential data. The deep learning algorithms outperform the traditional methodologies, which obtain more accuracy and higher stability. Medeiros et al. utilized different neural network models to predict the increase in leakage current and compared the performance between them [19]. The experiment results proved that the RNN outperformed other methodologies and achieved an accuracy of up to 97.25%. Yeh et al. proposed the bidirectional long short-term memory (Bi-LSTM) to categorize the leakage current of insulators [37]. The accumulated data from the outdoor insulator were utilized in the predicting model, which obtained an improvement of 49.529%, 72.736% error, and 12.761%, 36.641% accuracy in the training and validating operations. Nguyen et al. developed the hybrid model, which combined the convolution neural network (CNN) and Bi-LSTM to categorize the insulator leakage current [38]. The experiment proved that the CNN-Bi-LSTM outperformed other deep learning methods, which achieved improvements of 71.331% and 91.250% errors in the training and validating data with a 24-sequential window size. Therefore, the deep learning algorithms proved better performance in predicting the insulator leakage current compared with the traditional methodologies.
Although many researchers conducted many deep learning algorithms, the novel hybrid model, which combines the CNN and gated recurrent unit (GRU) algorithm, has not been evaluated and compared in predicting the leakage current of the insulator. In this research, the authors propose the novel CNN-GRU to more accurately and effectively categorize the leakage current of 15 kV HDPE distribution insulators. The innovative contributions in this study are as follows: (1) calculating the Pearson correlation between different climate features and the 15 kV high-voltage insulator leakage current, (2) developing the novel hybrid CNN and GRU to distinguish the leakage current levels of 15 kV HDPE insulators, (3) employing the hyperparameter optimization to establish the framework of the developed model, (4) analyzing and comparing the effectiveness and accuracy with other deep learning models, which include the recurrent neural network (RNN), the LSTM, the Bi-LSTM, and GRU. The methodologies are presented in the next section. The third section illustrates the hyperparameter results, and the fourth section presents the comparative tables between different deep learning methodologies.

2. Algorithm Flow and Methodology

The high frequent leakage currents come from the pollution particles in the environment, which accumulate on the insulator surface. The accumulated layer is influenced by many features, including air pollutants, wind direction, temperature, humidity, etc. In this research, many weather parameters were accumulated every hour for more than a two-year period, which is illustrated in Figure 1. The general timelines of this study are illustrated in the following aspects:
1.
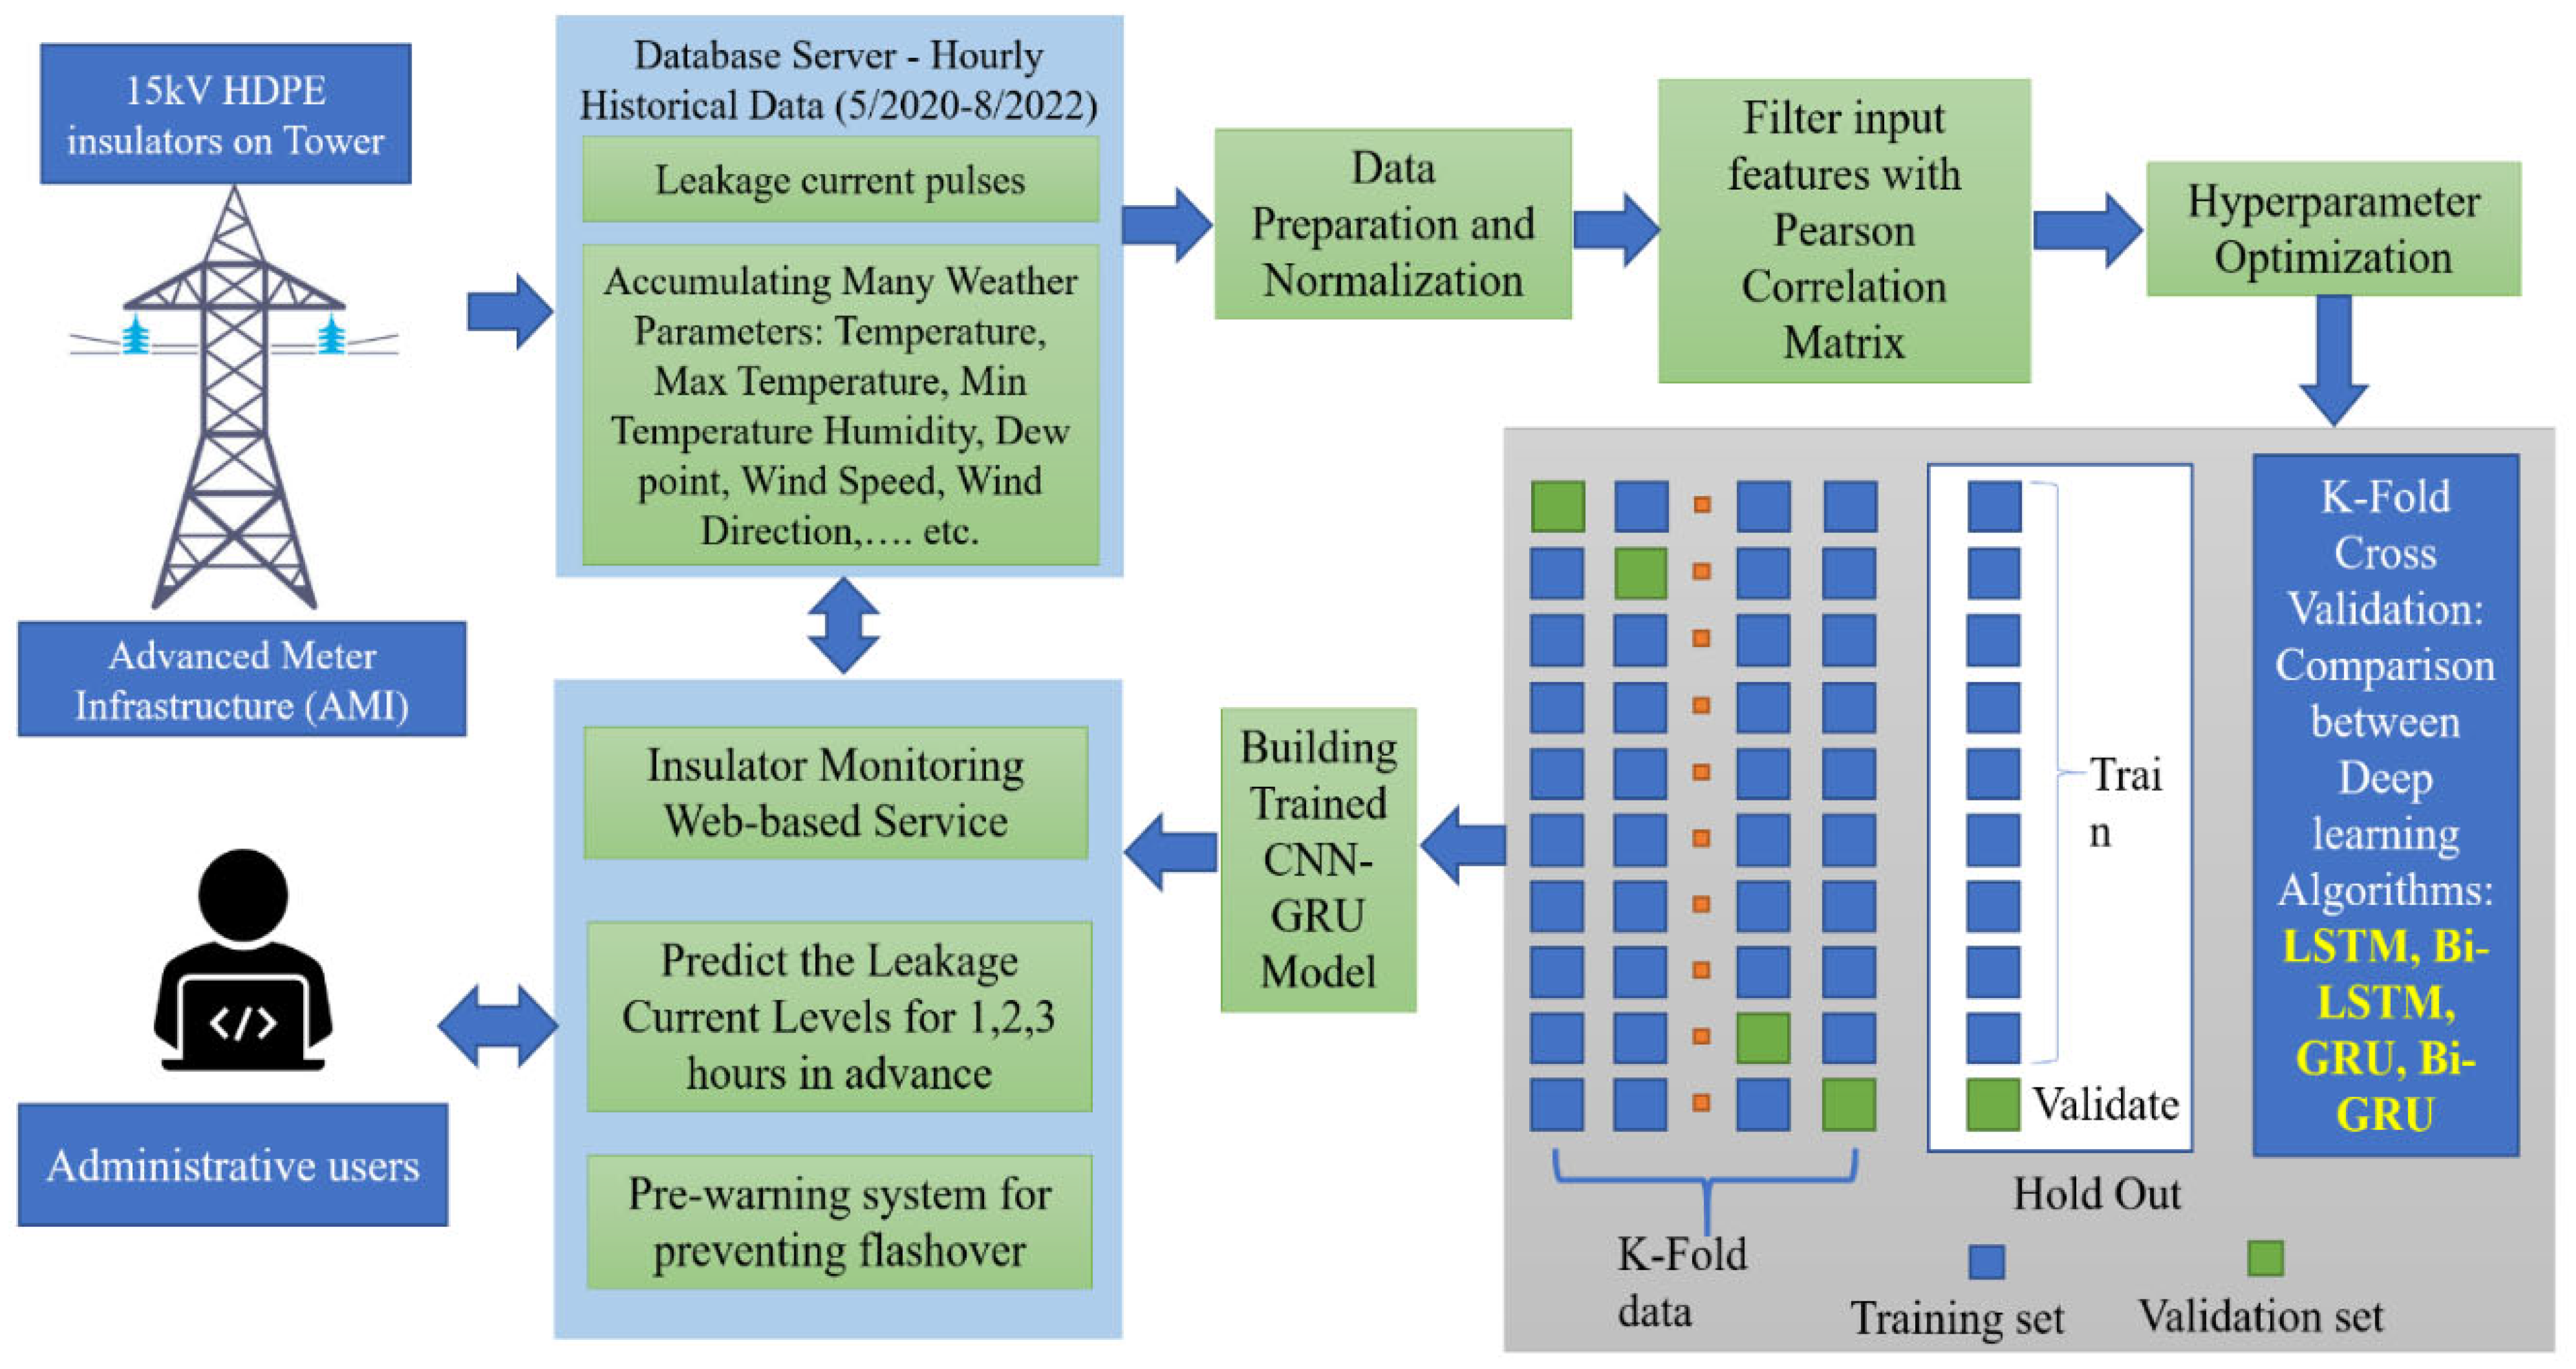
Collecting data: The weather parameters were gathered for more than two years. The advanced meter infrastructure (AMI) with accurate sensors was installed on the different transmission towers in Taiwan. The AMI systems transferred all the collected information to the database server. Moreover, the leakage current pulses were also accumulated and categorized based on their values in four locations. This research utilizes the weather parameters as input features and leakage current level as the target vector. All the collected information needs to be normalized by the min-max methodology, as in Equation (1), where in i , in min , and in max are the variable, the minimum value, and maximum of the input data, respectively.
In _ nor i = in i in min in max in min
2.
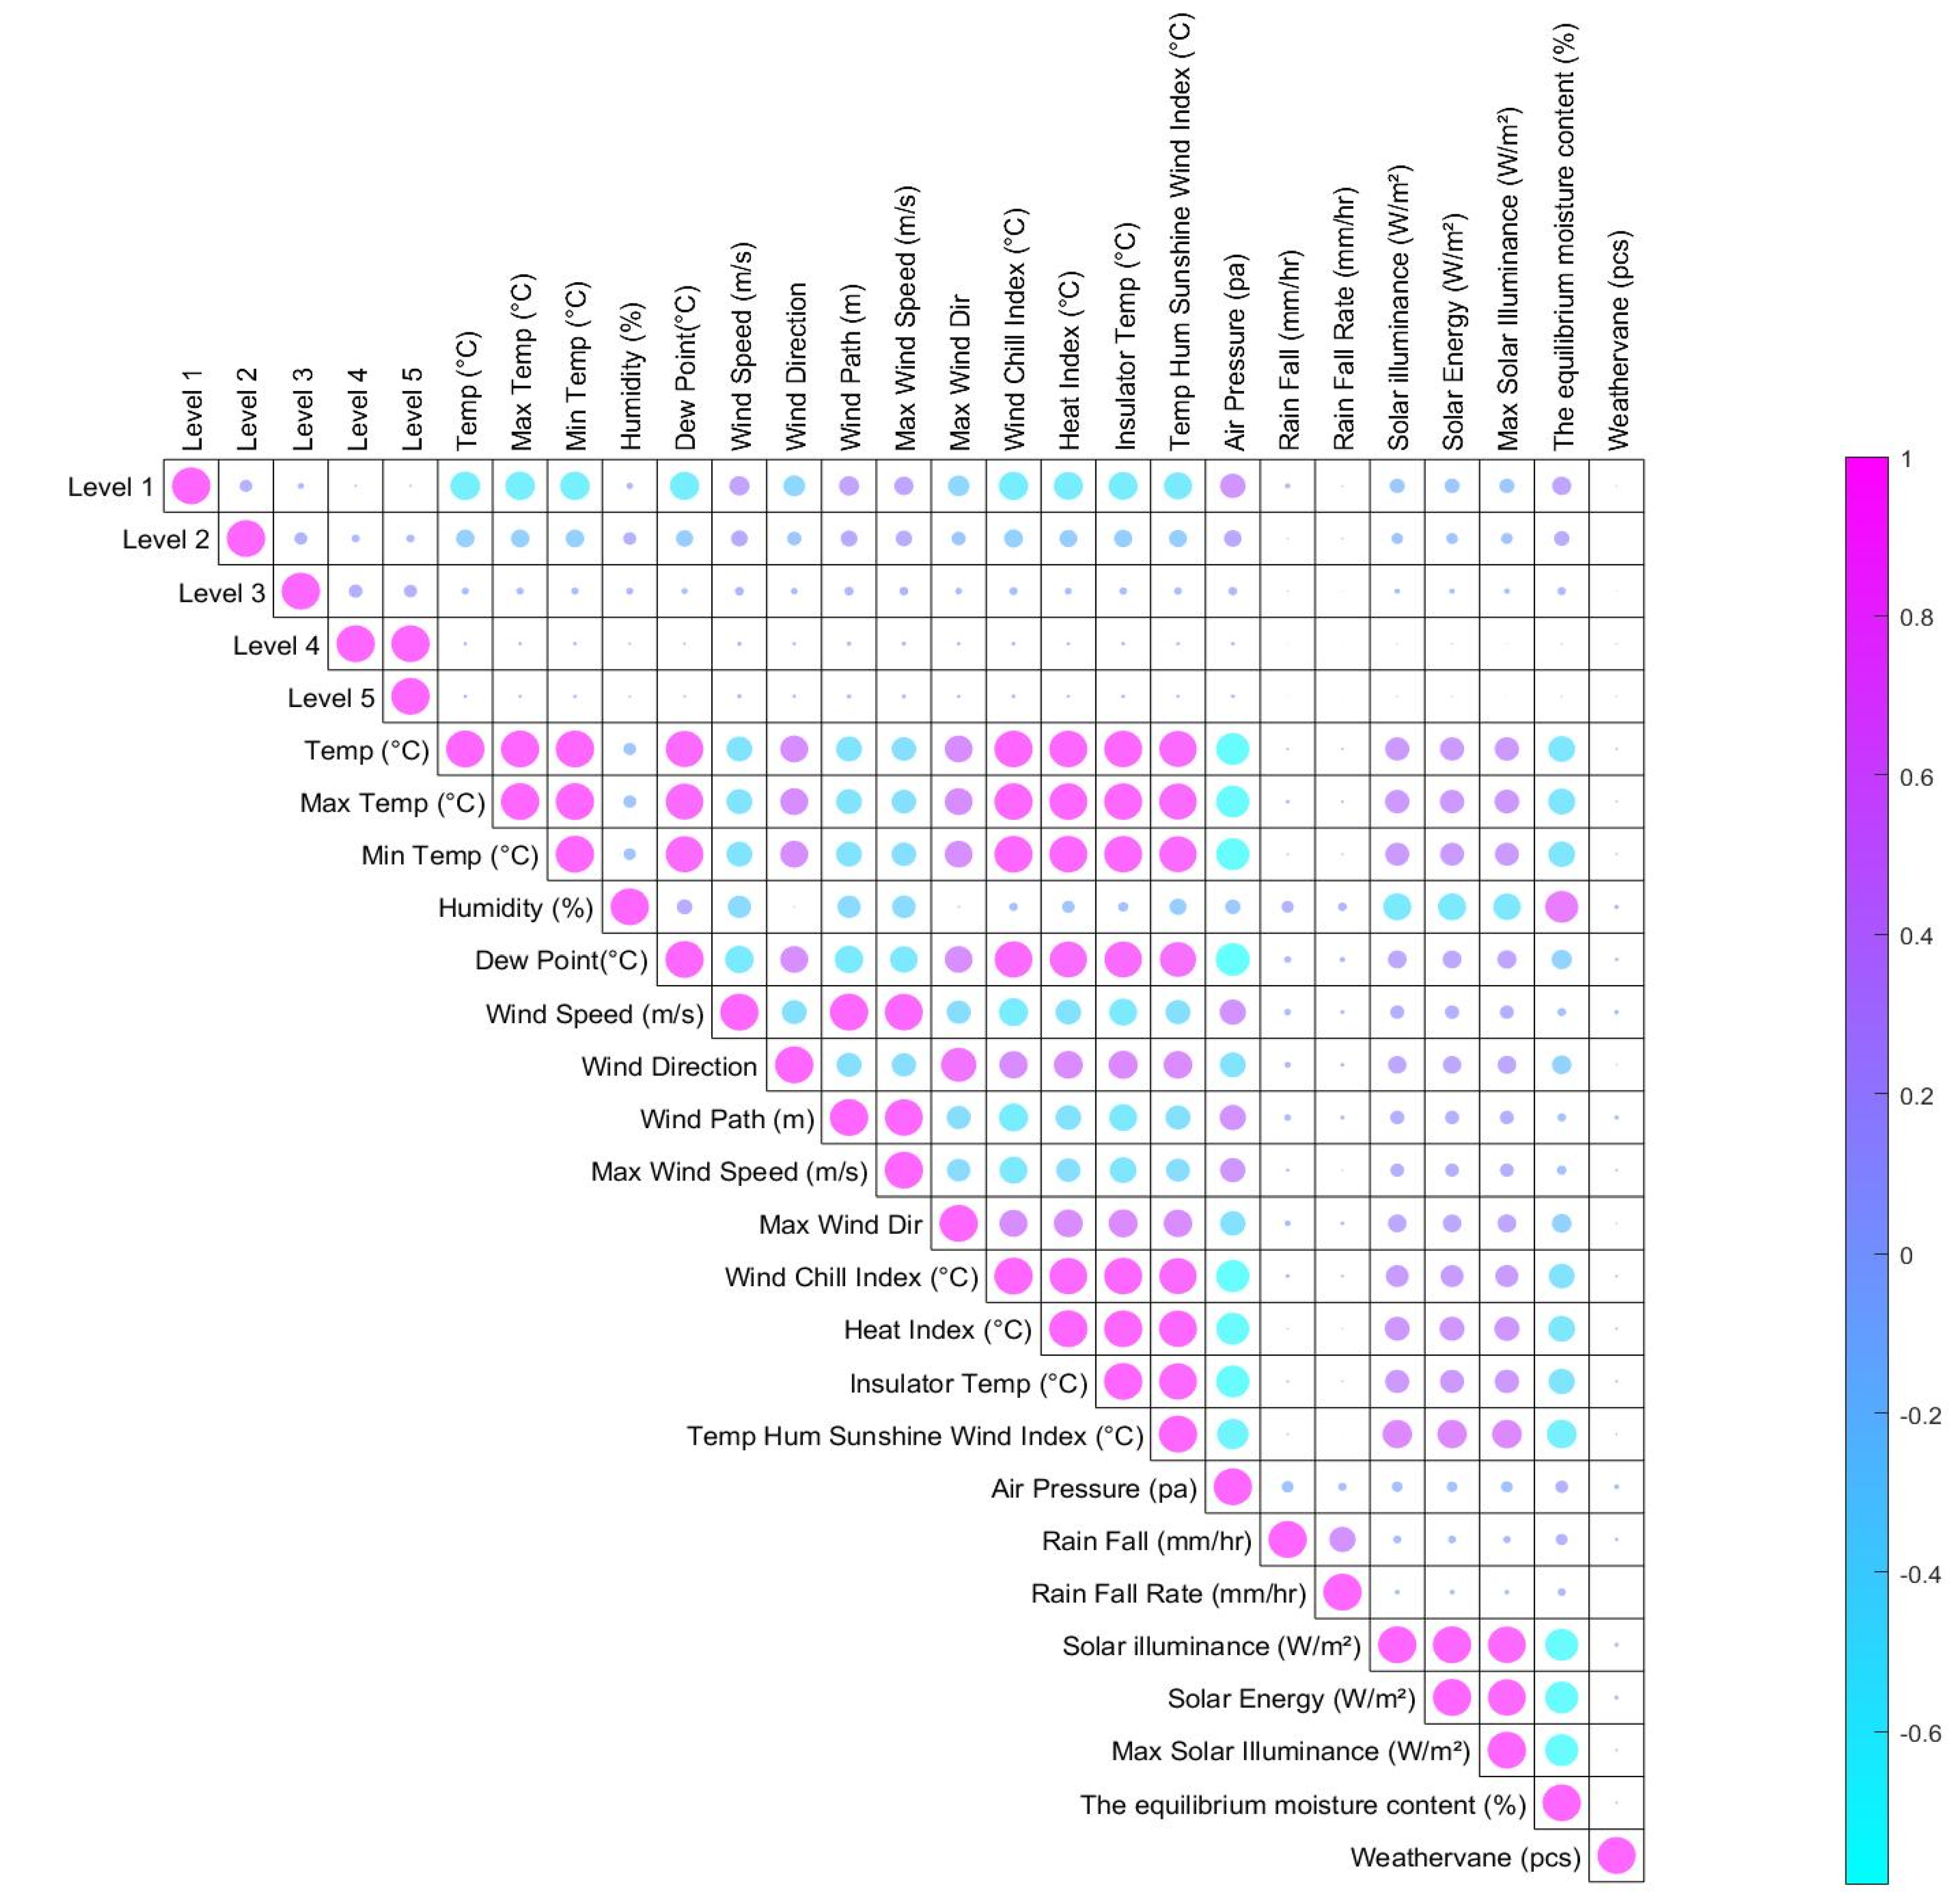
Selecting input features: To completely evaluate the influence of accumulated features on the insulator leakage current, this research calculates the Pearson correlation matrix between variables. The Pearson values present the correlation between two factors which vary from −1 to 1, as calculated in Equation (2), where In i , In ¯ , Out i , and Out ¯ are the input, average value of input, output, and average value of output, respectively [39,40]. The correlation coefficients are calculated for each collected environmental factor with the leakage current pulses. The influences of weather parameters are evaluated based on the interaction with the leakage current levels. The environmental indexes with high correlation are selected as dominant input features for utilization in the predicting model.
Corr In Out = In i In ¯ Out i Out ¯ In i In ¯ 2 Out i Out ¯ 2
3.
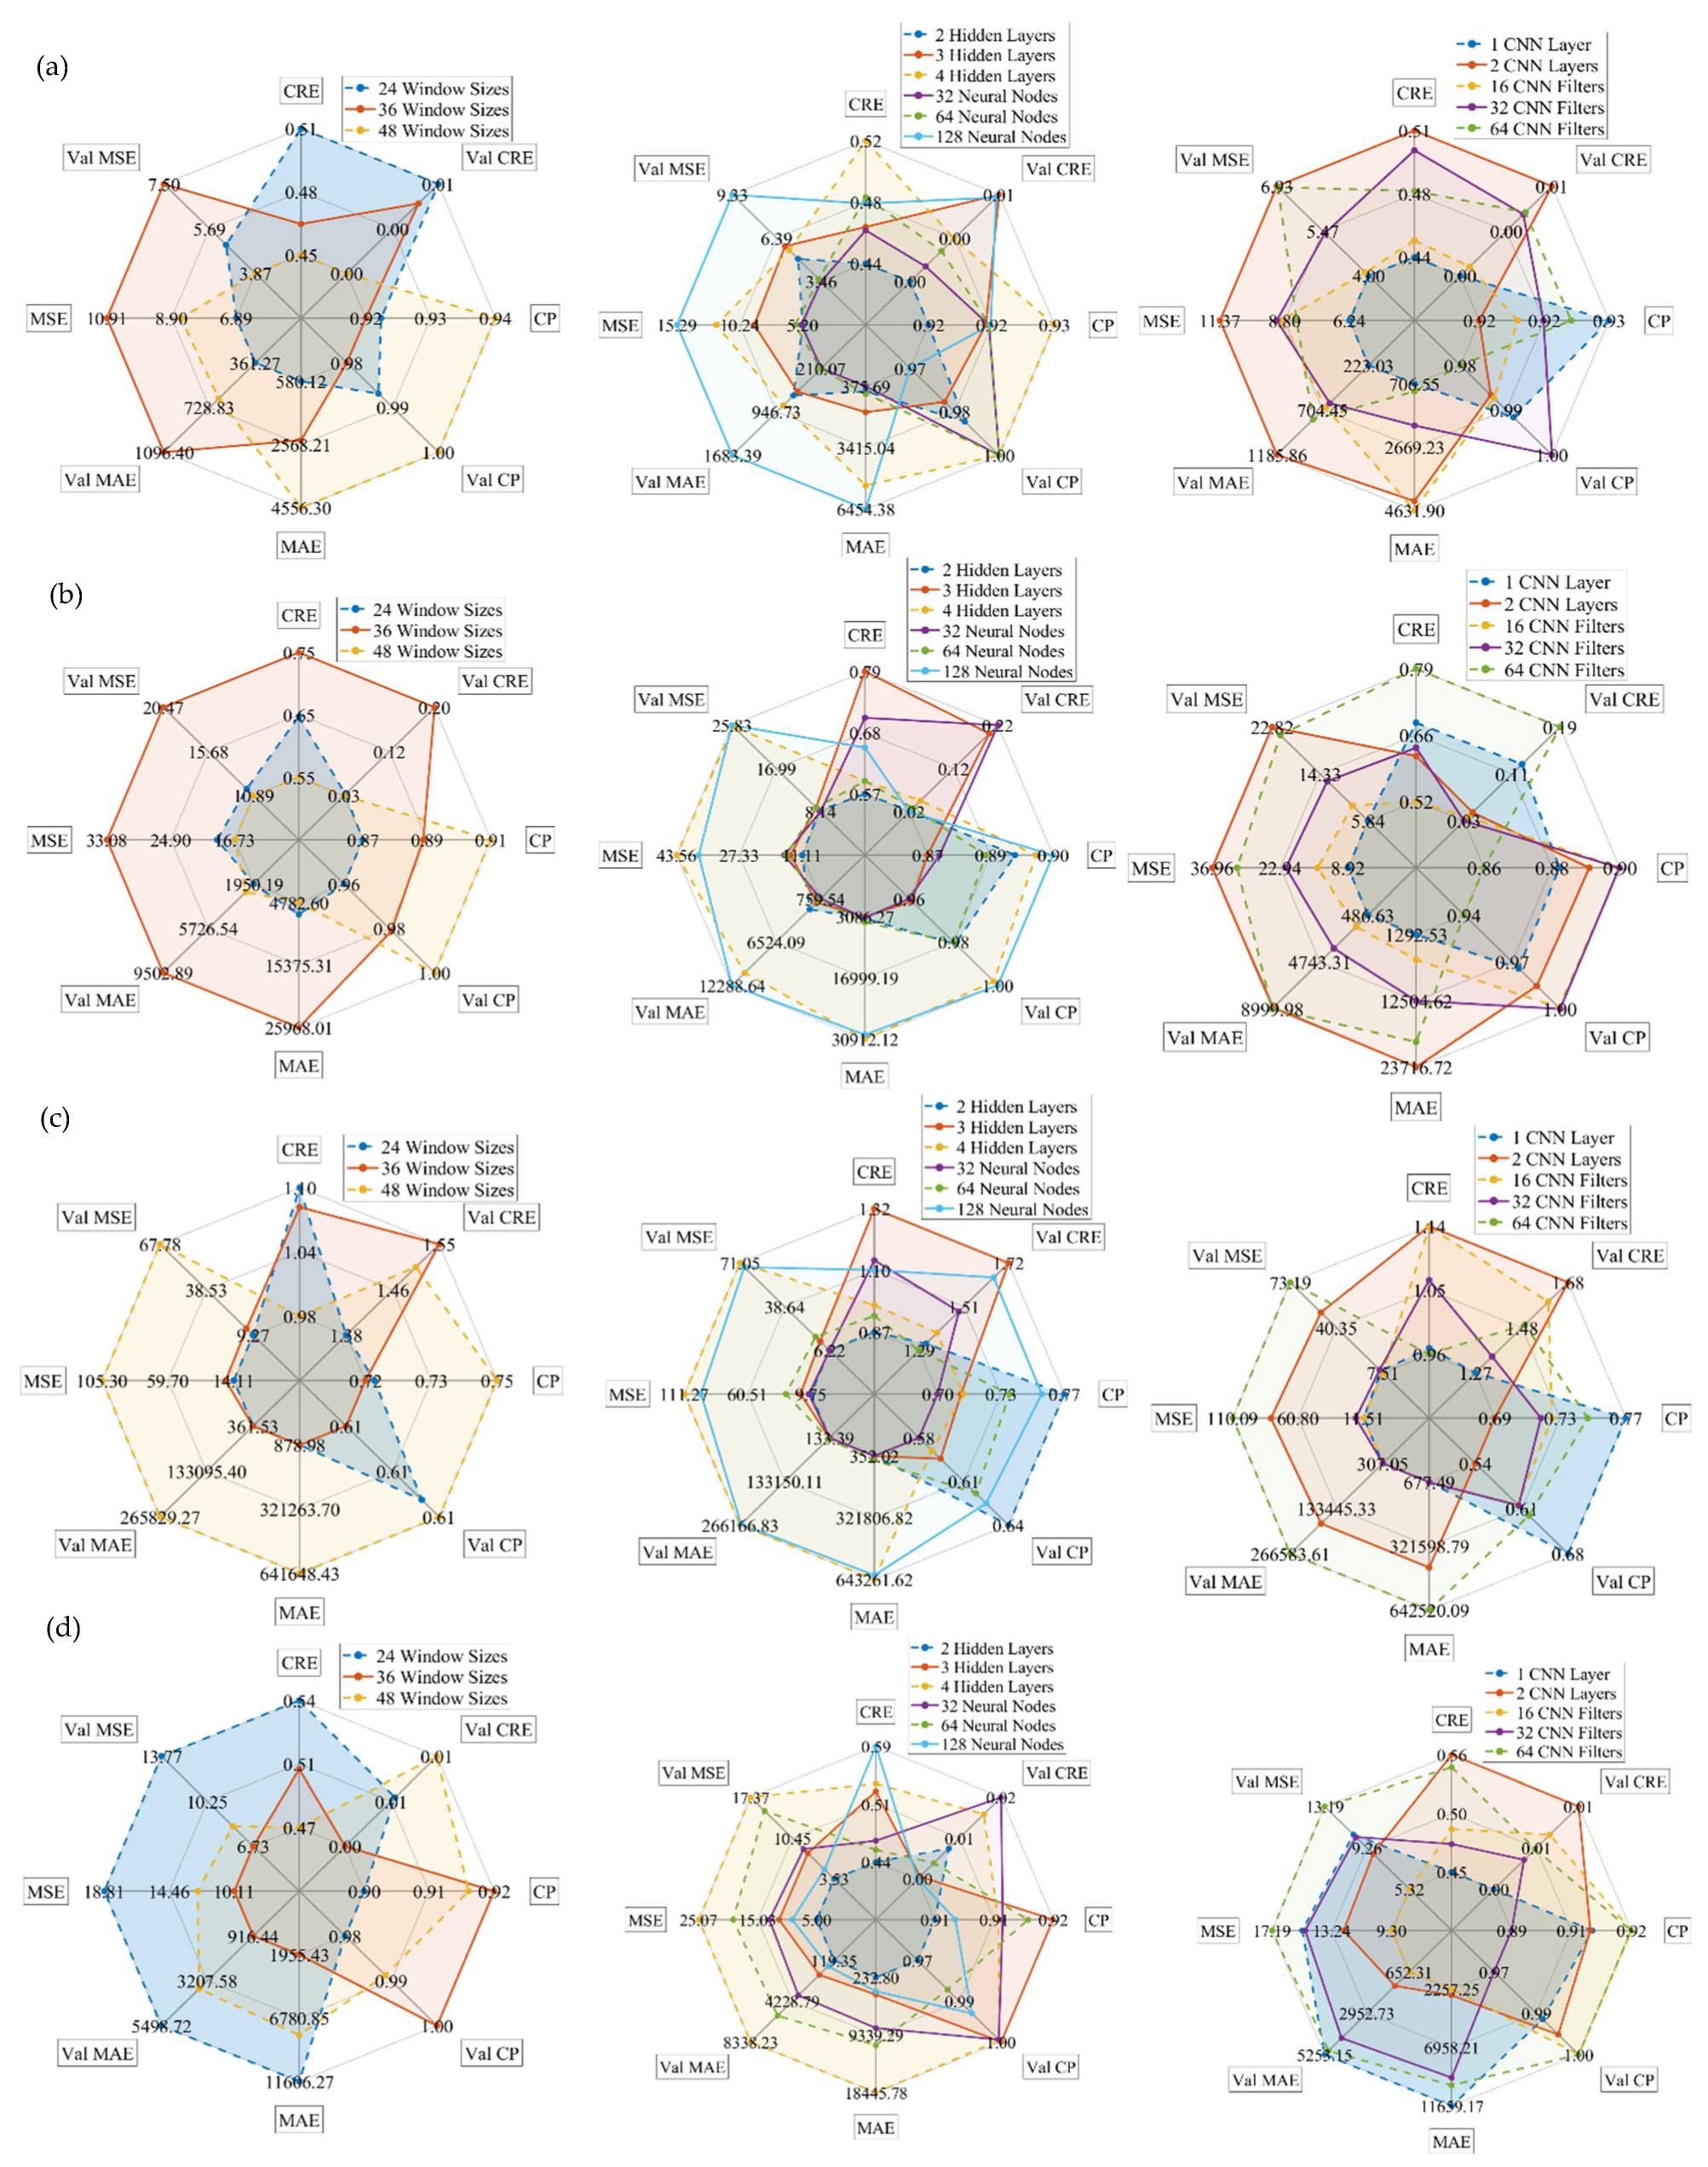
Performing the hyperparameter optimization to analyze the effectiveness of setting parameters on the deep learning models: This research identifies the most appropriate parameter which significantly improves the performance of classifying models. The simple grid search method is deployed to define the optimized setting parameter of the proposed models [41]. Moreover, the simple grid search analyzes the effects of setting variables on the predicting accuracy.
4.
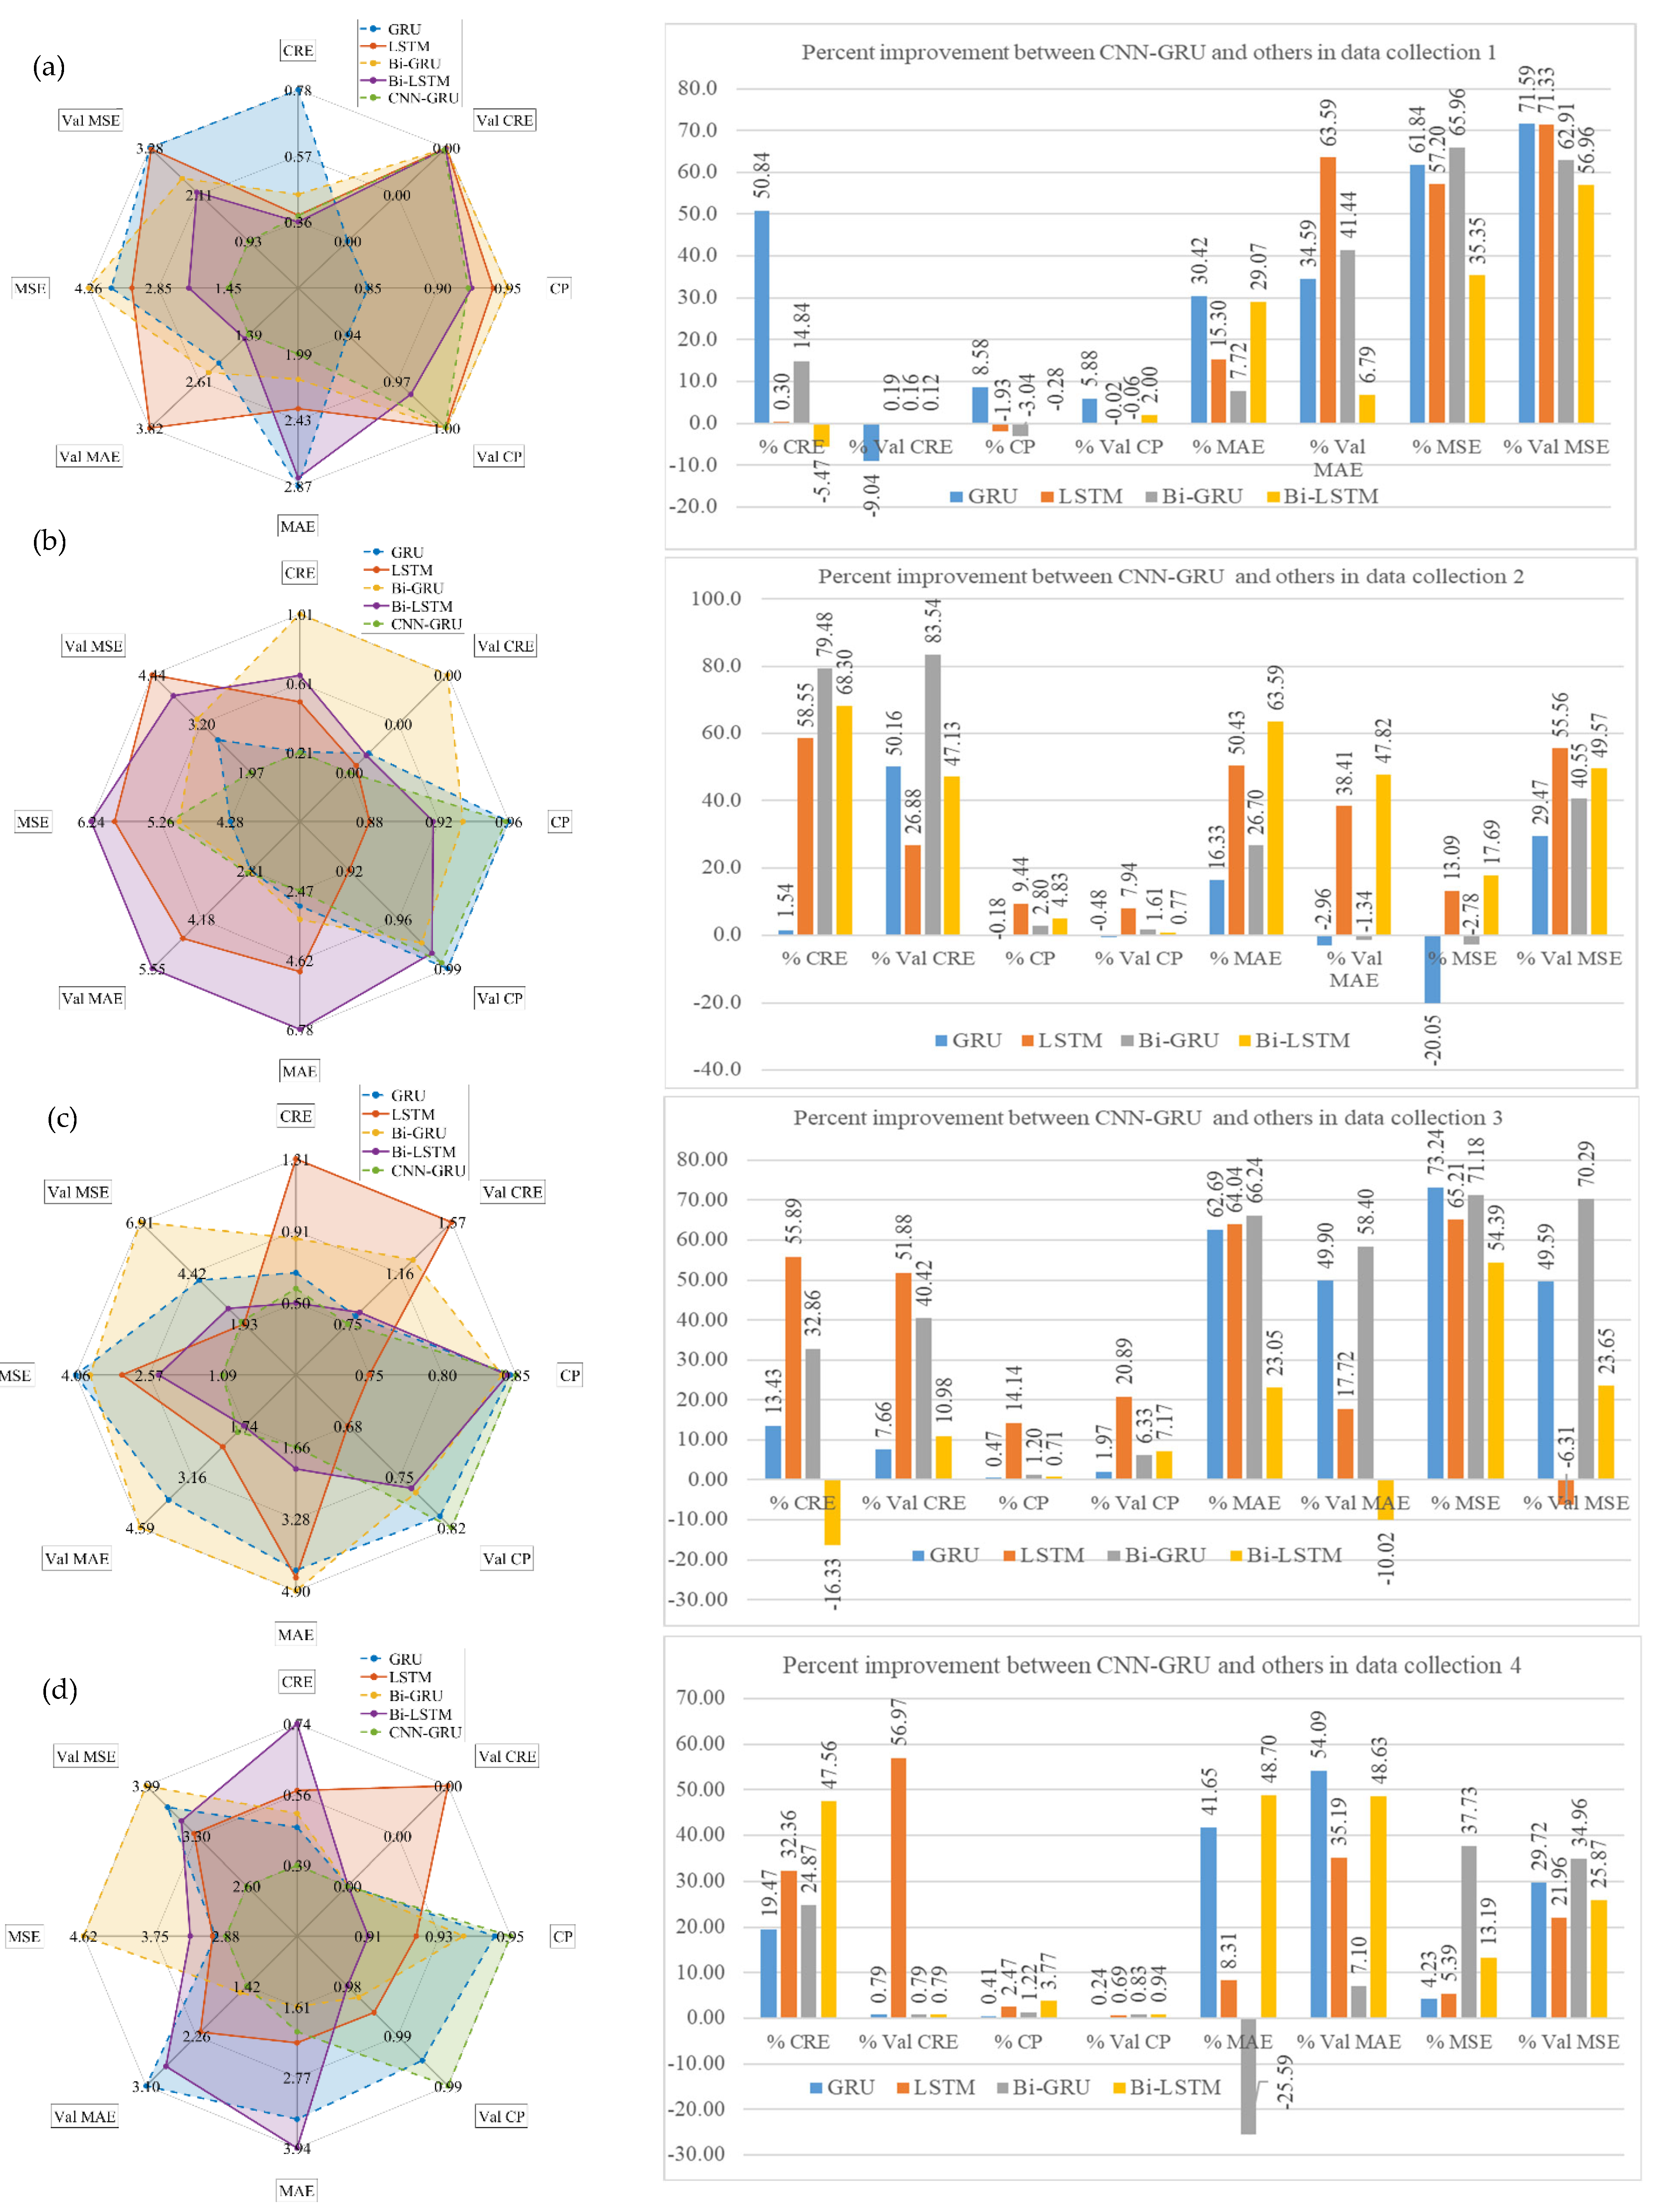
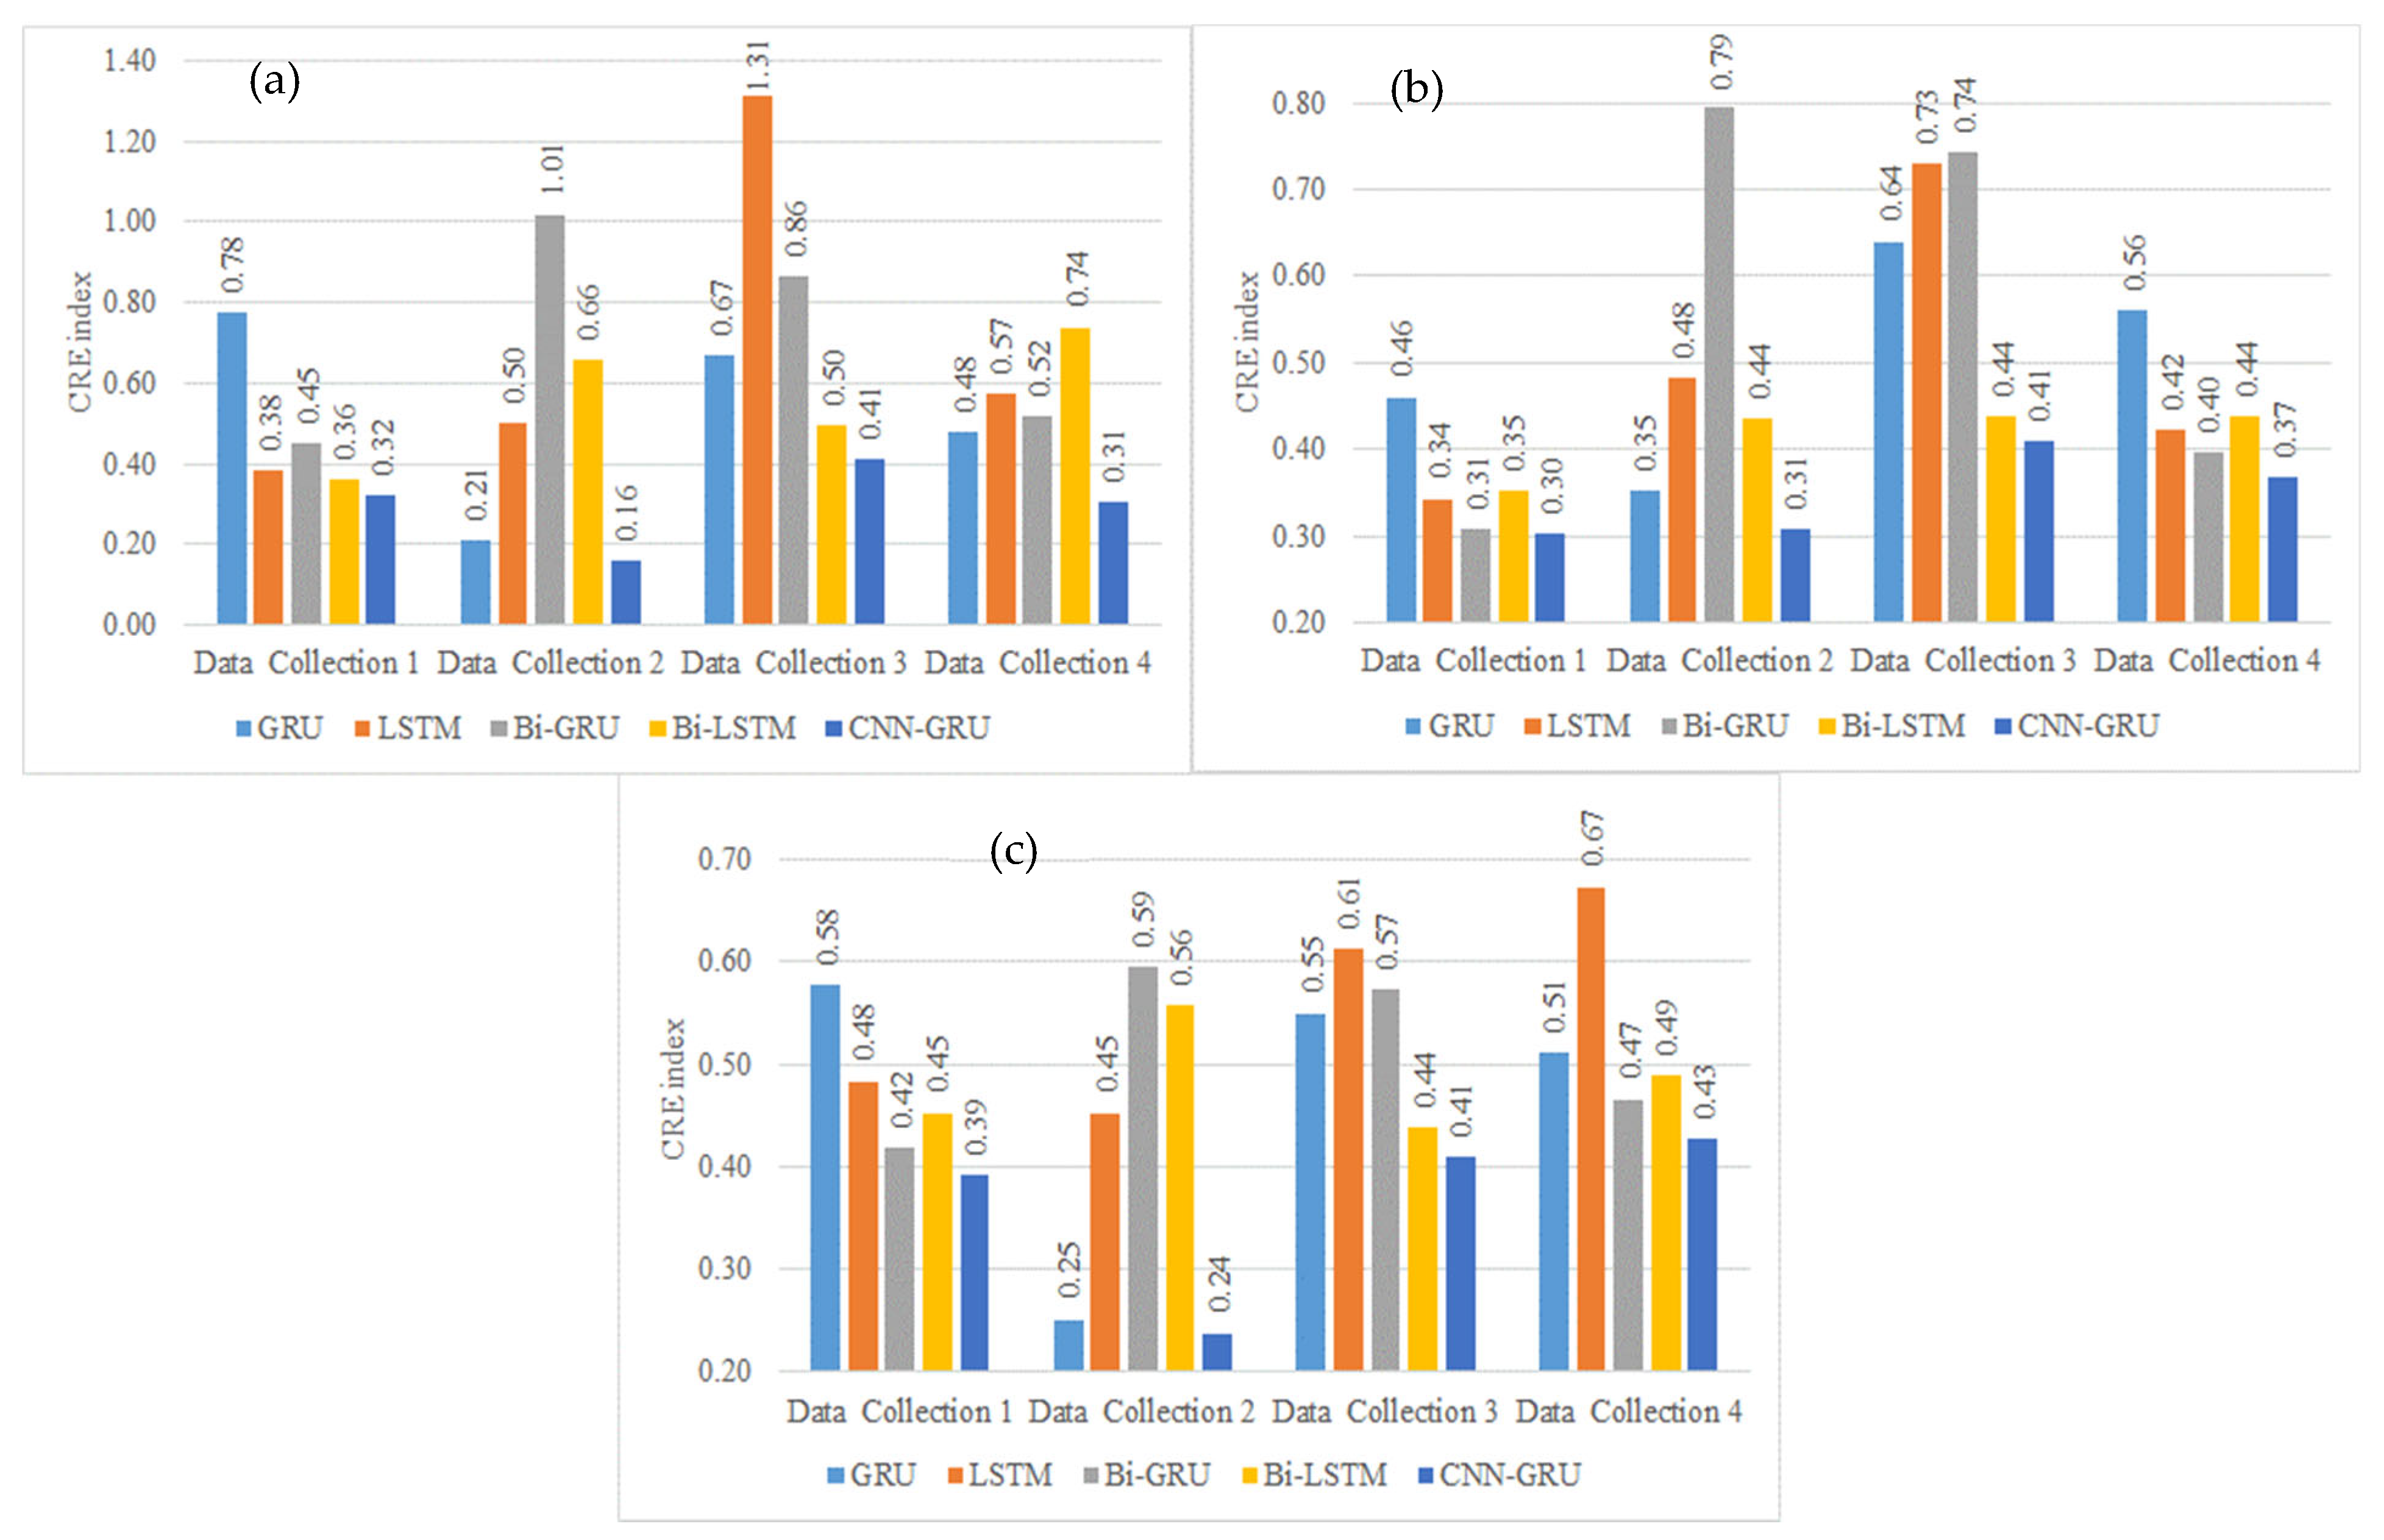
Comparing the performance and accuracy between the proposed algorithm and other deep learning methodologies with the optimized architecture: The CNN-GRU is completely analyzed with the RNN, LSTM, Bi-LSTM, and GRU models by utilizing the K-fold cross-validation [42,43]. This method could effectively evaluate the performance of deep learning algorithms on the collected data.
5.
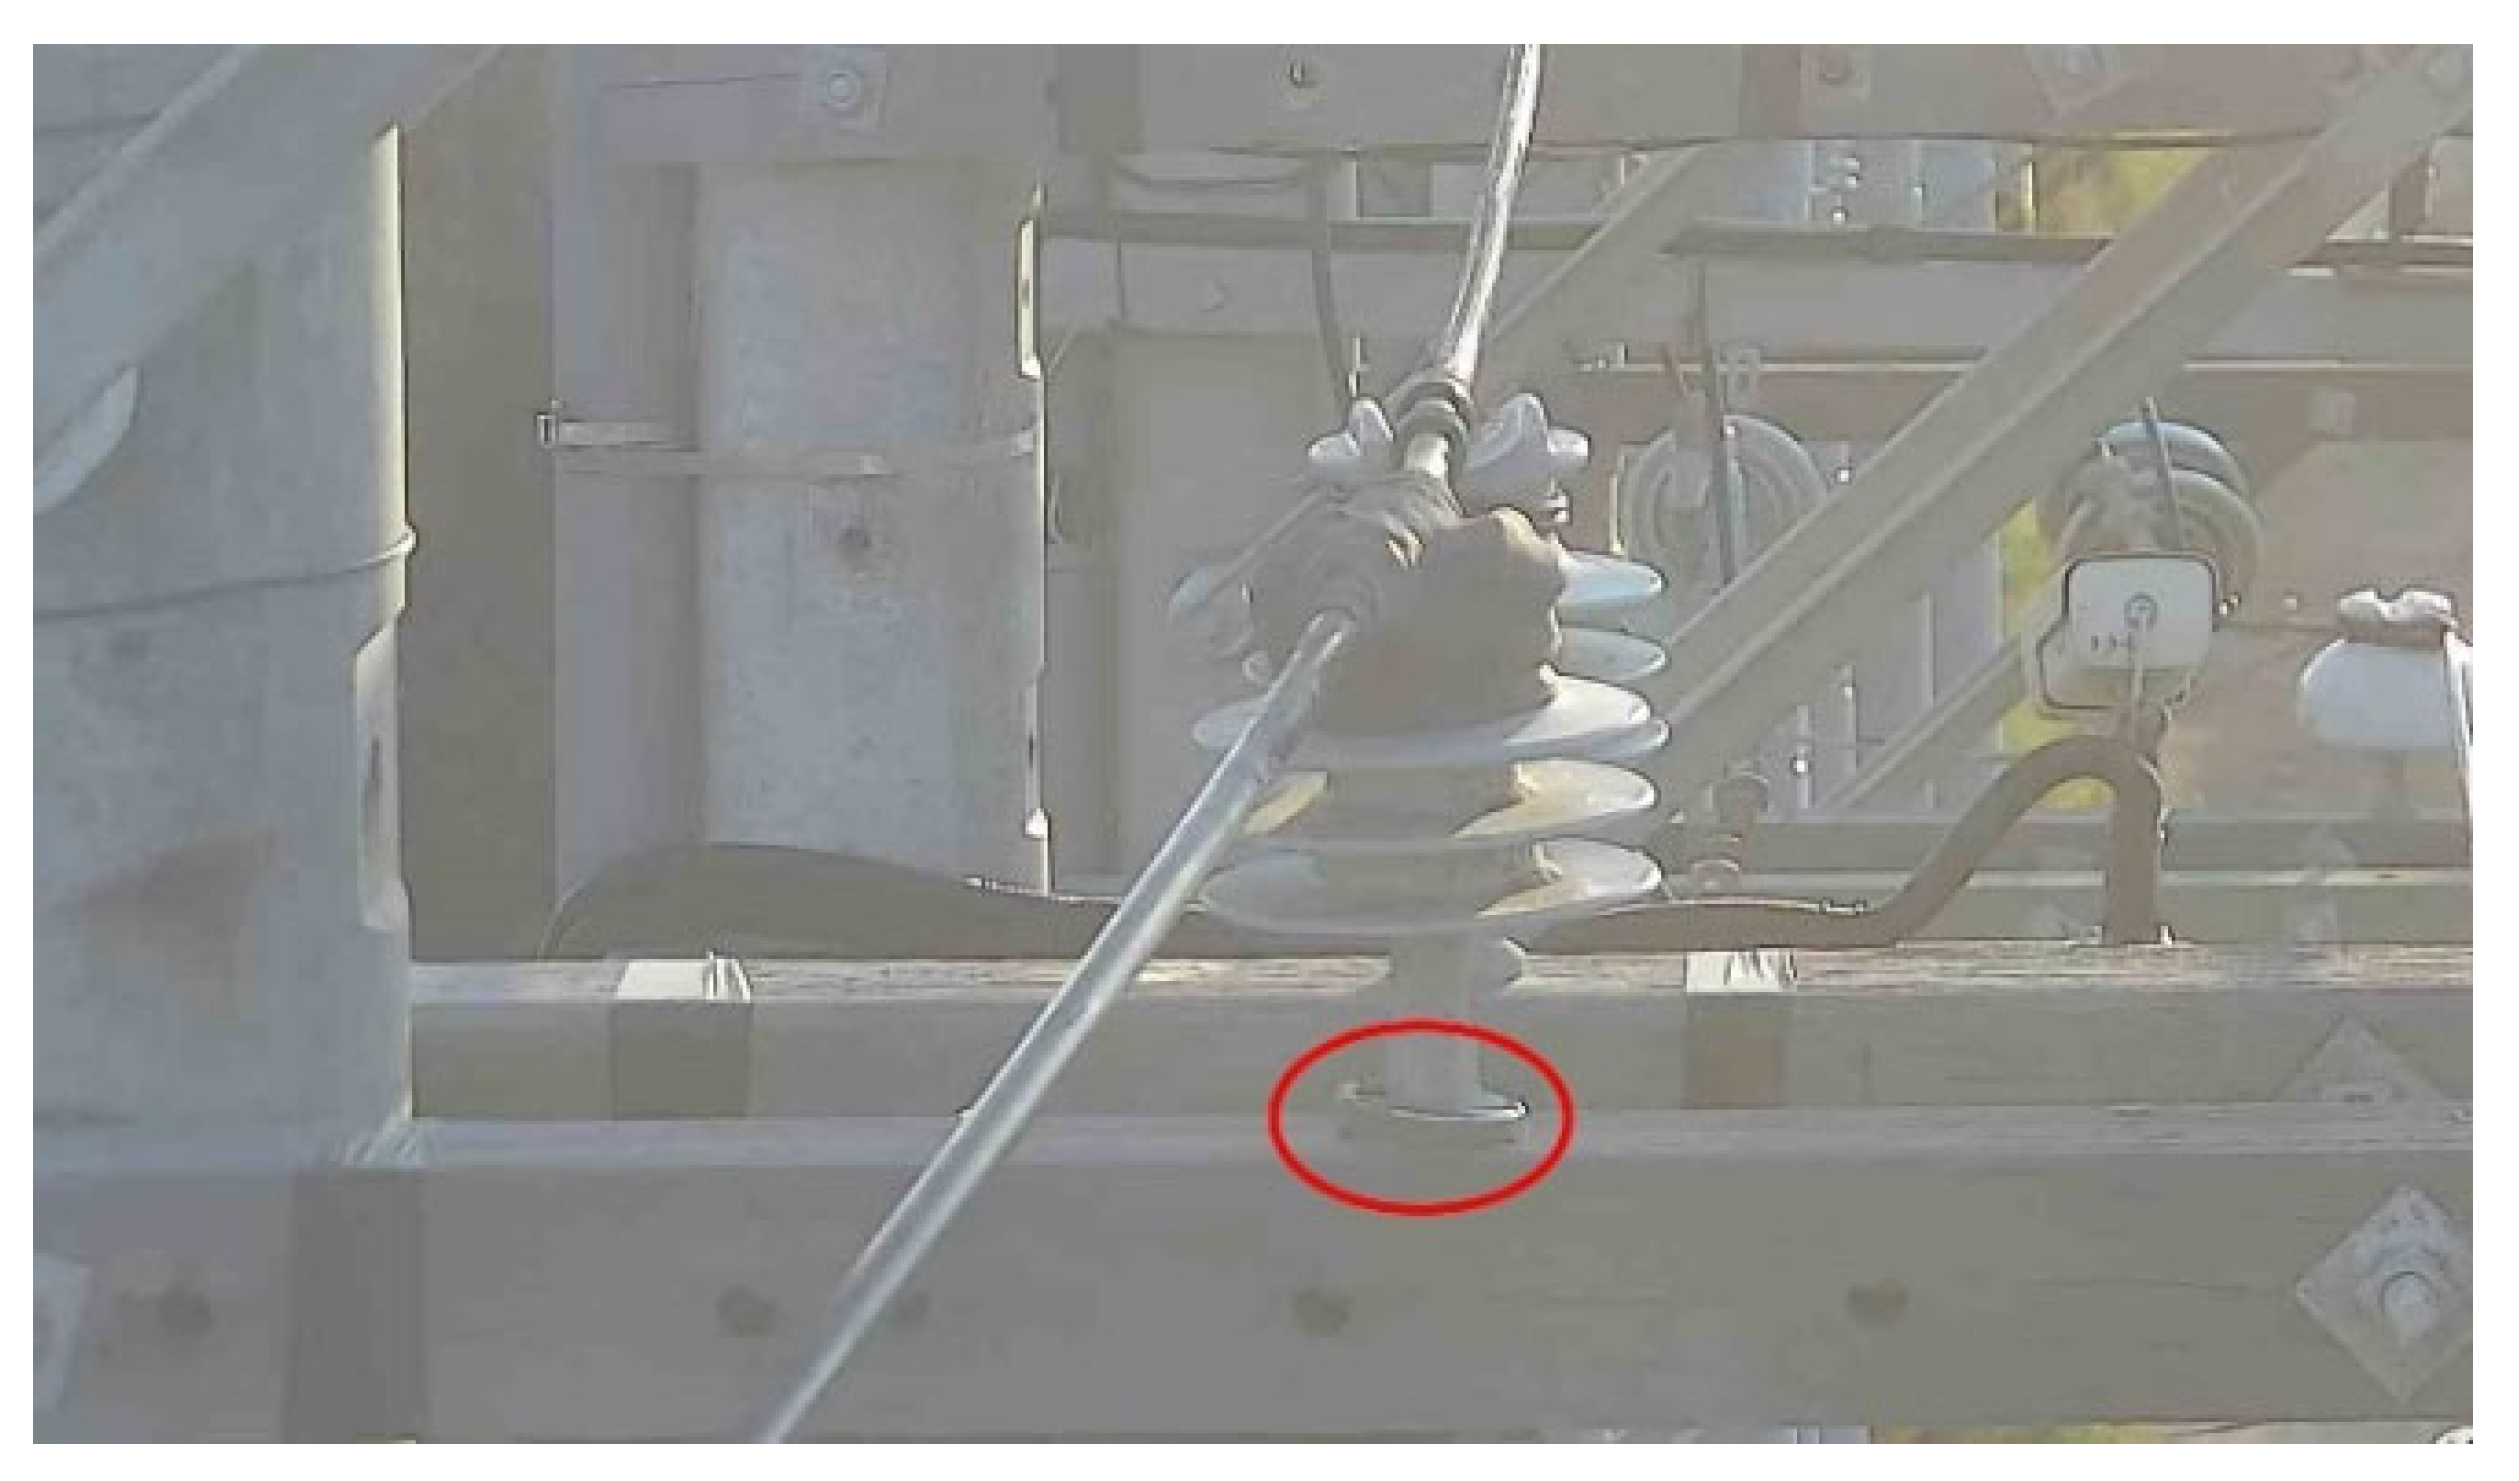
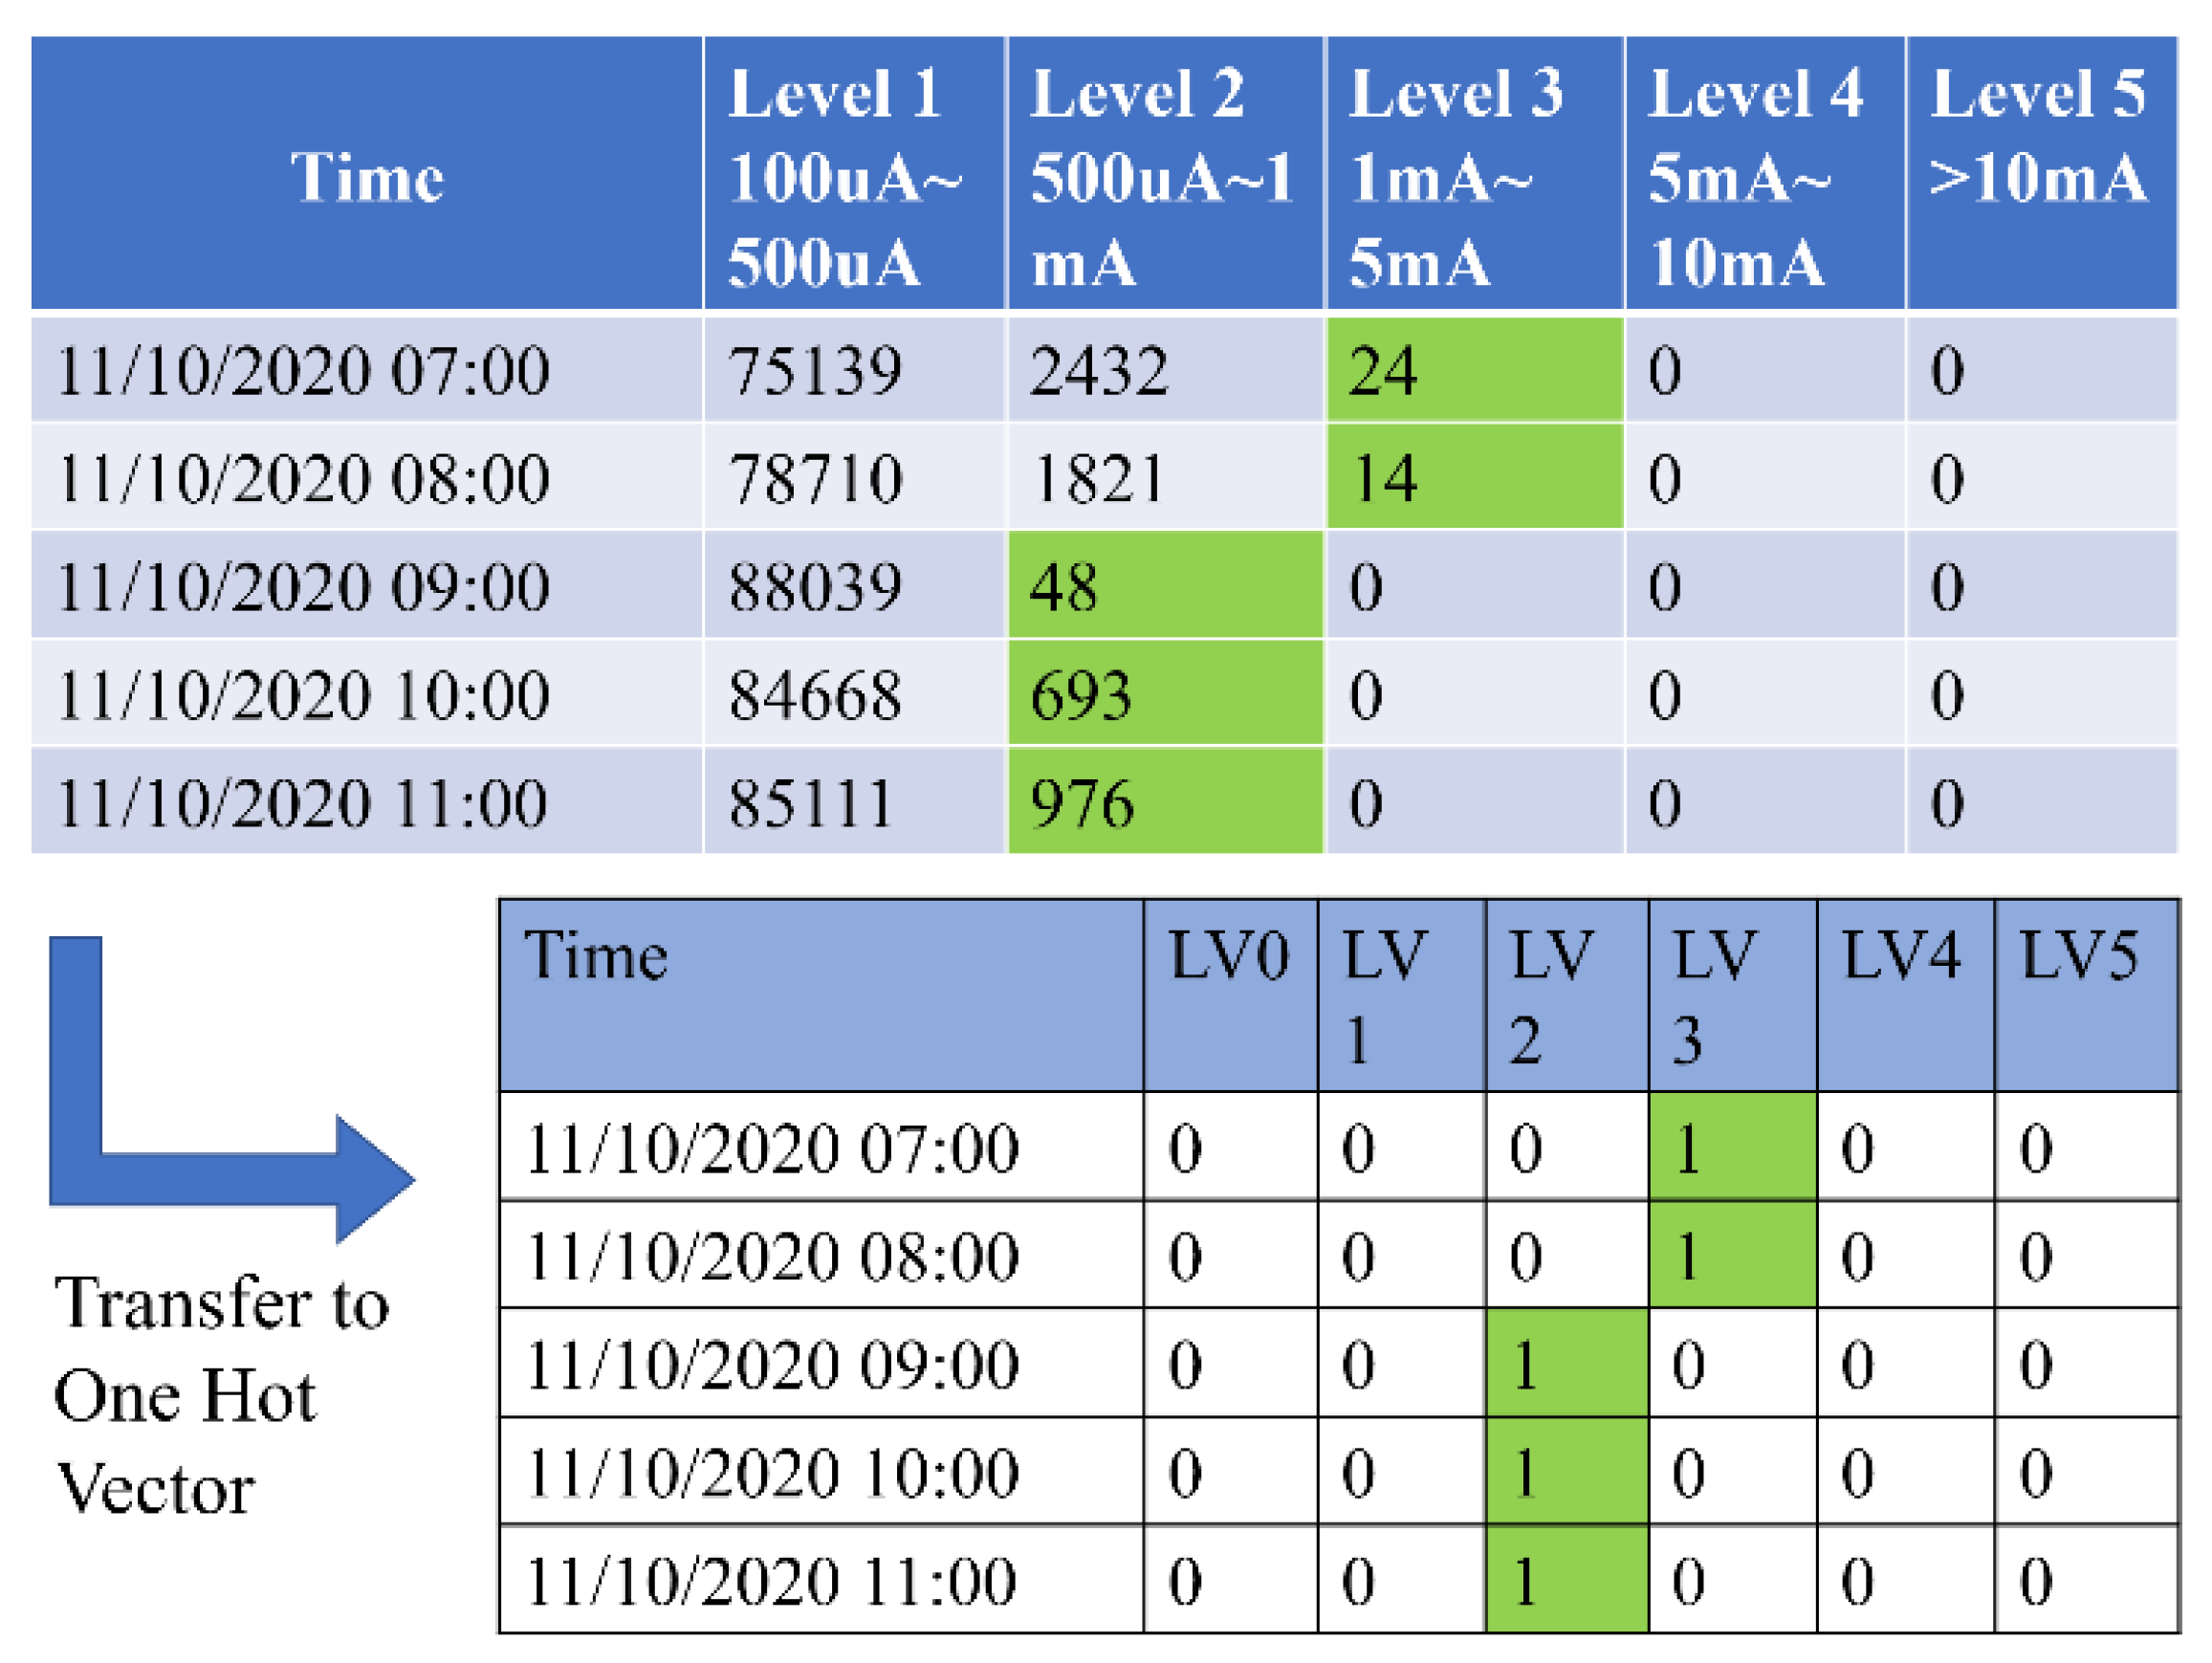
The collected data come from the natural insulators which were installed in Kaohsiung City, a coastal area in Taiwan. The test site is the 15 kV transmission line which is normally operated, as shown in Figure 2. The performance between predicting models is analyzed through different evaluation indexes, which include the mean square error (MSE), category cross entropy (CRE), cosine proximity (CP), and mean absolute error (MAE), as in the following Equations (3)–(6), where out i , out ^ i , out ¯ , and K are the actual, predictive, average vectors, and the number of testing set, respectively. The collected leakage current surges are transformed into one-hot vectors for the category purpose, which are utilized as target vectors in the forecasting algorithms, as in Figure 3. A total of 5 leakage current levels are categorized with different leakage current surges.
CRE = log ( e s p j C e s j )
MSE = 1 K i = 1 K out i out ^ i 2
CP = i = 1 n out i   out ^ i i = 1 n out i 2 i = 1 n out ^ i 2
MAE = 1 K i = 1 K out i out ^ i

2.1. Primary Influence of Environmental Factors on Insulator Leakage Current

Previous research proved that the weather indexes correlate critically with the leakage current. These weather factors accumulated the pollution particles in the air, which gradually deposited on the surface of insulators. Moreover, high humidity and rainfall conditions intensify the wet deposition, which makes contamination accumulate obviously. However, the effect of other weather factors on the insulator leakage current is comparatively complex. In this research, the authors calculate the Pearson correlation matrix to effectively analyze the significant correlation with leakage current, as presented in Figure 4. Each collected insulator leakage current surge is computed in the correlation index with the weather parameters. The analysis of the influence parameters of the insulator leakage current is detailed as follows:
  • Level 3, level 4, and level 5 have a weak correlation with all of the collected weather parameters, which indicates a weak relationship between the high level of leakage current and other environmental parameters. However, level 1 and 2 prove substantial similarity with the weather factors. Therefore, the leakage current levels from 0 to 2 are utilized as target variables in the categorizing models.
  • The average, the maximum, and the minimum temperature during a 1-h interval have the most negative correlation with leakage current, which are −0.60223, −0.60086, and −0.60276, respectively. In addition, the dew point, wind direction, and maximum wind direction have a contradictory connection with the leakage current, which could be applied in the predicting model. The wind chill index, heat index, insulator temperature, and temperature humidity sunshine wind index are also implemented as input variables for effectively distinguishing the leakage current levels.
  • The air pressure has the most positive connection with the leakage current due to the installed high mountain area, which is the 0.440471 Pearson index. Moreover, the wind speed, wind path, maximum wind speed, and equilibrium moisture content have an ordinary relationship with the leakage current levels 1 and 2, and are employed as high correlation components in the predicting methodology. The increase in these environmental factors will enhance the number of surges of 15 kV HDPE insulators because of their positive correlation magnitudes.
  • Moreover, some weather factors have a weak correlation with the leakage current, but they have formidable relationships with other weather parameters and are also included in the predicting methodology. Solar illuminance, maximum solar illuminance, and solar energy are also engaged in the categorizing algorithm to enhance accuracy and stability effectively.
From the Pearson correlation matrixes, some natural environmental features which have formidable correlations with leakage current are selected as input parameters for categorizing the 15 kV HDPE insulators from level 0 to level 2.

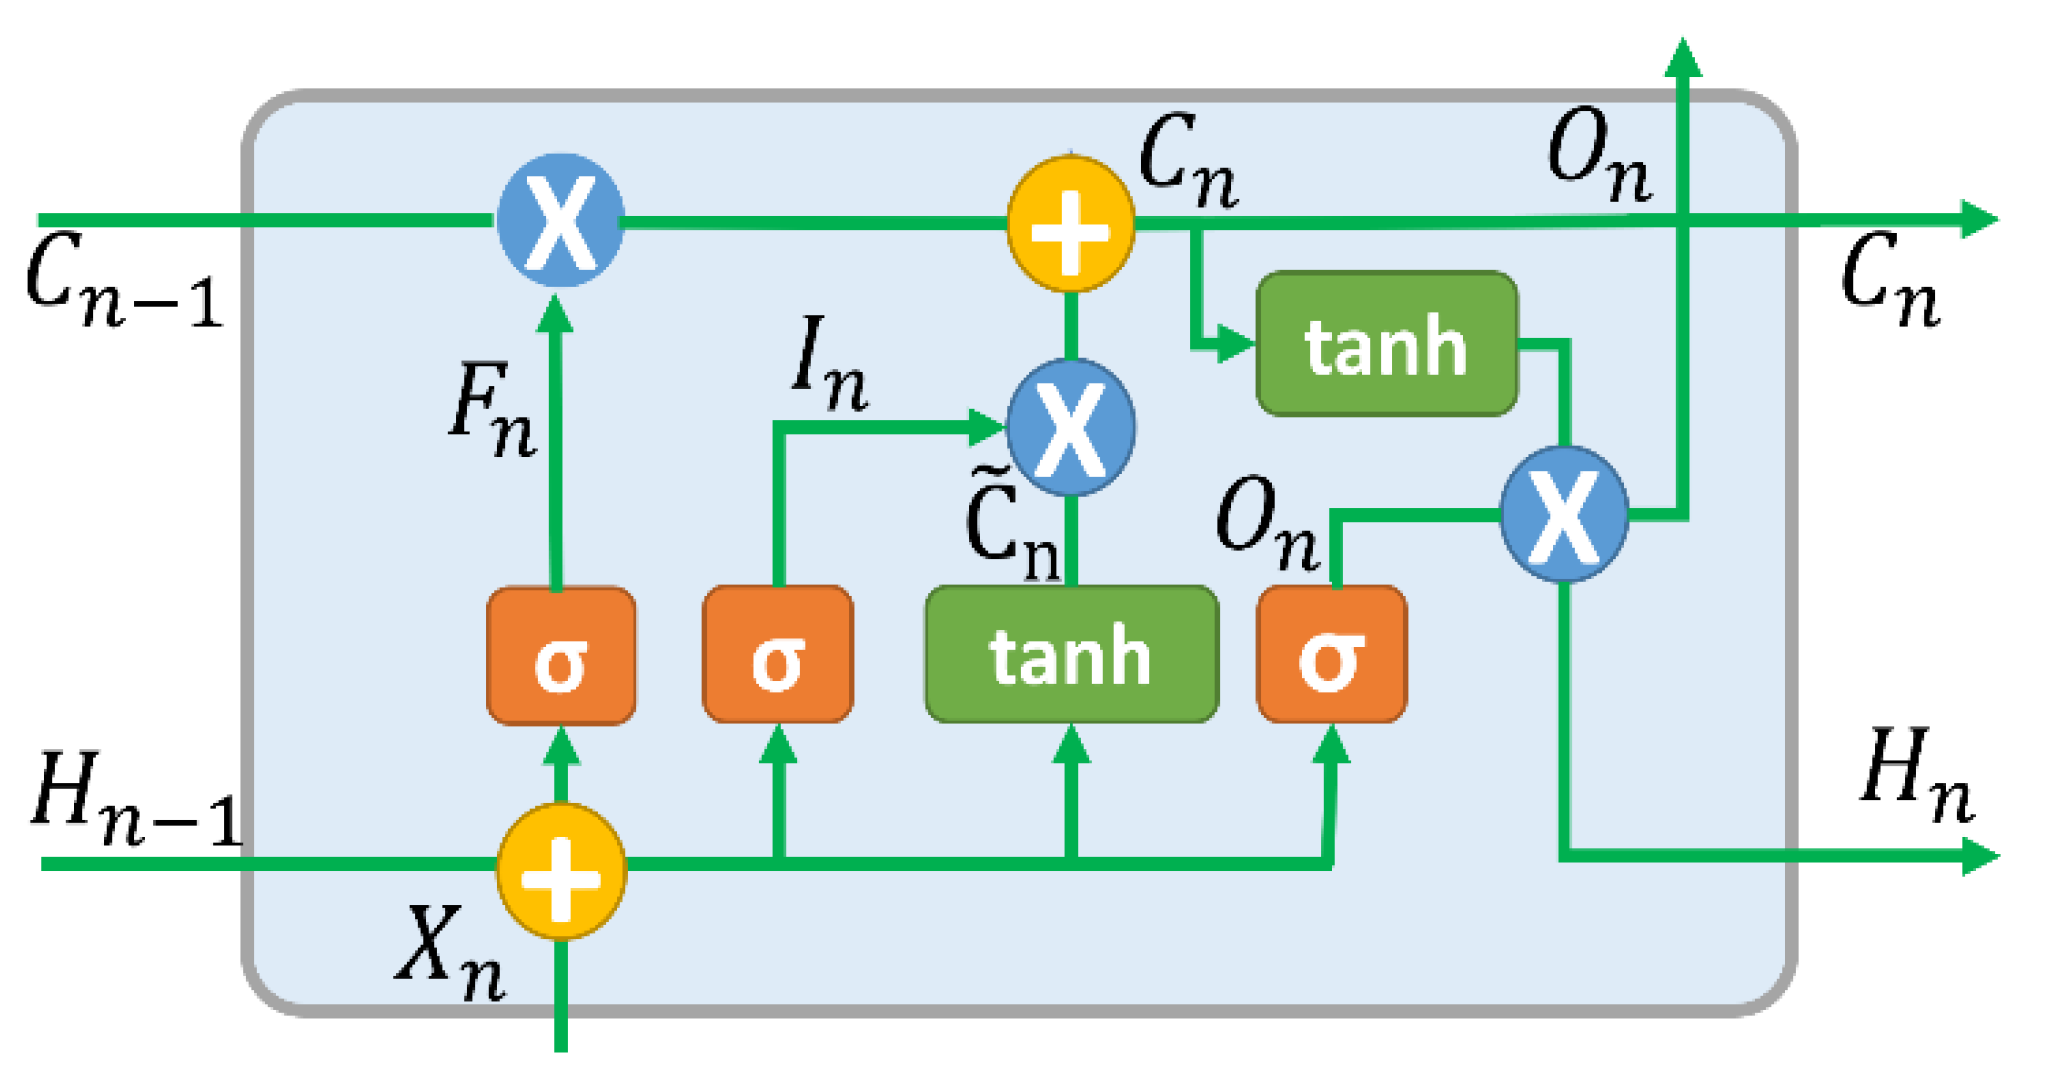
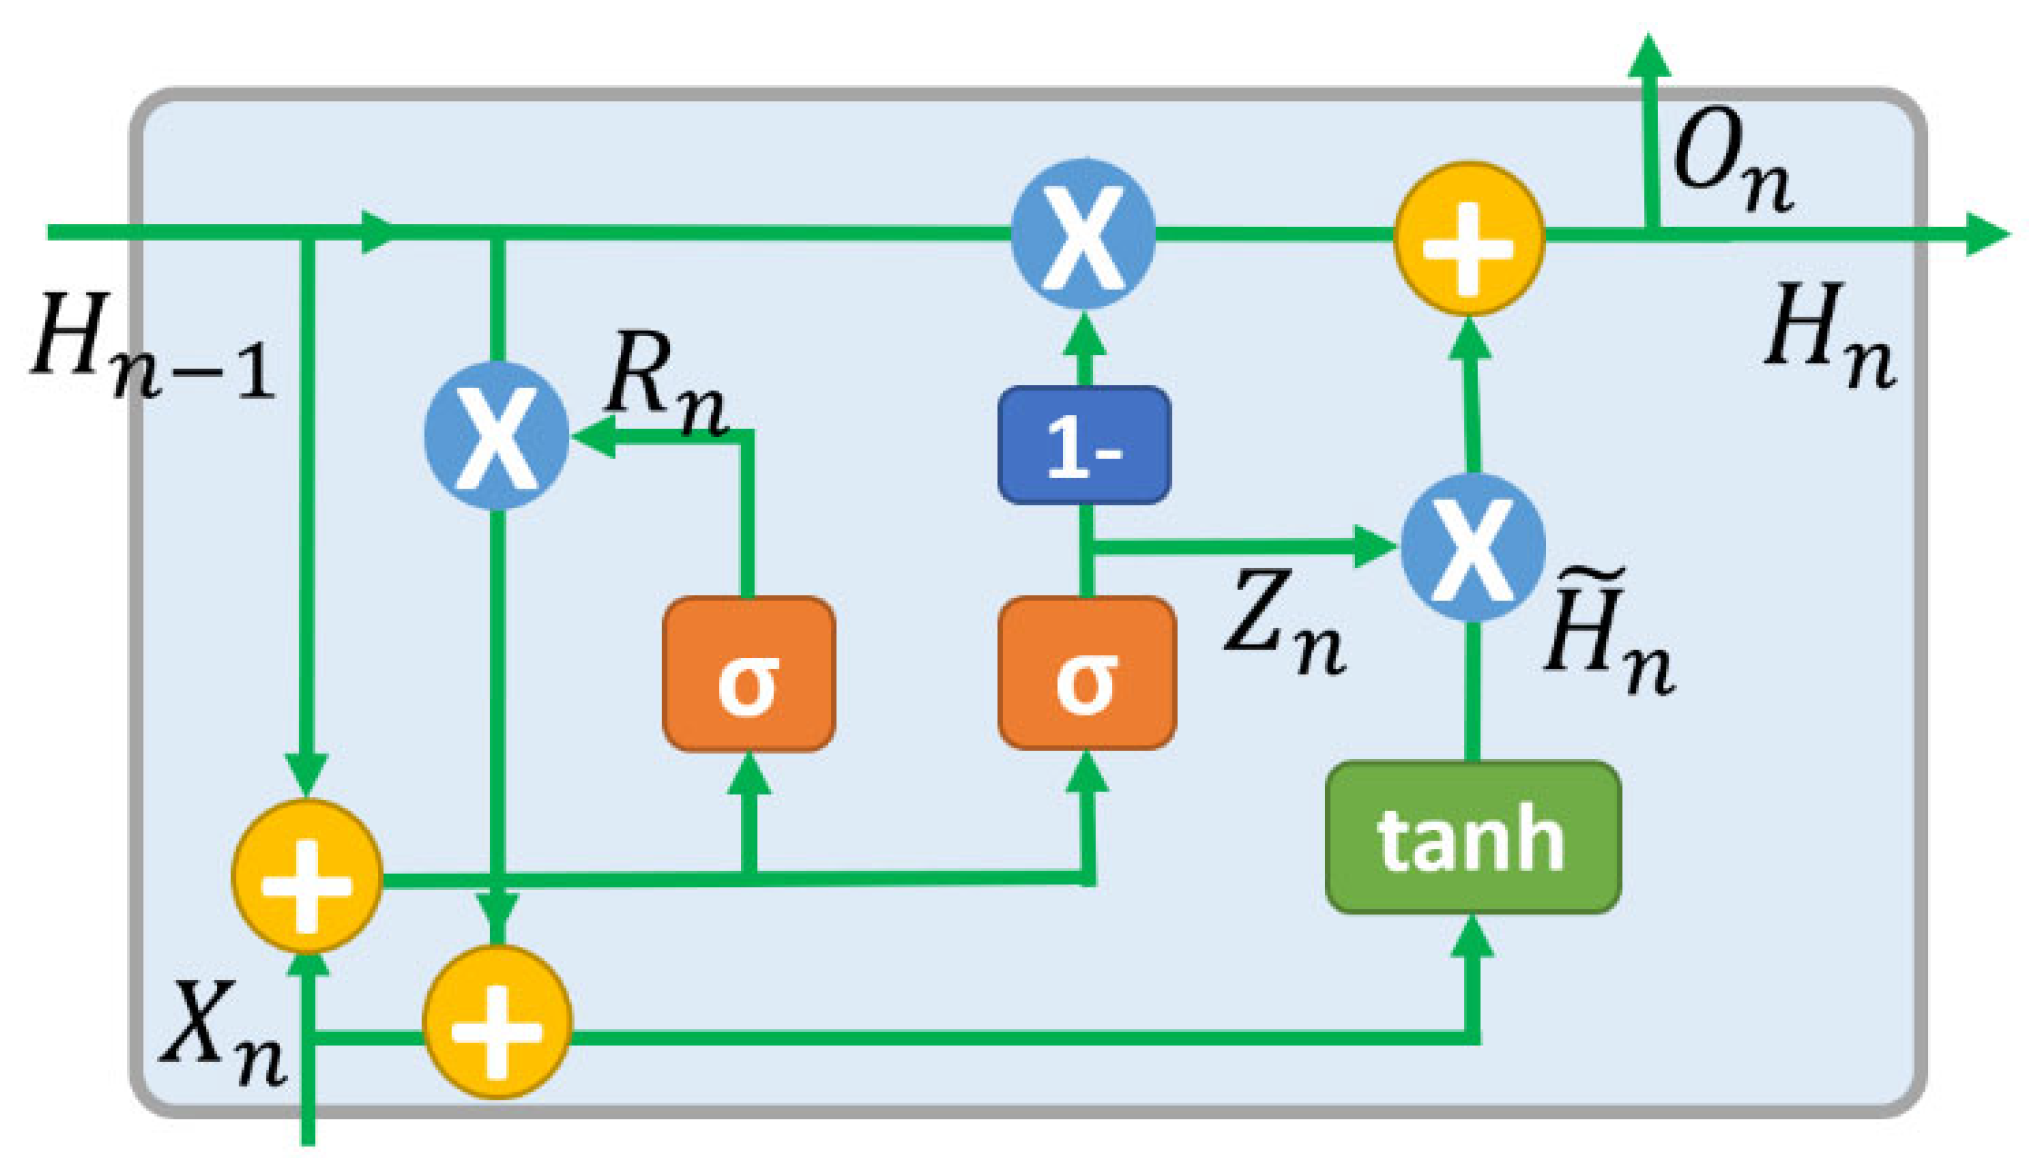
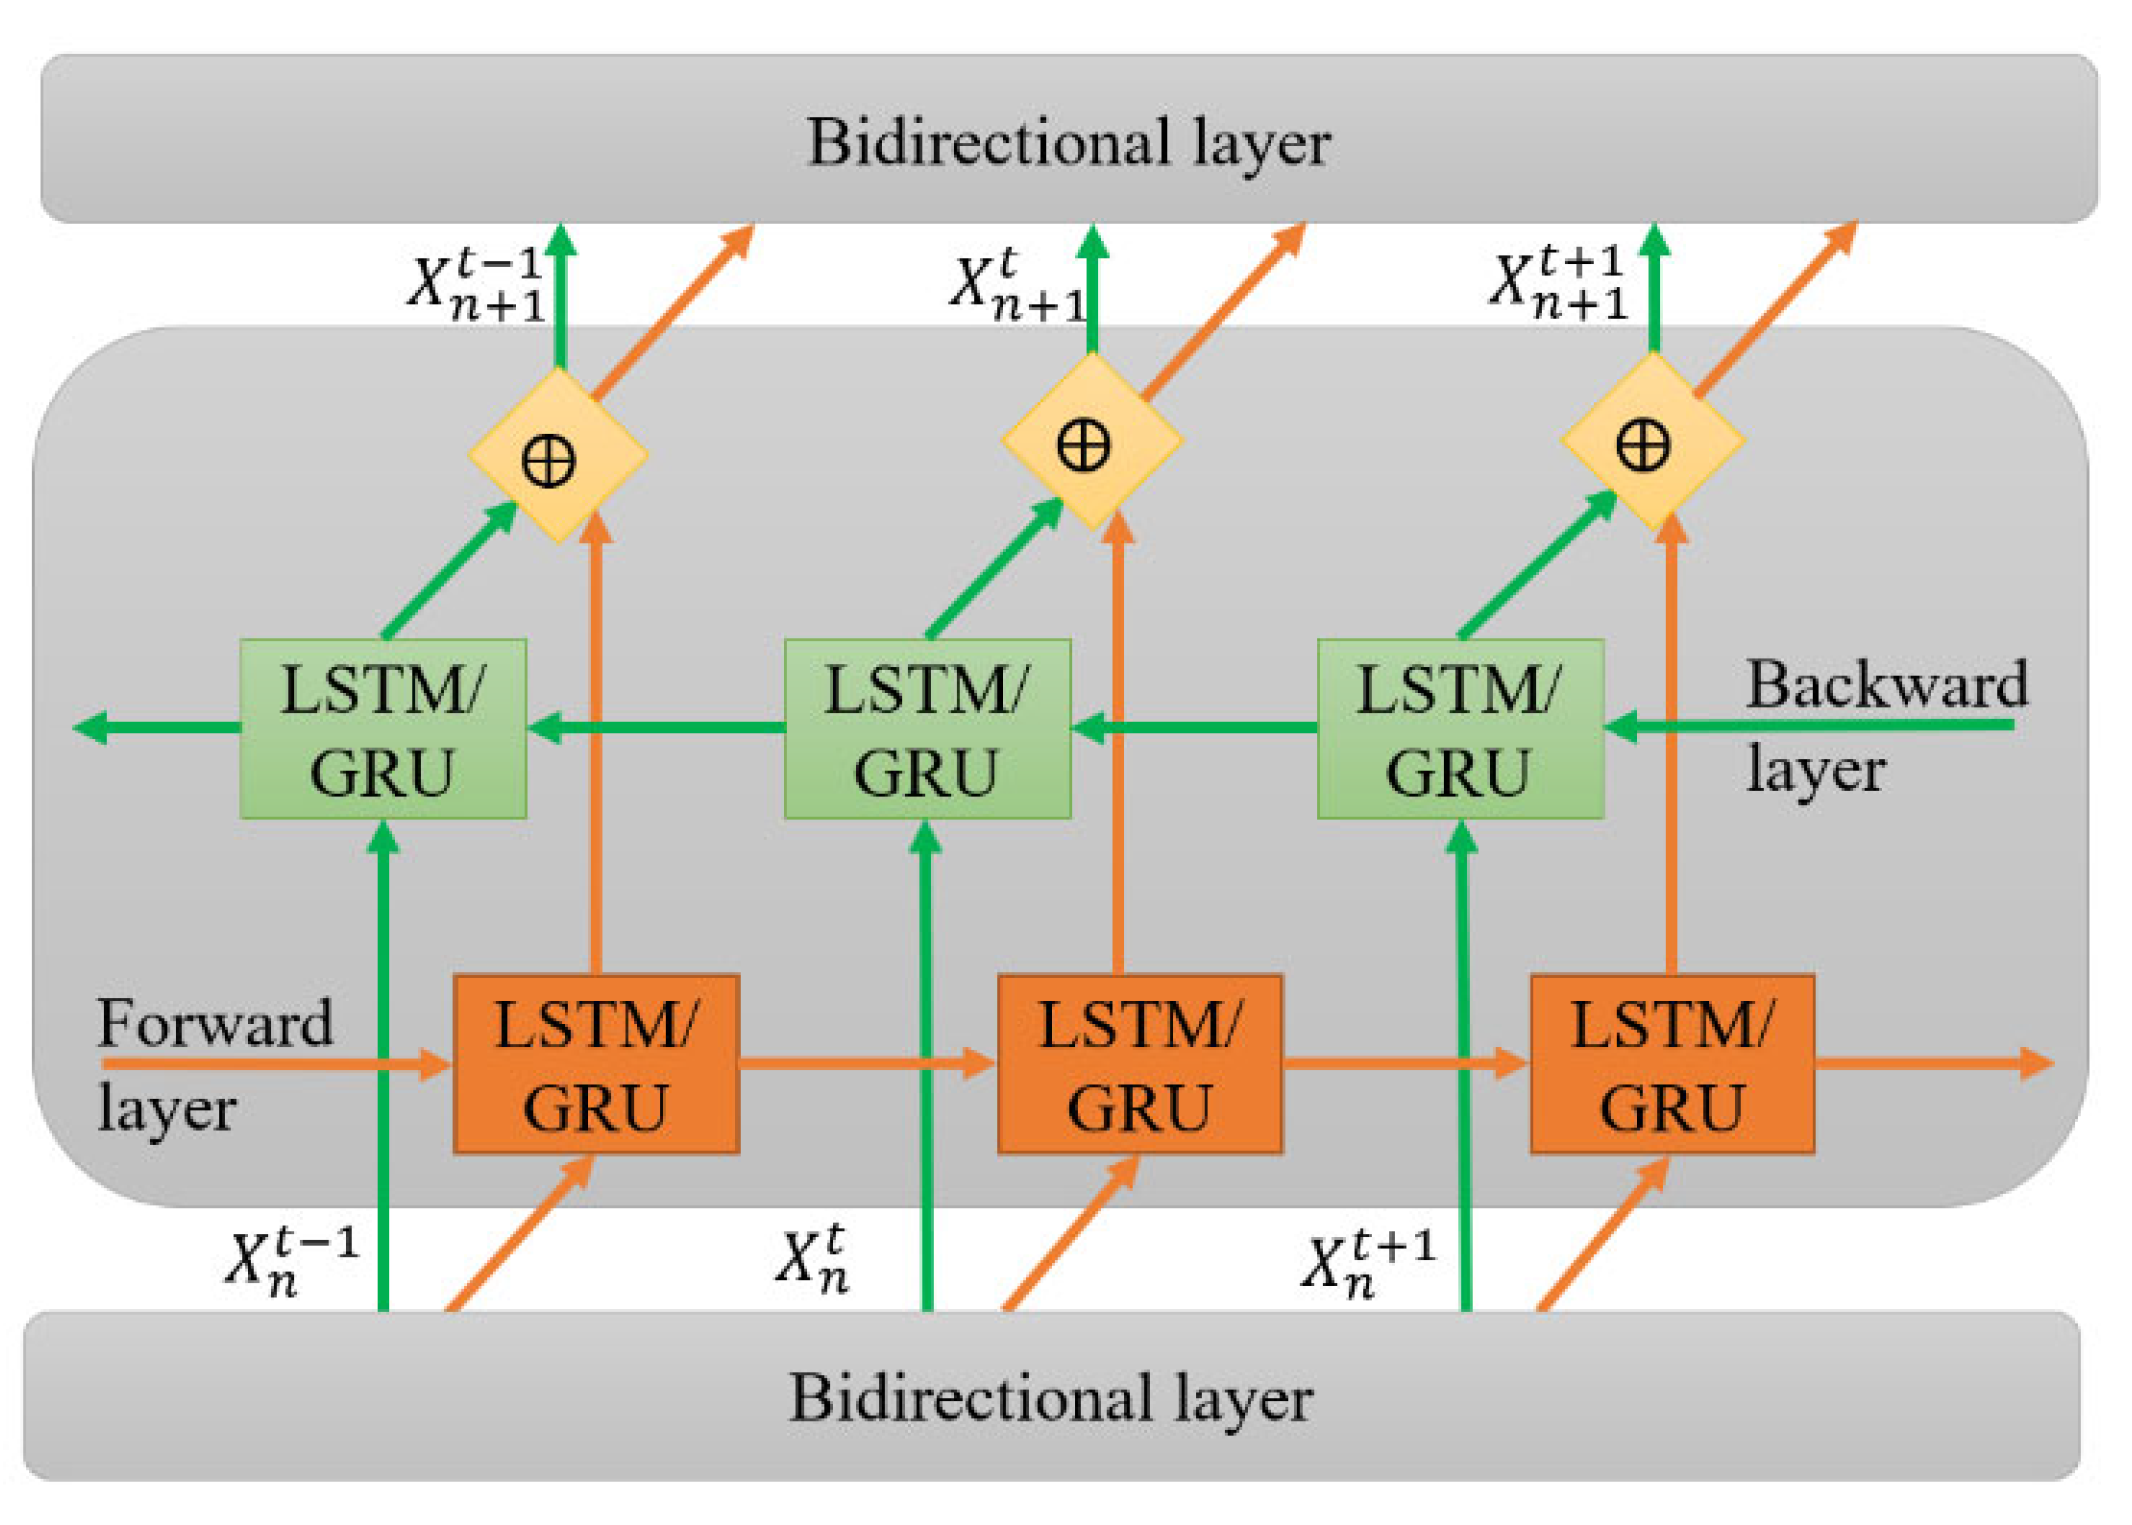
2.2. The Series Sequential Predicting Methodologies

The leakage current requires an accurate categorization which is a non-linear function with other natural environmental factors. This study provides a better solution for this challenge, which utilizes many sequential predicting algorithms. The LSTM is an appropriate solution that could solve the gradient vanishing exploding issues in the recurrent neural network (RNN) [44,45]. The LSTM is the sequential dependency methodology that effectively reaches a better performance. The LSTM is generally composed of input, output, and forget gates which effectively memorize the sequential historical information for a long time, as in Figure 5. The forget gate, F n , calculates the sequential input with a sigmoid activation function, which controls the output value between 0 and 1, as in Equation (7), where W FH , W FX , and b F are the weight matrixes and bias vectors. If the output value is nearly zero, the achieving data will be forgotten, and on the contrary, more data could be retained. This gate will forget unnecessary previous information and check the reserved information in the memory cell. The sequential data navigate to the input gate I n , which is computed by a sigmoid activation function, as in Equation (8), where W IH , W IX , b I , H n 1 , and X n are the weight matrixes, bias vector, the previous cell hidden state, and the input gate, respectively. The input gate takes responsibility for checking whether the information is worth reserving in the long memory. The candidate state, C ˜ n , is updated by a TANH operation which controls the output data in range −1 and 1, and the input vector, X n , as in Equation (9). The cell state, C n , is computed with the previous state, C n 1 , and the candidate state, as in Equation (10). Conclusively, the output gate, O n , and the cell hidden state, H n , are computed by the sigmoid and TANH activation function, as in Equations (11) and (12). The hidden layer cell state is computed based on the cell state and the output gate, which controls the long- and short-term dependency in the LSTM algorithm.
F n = σ W FH H n 1 + W FX X n + b F
I n = σ W IH . H n 1 + W IX X n + b I
C ˜ n = tan h W CH . H n 1 + W CX X n + b C
C n = F n C n 1 + I n C ˜ n
O n = σ W OH . H n 1 + W OX X n + b O
H n = O n tan h ( C n )
Another LSTM variant is the gated recurrent unit (GRU), which consists of a simplified configuration and fewer training weights. In many applications, the GRU demonstrated its ability to obtain similar prediction accuracy to LSTM while utilizing a few training epochs. The GRU and LSTM algorithms could hold more periods of historical serial information to enhance the feature augmentation and improve the multistep ahead categorization ability [46,47]. The GRU cell includes the reset gate, R n , and update gate, Z n , as illustrated in Figure 6. The update gate, Z n , controls the new update state of the hidden state, whereas the reset gate,   R n , is employed to ignore the information in the previous hidden state, as calculated in Equations (13) and (14), where W and b are the weight and bias matrixes and H n 1 and X n are the hidden state and input vector. The cell state, H ˜ n , and hidden state, H n , are combined into one hidden unit, representing the GRU algorithm’s stored memory, as computed in Equations (15) and (16).
Z n = σ W ZH . H n 1 + W ZX X n + b Z
R n = σ W RH . H n 1 + W RX X n + b R
H ˜ n = tan h W H R n H n 1 + X n + b C
H n = 1 Z n H n 1 + Z n H ˜ n
The LSTM and GRU are self-connected units that adapt to reduce error over time. These internal gates maintain the content in the memory cell, update necessary information, and forget unrelated contents. However, both LSTM and GRU only process the information in the forward direction, which could not reconstruct the memory in the backward direction. Therefore, the bidirectional models, which include the Bi-LSTM and Bi-GRU, are developed to procedure the sequential data in both directions, as in Figure 7. The bidirectional model consists of two dependent layers for inputting the forward and backward sequential information, which could better capture the long-term dependencies and facilitate more accurate predictions [48]. The forward and backward propagative processes are combined into one output by Equation (17), where W H , H n , W H , and H n are the weight and hidden state of forward and backward directions, respectively.
Out n = W H H n + W H H n + b Out

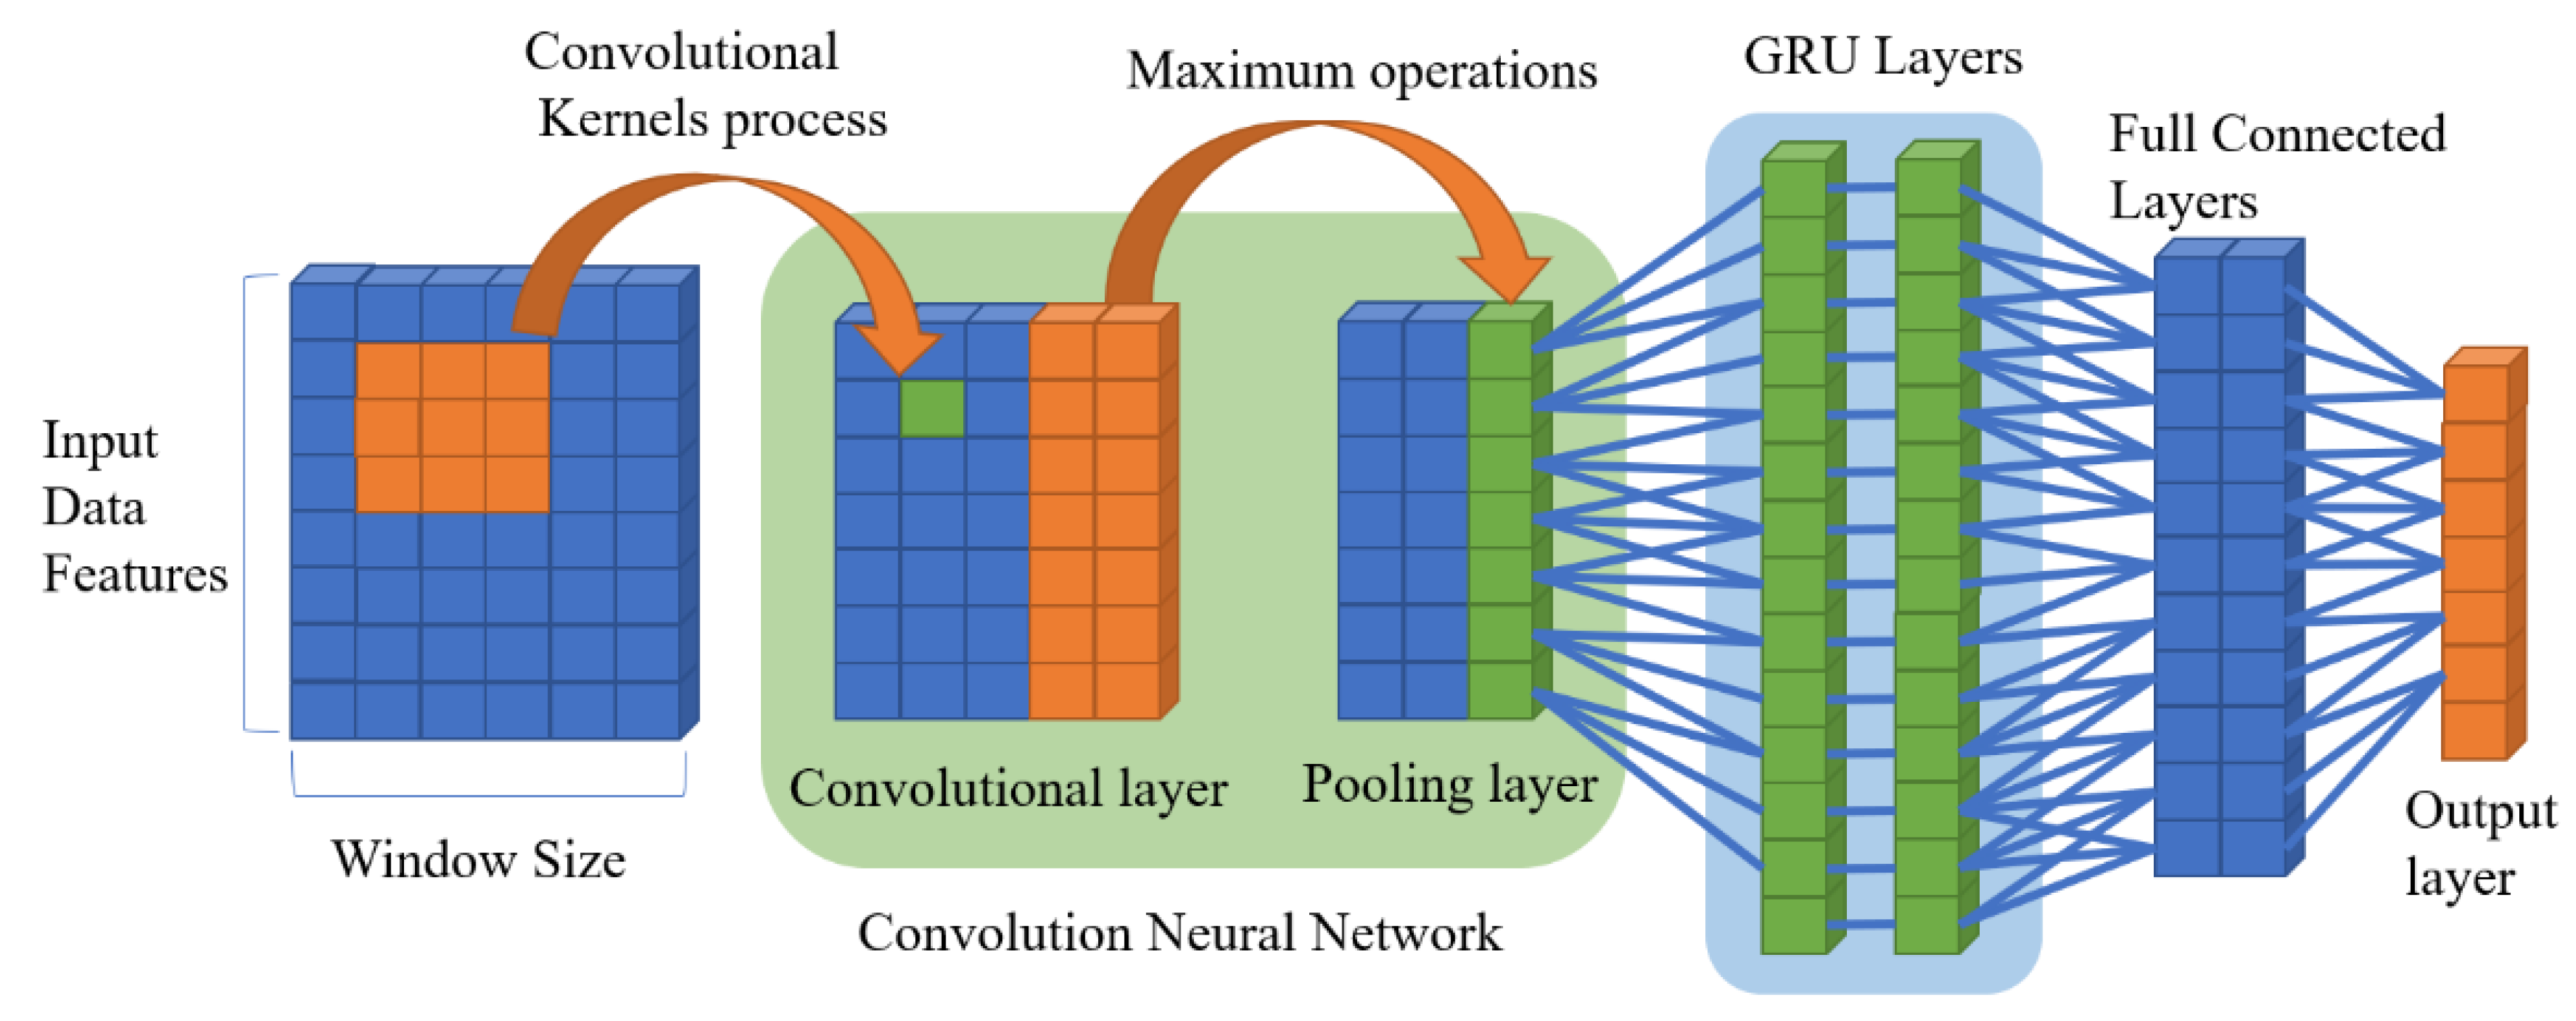
2.3. The Proposed Hybrid Convolution Neural Network and Gated Recurrent Unit

The convolution neural network (CNN) was inspired by the natural perception in the animal visual cortex, which was discovered by Fukushima in 1980 [49,50]. CNN is a well-known algorithm that has been successfully and effectively utilized in many applications. The CNN includes two main layers named convolutional and pooling layers which concentrate on learning feature representation of the information. The convolutional layers implement several kernel matrixes to calculate different feature maps and then deploy a nonlinear activation function to convolve the consequences. Equation (18) calculates the feature map value at the nth layer in the location i , j of the kth feature map, where f is the activation function and w and b are the weight term and bias vector. The activation function is the ReLU, which is generally desirable in stacked multilayer structures [51,52]. The pooling layer decreases the resolution of the feature map by employing shift invariance. The pooling layer is connected consequently to the convolution layers for extracting the dominant features by mathematical average and maximum operation [53]. By combining many CNN layers, the higher-level property representations are extracted for the subsequent layers. In this research, the max pooling layer is utilized in the CNN-GRU model for distinguishing the leakage current of 15 kV HDPE insulators.
out i , j , k n = f w k n   T x i , j n + b k l
The extracted dominant features from the CNN are transferred to the GRU layers, which perform high-level training operations. The last layers are fully connected layers with a SoftMax activation function for the classification task. The general architecture of CNN-GRU is illustrated in Figure 8. The proposed methodology is employed in distinguishing the leakage current level of the 15 kV HDPE insulator in the natural environmental experiment. The developed method first utilizes the CNN layers to decrease the dimension of the original matrix, which reduces the complexity while retaining most of the initial data. Then, the GRU is established to improve the predicting ability and accuracy during the optimizing process. The proposed CNN-GRU algorithm is analyzed and assessed with other deep learning methodologies, including LSTM, GRU, Bi-LSTM, and Bi-GRU models. The number of sequential historical data is defined as window size, and the level of leakage currents is the output of the proposed model. The hyperparameter optimization for the proposed methodology is presented in the next section.

3. Hyperparameter Optimization for CNN-GRU

Hyperparameter optimization (HPO) is implemented to enhance the performance of CNN-GRU with different configurations. This technique evaluates the CNN-GRU performance with different benchmark indexes and resource consumption. In this study, the grid search is developed to analyze the effect of variant setting configuration on the categorizing performance [41,54,55]. Table 1 describes the variant configuration of the proposed CNN-GRU. The number of window sizes alters from 24 to 36 to 48. In the CNN layers, the number of CNN layers adjusts from 1 to 2, and the number of kernel filters evolves from 16 to 32 to 64. In the GRU configuration, the number of GRU layers is modified from 2 to 3 to 4, and the number of GRU cells is 32, 64, and 128. Combined different configurations produce more than 162 CNN-GRU structures which are all simulated for analysis and evaluation. The summarized experiment results are illustrated in the radar maps in Figure 9 with different data collections from 1 to 4.
For better evaluating the advantages and disadvantages of different configurations on the CNN-GRU model, different benchmark indexes of CRE, MSE, CP, and MAE are described in the radar maps with training and validating operations. The coordinate values become greater from the center to the outside, which illustrates a lower performance for the CRE, MSE, and MAE indexes. In contrast, the CP value gradually increases from inside to outside, which presents a better achievement.
For the first data collection, the 48-window size, 2 hidden layers, 32 neural nodes, 1 CNN layer, and 16 CNN filters achieve more robust and better performance compared with other configurations, as clearly illustrated in the first row of Figure 9. The effect of selecting these configurations is superior to other parameters in predicting the leakage current levels of data collection 1. The increasing window size tends to decrease CRE, validating CRE, MSE, and the validating MSE benchmarks, and increases the CP and validating CP indexes. In the GRU structures, the increase in hidden layers prefers raising the instability in predicting benchmarks, which extends the CRE, MSE, MAE, and validating MAE. Moreover, the addition of neural nodes gravitates the variability of predicting performance, which enlarges the MSE, validating MSE, MAE, validating MAE, and validating CRE benchmarks. For optimizing the CNN layers, the additional layers will extend all the error benchmarks and decrease the CP index, which illustrates the unreliability in categorizing the leakage currents. Furthermore, the growth of CNN filters gravitates toward the growth of validating MAE, validating SE, CRE, CP, and validating CRE benchmarks.
The varying performances of CNN-GRU in the second data collection are clearly described in the second row of Figure 9. The optimized window size, hidden layers, CNN layers, and CNN filters are identical to data collection 1. However, the 64 neural nodes achieved superior performance compared with the 32 and 128 configurations. The 128 neural nodes enlarge the MAE, validating MAE, MSE, and the validating MSE benchmarks, while the 32 neural nodes increase the CRE and validate CRE indexes. Therefore, the 48-window size, 2 hidden layers, 64 neural nodes, 1 CNN layer, and 16 CNN filter are the most optimized specification which obtains the highest achievement in distinguishing the leakage current of data collection 2.
For the third data collection, the decrease in window size prefers enhancing the predicting performance of the CNN-GRU model, which decreases the MAE, validating MAE, MSE, validating MSE, and validating CRE benchmarks. Therefore, the 24-window size obtains higher accuracy than other configurations in classifying the leakage current. In the GRU architecture, the 64 neural nodes obtain the lowest CRE, validating CRE, MAE, validating MAE, MSE, and validating MSE criteria compared with 32 and 128 neural nodes. For optimizing the CNN construction, the 32 filters achieve the highest accuracy with a better error benchmark and higher CP index compared with the 16 and 64 filters, as depicted in the third row of Figure 9. Therefore, the 24-window size, 2 hidden layers, 64 neural nodes, 1 CNN layer, and 32 CNN filters are considered optimized parameters for the CNN-GRU model in data collection 3.
In final data collection, 4, the 36-window size acquires the lower CRE, validating CRE, MAE, validating MAE, MSE, and validating MSE standards and secures higher CP and validating CP criteria, as represented in the fourth row of Figure 9. In the GRU structure, the 128 neural nodes obtain the most stable benchmarks compared with 32 and 64 neural nodes in validating CRE, MAE, validating MAE, MSE, and validating MSE. Consequently, the 36-window size, 2 hidden layers, 128 neural nodes, 1 CNN layer, and 16 CNN filters are selected as optimized structures in classifying the leakage current of data collection 4.
Hyperparameter optimization is utilized for evaluating the efficacity of varying setting parameters on the accuracy of CNN-GRU in classifying the leakage current with different data collection groups. The optimized specification of CNN-GRU for each data collection is obtained to achieve the highest performance. In the next section, the comparison between CNN-GRU and other deep learning methodologies is illustrated and analyzed.

4. Evaluating Performance between Algorithms

This section presents the comparative consequence between the CNN-GRU and another methodology, as illustrated in Figure 10. For the first data collection, the proposed CNN-GRU is demonstrated to obtain better precision with minor expansion in the MAE, validating MAE, MSE, and validating MSE. In the bar chart, the CNN-GRU acquires more maximum improvements compared with other methodologies, which attain 50.84% higher CRE, 8.58% higher CP, 5.88% higher validating CP, 30.42% higher MAE, and 71.59% higher validating MSE benchmarks than the GRU algorithm; 0.19% higher validating CRE and 63.59% higher validating MAE benchmarks than the LSTM methodology; and 65.96% higher MSE criterion than the Bi-GRU technique. Therefore, in data collection 1, the proposed CNN-GRU achieves better prediction performance compared with other algorithms.
In the second collection, the CNN-GRU proves the efficiency in categorizing the leakage current. In the radar figure, the CNN-GRU obtains a narrow expansion in the CRE, validating CRE, MAE, validating MAE, and validating MSE. The bar chart describes that the CNN-GRU accomplishes the most significant enhancements in comparison to other methodologies, which produces better improvement of 79.48% CRE and 83.54% validating CRE benchmarks than the Bi-GRU approach; 9.44% higher CP, 7.94% higher validating CP, and 55.56% higher validating MSE indexes than the LSTM algorithm; and 63.59% higher validating MAE, 47.82% higher validating MAE, and 17.69% higher MSE than the Bi-LSTM method. The combination between the CNN layers and the GRU method could retain the original information, which increases the accurate performance in categorizing the leakage current.
In the third data accumulation, the CNN-GRU produces a narrower expansion than other methodologies in the validating CRE, MAE, and MSE benchmarks and superior spread in the CP and validating CP indexes. Moreover, the developed algorithm obtains the most critical enhancements compared with other methods, which achieve 55.89% higher CRE, 51.88% higher validating CRE, 14.14% higher CP, and 20.89% higher validating CP benchmarks compared with the LSTM method; 66.24% higher MAE, 58.40% higher validating MAE, and 70.29% higher validating MSE compared with the Bi-GRU algorithm; and a more remarkable 73.24% MSE index compared with the GRU approach. Therefore, in the third accumulative data, the CNN-GRU outperforms the accurate indexes and performing benchmarks compared with GRU, LSTM, Bi-GRU, and Bi-LSTM algorithms.
In the last data accumulation, the developed CNN-GRU accomplishes the highest performance in the CRE, CP, validating CP, validating MAE, MSE, and validating MSE benchmarks with smaller spread areas. Furthermore, the CNN-GRU performs larger spreads in the CP and the validating CP indexes. In comparison to the Bi-LSTM method, the CNN-GRU accomplishes better improvements which are 47.56% CRE, 3.77% CP, 0.94 validating CP, and 48.70% MAE benchmarks. The developed algorithm also acquires a 56.97% improvement in validating CRE compared with the LSTM method and a 54.09% enhancement in validating MAE compared with the GRU algorithm. In the MSE and validating MSE metrics, the CNN-GRU outperforms other algorithms with significant improvements of 37.73% and 34.96%. Therefore, the effect of utilizing the hybrid CNN layers and GRU algorithms for the insulator’s leakage current prediction is more accomplished than the other four methods.
Compared across different accumulated data, the proposed CNN-GRU algorithm defeats the GRU method in different error benchmarks, which acquires the most extreme enhancements of 50.84% CRE, 50.16% validating CRE, 8.58% CP, 5.88% validating CP, 62.69% MAE, 49.90% validating MAE, 73.24% MSE, and 71.59% validating MSE benchmarks. The additional CNN layers prove greater efficacity and higher precision in distinguishing the leakage current, which maintains the original information while decreasing the dimension of the input matrixes.
Compared through predicting technologies, the developed methodology surpasses the LSTM approach, which obtains significant improvements of 58.55% CRE, 56.97% validating CRE, 14.14% CP, 20.89% validating CP, 64.04% MAE, 63.59% validating MAE, 65.21% MSE, and 71.33% validating MSE metrics. Compared with the Bi-GRU algorithm, the CNN-GRU surpasses with supreme improvements of 79.48% CRE, 83.54% validating CRE, 2.8% CP, 6.33% validating CP, 66.24% MAE, 58.40% validating MAE, 71.18% MSE, and 70.29% validating MSE benchmarks. The additional CNN layers outperform the bidirectional features when combined with the GRU algorithm, which achieves higher accuracy and greater performance. In comparison with the Bi-LSTM approach, the CNN-GRU overwhelms all the evaluating metrics, which achieve maximum augmentations of 68.30% CRE, 47.13% validating CRE, 4.83% CP, 7.17% validating CP, 63.59% MAE, 48.63% validating MAE, 54.39% MSE, and 56.96% validating MSE metrics. Therefore, the proposed hybrid CNN and GRU outperform the original GRU and the Bi-GRU algorithms in distinguishing the insulator’s leakage current.
In general, the developed CNN-GRU acquired the most remarkable improvements of 79.48% CRE, 83.54% validating CRE, 14.14% CP, 20.89% validating CP, 66.24% MAE, 63.59% validating MAE, 73.24% MSE, and 71.59% validating MSE benchmarks, which greatly enhances the predicting ability and modeling precision in distinguishing the insulator’s leakage current. Therefore, the hybrid CNN-GRU provides the proper guideline for leakage current level in practical engineering applications. Figure 11 illustrates the CRE metric in the testing data with different predicting methods. For most data collections, the developed hybrid algorithm provides the most optimum CRE benchmark, which demonstrates the higher performance and greater performance in distinguishing the leakage current of 15 kV insulators. The limitation of this research is the application of the specific 15 kV insulators. The proposed algorithm needs more evaluation in different kinds of high-voltage insulators for more comprehensive reviews.

5. Conclusions

The categorizing leakage current for 15 kV insulators is critical for the safety and stability operation of the power system. An accurate prediction of leakage current is significant for contributing to appropriate maintenance schedules to prevent the flashover phenomenon in advance. This project develops the hybrid CNN and GRU methodology to categorize the leakage current levels through several group data collections. The simulation results validate the efficiency and precision of the proposed methods with other benchmark methodologies. This study evaluates the correlation between several weather parameters and the leakage current levels to maintain the most critical information as the input vector for the deep learning algorithms. The hyperparameters are employed with different evaluation indexes for constructing the higher forecasting accuracy and stability of the CNN-GRU algorithms. The optimized structures of the proposed CNN-GRU algorithm in different data collections are identified in this research for future reference. The simulation outcomes emphasize the influential combined CNN and GRU with the most remarkable improvements of 79.48% CRE, 83.54% validating CRE, 14.14% CP, 20.89% validating CP, 66.24% MAE, 63.59% validating MAE, 73.24% MSE, and 71.59% validating MSE benchmarks, compared with traditional GRU, LSTM, Bi-GRU, and Bi-LSTM methodologies. The additional CNN layers outperform the original GRU and the Bi-GRU algorithms in distinguishing the insulator’s leakage current, which achieve the maximum improvements of 79.48%, 83.54%, 8.58%, 5.88%, 66.24%, 58.40%, 73.24%, and 71.59% for CRE, CP, MAE, and MSE in the training and validating operations, respectively. The developed hybrid CNN-GRU technology provides comprehensive information about the contamination degrees of insulator surfaces derived from the property of leakage currents. Therefore, this study completely fills the research gap by deploying the hybrid CNN and GRU algorithms in classifying the leakage current of 15 kV HDPE insulators.

Author Contributions

Methodology, W.-B.L.; Software, P.N.T.; Validation, Writing—review and editing, T.N.D.; Visualization, M.-Y.C. All authors have read and agreed to the published version of the manuscript.

Funding

This research received no external funding.

Institutional Review Board Statement

Not applicable.

Informed Consent Statement

Not applicable.

Data Availability Statement

Data available on request due to restrictions.

Conflicts of Interest

The authors declare no conflict of interest.

References

  1. Ramirez, I.; Hernandez, R.; Montoya, G. Measurement of Leakage Current for Monitoring the Performance of Outdoor Insulators in Polluted Environments. IEEE Electr. Insul. Mag. 2012, 28, 29–34. [Google Scholar] [CrossRef]
  2. Amarh, F.; Karady, G.G.; Sundararajan, R. Linear Stochastic Analysis of Polluted Insulator Leakage Current. IEEE Trans. Power Deliv. 2002, 17, 1063–1069. [Google Scholar] [CrossRef]
  3. Salem, A.A.; Abd-Rahman, R.; Al-Gailani, S.A.; Salam, Z.; Kamarudin, M.S.; Zainuddin, H.; Yousof, M.F.M. Risk Assessment of Polluted Glass Insulator Using Leakage Current Index under Different Operating Conditions. IEEE Access 2020, 8, 175827–175839. [Google Scholar] [CrossRef]
  4. Salem, A.A.; Abd-Rahman, R.; Al-Gailani, S.A.; Kamarudin, M.S.; Ahmad, H.; Salam, Z. The Leakage Current Components as a Diagnostic Tool to Estimate Contamination Level on High Voltage Insulators. IEEE Access 2020, 8, 92514–92528. [Google Scholar] [CrossRef]
  5. Du, B.X.; Liu, Y.; Liu, H.J.; Yang, Y.J. Recurrent Plot Analysis of Leakage Current for Monitoring Outdoor Insulator Performance. IEEE Trans. Dielectr. Electr. Insul. 2009, 16, 139–146. [Google Scholar] [CrossRef]
  6. Fierro-Chavez, J.L.; Ramirez-Vazquez, Z.; Montoya-Tena, G. On-Line Leakage Current Monitoring of 400 KV Insulator Strings in Polluted Areas. IEE Proc.-Gener. Transm. Distrib. 1996, 143, 560–564. [Google Scholar] [CrossRef]
  7. Amin, M.; Amin, S.; Ali, M. Monitoring of Leakage Current for Composite Insulators and Electrical Devices. Rev. Adv. Mater. Sci. 2009, 21, 75–89. [Google Scholar]
  8. Fontana, E.; Oliveira, S.C.; Cavalcanti, F.J.M.M.; Lima, R.B.; Martins-Filho, J.F.; Meneses-Pacheco, E. Novel Sensor System for Leakage Current Detection on Insulator Strings of Overhead Transmission Lines. IEEE Trans. Power Deliv. 2006, 21, 2064–2070. [Google Scholar] [CrossRef]
  9. Suda, T. Frequency Characteristics of Leakage Current Waveforms of an Artificially Polluted Suspension Insulator. IEEE Trans. Dielectr. Electr. Insul. 2001, 8, 705–709. [Google Scholar] [CrossRef]
  10. Chandrasekar, S.; Kalaivanan, C.; Cavallini, A.; Montanari, G.C. Investigations on Leakage Current and Phase Angle Characteristics of Porcelain and Polymeric Insulator under Contaminated Conditions. IEEE Trans. Dielectr. Electr. Insul. 2009, 16, 574–583. [Google Scholar] [CrossRef]
  11. Douar, M.A.; Mekhaldi, A.; Bouzidi, M.C. Flashover Process and Frequency Analysis of the Leakage Current on Insulator Model under Non-Uniform Pollution Conditions. IEEE Trans. Dielectr. Electr. Insul. 2010, 17, 1284–1297. [Google Scholar] [CrossRef]
  12. Montoya, G.; Ramirez, I.; Montoya, J.I. Correlation among ESDD, NSDD and Leakage Current in Distribution Insulators. IEE Proc. Gener. Transm. Distrib. 2004, 151, 334–340. [Google Scholar] [CrossRef]
  13. Ahmadi-Joneidi, I.; Shayegani-Akmal, A.A.; Mohseni, H. Leakage Current Analysis of Polymeric Insulators under Uniform and Non-uniform Pollution Conditions. IET Gener. Transm. Distrib. 2017, 11, 2947–2957. [Google Scholar] [CrossRef]
  14. Li, J.Y.; Sun, C.X.; Sebo, S.A. Humidity and Contamination Severity Impact on the Leakage Currents of Porcelain Insulators. IET Gener. Transm. Distrib. 2011, 5, 19–28. [Google Scholar] [CrossRef]
  15. Li, J.; Sima, W.; Sun, C.; Sebo, S.A. Use of Leakage Currents of Insulators to Determine the Stage Characteristics of the Flashover Process and Contamination Level Prediction. IEEE Trans. Dielectr. Electr. Insul. 2010, 17, 490–501. [Google Scholar] [CrossRef]
  16. Zhao, L.; Jiang, J.; Duan, S.; Fang, C.; Wang, J.; Wang, K.; Cao, P.; Zhou, J. The Prediction of Post Insulators Leakage Current from Environmental Data. In Proceedings of the 2011 International Conference on Electrical and Control Engineering, Yichang, China, 16–18 September 2011; pp. 5103–5106. [Google Scholar]
  17. Jahromi, A.N.; El-Hag, A.H.; Jayaram, S.H.; Cherney, E.A.; Sanaye-Pasand, M.; Mohseni, H. A Neural Network Based Method for Leakage Current Prediction of Polymeric Insulators. IEEE Trans. Power Deliv. 2006, 21, 506–507. [Google Scholar] [CrossRef]
  18. El-Hag, A.H.; Jahromi, A.N.; Sanaye-Pasand, M. Prediction of Leakage Current of Non-Ceramic Insulators in Early Aging Period. Electr. Power Syst. Res. 2008, 78, 1686–1692. [Google Scholar] [CrossRef]
  19. Medeiros, A.; Sartori, A.; Stefenon, S.F.; Meyer, L.H.; Nied, A. Comparison of Artificial Intelligence Techniques to Failure Prediction in Contaminated Insulators Based on Leakage Current. J. Intell. Fuzzy Syst. 2021, 42, 3285–3298. [Google Scholar] [CrossRef]
  20. Thanh, P.N.; Cho, M.-Y.; Da, T.N. Insulator Leakage Current Prediction Using Surface Spark Discharge Data and Particle Swarm Optimization Based Neural Network. Electr. Power Syst. Res. 2021, 191, 106888. [Google Scholar] [CrossRef]
  21. de Santos, H.; Sanz-Bobi, M.Á. A Cumulative Pollution Index for the Estimation of the Leakage Current on Insulator Strings. IEEE Trans. Power Deliv. 2020, 35, 2438–2446. [Google Scholar] [CrossRef]
  22. Jahromi, A.N.; El-Hag, A.H.; Cherney, E.A.; Jayaram, S.H.; Sanaye-Pasand, M.; Mohseni, H. Prediction of Leakage Current of Composite Insulators in Salt Fog Test Using Neural Network. In Proceedings of the CEIDP’05 2005 Annual Report Conference on Electrical Insulation and Dielectric Phenomena, Nashville, TN, USA, 16–19 October 2005; pp. 309–312. [Google Scholar]
  23. Pinotti, M.A.; Meyer, L.H. Mathematical Model for Prediction of the Leakage Current on Distribution Insulators of 25 KV Class. In Proceedings of the 2017 IEEE Electrical Insulation Conference (EIC), Baltimore, MD, USA, 11–14 June 2017; pp. 256–260. [Google Scholar]
  24. Kordkheili, H.H.; Abravesh, H.; Tabasi, M.; Dakhem, M.; Abravesh, M.M. Determining the Probability of Flashover Occurrence in Composite Insulators by Using Leakage Current Harmonic Components. IEEE Trans. Dielectr. Electr. Insul. 2010, 17, 502–512. [Google Scholar] [CrossRef]
  25. Sidthik, A.S.; Kalaivani, L.; Iruthayarajan, M.W. Evaluation and Prediction of Contamination Level in Coastal Region Insulators Based on Leakage Current Characteristics. In Proceedings of the 2013 International Conference on Circuits, Power and Computing Technologies (ICCPCT), Nagercoil, India, 20–21 March 2013; pp. 132–137. [Google Scholar]
  26. Salem, A.A.; Lau, K.Y.; Abdul-Malek, Z.; Mohammed, N.; Al-Shaalan, A.M.; Al-Shamma’a, A.A.; Farh, H.M.H. Polymeric Insulator Conditions Estimation by Using Leakage Current Characteristics Based on Simulation and Experimental Investigation. Polymers 2022, 14, 737. [Google Scholar] [CrossRef] [PubMed]
  27. Volat, C.; Meghnefi, F.; Farzaneh, M.; Ezzaidi, H. Monitoring Leakage Current of Ice-Covered Station Post Insulators Using Artificial Neural Networks. IEEE Trans. Dielectr. Electr. Insul. 2010, 17, 443–450. [Google Scholar] [CrossRef]
  28. Ghiasi, Z.; Faghihi, F.; Shayegani-Akmal, A.A. Artificial Neural Network Approach for Prediction of Leakage Current of Polymeric Insulator under Non-Uniform Fan-Shaped Contamination. Electr. Power Syst. Res. 2022, 209, 107920. [Google Scholar] [CrossRef]
  29. Ali, H. Leakage Current Prediction for High Voltage Insulators Flashover Based on Extreme Value Theory. In Proceedings of the 2016 IEEE International Symposium on Computer, Consumer and Control, IS3C 2016, Xi’an, China, 4–6 July 2016; pp. 870–873. [Google Scholar]
  30. Li, J.; Sun, C.; Sima, W.; Yang, Q.; Hu, J. Contamination Level Prediction of Insulators Based on the Characteristics of Leakage Current. IEEE Trans. Power Deliv. 2010, 25, 417–424. [Google Scholar] [CrossRef]
  31. Vosloo, W.L.; Holtzhausen, J.P. The Prediction of Insulator Leakage Currents from Environmental Data. In Proceedings of the IEEE AFRICON. 6th Africon Conference in Africa, George, South Africa, 2–4 October 2002; Volume 2, pp. 603–608. [Google Scholar]
  32. Al Khafaf, N.; El-Hag, A. Bayesian Regularization of Neural Network to Predict Leakage Current in a Salt Fog Environment. IEEE Trans. Dielectr. Electr. Insul. 2018, 25, 686–693. [Google Scholar] [CrossRef]
  33. Wang, J.; Xi, Y.; Fang, C.; Cai, L.; Wang, J.; Fan, Y. Leakage Current Response Mechanism of Insulator String with Ambient Humidity on Days Without Rain. IEEE Access 2019, 7, 55229–55236. [Google Scholar] [CrossRef]
  34. Deb, S.; Choudhury, N.R.; Ghosh, R.; Chatterjee, B.; Dalai, S. Short Time Modified Hilbert Transform-Aided Sparse Representation for Sensing of Overhead Line Insulator Contamination. IEEE Sens. J. 2018, 18, 8125–8132. [Google Scholar] [CrossRef]
  35. Abouzeid, A.K.; El-Hag, A.; Assaleh, K. Equivalent Salt Deposit Density Prediction of Silicone Rubber Insulators under Simulated Pollution Conditions. Electr. Power Compon. Syst. 2018, 46, 1123–1133. [Google Scholar] [CrossRef]
  36. Sun, J.; Zhang, H.; Li, Q.; Liu, H.; Lu, X.; Hou, K. Contamination Degree Prediction of Insulator Surface Based on Exploratory Factor Analysis-least Square Support Vector Machine Combined Model. High Volt. 2021, 6, 264–277. [Google Scholar] [CrossRef]
  37. Yeh, C.-T.; Thanh, P.N.; Cho, M.-Y. Real-Time Leakage Current Classification of 15 kV and 25 kV Distribution Insulators Based on Bidirectional Long Short-Term Memory Networks with Deep Learning Machine. IEEE Access 2022, 10, 7128–7140. [Google Scholar] [CrossRef]
  38. Nguyen, T.-P.; Yeh, C.-T.; Cho, M.-Y.; Chang, C.-L.; Chen, M.-J. Convolutional Neural Network Bidirectional Long Short-Term Memory to Online Classify the Distribution Insulator Leakage Currents. Electr. Power Syst. Res. 2022, 208, 107923. [Google Scholar] [CrossRef]
  39. Benesty, J.; Chen, J.; Huang, Y.; Cohen, I. Pearson Correlation Coefficient. In Noise Reduction in Speech Processing; Springer: Berlin/Heidelberg, Germany, 2009; pp. 1–4. [Google Scholar]
  40. Adler, J.; Parmryd, I. Quantifying Colocalization by Correlation: The Pearson Correlation Coefficient Is Superior to the Mander’s Overlap Coefficient. Cytom. Part A 2010, 77, 733–742. [Google Scholar] [CrossRef]
  41. Feurer, M.; Hutter, F. Hyperparameter Optimization. In Automated Machine Learning; Springer: Cham, Switzerland, 2019; pp. 3–33. [Google Scholar]
  42. Refaeilzadeh, P.; Tang, L.; Liu, H. Cross-Validation. Encycl. Database Syst. 2009, 5, 532–538. [Google Scholar]
  43. Rodriguez, J.D.; Perez, A.; Lozano, J.A. Sensitivity Analysis of K-Fold Cross Validation in Prediction Error Estimation. IEEE Trans. Pattern Anal. Mach. Intell. 2009, 32, 569–575. [Google Scholar] [CrossRef]
  44. Hochreiter, S.; Schmidhuber, J. Long Short-Term Memory. Neural Comput. 1997, 9, 1735–1780. [Google Scholar] [CrossRef]
  45. Graves, A. Long Short-Term Memory. In Supervised Sequence Labelling with Recurrent Neural Networks; Springer: Berlin/Heidelberg, Germany, 2012; pp. 37–45. [Google Scholar]
  46. Chung, J.; Gulcehre, C.; Cho, K.; Bengio, Y. Empirical Evaluation of Gated Recurrent Neural Networks on Sequence Modeling. arXiv 2014, arXiv:1412.3555. [Google Scholar]
  47. Dey, R.; Salem, F.M. Gate-Variants of Gated Recurrent Unit (GRU) Neural Networks. In Proceedings of the 2017 IEEE 60th International Midwest Symposium on Circuits and Systems (MWSCAS), Medford, MA, USA, 6–9 August 2017; pp. 1597–1600. [Google Scholar]
  48. Graves, A.; Schmidhuber, J. Framewise Phoneme Classification with Bidirectional LSTM and Other Neural Network Architectures. Neural Netw. 2005, 18, 602–610. [Google Scholar] [CrossRef]
  49. Fukushima, K.; Miyake, S. Neocognitron: A Self-Organizing Neural Network Model for a Mechanism of Visual Pattern Recognition. In Competition and Cooperation in Neural Nets; Springer: Berlin/Heidelberg, Germany, 1982; pp. 267–285. [Google Scholar]
  50. LeCun, Y.; Boser, B.; Denker, J.; Henderson, D.; Howard, R.; Hubbard, W.; Jackel, L. Handwritten Digit Recognition with a Back-Propagation Network. Adv. Neural Inf. Process. Syst. 1989, 2, 396–404. [Google Scholar]
  51. Nair, V.; Hinton, G.E. Rectified Linear Units Improve Restricted Boltzmann Machines. In Proceedings of the 27th International Conference on Machine Learning (ICML-10), Haifa, Israel, 21–24 June 2010. [Google Scholar]
  52. Boureau, Y.-L.; Ponce, J.; LeCun, Y. A Theoretical Analysis of Feature Pooling in Visual Recognition. In Proceedings of the 27th International Conference on Machine Learning (ICML-10), Haifa, Israel, 21–24 June 2010; pp. 111–118. [Google Scholar]
  53. Wang, T.; Wu, D.J.; Coates, A.; Ng, A.Y. End-to-End Text Recognition with Convolutional Neural Networks. In Proceedings of the 21st International Conference on Pattern Recognition (ICPR2012), Tsukuba, Japan, 11–15 November 2012; pp. 3304–3308. [Google Scholar]
  54. Bergstra, J.; Bardenet, R.; Bengio, Y.; Kégl, B. Algorithms for Hyper-Parameter Optimization. Adv. Neural Inf. Process. Syst. 2011, 24, 2546–2554. [Google Scholar]
  55. Bergstra, J.; Bengio, Y. Random Search for Hyper-Parameter Optimization. J. Mach. Learn. Res. 2012, 13, 281–305. [Google Scholar]
Figure 1. The algorithm flow for implementing the predicting methodology.
Energies 16 02500 g001
Figure 2. Collecting the leakage current surges of 15 kV HDPE insulator in the natural environment.
Energies 16 02500 g002
Figure 3. Transforming the leakage current surges to one-hot vector.
Energies 16 02500 g003
Figure 4. The correlation between different leakage current and various natural environmental features.
Energies 16 02500 g004
Figure 5. The diagrammatic representation of the LSTM structure.
Energies 16 02500 g005
Figure 6. The basic configuration of GRU cell.
Energies 16 02500 g006
Figure 7. The structure of the Bi-GRU/Bi-LSTM model.
Energies 16 02500 g007
Figure 8. The hierarchically structured of CNN-GRU model.
Energies 16 02500 g008
Figure 9. The effectiveness of varying window size, number of hidden layers and neural nodes, and number of CNN layers and filters on the CNN-GRU performance in different data collection: (a) the first row is for data collection 1; (b) the second row is for data collection 2; (c) the third row is for data collection 3; (d) the fourth row is for data collection 4.
Energies 16 02500 g009
Figure 10. The comparative charts between the proposed algorithm and others: radar map and bar charts for (a) data collection 1; (b) data collection 2; (c) data collection 3; and (d) data collection 4.
Energies 16 02500 g010
Figure 11. The comparative CRE index between predicting algorithms in testing data: (a) for 1 h in advance; (b) for 2 h in advance; (c) for 3 h in advance.
Energies 16 02500 g011
Table 1. Different configurations of HPO for CNN-GRU.
Hyperparameter ConfigurationsValue Ranges
Window size24, 36, 48
CNN layers1, 2
CNN filters16, 32, 64
CNN kernel size3
GRU layers2, 3, 4
GRU neural nodes32, 64, 128
Fully connected layers2
Fully connected neural nodes64
Learning rate0.001
Train/validation ratio90/10
Training epochs50
Disclaimer/Publisher’s Note: The statements, opinions and data contained in all publications are solely those of the individual author(s) and contributor(s) and not of MDPI and/or the editor(s). MDPI and/or the editor(s) disclaim responsibility for any injury to people or property resulting from any ideas, methods, instructions or products referred to in the content.

