1. Introduction
Synchronous Generators (SG) have been used in variable-speed wind turbines connected to four-quadrant inverters operating as Voltage-Source Converters (VSCs) [
1]. VSCs with two levels are employed in most applications, but n-Level Neutral Point Clamped (nLNPC) and Modular Multilevel Converters (MMC) also have been used [
2,
3,
4]. The Wound Rotor Synchronous Generator (WRSG) and Permanent Magnet Synchronous Generator (PMSG) are the most used in the industry, especially as the number of poles increases [
1]. Most are three-phase; however, it is also common to find machines with more phases [
5,
6].
These generators are submitted to harsh conditions and are susceptible to present mechanical or electrical faults. Most mechanical faults involve the gearbox and bearings [
7,
8], as most electrical faults occur in the stator winding [
7,
9]. Insulation failure, which causes short-circuits between turns, is the most cited cause [
7]. These are called turn faults and, depending on the stator winding distribution, can involve turns of the same phase or different phases and are divided into the fault types reported in the literature: interturn, interbranch and phase-to-phase, which may involve the ground or not [
10]. If not detected early, these faults may damage the whole winding.
Predictive maintenance and diagnostic techniques are used to monitor the condition of the winding and to detect stator fault tendency [
7,
11,
12]. However, for these techniques, there is no evaluation of the time for fault detection and online operation [
7,
13]. A comprehensive review of these techniques for permanent magnet synchronous machines is presented in [
14]; however, there is a lack of papers addressing it for WRSG. Protection techniques are adopted aiming to minimize the damage caused by the faults, by detecting and isolating them in short periods of time.
Fault cases in which high line current values or differential currents are verified can be detected by overcurrent and differential protection functions adapted for variable-speed applications [
15]. However, there are fault cases with low current levels and no differential current, which require other alternatives [
7,
13,
16].
In order to detect this type of fault, current differences between branches for multi-winding machines, stray flux and vibrations can be used but they require installation and calibration of additional sensors [
7,
11,
17]. Current and voltage signature analysis is an alternative to avoid using additional sensors, as it can be performed using the signals measured for controlling purposes of the machine and converter [
7,
12,
13,
18,
19]. This approach does not require hardware changes and makes it possible to embed the fault detection technique together with the converter control algorithm.
The current signature approach uses time-frequency domain analysis tools, such as Fourier Transform (FT), Wavelet Transform (WT) and Multiple Reference Frames Theory (MRFT) to identify spectral changes in stator and rotor signals that are related to the stator fault occurrence [
19,
20,
21,
22,
23,
24,
25,
26]. Artificial Neural Networks (ANN) and Kalman Filter have also been studied for stator fault detection [
27,
28]. Model- and observer-based techniques can also be used instead of signature analysis for the fault detection of electric machines [
29].
Line currents (
), field currents (
) and
transformation currents (
) of the WRSG have been used to detect stator faults [
13,
20,
30]. Harmonic content analysis is the most reported in the literature [
7] but some use, instead of spectral analysis, zero and negative sequence monitoring to detect machine imbalance caused by turn faults [
16,
24,
25,
31]. Electrical faults cause asymmetry in the SG stator winding, consequently unbalancing fundamental harmonics of the line currents, leading to zero- and negative-sequence components [
25].
The third harmonic in
, second harmonic in
and second harmonic in
are related to stator faults [
13,
21,
22,
32]. These characteristic harmonics can be used to detect stator faults. The variable-speed operation needs to be considered during the isolation of the harmonic content of each current.
These spectral changes and the respective detection techniques have been reported for fixed-speed generators and variable-speed motors. However, there is a lack of publications evaluating them in variable-speed generator systems. Moreover, these have not been compared for similar fault cases and there are no publications evaluating them or the effects of internal faults in generators connected to multi-level converters.
For a WRSG connected to a 3LNPC VSC, for example, besides
,
and
, the DC neutral point current (
) of the converter is also available, as it can be used for DC voltage (
) balance monitoring and control [
33]. This current is directly related to
and the difference between
and
. Under normal conditions (
and
symmetrical),
is only composed by a frequency equal to the third harmonic of
. If
,
presents a mean value; if
is unbalanced,
has a component with a frequency equal to the fundamental harmonic of
[
33]. Although there are many studies concerning 3LNPC operation under unbalanced AC currents, none have evaluated the effects of a faulty machine in
.
Contributions and Text Organization
Therefore, in this paper, changes in the spectrum of currents typically measured for control purposes of the variable-speed WRSG connected to a 3LNPC converter are used to detect faults between stator winding turns. The third harmonic in , imbalance in , second harmonic in and fundamental harmonic in are compared under the same fault conditions. Dynamic bandpass filters based on transformation and Fourier series, with a frequency set by encoder measurements, are used to isolate the desired harmonic content. The geometric loci of the isolated current components are employed to detect between healthy and faulty conditions.
Simulation and experimental data are used for the evaluation. The mathematical equations of the generator under stator faults, 3LNPC converter and control loops used in the simulation are presented, as well as the experimental setup used to test the technique. In order to evaluate the applicability of the proposed indicator to different generator ratings, a 4.5 MW WRSG machine is simulated for internal faults.
One of the innovations of this paper is the evaluation of the neutral point current of the 3LNPC as a fault indicator, along with generator line and field currents. Another contribution of this paper is the evaluation of these components as a potential protection function; for this purpose, sensitivity, fault detection time and selectivity are analyzed. Moreover, in this paper, a transient analysis is included in the simulation and experimental tests to evaluate the dynamic response of the components considered here. This approach is not common in fault diagnosis papers, which usually analyze data from healthy and faulty steady states to detect incipient faults. Currents typically measured for control in a WRSG-3LNPC setup are considered here to avoid the need to install additional sensors; so, the same evaluation presented here may be reproduced in real machines with simple software implementation.
It should be emphasized that the main objective of this paper is to detect stator fault occurrence fast in order to avoid further damage in the scenario of a severe short-circuit between stator winding turns—it is not to indicate the tendency or the probability of fault occurrence. Fault location and classification are not within the scope of this paper. Moreover, the aim is not to present a definite protection device for faults between stator winding turns of synchronous generators nor to present a comparative evaluation of existing protection devices.
This work is divided as follows:
Section 2 presents the mathematical model analysis of the variable-speed WRSG with stator winding faults connected to the 3LNPC;
Section 3 presents the simulation of three stator fault cases in order to determine the harmonic components related to them;
Section 4 describes the setup used for experimental validation and presents the data analysis of three stator fault cases of the same type as the faults presented in
Section 3;
Section 5 introduces the proposed fault detection technique;
Section 6 addresses the setting of the proposed method and its preliminary evaluation using experimental data of the generator with and without turn faults;
Section 7 evaluates the sensitivity of the proposed method for different fault types using experimental data;
Section 8 presents the time for detecting different fault cases;
Section 9 presents the selectivity analysis using simulation data;
Section 10 discusses the effects of sensor loss and measurement noises;
Section 11 presents the evaluation of the proposed technique for a simulated 4.5 MW WRSG; finally, in
Section 12, the conclusion is drawn.
2. Model Representation of Stator Turn Faults in Variable-Speed Synchronous Generators
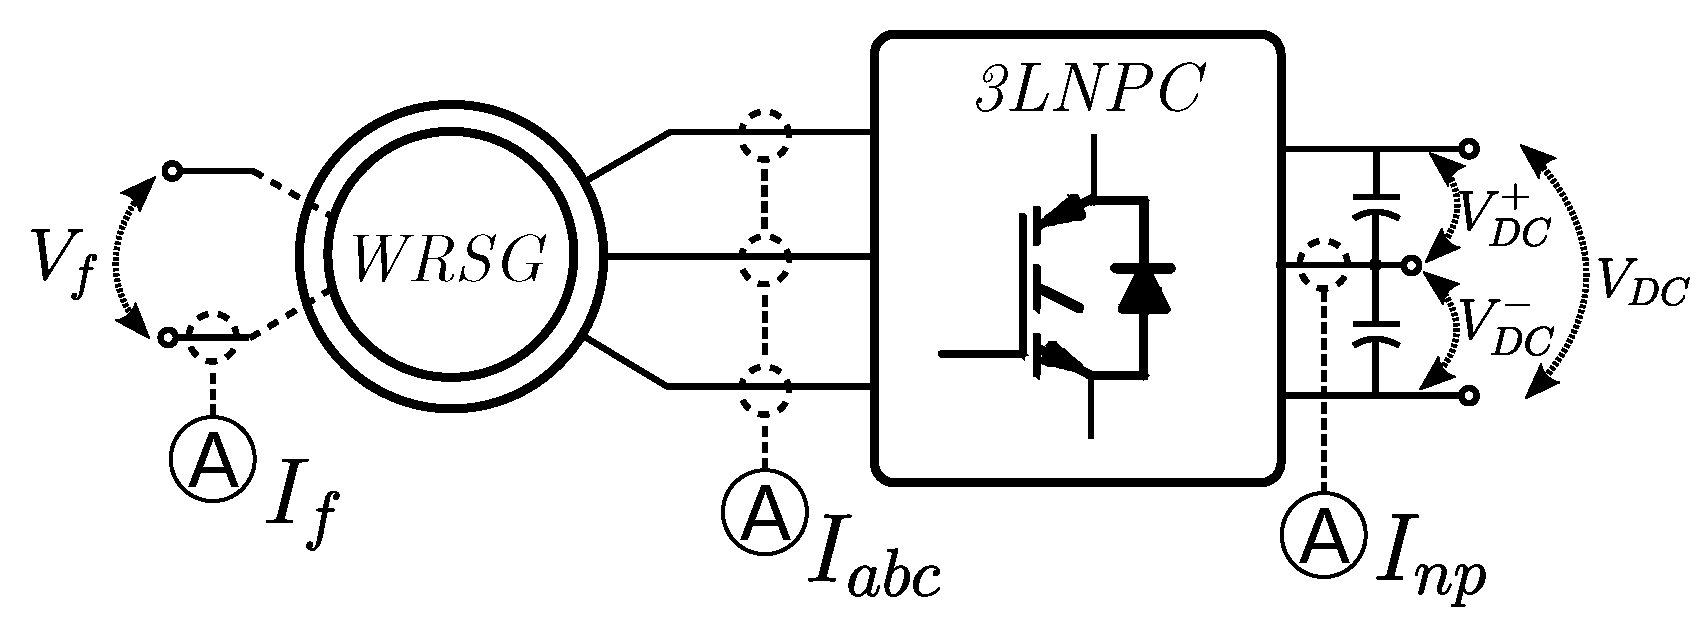
The configuration of the variable-speed SG and 3LNPC illustrated in
Figure 1 is used as a reference for the model description and to present the measurements considered in this paper.
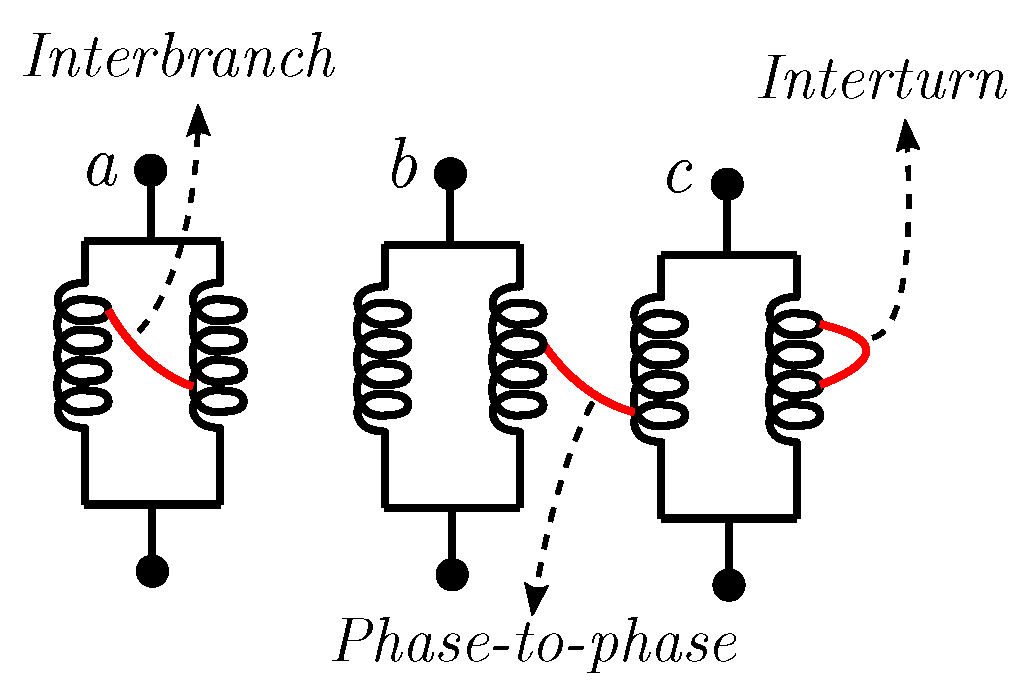
Faults involving stator winding turns of an SG with multiple branches per phase can be classified as follows: interturn (IT) if turns of the same branch are involved; interbranch (IB) for turns of different branches and same phase; phase-to-phase (PTP) for faults between different phases [
10].
Figure 2 illustrates these types of faults in a generator with two parallel branches per phase. Generators that have one winding per phase do not have IB faults. Most of these faults occur inside the slots; therefore, faults involving turns of three phases are unlikely to happen [
21].
2.1. Faulty WRSG Equations
The mathematical model of a faulty WRSG is given by (
1)–(
6). For these equations, a fault between turns of phase
a is considered. The phase
a winding is divided into parts with subscripts “
” and “
” [
34,
35,
36]. Damper-winding-related terms were omitted to simplify the model description and reduce the order of the vectors and matrices presented below.
Equation (
1) is the voltage equation used to model the machine, where
v is the vector with voltage values,
i the current vector and
the flux. These vectors are given by (
2)–(
4). Note that
because a short-circuit is considered.
Resistance (
R) and inductance (
L) matrices are described by (
5) and (
6). Inductance calculation of faulty machines are performed through a Winding Function Approach (WFA) [
21].
From Equations (
4) and (
6), the coupling between the faulty and functional parts of the involved phase is noted. The faulty part is also coupled with other phases and field winding.
Numerical simulation of the WRSG is performed using voltage as input to solve Equation (
1). The average or switched output voltages of the NPC converter are assumed because it is used to control the WRSG. In this paper, the switched voltages, described in the following section, are considered. The NPC voltage values depend on the control algorithm output and Pulse-Width Modulation (PWM) stage.
2.2. 3LNPC Equations
The output voltages of a 3LNPC VSC are given in (
7) [
33], where
is the AC voltage (
);
and
, as illustrated in
Figure 1;
and
are the switching functions, determined by the PWM stage;
and
if
,
and
if
;
is the modulating signal, defined as (
8).
For a sinusoidal PWM, the modulating signal of each phase is determined by (
8), where
is the
balance control;
is given by performing the inverse
transformation to the current control outputs (
12) and (
13). Both are defined in the next section. The measured
is typically used, and it is considered that the grid-side control is able to regulate the
.
The currents
,
and
are defined as (
9) [
33]. These currents are expressed in terms of the 3LNPC AC currents (which are the WRSG line currents) and switching functions (
). Therefore, it is expected that imbalance and spectral changes in the AC currents will directly affect the DC currents.
2.3. Control Equations
The current control of the WRSG is usually performed in the
reference frame [
37]. The healthy WRSG stator equation in the
reference frame is given by (
10), where
and
are the stator currents in
frame;
is the stator resistance; the stator inductances in
reference are
and
; the magnetization inductance in the
d axis is
;
is the electrical angular speed;
and
are the stator voltages in
frame; and
is the field current.
The rotor equation is given by (
11). The field resistance is
, the inductance is
and
is the field voltage.
The
voltages required for
and
currents control are given, respectively, by (
12) and (
13). PI controllers with transfer function
are typically used to minimize the error between reference and measured currents.
The voltage required for field current control is given by (
14).
The relationship between
and the electromagnetic torque is given in (
15), where
J is the moment of inertia and
the number of pole pairs. If
is kept constant and
is zero, then the electromagnetic torque is proportional to the
value.
is the mechanical torque.
Therefore, the reference for the
required for the speed control (
) is given by (
16).
3LNPC requires
and
balance control, performed by adding
to the modulating signals of the phases (
) [
33]. This control is presented in (
17), where
is the mean value of the
voltage imbalance,
the gain of the proportional controller and
if
or
if
.
The controller design and tuning method description are not within the scope of this paper.
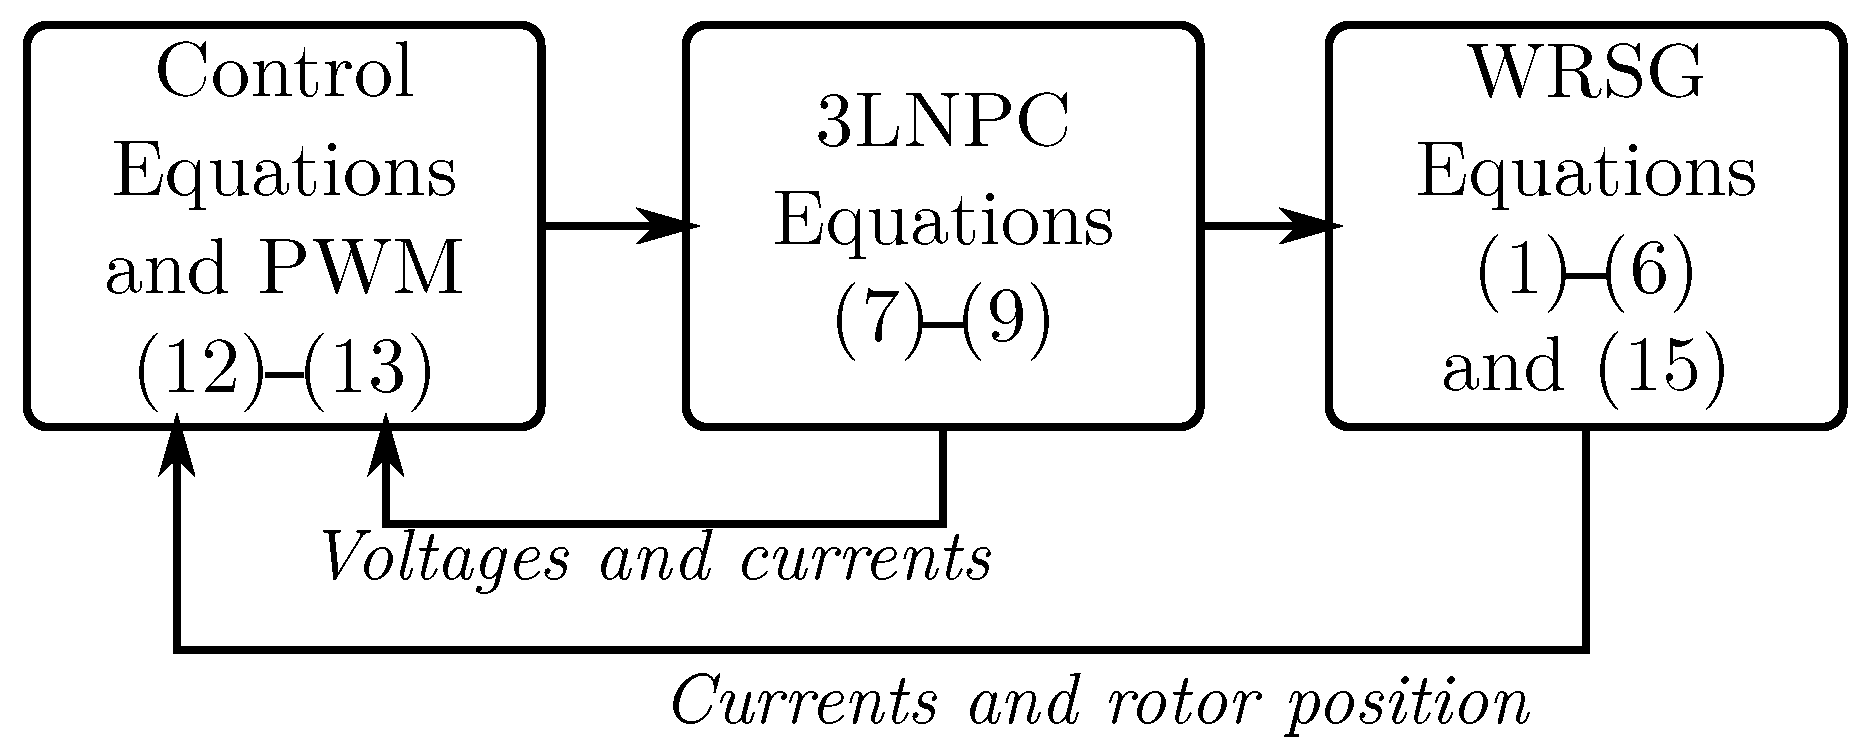
2.4. WRSG, 3LNPC and Control Integration
Equations (
1)–(
17) are used together to simulate the WRSG controlled by the 3LNPC during turn faults in the stator winding.
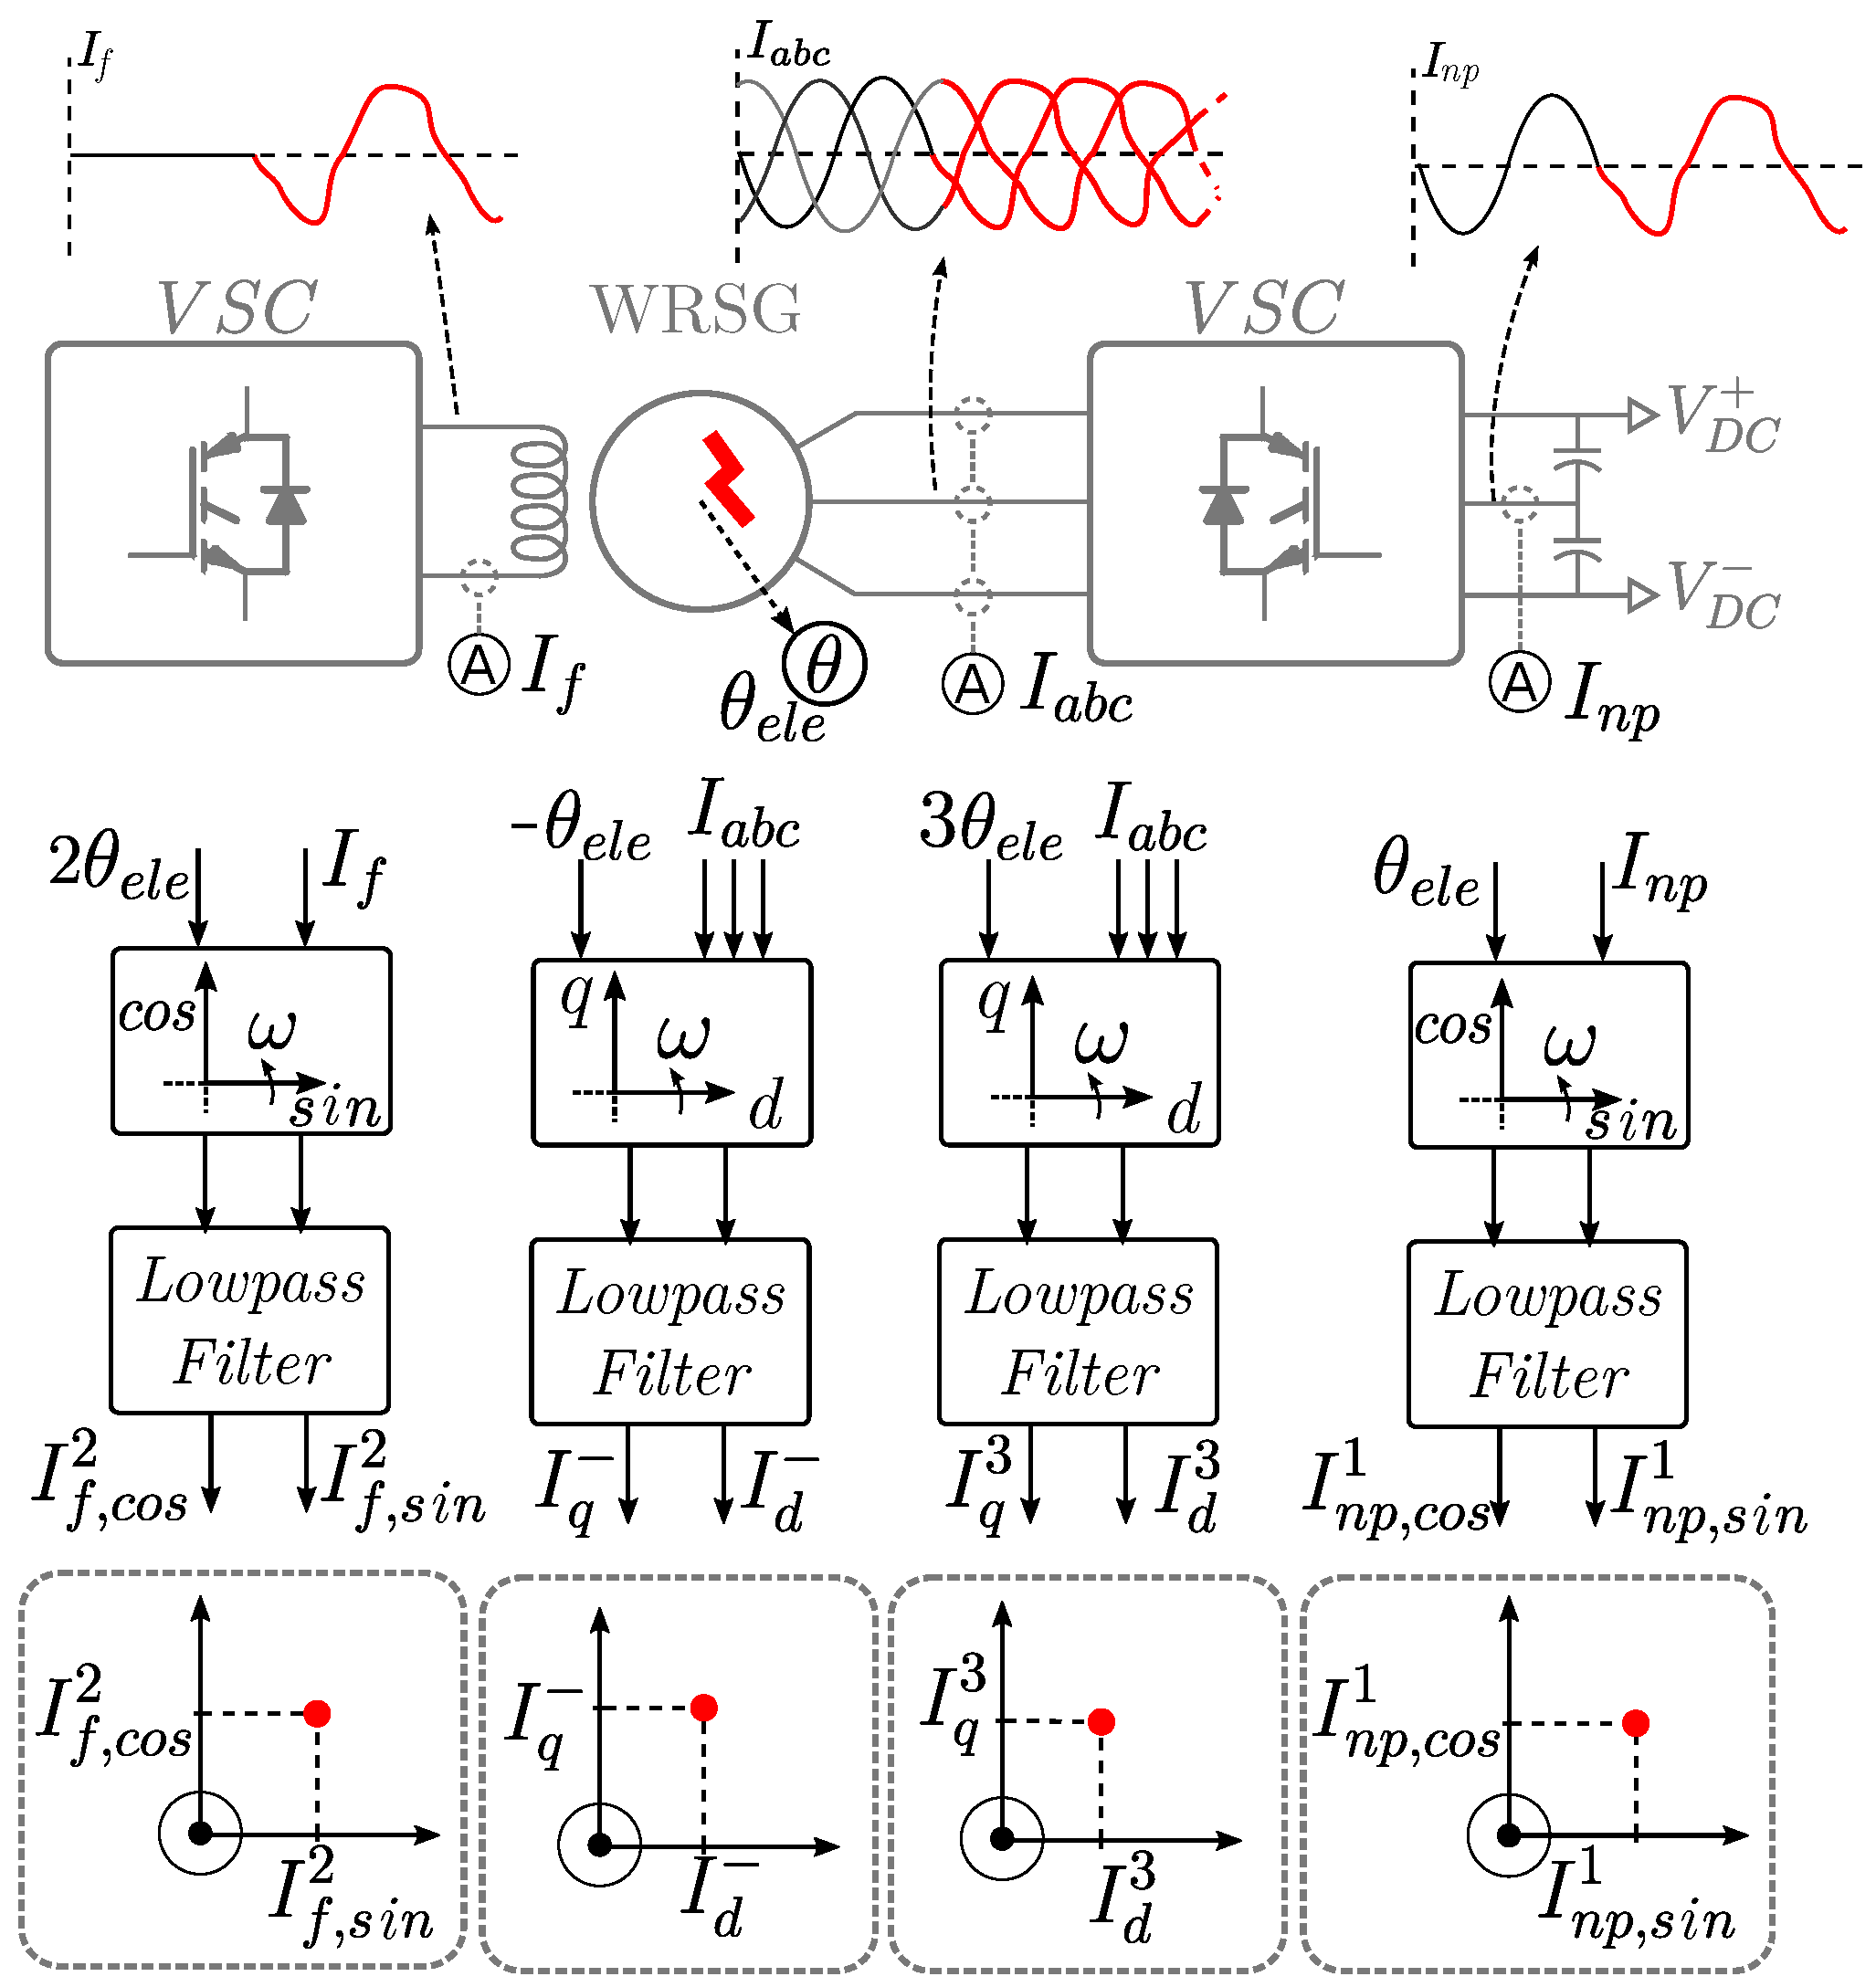
Figure 3 illustrates the interconnection of the faulty WRSG, the 3LNPC and control equations.
2.5. Simulation of the Transient Conditions
During the simulation, the elements of the inductance matrix are determined via lookup tables, which can be used to store inductance values of healthy and faulty conditions. This approach makes it possible to change from healthy to faulty conditions during simulation.
Considering the fault described in
Section 2.1, the values of the inductance related to the remaining operating portion (
) are determined according to (
18), where
is the variable that defines healthy (
) and faulty (
) conditions. The values
and
are determined through WFA using the respective winding functions.
The values of inductance related to the faulty portion (
) are determined according to (
19), where the constant
is used to cancel the fault-related terms of the inductance matrix. This constant must be small enough to cancel these elements, which will result in very small currents;
k must be greater than zero in order to avoid numerical instability during the simulation. The values of
are determined though WFA using the respective winding functions.
The resistance matrix also has to be changed. The value of resistance of the remaining operating portion (
) is determined according to (
20).
The resistance of the faulty portion (
) is determined according to (
21), where
. Fault resistance may be added to
.
3. Simulation Analysis
The equations of the WRSG, 3LNPC and control loops presented in the last section were used to conduct the simulation and analysis of the effects of the faults between stator winding turns. These equations were solved numerically using Matlab and Simulink software (version 2021b).
The simulated WRSG is the same machine presented in
Section 4; its electrical and constructive parameters are presented in
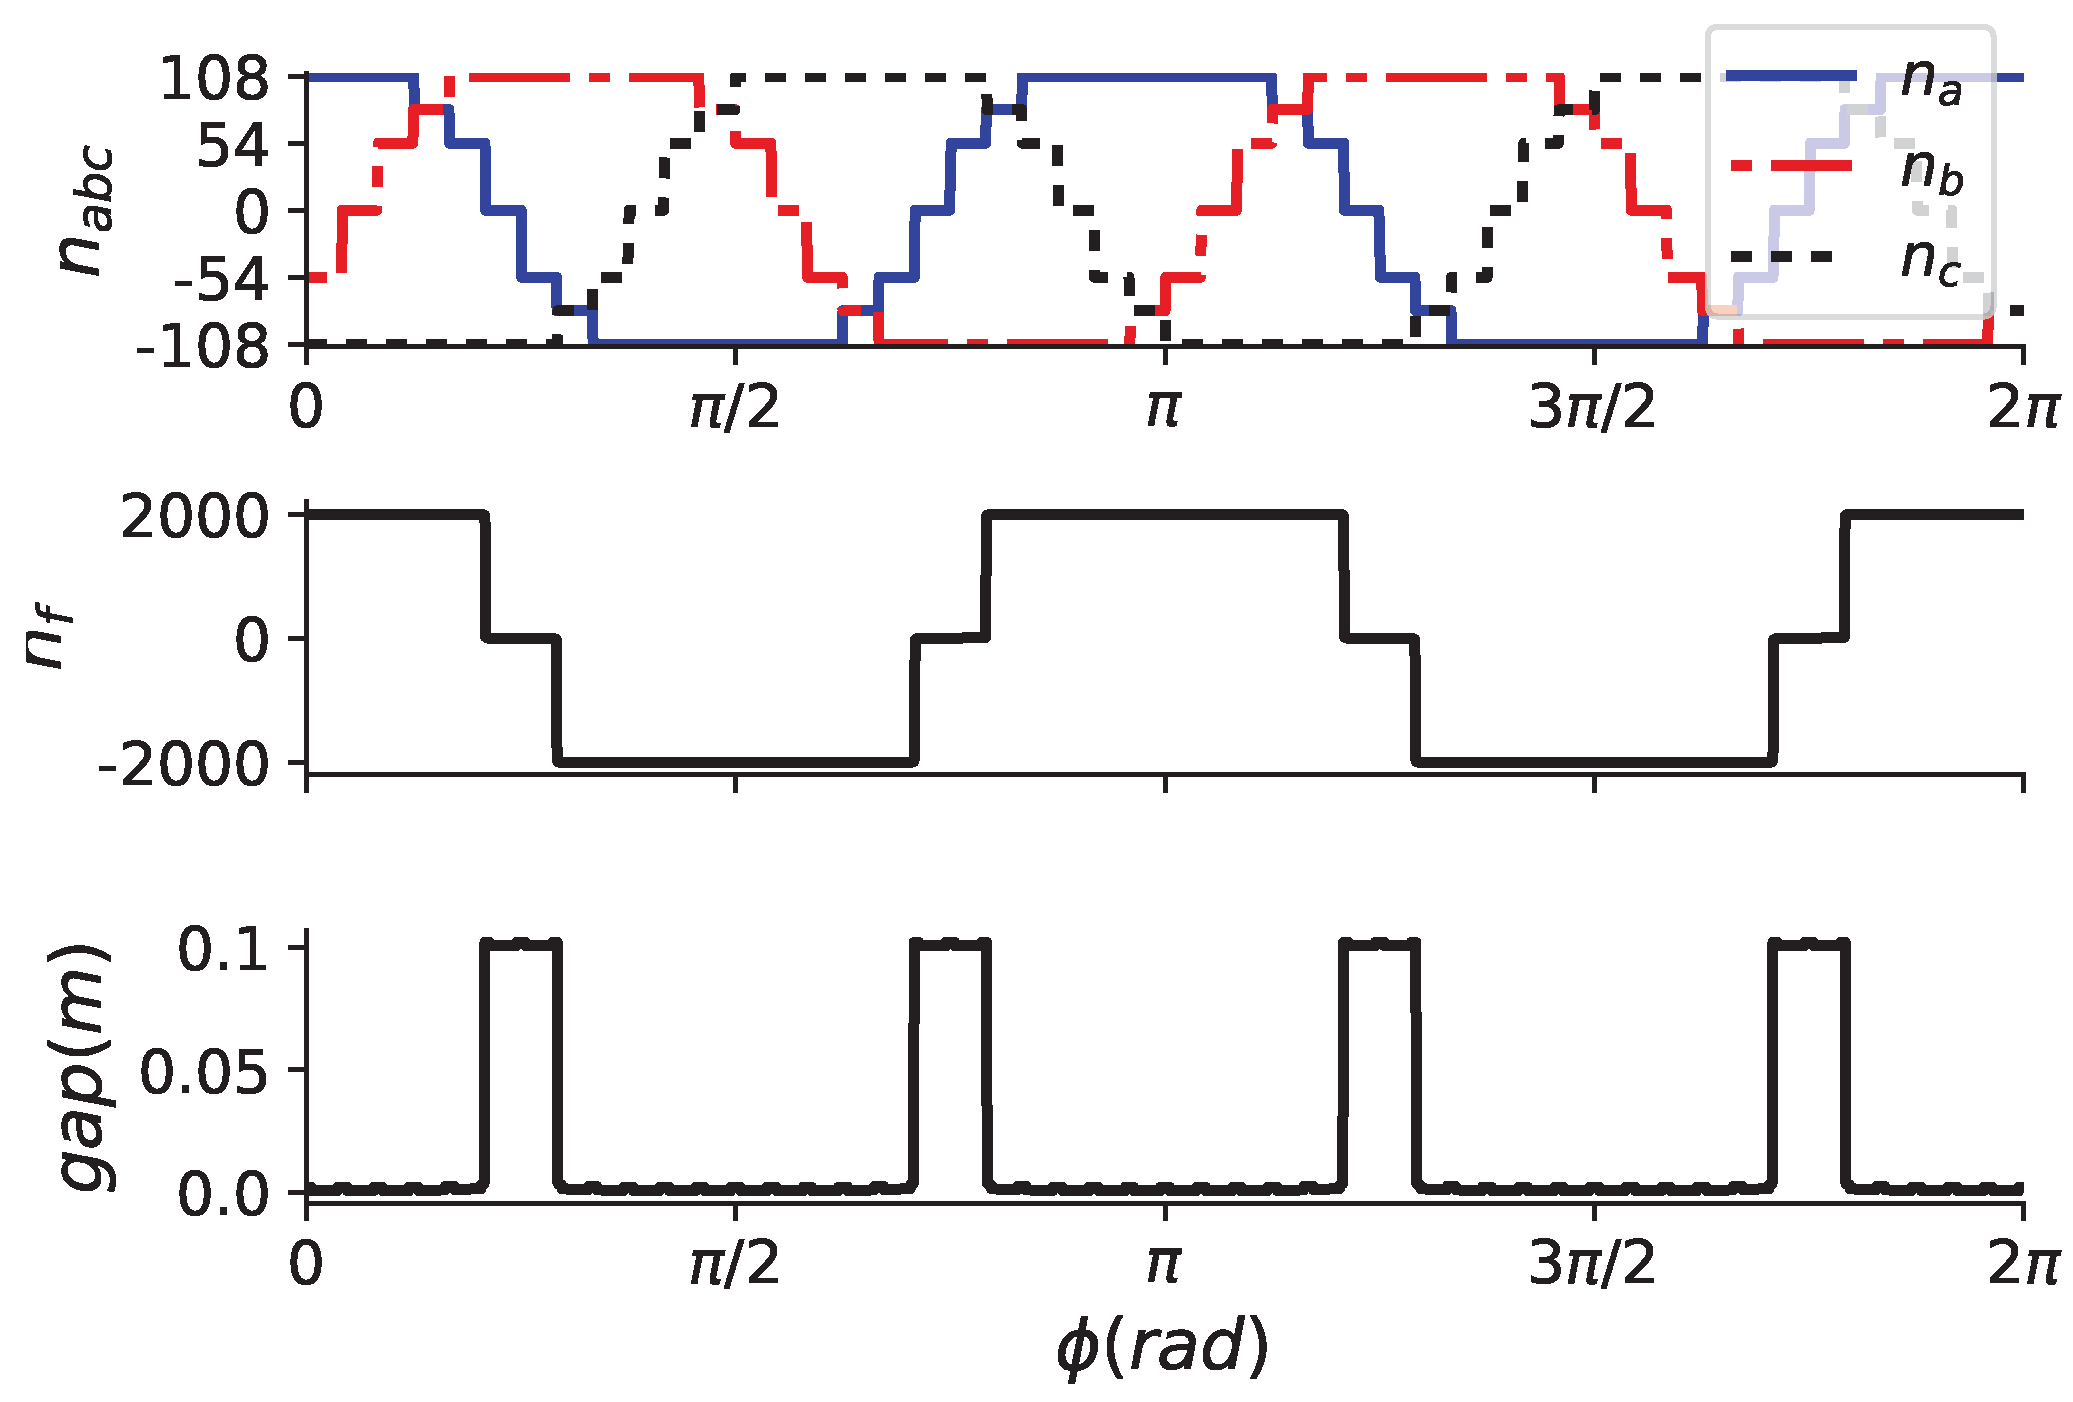
Table 1 [
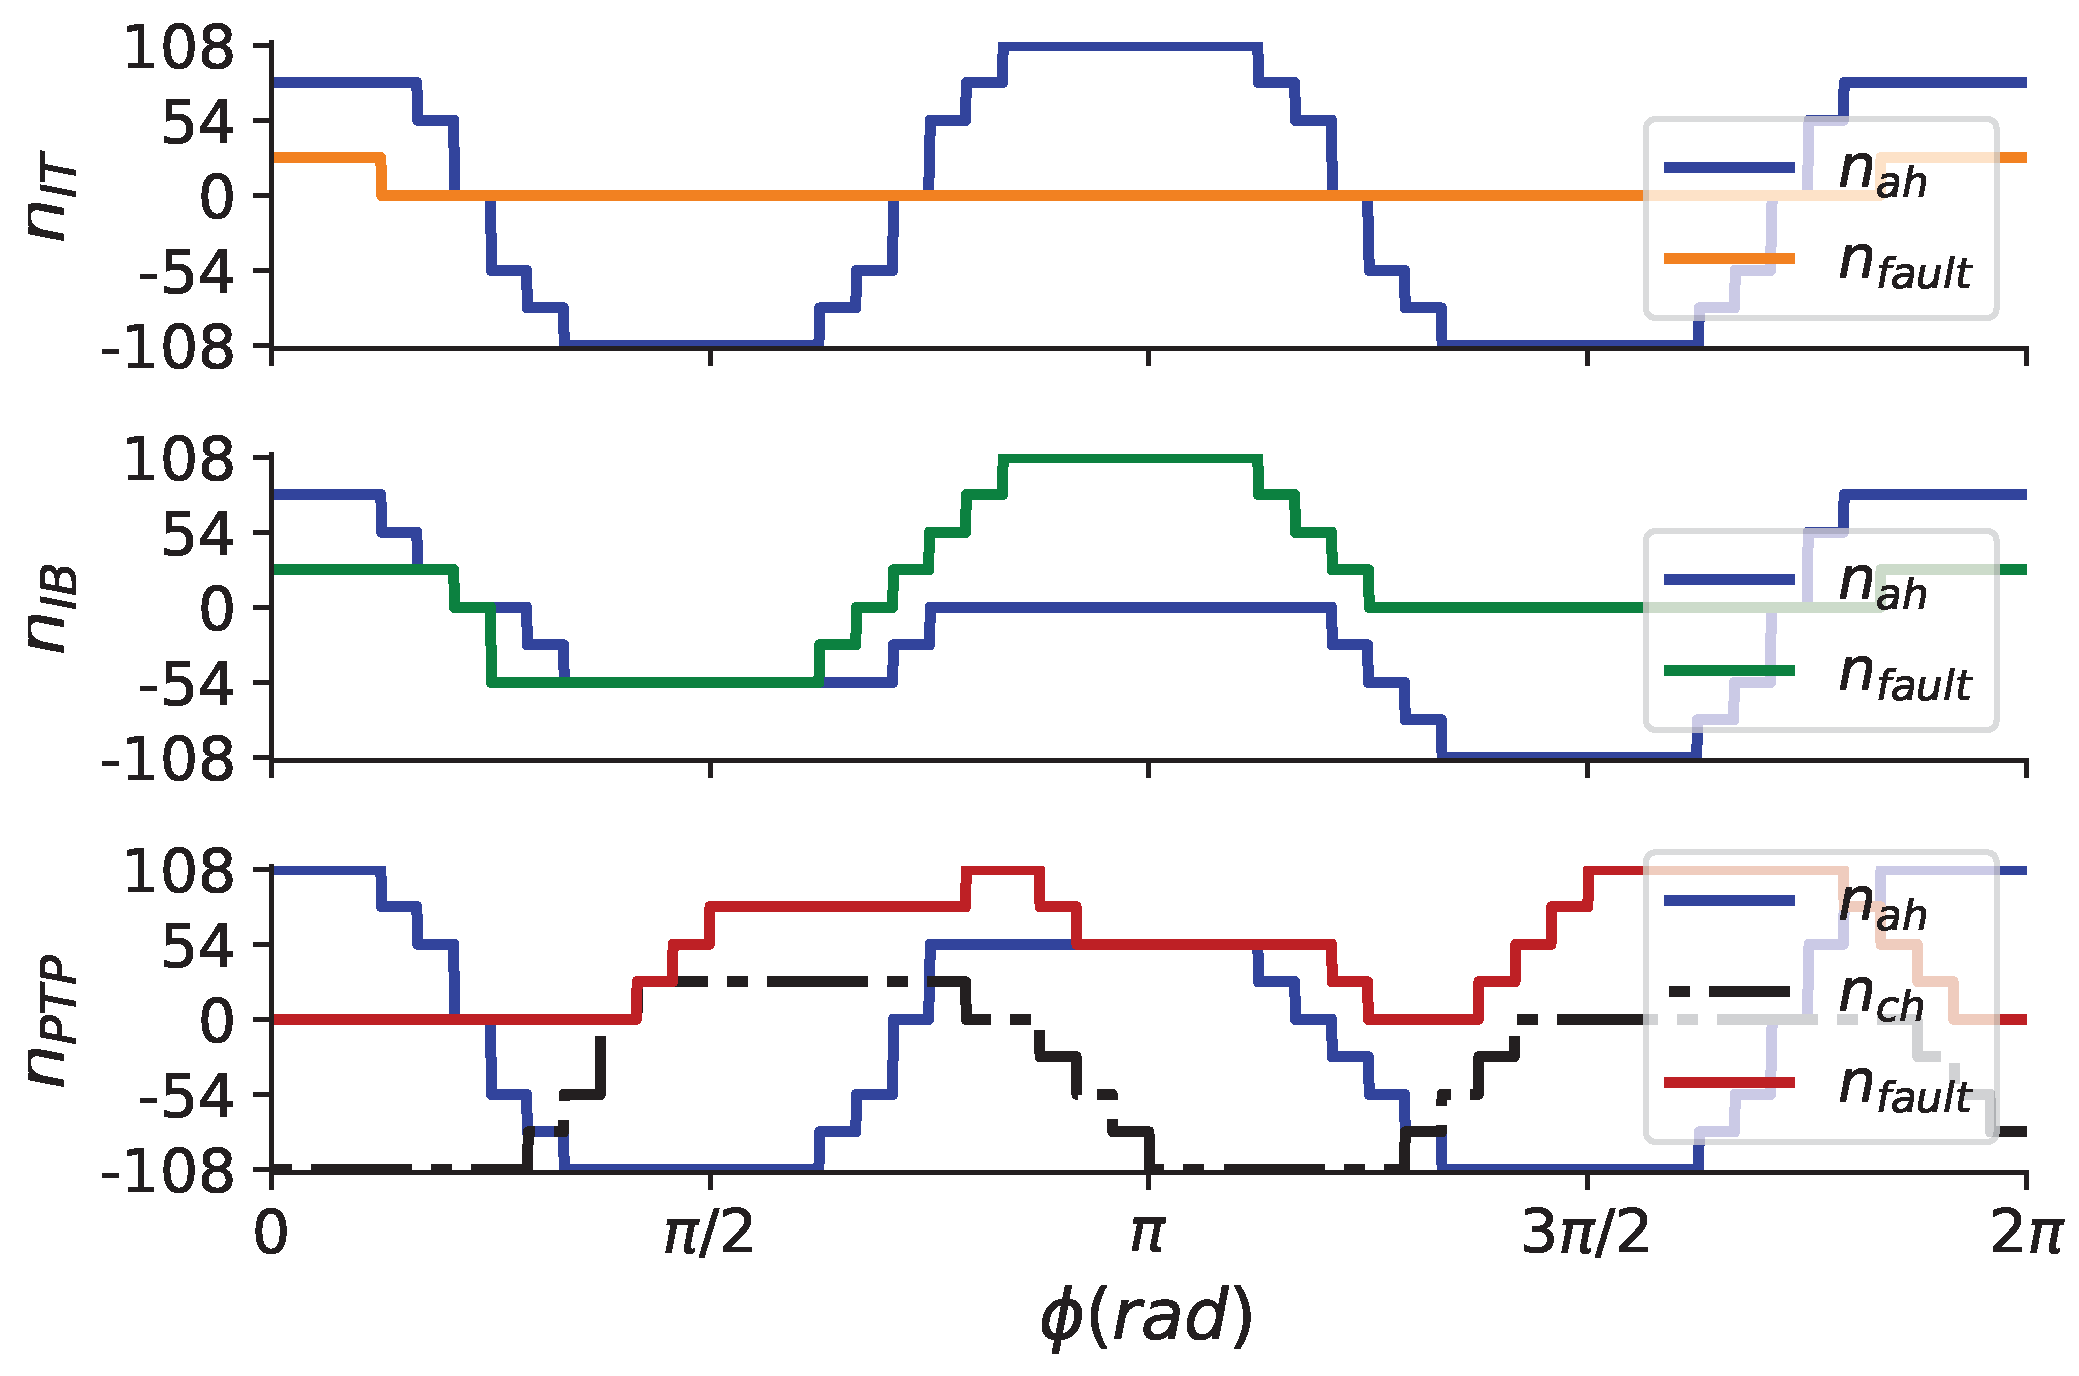
10]. The stator winding functions (
), field winding function (
) and gap function (
) are illustrated in
Figure 4.
The following fault cases were considered:
The IT fault involving turns of the phase a winding was simulated;
The IB fault involving turns located in the middle of each branch of phase a was simulated;
The PTP fault involving turns located in the middle of a single branch of phases a and c was simulated.
The winding distributions for these three faults are illustrated in
Figure 5. The IT and IB faults divide the phase
a winding into two portions:
and
. The PTP fault also divides the phase
c winding; therefore, there are three functions:
,
and
.
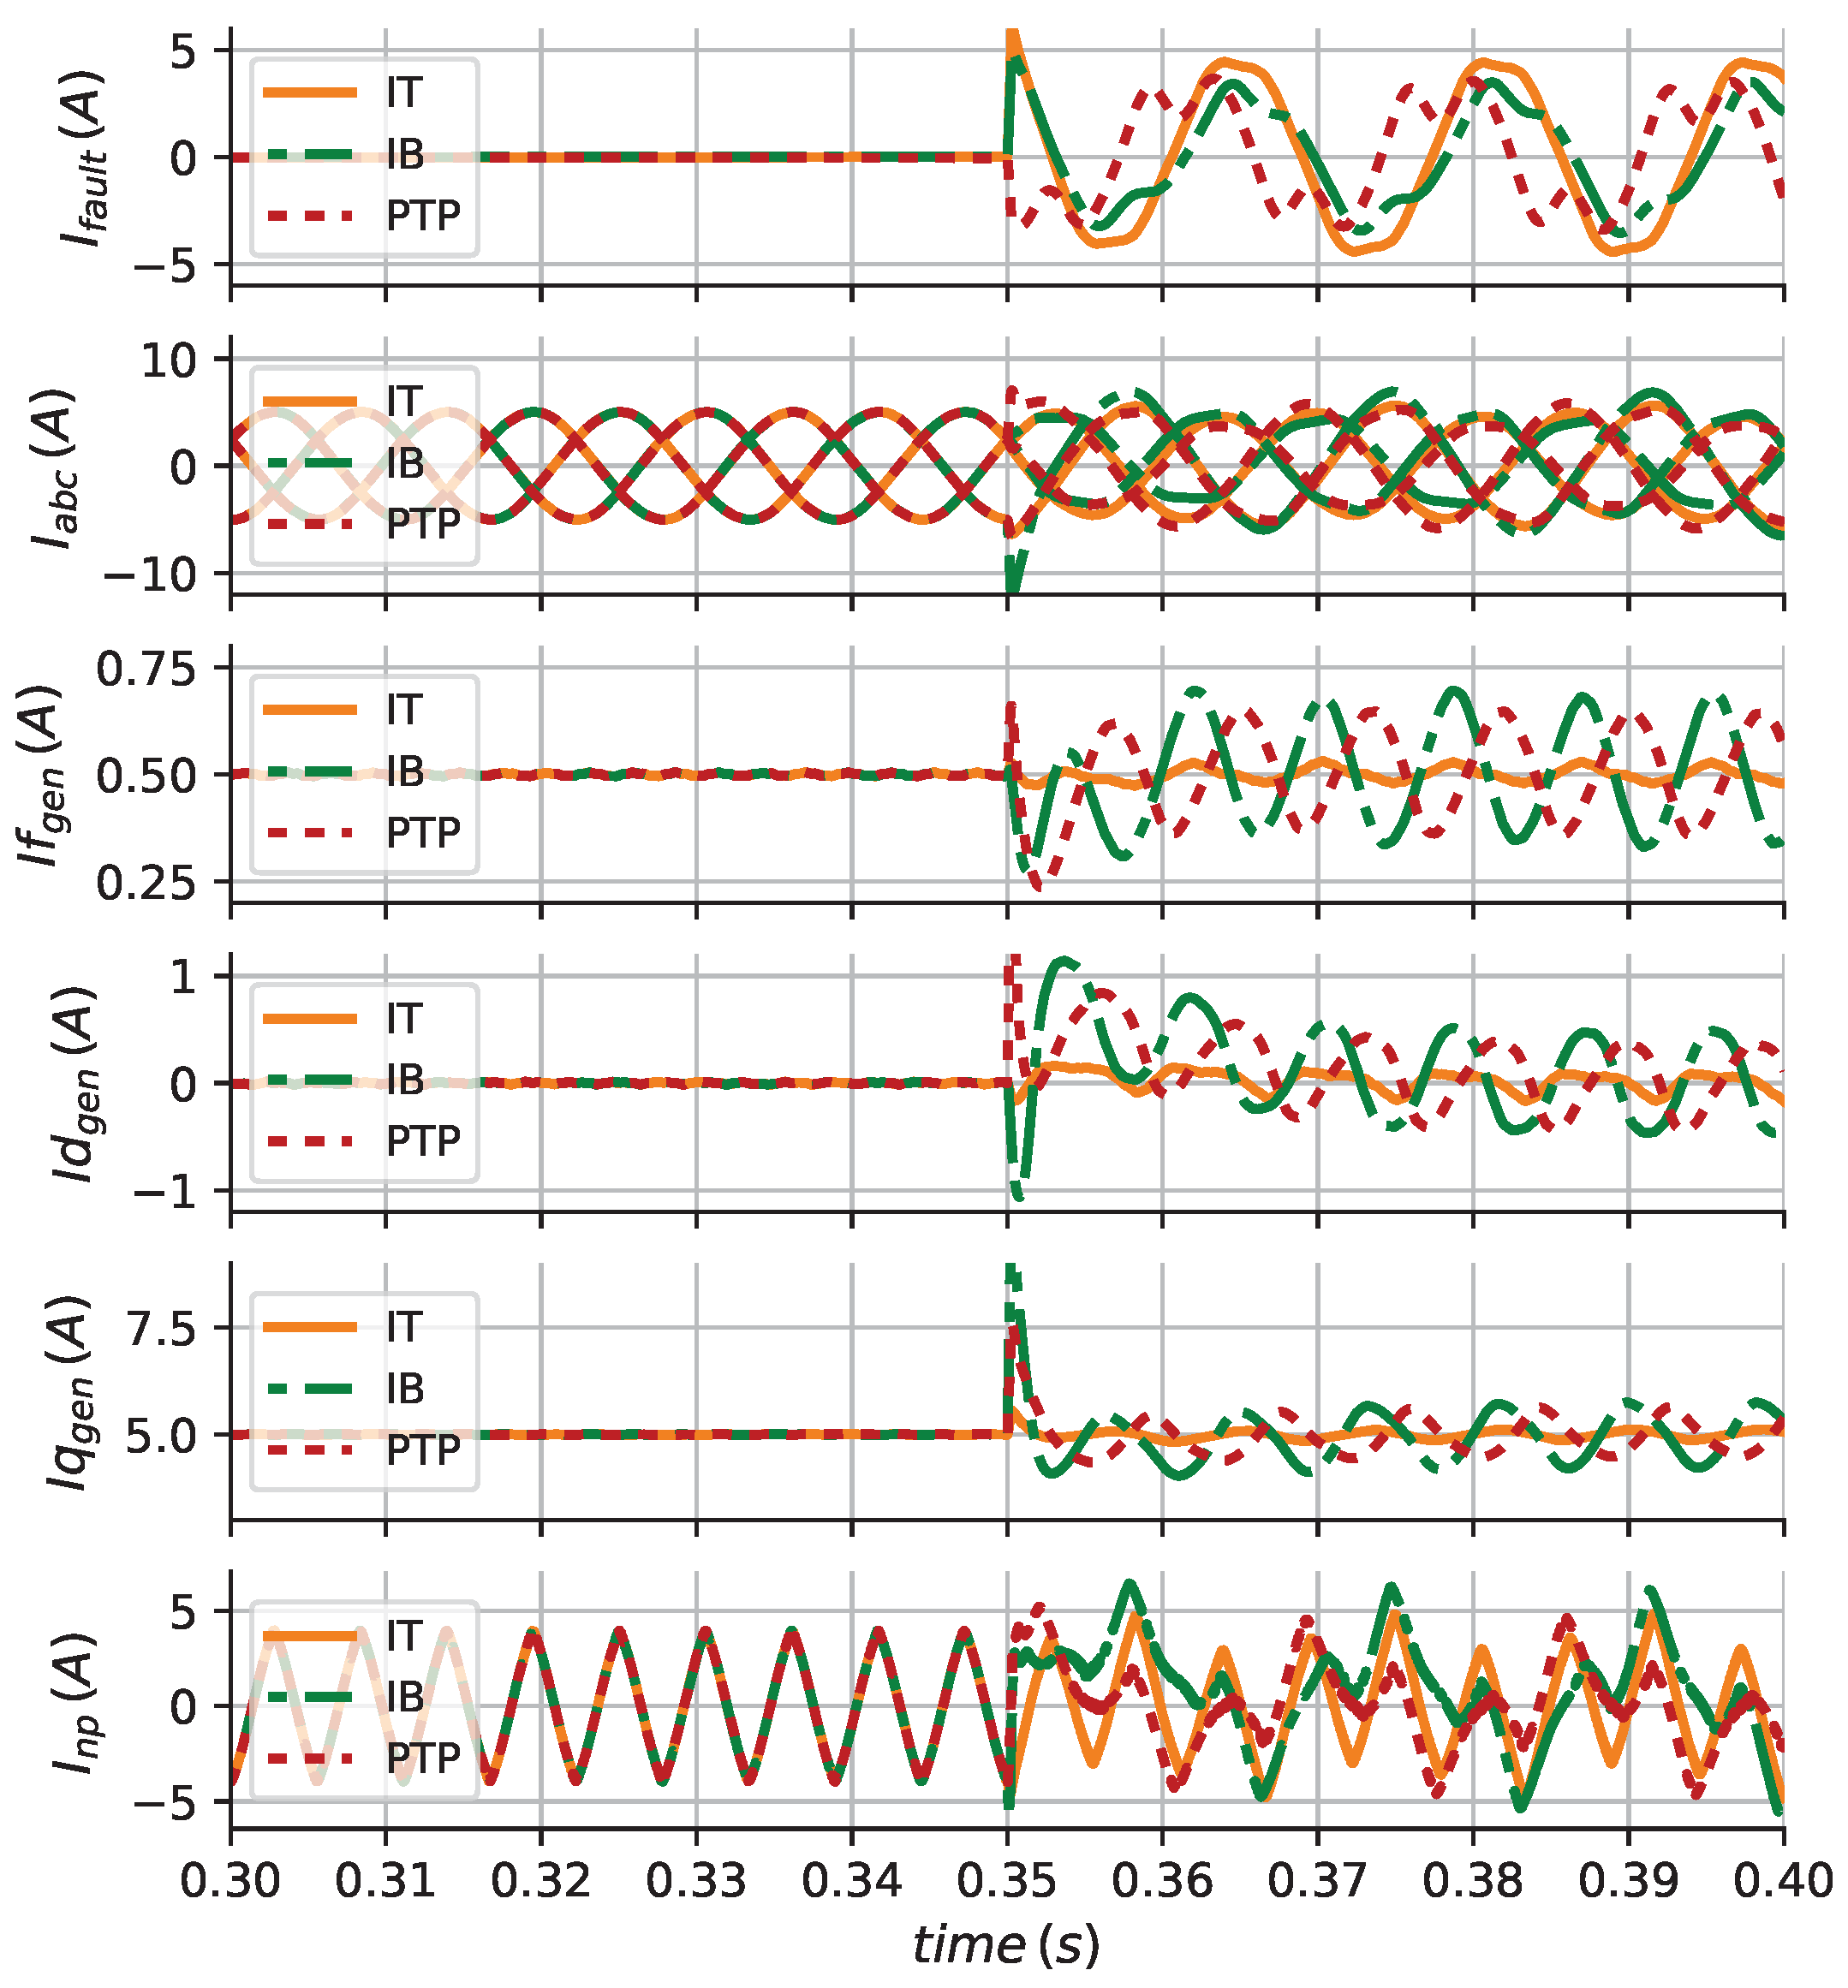
Figure 6 illustrates that the fault current (
) is distorted for the three fault types. Furthermore, the fault occurrence causes distortion of the currents
,
,
and
.
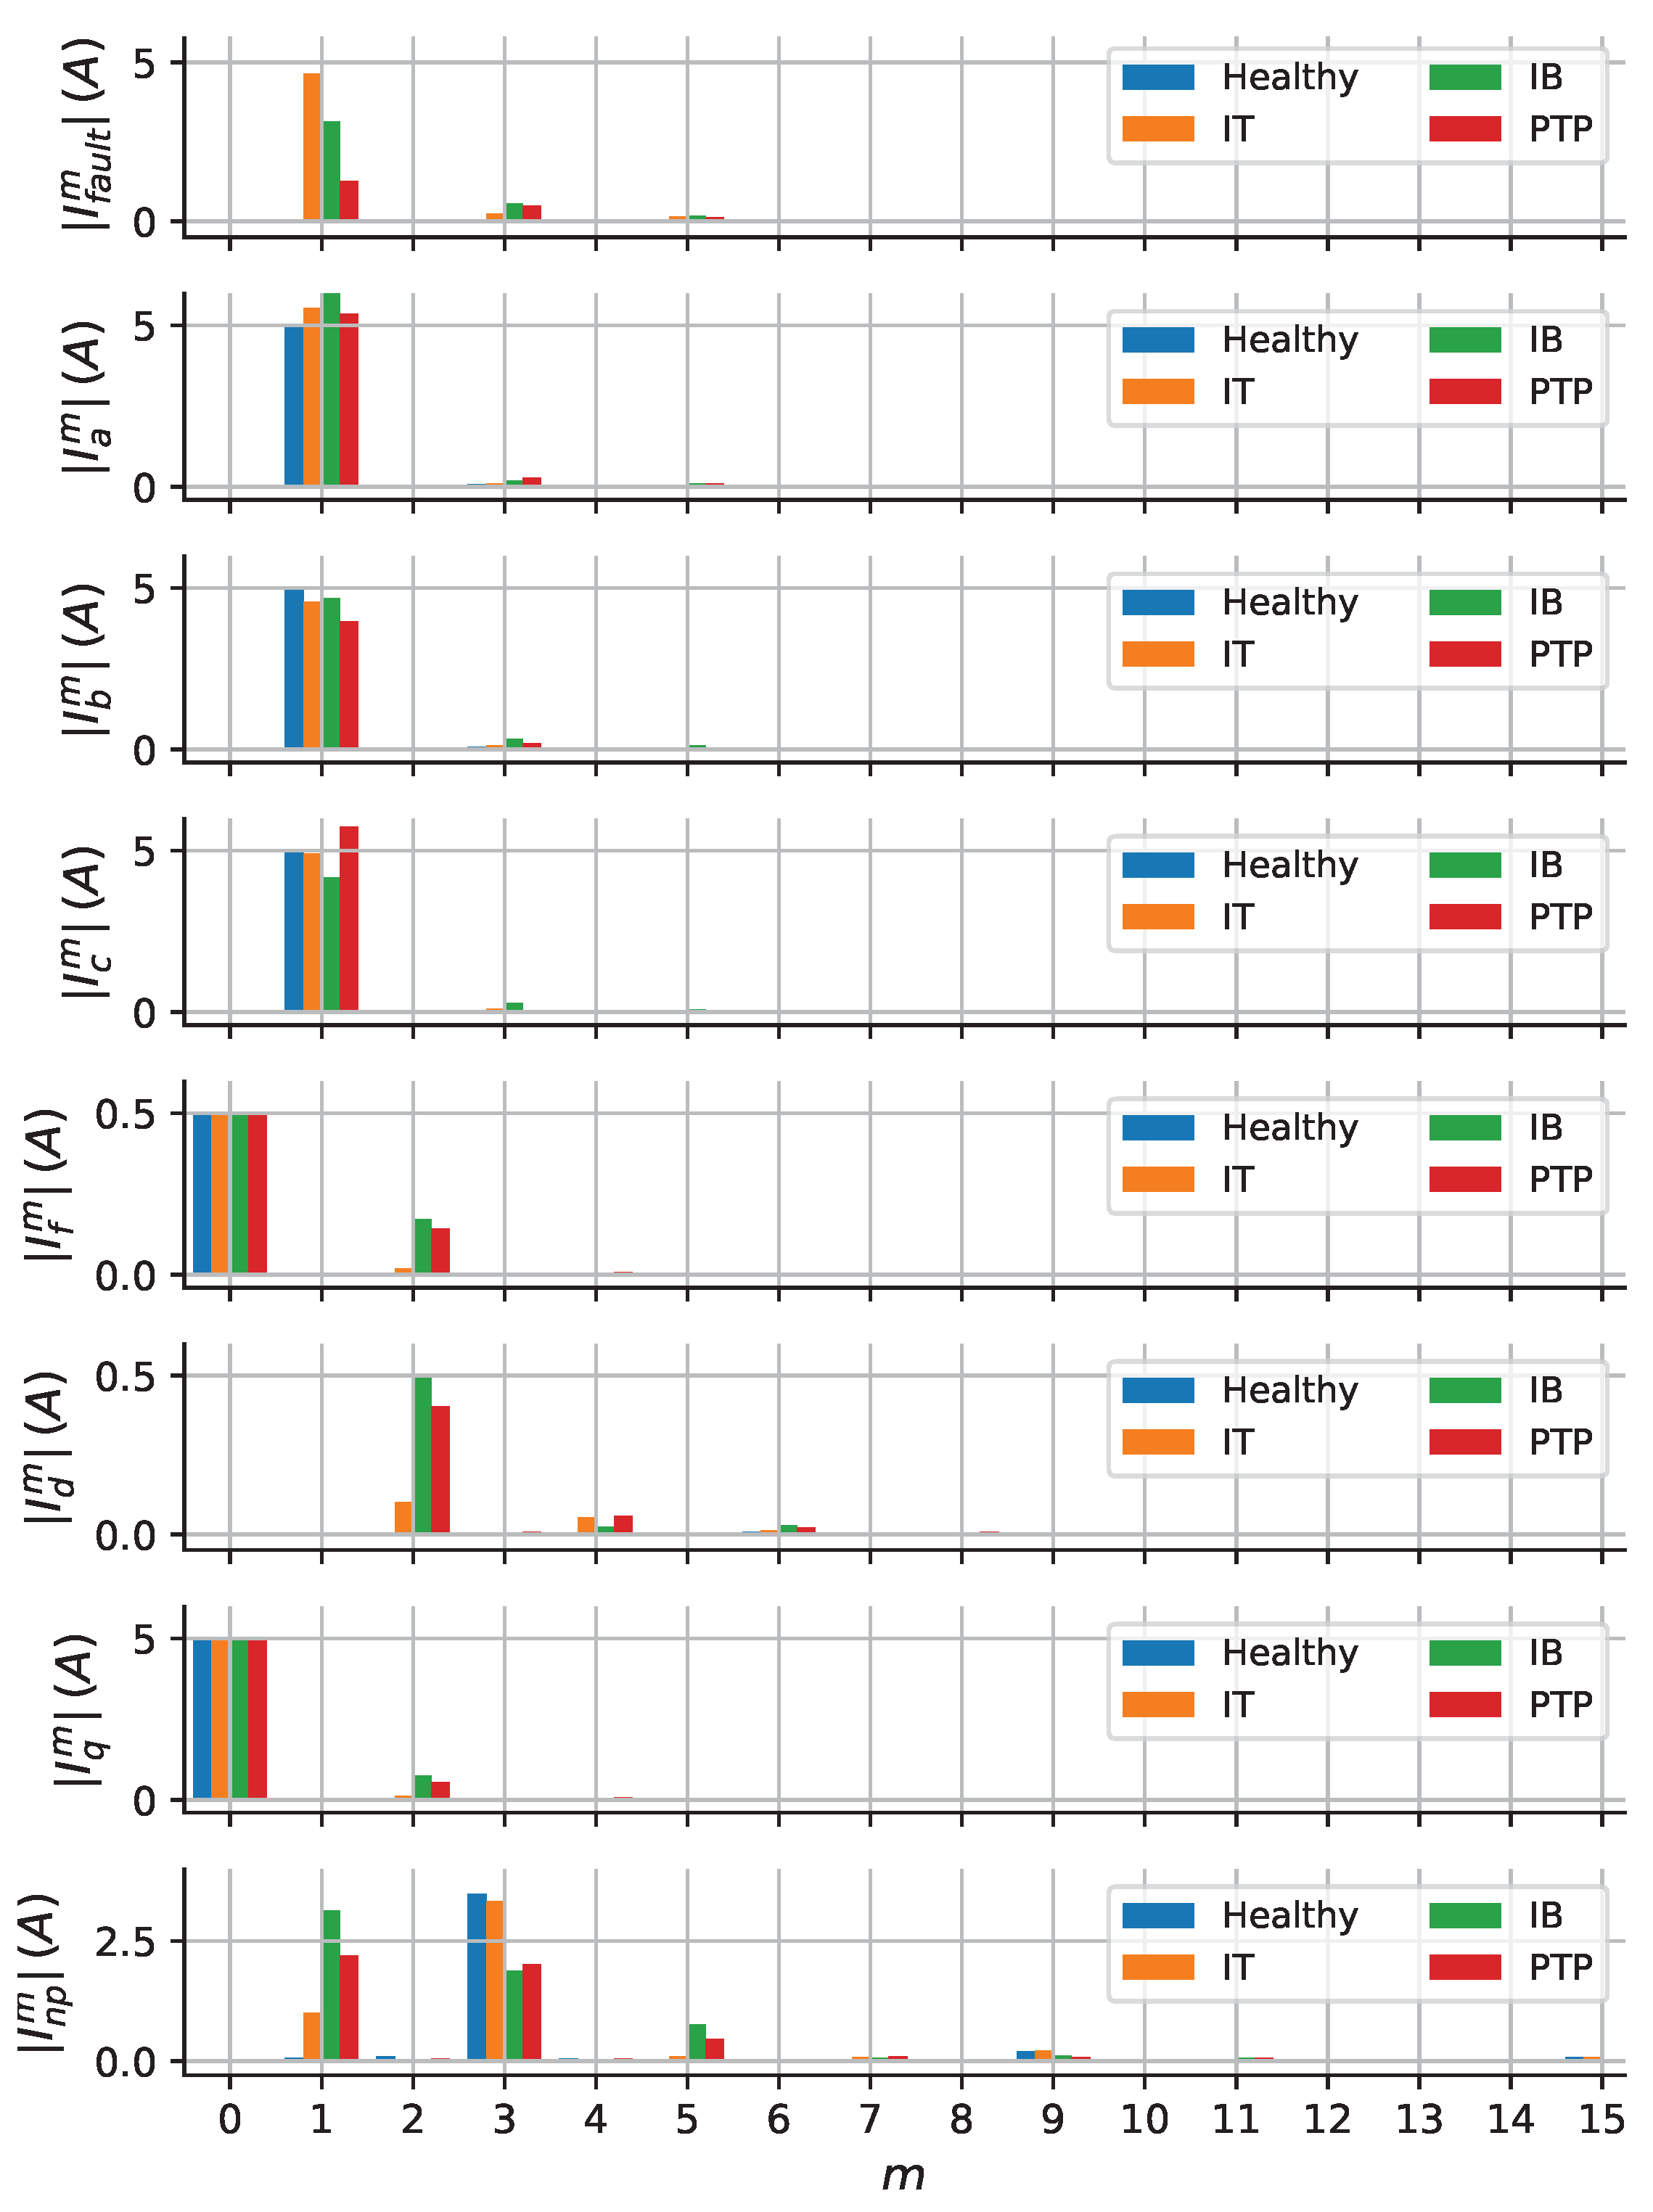
Performing the Fast Fourier Transform (FFT), using normal and fault case waveforms, makes it possible to identify spectrum changes in these currents.
Figure 7 illustrates the results obtained using the simulated data.
Analyzing the Fourier spectrum shown in
Figure 7, it is noted that
and
have the same harmonic components during the faults. This effect is expected because of the coupling between the winding of each phase and the turns involved in the fault. Moreover, the fault occurrence affects the spectrum of
,
and
.
The behavior reported in the literature [
32,
34] is confirmed: the fault current presents non-fundamental harmonics, in which the third harmonic is the most relevant. Under internal faults, there is also an imbalance in the line current fundamental harmonics (
), third harmonics in the line currents (
) and second harmonics in the field current (
) and
currents (
). Furthermore, it is shown that the fault in the WRSG causes fundamental harmonics in the NPC neutral current (
).
4. Experimental Analysis
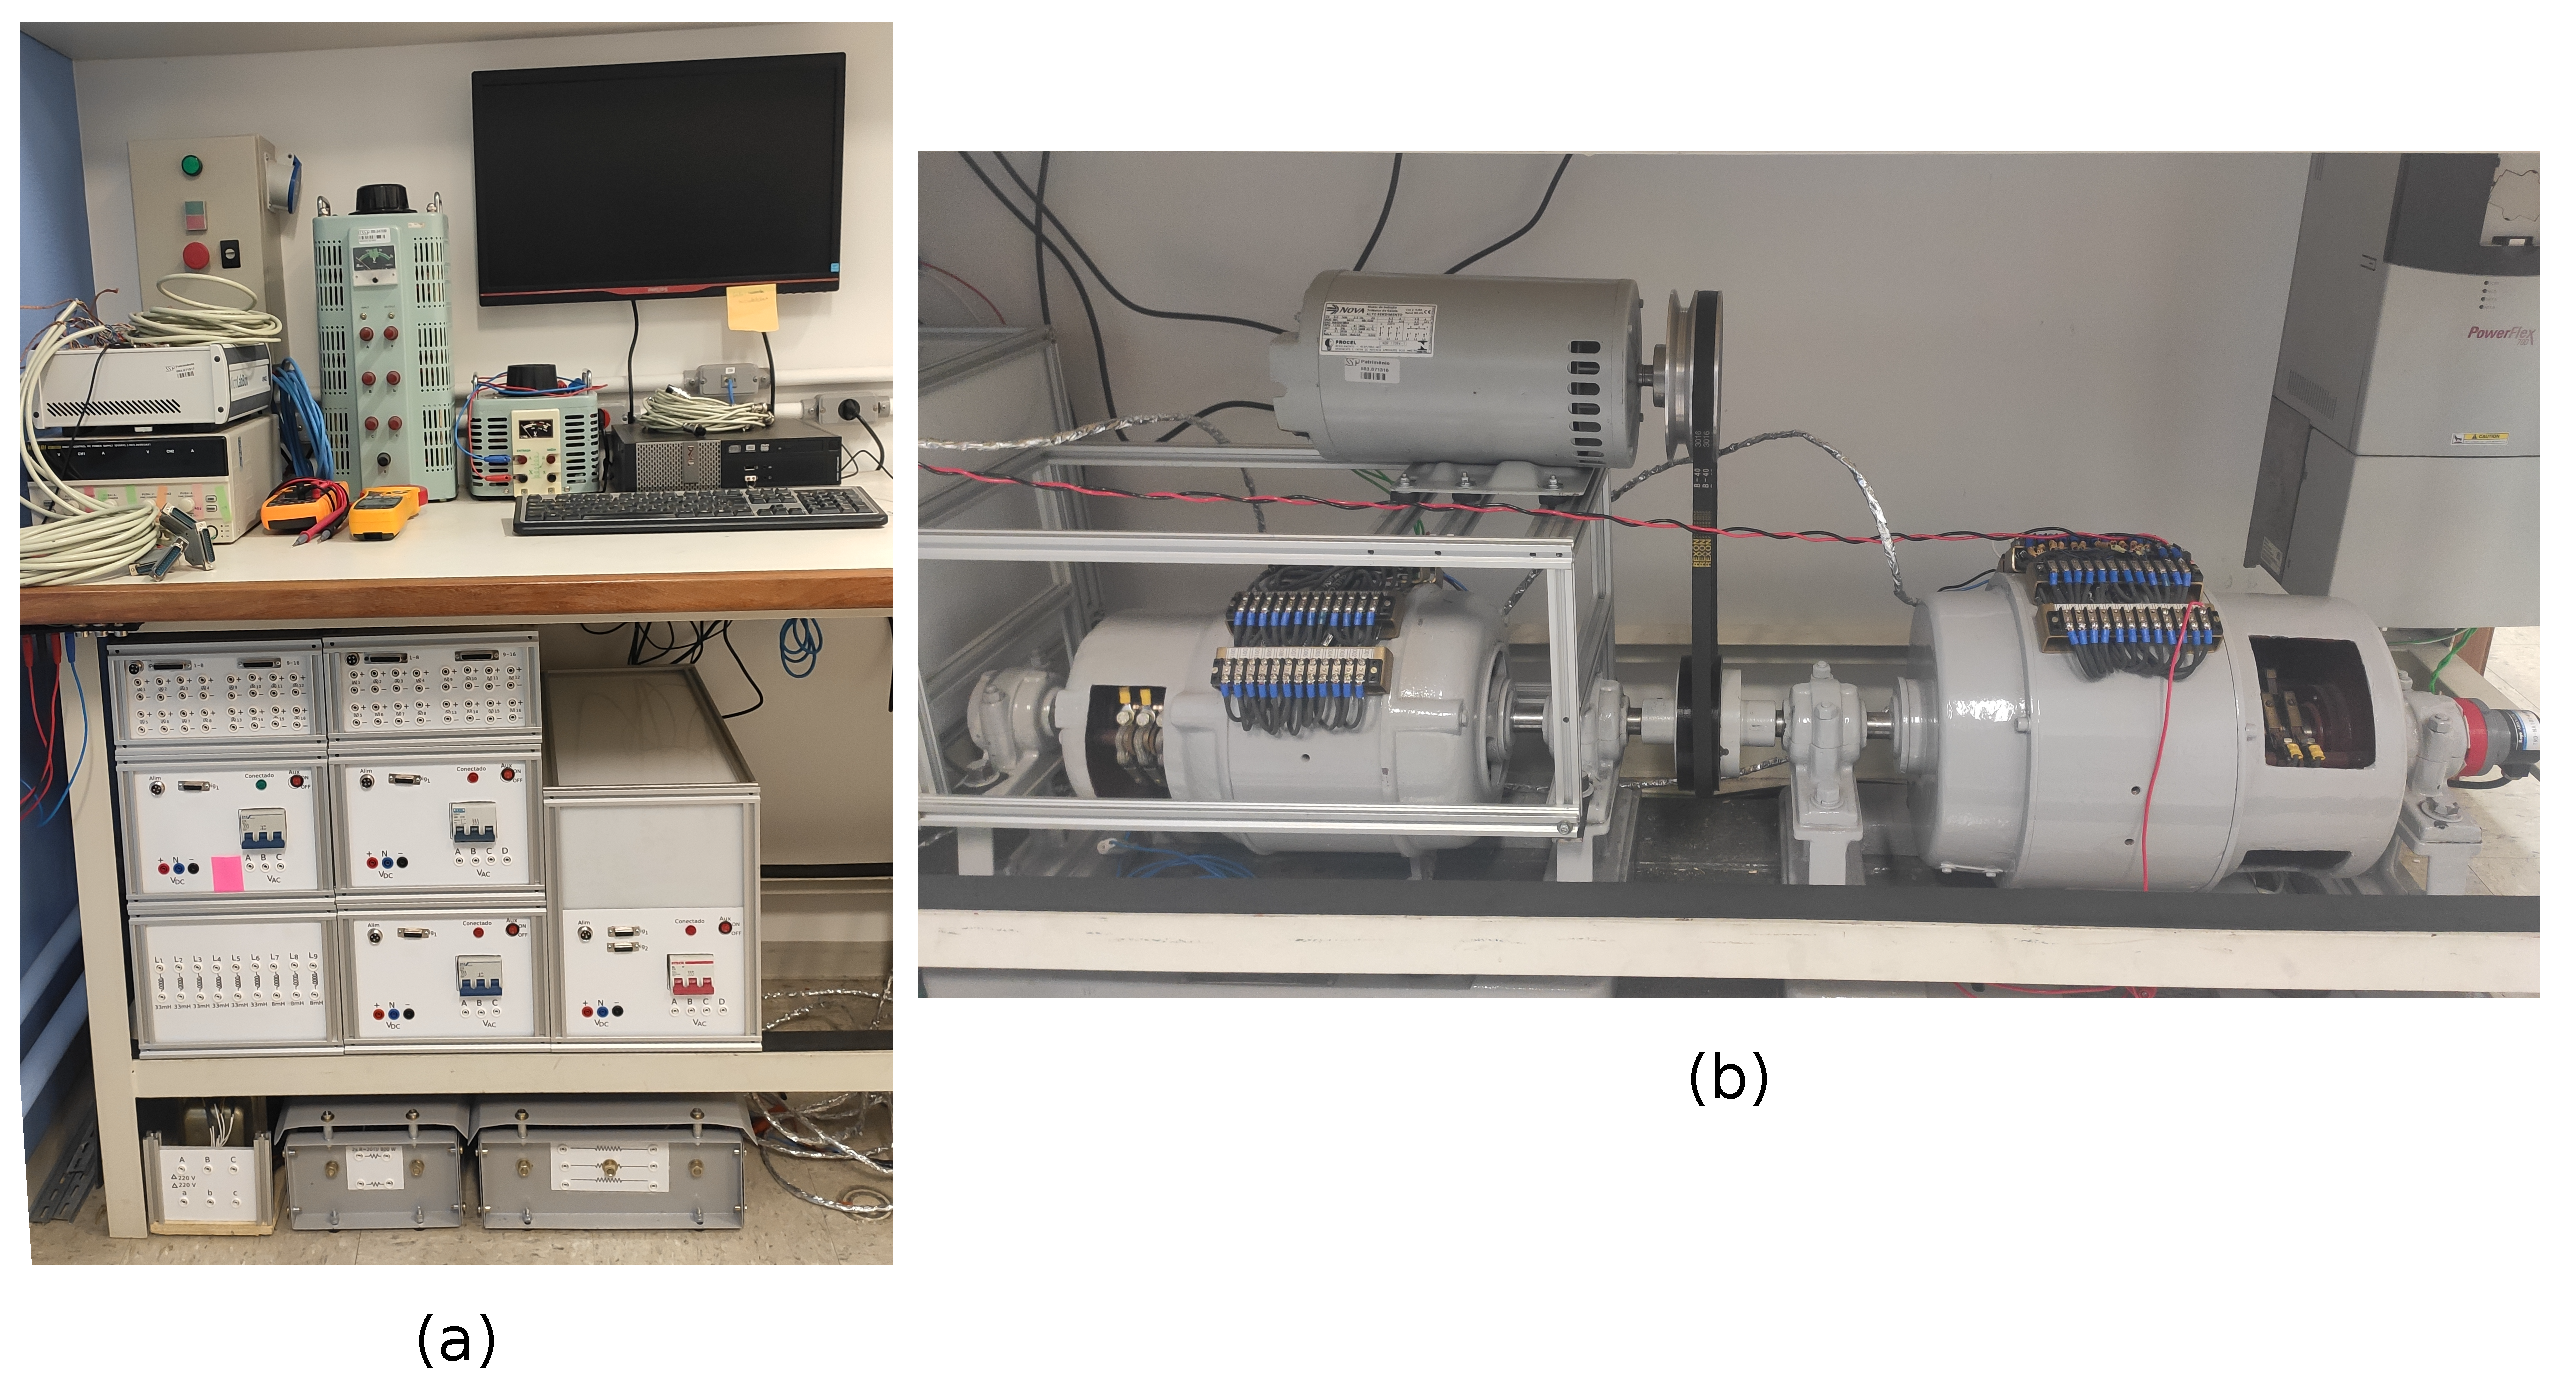
Figure 8 illustrates the experimental setup utilized in this paper. It is constituted of the following: one
kVA two-level VSC (2LVSC) and one 10 kVA 3LNPC VSC, both with
V and
kHz; one buck converter with ratio
V for field supply; one three-phase salient-pole WRSG with
kVA and
V; one inverter-driven three-phase SCIM with
kVA and
V; switches; voltage and current sensing boards; resistor bank for fault current limitation; one controller; one computer for programming and monitoring.
A Direct Torque Controlled (DTC) Squirrel-Cage Induction Motor (SCIM) is used as the mechanical torque source. The SCIM and WRSG are illustrated in
Figure 8b. The rotor position of the WRSG is determined by a 10-bit absolute encoder installed on its shaft.
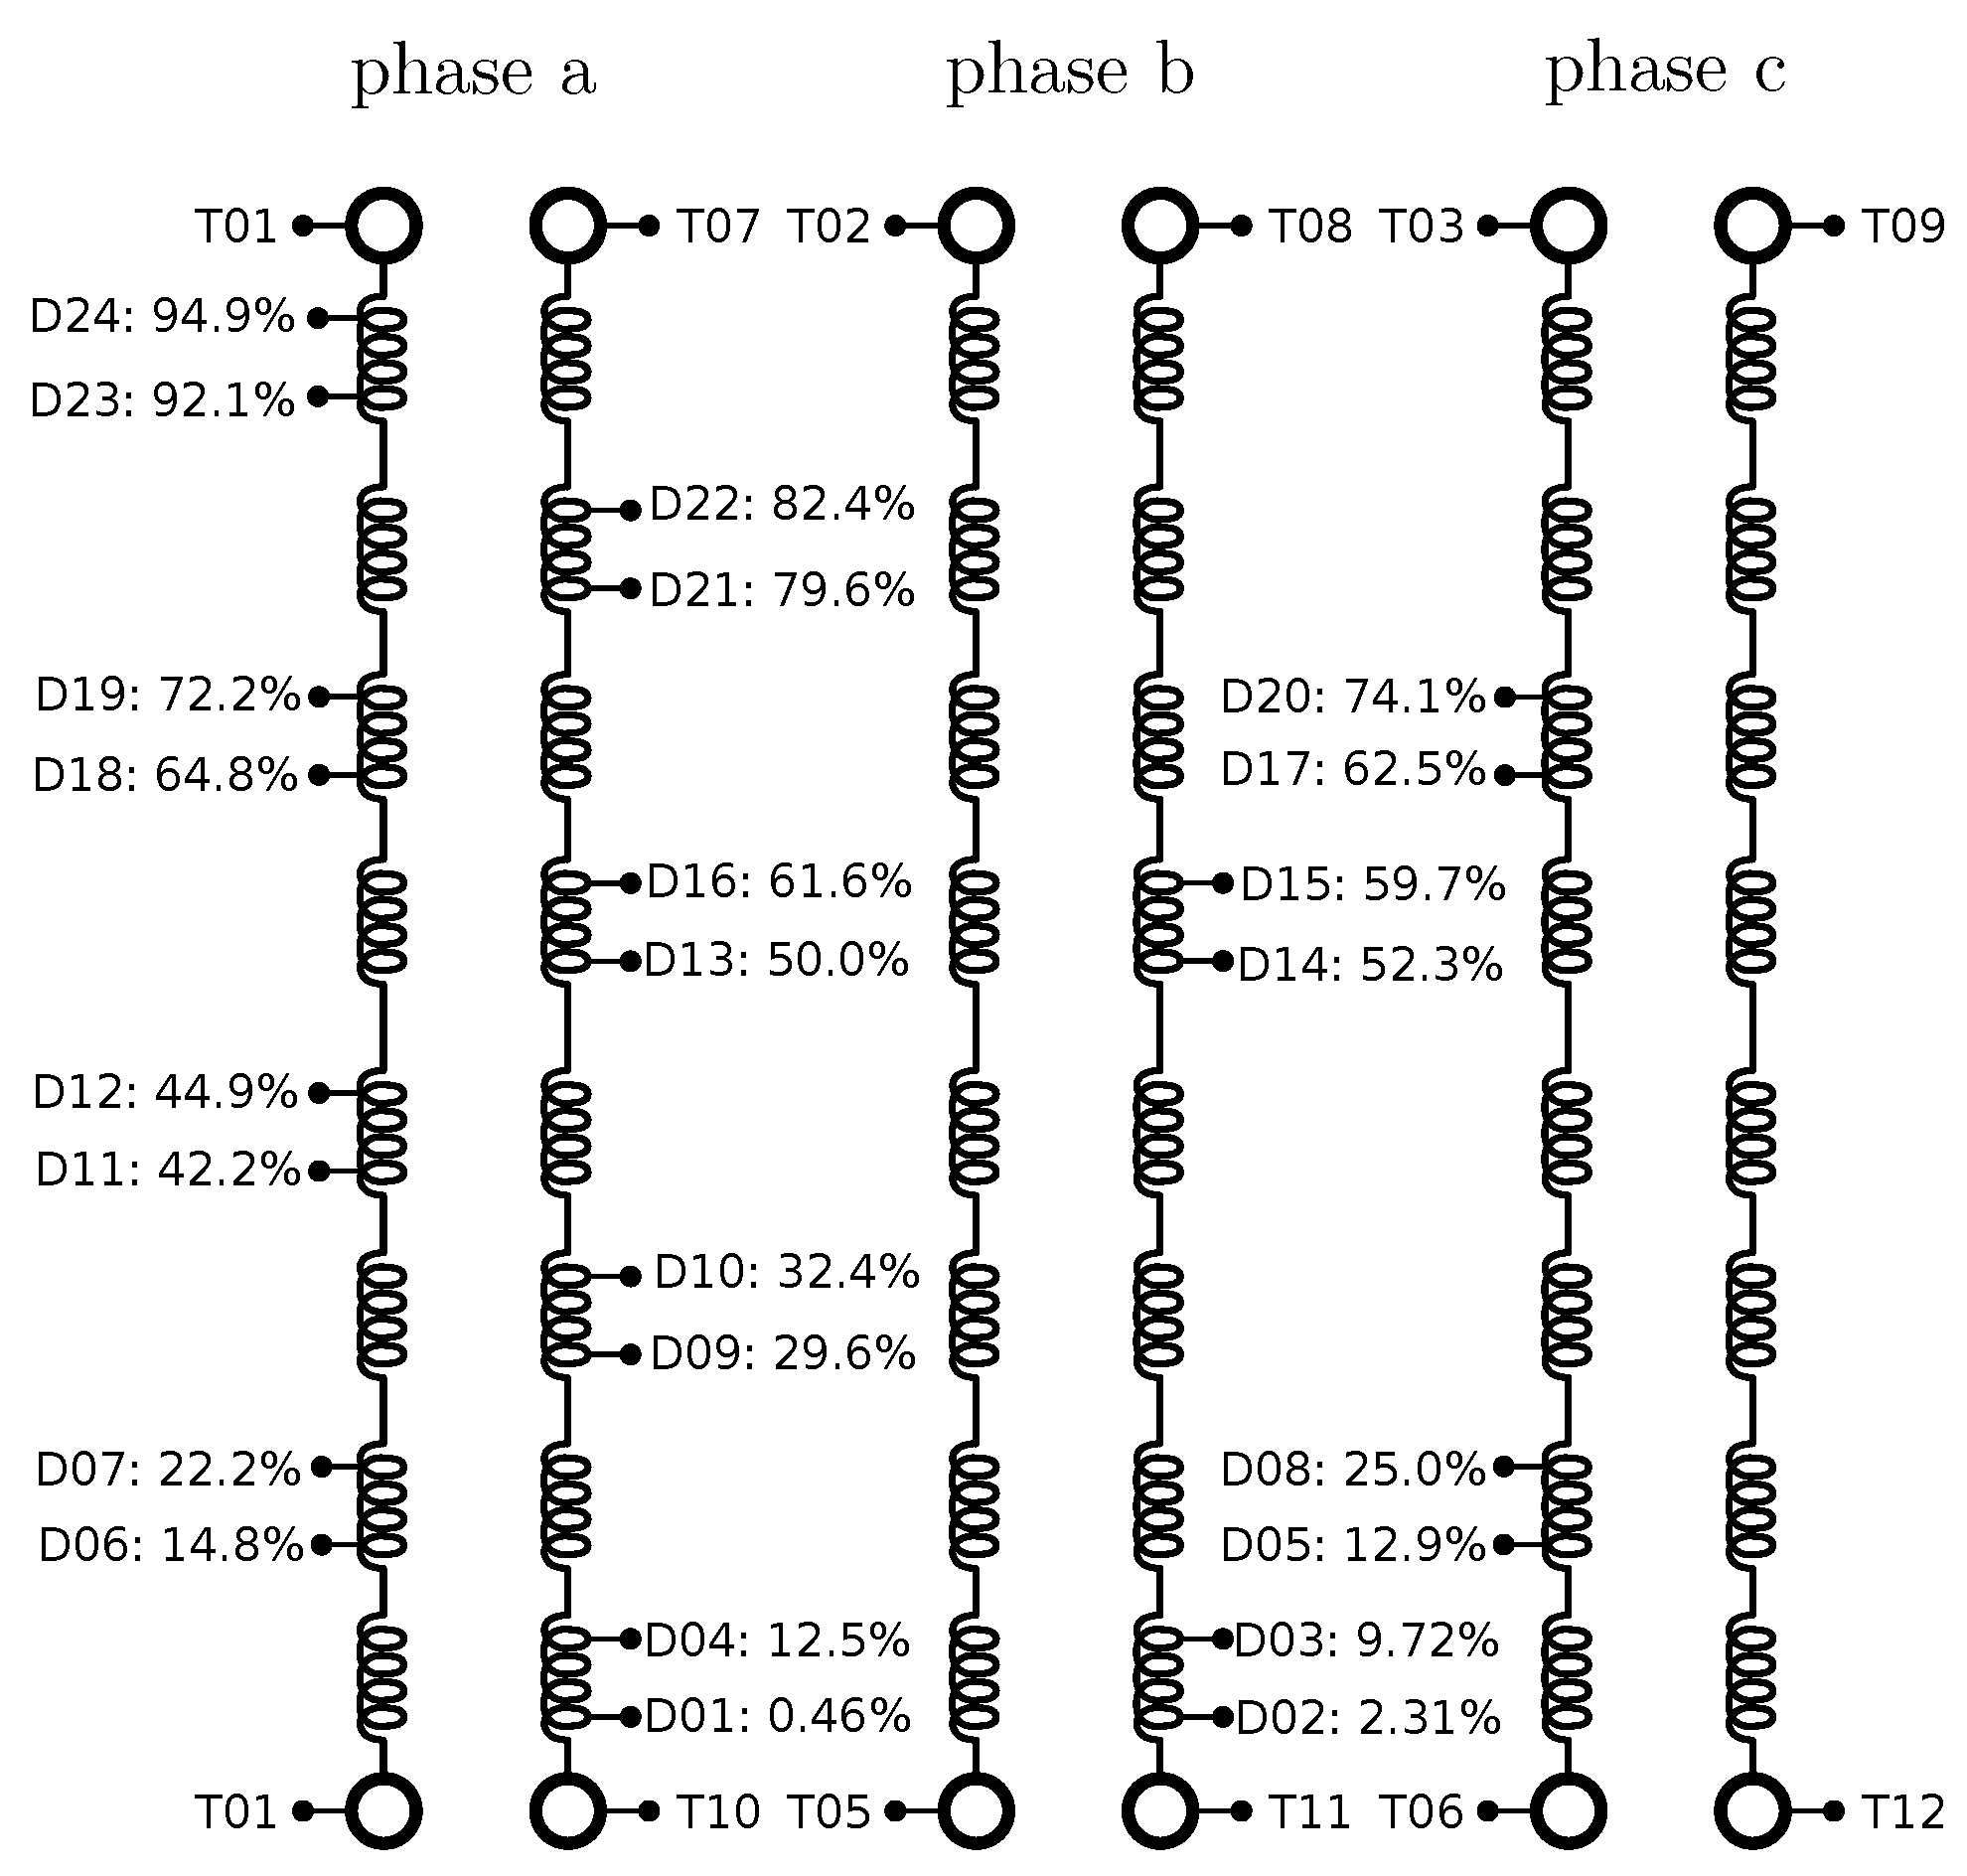
The WRSG used in the experimental setup is a four-pole machine with two branches per phase. There are 24 taps that make it possible to apply IT, IB and PTP faults during different operation cases; their distribution is shown in
Figure 9. This specific WRSG is thoroughly described in [
10].
The WRSG is wye connected, with the two branches of each phase in parallel, in order to operate on its rated power in a 220 V line voltage system. The generator and converter are not grounded to reduce current ripple [
33].
The faults are applied during operation to include measurements before and after fault occurrence, as well as the transient caused by the fault. A switch is used to apply the faults using the taps presented in
Figure 9. A resistor is connected to avoid damaging the generator and converter during the tests.
Using the experimental setup described, currents were analyzed under healthy and faulty conditions.
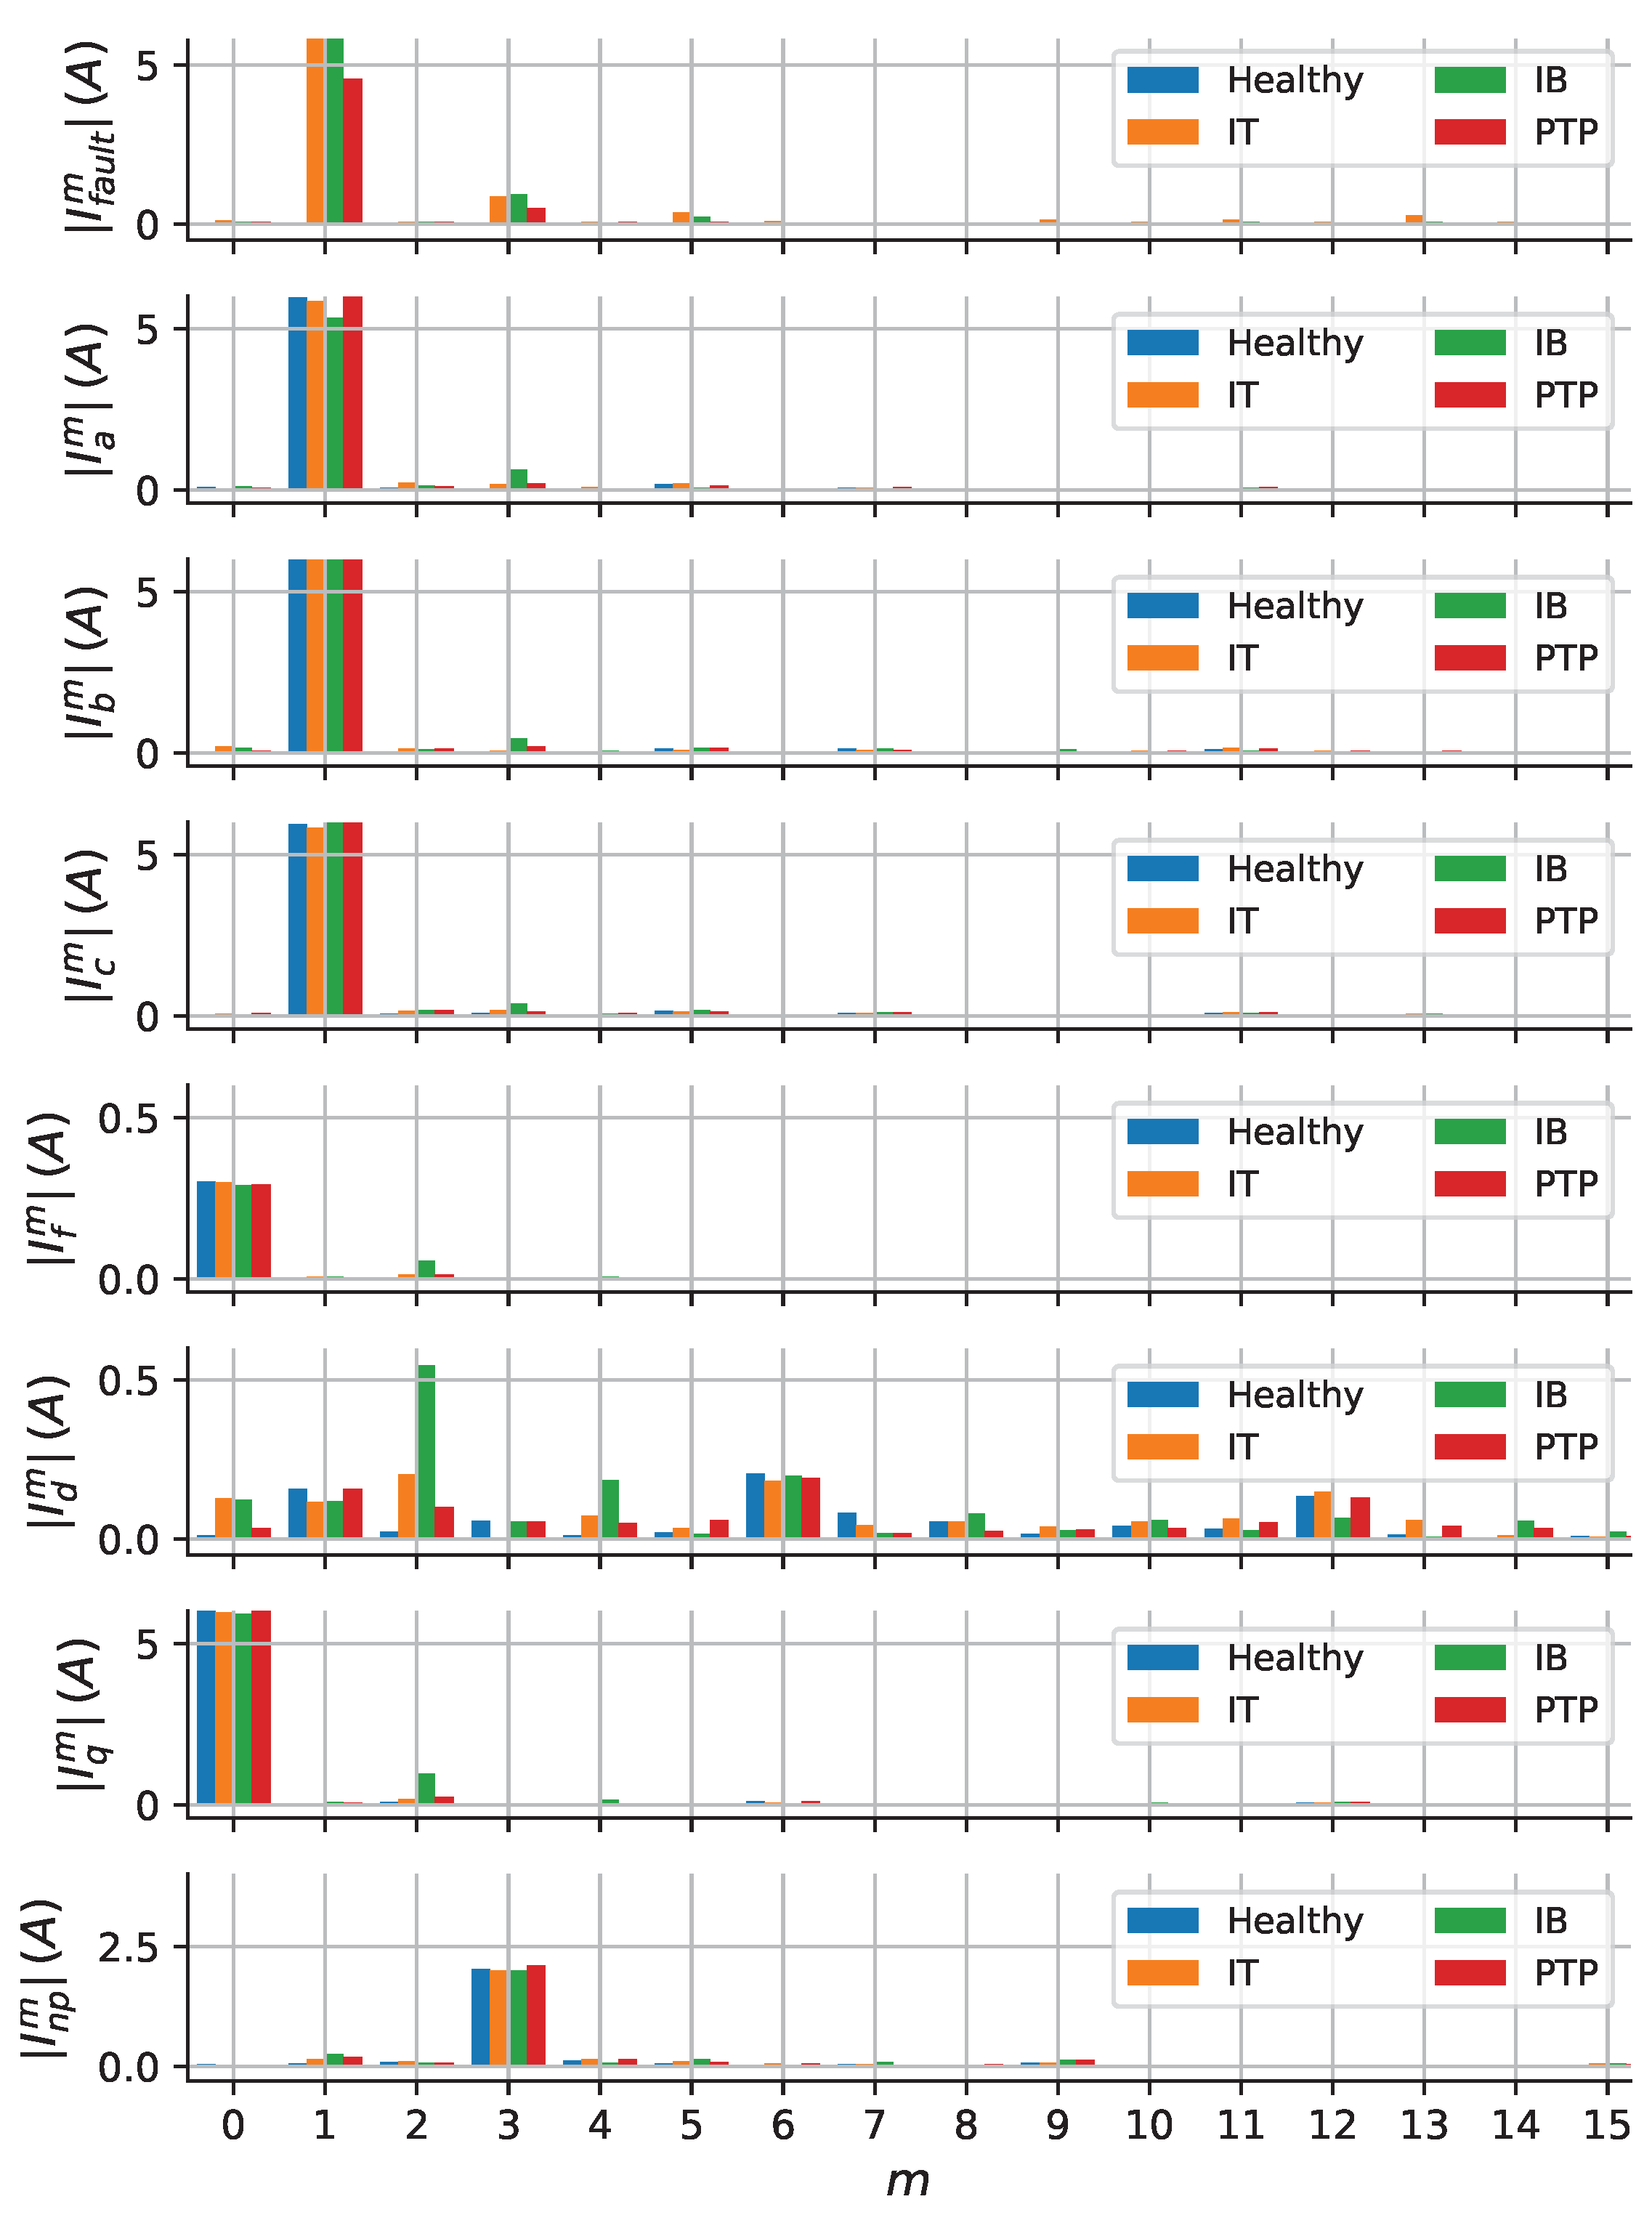
Figure 10 illustrates the FFT decomposition of the currents
,
,
and
for three fault cases. These results were obtained using the FFT performed with the cycle length adjusted according to machine speed (kept constant) in order to avoid spectral leakage.
Figure 10 shows the same components observed in
Figure 7; however, the amplitude of the harmonic components is different because of the accuracy of the simulation model and differences between the simulated and experimental fault scenarios. Nevertheless, comparing the results presented in both figures, it is noted that, for the three fault types, the component
is the most relevant fault-related harmonics in currents
and
,
is the most relevant in currents
and
,
in current
, and the fault causes imbalance in
.
5. Approach for Fault Detection in Variable-Speed Synchronous Generators
Harmonic content estimation of signals with fundamental frequency variation is often performed by dynamically changing the sampling rate or window size and applying the Fourier transform using the data contained in the window [
15]. Another approach is adopted here: detection of these harmonics using bandpass filters with frequency dynamically set by encoder measurements. These filters use
transformation and Fourier series concepts together with low-pass filters to isolate the characteristic harmonics. Both approaches may be used and a comparative study of them is not within the scope of this paper.
The negative-sequence component and third harmonic in are expressed in coordinates, second harmonic in and the fundamental in are expressed in and coefficients (ℜ and ℑ notation may be used). The reference for transform and Fourier coefficient calculation is given by the encoder normally used to control the WRSG, as mechanical and field speeds are synchronized.
5.1. Harmonics Filtering under Variable-Speed
For the filtering process used in currents
,
transformation is performed with the reference axis given by the field position (
) multiplied by the harmonic order of interest (
m) to detect the third harmonic
and to detect the negative-sequence
. A similar filtering approach is used to isolate fault-related harmonics on induction motors [
20]. The field position is calculated using the rotor mechanical angular position (
) and the number of pole pairs (
):
.
Currents are mainly constituted of a predominant fundamental harmonic with position that appears as an oscillation of harmonic frequency in the outputs of the transformation. When a turn fault occurs and there is a component , the output will have a mean value different from zero. A low-pass filter is used to eliminate the oscillation; therefore, it gives the value of the m component in coordinates: represents negative-sequence and represents the third harmonic.
The
transformation is performed as (
22), where
m is the harmonic to be detected. Where both
and
values are instantaneous, there is no data window definition.
For instance, if the currents
have the form presented in (
23), where
is the amplitude of the fundamental component and
is the amplitude of the
m harmonic, we have the following:
The result of performing (
22) is shown in (
24). It is noted that the output has a mean value
and oscillatory component with frequency
and amplitude
. Then, (
24) is filtered to isolate the mean value, which is the amplitude
.
If the m component does not have the same phase as the fundamental components, the value will be divided in the components and . Therefore, it is convenient to monitor both components simultaneously or the geometric locus of .
A Fourier-based approach is used for detecting
and
. The coefficients
and
for a given component
m are calculated as in (
25), with
as
or
.
For the filtering process based on these coefficients, the instantaneous value of the signal is multiplied by the sin and cos of . A similar approach is employed for single-phase converter grid synchronization. Field position is used to dynamically change the filter setting according to the generator speed.
The products
and
will have oscillation if harmonics other than
m are present in the signal, and the mean value is different to zero if
m is present. Therefore, a low-pass filter is used to eliminate the oscillation, giving the value of the desired harmonic sin and cos coefficients:
and
represent the second harmonic in
, as
and
the fundamental in
. This approach uses the low-pass filter instead of the periodic integral used in (
25).
For instance, if the current
has the form presented in (
26), where
is the mean value and
is the amplitude of the
m harmonic, then
The result of performing (
25) is shown in (
27). It is noted that the output has a mean value
and oscillatory component with frequency
m and amplitude
. Then, (
27) is filtered to isolate the mean value, which is the amplitude
.
If the m component has a different phase, the value will be divided into the components and . Therefore, it is convenient to monitor both components simultaneously, or their geometric locus.
Low-pass filters are used to eliminate oscillations and give the value of each component desired. Therefore, their cut-off frequency may be the lowest practical filter order chosen to avoid long delays. Second-order Butterworth filters set to 15 Hz were used but other types of filters may be further analyzed. The overall filtering process is presented in
Figure 11.
5.2. Fault Detection Using the Geometric Loci of the Harmonic Components
Figure 11 illustrates the fault detection scheme using the filtered variables. After isolating the characteristic harmonics through the described filters, they are used to detect the fault occurrence. The geometric loci of the components
,
,
and
are used:
×
,
×
,
×
and
×
. This approach is chosen instead of using only the module of the components, enhancing the detection sensibility.
Under healthy conditions, there are no characteristic harmonics; so, the geometric loci are near the origin. Ideally, it should be located in the origin, but machines have intrinsic imbalance and non-fundamental harmonics [
21]; therefore, the components have near zero value. When a turn fault occurs, there are harmonics and each geometric locus moves farther from the origin. This behavior is used to detect the fault occurrence: the Normal Operation Regions (NORs) are delimited and, when the geometric locus of a component moves off its respective NOR, a trip variable is activated.
Different shapes can be used to delimit the NOR for a component
, and the circumference is used here. For a given NOR
with radius
and center defined by coordinates
and
, the respective trip variable (
) is calculated as in (
28).
The NOR settings may be made empirically to meet the respective WRSG characteristics and cover the normal operation changes in the system. The procedure for setting the NOR using the experimental data is described in the following section. The precise machine and converter simulation can be performed using the equations presented in
Section 2.1, sparing the need for the experimental data for the NOR settings.
6. Setting and Evaluation
The proposed fault detection method was evaluated in this section using data gathered from the experimental setup described in
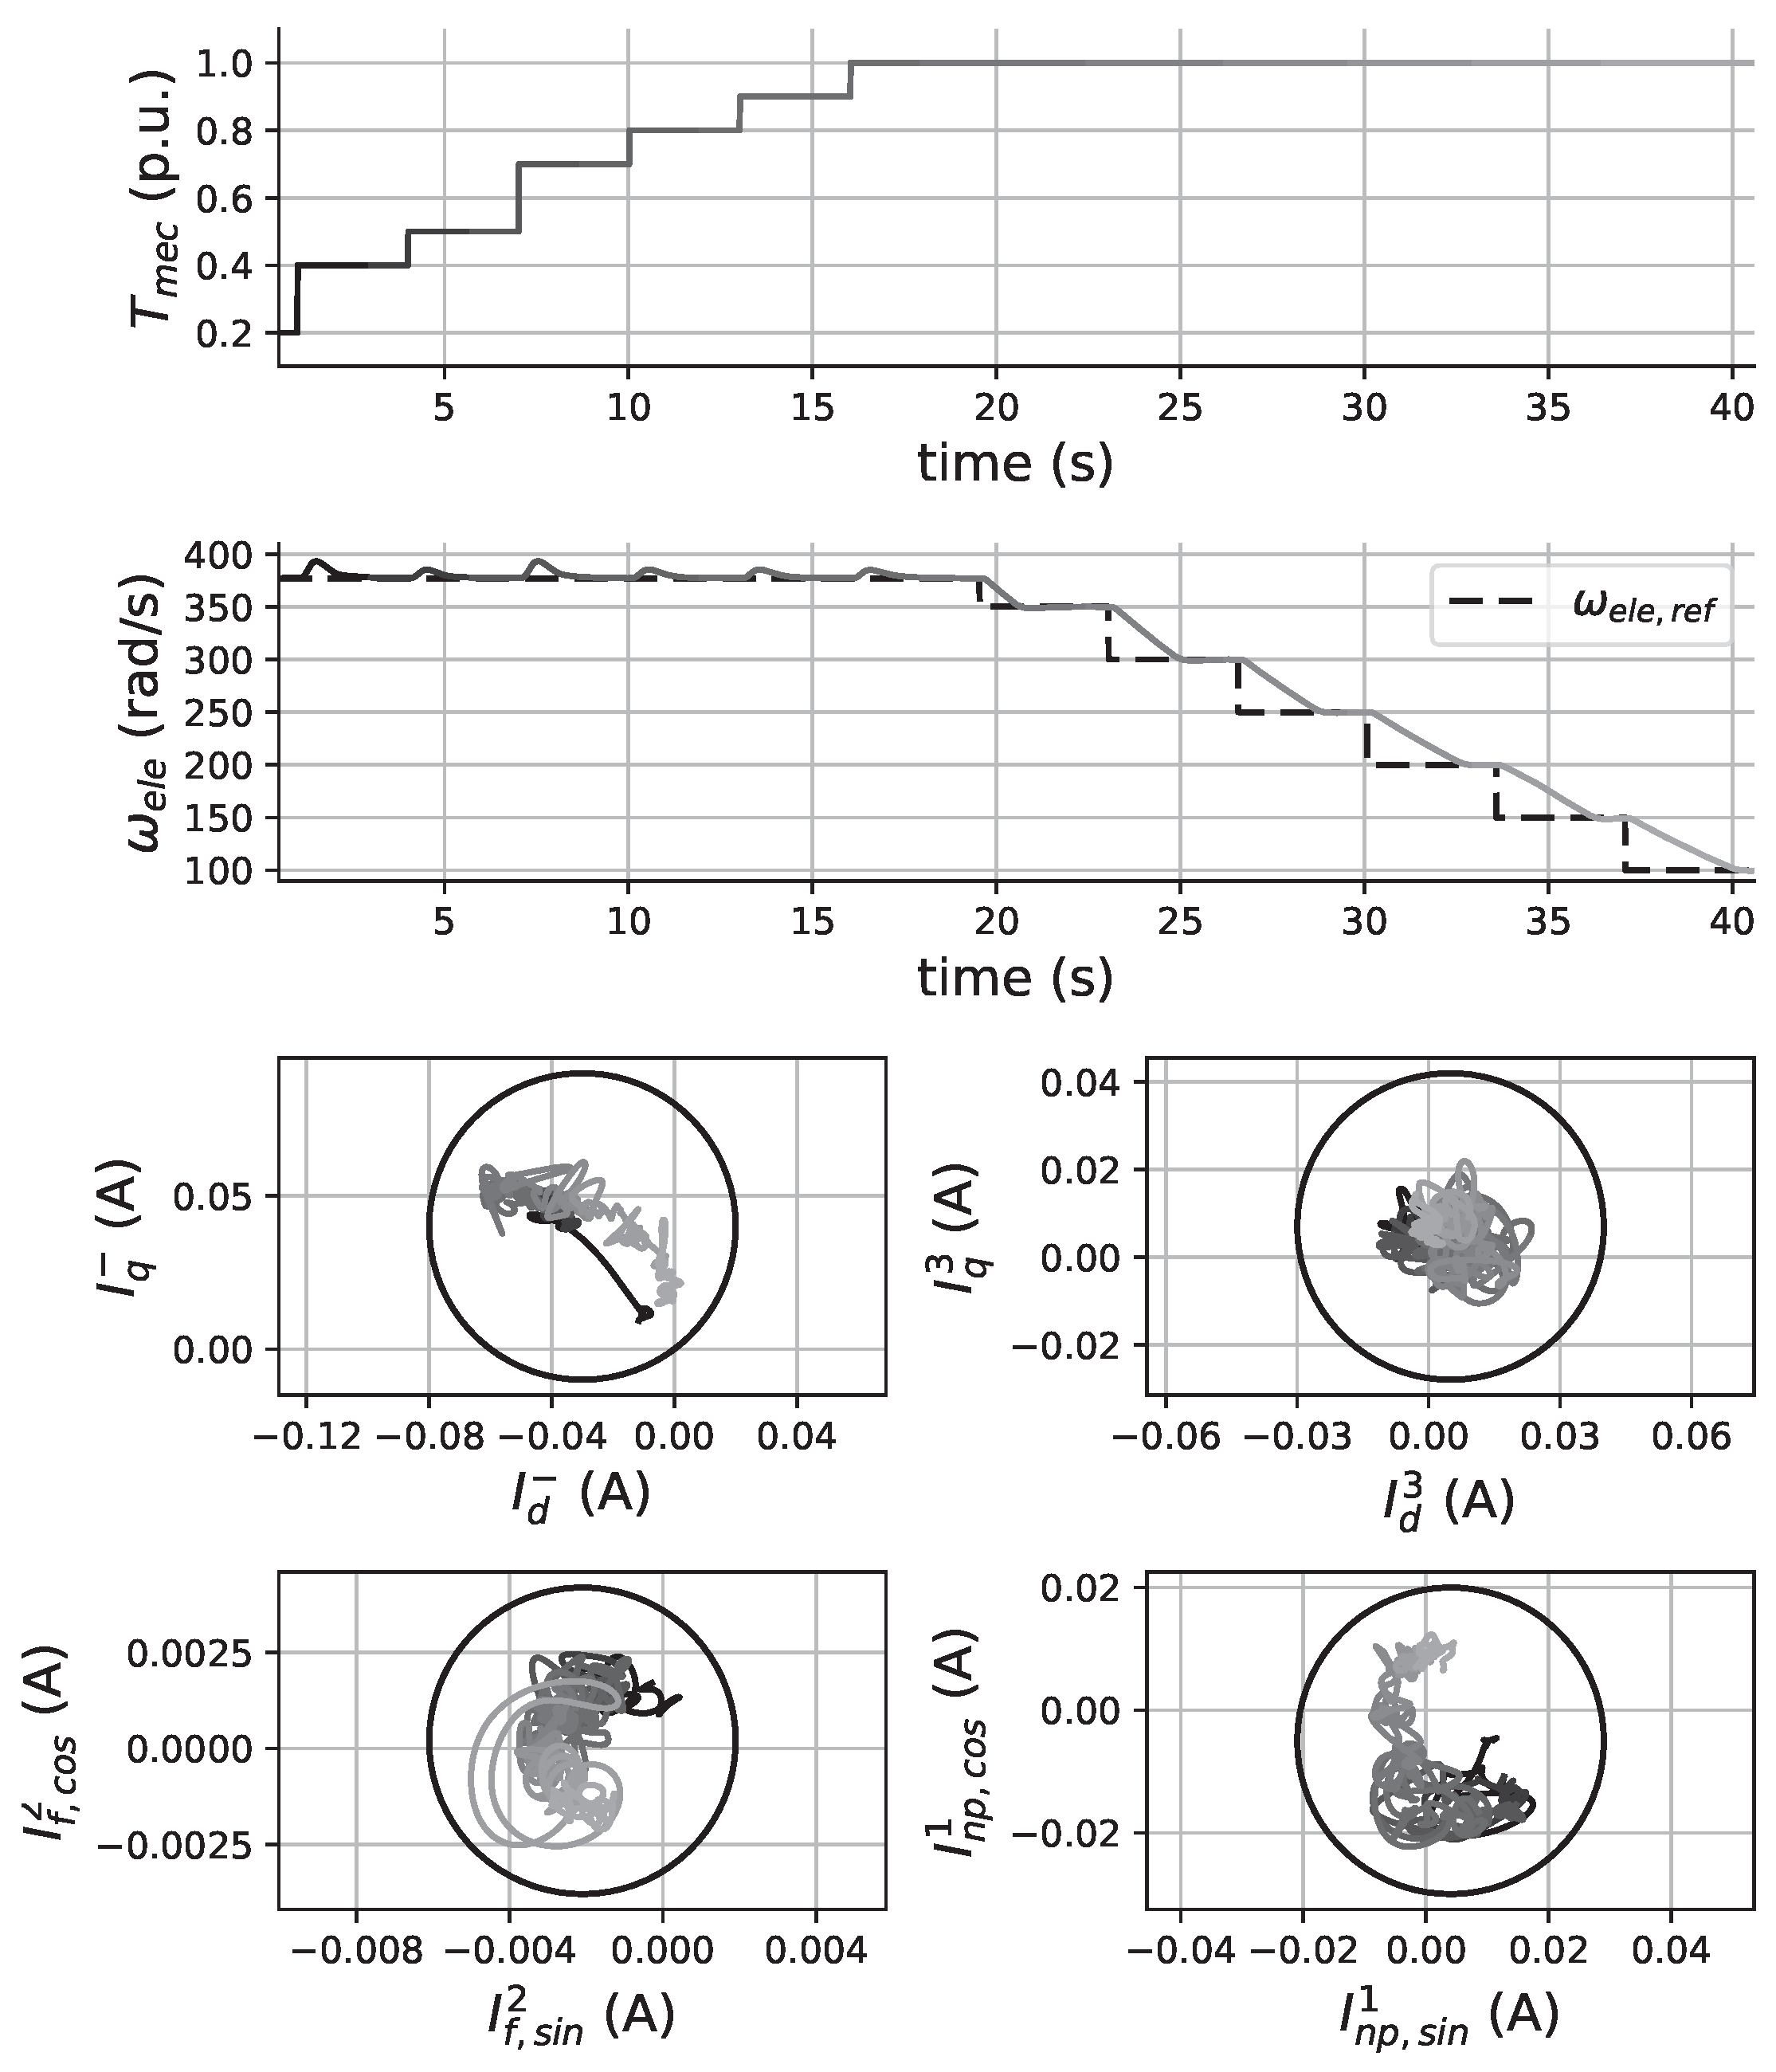
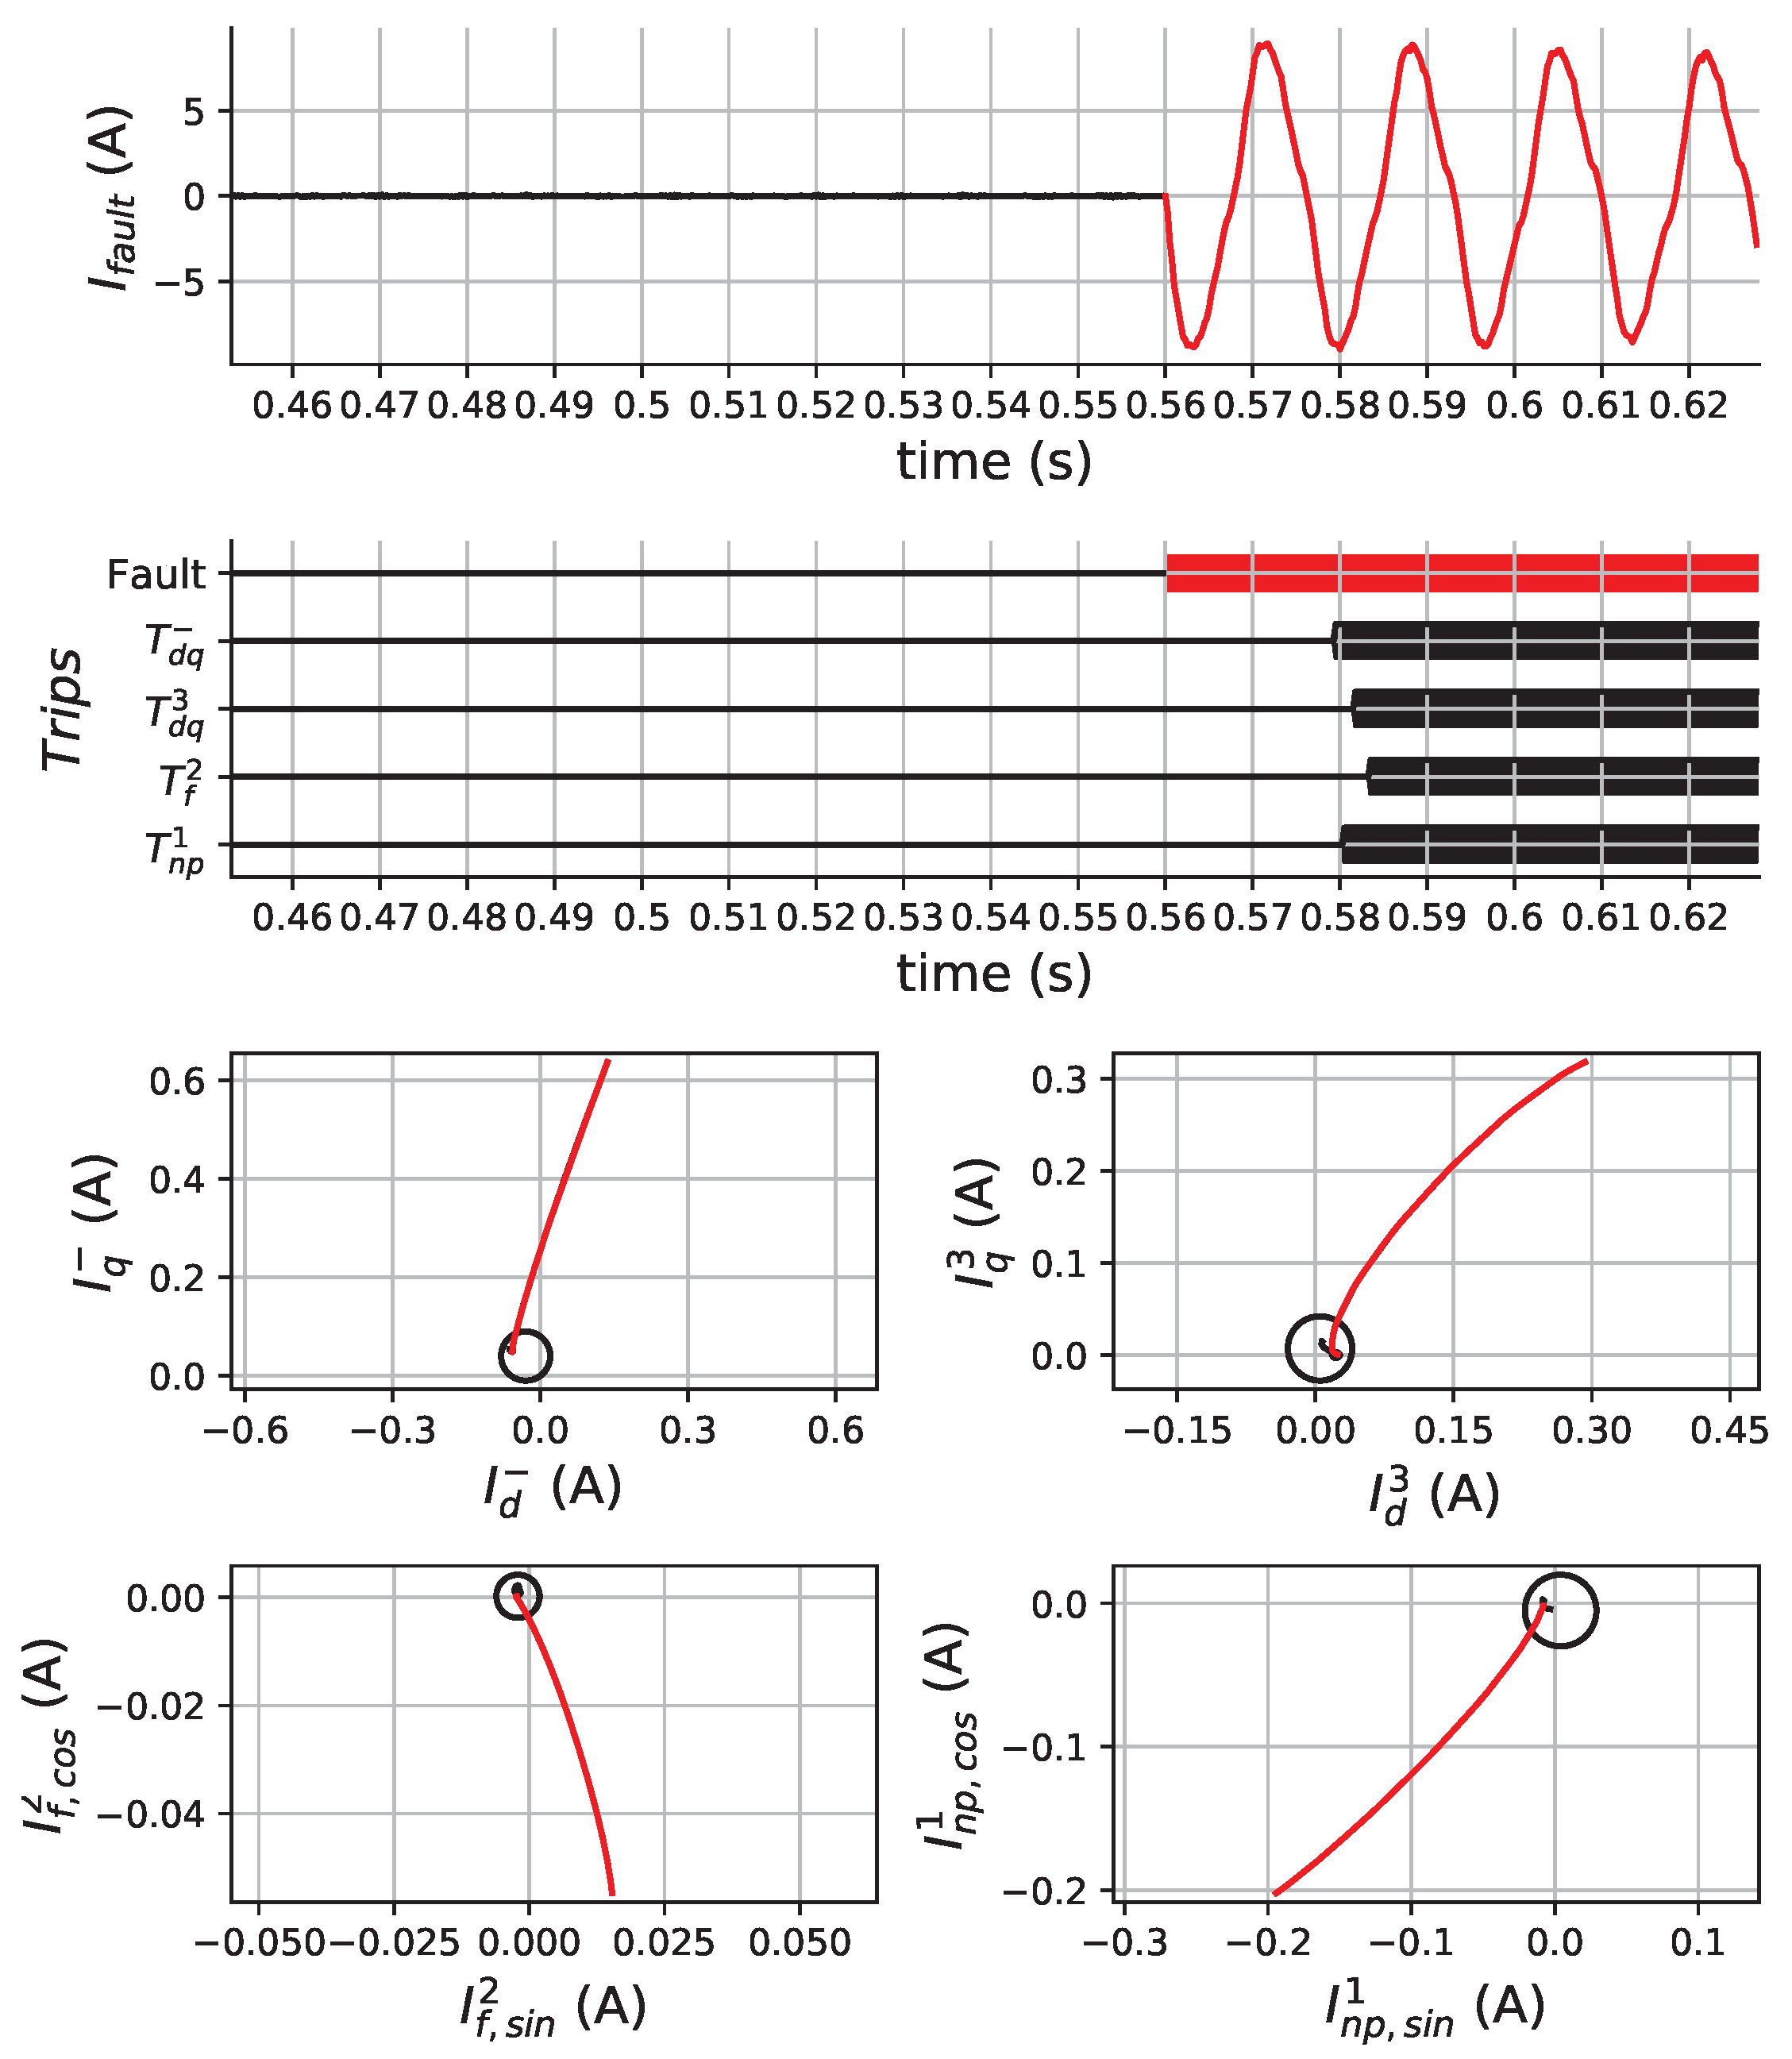
Section 4. Firstly, the NOR were defined for the healthy WRSG by varying the operating point and monitoring the geometric locus route of each component during the variations, as illustrated in
Figure 12.
Table 2 summarizes the NOR settings obtained using the experimental setup. This procedure may be performed offline using simulations of the machine if empirical data are not available.
Figure 13 illustrates the operation of the proposed method using the NOR settings in
Table 2. Under healthy conditions, with the generator operating at
A, the geometric locus of each component remains inside its respective limited region (NOR). Then, an IB fault is applied using taps D10 and D23 (
Figure 9 shows their location) and the geometric loci of all the components move outside the NOR.
During the variations under healthy conditions, there is no trip variable activated, as the geometric loci remained inside the NOR; however, when there is an IB fault, they all leave the respective NOR and all the trip variables are activated. In this case, it is observed that approximately 24 ms is required for activation of the trip variables.
7. Sensitivity Analysis
The sensitivity analysis was performed using experimental data in order to incorporate the influence of noise found in real equipment operation; the Signal-to-Noise Ratio (SNR) verified for the measurements is
. Some fault cases were defined to evaluate these variables for faults in different locations and involving different portions of the stator winding, which are listed in
Table 3. For most of them, the WRSG operated at
A and
rad/s to establish the same conditions for comparison. Seven cases with off-nominal speeds were included to evaluate the performance in different operation points. Resistors were used to limit the fault current close to the WRSG nominal current to avoid winding damages.
In order to facilitate the evaluation for different cases and avoid using many figures to illustrate each one, the maximum values reached by the geometric loci of the currents in the presented cases is used. The maximum value found for a given component
is normalized in relation to its respective NOR (
) radius according to (
29).
Table 4 summarizes the results obtained for all cases described in
Table 3. The higher the value, the greater the displacement of geometric locus and the more severe the fault can be considered. Values smaller than the unit indicate that the locus remained within the NOR and there is no activation of the respective trip variable.
The maximum displacements occurred in the first case, reaching more than 10 times the radius in all variables, while the minimum occurred in cases 7 to 10, in which most variables had displacement of less than one radius, which means they remained within the defined circumference. In cases 2 and 3, the displacements are around two and three times the radius, respectively.
In cases 4 and 5, the fault conditions are similar to case 3, i.e., IT faults that involve about 1/8 of a branch with the same fault resistance. In these cases, the geometric path reached up to 2.41 radius in the fifth case.
Fault conditions of cases 6 and 12 are similar to the first: they are IB faults in phase a but the results are different due to the fault resistance and taps involved. Thus, the displacement in relation to the normal region is smaller for case 6, which involves taps located close to the neutral. In cases 1 and 12, the taps are closer to the phase terminal and larger displacements are verified.
The PTP fault in case 11 is the second most severe, where the points moved further away from the defined region, reaching 7 to 10 radius. For cases 7 to 10, in which the faults are IT involving 7.4% of a branch of a phase, the maximum point reached is 1.59 radius.
Cases 14 to 16 indicate that different operating points lead to changes in the maximum geometric loci achieved during the fault. Despite these changes, the method used here is able to isolate the desired harmonics of all the considered currents and detect the faults in these conditions.
Less severe IB and PTP faults were defined in cases 17 to 20. It can be noted that the fault is detected in most cases, except for the faults applied with low speed (150 rad/s).
8. Activation Times
After evaluating the excursion of the geometric locus, which indicates if the respective trip variable activates, the time required to detect each fault case is analyzed.
Table 5 summarizes the activation times obtained for the cases considered. The values were calculated by subtracting the time instant in which the variables
change to 1 from the time instant the fault is applied.
Figure 13, for example, illustrates the time required for the proposed method to detect the fault in Case 1 given in
Table 3.
By comparing the results presented in
Table 4 and
Table 5, it can be observed that the activation time is related to the maximum geometric locus displacement during the fault. Fault cases that cause larger geometric locus displacement are detected more quickly than the ones with shorter displacement. Furthermore, if the components do not leave the NOR, there is no activation, which is represented by ∞ in
Table 5.
The quickest activation is verified in the first case, around 24 ms for components and , ms for and ms for . In this case, the geometric locus of each component displaced more than 10× the radius of the respective NOR; thus, they moved off the NOR more quickly than verified in cases with shorter displacement. For cases with displacement close to the NOR radius, the activation time was higher than 100 ms.
Therefore, the activation of the trip variables has an intrinsic inverse time behavior because faults that move the components further from the NOR are identified faster than the ones that do not. The results presented here also show that these trip variables may be combined to ensure proper detection of fault cases.
Improvements can be made in the NOR setting to make the method more sensitive and enable fault detection of cases in which the trip variables do not activate with the shape and size used here. Nevertheless, increasing the sensitivity may lead to improper activation while normal operating conditions change. Furthermore, other types of filters may be evaluated to improve the overall operation of the proposed technique.
9. Selectivity Analysis
One of the aspects that needs to be evaluated is the selectivity for internal and external faults. The protection of the variable-speed machine may be divided into zones: Zone 1 is related to faults on the AC side of the grid-connected converter; Zone 2 to faults on the DC link; and Zone 3 on the AC side of the generator connected converter, including faults inside the generator [
38]. In order to guarantee the selectivity, the aforementioned variables should stay within the NOR for faults in Zones 1 and 2. If the variables do not show intrinsic selectivity, a blocking logic or time coordination method must be applied.
Zone 2 faults lead to sag and generator acceleration. These faults should be detected by specific protection devices and are not within the scope of this paper. Zone 1 faults may involve one, two or three phases and the ground; the asymmetric ones cause negative and zero sequence currents on the AC side, which lead to active power and oscillations with second harmonic content.
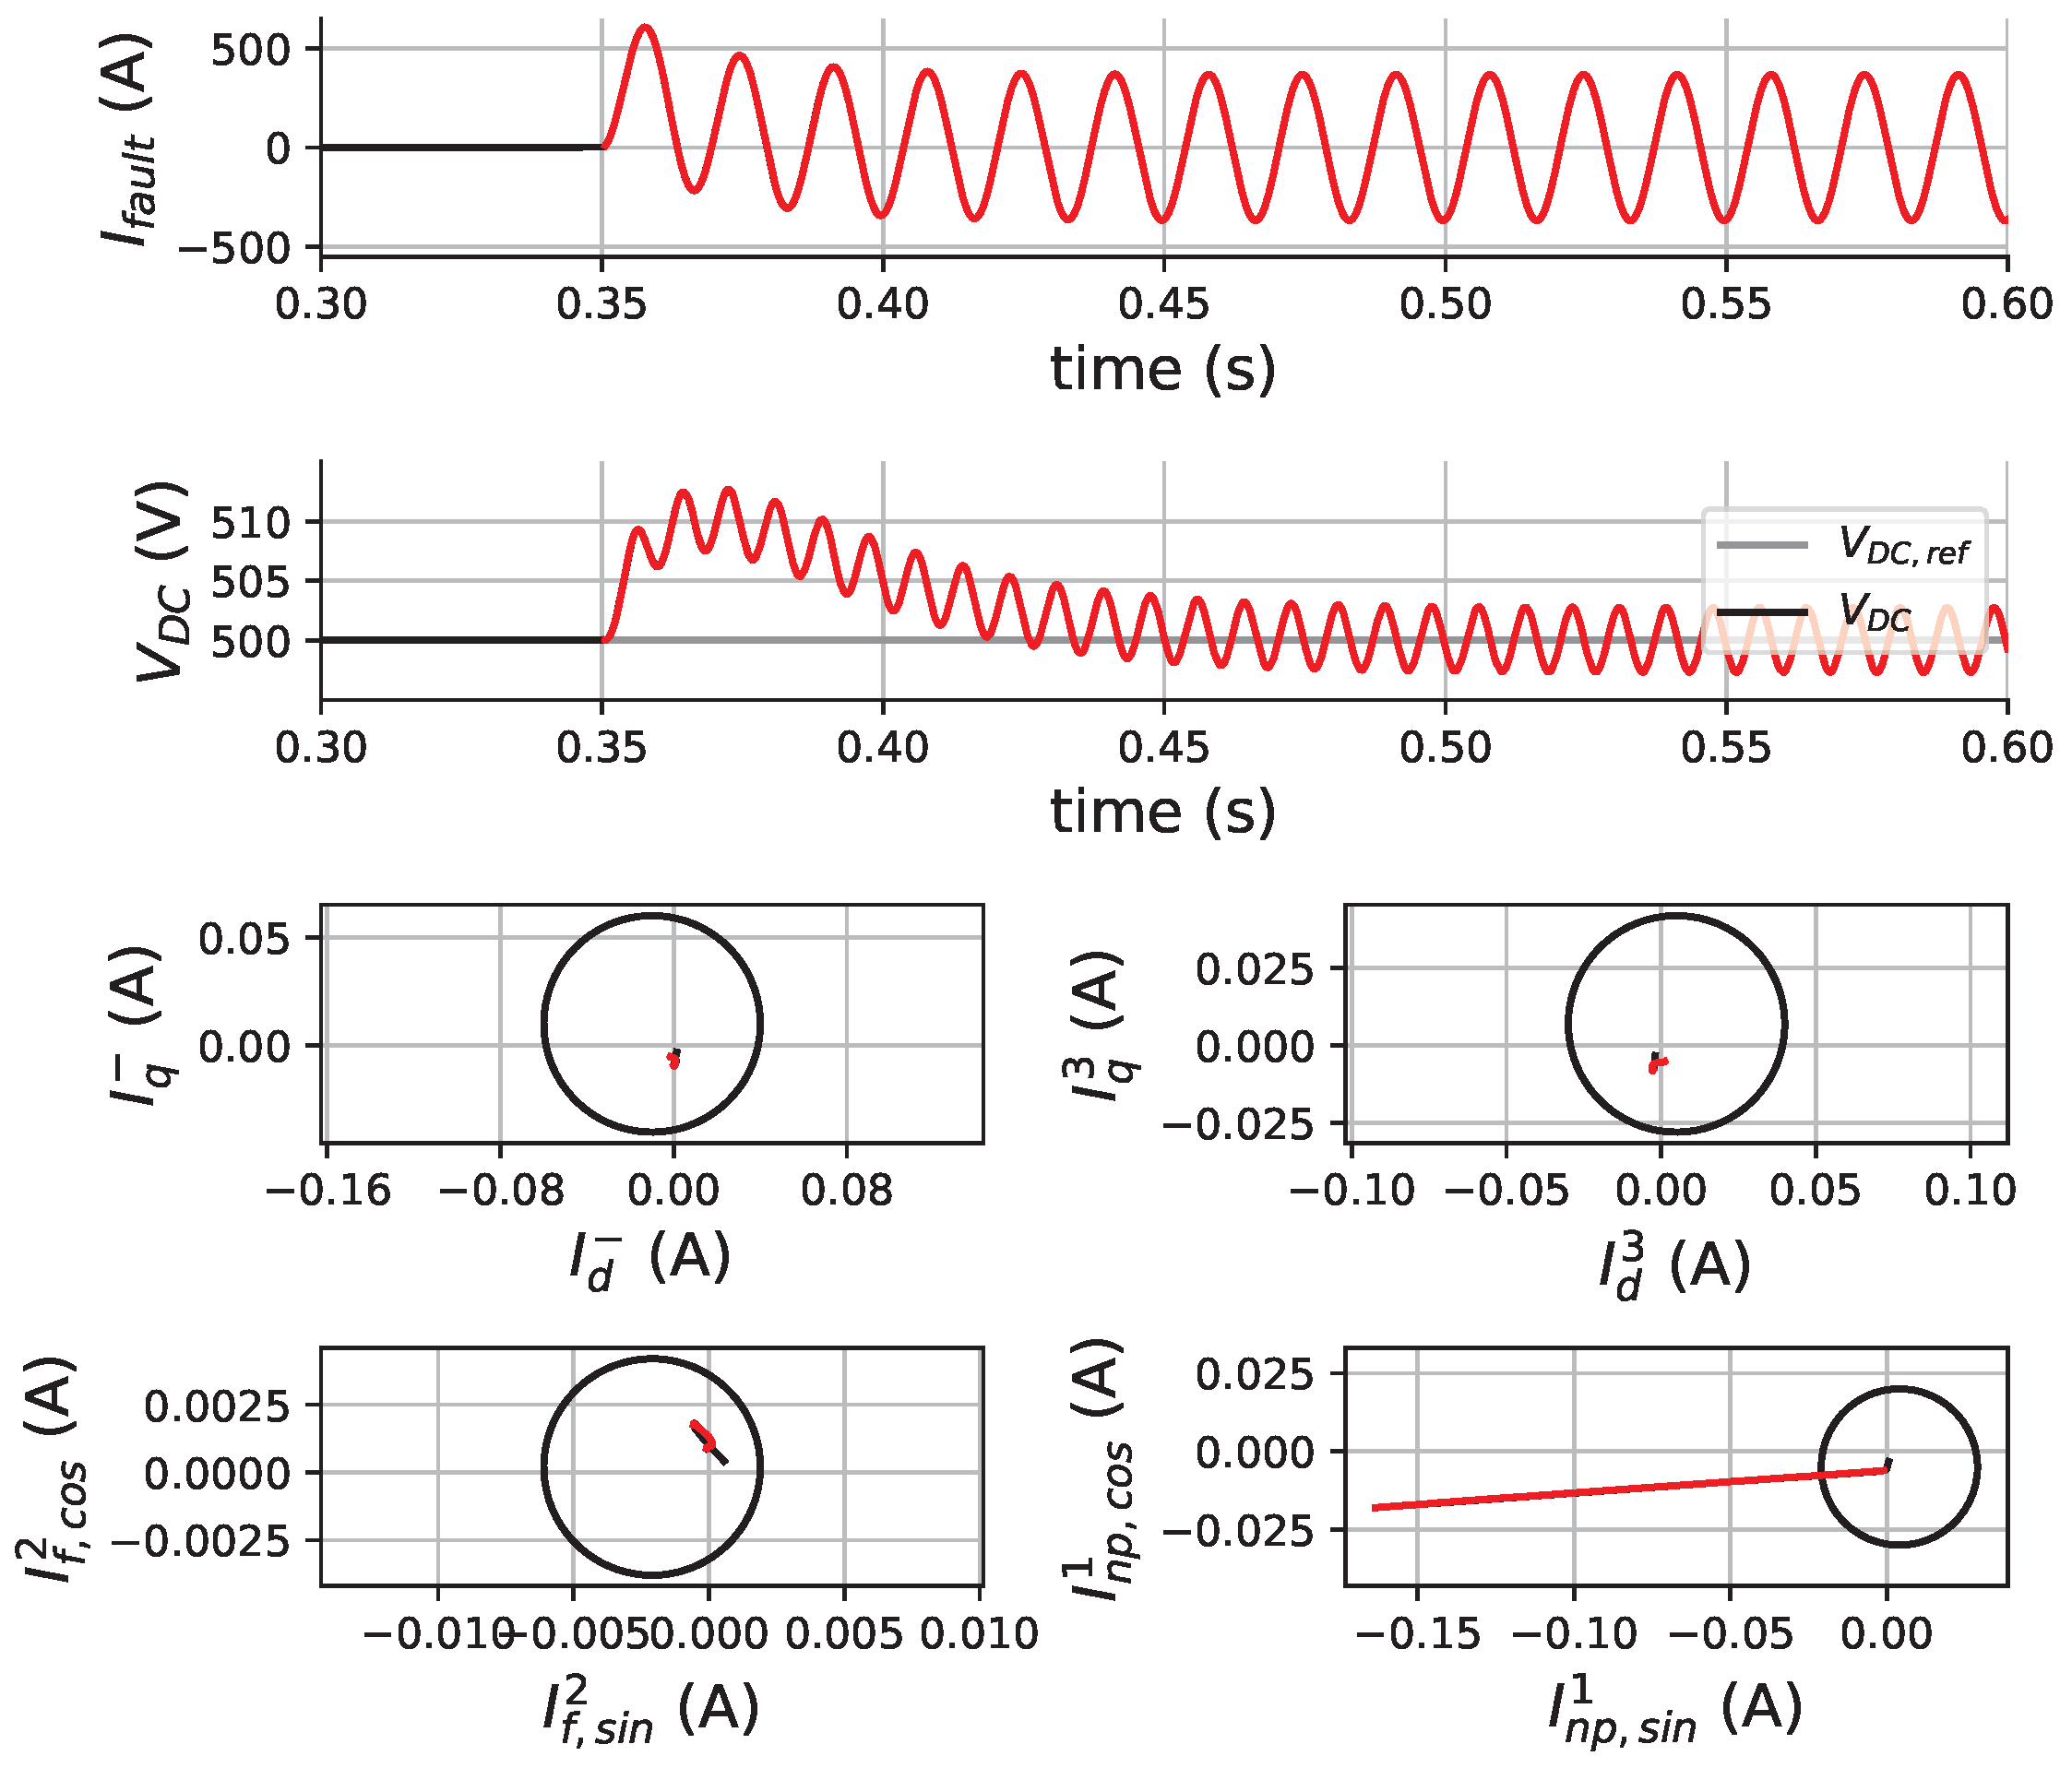
This section presents a simulation-based analysis of the variables behavior under
oscillation caused by a phase fault in the grid.
Figure 14 illustrates the
considered for the test and each variable response. The same generator and converters used in
Section 3 are considered.
It can be observed that the oscillation does not affect the
and
variables. However, as described in
Section 2.1,
is directly related to the
(
and
), so the
oscillation impacts it; therefore, this variable is not selective. Improper activation during Zone 1 events may be blocked if
oscillation is detected or if a specific Zone 1 protection device is activated.
It is important to emphasize that Zone 1 faults should be detected and mitigated by specific protection devices [
38], which are not within the scope of this paper.
10. Robustness to Sensor Loss and Noises
The proposed technique depends directly on the integrity of the current measurements. Therefore, sensor loss will cause improper actuation of the trip variables. For example, if the phase a sensor is lost, the currents are imbalanced and the variable is activated; is not activated because the real currents are balanced. Moreover, distortions on the sensors would affect and . It is important to emphasize that the measurements used for fault detection are the same as those used for controlling purposes, which also depend on measurement integrity.
Regarding the effects of noise, the proposed algorithm was tested using an experimental setup in which the SNR verified for the measurements is . Therefore, the method tolerates noise but smaller SNR values may cause improper activation of the trip variables.
11. Evaluation on a Simulated 4.5 MW WRSG
An WRSG was simulated in order to evaluate the feasibility of the variables to detect stator winding faults, especially for high-power applications. Therefore, the machine described in [
39] was used—a
MW WRSG with ten poles, 6 kV of nominal voltage, 50 Hz of nominal frequency and 295 A of nominal field current. This machine has one branch per phase; so, only IT and PTP faults may occur. An IT fault involving one of the coils of phase
a was defined, where
was considered to avoid numerical instability. The generator, 3LNPC and control loops were simulated using the equations presented in
Section 2.1. The NOR setting was performed via simulation, following the procedure described in
Section 6.
Table 6 summarizes the NOR settings.
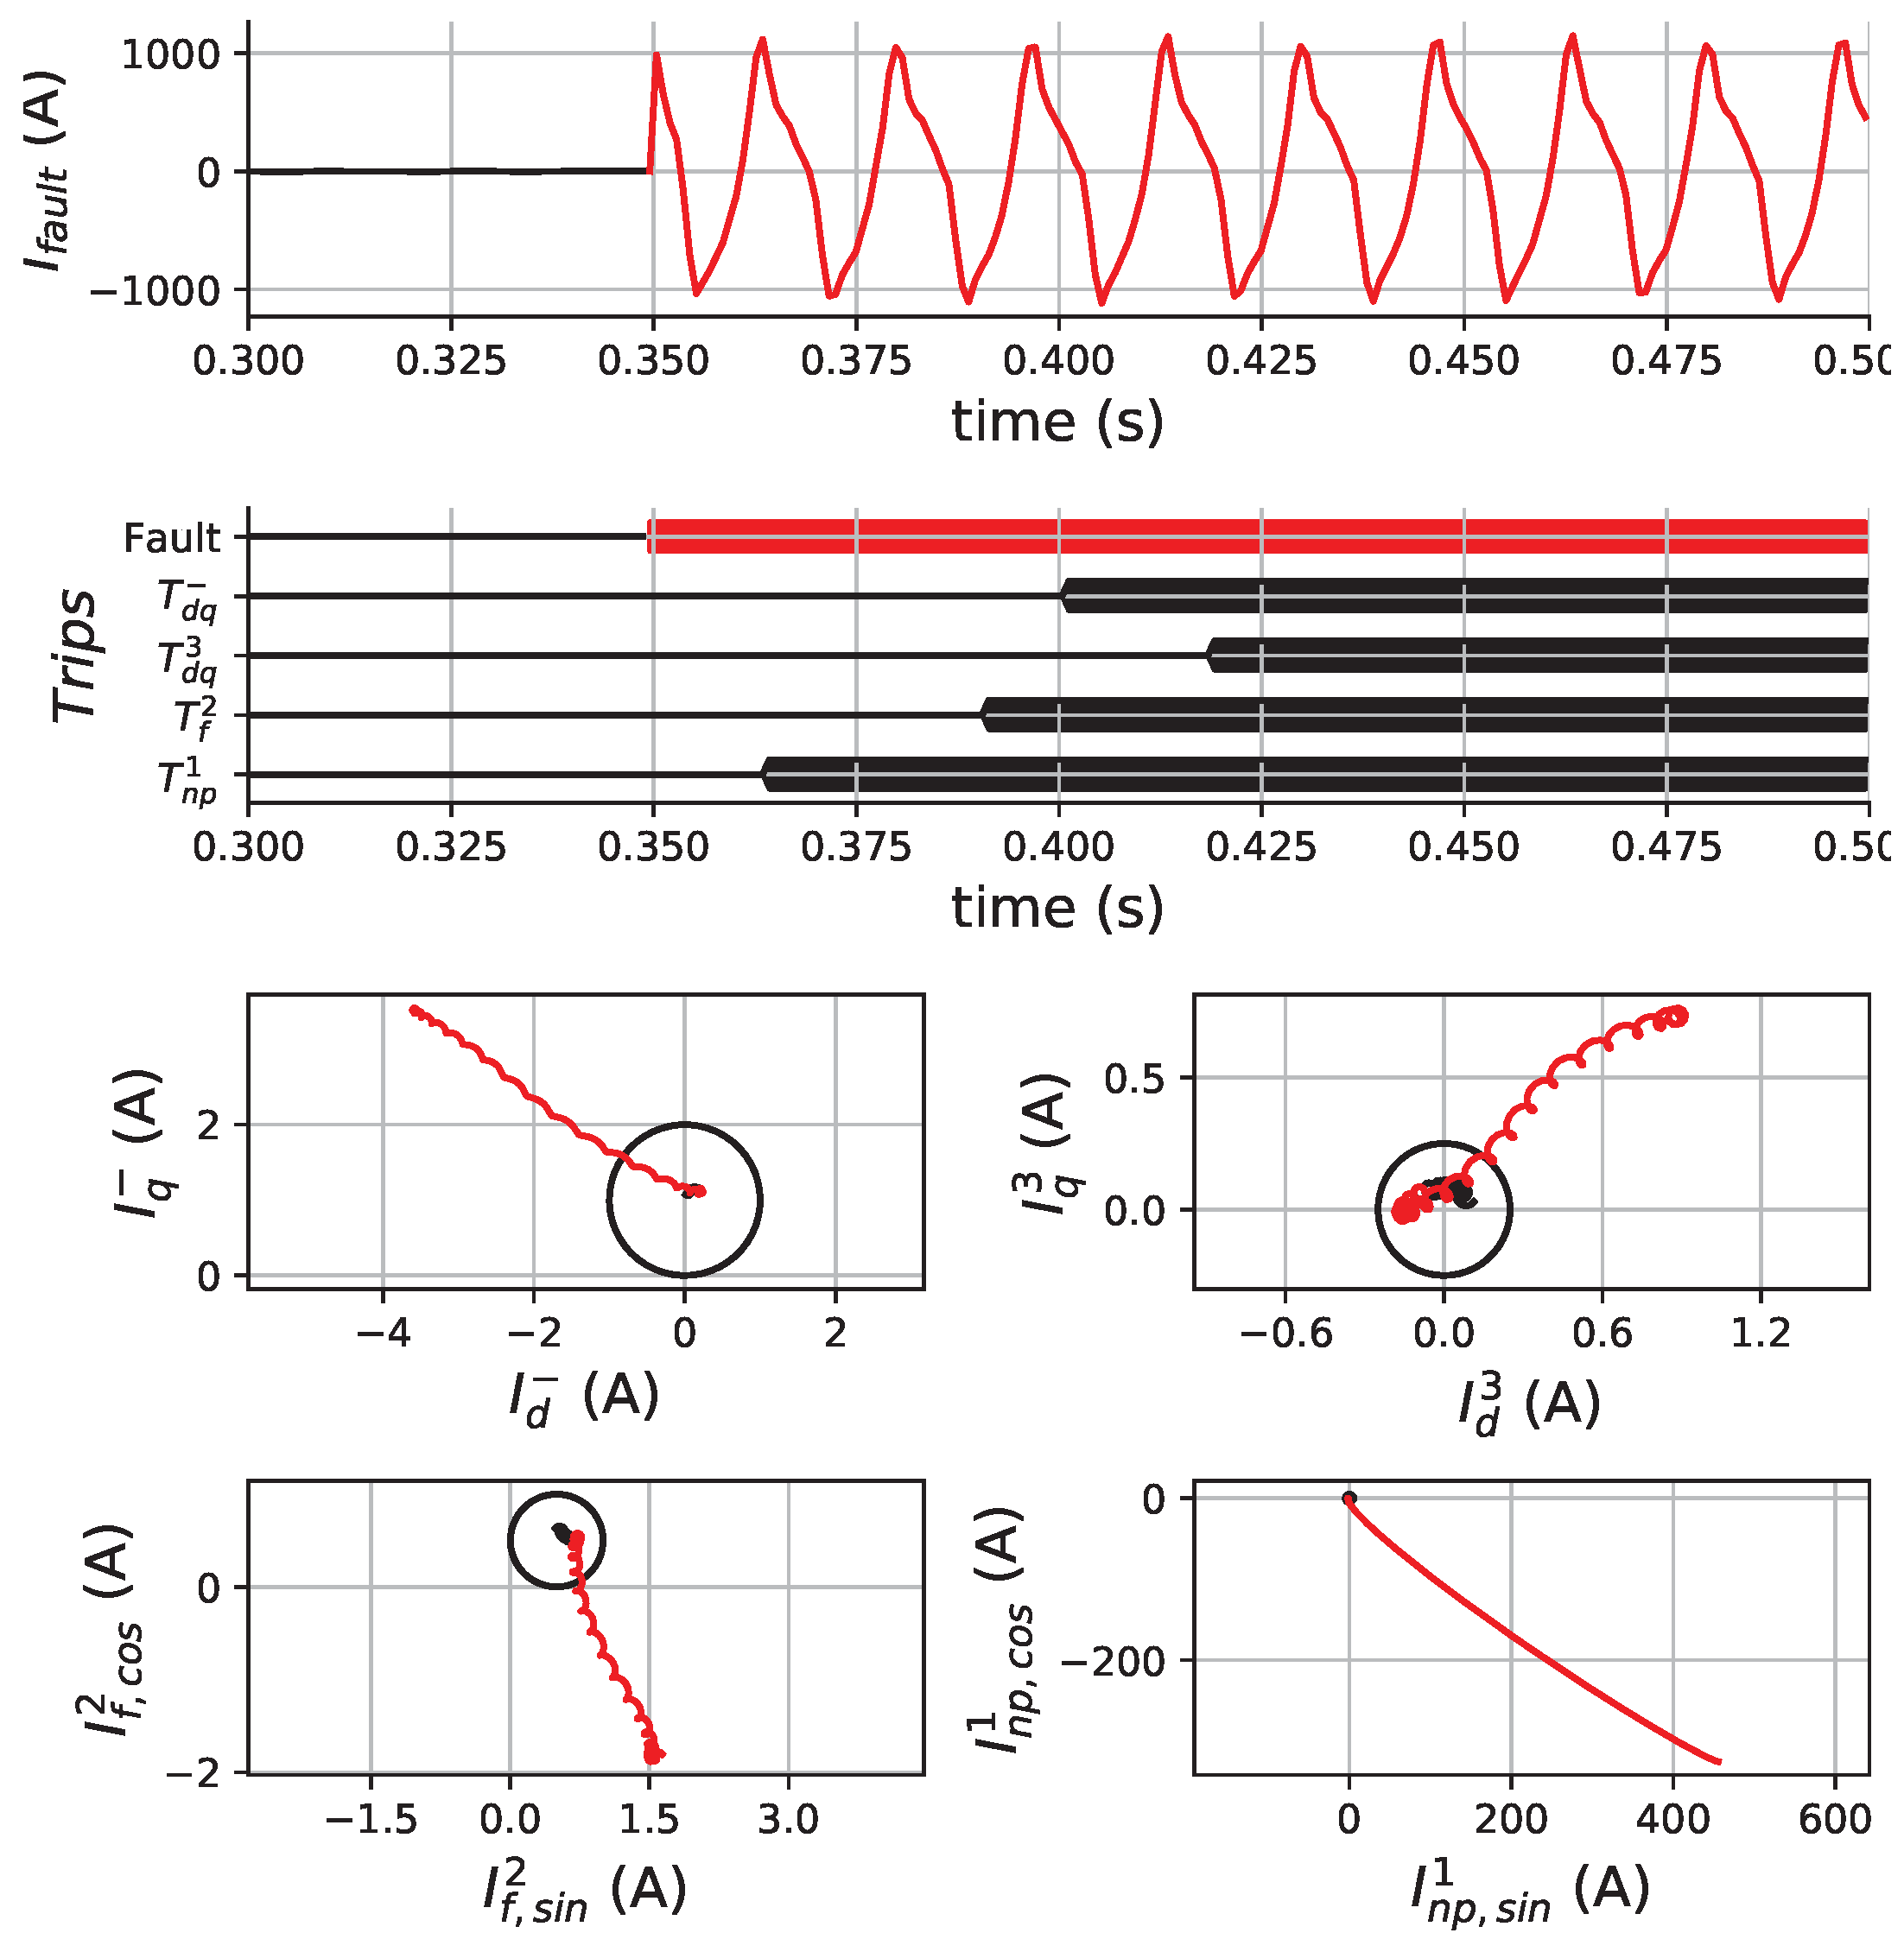
Figure 15 illustrates the result of the simulation and the fault detection technique for an IT fault in phase
a. It is noted that, without the fault occurrence, the variables remain inside the NOR and, when there is a fault, they move outside the NOR, tripping the fault indication. For this fault case, the activation times varied between 15 ms and 50 ms, where
was the fastest and
the slowest. Therefore, the harmonics verified during faults between turns in the WRSG used on the experimental setup also occur in larger machines and can be monitored using the proposed technique.
In addition to the IT fault case illustrated in
Figure 15, the five fault cases presented in
Table 7 were used to evaluate sensitivity and activation times. In
Table 7, Dxx and Dyy denote the position of turns involved in the fault. This is different from the experimental setup as there are no discrete taps; thus, the percentage of the respective winding is used to describe its location.
was considered for all the cases.
The maximum value found for a given component
was calculated for each fault case using (
29). The results are summarized in
Table 8. The highest values were verified for the
for all the cases considered in
Table 7. It is noted that the values of all the variables are greater than one, which means that the fault is detected. The maximum values depend on the speed of the WRSG.
The activation times for the same fault cases are presented in
Table 9. It can be observed that the faults were detected by the four variables and the times varied between 10 and 40 ms.
12. Conclusions
This paper presented an analysis of some current harmonic components as indicators of faults between stator winding turns of a variable-speed WRSG and described an algorithm for filtering these components under variable speeds and detecting the fault. A WRSG controlled by a back-to-back VSC converter was considered and the described approach evaluated with simulations, real converters and a generator. The results of the previous sections show that the filtering and detection algorithms are able to operate under different operation conditions and identify most of the fault types considered. As found in other methods proposed in the literature, there are faults that are not detected. Overall, faults involving more than 5% of the winding are detected by all the components studied.
Spectral analysis of the NPC neutral current when there is an internal fault in the machine is not documented in the literature. The cases presented here show that if this current is measured, its fundamental frequency component is able to detect faults in the machine. However, this variable is not selective.
Using these components to classify and locate the fault requires further analysis of the arrangement of the machine stator winding, as it defines the inductance (hence, the coupling) between the faulted winding and the healthy.
As future work, we suggest the following: studies to evaluate the use of geometric loci trajectory for fault classification and location; adaptation of the method described in this paper for multi-phase machines; evaluation of dynamic setting of the normal operation region in order to improve the sensitivity of the technique; evaluation of different types of filters to isolate the selected components; combining the proposed method with artificial intelligence techniques to improve fault detection and classification. Furthermore, comparative studies between traditional protection devices and current signature analysis may be performed.
Author Contributions
Conceptualization, R.V.R. and R.M.M.; methodology, R.V.R.; software, R.V.R.; validation, R.V.R.; formal analysis, R.V.R. and R.M.M.; investigation, R.V.R.; resources, R.V.R. and R.M.M.; data curation, R.V.R.; writing—original draft preparation, R.V.R.; writing—review and editing, R.V.R. and R.M.M.; visualization, R.V.R. and R.M.M.; supervision, R.M.M.; project administration, R.M.M.; funding acquisition, R.V.R. and R.M.M. All authors have read and agreed to the published version of the manuscript.
Funding
This research was funded by São Paulo Research Foundation (FAPESP) under grant number 2017/09554-0 and National Council for Scientific and Technological Development (CNPq) under grant number 407723/2021-8.
Data Availability Statement
The data presented in this study are available on request from the corresponding author. The data are not publicly available because they will be used to elaborate the reports of the projects mentioned in “Funding”.
Acknowledgments
This work could not be developed without the physical structure provided by the EPUSP (Polytechnic School of the University of São Paulo) and financial funding from FAPESP (São Paulo Research Foundation), CAPES (Coordination for the Improvement of Higher Education Personnel) and CNPq (National Council for Scientific and Technological Development).
Conflicts of Interest
The authors declare no conflict of interest. The funders had no role in the design of the study; in the collection, analyses, or interpretation of data; in the writing of the manuscript; or in the decision to publish the results.
References
- Boldea, I. Electric Generators and Motors: An Overview. CES Trans. Electr. Mach. Syst. 2017, 1, 3–14. [Google Scholar] [CrossRef]
- Hasan, N.S.; Rosmin, N.; Osman, D.A.A.; Musta’amal Jamal, A.H. Reviews on multilevel converter and modulation techniques. Renew. Sustain. Energy Rev. 2017, 80, 163–174. [Google Scholar] [CrossRef]
- Zhang, Z.; Wang, F.; Wang, J.; Rodríguez, J.; Kennel, R. Nonlinear Direct Control for Three-Level NPC Back-to-Back Converter PMSG Wind Turbine Systems: Experimental Assessment with FPGA. IEEE Trans. Ind. Inform. 2017, 13, 1172–1183. [Google Scholar] [CrossRef]
- Gontijo, G.F.; Bakhshizadeh, M.K.; Kocewiak, L.H.; Teodorescu, R. State Space Modeling of an Offshore Wind Power Plant With an MMC-HVDC Connection for an Eigenvalue-Based Stability Analysis. IEEE Access 2022, 10, 82844–82869. [Google Scholar] [CrossRef]
- Bogdan, V.; Adrian, M.; Ionut, N.; Adrian-Cosmin, P.; Mihai-Catalin, D. Comparative Analysis of Two Permanent Magnet Fractional Slots Synchronous Generators with Different Number of Phases: 15 slots/16 magnets three-phase generator to 15 slots/18 magnets five-phase generator. In Proceedings of the 2020 International Conference and Exposition on Electrical and Power Engineering (EPE), Iasi, Romania, 22–23 October 2020; pp. 525–529. [Google Scholar] [CrossRef]
- Kumar, R.R.; Devi, P.; Chetri, C.; Vardhan, A.S.S.; Elavarasan, R.M.; Mihet-Popa, L.; Saket, R.K. Design and Characteristics Investigation of Novel Dual Stator Pseudo-Pole Five-Phase Permanent Magnet Synchronous Generator for Wind Power Application. IEEE Access 2020, 8, 175788–175804. [Google Scholar] [CrossRef]
- Riera-Guasp, M.; Antonino-Daviu, J.A.; Capolino, G.A. Advances in electrical machine, power electronic, and drive condition monitoring and fault detection: State of the art. IEEE Trans. Ind. Electron. 2015, 62, 1746–1759. [Google Scholar] [CrossRef]
- Salameh, J.P.; Cauet, S.; Etien, E.; Sakout, A.; Rambault, L. Gearbox condition monitoring in wind turbines: A review. Mech. Syst. Signal Process. 2018, 111, 251–264. [Google Scholar] [CrossRef]
- Singh, G.; Sundaram, K.; Matuonto, M. A solution to reduce overheating and increase wind turbine systems availability. Wind Eng. 2021, 45, 491–504. [Google Scholar] [CrossRef]
- Monaro, R.M.H.; Vieira, J.C.; Coury, D.V.; Malik, O.P. Experimental platform for controlled faults on synchronous generator armature windings. IEEE Trans. Energy Convers. 2012, 27, 948–957. [Google Scholar] [CrossRef]
- Capolino, G.A.; Antonino-Daviu, J.A.; Riera-Guasp, M. Modern diagnostics techniques for electrical machines, power electronics, and drives. IEEE Trans. Ind. Electron. 2015, 62, 1738–1745. [Google Scholar] [CrossRef]
- Allafi, I.M.; Foster, S.N. Condition Monitoring Accuracy in Inverter-Driven Permanent Magnet Synchronous Machines Based on Motor Voltage Signature Analysis. Energies 2023, 16, 1477. [Google Scholar] [CrossRef]
- Gandhi, A.; Corrigan, T.; Parsa, L. Recent advances in modeling and online detection of stator interturn faults in electrical motors. IEEE Trans. Ind. Electron. 2011, 58, 1564–1575. [Google Scholar] [CrossRef]
- Orlowska-Kowalska, T.; Wolkiewicz, M.; Pietrzak, P.; Skowron, M.; Ewert, P.; Tarchala, G.; Krzysztofiak, M.; Kowalski, C.T. Fault Diagnosis and Fault-Tolerant Control of PMSM Drives-State of the Art and Future Challenges. IEEE Access 2022, 10, 59979–60024. [Google Scholar] [CrossRef]
- Bataglioli, R.P.; Monaro, R.M.; Coury, D.V. Differential protection for stator ground faults in a full-converter wind turbine generator. Electr. Power Syst. Res. 2019, 169, 195–205. [Google Scholar] [CrossRef]
- He, S.; Shen, X.; Jiang, Z. Detection and Location of Stator Winding Interturn Fault at Different Slots of DFIG. IEEE Access 2019, 7, 89342–89353. [Google Scholar] [CrossRef]
- IEEE C37.102; IEEE Guide for AC Generator Protection. IEEE: Piscataway, NJ, USA, 2006.
- Huang, S.; Bi, Z.; Sun, Z.; Aggarwal, A.; Huang, X.; Wu, L.; Niu, F. Detection of Stator Winding Faults in PMSMs Based on Second Harmonics of Phase Instantaneous Reactive Powers. Energies 2022, 15, 3248. [Google Scholar] [CrossRef]
- Pietrzak, P.; Wolkiewicz, M. Comparison of selected methods for the stator winding condition monitoring of a pmsm using the stator phase currents. Energies 2021, 14, 1630. [Google Scholar] [CrossRef]
- Cruz, S.; Cardoso, A. Multiple reference frames theory: A new method for the diagnosis of stator faults in three-phase induction motors. IEEE Trans. Energy Convers. 2005, 20, 611–619. [Google Scholar] [CrossRef]
- Nadarajan, S.; Panda, S.K.; Bhangu, B.; Gupta, A.K. Hybrid Model for Wound-Rotor Synchronous Generator to Detect and Diagnose Turn-to-Turn Short-Circuit Fault in Stator Windings. IEEE Trans. Ind. Electron. 2015, 62, 1888–1900. [Google Scholar] [CrossRef]
- Neti, P.; Nandi, S. Stator interturn fault detection of synchronous machines using field current and rotor search-coil voltage signature analysis. IEEE Trans. Ind. Appl. 2009, 45, 911–920. [Google Scholar] [CrossRef]
- Gketsis, Z.E.; Zervakis, M.E.; Stavrakakis, G. Detection and classification of winding faults in windmill generators using Wavelet Transform and ANN. Electr. Power Syst. Res. 2009, 79, 1483–1494. [Google Scholar] [CrossRef]
- Jeong, H.; Moon, S.; Kim, S.W. An Early Stage Interturn Fault Diagnosis of PMSMs by Using Negative-Sequence Components. IEEE Trans. Ind. Electron. 2017, 64, 5701–5708. [Google Scholar] [CrossRef]
- Doorwar, A.; Bhalja, B.; Malik, O.P. A New Internal Fault Detection and Classification Technique for Synchronous Generator. IEEE Trans. Power Deliv. 2019, 34, 739–749. [Google Scholar] [CrossRef]
- Masoumi, Z.; Moaveni, B.; Gazafrudi, S.M.M.; Faiz, J. Online Model-Based Fault Detection of Synchronous Generators Using Residual Analysis. IEEE Access 2021, 9, 163697–163706. [Google Scholar] [CrossRef]
- Bouzid, M.B.K.; Champenois, G. An Efficient Simplified Physical Faulty Model of a Permanent Magnet Synchronous Generator Dedicated to Stator Fault Diagnosis Part II: Automatic Stator Fault Diagnosis. IEEE Trans. Ind. Appl. 2017, 53, 2762–2771. [Google Scholar] [CrossRef]
- El Sayed, W.; El Geliel, M.A.; Lotfy, A. Fault diagnosis of PMSG stator inter-turn fault using extended kalman filter and unscented kalman filter. Energies 2020, 13, 2972. [Google Scholar] [CrossRef]
- Wu, Y.; Jiang, B.; Wang, Y. Incipient winding fault detection and diagnosis for squirrel-cage induction motors equipped on CRH trains. ISA Trans. 2020, 99, 488–495. [Google Scholar] [CrossRef]
- Cheng, S.; Zhang, P.; Habetler, T.G. An Impedance Identification Approach to Sensitive Detection and Location of Stator Turn-to-Turn Faults in a Closed-Loop Multiple-Motor Drive. IEEE Trans. Ind. Electron. 2011, 58, 1545–1554. [Google Scholar] [CrossRef]
- Urresty, J.C.; Riba, J.R.; Romeral, L. Application of the zero-sequence voltage component to detect stator winding inter-turn faults in PMSMs. Electr. Power Syst. Res. 2012, 89, 38–44. [Google Scholar] [CrossRef]
- Yassa, N.; Rachek, M. Modeling and detecting the stator winding inter turn fault of permanent magnet synchronous motors using stator current signature analysis. Math. Comput. Simul. 2020, 167, 325–339. [Google Scholar] [CrossRef]
- Jun, E.S.; Nguyen, M.H.; Kwak, S.S. Model Predictive Control Method With NP Voltage Balance by Offset Voltage Injection for Three-Phase Three-Level NPC Inverter. IEEE Access 2020, 8, 172175–172195. [Google Scholar] [CrossRef]
- Muthumuni, D.D.S.; McLaren, P.G.; Dirks, E. Internal fault simulation in synchronous machines. Can. Conf. Electr. Comput. Eng. 2000, 2, 1202–1206. [Google Scholar] [CrossRef]
- Vaseghi, B.; Takorabet, N.; Nahid-Mobarakeh, B.; Meibody-Tabar, F. Modelling and study of PM machines with inter-turn fault dynamic model-FEM model. Electr. Power Syst. Res. 2011, 81, 1715–1722. [Google Scholar] [CrossRef]
- Reichmeider, P.P.; Querrey, D.; Gross, C.A.; Novosel, D.; Salon, S. Partitioning of Synchronous Machine Windings for Internal Fault Analysis. IEEE Trans. Energy Convers. 2001, 16, 384. [Google Scholar] [CrossRef]
- Quéval, L.; Ohsaki, H. Back-to-back converter design and control for synchronous generator-based wind turbines. In Proceedings of the 2012 International Conference on Renewable Energy Research and Applications (ICRERA), Nagasaki, Japan, 11–14 November 2012; pp. 1–6. [Google Scholar]
- IEEE Std 3004.8; IEEE Recommended Practice for Motor Protection in Industrial and Commercial Power Systems. IEEE: Piscataway, NJ, USA, 2016.
- Gozdowiak, A. Faulty synchronization of salient pole synchronous hydro generator. Energies 2020, 13, 5491. [Google Scholar] [CrossRef]
Figure 1.
Current measures considered for the WRSG connected to the 3LNPC VSC.
Figure 1.
Current measures considered for the WRSG connected to the 3LNPC VSC.
Figure 2.
Types of faults caused by short-circuits between turns in a three-phase multi-winding SG: interturn (IT), interbranch (IB) and phase-to-phase (PTP).
Figure 2.
Types of faults caused by short-circuits between turns in a three-phase multi-winding SG: interturn (IT), interbranch (IB) and phase-to-phase (PTP).
Figure 3.
Integration of the WRSG, 3LNPC and control models.
Figure 3.
Integration of the WRSG, 3LNPC and control models.
Figure 4.
Stator winding functions (), field winding function () and gap function (). Field winding and gap functions are described considering that the rotor position is in the axis of phase a.
Figure 4.
Stator winding functions (), field winding function () and gap function (). Field winding and gap functions are described considering that the rotor position is in the axis of phase a.
Figure 5.
Winding functions for the three fault types: , and .
Figure 5.
Winding functions for the three fault types: , and .
Figure 6.
Simulated , , , and under healthy condition, IT, IB and PTP faults. Fundamental frequency: 60 Hz.
Figure 6.
Simulated , , , and under healthy condition, IT, IB and PTP faults. Fundamental frequency: 60 Hz.
Figure 7.
FFT magnitude spectrum of simulated , , , and under healthy and faulty conditions. Fundamental frequency (): 60 Hz.
Figure 7.
FFT magnitude spectrum of simulated , , , and under healthy and faulty conditions. Fundamental frequency (): 60 Hz.
Figure 8.
Experimental setup: (a) converters, measuring boards, controller and computer; (b) WRSG and SCIM.
Figure 8.
Experimental setup: (a) converters, measuring boards, controller and computer; (b) WRSG and SCIM.
Figure 9.
Winding tap distribution of the WRSG used in the experimental setup.
Figure 9.
Winding tap distribution of the WRSG used in the experimental setup.
Figure 10.
FFT magnitude spectrum of , , , and under healthy and faulty conditions. Fundamental frequency (): 60 Hz.
Figure 10.
FFT magnitude spectrum of , , , and under healthy and faulty conditions. Fundamental frequency (): 60 Hz.
Figure 11.
Proposed turn fault detection algorithm using the geometric loci of the harmonic components. The fault is detected if they move out of the specified region.
Figure 11.
Proposed turn fault detection algorithm using the geometric loci of the harmonic components. The fault is detected if they move out of the specified region.
Figure 12.
Normal operation region definition: mechanical torque and speed steps are used to determine the normal variation of each geometric locus.
Figure 12.
Normal operation region definition: mechanical torque and speed steps are used to determine the normal variation of each geometric locus.
Figure 13.
Evaluation of the proposed technique using experimental data of an IB fault case. Fault occurrence is detected in the four variables.
Figure 13.
Evaluation of the proposed technique using experimental data of an IB fault case. Fault occurrence is detected in the four variables.
Figure 14.
Trip variables activation during Zone 1 events.
Figure 14.
Trip variables activation during Zone 1 events.
Figure 15.
Evaluation of the proposed technique for an IT fault case in a 4.5 MW WRSG. The fault occurrence is detected in the four variables.
Figure 15.
Evaluation of the proposed technique for an IT fault case in a 4.5 MW WRSG. The fault occurrence is detected in the four variables.
Table 1.
WRSG, grid and converter parameters.
Table 1.
WRSG, grid and converter parameters.
| WRSG |
|---|
| 2 kVA | | 230 V | | 60 Hz |
| 1800 rpm | | mA | | p.u. |
| p.u. | | p.u. | | p.u. |
| p.u. | | 1 H | | 2 |
| J | 0.0746 g·m | | 108 | | 2000 |
| 0.7 mm | | 10 cm | | 48 |
| 74.3 mm | | 120 mm | | 60 mm |
| Grid |
| 220 V | | 100 kVA | | 60 Hz |
| Converter |
| 10 kHz | | 1 mF | | 500 V |
Table 2.
Normal operation region settings for the experimental setup.
Table 2.
Normal operation region settings for the experimental setup.
| | (A) | (A) | (A) |
|---|
| −0.03 | 0.04 | 0.05 |
| 0.005 | 0.007 | 0.035 |
| −0.0021 | 0.002 | 0.004 |
| 0.004 | −0.005 | 0.025 |
Table 3.
Fault cases used for the experimental evaluation.
Table 3.
Fault cases used for the experimental evaluation.
| Case | Type | Dxx | Dyy | Torque
(p.u.) | Speed
(rad/s) |
() |
|---|
| 1 | IB | D23 | D10 | 1.0 | 377 | |
| 2 | PTP | D09 | D02 | 1.0 | 377 | |
| 3 | IT | D17 | D20 | 1.0 | 377 | |
| 4 | IT | D13 | D16 | 1.0 | 377 | |
| 5 | IT | D05 | D08 | 1.0 | 377 | |
| 6 | IB | D07 | D04 | 1.0 | 377 | |
| 7 | IT | D06 | D07 | 1.0 | 377 | |
| 8 | IT | D02 | D03 | 1.0 | 377 | |
| 9 | IT | D18 | D19 | 1.0 | 377 | |
| 10 | IT | D14 | D15 | 1.0 | 377 | |
| 11 | PTP | D23 | D05 | 1.0 | 377 | |
| 12 | IB | D11 | D22 | 1.0 | 377 | |
| 13 | IT | D04 | D01 | 1.0 | 377 | |
| 14 | IB | D21 | D12 | 0.6 | 300 | |
| 15 | PTP | D23 | D05 | 0.6 | 200 | |
| 16 | IT | D08 | D05 | 1.0 | 400 | |
| 17 | IB | D19 | D16 | 1.0 | 400 | |
| 18 | IB | D19 | D16 | 0.4 | 150 | |
| 19 | PTP | D09 | D03 | 1.0 | 400 | |
| 20 | PTP | D09 | D03 | 0.4 | 150 | |
Table 4.
Maximum values reached by the geometric loci for the cases in
Table 3.
Table 4.
Maximum values reached by the geometric loci for the cases in
Table 3.
| Case | | | | |
|---|
| 1 | | | | |
| 2 | | | | |
| 3 | | | | |
| 4 | | | | |
| 5 | | | | |
| 6 | | | | |
| 7 | | | | |
| 8 | | | | |
| 9 | | | | |
| 10 | | | | |
| 11 | | | | |
| 12 | | | | |
| 13 | | | | |
| 14 | | | | |
| 15 | | | | |
| 16 | | | | |
| 17 | | | | |
| 18 | | | | |
| 19 | | | | |
| 20 | | | | |
Table 5.
Time required to detect the fault cases in
Table 3 in milliseconds.
Table 5.
Time required to detect the fault cases in
Table 3 in milliseconds.
| Case | | | | |
|---|
| 1 | 24 | | | 24 |
| 2 | | 58 | | |
| 3 | | | | |
| 4 | | 70 | | |
| 5 | | | | |
| 6 | | | | |
| 7 |
∞
| 133 |
∞
| 108 |
| 8 | |
∞
| |
∞
|
| 9 |
∞
|
∞
|
∞
| |
| 10 | | | |
∞
|
| 11 | | 45 | | 29 |
| 12 | | | | |
| 13 | | | | |
| 14 | | 135 | | 183 |
| 15 | 109 | | | |
| 16 | | | 142 | |
| 17 | | | | |
| 18 | |
∞
|
∞
|
∞
|
| 19 | | | | |
| 20 | |
∞
| | ∞ |
Table 6.
Normal operation region settings for the 4.5 MW WRSG.
Table 6.
Normal operation region settings for the 4.5 MW WRSG.
| | (A) | (A) | (A) |
|---|
| 0 | 0 | 5 |
| 0.5 | 0.5 | 0.5 |
| 0 | 1 | 1 |
| 0 | 0 | 0.25 |
Table 7.
Turn fault cases used for the 4.5 MW WRSG.
Table 7.
Turn fault cases used for the 4.5 MW WRSG.
| Case | Type (Phase) | Dxx (%) | Dyy (%) | Torque
(p.u.) | Speed
(rad/s) |
|---|
| 1 | IT (a) | 90% | 80% | 1.0 | 377 |
| 2 | IT (a) | 90% | 80% | 1.0 | 400 |
| 3 | IT (a) | 90% | 80% | 0.5 | 150 |
| 4 | PTP (ac) | 50% | 50% | 1.0 | 377 |
| 5 | PTP (ac) | 50% | 50% | 0.5 | 150 |
Table 8.
Maximum values reached by the geometric loci for the 4.5 MW WRSG.
Table 8.
Maximum values reached by the geometric loci for the 4.5 MW WRSG.
| Case | | | | |
|---|
| 1 | | | | |
| 2 | | | | |
| 3 | | | | |
| 4 | | | | |
| 5 | | | | |
Table 9.
Activation time of the trip variables for the 4.5 MW WRSG in milliseconds.
Table 9.
Activation time of the trip variables for the 4.5 MW WRSG in milliseconds.
| Case | | | | |
|---|
| 1 | 49 | | | |
| 2 | | | 32 | |
| 3 | | | | |
| 4 | | | | |
| 5 | | | | |
| Disclaimer/Publisher’s Note: The statements, opinions and data contained in all publications are solely those of the individual author(s) and contributor(s) and not of MDPI and/or the editor(s). MDPI and/or the editor(s) disclaim responsibility for any injury to people or property resulting from any ideas, methods, instructions or products referred to in the content. |
© 2023 by the authors. Licensee MDPI, Basel, Switzerland. This article is an open access article distributed under the terms and conditions of the Creative Commons Attribution (CC BY) license (https://creativecommons.org/licenses/by/4.0/).


