Article

Study on Nonlinear Dielectric Properties of Micro Silica

1
Key Laboratory of Engineering Dielectrics and Its Application, Ministry of Education, Harbin University of Science and Technology, Harbin 150080, China
2
Institute of Electrical Engineering, Suihua University, Suihua 152061, China
*
Authors to whom correspondence should be addressed.
Energies 2023, 16(5), 2479; https://doi.org/10.3390/en16052479
Submission received: 23 January 2023 / Revised: 1 March 2023 / Accepted: 1 March 2023 / Published: 5 March 2023

Abstract

:
Inorganic insulating powder can potentially be used in nuclear power plant cables, fire-resistant cables, and so on due to its high heat resistance and radiation resistance. It is of great academic and engineering value to study the dielectric properties of inorganic insulating powder. In this paper, we aim to study the nonlinear dielectric properties via the measurement of the time-domain polarization current spectrum under the application of a DC electric field. Three kinds of silica powders are measured by a measurement system with adjustable pressure. The effects of powder shape, particle size, and packing pressure and temperature on the dependence of relaxation polarization and electrical conductivity on the applied electric field are studied. The experimental results show that the relationship between electrical conductivity and the electric field of inorganic insulating powder presents two different characteristics, i.e., field-induced enhancement and field-induced weakening. The relationship between conductance and temperature shows an increase with temperature. That is, the electrical conductivity increases or decreases with the increase in temperature. The inorganic powder insulation can be regarded as a composite, which is composed of inorganic powder particles and air gaps. The interface between the powder particles and air gaps contributes a lot to the polarization of inorganic insulating powder. The phenomena (including the field-induced weakening characteristic between relaxation polarization and electric field and the decrease characteristic of polarization with increasing temperature) can be explained by a simplified interface polarization mechanism.

1. Introduction

With the rapid development of human society, the demand for electric energy is also increasing continuously. As an important part of the power transmission system, the insulation reliability of cables is crucial to ensure the safety of power transmission and the reliable operation of the power grid. In different applications, cable insulation is usually subjected to different harmful effects, such as high temperature resistance, fire resistance, radiation resistance, etc., which pose a great challenge to the performance of insulation materials. In different operating occasions, cable insulation is usually subjected to different harmful effects, such as high temperature, fire, radiation, etc., which pose a great challenge to the performance of insulation materials [1,2]. Insulation materials must not only withstand adverse conditions, but also need to ensure reliable dielectric properties. Inorganic powder is traditionally used as a raw material for electrical and electronic ceramics [3,4,5]. Moreover, it is also used in polymer-based composites as a functional filler to improve the composite’s thermal, mechanical, and electrical insulating properties [6,7,8,9,10]. Due to its high temperature resistance and radiation resistance, inorganic insulating powder is widely used in fire-resistant cables [1], nuclear power plant cables [2], and electromagnetic winding coils [11], and it is potentially applied in the electrical insulation field under extreme environments.
Inorganic insulating powder can be considered as a composite system, which is composed of powder particles and the air gaps between the packing powder particles. The dielectric properties of the inorganic insulating powder are not only related to the intrinsic dielectric properties of powder particles, but also to the packing structure of the powder particles [12,13]. The factors that affect the packing structure of the powder particles mainly include the applied pressure, the powder particles’ intrinsic properties (e.g., particle size, shape, and surface roughness), and the container’s properties (such as container size, shape, and inner surface roughness) [14,15]. The dielectric properties of inorganic powder are important not only because of its usage as insulation in special cables [1,2,11], but also because it is widely used as an additive in polymer composites. From the engineering point of view, when inorganic insulating powder is filled in a specific insulation structure, the circuit parameters of the insulation structure will be modified by the filled powder, which influences the dynamic and steady-state characteristics of the insulation system. It is beneficial to the design of the insulation structure only after the inorganic powder material parameters are clarified. Moreover, from the scientific point of view, the study of the electrical properties of inorganic powder helps to reveal the deep dielectric mechanism.
Bouanga et al. investigated the behavior of the permittivity of Al2O3 and BN powders at low frequencies [16]. They revealed that the treatment under a vacuum is a more efficient way to remove the water in powders than thermal treatment, and by measuring the value for a powder, an accurate estimation of the permittivity of the bulk material can be acquired by known mixing laws for the dielectric permittivity. The dielectric properties of inorganic powders are also important in mineral separation techniques. Goossens et al. measured the permittivity of mineral powders and found that obsidian can be served as a possible reference mineral powder because it suits the necessary requirements of an excellent dielectric reference mineral [17]. Stepan S. Batsanov found that the permittivity of diamond powders increases with a decrease in size, which is not explained by the Maxwell–Wagner effect well. A double electric layer induced by the charges (unpaired electrons) on the surface atoms contributes to the permittivity increase with a decrease in size. The model Batsanov presented provides a way to estimate correctly the sense of the size effect and the order of magnitude of the permittivity for fine powders [18]. Though the permittivity of inorganic powders has been studied before, the electric conductivity is rarely studied. Compared to insulating powder materials, the studies of conductivity for conductive and semi-conductive powders have been reported more frequently [19,20,21].
The aim of this paper is to study the dielectric properties of a typical inorganic insulating powder (i.e., silica) by the time-domain polarization current method. Moreover, the effects of the applied pressure, the powder particles’ shape and size, as well as the temperature on the relaxation polarization and electrical conductivity characteristics of the packing inorganic insulating powder are studied. It is expected to provide a more in-depth understanding of the dielectric behavior of inorganic powders from this study.

2. Materials and Methods

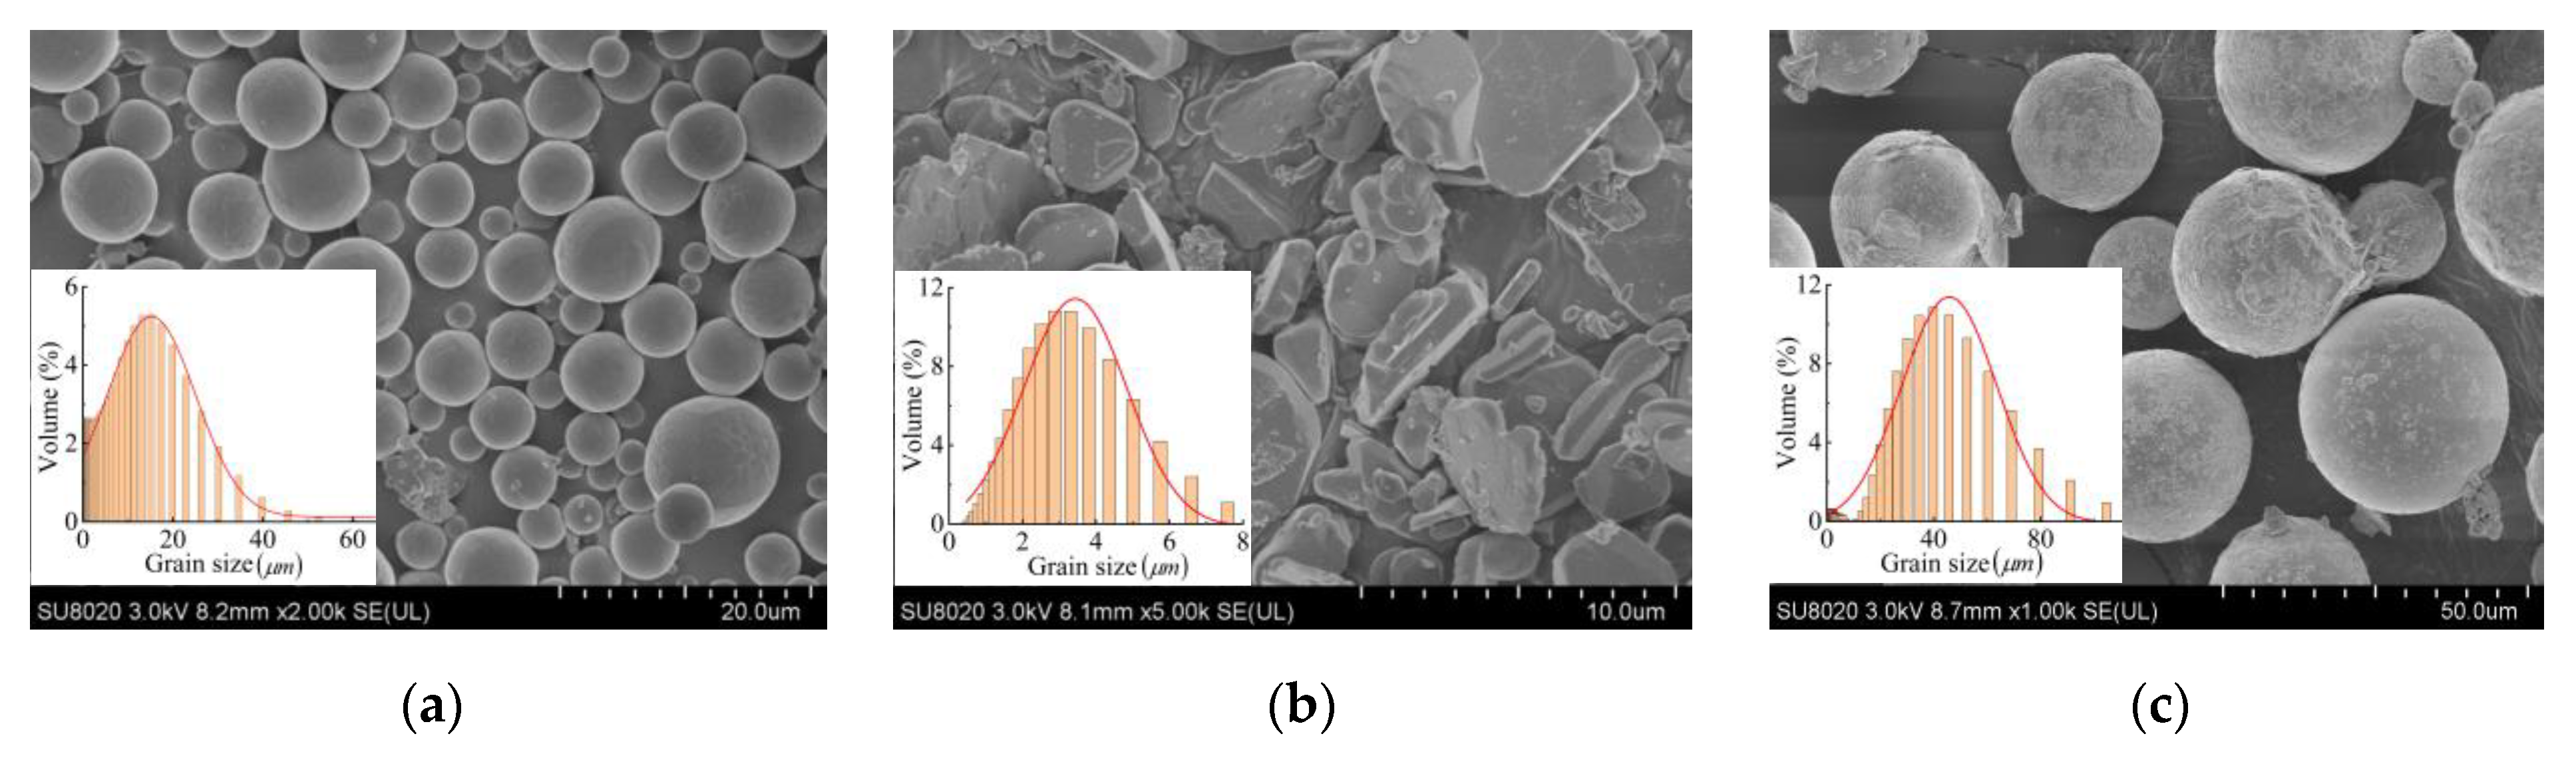
2.1. Inorganic Insulating Powder

There are many types of inorganic insulating powders sorted by chemical composition. Some insulating powders are mostly added to the polymer matrix for modification purposes to prepare the corresponding composite materials, such as Al2O3, MgO, SiO2, and BN. MgO and SiO2, in the form of a closely packed powder, also could be used in refractory cables and cables for nuclear power plants. Considering the applications in practice and the typical structure of SiO2, SiO2 is chosen as the model material in this study.
Three kinds of silica powders produced by Zhejiang Yamei Nano Co., Ltd. are studied; all of their purities are greater than 99.9%. The scanning electron microscope morphologies and the histograms of the average particle size, which were measured by a laser particle size analyzer, of these powders are shown in Figure 1.
The small spherical silica (SS) has a volume average diameter of 10.1 μm, and the large spherical silica (LS) has a volume average diameter of 42.6 μm. The small irregular silica (SIS) has a volume average diameter of 3.3 μm. These three kinds of silica powders are used to investigate the effects of the powder particles’ shape and size on the apparent dielectric properties of the inorganic insulating powder.
In order to eliminate the influence of moisture and space charge on the powders, these powders are preprocessed before measurement. A clean circular plate electrode is placed in a beaker, and the powder is loaded in the circular plate electrodes and is shorted. The whole electrodes are placed under 200 °C and −0.1 MPa for 48 h, and then, the powder is cooled to the measurement temperature under a vacuum. Subsequently, the powder is filled in the electrodes in the system as soon as possible.

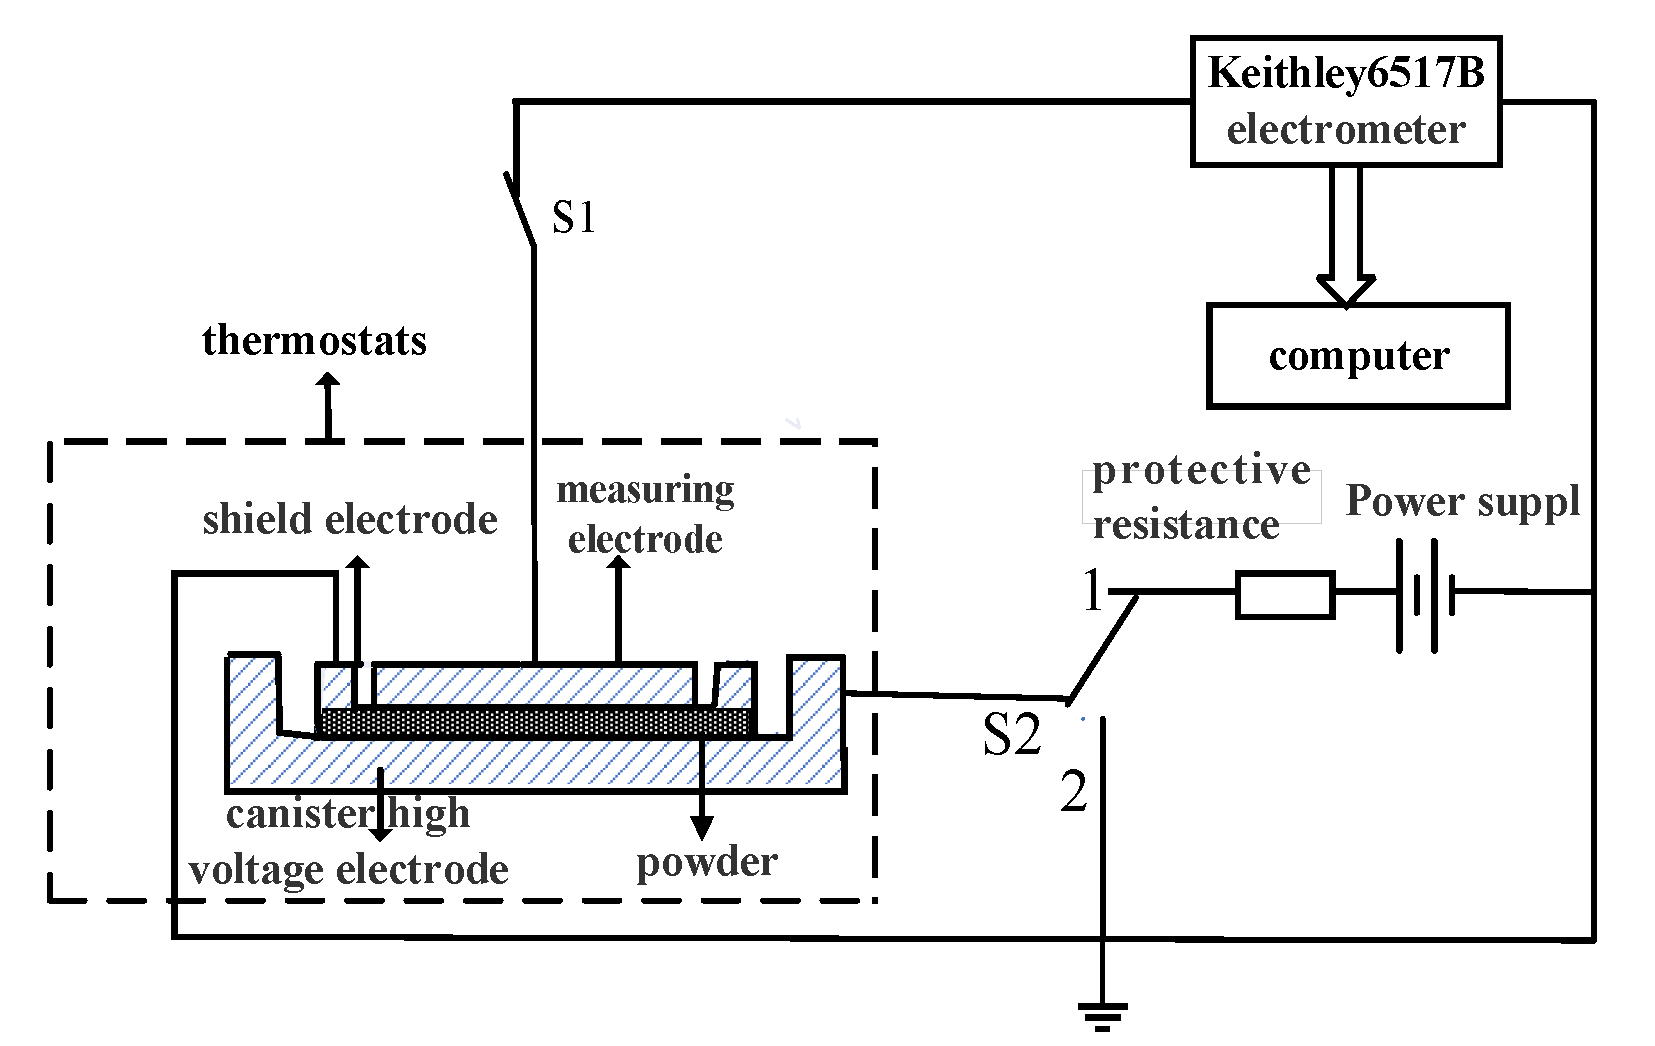
2.2. Measurement System and Conditions

To study the apparent properties of conductivity and polarization of inorganic powders, time-domain polarization current spectra under different temperatures and electric fields are measured by a measurement system equipped with a cup-shaped three-electrode system [22], as shown in Figure 2.
The three-electrode system is a commonly used test electrode system in the field of dielectric property research [23,24]. In this study, the diameter of the measuring electrode is 50 mm. The inner and outer diameters of the shield electrode are 54 mm and 74 mm. The diameter of the high-voltage electrode is 94 mm. The measurements are carried out at 25, 40, 55, and 70 °C, respectively. The ambient relative humidity is less than 40%.
It is known that the breakdown strength of air is about 3 kV/mm. The initial electric field is inversely proportional to the relative dielectric constant. As is known, the relative dielectric constants of air and silica are 1 and 4, respectively. The electric field E 2 , 0 in the air gap is described as E 2 , 0 = 4 E 1 , 0 .
Considering that:
d 1 E 1 , 0 + d 2 E 2 , 0 = d 1 E 1 , 0 + 4 d 2 E 1 , 0 = E ave ( d 1 + d 2 )
d 1 > 0 , d 2 > 0 and (1) are then rewritten as bellow:
E 1 , 0 = E ave d 1 + d 2 d 1 + 4 d 2 < E ave
Since Eave used in our manuscript is no larger than 0.7 kV/mm, the electric field E2,0 in the air gap is presented as E2,0 = 4E1,0 < 4Eave = 2.8E2,0 kV/mm. Thus, the initial electric field in the air gap is no larger than 2.8 kV/mm. In addition, the air gap between powders is very thin, and it is more difficult for powders to emit electrons than metal electrodes, so the breakdown of air hardly occurs. And, it was found that partial discharge will not happen in powders when the applied electric field does not exceed 1 kV/mm in experiments. Moreover, it was found that partial discharge will happen in powders when the applied electric field exceeds 1 kV/mm. So, the applied electric field is from 0.1 kV/mm to 0.7 kV/mm to avoid partial discharge in silica powders in this study. Correspondingly, the voltage is from 0.5 kV to 3.5 kV because the thickness of the silica powder samples is 5 mm. The polarization time is 1 h under each electric field and then follows the depolarization process with at least 2 h to make sure the sample discharges completely.

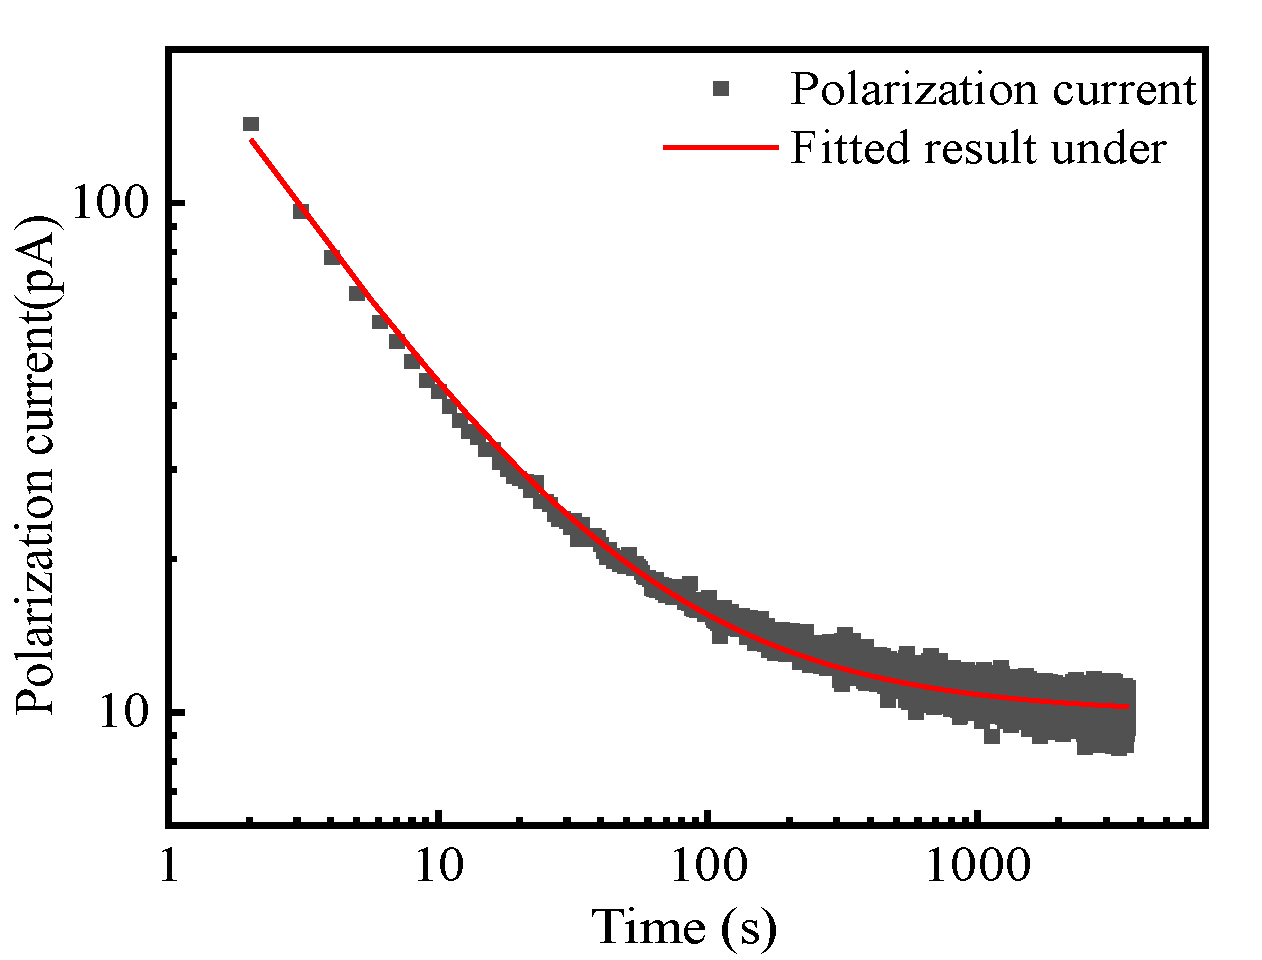
2.3. Calculation of Apparent Relaxation Polarizability and Electrical Conductivity

The time-domain polarization current usually includes nonrelaxation polarization current, relaxation polarization current, and conduction current.
Limited by the response of the measurement system, the nonrelaxation polarization current cannot be acquired by the measurement system because the building time of nonrelaxation polarization is much shorter than the system response. So, the measured time-domain polarization current only includes the relaxation polarization current and the conduction current. The measured current satisfies Equations (3) and (4) [25,26,27,28,29,30].
i ( t ) = i p ( t ) + i DC
i p ( t ) = At n  or  j = 1 n A j e t τ j
where ip(t) is the relaxation polarization current, iDC is the conduction current, and A, n, Aj, τj are constants. Figure 3 shows a typical time-domain polarization current spectrum. Equation (4) can be used to eliminate the interference and realize the decomposition of the relaxation polarization current and conduction current by fitting the measured data according to the normal least squares method [31].
The apparent electrical conductivity of the powder can be obtained as below.
γ = i DC S E
where S is the effective electrode area, and E is the applied electric field.
The relationship between the relaxation polarization p(t) and time is able to be obtained from the numerical integration of the polarization current ip(t) against time as follows.
p ( t ) = 1 S 0 t i p ( τ ) d τ
Moreover, the steady-state relaxation polarization Psteady is then obtained according to the trend prediction. The static apparent relaxation polarizability χr is then calculated by Equation (7).
χ r = P steady ε 0 E
where ε 0 is the vacuum permittivity.
Subsequently, the relationship of the static apparent relaxation polarizability (electrical conductivity) and electric field are obtained by changing the applied electric field E.

3. Results and Discussion

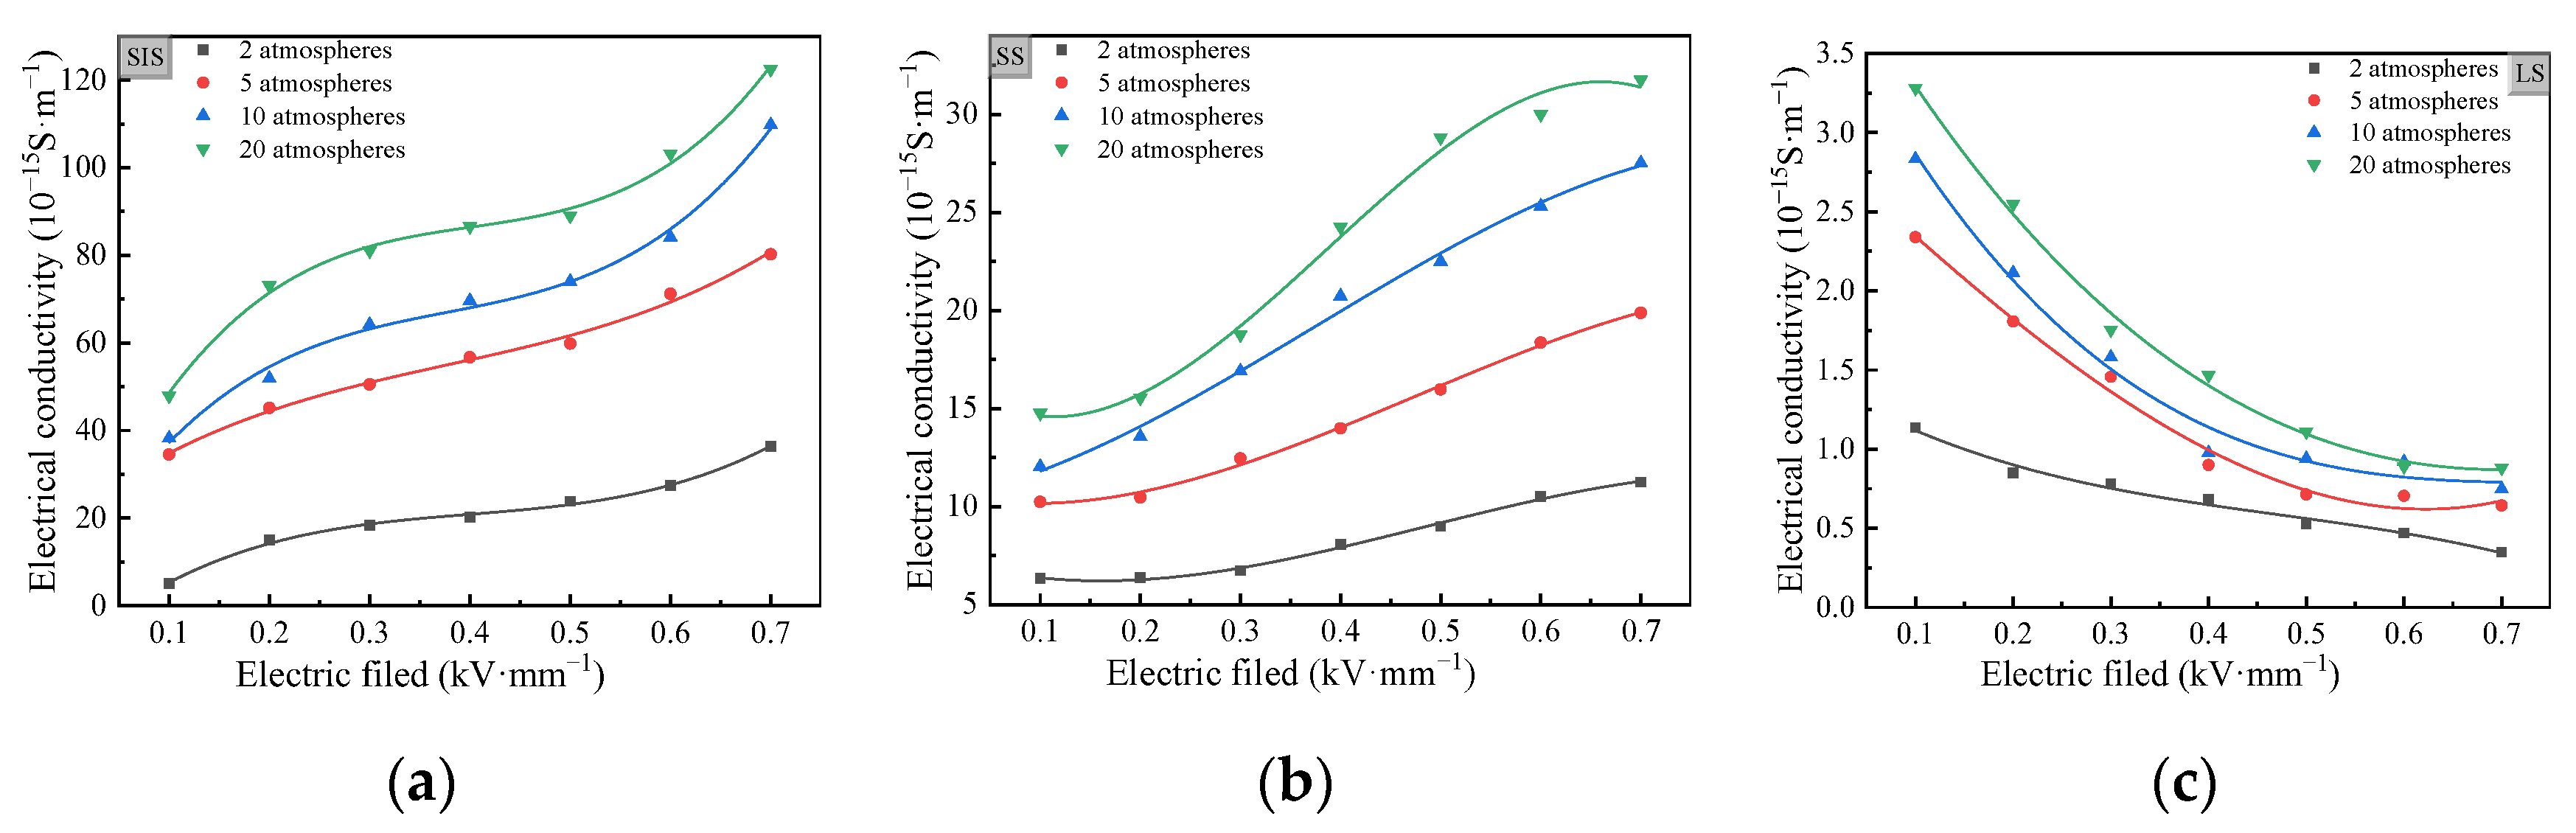
3.1. Electrical Conductivity

3.1.1. Effect of Pressure on the Apparent Electrical Conductivity

Figure 4 shows the relationship between the apparent electrical conductivity and the electric field of the three kinds of powders under different pressure conditions at 55 °C.
It can be seen that the increasing applied pressure results in a higher apparent electrical conductivity in Figure 4a,b. The apparent resistance of the powder consists of the intrinsic resistance of the powder particles, the contact resistance between the particles, the air gap resistance, and the interface resistance between the air gaps and powder particles via the mixed series and parallel connection. The increasing pressure can effectively reduce the contact resistance between particles and the air gap resistance. Thus, the powder shows an increase in the apparent electrical conductivity. In addition, it also can be seen that there is a nonlinear relationship between the electrical conductivity and the electric field from Figure 4a,b. This is because the electrically conductive process of silica powder is complicated, which is modulated by the contact between particles, the air gaps, and the interface as mentioned above. The electric field influences the contact barriers and interface charges [32], which results in the nonlinear electrical conductivity, as shown in Figure 5, and also makes the polarization exhibit a nonlinear behavior hereinafter.
It can also be seen from Figure 4 that the SIS powder has the highest apparent electrical conductivity, followed by the SS powder and the LS powder. Compared with the point contact between the spherical powder particles, the surface and line contact exist between the irregular powder particles. Thus, the contact resistance between irregular particles is much lower than that between spherical particles.
The reasons for the low apparent electrical conductivity of LS powder in Figure 4c are as follows. On the one hand, the number of contact points between large particles per unit volume is much smaller than that of small particles. On the other hand, the compactness of them is lower than that of small-size powders under the same applied pressure, and the air gap resistance takes effect at this time.
Seen from the effect of pressure on the apparent electrical conductivity of powders, the contact resistance between powders with a small particle size gives the greatest contribution to the apparent electrical conductivity, while the air gap resistance between powders with a large particle size gives the greatest contribution to the apparent electrical conductivity. This conclusion can be further confirmed by the relationship between the apparent electrical conductivity of powders with different sizes and the electric field.
The relationship between the apparent electrical conductivity and the electric field of powders with a small particle size presents an electric field-enhancing electrical conductivity characteristic. The apparent electrical conductivity of powders with a small particle size is determined by the interparticle contact resistance, which can be characterized by the interparticle contact barrier. The increase in electric field is able to reduce the equivalent barrier height [23]; thus, the apparent electrical conductivity of powders with a small particle size is electric field enhanced. In contrast, the relationship between the apparent conductivity and the electric field of powders with a large particle size presents an electric field-weakening conductivity characteristic. At this time, the air gap resistance plays a leading role. In order to qualitatively discuss the conductivity and polarizability characterization in inorganic insulating powder, a simplified model, as shown in Figure 6, is established [28] where γ1 and γ2 are the electrical conductivities of the solid particles and air gaps, respectively. ε1 and ε2 are the relative dielectric constants of the solid particles and air gaps, respectively. d1 and d2 are the thicknesses of the solid particles and air gaps, respectively.
According to the basic principle of electromagnetic fields, the steady-state electric field distribution in the composite system meets as follows.
γ 1 E 1 , = γ 2 E 2 , = γ E ave E 1 , d 1 + E 2 , d 2 = E ave d
where E1,∞ and E2,∞ are the electric fields in solid particles and air gaps, respectively. Eave is the average electric field across the solid particles and air gaps, d = d1 + d2. γ is the equivalent electrical conductivity of the model and is determined by eliminating E1,∞, E2,∞, and Eave as below.
γ = γ 1 γ 2 d γ 1 d 2 + γ 2 d 1
Considering the variation in the electrical conductivity and the average electric field, Equation (9) is rewritten as below by taking the derivative against the average electric field.
γ E ave = γ 1 2 d d 2 γ 1 d 2 + γ 2 d 1 2 γ 2 E ave
γ 1 2 d d 2 / γ 1 d 2 + γ 2 d 1 2 > 0 , γ E ave , and γ 2 E ave have the same sign. Since the current density of air is closely related to the applied electric field, as shown in Figure 5, the current density is nearly constant and independent of the electric field when the electric field is larger than E1 but lower than E2. As the current density is the product of the electrical conductivity and electric field, the approximately constant current density leads to a decrease in the electrical conductivity of the air gap with the increasing electric field, i.e., γ 2 E ave < 0 and then γ E ave < 0 . Thus, the silica with a larger particle size shows the electric field-weakening conductivity characteristic, which results in the static electrical conductivity decreasing with the increase in the electric field as shown in Figure 4c.

3.1.2. Effect of Temperature on the Apparent Electrical Conductivity

Figure 7 shows the relationships between the apparent electrical conductivity and the electric field of the three kinds of powders under different temperatures at decuple atmospheric pressure.
It can be seen that the IS powder has the highest apparent electrical conductivity. In contrast, the SS powder has a much lower apparent electrical conductivity, and the LS has the lowest apparent electrical conductivity. At the same time, the small-size powder shows an electric field-enhancing electrical conductivity characteristic, whereas the LS powder shows an electric field-weakening electrical conductivity characteristic. In addition, the apparent electrical conductivity of SS powder increases with the increasing temperature. As the powders’ intrinsic resistance and the contact resistance between the particles decrease with the increasing temperature, the carrier is able to pass from one particle to the adjacent particle by overcoming the interfacial potential barrier, and the physical process attributes to the thermal-stimulated hopping electrical conductivity model.

3.2. Polarization Characteristics

3.2.1. Effects of Applied Pressure on the Apparent Relaxation Polarizability

Figure 8 shows the relationships between the apparent relaxation polarizability and the electric field of the studied powders at 55 °C.
It can be seen that the increasing pressure leads to a much higher apparent relaxation polarizability for each kind of silica. It can also be learnt that at the same pressure, the SIS powder shows the highest apparent relaxation polarizability among the three kinds of powders, and the SS powder has a much higher apparent relaxation polarizability than the LS powder. These suggest that the relaxation polarization of powders belongs to the interface polarization. With the increase in pressure, the powder is packed more compactly, resulting in more interfaces per unit volume and an increase in the apparent relaxation polarizability. The comparison of the apparent relaxation polarizability between the IS powder and SS powder with a similar particle size further confirms that the powders’ polarization belongs to the interface one. When the pressure, which is in parallel with the direction of the electric field, is applied on the IS powder interface, more interfaces perpendicular to the electric field are generated, so the IS powder shows a very high apparent relaxation polarizability.
As can be seen from Figure 8a,b, the apparent relaxation polarizability of the powder decreases with the increase in the electric field, which means that it belongs to an electric field-weakening polarization. In Figure 8c, the apparent relaxation polarizability of the powder presents an obvious electric field-weakening polarization characteristic only at the maximum pressure. At the other pressures, the error of the obtained polarizability is large due to the low polarizability and polarization absorption current of the LS powder, which conceals the varying trend of the polarizability and electric field.

3.2.2. Effects of Temperature on the Apparent Relaxation Polarizability

Figure 9 shows the relationships between the apparent relaxation polarizability and the electric field of the studied powders under different temperatures and at decuple atmospheric pressure.
Figure 9 also shows that the apparent relaxation polarizability of SIS powder is the highest, followed by SS powder, and that of LS powder is the lowest. Figure 9a,b clearly show that the powder has an electric field-weakening relaxation polarization, and the apparent relaxation polarizability of the powder decreases with the increase in temperature. Similarly, Figure 9c does not clearly show the varying trend due to the large error of the measured polarizability caused by the low relaxation polarization absorption current.
In addition, according to our model in Figure 5, the electric field distribution in the composite system can be described as Equation (11) under the initial time of the applied DC voltage U0.
ε 0 ε 1 E 1 , 0 = ε 0 ε 2 E 2 , 0
At this time, the electric field is inversely proportional to the relative dielectric constant, and the charge density at the interface is 0.
According to Equation (8), the steady-state electric field can be obtained as follows.
E 1 , = γ 2 d 1 + d 2 γ 1 d 2 + γ 2 d 1 E ave E 2 , = γ 1 d 1 + d 2 γ 1 d 2 + γ 2 d 1 E ave
The steady-state interface charge density can be denoted as below.
σ inter = ε 0 ε 1 E 1 , ε 0 ε 2 E 2 ,
Substitute Equation (12) into (13); the steady-state interface charge density is rewritten as follows.
σ inter = ε 0 ε 1 γ 2 ε 2 γ 1 d 1 + d 2 γ 1 d 2 + γ 2 d 1 E ave
As the interface polarization is proportional to the interfacial charge density, the apparent relaxation polarizability is obtained as Equation (15).
χ r , inter = P inter E ave σ inter E ave = ε 0 d 1 + d 2 ε 1 γ 2 ε 2 γ 1 γ 1 d 2 + γ 2 d 1
Considering the variation trend of the relaxation polarization and the apparent average electric field, Equation (15) is derived with respect to the apparent average electric field, and Equation (16) can be obtained.
χ r , inter E ave E ave ε 0 d 1 + d 2 ε 1 γ 2 ε 2 γ 1 γ 1 d 2 + γ 2 d 1
In Equation (16), only the air’s electrical conductivity is related to the electric field, and it shows an electric field-weakening nonlinear electrical conductivity under the premise of no discharge, i.e., γ 2 E ave < 0 . Equation (16) can be rewritten from the derivation formula as below.
χ r , inter E ave ε 0 d 1 + d 2 γ 1 ε 1 d 2 + ε 2 d 1 γ 1 d 2 + γ 2 d 1 2 γ 2 E ave
According to the dielectric parameters of each material, it can be inferred that ε 0 d 1 + d 2 γ 1 ε 1 d 2 + ε 2 d 1 γ 1 d 2 + γ 2 d 1 2 > 0 . Consequently, χ r , inter E ave and γ 2 E ave always show the same polarity. When the air’s electrical conductivity shows an electric field-weakening nonlinear electrical conductivity (i.e., γ 2 E ave < 0 ), χ r , inter E ave < 0 . Namely, the interfacial relaxed polarization of the inorganic insulating powder is bound to show a similar electric field-weakening polarization characteristic.
It can also be seen from Equation (15) that the increasing temperature leads to the increase in the intrinsic electrical conductivity γ 1 of powder particles, which causes the negative temperature dependence of the apparent relaxation polarizability χ r . Thus, the experimental phenomena that the apparent relaxation polarizability of insulating powder decreases with increasing temperature is perfectly explained.

4. Conclusions

The effects of pressure and temperature on the relationship between the dielectric parameters and the electric field of powders with different particle shapes and sizes were experimentally researched, and some significant conclusions could be obtained.
(1) The powder with a small particle size is packed compactly, and its apparent electrical conductivity is controlled by the contact resistance between the particles. In contrast, the powder with a large particle size is packed more loosely, and the air gap resistance plays a dominant role in its apparent electrical conductivity.
(2) Insulating powder shows a nonlinear electrical conductivity characteristic. When the apparent electrical conductivity of the powder is determined by the contact resistance between particles, the powder exhibits electric field-enhancing electrical conductivity. In comparison, when the air gap resistance plays a leading role, the electrical conductivity of the powder is electric field weakened.
(3) The apparent electrical conductivity of silica powder is positively temperature dependent when the contact resistance between particles is dominant, whereas it is negatively temperature dependent when the air gap resistance takes effect.
(4) The relaxation polarization of powder originates from the interface polarization between powder particles and air gaps. The increase of applied pressure results in an increase in the number of interfaces per unit volume, which makes the relaxation polarizability increase. The polarizability of SIS powder is the highest, followed by the SI powder with a similar size, and the polarization of LS powder is the lowest.
(5) The interface polarization mechanism between the solid particles and the air gaps determines if the insulating powder has an electric field-weakening polarization characteristic and a temperature-weakening relaxation polarization.
(6) The relationships between the apparent electrical conductivity as well as the relaxation polarizability and the electric field are helpful to reveal the dielectric mechanisms of insulating powders. They can also provide some reference and guidance when insulating powder is used as an additive agent in polymer insulating materials.

Author Contributions

Conceptualization, Z.L.; data curation, Y.X.; funding acquisition, Z.L.; investigation, Y.X., Y.H., and H.J.; methodology, Y.S.; supervision, Z.L.; writing—original draft, Y.X.; writing—review and editing, W.G. All authors have read and agreed to the published version of the manuscript.

Funding

This research was funded by National Natural Science Foundation of China, No. 51837003.

Data Availability Statement

Not applicable.

Conflicts of Interest

The authors declare no conflict of interest.

References

  1. Pilarska, A.A.; Klapiszewski, L.; Jesionowski, T. Recent development in the synthesis, modification and application of Mg(OH)(2) and MgO: A review. Powder Technol. 2017, 319, 373–407. [Google Scholar] [CrossRef]
  2. Soliman, E.S.; Abdul, E.; Ezz-Eldin, M.R.; Howayda, G.; Walaa, E.K. Modification of cable insulation characteristics using nanocomposites for the nuclear power plant. Nucl. Radiat. Saf. 2019, 3, 75–82. [Google Scholar] [CrossRef] [PubMed]
  3. Tian, H.; Liu, H.T.; Cheng, H.F. Microstructural and electrical properties of thick film resistors on oxide/oxide ceramic–matrix composites. Ceram. Int. 2015, 41, 3214–3219. [Google Scholar] [CrossRef]
  4. Kulawik, J.; Szwagierczak, D.; Gröger, B. Investigations of properties of ceramic materials with perovskite structure in chosen electronic applications. Bull. Pol. Acad. Sci. Tech. Sci. 2007, 55, 293–297. [Google Scholar]
  5. Kolesnik, L.L.; Zhuleva, T.S.; Predtechenskiy, P.O.; Hlaing, M.K.; Aung, Z.P. Processing of metallization technology aluminum oxide ceramics for electro-vacuum devices elements and power electronics devices. J. Phys. Conf. Ser. 2017, 872, 012018. [Google Scholar] [CrossRef] [Green Version]
  6. Zhao, N.F.; Li, J.T.; Wang, W.J.; Gao, W.W.; Bai, H. Isotropically ultrahigh thermal conductive polymer composites by assembling anisotropic boron nitride nanosheets into a biaxially oriented network. ACS Nano 2022, 16, 18959–18967. [Google Scholar] [CrossRef]
  7. Wang, Y.Y.; Wang, C.; Zhang, Z.X.; Xiao, K. Anti-thermal aging properties of low-density polyethylene-based nanocomposites. IEEE Trans. Dielectr. Electr. Insul. 2018, 25, 1003–1013. [Google Scholar] [CrossRef]
  8. Zhang, X.X.; Wen, H.; Chen, X.Y.; Wu, Y.J.; Xiao, S. Study on the Thermal and Dielectric Properties of SrTiO3/Epoxy Nanocomposites. Energies 2017, 10, 692. [Google Scholar] [CrossRef] [Green Version]
  9. Vishal, M.; Kumar, A.P. Dynamic mechanical analysis of PVC/TiO2 nanocomposites. Adv. Compos. Hybrid Mater. 2018, 1, 741–747. [Google Scholar] [CrossRef]
  10. Wang, Y.N.; Zhang, S.; Sun, Y.Y.; Yang, X.W.; Liu, C. Effect of nano-MgO doping in XLPE on charge transport and electric field distribution in composite insulation of HVDC cable joint. Energies 2022, 15, 6948. [Google Scholar] [CrossRef]
  11. Yamanoi, Y.; Tanaka, K.H.; Saito, Y.; Yahata, K.; Kato, K.; Ito, S.; Sinozuka, N.; Tsukada, S. Development of Radiation-Resistant Magnet Coils for High-IntensityBeam Lines: Part 11-completely inorganic insulated coils. IEEE Trans. Magn. 1996, 32, 2147–2150. [Google Scholar] [CrossRef]
  12. Peltonen, J.; Murtomaa, M.; Robinson, K.; Salonen, J. The electrical resistivity and relative permittivity of binary powder mixtures. Powder Technol. 2018, 325, 228–233. [Google Scholar] [CrossRef]
  13. Shafaay, A.S.; Ahmed, M.A.; Yahia, I.S.; El-Dek, S.I. Resistivity and magnetization bimodal improvement in Ni ferrite nanoparticles by Mg substitution. J. Aust. Ceram. Soc. 2021, 57, 719–729. [Google Scholar] [CrossRef]
  14. Keizo, U. Processing science for ceramics based on analysis of packing structure of powder. J. Soc. Powder Technol. Jpn. 2013, 50, 108–120. [Google Scholar] [CrossRef]
  15. Shah, U.V.; Karde, V.; Ghoroi, C.; Heng, J.Y.Y. Influence of particle properties on powder bulk behaviour and processability. Int. J. Pharm. 2017, 518, 138–154. [Google Scholar] [CrossRef]
  16. Bouanga, C.V.; Savoie, S.; Couderc, H.; Fréchette, M.F.; David, E. The dielectric permittivity of ceramic powders used in composite polymers. In Proceedings of the Annual Report Conference on Electrical Insulation and Dielectric Phenomena, Cancun, Mexico, 16–19 October 2011; pp. 714–717. [Google Scholar] [CrossRef]
  17. Goossens, K.; van Biesen, L.; Boven, A.; Castelain, P. Theoretical and experimental analysis of the dielectric properties of powders. In Proceedings of the Sixth International Conference on Dielectric Materials, Measurements and Applications, Manchester, UK, 7–10 September 1992; pp. 73–76. [Google Scholar]
  18. Batsanov, S.S. On the size-effect in the dielectric permittivity of solids. J. Phys. Chem. Solids 2016, 91, 90–92. [Google Scholar] [CrossRef]
  19. Trapp, J.; Kieback, B. Fundamental principles of spark plasma sintering of metals: Part I—Joule heating controlled by the evolution of powder resistivity and local current densities. Powder Metall. 2019, 62, 297–306. [Google Scholar] [CrossRef]
  20. Montes, J.; Cuevas, F.; Ternero, F.; Astacio, R.; Caballero, E.; Cintas, R. A Method to Determine the Electrical Resistance of a Metallic Powder Mass under Compression. Metals 2017, 7, 479. [Google Scholar] [CrossRef] [Green Version]
  21. Hedden, M.; Francis, N.; Haraldsen, J.T.; Ahmed, T.; Constantin, C. Thermoelectric Properties of Nano-MesoMicro β-MnO2 Powders as a Function of Electrical Resistance. Nanoscale Res. Lett. 2015, 10, 292. [Google Scholar] [CrossRef] [Green Version]
  22. Xue, Y.; Guo, W.; Sun, Y.; Li, Z.; Han, Y. Abnormal Time-Domain Current Spectrum of Inorganic Insulating Powder under DC Voltage. Energies 2022, 15, 8227. [Google Scholar] [CrossRef]
  23. Chalashkanov, N.M.; Dodd, S.J.; Dissado, L.A.; Fothergill, J.C. Re-examination of the dielectric spectra of epoxy resins: Bulk charge transport and interfacial polarization peaks. IEEE Trans. Dielectr. Electr. Insul. 2014, 3, 1330–1341. [Google Scholar] [CrossRef] [Green Version]
  24. Gao, Y.; Liang, X.; Dissado, L.A.; Dodd, S.J.; Chalashkanov, N.M. Dielectric Response of Filled High Temperature Vulcanized Silicone Rubber. IEEE Trans. Dielect Electr.. Insul. 2016, 23, 3683–3695. [Google Scholar] [CrossRef] [Green Version]
  25. Das, S. Revisiting the Curie-Von Schweidler law for dielectric relaxation and derivation of distribution function for relaxation rates as zipf’s power law and manifestation of fractional differential equation for capacitor. J. Mod. Phys. 2017, 8, 1988–2012. [Google Scholar] [CrossRef] [Green Version]
  26. Wei, J.L.; Zhang, G.J.; Xu, H.; Peng, H.D.; Wang, S.-Q.; Dong, M. Novel characteristic parameters for oil-paper insulation assessment from differential time-domain spectroscopy based on polarization and depolarization current measurement. IEEE Trans. Dielectr. Electr. Insul. 2011, 18, 1918–1928. [Google Scholar] [CrossRef]
  27. Suo, C.Y.; Li, Z.H.; Sun, Y.L.; Han, Y.S. Application of l1 trend filtering technology on the current time domain spectroscopy of dielectrics. Electronics 2019, 8, 1046. [Google Scholar] [CrossRef] [Green Version]
  28. Sun, Y.L.; Li, Z.H.; Han, Y.S.; Zhang, X. Quantitative Investigation of the Nonlinear Polarization in Epoxy/SiC Nanocomposite. IEEE Trans. Dielectr. Electr. Insul. 2021, 28, 66–73. [Google Scholar] [CrossRef]
  29. Haque, N.; Dalai, S.; Chatterjee, B.; Chakravorti, S. Study on charge de-trapping and dipolar relaxation properties of epoxy resin from discharging current measurements. IEEE Trans. Dielectr. Electr. Insul. 2017, 24, 3811–3820. [Google Scholar] [CrossRef]
  30. Farahani, M.; Borsi, H.; Gockenbach, E. Dielectric response studies on insulating system of high voltage rotating machines. IEEE Trans. Dielectr. Electr. Insul. 2006, 13, 383–393. [Google Scholar] [CrossRef]
  31. Li, Z.H.; Suo, C.Y.; Chen, Y.; Guo, W.Y.; Zheng, H.; Han, Y.S.; Sun, Y.L. Method for Measuring Principle of steady State Relaxation Polarizability and Electric Field Characteristic in Nonlinear Insulating Dielectric Medium, Involves Realizing Measurement of Dielectric Steady State Relaxation Polarizability. Patent CN111579909(A), CN111579909(B), 14 September 2020. [Google Scholar]
  32. Kwan, C.K. Dielectric Phenomena in Solids; Elsevier Academic Press: San Diego, CA, USA, 2004. [Google Scholar]
Figure 1. Morphology and the histograms of the average particle size of silica: (a) small spherical silica with a volume average diameter of 10.1 μm; (b) irregular silica with a volume average diameter of 3.3 μm; and (c) large spherical silica with a volume average diameter of 42.6 μm.
Energies 16 02479 g001
Figure 2. Measurement system for time-domain polarization current.
Energies 16 02479 g002
Figure 3. Typical time-domain polarization current spectrum of silica.
Energies 16 02479 g003
Figure 4. Relationship between the apparent electrical conductivity and the electric field of silica powders under different pressures: (a) apparent electrical conductivity of SIS powder; (b) apparent electrical conductivity of SS powder; and (c) apparent electrical conductivity of LS powder.
Energies 16 02479 g004
Figure 5. Relationship between current density (j) and electric field (E) of air [32].
Energies 16 02479 g005
Figure 6. Simplified conductivity and interface polarization model of inorganic insulating powder.
Energies 16 02479 g006
Figure 7. Relationship between apparent electrical conductivity and electric field under different temperatures: (a) apparent electrical conductivity of SIS powder; (b) apparent electrical conductivity of SS powder; and (c) apparent electrical conductivity of LS powder.
Energies 16 02479 g007
Figure 8. Relationships between the apparent relaxation polarizability and electric field: (a) apparent polarizability of IS powder; (b) apparent polarizability of SS powder; and (c) apparent polarizability of LS powder.
Energies 16 02479 g008
Figure 9. Relationship between apparent polarizability and electric field under different temperatures: (a) apparent polarizability of SIS powder; (b) apparent polarizability of SS powder; and (c) apparent relaxation polarizability of LS powder.
Energies 16 02479 g009
Disclaimer/Publisher’s Note: The statements, opinions and data contained in all publications are solely those of the individual author(s) and contributor(s) and not of MDPI and/or the editor(s). MDPI and/or the editor(s) disclaim responsibility for any injury to people or property resulting from any ideas, methods, instructions or products referred to in the content.

