1. Introduction
One of the greatest challenges of the 21st century is the gradual transition from the massive use of fossil fuels by traditional power plants toward an economy based on carbon-neutral technologies and systems. By signing the Paris Agreement [
1] in 2015 and with the Clean Energy Package (CEP) [
2], the European Union has committed to reducing pollutant emissions and switching toward a cleaner economy, putting the energy sector (responsible for more than 75% of EU emissions [
3]) in a central position [
4,
5]. The future energy system will therefore integrate the energy carriers with smart networks and will be characterized by a more diverse and distributed generation, mostly based on Renewable Energy Sources (RESs), often Non-Programmable (NP-RESs), causing a higher and higher level of decentralization. Consequently, Distributed Energy Resources (DERs) are expected to have an increasingly important role in managing the electrical grids [
6,
7], even if nowadays in Europe these technologies are not always allowed to participate in the electricity markets.
It is proved that a strong correlation exists between the increasing spreading of NP-RESs and the demand for ancillary services [
8], since the variability and scarce programmability of these sources make it more difficult for system operators to manage the network in safe conditions. However, it is also well established that, even though RES production brings with itself new issues and challenges for the power system operation, DERs can also represent an effective solution to the problem at hand if properly managed.
The prosumers, i.e., customers who produce electricity primarily for their own needs but can also sell the excess electricity, play a key role in this transformation. They are primarily connected to the distribution network with small or medium installed capacity and, due to the development of smart grids and affordable distributed energy resource technologies (e.g., photovoltaic and batteries), have the possibility of selling the surplus electricity produced in combination with a broad set of services [
9,
10]. With aggregation policies, their contribution to the market is expected to largely increase due to the benefits in terms of market potential and economies of scale [
11].
Indeed, many different ancillary services can be provided to the grid by DER units, related both to the active and reactive power [
12,
13]. However, to this purpose, the adoption of new technologies and control strategies is essential. In this regard, capillary observability and controllability of all the dispersed resources is often a strict requirement. With this aim, national governments are moving to promote the implementation of communication infrastructures enabling the exchange of monitoring and control data between network operators (TSOs and DSOs) and users [
14]. Digitalization and Information and Communication Technologies (ICTs) can be considered enablers for this transformation, even if costs and management complexity are issues to be taken into account, which can influence the identification of a suitable trade-off between extensiveness of the data infrastructure and the number and size of users to involve in the flexibility harvesting [
15].
Regarding DERs integration, CEP laid the foundations in the EU for the flexibility provision from DERs and their aggregation, promoting better controllability and reliability of the power system operation, also by increasing cooperation between Transmission and Distribution System Operators (TSOs and DSOs). In particular, European Directive 2019/944 [
16] established that the necessary regulatory framework and relevant incentives must be defined by Member States to promote the utilization of flexibility in distribution networks, in the form of local ancillary services to be collected by DSOs. As a consequence, the birth of local flexibility markets in many EU countries is foreseen in the near future.
Following the above-mentioned legislation, many European Member States are currently testing new designs for local flexibility markets, or checking the feasibility of opening the current ASM to DER units. This is the aim of many projects financed by the H2020 programme [
17], such as SmartNet [
18,
19], Platone [
20,
21], Piclo Flex [
22,
23,
24], InterFlex [
25,
26], FlexPlan [
27,
28], and CoordiNet [
29,
30]. In general, the experiences carried out in the last two decades aimed to eliminate the existing regulatory barriers [
31] by either a whole system redesign (e.g., passing from central to self-dispatch [
32]), the reform of some services (e.g., the introduction of fast frequency response services [
33]), or proposing the evolution of some products (e.g., a decrease in the minimum bid quantity of existing services to enable provision by DERs [
34]). However, reforming markets and defining suitable incentive schemes to support DERs’ expansion must be cautiously performed by governments and national regulatory authorities since each evolution could imply many regulatory trade-offs [
35,
36]. In this regard, even if some studies on the topic can be found in the literature, their results are often bounded to technology-related aspects [
37,
38] or to country-specific frameworks, as in [
39], where the authors propose an assessment of market and policy barriers for the ancillary services provision by demand response in the U.S., or in [
40], where it is performed an international comparison of the aspects of ASMs in the electric power industry, which, however, is limited to England, NORDEL (Denmark, Finland, Norway, Sweden), California, USA, Argentina, Australia and Spain. In [
36], a review of the current main characteristics and barriers to DERs of some national ASMs in the EU is reported. In this study, the authors identify the abolition of price limits (removal of the price cap and enabling of negative prices), i.e., the topic that the present paper aims to address, as one of the main aspects, together with the application of the incentive schemes, that still does not present a common approach at the EU level and therefore needs proper investigation. In particular, concerning negative prices, they are deemed effective in incentivizing RESs to provide downward reserve, even if their implications on the recovery of the incentive are an aspect that must be taken into account [
41].
2. Current Market Structure and Remuneration Schemes for DERs
The Italian Wholesale Electricity Market was established as the outcome of the Legislative Decree n. 79 of 16 March 1999 [
42], a consequence of the European Directive 96/92 [
43] concerning common rules for the internal market in electricity. The Italian market is run by Gestore dei Mercati Energetici (GME) [
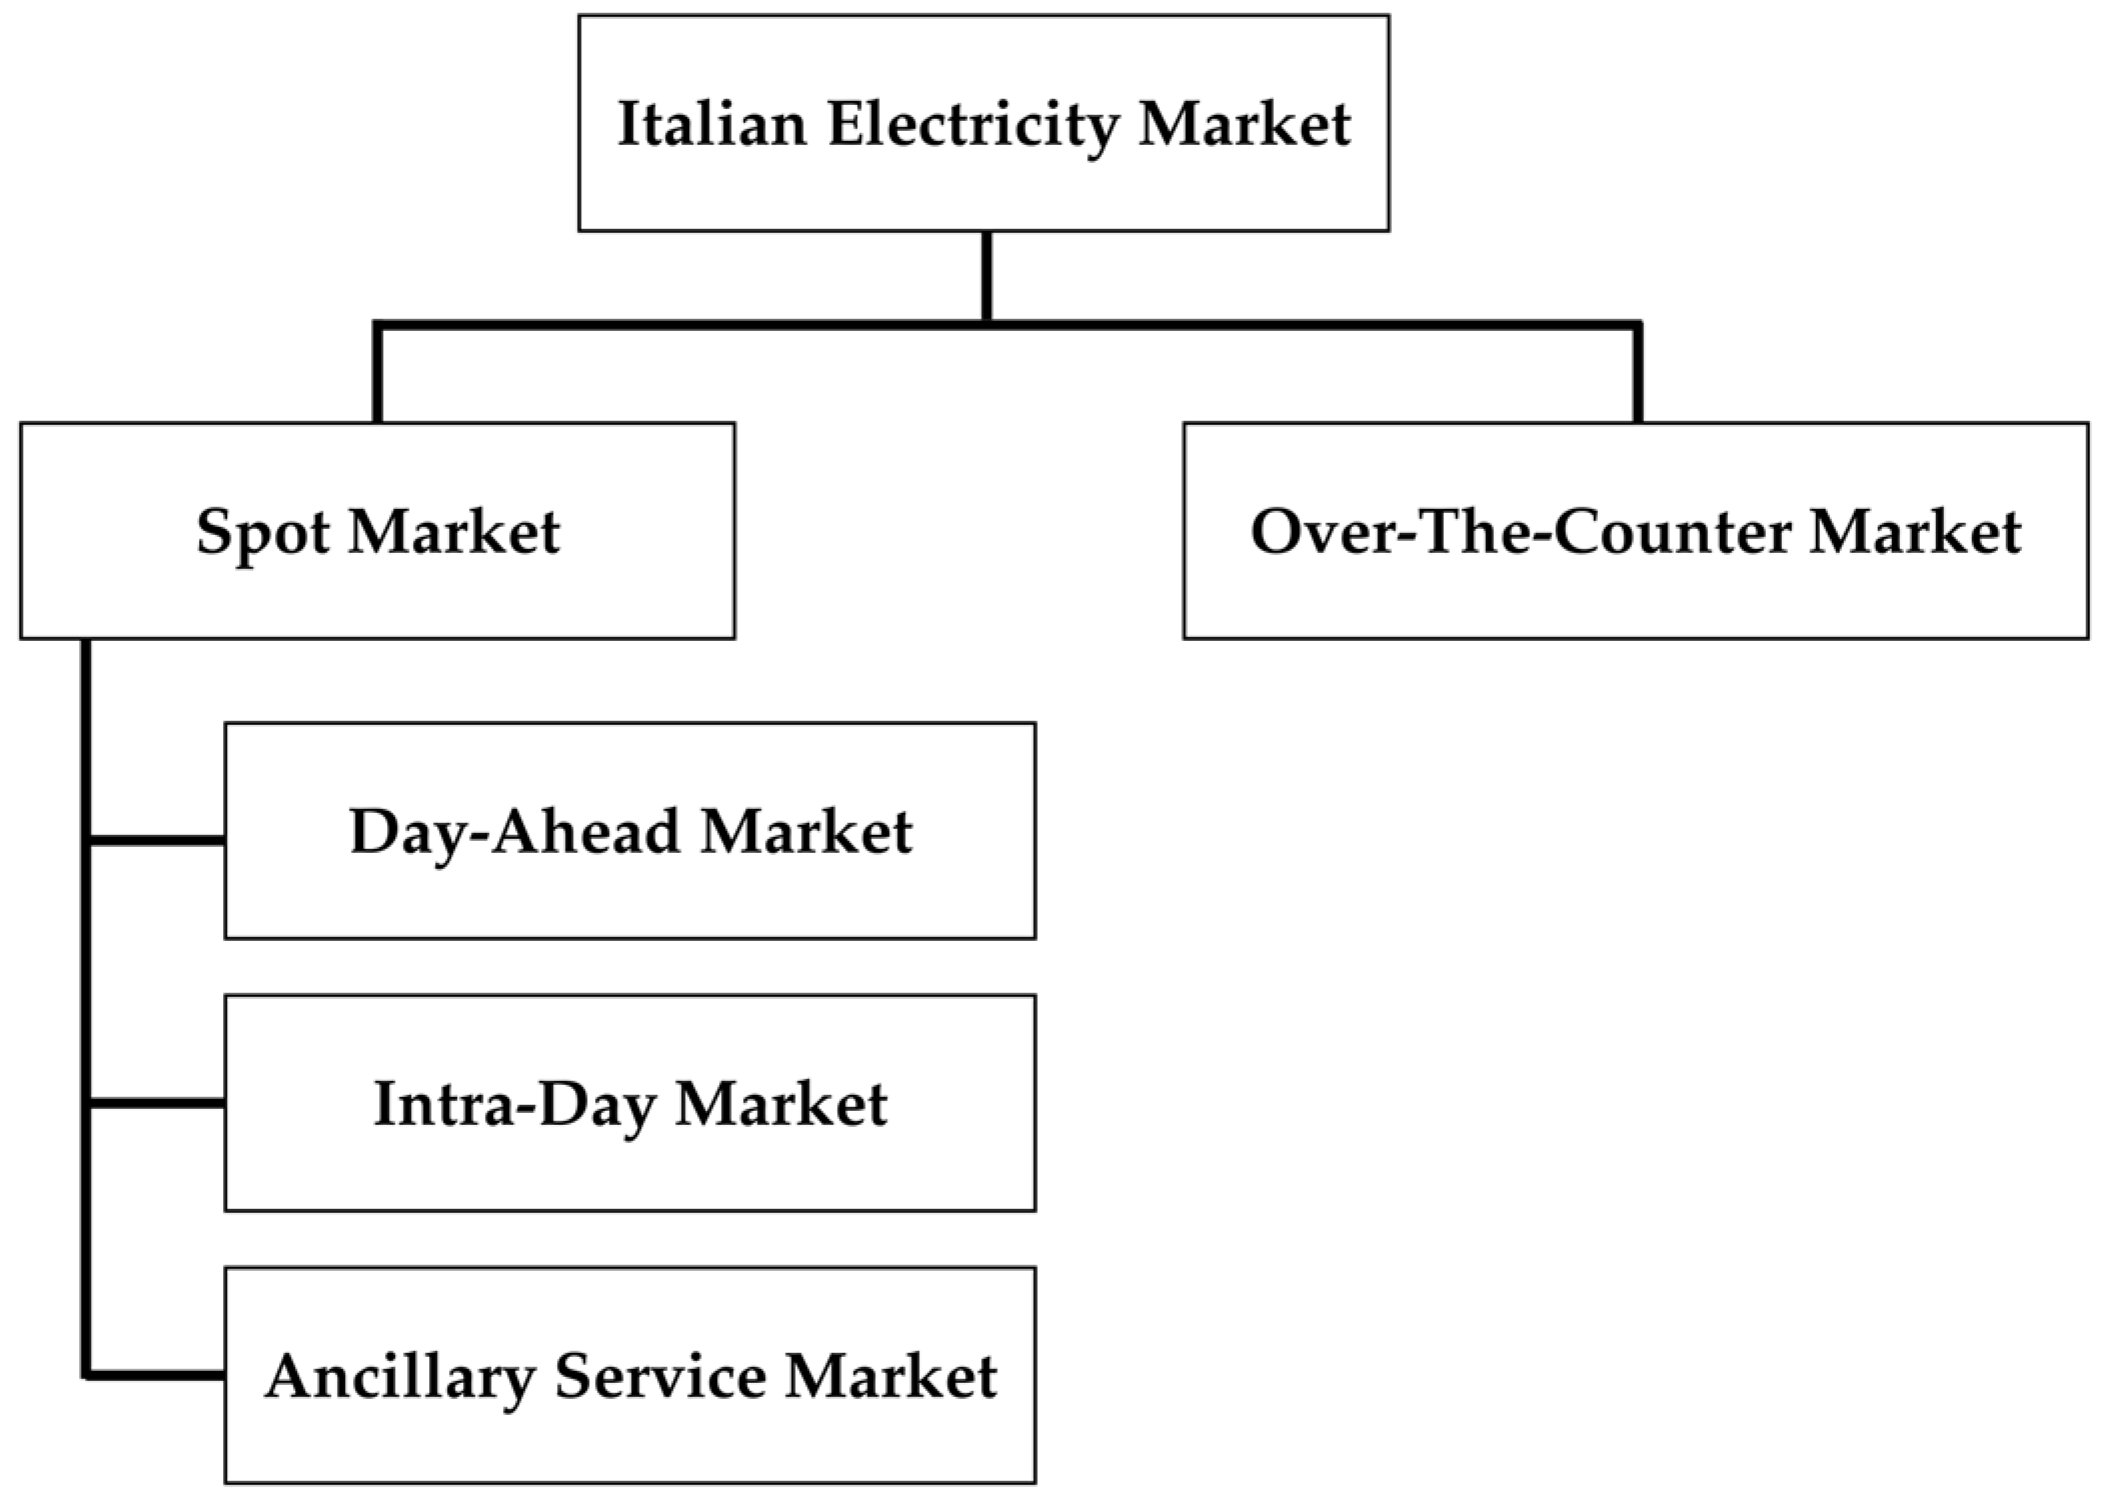
44], and it is organized as presented in
Figure 1.
On the Over-The-Counter Market (OTC), bilateral (usually long-term) contracts are signed to define energy and economic transactions among energy operators and producers. The Spot Market is the part of the electricity market in which products are traded for immediate delivery. The Spot Market is further divided into three sub-markets:
Day-Ahead Market (DAM), where most energy transactions take place, in which the players make offers/requests about electricity for the day ahead. The price is determined, hour by hour, according to a merit order system. The result of the auction is a unique market clearing price, defined at the point where the curves of demand and supply meet.
Intra-Day Market (IM), which allows operators to modify the programs defined during the DAM through additional offers based on new market information. The price is set through a continuous trading mechanism and three auction sessions during the day.
Ancillary Services Market (ASM), where the TSO, acting as central counterpart, purchases the resources necessary for managing and controlling the grid. The bids accepted are remunerated with a pay-as-bid mechanism. The ASM is composed of two main phases:
ASM ex-ante scheduling, in which the required amount of capacity reserves is defined, together with the mode of operation of the Power Units (PUs), based on the given demand forecast and supply availability;
Balancing Market (BM), where dispatching orders are sent to the PUs to keep the system balanced in terms of active power, also counteracting the occurrence of emergencies and malfunctions of the system.
The Italian electricity market is partitioned into seven market zones, matching the actual geographical zones of Italy, and the relevant market and power system’s constraints (see
Section 4), plus some “virtual” zones modeling the energy exchanges with foreign countries [
45].
The ASM is of key importance in guaranteeing the safe and reliable operation of the national power system, because in this market, the TSO collects the regulation services required to solve constraints and problems that may affect the grid operation. In particular, capacity reserve for frequency control and congestion settlement are procured by TSO during the scheduling phase, i.e., ASM ex-ante, while during the BM, bids and offers for the real-time balancing are managed.
Currently, in order to participate in the ASM, the PUs have to meet specific requirements [
45]. In particular, they must be connected to the transmission grid (i.e., rated power ≥10 MVA) and not be from NP-RES. Moreover, some prerequisites apply concerning the minimum gradient and duration required for each regulation.
According to the rules in place, therefore, NP-RES power plants and small and medium-sized production units (<10 MVA) cannot participate in the ASM. However, in recent years, the national regulatory authority (ARERA) started a reform process to open the ASM also to NP-RES-based and DER units. As a result, a series of pilot projects have been launched [
46] in which these PU categories can offer balancing, congestion management, and tertiary reserve services on the ASM. The pilot project currently running, the so-called UVAM (
Unità Virtuali Abilitate Miste, i.e., mixed enabled virtual units) project, started in 2018 and enabled the ASM participation of virtual aggregations of NP-RES, consumption units (e.g., e-mobility), and energy storage systems.
In addition to market structure, another factor with a great impact on the viability of DER integration in the ASM is represented by the incentive schemes applied to RES energy production.
Regarding the payment of the energy injected into the grid by PUs, in Italy, the following schemes are adopted.
Free market. The PU owner sells its production directly on the market or through an agreement with a trader. The energy is paid at the DAM price. This is the only option available for large (≥10 MVA) conventional power plants, while it is rarely adopted by DERs because of some more advantageous alternative options.
Dedicated withdrawal (
ritiro dedicato). DER energy production is sold on the market on behalf of the user by a public company (GSE) [
47]. Compared to the previous one, this scheme allows following a simplified procedure to sell the energy on the market (single agreement with GSE). All PUs with rated power < 10 MVA, or larger from NP-RES, can benefit of this energy selling scheme.
Feed-in-Tariff (FiT;
tariffa onnicomprensiva). Each unit of produced energy is paid to the DER owner at a fixed price, including both the value of the electricity and an incentive. As shown in
Table 1, over the years, various FiT schemes have been implemented, with different rules regarding the amount of the incentive and plant configurations admitted.
On-site exchange (scambio sul posto). This mechanism is designed to promote the spread of RES power plants. The energy injected into the grid by the PU is paid at its market price; in addition, the difference between the cost of the energy absorbed from the grid and the price of the energy sold is partially refunded to the user (virtual self-consumption). Currently, only RES or high-efficiency CHP units with rated power ≤ 500 kW can benefit from it. Its termination is planned by 2024.
Concerning the incentive schemes for renewables, several indications and directives have been provided at the European level, with the purpose to define a common path for the energy transition to be followed by all Countries. The main support schemes presently in force in Italy are reported in
Table 1, with the relevant applicability to the above-described mechanisms for the energy selling.
3. Research Motivations and Methodology
This research work is motivated by the fact that some aspects of the present market and pricing structures seem to act as barriers to DER participation in the Italian ASM, limiting the economic attraction of this new business. The existence of these issues is confirmed by the preliminary results of UVAM projects (see
Section 2). In 2021, 272 UVAMs managed by 32 aggregators were enabled to participate in the ASM, qualified to supply a total of 1565 MW for the upward service and only 194 MW for the downward service. These amounts highlight that aggregators consider it easier to offer upward regulation rather than downward one, even if the technological limits of RES generators would suggest a regulation easier in the opposite direction. The reason is probably that the resources used to supply the services needed by the system are mostly programmable loads (that can provide upward regulation by load curtailment) and controllable generators, such as CHP units, which can modulate power in both directions. Therefore, even if non-programmable or partially programmable DER units already today could contribute to the provision of ancillary services to the grid from a technical point of view, market and pricing schemes in place limit their integration in the market. In the future, the introduction of new market products tailored to DER’s characteristics (such as the flexible ramp implemented in the U.S.) could encourage this process, ensuring sufficient regulation availability in the system [
49]. However, proper legislative and regulatory frameworks are also pivotal to achieve this goal.
In the context outlined, the focus of the present work is set on the role within the ASM of DER power plants (i.e., small production units, often belonging to prosumers, connected to the distribution network) and on the evaluation of the actual economic opportunities for them of supplying regulation services to the grid. To this purpose, the current Italian framework, in terms of market structure and prices, will be considered as a reference. More specifically, the purposes of this study are to:
evaluate the economic opportunities arising from the participation of small production units, DER, and (NP-)RES in the ASM;
determine the economic conditions under which producers can find it profitable to provide regulation (tertiary reserve and balancing control) to the grid;
explore possible remuneration schemes to increase the economic viability of the ancillary service provision in those cases in which barriers are identified in the present market framework. To this purpose, this paper proposes a research methodology based on time series analysis applied to historical price trends relevant to the Italian gas and electricity markets (DAM and ASM). Hourly price data are collected over a 4-year period (2019–2022) and processed to obtain daily average values, which are used to highlight price trends and possible correlations between the quantities observed. Even if past data cannot be considered fully representative of future market evolutions, especially over the long term, they can be useful to identify factors preventing the effective integration into the market of some users’ categories today (e.g., RES-based power plants).
Considering the fundamental role of the legislative and regulatory framework in limiting or supporting DER participation in the ASM, as the next step, the present paper evaluates the potential effect of the energy selling and incentive schemes applied in Italy to DERs on the earnings from the sale of tertiary reserve and balancing regulation on the ASM. With this aim, a reference case study is adopted where a small Production Unit (PU) offers its services on the market through an aggregator (Balancing Service Provider, or BSP). Results (earnings) obtained for the DER unit are compared with those of a reference thermal power plant. After having clearly identified variable costs and other factors that can affect the business case, the potential revenues of the power plant are evaluated under the different payment and incentive options in the current market scenario over the 4 years considered. To this purpose, the situations in which the power plant offers on the ASM both upward and downward regulation are evaluated, comparing their results to the DAM participation only.
Then, once the issues posed by the current scenario are identified, the effectiveness and possible complementarity of two updates to the present market pricing and incentives mechanisms are discussed. Firstly, assuming that negative prices are allowed on the ASM, the price limits for the up/downward regulation over/below which the AS provision can be advantageous for a DER unit are evaluated. The results obtained provide useful indications about the state of the up/downward regulation in relation to economic sustainability according to the present market prices. Even if with negative prices DER units can offer downward regulation at a price capable of compensating for all the economic loss caused by the production reduction, in the current scenario, the competition of conventional generators must also be considered. Therefore, some conclusions will be drawn about the possibility of applying the incentives on the amount of energy production scheduled on the DAM (at the net of possible imbalance errors), without considering the reduction caused by the actuation of downward regulation requests (or, similarly, the increase resulting from upward regulations).
4. Current Trends in Electricity and Gas Markets
Considerations about the actual economic opportunities arising from the ASM opening to DERs can be drawn only after having analyzed electricity and gas price trends. An investigation regarding these economic figures is crucial since the present historical period is rich in extreme events that are causing strong unpredictability of such prices, and consequently making it more difficult to forecast future scenarios. The period considered for the analysis, starting in January 2019, covers the COVID-19 pandemic and the first part of the war in Ukraine, until December 2022, both extraordinary events that have influenced the energy markets of the entire globe. For sake of brevity, an extensive analysis will be performed only on the market zone relevant to the Central–Northern Italy (so-called CNOR). Then, some data will be provided in brief for the other geographical areas.
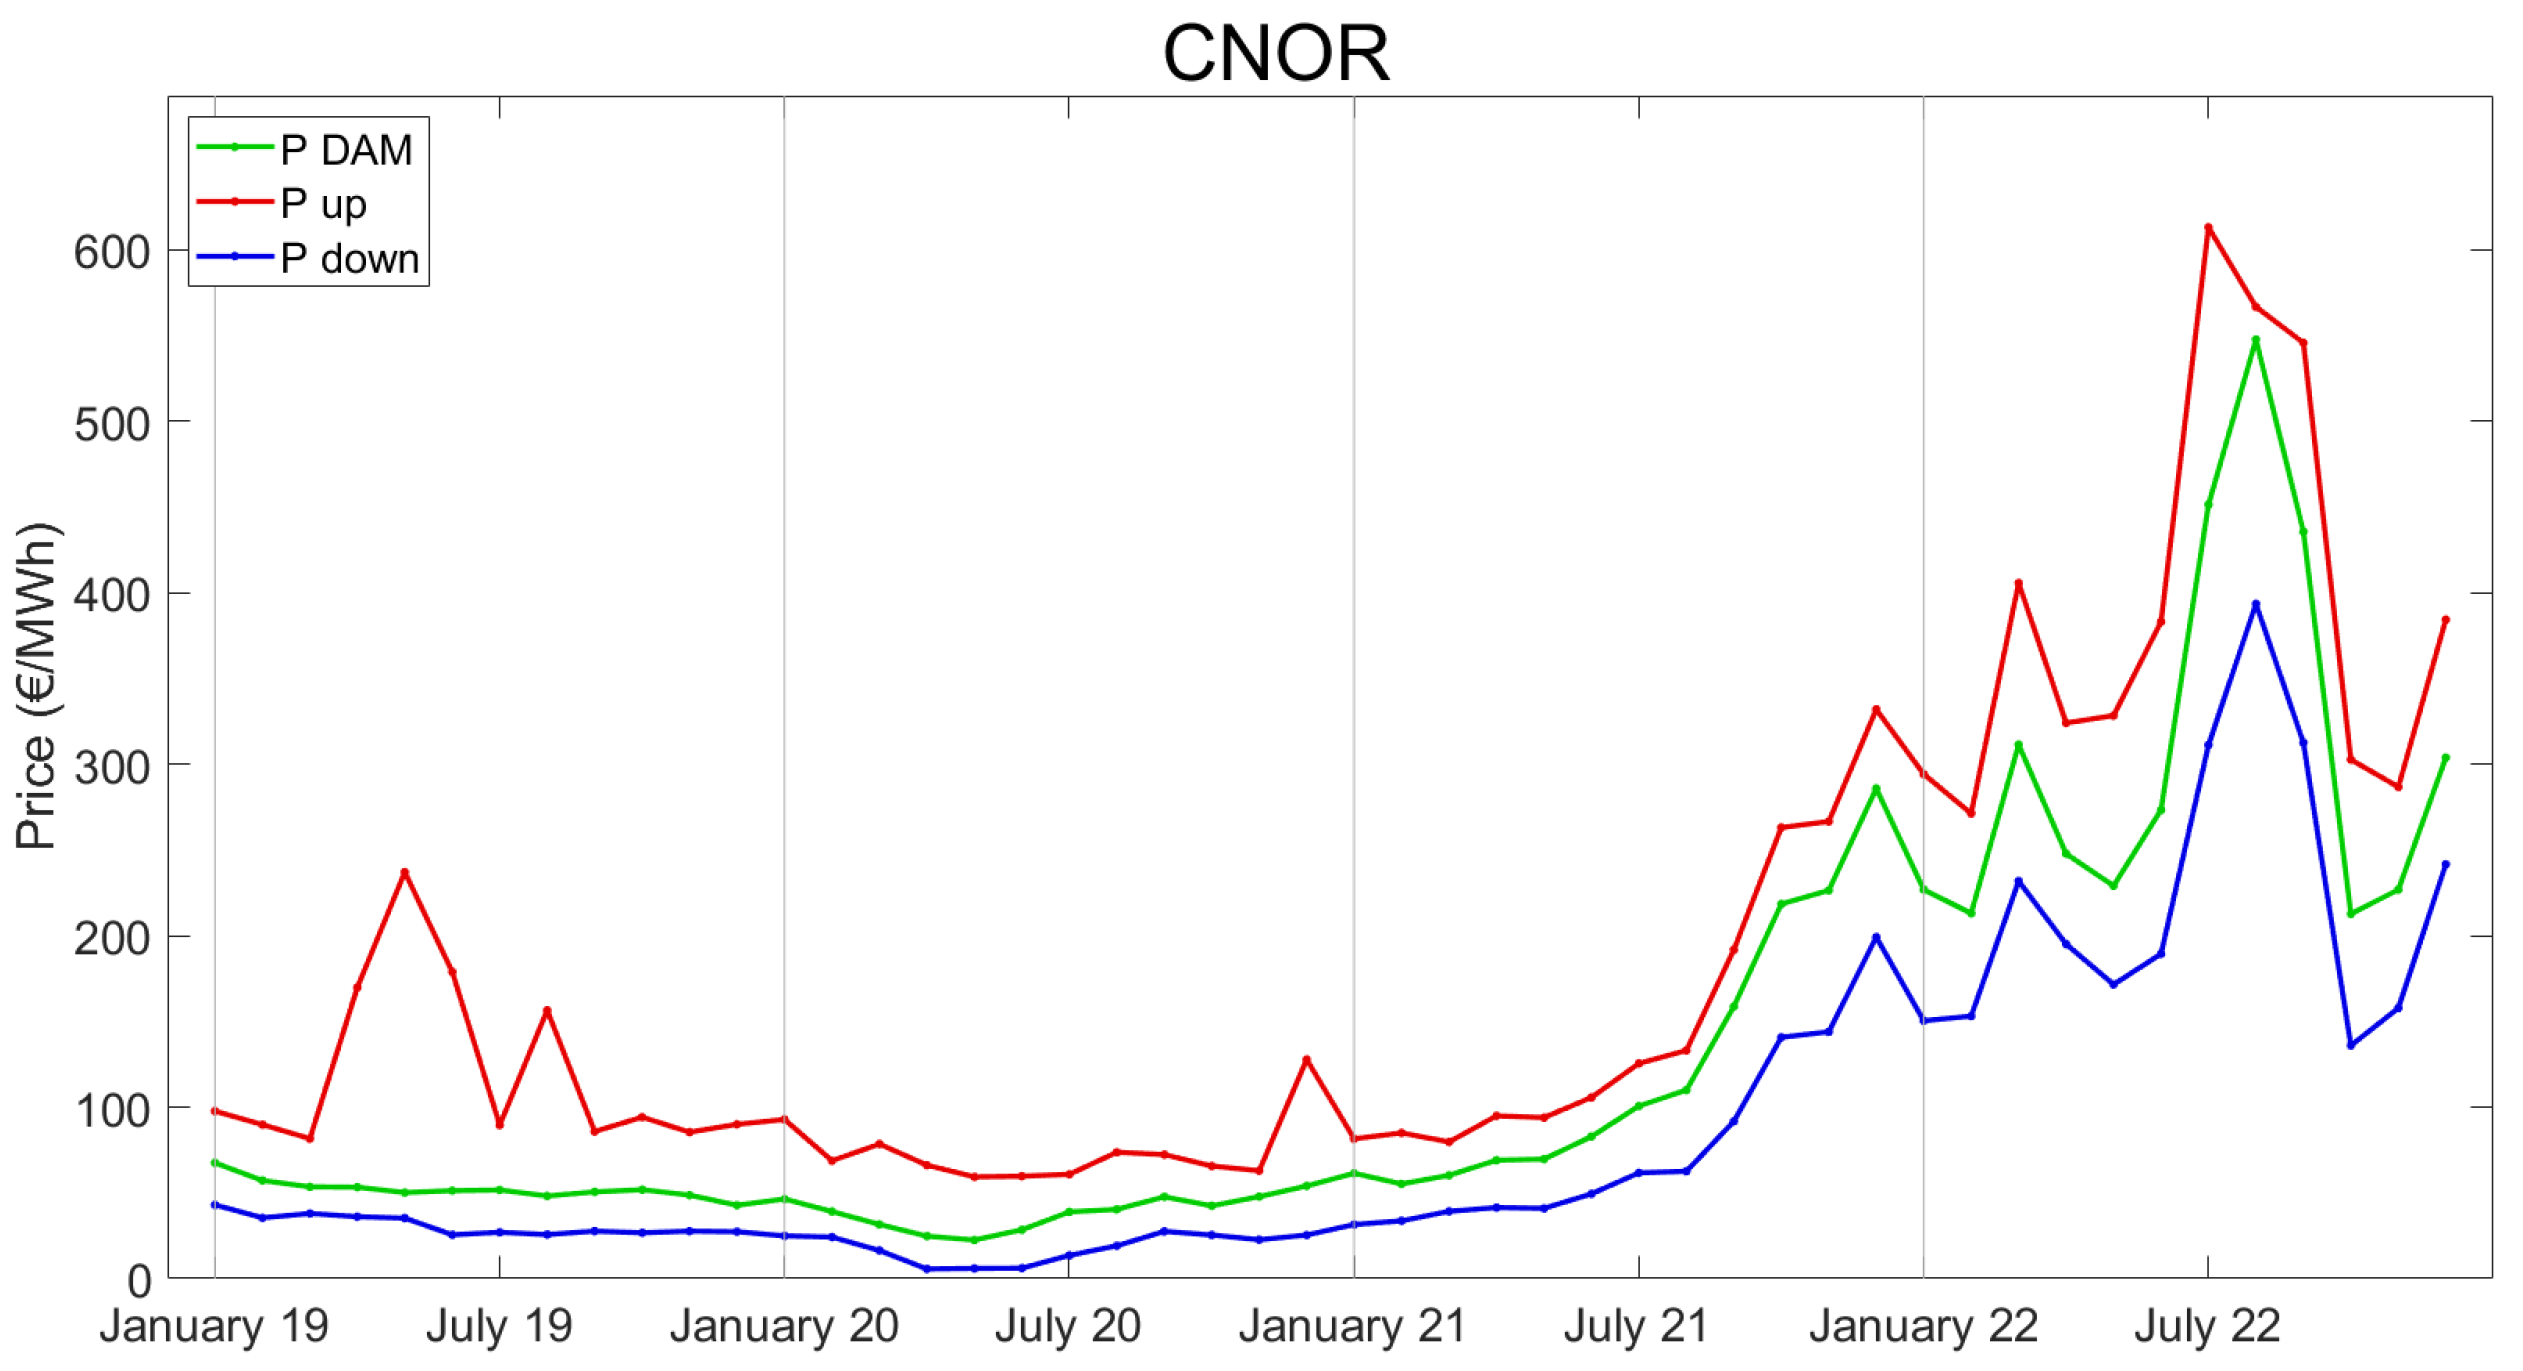
Figure 2 shows the Day-Ahead Market (DAM) and ASM prices trend of this zone, displaying peaks and dips that characterize the time frame observed. In the chart, ASM prices refer to upward (
Pup) and downward (
Pdown) tertiary reserve and balancing regulation, in red and blue, respectively, while
PDAM, in green, is the energy price on the DAM. All the values reported in the diagram, in particular, are monthly averages obtained from the 24-hour values of each day of any singular month considered. To this purpose, output data from different markets have been collected: the price of the offers accepted on the ASM for
Pup and
Pdown, and the DAM energy clearing price for
PDAM. According to the ASM discipline in place, a PU increasing its power production on request of the TSO (upward regulation) receives a remuneration
Pup, while in case of power reduction resulting from a dispatching order (downward regulation), the PU is required to pay back an amount
Pdown for every megawatt-hour saved with respect to the DAM binding schedule. In regard to the CNOR zone,
Pup shows values from 116% to 400% of
PDAM, while
Pdown assumes values from 21% to 79% of
PDAM. Of particular interest are the first months of COVID-19 spread, starting in March 2020, since the lowest electricity prices ever were experienced:
PDAM of May 2020 reached an average value of 22.54 €/MWh with a minimum equal to 1.0 €/MWh in the central hours of the day. Consequently, also
Pup and
Pdown faced very low values. In the second half of 2020, the prices started rising again with the re-opening of industries and commercial activities in Italy, reaching values comparable with the year 2019, and never stopped with a steeper and steeper trend as the war between Russia and Ukraine became more imminent. The highest price in the DAM for CNOR was reached on 29 August 2022 at 8 pm with a value equal to 871.00 €/MWh. The following month, September 2022, is then characterized by a slight reduction in the electricity prices that continued in October as well, with an increase in the last months of 2022.
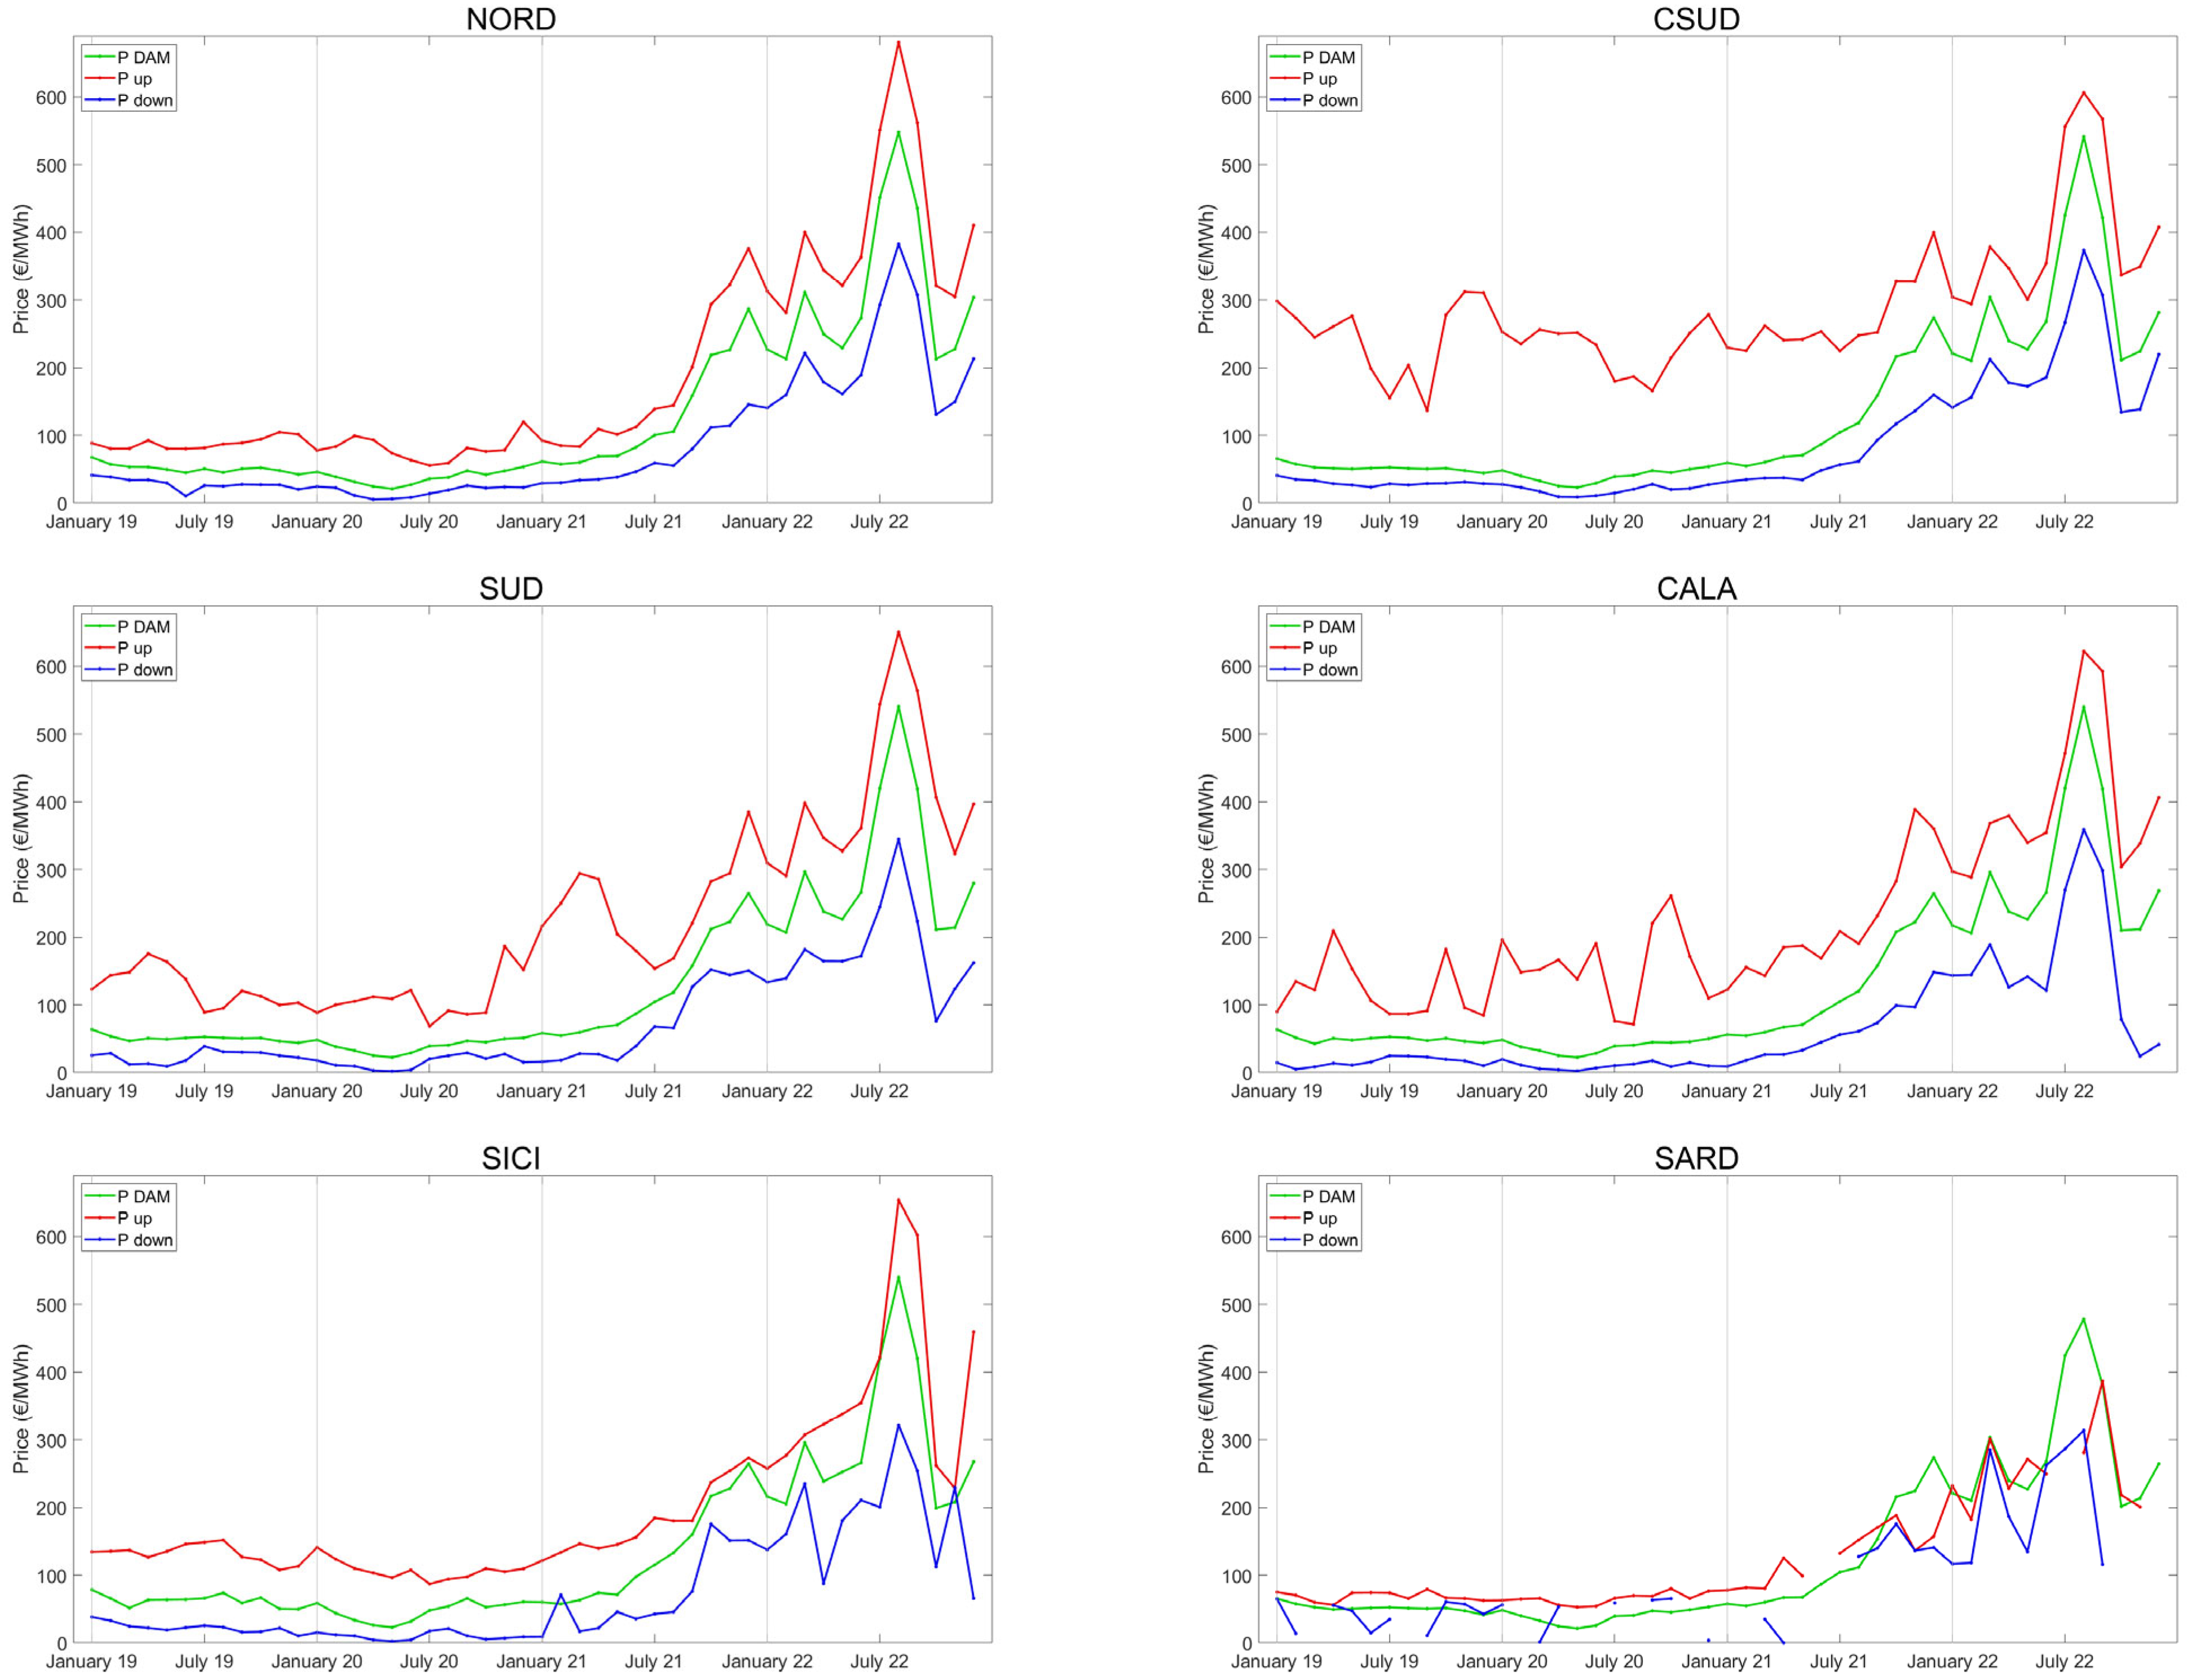
The same general trend has been observed for the other Italian market regions, with peaks and dips characterizing the time frame analyzed.
Figure 3 shows the monthly average price trends of the other market zones. It is possible to observe that the general development of the curves is quite the same in the entire Italian territory, with
Pup higher than
PDAM and
Pdown lower than
PDAM on average. In particular,
PDAM and
Pdown present a trend very similar to the one observed for CNOR, while
Pup turns out to be more floating and characterized by higher values and many peaks and dips in the southern regions of the country. Regarding SICI (Sicily) market zone, the increase in prices is less steep than in the rest of Italy. As an outlier, SARD (Sardinia) presents a lighter difference between prices of DAM and prices of ASM and a very shattered trend for
Pup, and especially
Pdown. This means that in some months, no offers were accepted on the market for downward regulation, even though bids were presented.
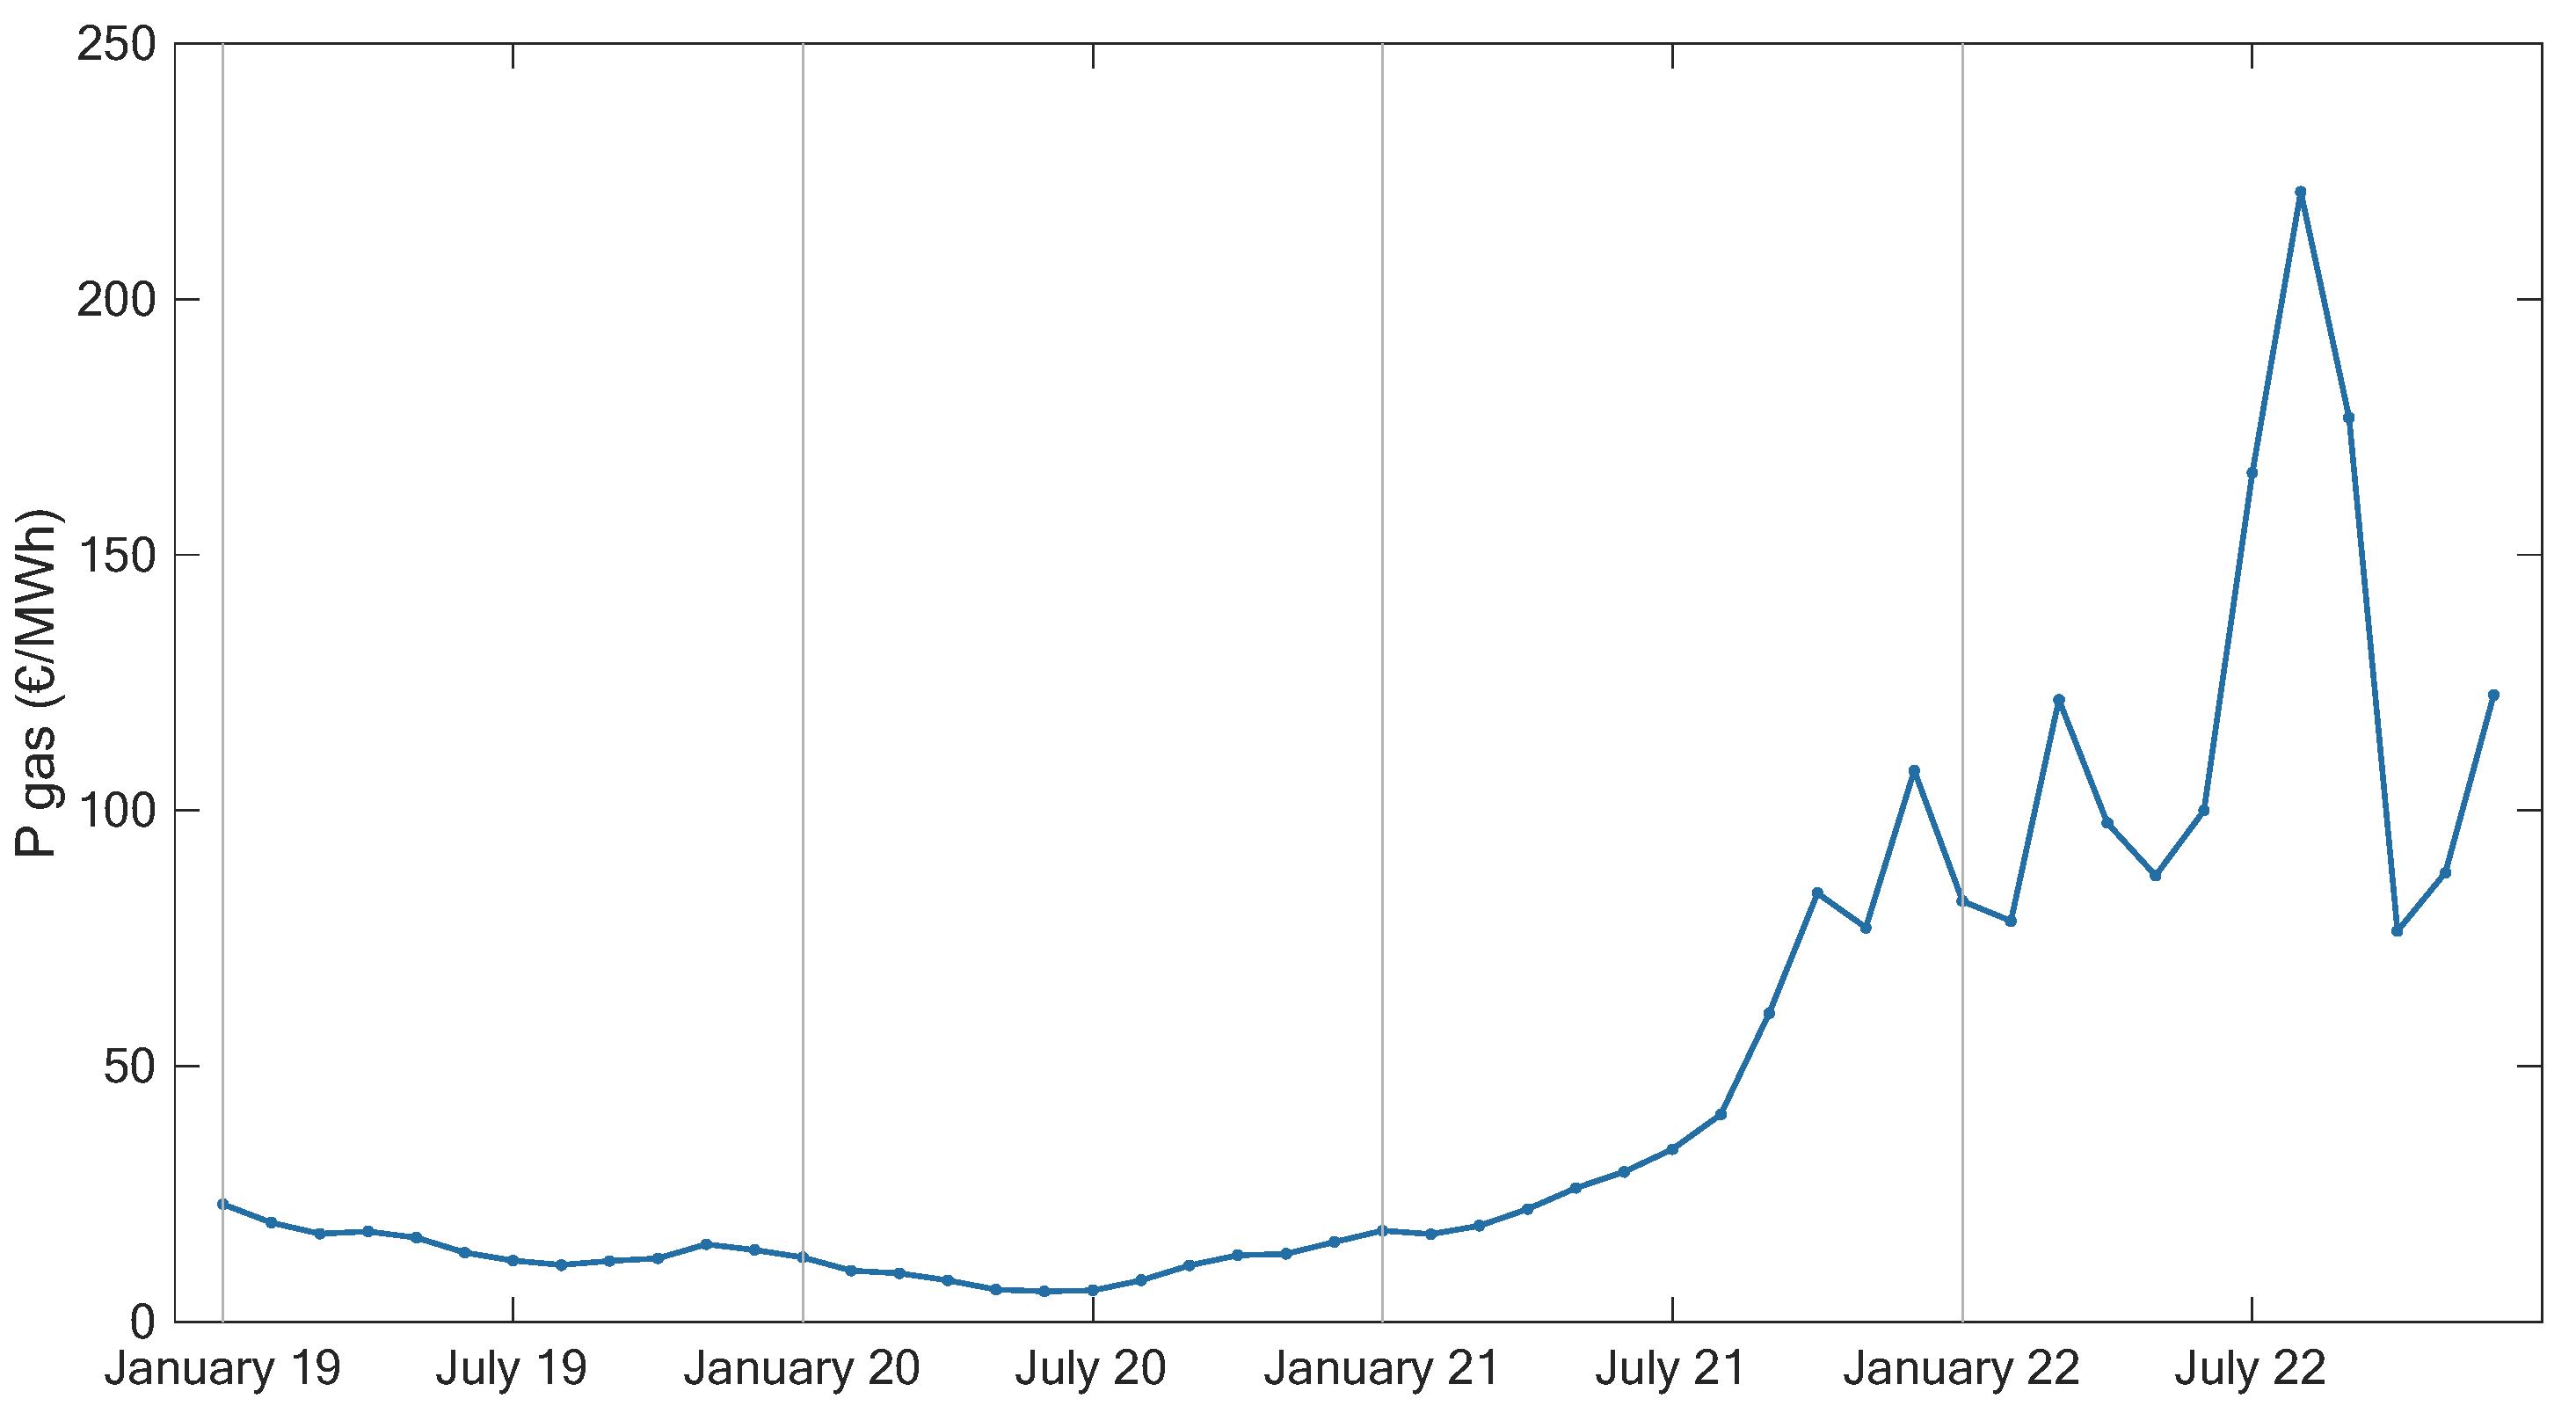
The price trends displayed are strictly related to the important increase in prices of energy commodities (oil and natural gas) in the European markets, which have shown to be very dependent on Russian gas supply. The shape of average electricity prices in
Figure 2 and
Figure 3 is in fact very similar to the one of the average gas prices in
Figure 4, highlighting the strong dependence of the Italian energy system on natural gas (the share of electricity produced from natural gas in 2019 was equal to 43.2% [
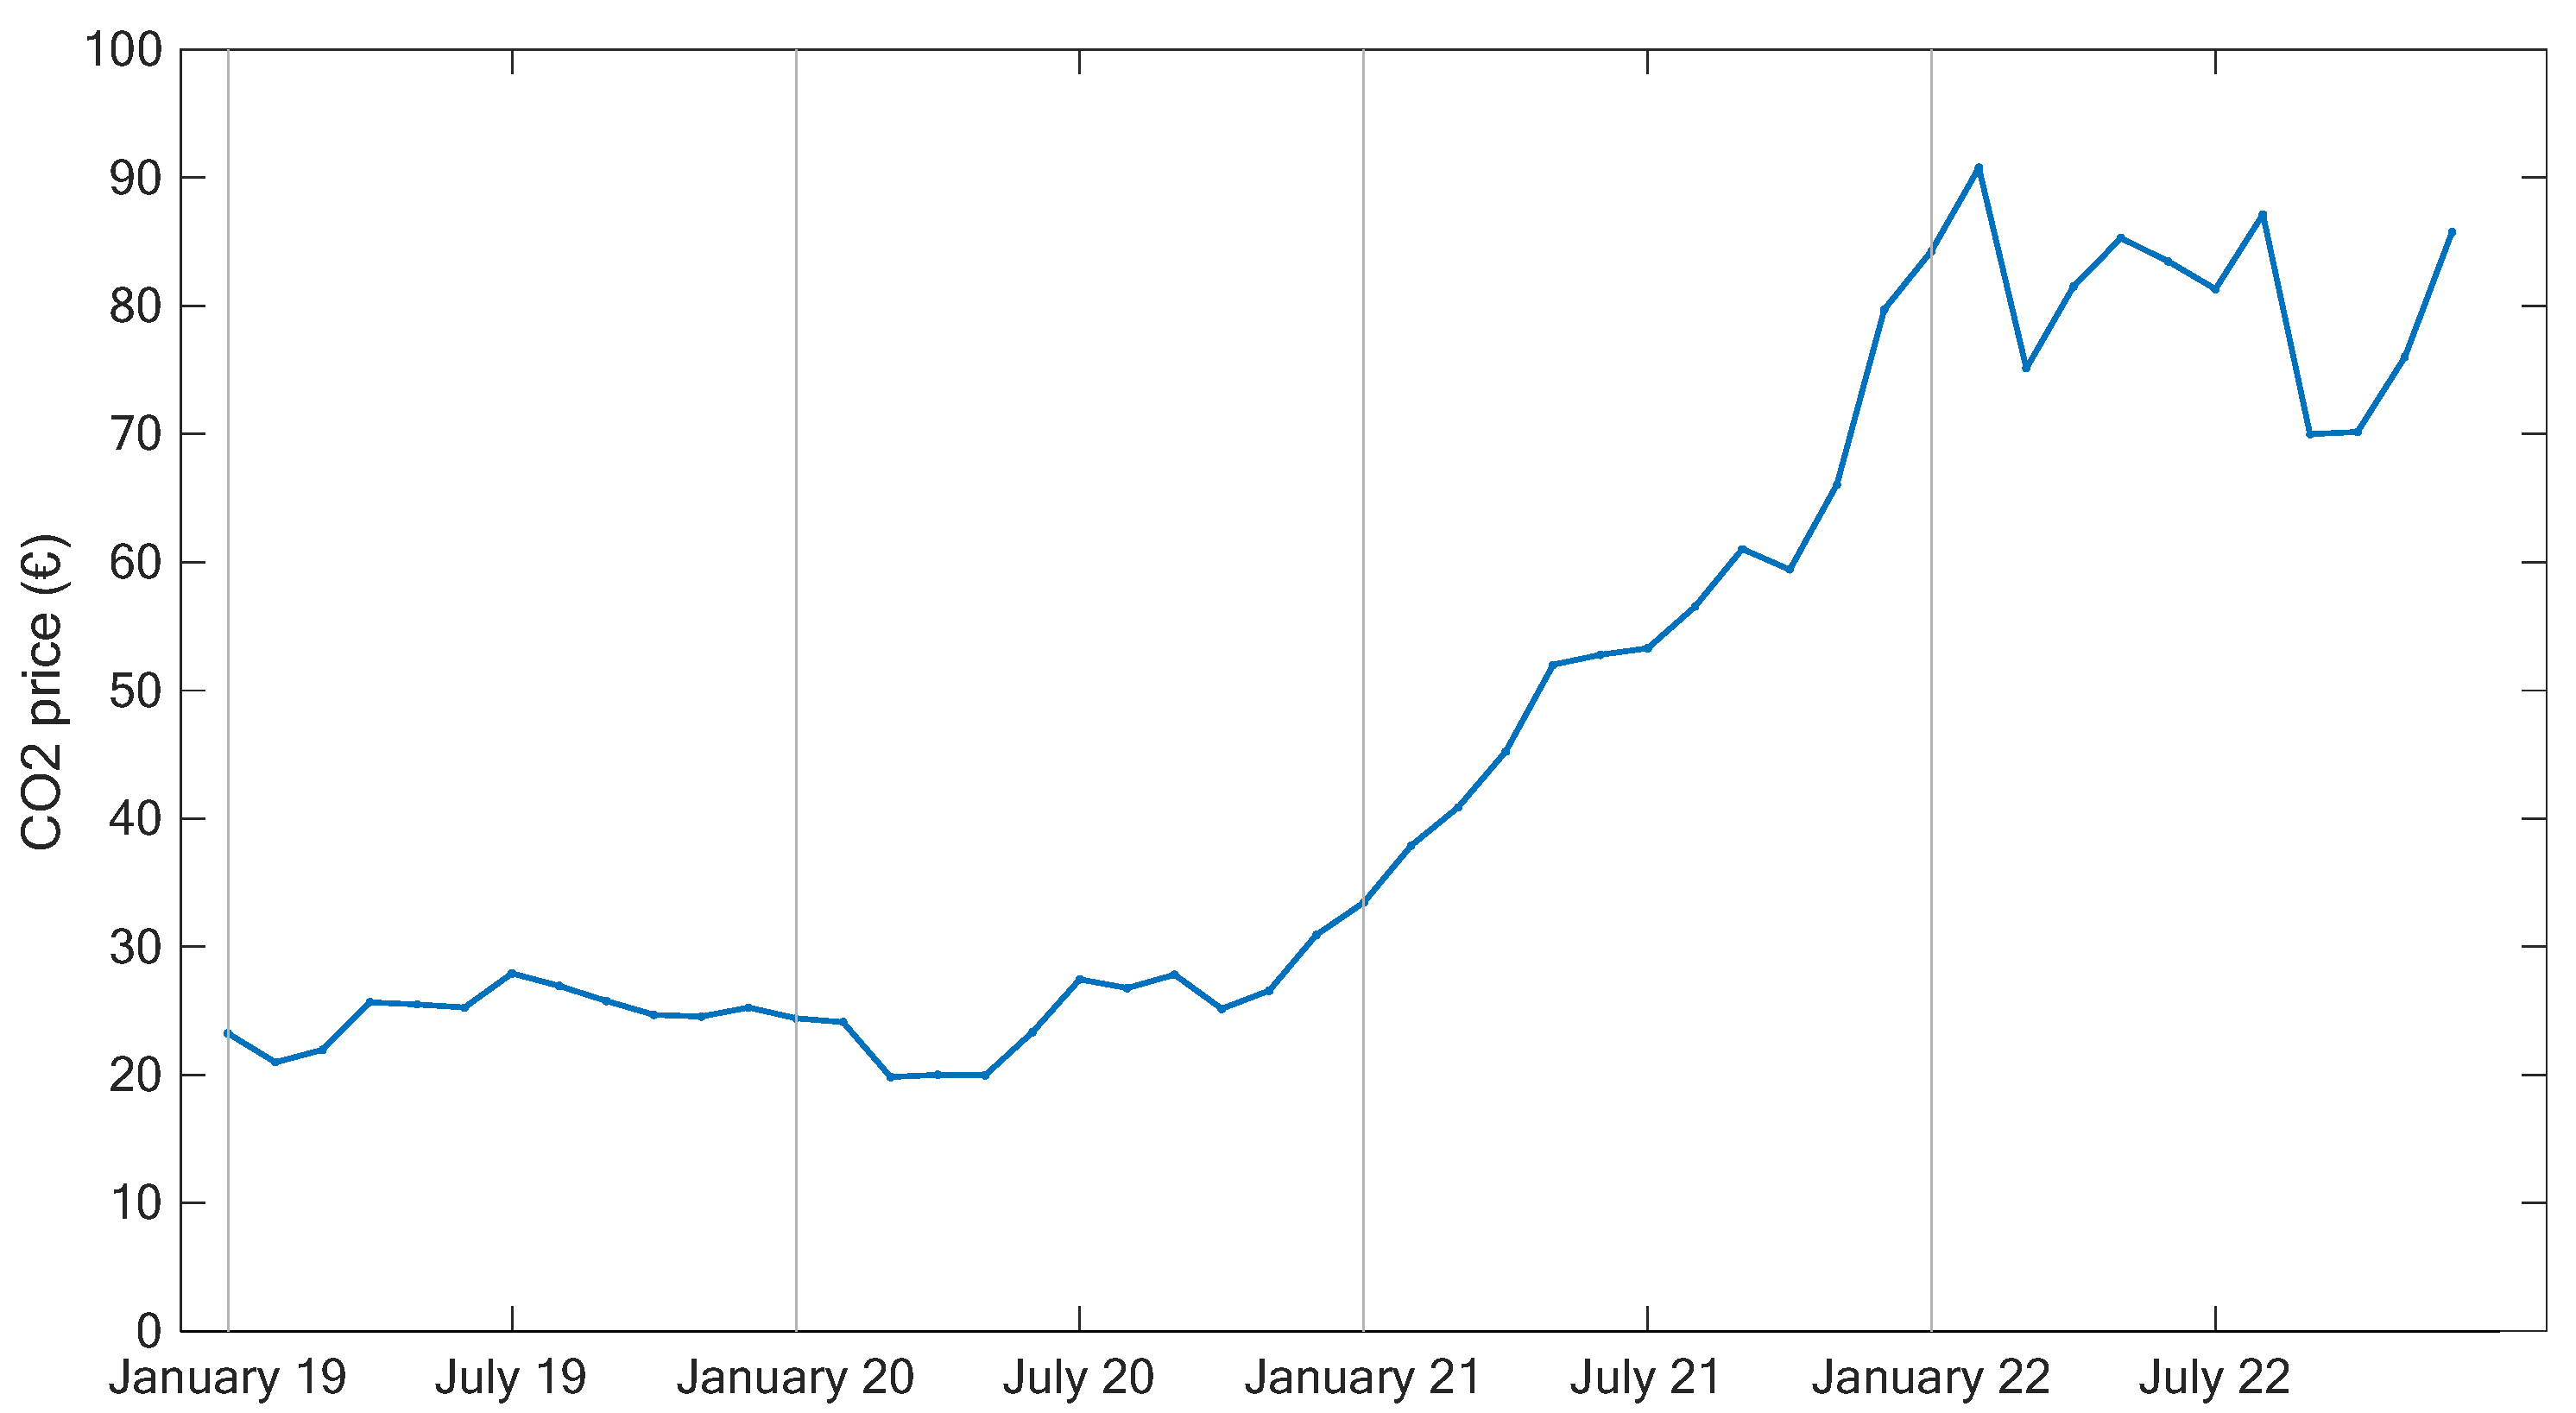
47]). From the analysis performed, it is clear that the general picture is rapidly changing, causing significant volatility in commodities prices. This strongly variable scenario constitutes a problem for small producers, as well as for system operators, since uncertain market forecasts make it difficult to evaluate future investments and define long-term strategies. The same rapid change is also involving the price of emissions allowances (
Figure 5), which in the last four years have more than tripled their average value following the increasingly stringent decarbonization goals.
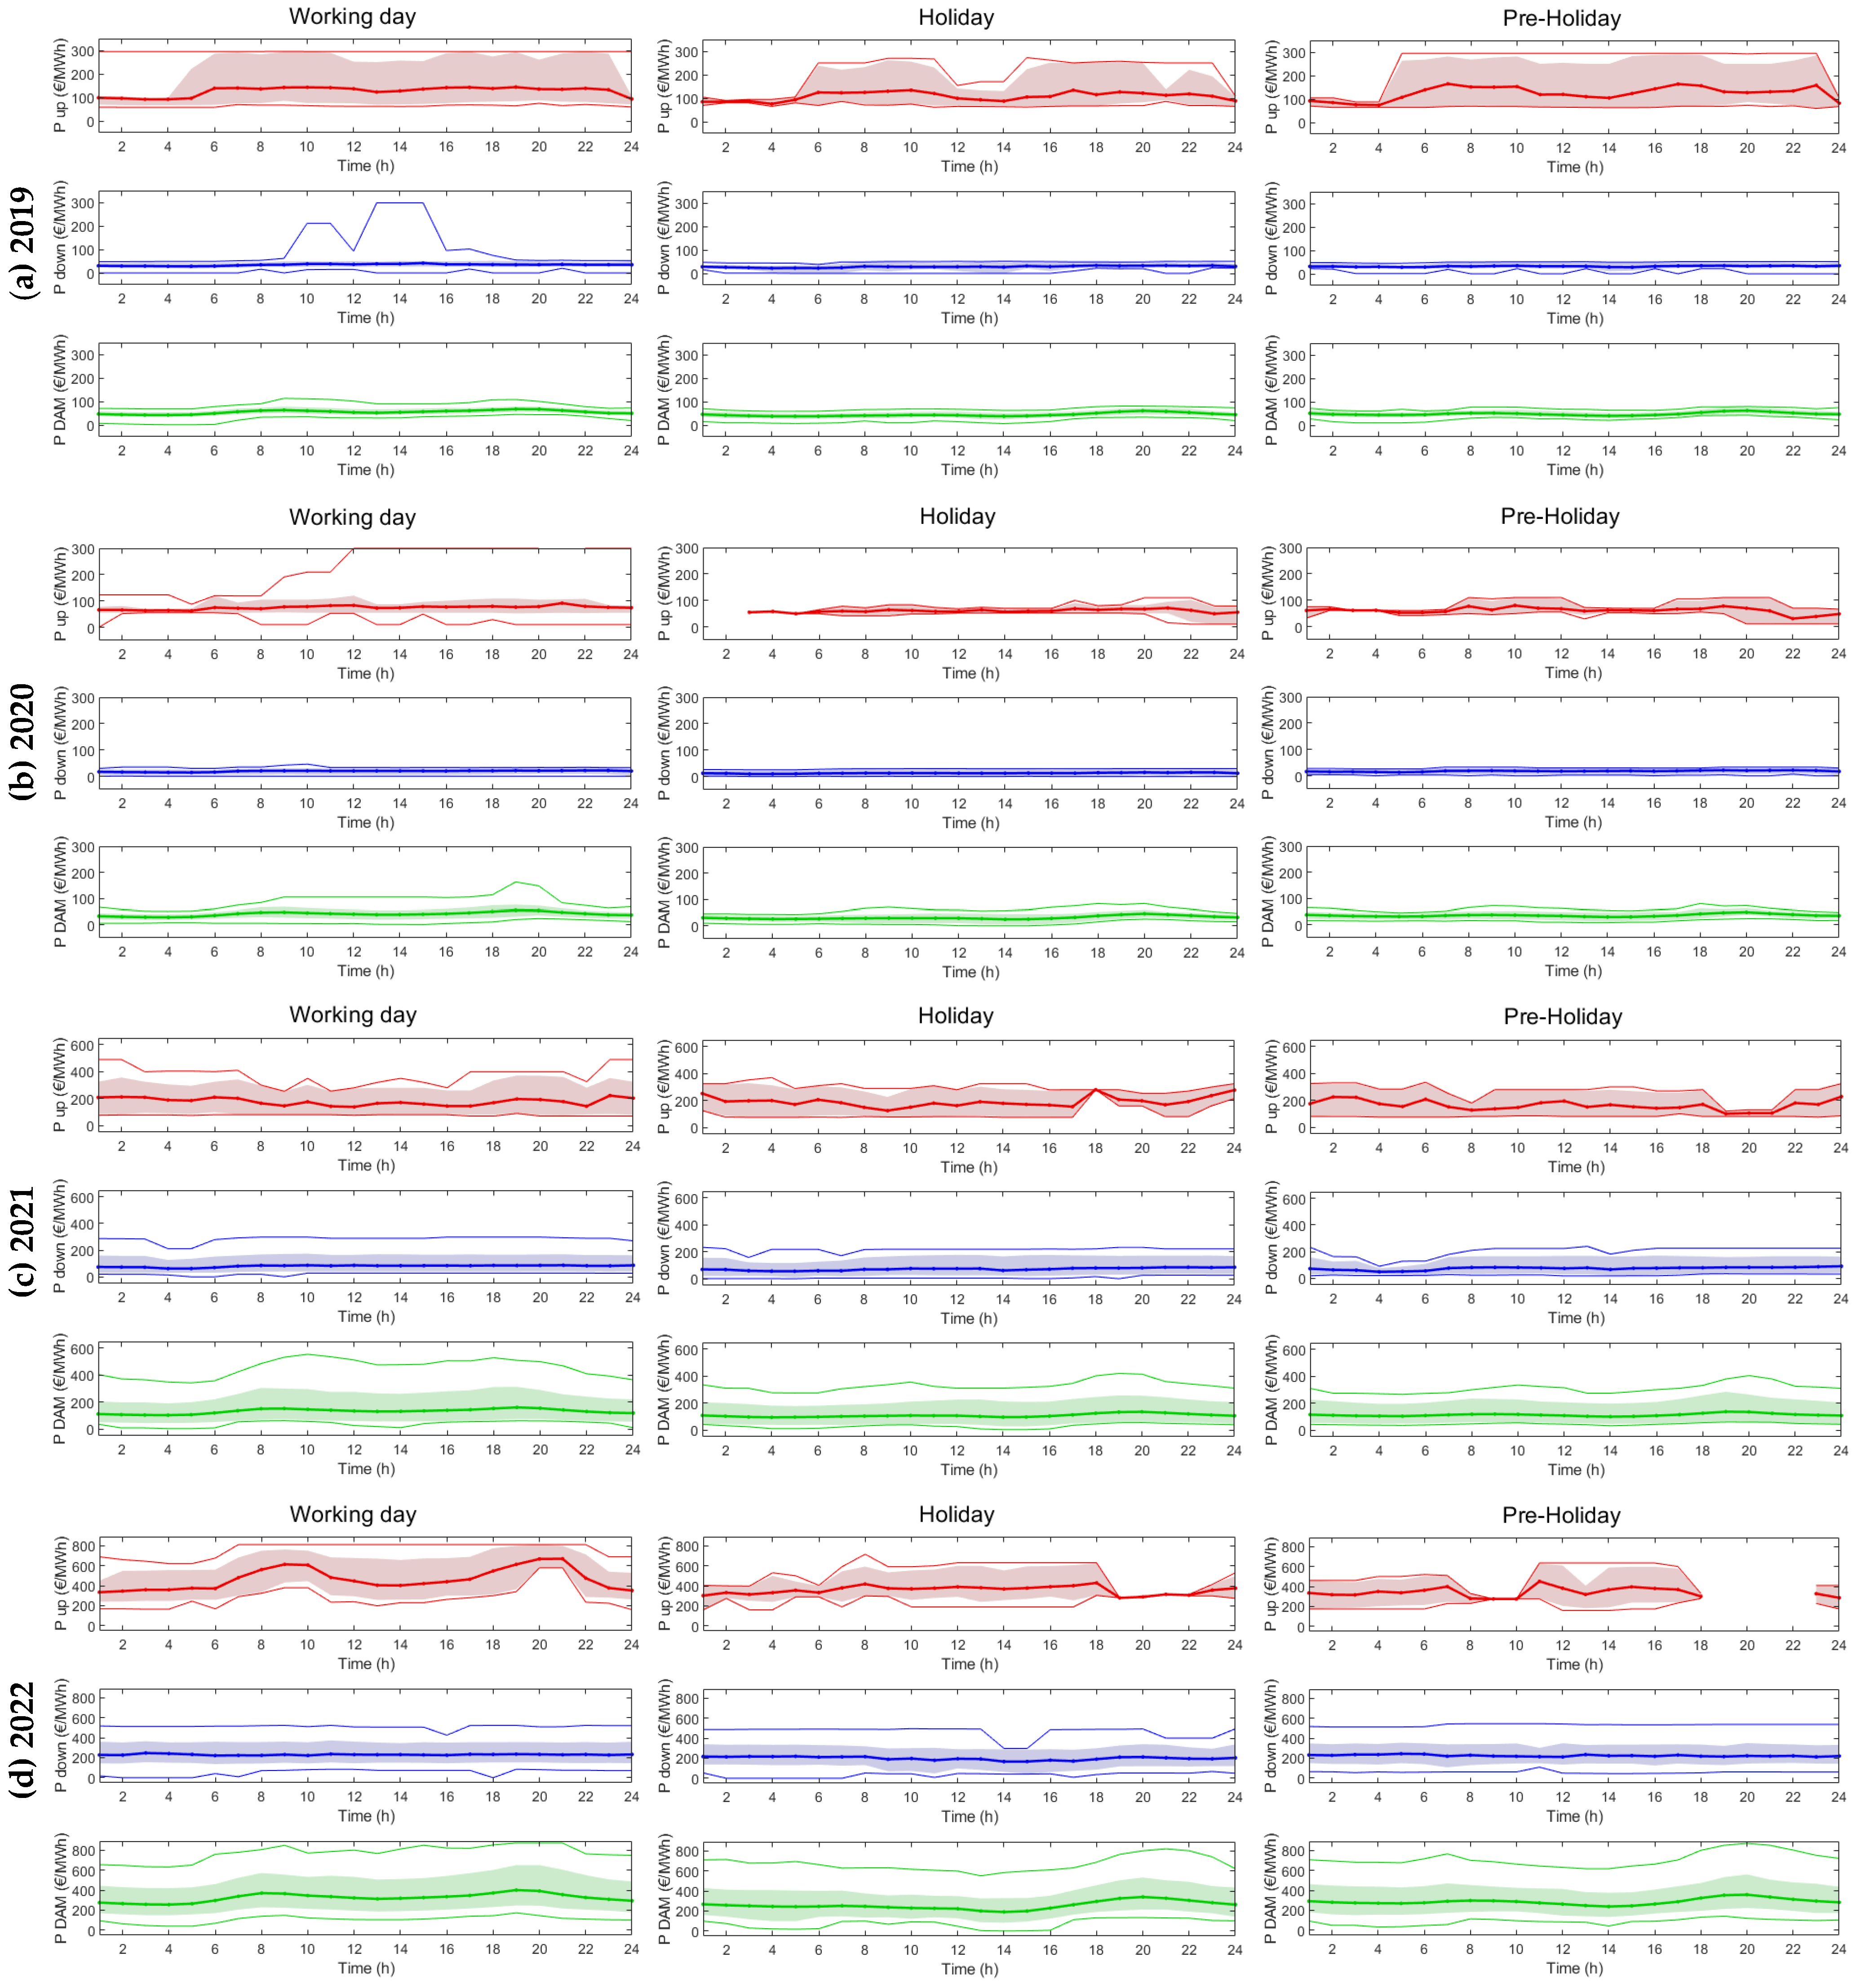
In order to better understand the width of the range of values covered by market prices, starting from the data gathered, an annual trend analysis of DAM and ASM prices has been performed differentiating the market output of a Working day from a Holiday and a pre-Holiday for CNOR market zone. A representation of such price trends is shown in
Figure 6, reporting three groups of charts per year, relevant to the three-day categories under analysis. In the diagrams, the vertical axis shows the different prices considered in €/MWh, while the horizontal axis represents the 24 hours of the day. For Working day analysis, all the business days of the year (from Monday to Friday) have been taken into account, pre-Holiday contains Saturday, and Holiday considers all Sundays and festivities. For each day category, an average for
Pup,
Pdown, and
PDAM has been calculated hour by hour, and price trends have been represented:
Pup in red,
Pdown in blue, and
PDAM in green. The average values are depicted with the thick central line, maximum and minimum values are represented by the thinner lines, and the range between the 10th and the 90th percentile is presented by the colored band. Annual trends are reported here for years 2019, 2020, 2021, and 2022. It is possible to state that the most evident differences are visible by comparing diagrams and values of different years rather than comparing the Working days’ trends with Holidays’ ones. In 2019, looking at the
PDAM graph of Working day (charts in the first column), two slight hills may be recognized in correspondence to morning and evening hours, always remaining under 100 €/MWh. Maximum and minimum lines remain quite close to the average thick line, and the 10th—90th percentiles band is practically undetectable since it covers a maximum of ± 10 €/MWh deviation from the average.
In regard to 2020, the curve of Working day’s PDAM is comparable to the one of the previous year, both in shape and average values: the only difference is that in 2020, a wider range of prices has been experienced with maximum values equal to 163.1 €/MWh in the evening hours. Both in 2019 and 2020, the price cap of Pup equal to 300 €/MWh has been respected; in 2020, the 10th–90th percentiles band is less extended than in 2019, and Pup even reached the price floor of 0 €/MWh. Looking at the PDAM graph of the Working day of 2021, the average price, around 200 €/MWh, is clearly higher than in the previous years, characterized by values of approximately 100 €/MWh. This is due to the strong increase in energy market prices experienced in 2021. As well as for Pup and Pdown, the colored band is wider, while the maximum line is far above the 90th percentile, reaching values of 555 €/MWh at 10 a.m. Year 2022 is characterized by the highest prices ever experienced in the Italian electricity market; PDAM curve presents two hills, one in the morning between hours 8 and 10, and one in the evening between hours 18 and 21, and the maximum line lies quite high in the chart, reaching the values of 871.00 €/MWh in the evening of 29 August.
It is evident that the considerable volatility of electricity prices, especially in the last few years, was affected by the global pandemic and the war in Ukraine. Gas prices as well are characterized by high volatility and strong dependency on the historical context. In the ten-year period from 2010 to 2019, the gas price remained quite constant, covering an interval between 15 and 25 €/MWh [
47], but, in the last couple of years, it has shown its historic minimum and maximum, reaching a 600% increase on the previous years. The growth of gas price has already caused an inevitable increase in the prices of energy and fuel, significantly impacting the economy, already threatened by the pandemic.
Looking at the trend of average monthly prices of different market zones of Italy, it is clear that the volatility of prices for upward/downward regulation, affecting all the regions of the country, constitutes a big problem. This is true for large Production Units connected to the transmission system, because the unpredictability and volatility of market prices make it very difficult to perform effective investment planning, but this issue impacts even more DER units given the technical and economic challenges affecting specifically these generation technologies.
5. Profitability for DERs of ASM Participation: Case Studies Definition
The profitability of different DER production technologies of providing upward and downward regulation on the ASM has been evaluated. Firstly, in the analysis, the current market structure and regulations are assumed to be in place. Then, some possible evolutions to such regulations are envisaged and their potential to improve the accessibility to the ASM is discussed. In order to evaluate the impact on the earnings arising from the provision of ancillary services by DERs, different combinations of energy selling schemes and incentives have been considered, as explained in
Table 2. The case studies to consider have been chosen by prioritizing the most representative ones for small-sized DERs (≤1 MW). In particular, D.M. 4 July 2019 (so-called D.M. FER [
50]) is the latest incentive scheme issued in Italy for power plants from RES and residual waste gas. It establishes that, under a given power threshold of the PU (250 kW), the incentive is paid under the form of FiT (see
Table 1); on the contrary, for larger plants, a Feed-in-Premium is granted to the producer (on top of the revenues from the free market). However, in the latter case, the amount of the FiP is variable and calculated to provide a total remuneration (DAM + FiP) equal to a target price. The FiP can even be negative if the price paid on the DAM is greater than the target remuneration. In this case, the user must refund the system a sum equal to the negative price. In all, the FiP has been designed so as to provide a fixed remuneration to the user, exactly the same as the FiT scheme in place for smaller UPs. The main difference is that the user must sell by its own the energy on the DAM. The incentive structure of D.M. 4 July 2019 is similar to the ones provided by D.M. 5 July 2012 and D.M. 23 June 2016; therefore, for the sake of brevity, only the most recent one will be considered in the following. Moreover, in order to gain some insights into the potential effect of different incentives on the profitability of ASM participation, in the numerical analyses that follow the FiP incentive scheme put in force by a past regulation, D.M. 6 August 2010 (so-called III Conto Energia), will be also considered. Finally, the case of a non-incentivized RES unit will be included in the evaluations, which sells energy on the DAM according to the “dedicated withdrawal” mechanism.
The just-mentioned plant configurations will be compared to a reference case relevant to a natural gas-fired thermal PU participating in the free market and being subject to the payment of emission allowances, i.e., the typical case of a conventional power plant supplying regulation services to the power system today.
Regarding D.M. 4 July 2019, it applies to wind, hydro, photovoltaic and residual gas-fueled power plants. The amount of the FiT depends on the production technologies and PU’s size. In particular, the Ministerial Decree establishes that from 2021, new DER power plants are rewarded with the FiT, as seen in
Table 3. The tariff is reduced by a factor taking into account the energy losses between the meter and the point of connection to the grid (equal to 2.3% for PUs connected to the MV grid [
51]). Moreover, further reductions can apply for delays during the connection process or by voluntary decision of the producer (if a FiT curtailment is accepted by the user, a higher priority is assigned in the ranking to the incentive request).
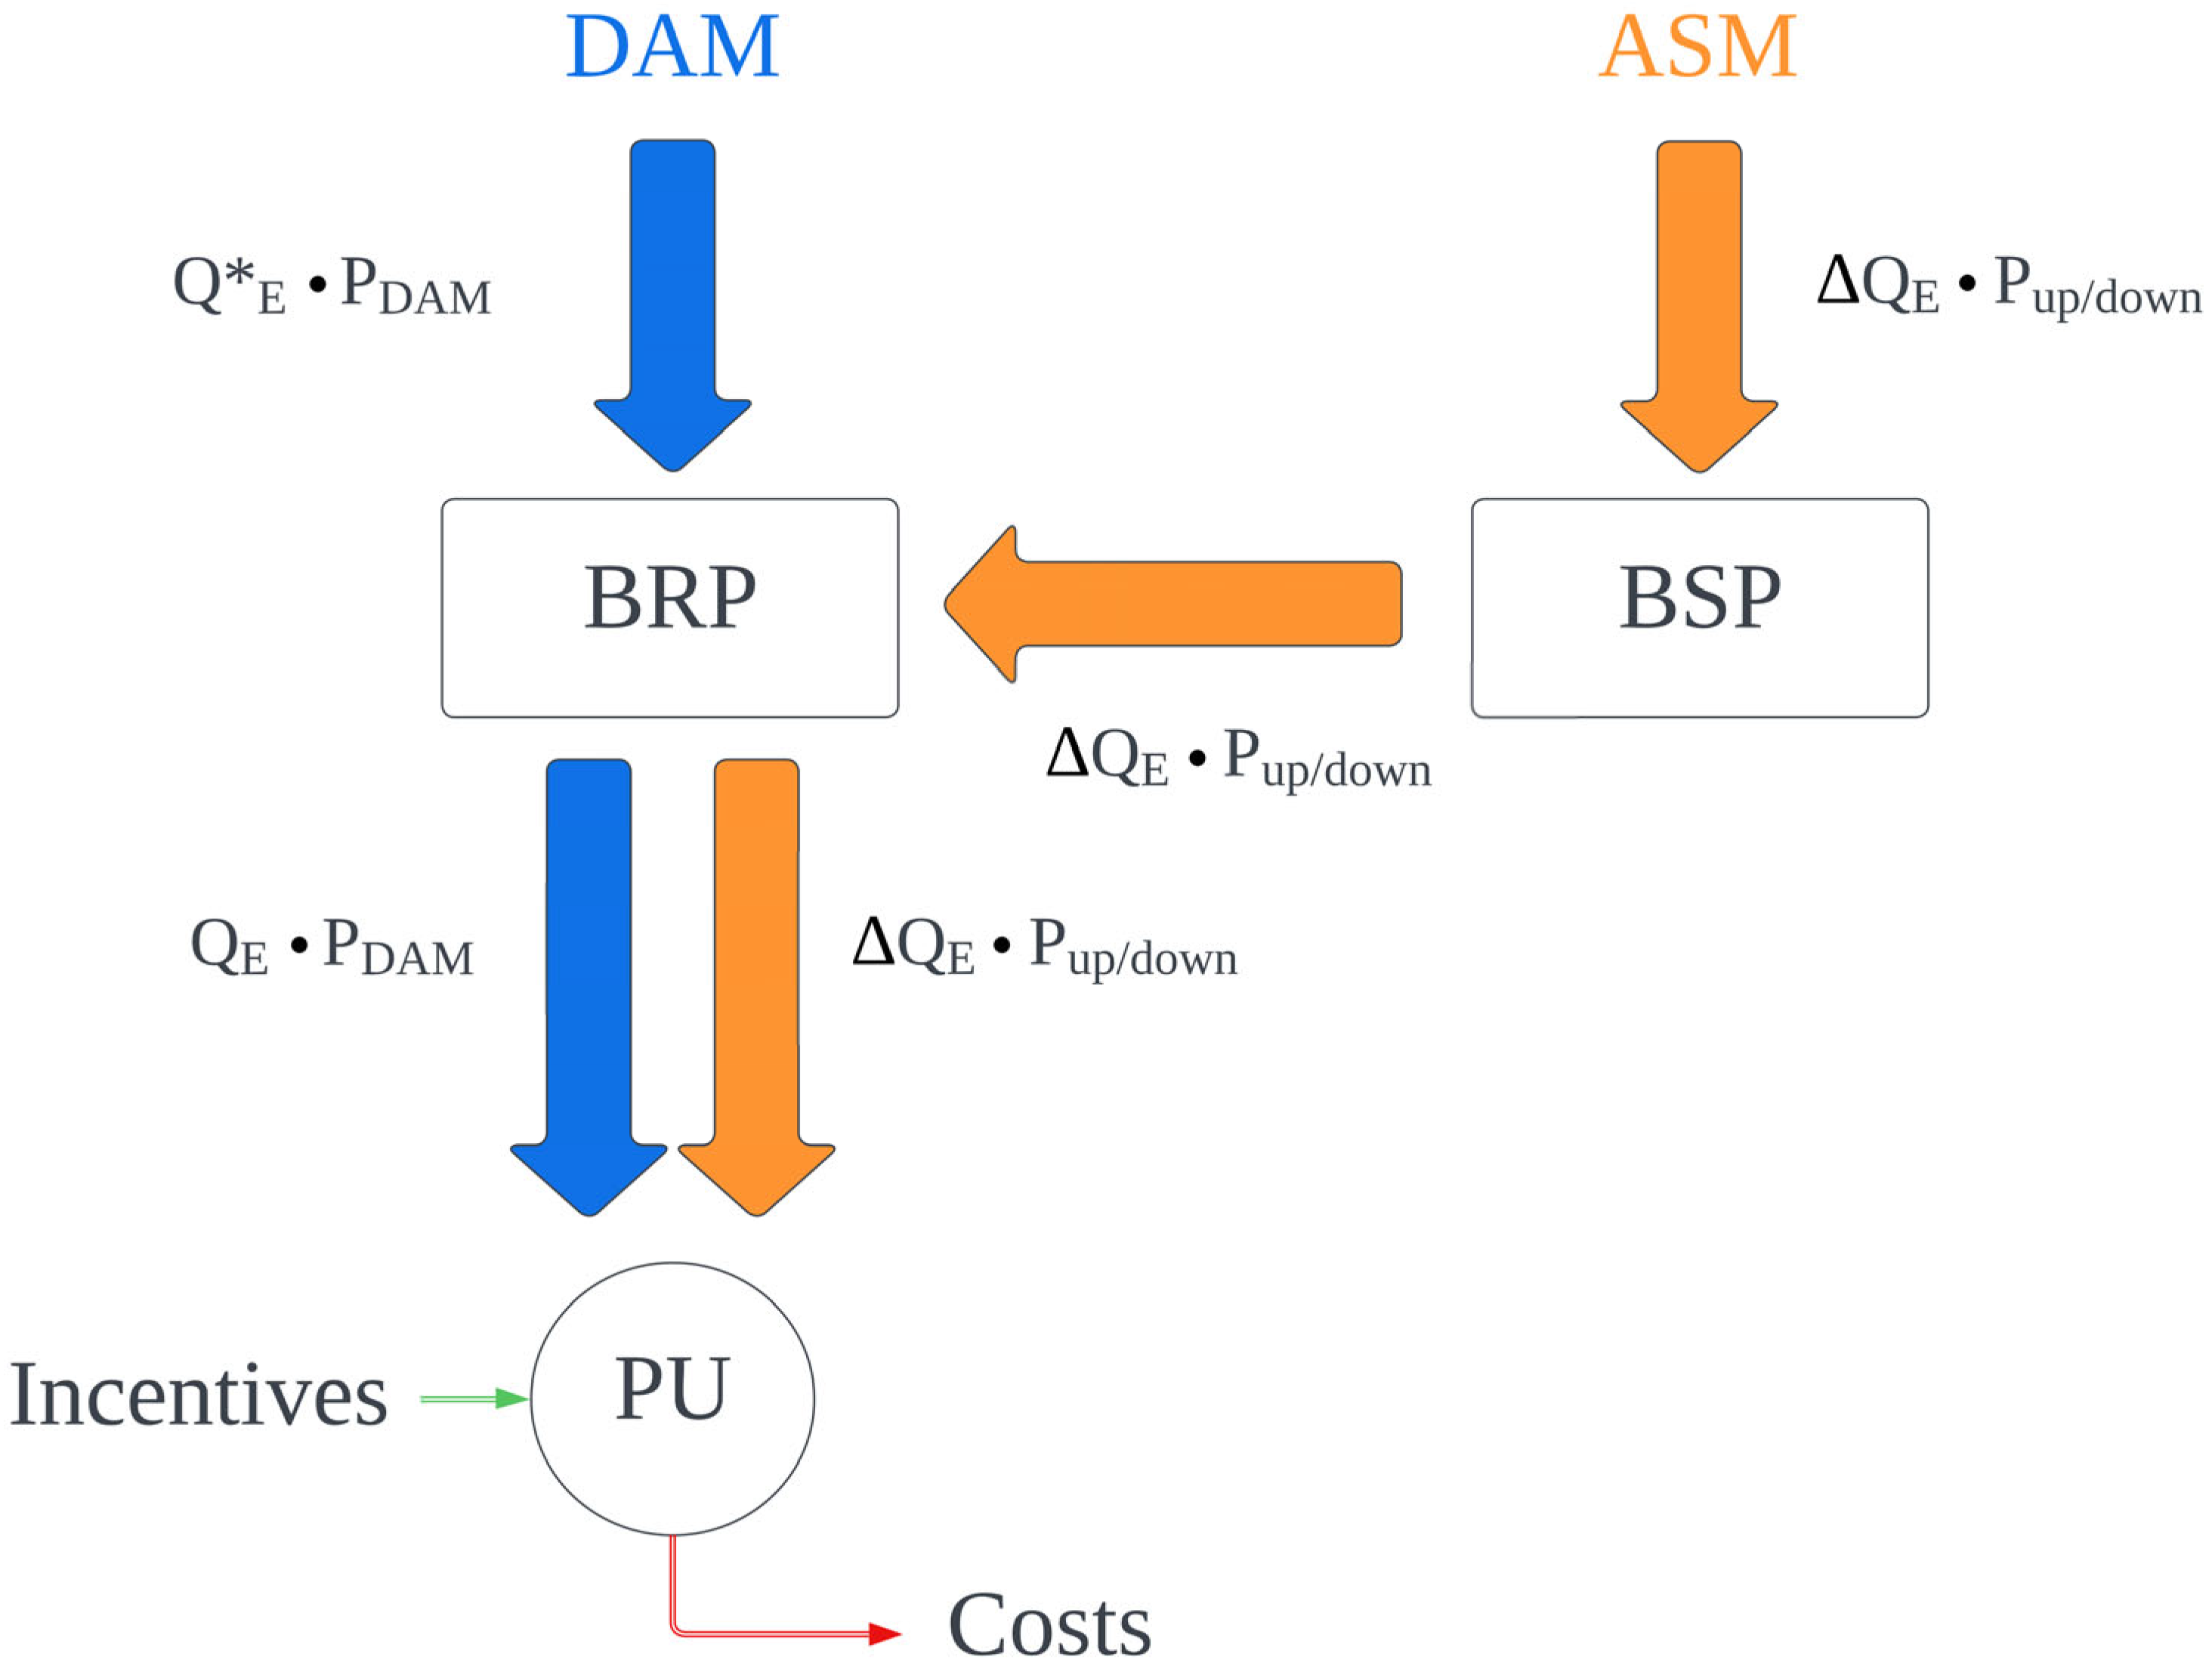
For the study, it is supposed that the DER unit accesses the market through an Aggregator (Balancing Service Provider: BSP), which could also coordinate the power exchanges of a portfolio of DERs to supply the services requested on the ASM. To this purpose, the reference architecture provided by the ENTSO-E Electricity Balancing Guideline [
52] is considered, in which the BSP is defined as a market participant with reserve-providing units or reserve-providing groups (DERs) able to supply balancing services to the TSO (thus operating as an interface between DERs and the ASM), while the Balance Responsible Party (BRP) is the market participant responsible for DER imbalances (thus the subject having in charge to declare a binding power schedule on the DAM on behalf of the DER producer).
According to this reference scheme, the economic flows of the PU are depicted in
Figure 7: the ones related to the DAM are reported in blue, while those concerning the ASM are shown in orange. The smaller arrows in the diagram represent other economic quantities, such as incentives (if any) and production costs. In particular, a generic PU receives a reward for the electricity injected into the grid that is a function of the results of the DAM, in terms of quantity
QE (MWh) and price (
PDAM, in €/MWh). The BRP is entitled to declare, the day ahead, the power schedule for the PU and to respect it in the real time. In general, the energy price paid by the BRP to the PU, according to the agreement in place between the parties, could be different from
PDAM (e.g., as a consequence of possible revenue margins of the BRP); however, for the sake of simplicity, in this study, they will be assumed equal. Similarly, the binding power schedule declared on the market could be different from the actual one (respectively,
Q*E and
QE): in this case, an imbalance occurs (e.g., forecasting error) that is usually penalized by economic fees. In addition, this situation is neglected, so,
Q*E and
QE in the diagram will be considered equal.
When participating in the ASM, the PU is remunerated for the regulation supplied ∆QE (MWh) at prices Pup and Pdown (€/MWh), respectively, for upward and downward power variations. In addition, in this case, the effect of possible power imbalances is neglected. PUs could be characterized by variable production costs, related to the functioning of the plant and/or the amount of fuel utilized. Moreover, they can receive incentives depending on the nature of the plant itself and the legislation in place at the date of entry into service of the power plant.
According to the assumptions made, all power plants reported in
Table 2 can play on the DAM and concurrently on the ASM. These plants are usually always able to provide downward regulation by reducing their power output and the amount of electricity injected into the grid. On the other hand, it is not possible for every PU to regulate upward: the electricity produced from RES takes precedence over the one from conventional sources, hence NP-RES plants (wind, PV plants, run-of-river hydro) always operate at their maximum power [
48]. Instead, power plants based on fossil fuels and programmable RES (e.g., hydroelectric power plants with reservoir) can also increase their power output as well. The upper limit of power production of each plant depends on the nature of the generator and its capability chart.
The total earnings of the producer can be computed by the following Equation (1), as the balance of all the economic flows involving the PU. This balance should be positive in order for it to become profitable for the PU to participate in the ASM.
In the economic analyses that follow, proper assumptions are made to exemplify the effect of the remuneration schemes in place on the revenues of the DER unit on the ASM:
a unitary amount of energy production, paid at PDAM, is assumed to be sold on the DAM (QE = 1 MWh);
a unitary amount of upward/downward regulation (tertiary reserve or balancing control), paid, respectively, at Pup/Pdown, is assumed to be sold on the ASM (∆QE = 1 MWh for upward regulation; ∆QE = −1 MWh for downward regulation);
PDAM,
Pup and
Pdown are obtained as the monthly average of the real prices registered on the Italian DAM and ASM in the CNOR (Central–Northern Italy) market zone in the period from January 2019 to December 2022 (
Figure 2);
the incentive value (Inc) is defined according to the specific legislative arrangement considered;
Costs are computed as in Equation (2).
The item
Costs is computed considering both direct and indirect variable costs for the PU:
For gas-fired power plants,
Cfuel is the cost of fuel, assumed to be directly proportional to the total quantity of energy produced by the plant (
QE + ∆
QE). It is determined as the monthly average of the values actually observed on the Italian gas DAM (
Figure 4).
Cvar represents the other costs depending on the amount of energy produced by the generator. For RES units, this quantity can be considered almost negligible [
53,
54,
55], while for fossil-fueled PUs it includes the cost for emission allowances and the other variable costs related to the technology considered, which are assumed to increase linearly with the increase in the total energy produced (
QE + ∆
QE). Even if modern thermal units are perfectly capable of increasing or decreasing their electricity production according to automatic control systems or external signals, for these technologies, ramping costs (
Cramp) cannot be considered negligible. Therefore, for thermal units,
Cvar and
Cramp have been both grossly estimated in 1.88 €/MWh [
56,
57]. On the contrary, as for
Cvar, the amount of
Cramp is neglected for RES units. Finally, for the gas-fired thermal unit, an efficiency of 58% and an emission rate of 206.28 kg CO
2/MWh
th (combined cycle power plant) have been assumed [
58].
6. Profitability for DERs of ASM Participation: Numerical results
In the present section, the potential revenues for a DER unit supplied by the provision of tertiary reserve and balancing regulation on the ASM are evaluated in the current situation. Then, alternative scenarios, characterized by possible evolutions in the market structure and incentive regulation, are discussed.
6.1. Current situation
As already introduced, PUs providing downward regulation are required to pay back an amount of the reward received on the DAM proportional to the quantity of energy curtailed. Hence, the plant loses part of the profits by providing such regulation, which therefore is convenient only whenever the avoided costs (e.g., fuel) are higher than
Pdown, i.e., by reformulating Equations (1) and (2) when
On the other hand, the supply of upward regulation is economically advantageous for the producer with respect to the DAM participation only when the price paid on the ASM is greater than the cost covered by the PU to increase the power production less the incentives:
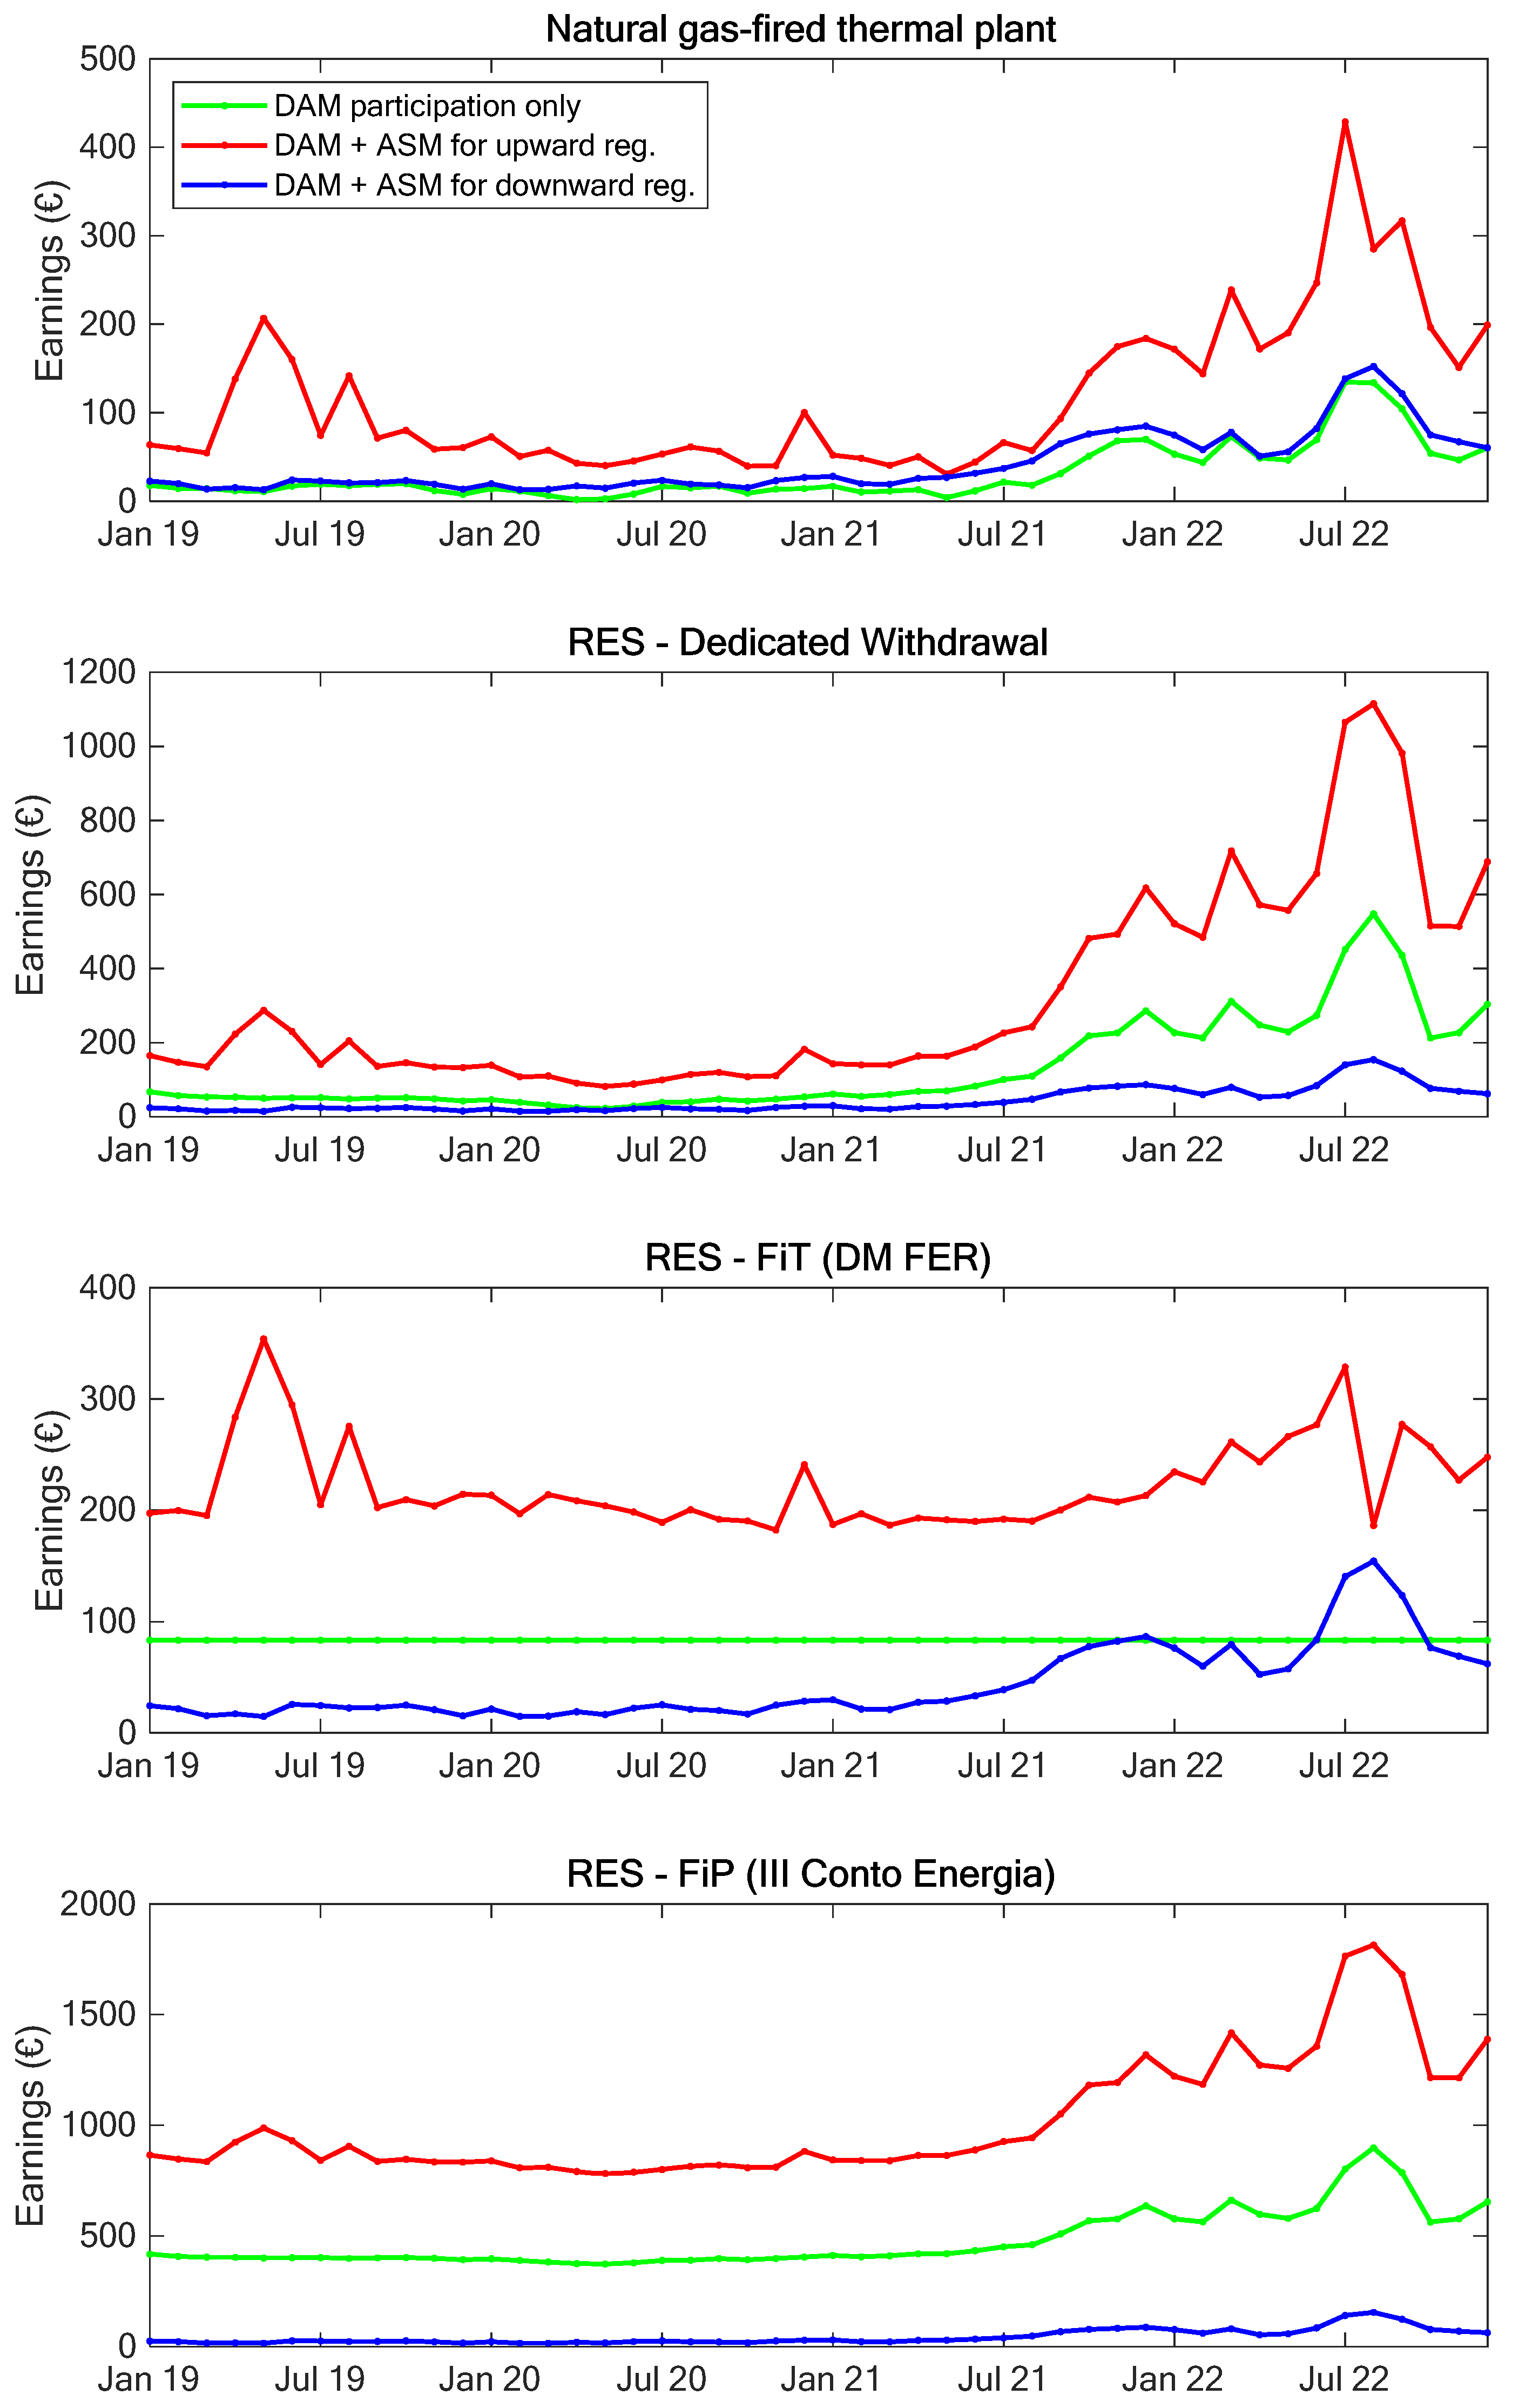
Figure 8 reports the earnings computed with Equation (1), defined according to the assumptions of
Section 5, for all the technologies and remuneration schemes considered in the analysis (see
Table 2), in the case of DAM participation only, and assuming the PU also offers downward or upward regulation on the ASM. For DER plants incentivized by D.M. 4 July 2019 (D.M. FER), a FiT equal to 83.53 €/MWh is considered (PV plant with rated power included between 100 and 1000 kW), while for D.M. 6 August 2010 (III Conto Energia; valid only for photovoltaic plants), a FiP of 350 €/MWh (PV plant installed on rooftop) is assumed.
Regarding the provision of downward regulation (represented by the blue curve), one can observe that, according to the average prices registered on the ASM over the period under investigation, the only UP technology taking advantage of the regulation (earnings greater than with the DAM participation only, in green) is the natural gas-fired thermal plant. This is an expected result because, as already mentioned, downward regulation is affordable only when the savings achieved due to power curtailment (fuel consumption and other variable cost reduction) are higher than the price to pay on the ASM (Pdown). For the same reason, considering RES-based DER units, in case of regulation, the earnings are almost always significantly lower than those faced when the UP only sells energy on the DAM (green line). Therefore, offering downward regulation causes an economic loss to the UP, which is even greater for incentivized power plants, since the rules in place establish that incentives are granted according to the power output actually measured by the user’s energy meter. This is a common issue for all generation technologies having nearly zero marginal cost of production. A particular case in this regard is represented by PUs benefitting from D.M. 4 July 2019 (D.M. FER): when the DAM energy price is greater than the FiT (83.53 €/MWh), e.g., in 2022, it could be more affordable for the power unit to supply downward regulation, thus paying back an amount Pdown for each unit of energy variation, instead of injecting the energy into the grid and be subject to a negative incentive (difference between the FiT target price and the DAM price).
Concerning the upward regulation, this can only be performed by the fossil fuel-based UPs and programmable RES (e.g., hydro with reservoir). From the results obtained, it is possible to conclude that, for those UPs capable of providing upward regulation, it is always convenient to participate in the ASM in this direction since the prices accepted on the market, on average, allow covering the additional costs and making profits.
Regarding the influence of possible incentives on the profitability of the ancillary services provision, it emerges that, in general, the greater the incentives, the greater the losses in case of downward regulation but also the revenues in case of upward regulation.
From the analysis carried out, it is clear that RES power plants, and even more NP-RES not capable of providing upward regulation, are disadvantaged from the actual structure of the Italian ASM and would find it difficult to play on it in a cost-effective way. Generally speaking, the Italian ASM, like almost all the ASMs around the world, was established taking as a reference conventional (i.e., thermal) power plants and meant to suit their characteristics. Therefore, it is of interest to explore possible adjustments to the present framework to solve, or at least mitigate, the issues detected.
6.2. Possible future scenarios
At present, in the Italian energy market, it is not possible to submit offers with negative prices since a price floor of 0 €/MWh is mandatory; in contrast, negative prices are allowed in many other European electricity markets [
35,
59]. Therefore, production technologies like DERs, having nearly zero marginal production costs, cannot attain a viable business case on the ASM. In this section, the economic conditions under which DER units could increase their revenues on the ASM are assessed for the different UP technologies and incentive schemes. This is carried out by evaluating:
the maximum price Pdown to be offered on the ASM below which the provision of the downward regulation is profitable;
the minimum price Pup that is required to make the upward regulation cost-effective.
Both Pdown and Pup are calculated from Equations (3) and (4) as the limit value of the relevant inequality, considering the historical costs trends and amount of incentives.
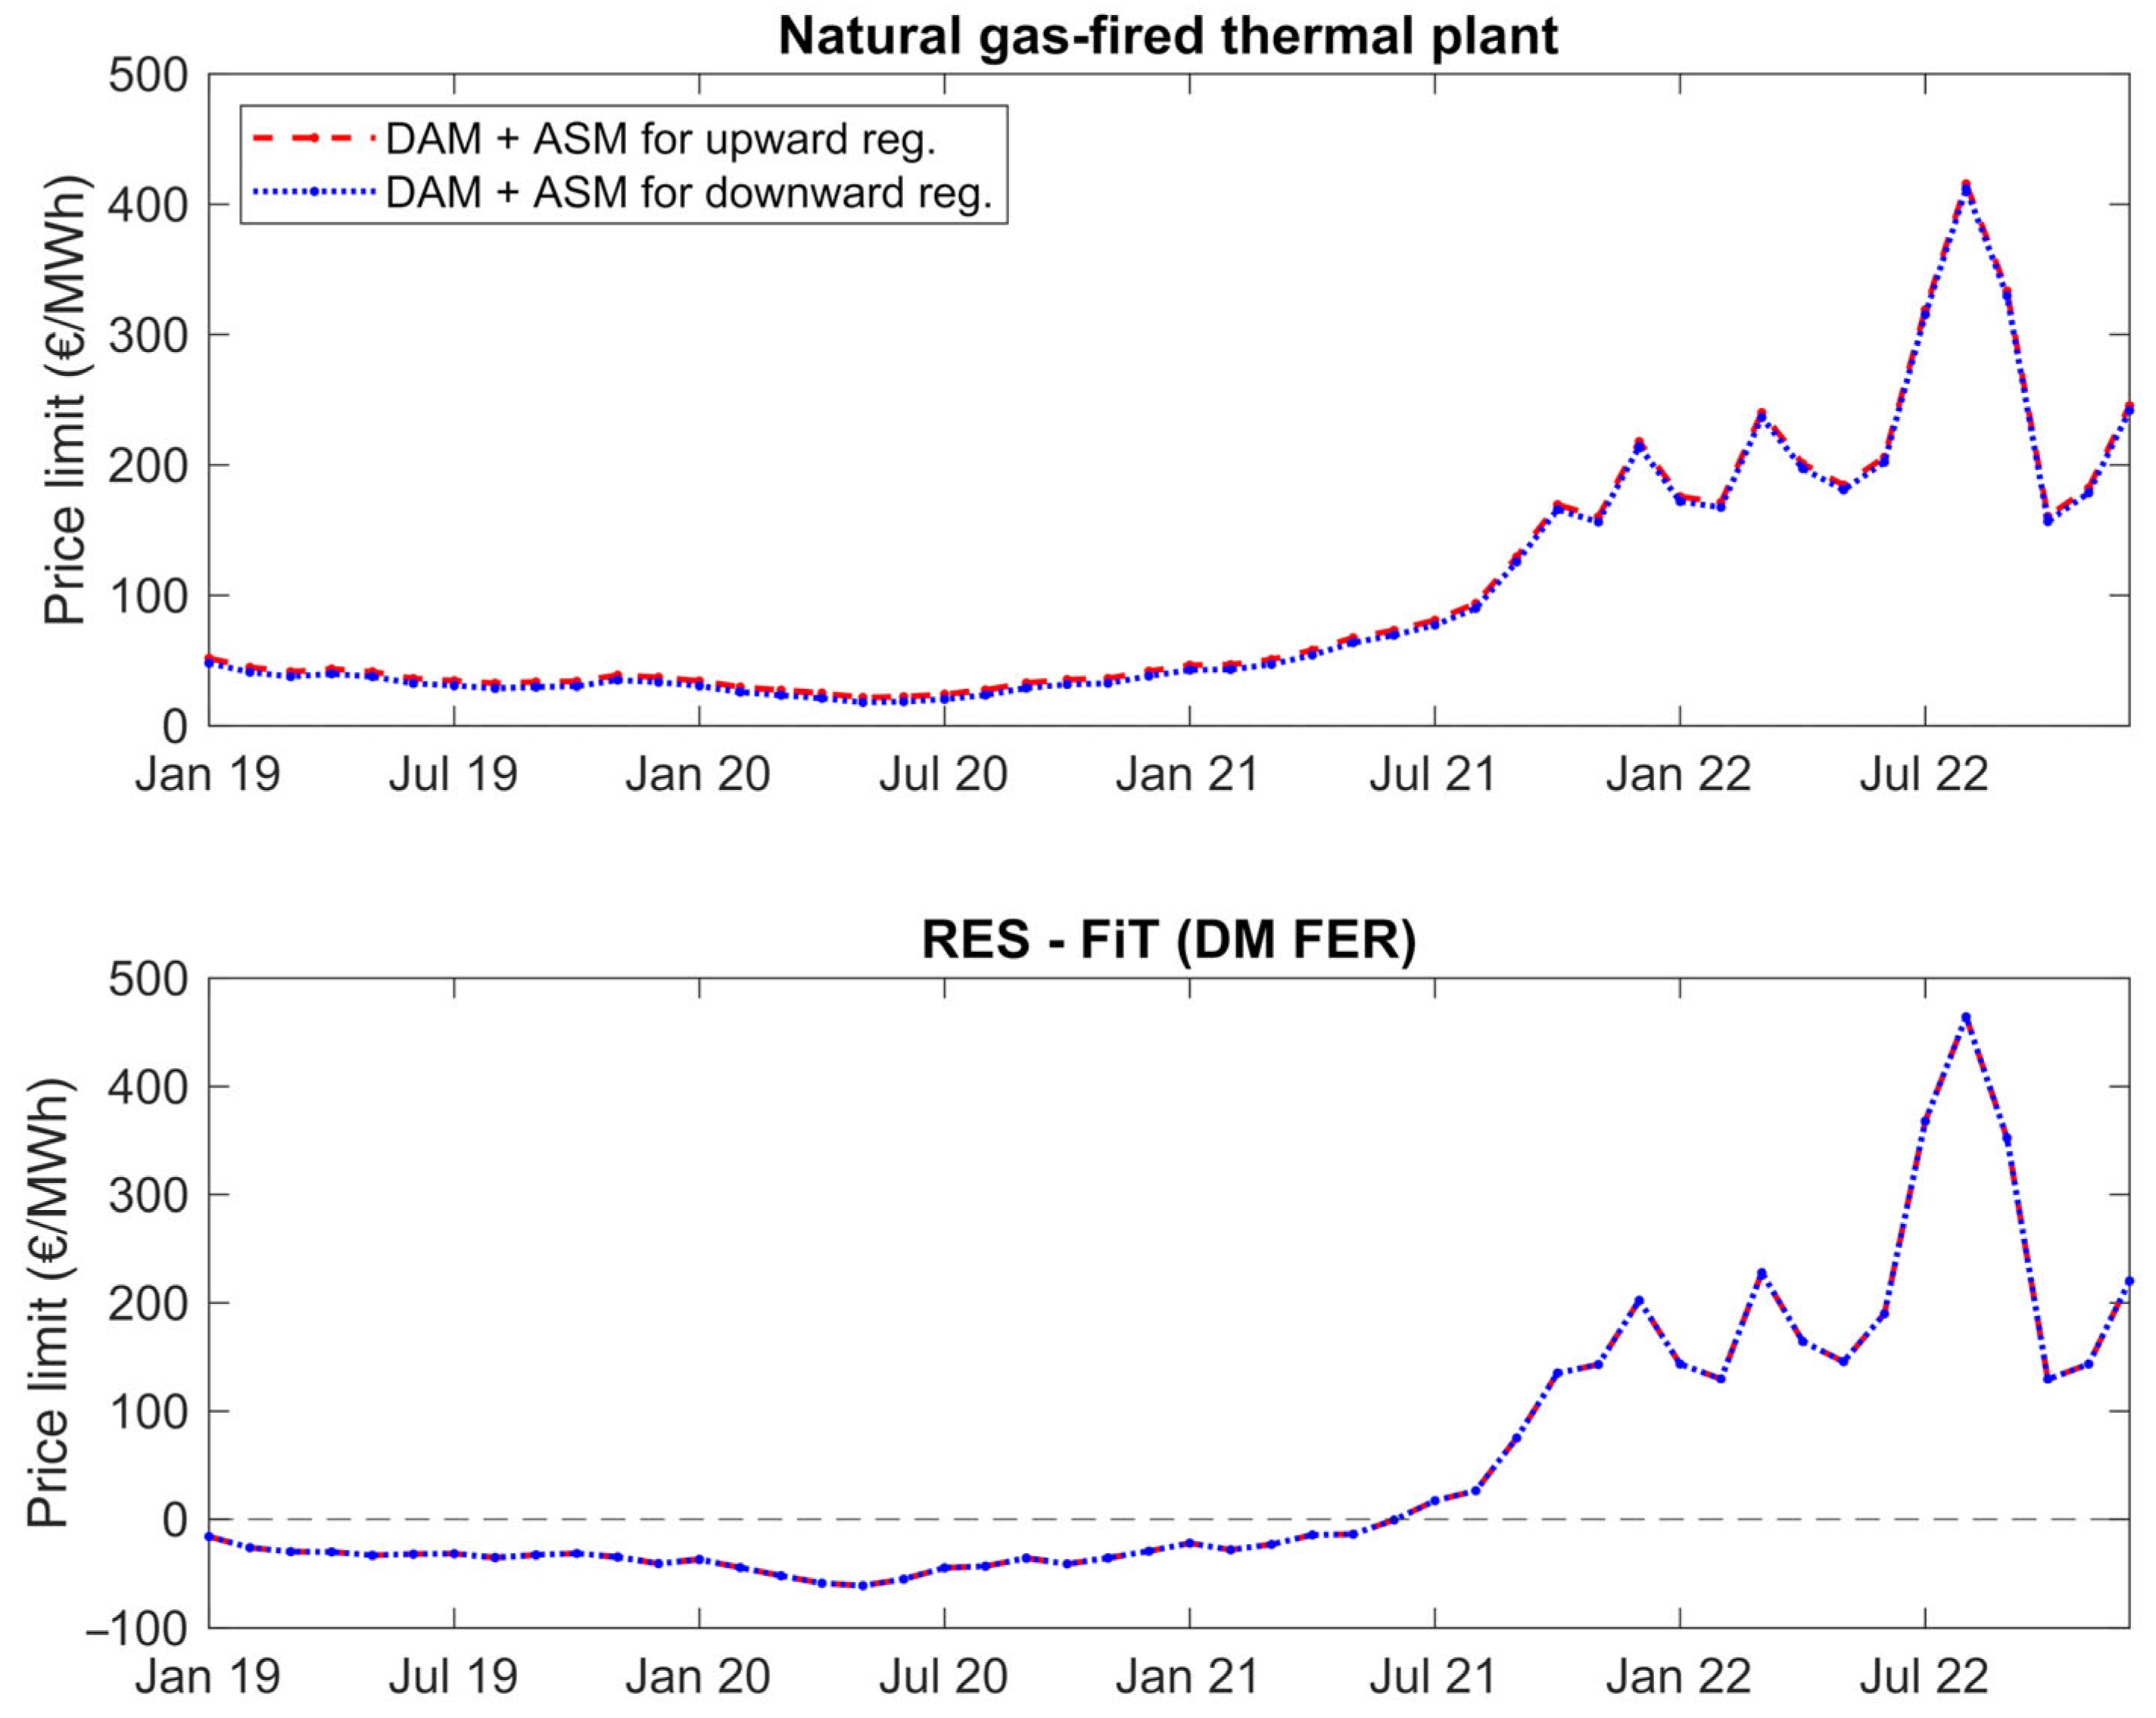
The upper plot in
Figure 9 shows the results of the analysis for the natural gas-fired thermal plant. Both
Pdown and
Pup are positive, for the non-zero marginal costs of this generation technology: a downward regulation allows reducing variable costs, thus it is acceptable for the producer to return part of the revenues from the DAM if these are lower than the expenses saved, while an upward regulation causes higher costs, which must be covered by the revenues from the ASM. The small difference between
Pdown and
Pup is due to the effect of
, which makes Equations (3) and (4) not perfectly symmetrical.
Instead, for power plants showing nearly zero marginal costs, like DERs, according to the two equations, both price thresholds are equal to -
Inc. Therefore, regarding the DER configurations analyzed, the
Pup/Pdown price threshold for a non-incentivized DER unit (Dedicated Withdrawal) is constant and equal to 0 €/MWh: i.e., a slightly positive
Pup price or a slightly negative
Pdown price is sufficient to overcome the economic neutrality toward the ASM regulation and obtain a profit margin. For DER plants incentivized with a FiP (e.g., “III Conto Energia”), the price limit is equal to minus the FiP itself (in the example considered, -350 €/MWh). On the other hand, if a variable incentive is applied, as for RES units incentivized through the FiT of D.M. 4 July 2019 (
Figure 9), the price threshold will change according to the actual incentive value. In particular, if a positive incentive
Inc is rewarded to the user (the typical situation), the actual market rules are always suitable to guarantee the profitability of upward regulation (provided that the generator technology actually allows an increase in the active power); on the contrary, to make an income with a downward regulation, it becomes essential to accept offers on the ASM with negative prices. The opposite situation occurs in the case in which
Inc < 0 (as already mentioned, this is a particular condition that happens when the energy price on the DAM is greater than the FiT target price).
It can be said that while the upward regulation is already cost-effective for DER power plants (even if a technological barrier is present for NP-RES), the introduction of negative prices can definitely contribute to making the downward regulation more profitable for RES, and the more Pdown is negative, the more it becomes advantageous to participate in the ASM because the profits are higher. However, enabling negative prices alone is not enough to ensure an affordable participation of DERs in the ASM, because to be accepted by the TSO, an offer must win the competition with the ones by other UPs. In this regard, the numerical analyses carried out have shown that a great advantage exists for conventional (thermal) power plants over RES-based ones.
A possible mitigation for the issues identified is related to a different way of application of the incentives. As already mentioned, the legislative framework generally provides that incentives are rewarded to the DER unit according to its actual production, as measured by the relevant energy meter. As a consequence, power variations, resulting from an ancillary service request, change the amount of incentive received by the producer (i.e., higher revenues for upward regulation, but also potential losses for the downward one). Therefore, a possible option under discussion in Italy regards the possibility to apply the incentive on the amount of energy scheduled on the DAM (
QE) [
46,
60]. Under this assumption, in case of downward regulation, incentives related to the curtailed quantity of electricity (∆
QE in
Figure 7) would be retained instead of being lost. This way, for RES, the price limit for
Pdown to make the downward regulation profitable would move closer to 0 €/MWh (the same for
Pup), thus reducing the gap with conventional plants. Nevertheless, also in this scenario,
Pdown should be negative enough to compensate all the costs covered by the user to participate in the ASM, represented by variable costs to perform the regulation (almost negligible for RES power plants), amortization of investment costs to enable the receiving and implementation of control signals (e.g., signal and control equipment), plus the revenue margins of the BSP. For this reason, the retention of incentives is not enough: in order to support the DER integration in the market, it should be coupled with the introduction of negative prices and both solutions must complement each other.
In addition, particular attention must be paid to avoid unfair behaviors by the users and to guarantee an amount of the incentive still reflecting the actual benefits for the system given by RES production. For example, in case of power imbalances, i.e., production scheduled on the DAM that is not actually injected into the grid for unexpected events (faults, forecasting inaccuracies of the solar radiation for PV plants, etc.), the incentive should be properly adjusted. Therefore, the applicability of the mechanism in practice could be not trivial. This is also the reason why, in some countries such as Italy, national regulatory authorities are moving to also explore alternative options to foster the DER integration into the ASM: this is the case, for example, of dual remuneration schemes, where DER units are paid both for their availability to supply a given service (€/MW) over a predefined period (e.g., one month or one year) and for the service itself (€/MWh) [
46].
7. Conclusions
The effective integration of renewable energy sources in the power system operation is one of the main challenges of the energy transition, because only by proper strategies capable of taking advantage of the control capabilities of RES-based plants it is possible to imagine a complete phase out from fossil fuels. In this scenario, the opening of national Ancillary Services Markets to DERs is key, but market participants must have clear and reliable information about the potential economic opportunities and risks associated with their new role. A thorough knowledge of the past trends of the market, although unable to provide a guarantee about the future, can be very useful to producers to effectively set up investment plans. The analytical analyses performed in this paper on the data from Italian DAM and ASM can support DER users in this direction. The results of the study have also shown that geopolitical and economic factors (global pandemic and war in Ukraine) and energy policies (e.g., emission allowances) can have a huge impact on the economics of market participants (e.g., DAM energy average price in Central–Northern Italy increased by 692.47% in 2022 compared to 2020).
In general, the higher the price of energy on the DAM, the greater the net revenues for producers both on the DAM and ASM. However, barriers preventing the participation of DERs in the ASM still exist, because, assuming the same rules in place for large generators are applied to DER units, the downward regulation always brings along economic losses (except in particular cases, as conditions characterized by a very high energy price on the DAM, if the FiT of D.M. 4 July 2019 is considered). In this regard, the paper has shown the ways in which the adoption of negative prices could increase the interest of NP-RES power plants toward the ASM. The degree to which the offering price must be negative largely depends on the opportunity cost derived from the amount of lost incentive: for example, in case of the Italian FiP of D.M. 6 August 2010 (now dismissed for new power plants), it could be even below −350 €/MWh.
The incentive retention during ancillary services provision could be an option to unlink the ASM offering prices and the incentive premium and help to improve the competitiveness of DER units on the ASM. However, its usage must be carefully evaluated, because distortive effects could occur, mainly related to the fact that users can be rewarded for an amount of RES energy that is actually not produced. For this reason, alternative solutions, such as combined power + energy payment schemes, should be also tested to evaluate their effectiveness and practical applicability in the real life.


