Article

Encouraging Trust in Demand-Side Management via Interaction Design: An Automation Level Based Trust Framework

1
Center for Technolgy Experience, AIT Austrian Institute of Technology, 1210 Vienna, Austria
2
Human-Computer Interaction Division, Department of Artificial Intelligence and Human Interfaces, University of Salzburg, 5020 Salzburg, Austria
*
Author to whom correspondence should be addressed.
Energies 2023, 16(5), 2393; https://doi.org/10.3390/en16052393
Submission received: 30 November 2022 / Revised: 25 January 2023 / Accepted: 22 February 2023 / Published: 2 March 2023
(This article belongs to the Special Issue Social License for Digital Energy)

Abstract

:
The energy transition requires increased end-user flexibility in consumption as a response to the more volatile production patterns of renewable resources. Automated demand-side management solutions can provide support in achieving this but struggle with trust and acceptance issues from end-users. This paper contributes insights into how communicating trustworthiness can be achieved through careful and context-aware interaction design in such systems. Core interface features such as feedback, automation transparency, control options, benefit information, and actionable information were identified and fifteen case studies from six countries were analysed with regard to provided interaction features, automation level, and end-user experiences. The results provide insights into the form and frequency of these features used at different automation levels and their varying role in trust and acceptance building. Based on our results, we recommend particular attention to providing actionable information and actively reaching out to users at a low automation level, to provision and communication of control at a medium automation level, and to providing transparency at a high automation level in order to promote trust successfully, while benefit information is central for a “social license to automate” independently of the automation level.

1. Introduction

Renewable energy sources form the heart of the energy transition but bring the challenge of volatility which doesn’t allow to match production to demand and instead requires an increase of flexibility on the demand-side of the energy system [1,2,3]. End-users activation, incentivized through price signals or other rationales, such as increase of grid stability, increased independence from the grid, and environmental benefits, is seen as a core resource in providing this flexibility through adjustment of their consumption patterns [4,5] but has several challenges to overcome. Creating flexibility manually is taxing, as it requires continued time and effort in order to stay aware of and systematically react to the grid fluctuations caused by the intermittent and variable nature of renewable energy and adjust energy consumption patterns accordingly [6]. Further, flexibility through adjustment of energy consumption is limited by a number of contextual factors, such as household energy practices and rules, times during which people are at home, restrictions to load-shifting outside of the household, ability to afford equipment that would allow for programmed load shifting, and others [7,8,9].
Automation as an alternative way to adjust to grid requirements offers noticeable advantages in this regard, as it enables end-users to pass on the need of awareness and adjustment of consumption patterns to automated systems [10]. Such automation can affect a multitude of loads including electric vehicle (EV) charging, storage batteries, heat pumps, electric heaters, hot water boilers, and air conditioning systems, as well as devices such as fridges, dishwashers, and washing machines. But automated solutions are often met with distrust, concerns about loss of control and comfort, uncertainty about benefits, fear of negative financial consequences, and doubts with regard to the trustworthiness of the system operators [11,12]. These challenges emphasize the the need for trust in the system and the responsible parties behind it. In order to carry out automated demand-side management (DSM) in private households to generate flexibility it is therefore crucial to achieve trust and acceptance among end-users first. Finally, even with limited need for behavior change, sufficient engagement of end-users is still required in order to recruit them to participate in automated DSM programs. Indeed, even at low automation levels successful support for behavior change remains a factor to consider [13,14].
The notion of the “social license to automate” [13] is based on the “social license to operate” concept which was originally developed to describe an informal acceptance and approval of an affected community towards a local mining initiative [15]. Within the “Social License to Automate” project of the Users Technology Collaboration Programme (UsersTCP) of the International Energy Agency IEA [16], which functions as a platform for policy-relevant socio-technical research on user- centred energy systems, the concept was adapted for the energy sector in order to describe the trust in the legitimacy and the approval of the application of automation within their homes and businesses by participants of DSM programs [13,17]. User interactions through provided digital channels were identified as playing an important role with regards to trust building [18], as they form the everyday contact point available to end-users to gain insight in automated processes and any achieved benefits, receive actionable support if required, and control processes according to personal preferences and needs. Trust forms a core component for the granting of a social license, as it indicates an expectation that the trust-receiving party will in the actions it takes that will affect oneself safeguard one’s interests [19].
This paper explores the impact that the interaction design of the provided channels and the features they contain has on trust and user acceptance through a comparative analysis of 15 international case studies from 6 different countries using a structured analysis framework. It provides new insights into the role of different interaction features for furthering trust in and acceptance of DSM under consideration of automation level and how the role of these features changes in relation to this level. The end result is a trust framework for DSM that situates identified end-user trust factors in relation to the level of system automation, which can support the design of automated DSM interaction channels in successfully communicating trustworthiness. In the following, we first outline and briefly discuss relevant background literature and present material and methods used to answer our research questions:
1.
Which features are typically included in interaction channels provided to end-users in automated DSM projects? (RQ1)
2.
Which role does the automation level play with regards to included features and their acceptance? (RQ2)
3.
How are the features received and how do they impact trust and acceptance? (RQ3)
4.
Which lessons can be drawn with regards to interaction design in automated DSM projects at different automation levels to purposefully increase trust and acceptance? (RQ4)
We then present the results regarding trust-related factors and how they relate to levels of automation and follow with the trust framework. We proceed with a discussion of our findings and conclude with an overall summary of initial goals, findings, limitations and future perspectives.
This work is based on results from the international cooperative “Social License to Automate” research project [16] and the researchers involved in this project were also involved in many of the cases analysed within this work. The methodology and related results were presented in the final report “Social License to Automate: Emerging Approaches to Demand-Side Management” [20], and we have reproduced, adjusted and extended them to fit the scope of this paper. Further results of the Social License project are also discussed by Michellod et al. [21]. The majority of the analysis, results, and modified framework presented in this paper are original contents based on the work that was performed in the project.
Following, we provide an overview of previous literature that this paper is motivated by and builds upon. In Section 1.1, we summarize the state of research on user interaction and automation for demand-side management. Here, we especially outline remaining gaps that led us towards proposing our automation level based trust framework. Section 1.2 presents the factors that have been found to be relevant for supporting behavioural decisions. Finally, Section 1.3 highlights core factors to consider in human-technology interactions.

1.1. Systematic Overviews and Frameworks on Human Interaction with Automated Demand-Side Management

There is an increasing body of literature on the effects of demand-side management on households. Many of these relate to the influences on household adoption and energy use (e.g., [22,23,24]). Other topics include public perception of DSM [25,26,27], and specific household characteristics [28]. There are also scientific accounts of household preferences with regard to the programs and strategies applied [29], pricing strategies [30], as well as insights for feedback display for DSM services [31]. Furthermore, critical considerations from a social science perspective have been formulated about (mis-)conceptualizations underlying the way how energy services are designed [32].
Beyond individual studies, systematic overview analyses that focus on human-technology interaction within the scope of demand-side management are available only to a very limited degree (e.g., [22,24,33]). A recent systematic literature analysis by Chadwick et al. [24] proposes a consumer behavior framework synthesizing publications regarding their reported influences on household adoption and rejection of technology. The framework focuses on five psychological categories (cognitive, social, affective, behavioural, and contextual), but it does not elaborate on design aspects of human-technology interaction. Shekari et al. [34] provided an analysis of 54 publications from several perspectives, including social and cultural dimensions, but without a dedicated focus on interaction design.
So far, despite having been identified as a relevant research issue [13], no systematic analysis focusing on human-automation interaction within DSM systems has been carried out. Specifically, we are missing data that can provide guidance on how to design human-technology interactions for different levels of DSM automation (compare [35] for a cross-sectoral categorization of automation levels). Related human-automation interaction research beyond the energy domain [36] can be used as a reference frame for balancing active user engagement and active behaviour change with subliminal influence through automation [37]. In the remainder of this section, relevant factors for promoting behaviour change and realizing human-automation interaction are documented. These factors structure the automation level-based trust framework proposed in Section 4.

1.2. Behavioural and Engagement Factors

Within models explaining behavioural decisions, behavioural intention is typically at the center, accompanied by habits and facilitating or aggravating circumstances, and influenced by problem awareness, perception of responsibility, self-efficacy expectations, personal values, and social norms (See e.g., Theory of Planned Behavior [38], Comprehensive Action Determination Model [39], Norm-Activation-Model [40], Theory of Interpersonal Behavior [41]). Accordingly, it is important to avoid neglecting any of these three core factors in persuasive engagement approaches to behaviour change, as is often done by overestimating the relevance of intention and underestimating the influence of circumstantial and habitual aspects of behaviour. Recent sociological approaches, such as Social Practice Theory (SPT) [42], therefore, treat external and internal influences equally, in that the performance of a social practice depends equally on the availability of and access to needed “material” (including access to services), the ability (“competence”) to use the material and understand the benefits, and the will (the “meaning” attributed to that action) to do so, which is strongly linked to personal intentions and social norms. If one of these components is missing, the implementation of a “new” practice fails. Legal frameworks may also encourage certain energy practices, such as adopting the role of a prosumer or peer-2-peer selling and discourage others.
In order to motivate consumers to change their behaviour, it is essential to communicate in a way that is specific to the target group and tailored to their prevailing values and life circumstances [43]. In addition, successful engagement messaging should focus on the here and now; communicate consequences in a concrete, tangible, and personal way, viewed from a local perspective; and communicate emotionally engaging, empowering rather than sacrificial messages [44,45,46]. In addition to knowledge and awareness, the ability to act must also be ensured through instructions that are concrete and consider differences in resources and limitations. Moreover, the habit factor is of great importance in energy consumption practices and approaches that take advantage of natural breaking points or create new ones should receive special attention. The more frequently habits are repeated, the harder they are to break [47]—frequent repetition is, therefore, correspondingly central to the stability of formation of new habits. Through appropriate communication, participatory approaches, and collectively designed persuasion strategies, a collaborative perspective can also be fostered and targeted as an engagement strategy [48]. Furthermore, care must be taken to ensure that incentive structures are designed to promote sustainable behaviour and that the desired changes are also exemplified within the government’s own policies and practices [49].

1.3. Human-Technology Interaction Factors

Perceived agency is central to positive user experience [50] (Limerick, Cole, & Moore, 2014). DSM trades agency against convenience by relieving end-users (the degree depending on the level of automation) from dedicating time and effort to load shifts and peak shaving according to grid needs in exchange for for full control over energy usage patterns of their homes. This process has to be handled with great care and consideration in order to succeed in communicating a sufficient sense of retained control to end-users despite this trade if a “social license to automate” is to be successfully achieved. Fell [51] lists information, familiarity, predictability, trust, and choice as key antecedents of perceived control. Important factors in this context are:
Sufficiently detailed information on consumption patterns—i.e., feedback—is crucial for empowerment and agency with regards to energy consumption [52]. Without an understanding of the effect behavioral decisions and automated load-shifting have on one’s consumption patterns, the building of understanding and actionable knowledge is severely hampered. Therefore, despite the mixed results with regards to feedback as a strategy to change energy consumption, it provides an indispensable contribution [53].
Transparency has been identified as another crucial factor: end-users should be provided with information into past, current and upcoming (as available) automated DSM processes, supporting their insight into them and providing a sense of supervisory control [54]. Predictability has been underlined as another factor impacting transparency as it provides end-users with a base understanding of what they can expect and to prepare accordingly based on these expectations, furthering the experience of agency [55,56].
The aspect of benefit information (giving end-users feedback on benefits that have resulted from DSM) has also been highlighted as important for establishing the perception of fairness, reciprocity, and reliability with regards to fulfilling promises that were made [51,57]. Underlining a variety of attractive and dependable benefits in communication provides reassurance and a sense of accountability beyond simply positive feedback to end-users [58,59]. Further, there should be the possibility for end-users to interrupt an intended automation if so required for whichever reason [56]—the final say should be with the end-user. We have framed this as part of transparency within the scope of this research.
Finally, there is the concept of actionable advice. Energy consumption is a black-box to end-users in many ways—rules of thumb and heuristics are applied to gauge how much energy is used by which systems and devices [60,61] but without regular feedback of any sort insights are very limited. Therefore, the provision of specific actionable advice on how to achieve load shifting or savings and the building of confidence and competency through this can aid to trust.
The literature further indicated a complex but meaningful relationship between trust and engagement, with trust furthering engagement and successful engagement impacting the development of trust [62,63,64]. Engagement is, therefore, also to be considered as a relevant factor in relationship to trust and acceptance building in the context of this work. A common tool for furthering engagement along the provision of feedback and benefit communication is gamification via different mechanisms including e.g., goal setting, challenges, competition and cooperation [65,66]. Gamification shows potential with regards to furthering desirable energy consumption behavior but lacks sufficient empirical evidence to date. Another related approach is the application of social intervention strategies to influence energy consumption, such as communication of social norms, provision of social comparison information and feedback about group performance, which have shown themselves to be effective both pitted against control groups as well as other intervention approaches [67].

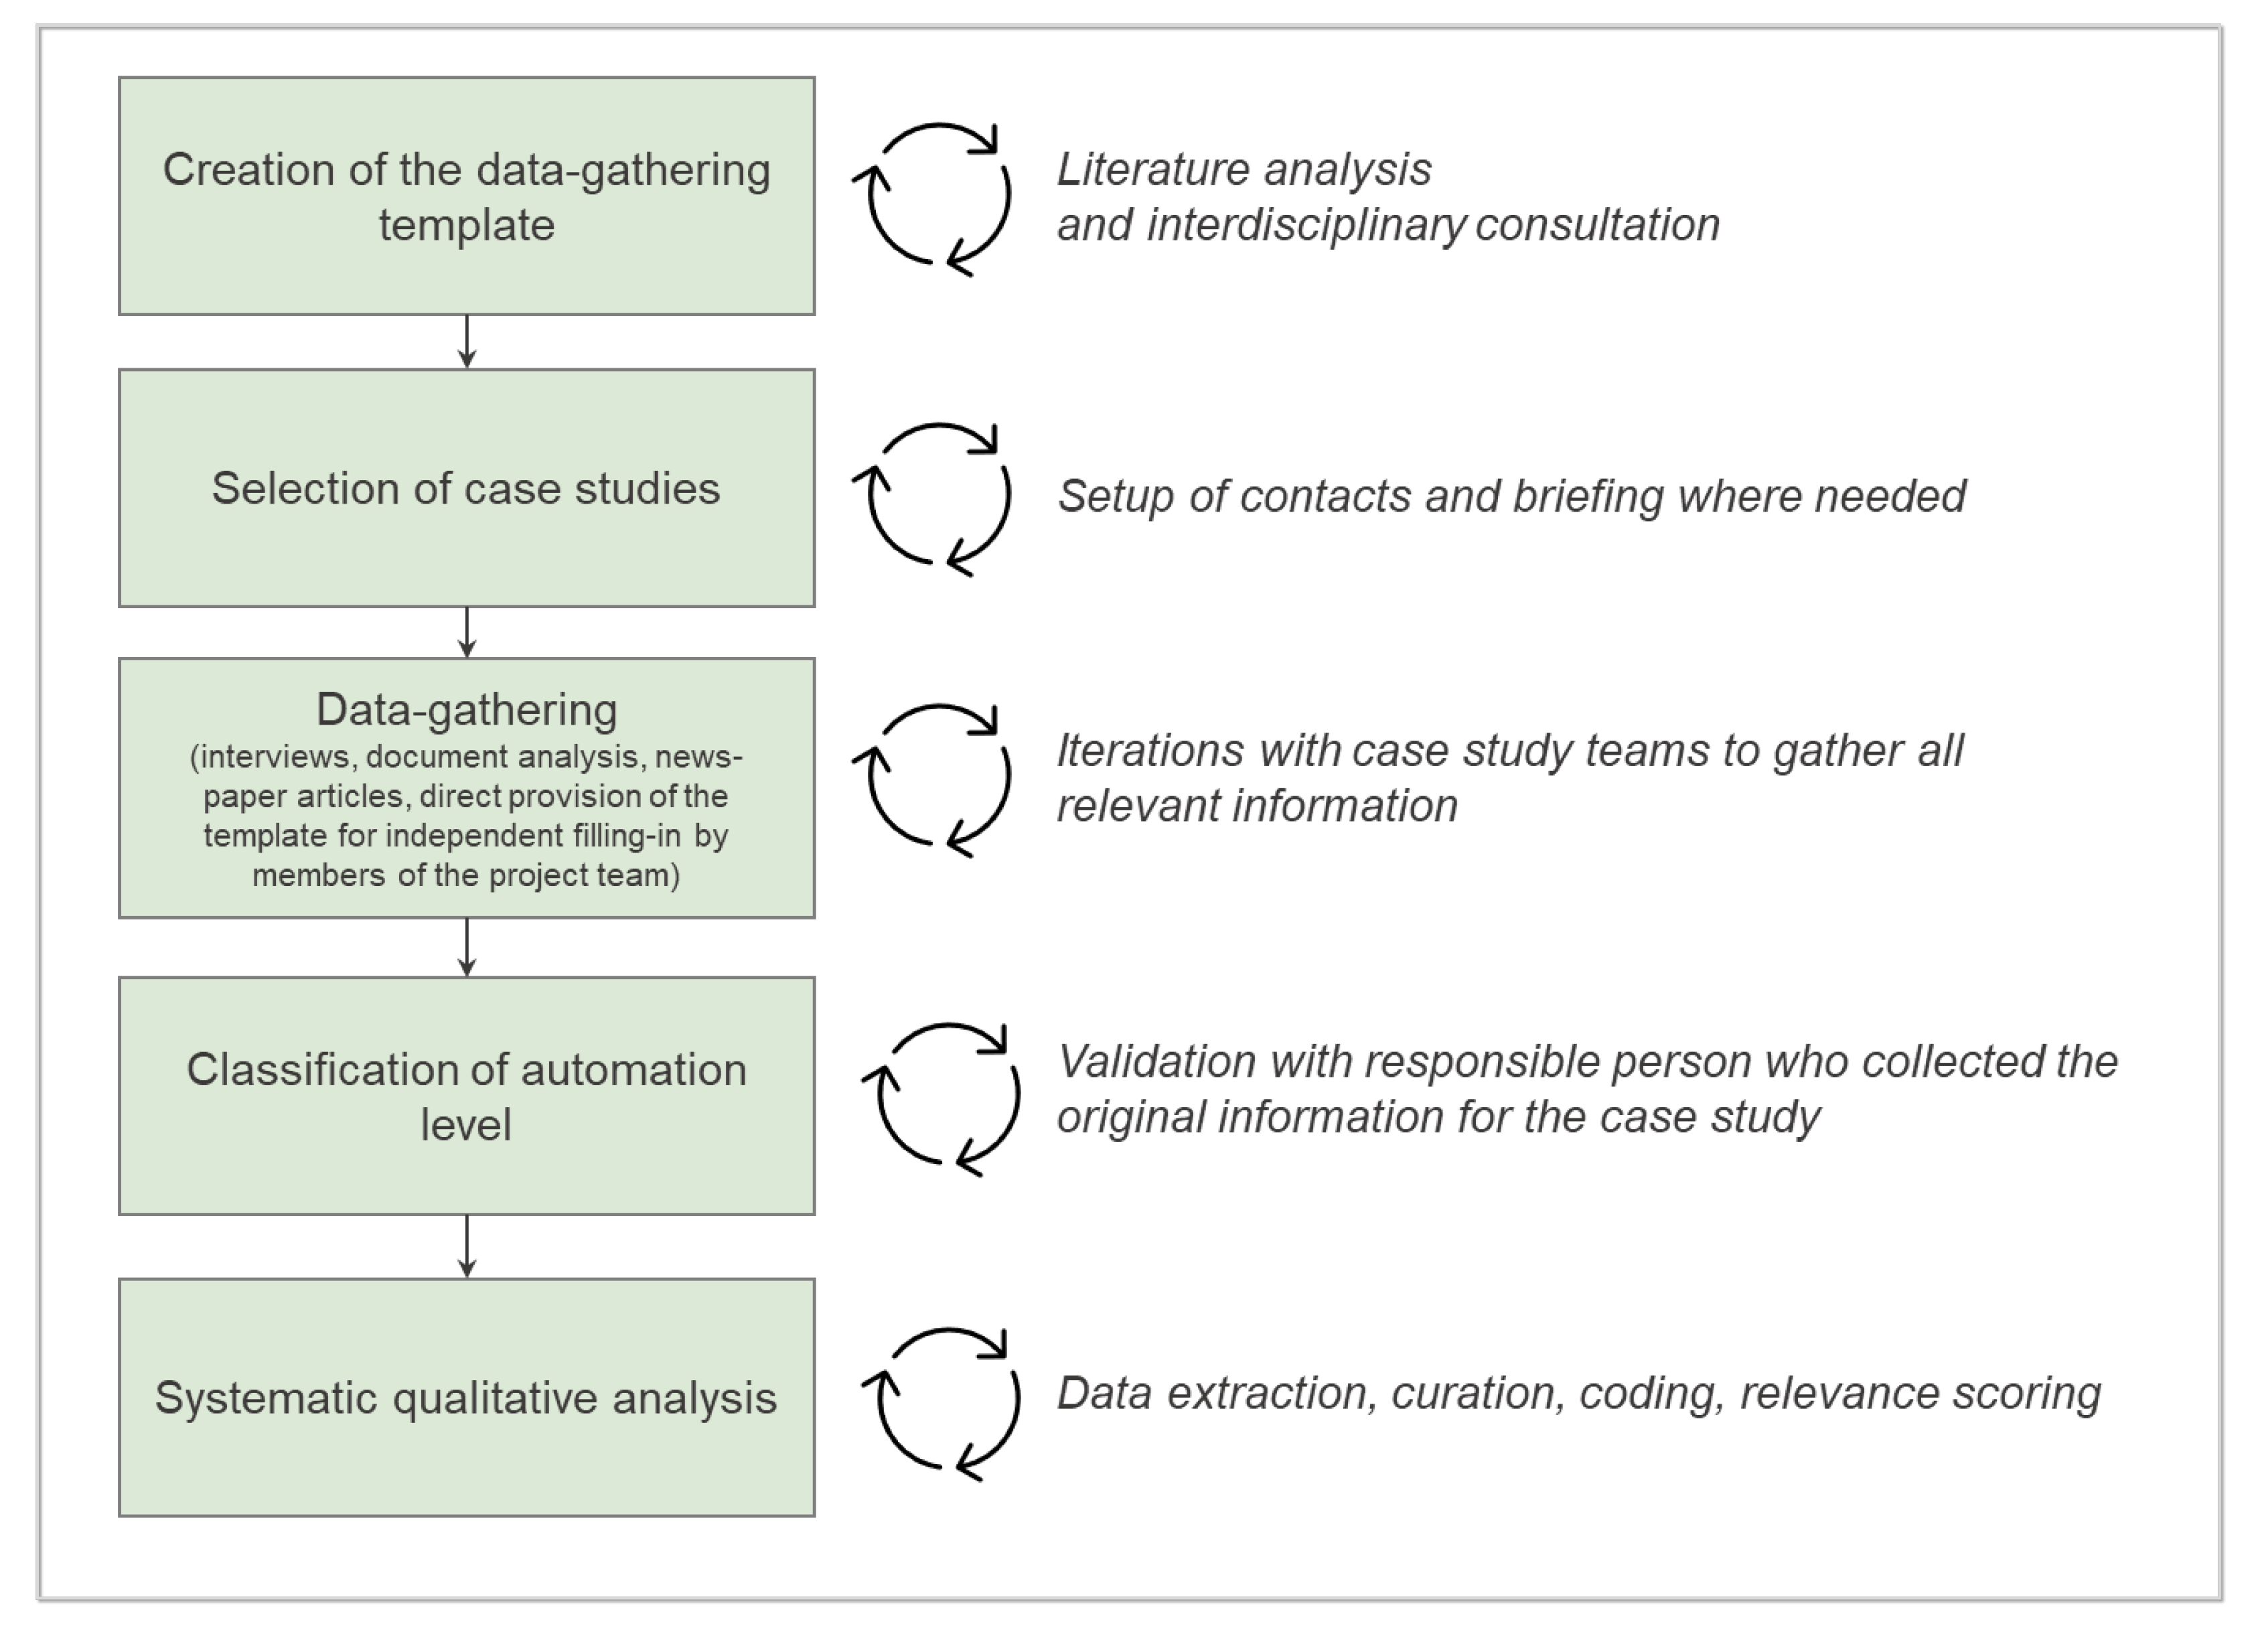
2. Materials and Methods

In order to answer the identified research questions as well as others beyond the scope of this paper, an analysis template to identify acceptance factors of DSM projects was developed within the expert team of the “Social License to Automate” project. The methodology followed the concept of comparative case study analyses [68,69], acknowledging that through the analysis of several case studies a higher robustness can be achieved compared to only looking at one case [70]. Following good practice in social science research, the template should enable consistent data capture [70] and was therefore of central central importance in our research process. It was structured in a way that supports a mixed methods approach [71], flexibly suitable for different case study contexts. It was designed for the application within structured interviews, as well as the gathering of additional information via source material, such as project deliverables and reports, since single interview partners typically were not intimately familiar will all relevant aspects of a case. Figure 1 illustrates the research process following the template creation, through case study selection, data-gathering, classification and systematic analysis. The data gathering process typically built on an initial interview or, if one of the experts was involved directly in a case, a written completion by the concerned expert. Most cases also include data from additional sources identified or requested by the authors of this paper to fill in the template for each case as completely and with as much detail as possible in order to allow for the comparative case analysis and answering of the posed research questions.
The aspects addressed within the sections dedicated to the role of interaction systems and end user experience were based on the insights gained through the available literature. Provided below is an overview of the information gathered through the template that was considered within the interaction analysis:
General information
1.
In which country was the demo-site located?
2.
How many households were involved in the program?
3.
What were the characteristics of the involved users? (housing type, ownership, etc.)
4.
What was the trial length?
5.
What was the rationale for automation communicated to end-users?
6.
Which loads were automated/affected?
7.
Were end-users required to take actions and if yes, which actions?
8.
Does the automation system provide an interface for end-users?
Interface-related information
1.
Which information channels are used to communicate with end-users? [Channel]
2.
Does the system provide any type of feedback to end-users? [Feedback]
3.
Does the system provide process information to end-users, such as automation status, as well as post and planned automation? [Automation Transparency]
4.
Does the system provide choices to end-users regarding participation, flexibility activation, personalization (e.g., comfort ranges), data access, or other? [Control]
5.
Was gamification used within the system? [Gamification]
6.
Were end-users provided with any actionable information (concrete advice about actions to take)? [Actionable Information]
7.
Does the system provide specific information on gained benefits? [Benefit Communication]
8.
Does the system provide information on safety, privacy, and security measures? [Privacy]
9.
Are consumers actively contacted by the system and if yes, for which reasons, how often, and is a response required? [Active Interaction]
Usage- and experience-related information
1.
Did end-users make use of the provided interface?
2.
Were loads successfully shifted/savings achieved?
3.
How did end-users experience their interaction with the system? Did you receive any positive or negative feedback?
4.
How did end-users experience their participation in the program?
5.
Did end-users experience a benefit?
6.
How was the project success perceived with regards to the participation of end-users?
Further use case information collected were general project details such as project name, project runtime, country the demo-site(s) was/were placed in, number of participating households, user characteristics and demo runtime. The interface-related information gathered (specifically questions 2–9) was used to answer RQ1 and, in combination with general information on the automation level, RQ2. Usage- and experience-related information was in combination with the additional insights gained through a qualitative survey presented to the experts who had gathered the respective case data (see below for more details) used to answer RQ3 (specifically 1, 3, and the survey) and RQ4 (all questions from this section, the survey, and the case details from the general information section—here is an overlap as RQ4 includes the insights from RQ3 but goes beyond them). The full template can be found in the Appendix A and was also reproduced to a large degree in Michellod et al. [21]. As described above, data capture followed a mixed method approach, including interviews, document analysis, newspaper articles, direct provision of the template for independent filling-in by the members of the project team. If a specific questions was answered insufficiently, the authors contacted the expert who documented the case and requested more detailed information. If members of the expert team were directly involved in a case it was in some cases possible to gather specific, template-oriented insights through the quantitative and qualitative data collected in running national cases and provide more in-depth answers to questions formulated within the template. The case studies were, however, all part of independent projects and none were carried out specifically to answer the questions posed in the developed template.
The defined criterion to include a case study in the interaction focused analysis was the availability of dedicated interaction channels. This specification was necessary as the case analysis took part to answer a larger group of questions from a number of experts, and therefore some cases provided answers to questions beyond the scope of this paper but delivered no insights within it. Of the altogether 26 collected use cases, 15 cases from 6 different countries (Austria, Switzerland, Germany, Norway, Spain and Australia) met this criterion. Table 1 provides an overview of the included cases and relevant parameter information regarding country, runtime, context, sample types and sizes, runtime, and automation level. With regards to the latter, it is important to note that there was often more than one level of automation in many of the investigated case studies, as they would usually consist of several and not one single system. However, the interface and/or communication towards the end user was typically concentrated in a single point of interaction and related system, thus is linked to a single level of automation. This is what “analyzed automation level” refers to, as any other systems—automated or not—that might have been part of a project but were not involved in end-user communication, were outside the scope of this investigation.
Included cases were then classified regarding their level of automation. Classification of automation level was based on a literature review presented by [35] who identified 19 different automation levels out of which 5 were identified as most common as they were used by more than 50%: (1) Manual, (2) Offers Decisions, (3) Executes with human approval, (4) Executes if there is no veto, (5) Autonomous System. Out of these, Level 4 was split in two to acknowledge the difference between an active contacting of end-users by the system and providing them with the opportunity to veto an automation vs. automated vetoing through set parameters. The automation level prominent in a use case with regards to end-user interaction formed the basis for analysis, as it has a strong impact on expectations about active user participation. Therefore, a relationship between automation level and what a system needs to provide users with through interaction design in order to further trust and acceptance can be expected. The six automation levels used for a first-step classification, also described in the project report [72], were as follows:
  • Automation Level 1: Manual. Load shifting or saving is done manually by the user (automation only with regards to automated notifications about target consumption/load shifting).
  • Automation Level 2: Manual automation. Load shifting or conservation of energy is done via manual programming of devices or systems by the user.
  • Automation Level 3: Consensual automation with acceptance. The user is actively contacted by the system and must agree to an automation event; if agreement is not obtained, the automation is not carried out.
  • Automation Level 4: Consensual automation with veto. The user is actively contacted by the system and offered the chance to veto the automation event; if the event is not vetoed, the automation is carried out.
  • Automation Level 5. Restricted automation. The user has the possibility to restrict automation according to specified requirements, such as time periods or comfort zones; the user can monitor automation and interrupt it via the system if necessary.
  • Automation Level 6: Full Automation. The user is not provided with the option to interrupt automation events via an interaction channel.
For the purpose of the analysis, these more detailed automation levels (AL) were combined into more general ones in order to allow for a combined analysis and drawing of conclusions under consideration of the limited number of cases available. These were as follows:
  • Low Automation Level: AL 1 or AL 2
  • Medium Automation Level: AL 3 or 4
  • High Automation Level: AL 5 or AL 6
Further, in order to gather additional relevant insights from the studied use cases regarding the provided interaction and to answer the research questions better, project partners were asked to fill in a short questionnaire with regards to the case studies they had gathered the original data for and were in many cases involved in directly as well. The presented questionnaire included four open text questions for each case, as well as three quantitative questions where the experts were asked to rate their impressions of the provided interaction regarding some traditional acceptance factors under consideration of the automation context (Technology Acceptance Model TAM, [73,74]). The qualitative questions included in the survey where as follows:
  • “Successes: Did you have the impression, that the user interface (web portal, app or similar) impacted acceptance? Which aspects do you think were most important?”
  • “Failures: Are there any aspects of the interface that you feel really fell short and did not work as intended? Which ones and what was the problem?”
  • “Missed opportunities: Did you take note of any issues that end-users experienced and that you think could have been (partly) resolved through an interface? Which ones and what do you think the interface could have contributed to resolve them?”
We analyzed the collected data based on the previously presented generalized automation levels. In this process, the material gathered on the use cases fulfilling the condition of available communication channels underwent a systematic qualitative analysis with a comparative approach based on the recorded automation level. The extracted qualitative data data was curated and edited in order to allow for comparison and available interaction features and other describing aspects of the case studies. The experiences of involved users were coded to allow for comparative analysis of frequency and form, implemented under consideration of automation level. Finally, the observed relevance of feature per automation level was scored within an expert team and translated into a framework describing the impact of the observed interaction features on trust in automated DSM.

3. Results

In the following, we first present the observations extracted from the case analysis. We begin with outlining the findings from the general and interaction-related information items (see Materials and Methods), answering RQ1 and RQ2. The findings are listed item-by-item, including number and/or frequency of cases, and a mapping to the respective level(s) of automation (ALs). After this, we report the results from the usage- and experience-related items in a separate subsection. Part of this represents a reproduction of the findings laid out in the final project report [20], on which we build in the further and new analysis and framework development.

3.1. General Information

Here, we first outline the basic parameters of the investigated cases (refer also to Table 1 for the general case overview) and then additionally present captured basic information on rationale, affected loads, and actions required by users.
Regarding the number of cases per automation level, four cases had a low automation level (AL) of 1 to 2 (typically both manual and manually-programmed load shifting were combined), four cases were medium AL (3 with AL 3 and 1 with AL 4), and seven cases were high AL (3 with AL 5 and 4 with AL 6). For the secondary automation level AL 1 and AL 6 were most often combined, and AL 3–5 were typically combined with each other. The possibility of single event automation (medium AL) could also be found repeatedly in high AL cases. The country distribution was as follows: Low AL cases were from AT, DE, and ES, medium AL cases from AU and CH, and high AL cases from AT, DE, CH, AU, and NO. Trial lengths were on average around 10–12 months, with no noticeable differences regarding AL. The number of participating households ranged from 10 to 6000+, with business case projects having higher numbers of participants. These ranged across all ALs, with the one difference being that low AL cases had lower numbers overall, since none of them were business cases. Low ALs were more often implemented in apartment blocks, while high ALs were more often implemented in single family-homes. The middle level was mixed.

3.1.1. Rationale

The most frequently communicated rationale throughout all analysed cases independently of AL (87% with 13 out of 15 cases) was financial benefits. Grid balancing as an argument for automation was put forward in six projects (60%) and gaining access to new technology, contributing to the future of the energy grid, and environmental benefits were named five times (33%) each, while local consumption and increase of control was referred to four times (27%). Least often presented as automation rationale were independence (self-sufficiency) (twice) and contribution to the community (once). Most rationales were represented throughout all ALs, although increased self-sufficiency was not advertised at low AL and community-related benefits were only emphasized at high AL.

3.1.2. Loads Affected

Affected loads are strongly related to automation levels. At low AL, loads-shifting typically concerns appliances/devices, lights, and hot water. At medium AL, affected loads vary most strongly, ranging from appliances/devices, EV charging, air conditioning, and heating in different forms, to heat pumps and storage batteries. At high AL, automated loads are typically hot water boilers, heat pumps, and storage batteries and heating and storage heaters, although less frequently. Overall, appliances/devices and heating were most commonly affected (7 and 6 cases, 47% and 40%, respectively) as well as heat pumps and storage batteries (both in 5 cases, 33%).

3.1.3. Actions Required

Actions required from users are determined by automation level. At low automation levels, load shifting/conserving is achieved manually or through manual programming (for specific times or single automation parameters). At medium AL, end-users are actively contacted by the system and are either required to agree to an automation event or given the option to veto it. At high automation levels, end-users have the possibility to restrict automation through general parameter setting, veto due to active monitoring of automation status, or there is full automation without the possibility to interfere through provided interaction channels.

3.2. Interface-Related Information

We now report the results regarding the interaction channels used, the features that were present, and in relation to which ADLs they were used. We have pre-structured these into interaction channels used, central trustbuilding features, engagement and enablement features, and privacy-related information. For ease of reading, the subsections on central trust-building features and engagement and enablement features are each concluded with a separate highlight summary.

3.2.1. Interaction Channels

Dedicated apps were recorded as the most frequent form of interaction channel (11 cases, 73%; once provided on a dedicated tablet), followed by web portals (7 cases, 47%). Text messages were used less frequently (3 cases, 20%) and in one case IHDs (In-Home-Displays) were installed in participating households. Emails also often functioned as communication channels, but were predominantly utilized during early phases of a project for recruiting purposes and the sending of newsletters/reports, or for user research. Phone calls were used for recruiting, as well as a last-resort possibility to veto automation in two high-automation cases without parameter setting options (13%). There was no noticeable pattern of used interaction channels with regards to AL besides text messages not being used at high ALs.

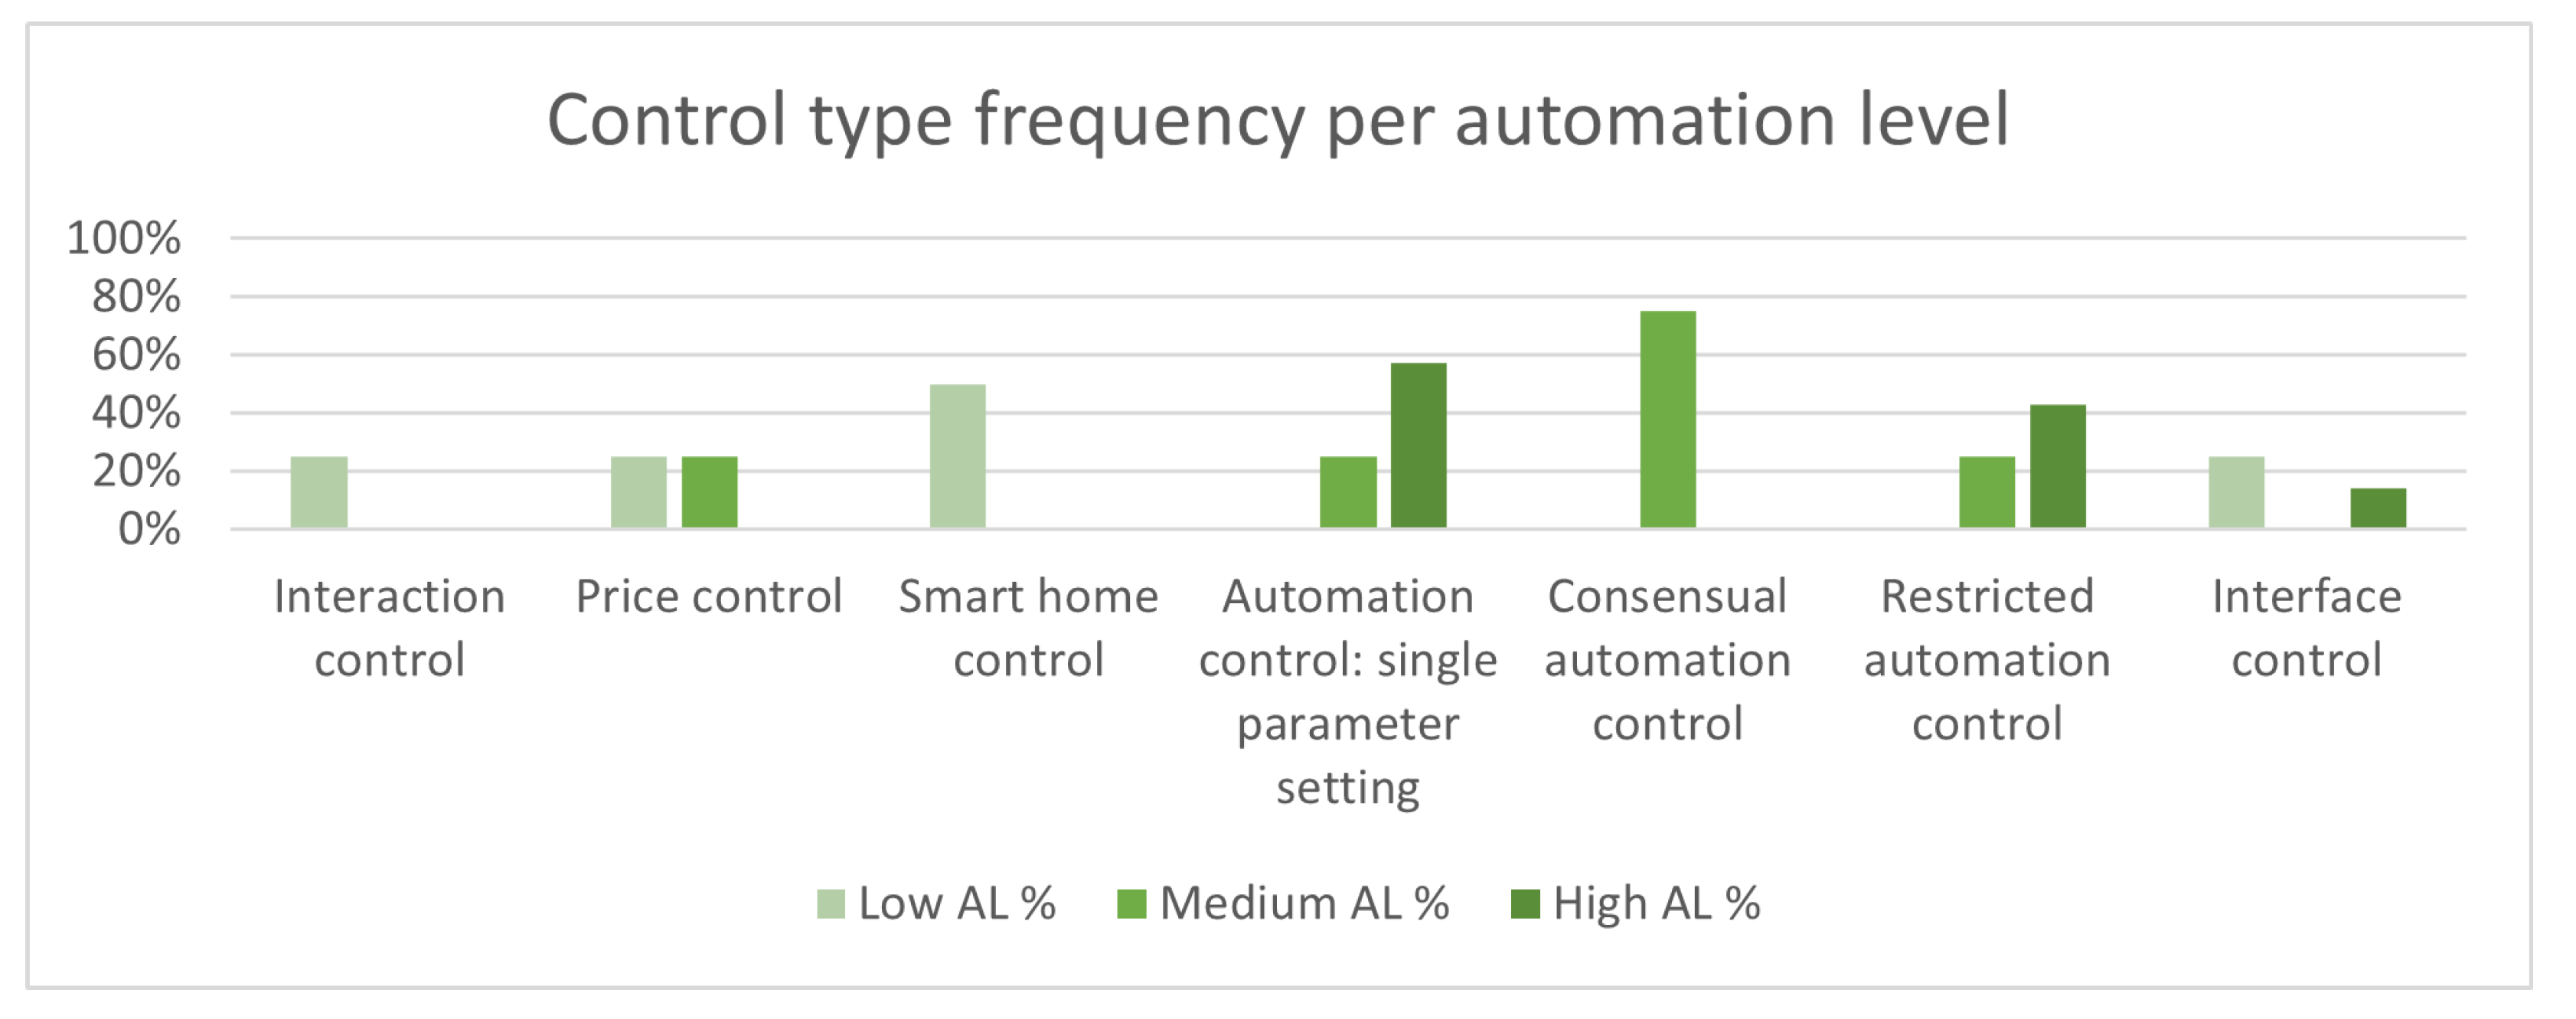
3.2.2. Central Trustbuilding Features

Feedback:General consumption feedback was present in 13 cases (87%). It typically included information on current status and consumption history, often with the possibility to specify time period, as well as comparison with past consumption history. In some cases, concrete information on self-sufficiency could also be displayed (in %). In one low-AL case, the consumption was additionally translated into user-tangible reference values (e.g., hours of TV watched). No noticeable differences regarding the provision of consumption feedback based on automation level were identified. Device-specific consumption feedback was only present in three cases (20%), all of which were medium or high AL. Production feedback was implemented in all nine cases that included PV production at a user-awareness level. Production feedback (and related PV production) was most commonly found in high AL cases (six times) and rarely for low-AL cases (only in one instance). Smart home-related feedback was present in all five cases that included a smart home system. Two of these cases were low AL, two were high, and one medium AL. The feedback provided to the end-users consisted mostly of sensor-based information, such as temperature or air quality. Battery status information was present in two out of five cases that involved battery automation. Both cases involving battery status information were high AL.
Automation transparency: There was high variability and a strong dependence on automation level throughout the analysed cases: Information on smart home settings was present in 2 low AL cases. Tariff-related information was also present in two low AL cases. PV production forecasts were provided in two cases, one low and one high AL. Information on the beginning and end of events was present in two cases, both medium AL. Information on automation parameter settings was present in one medium AL case. Information on flexibility use was present in three high AL cases. Finally, information on energy flows was present in four cases, three of which being high AL and one low AL.
Control options: Similar to automation transparency, control options were varied according to ALs. Consumption and comfort control via smart home settings was present in two low AL cases Interaction control was provided in one low AL case. That specific case allowed setting a minimum savings potential and would emit notifications based on that setting. Price control was present in one low AL case (where it enabled tariff selection) and in one medium AL case (where buy and sell prices of locally produced energy could be set). Automation control via single parameter settings was present in one medium AL case and four high AL cases. In the medium AL case, single automation event conditions (e.g., dishwasher completion time) constituted the overall automation contro. In all four high AL cases, automation control consisted in single event settings for EV charging. Consensual automation control was present in three medium AL cases, two of which requiring active acceptance of automation invitations and one that included a veto option for planned automation tasks. Restricted automation control was available in one medium AL and two high AL cases in the form of general automation parameter settings (vi comfort ranges) as well as in one high AL cases as a veto option. In addition, a phone-based veto option was possible in two high AL cases but was not registered as restricted automation control since it was not handled through a dedicated and continuously used interaction channel. These veto options were intended as a last resort in case of emergencies and implemented outside of the standard interaction environment. Interface-related control options were present in one low AL and one high AL cases. In both cases, this mainly consisted in the possibility to rearrange the dashboard. In one case, nicknames could be given to the appliances and in another case, different colour schemes could be assigned.
Benefit information:Savings in € was the most frequently encountered form of benefits communication (1 low AL, 1 medium AL and 2 high AL cases). In one of the high AL cases, feedback was further detailed into general savings, savings due to battery and solar, and savings due to only solar. Savings in CO 2 -emissions ware communicated in three cases (1 low, 1 medium, 1 high AL). Savings in kWh were also communicated in three cases, two of which were low AL and one was medium AL. Savings potential was communicated in two low AL cases. Out of the 15 reviewed cases, eight (53%) specifically did not communicate benefits through any of the provided interaction channels.
Summary of main points:
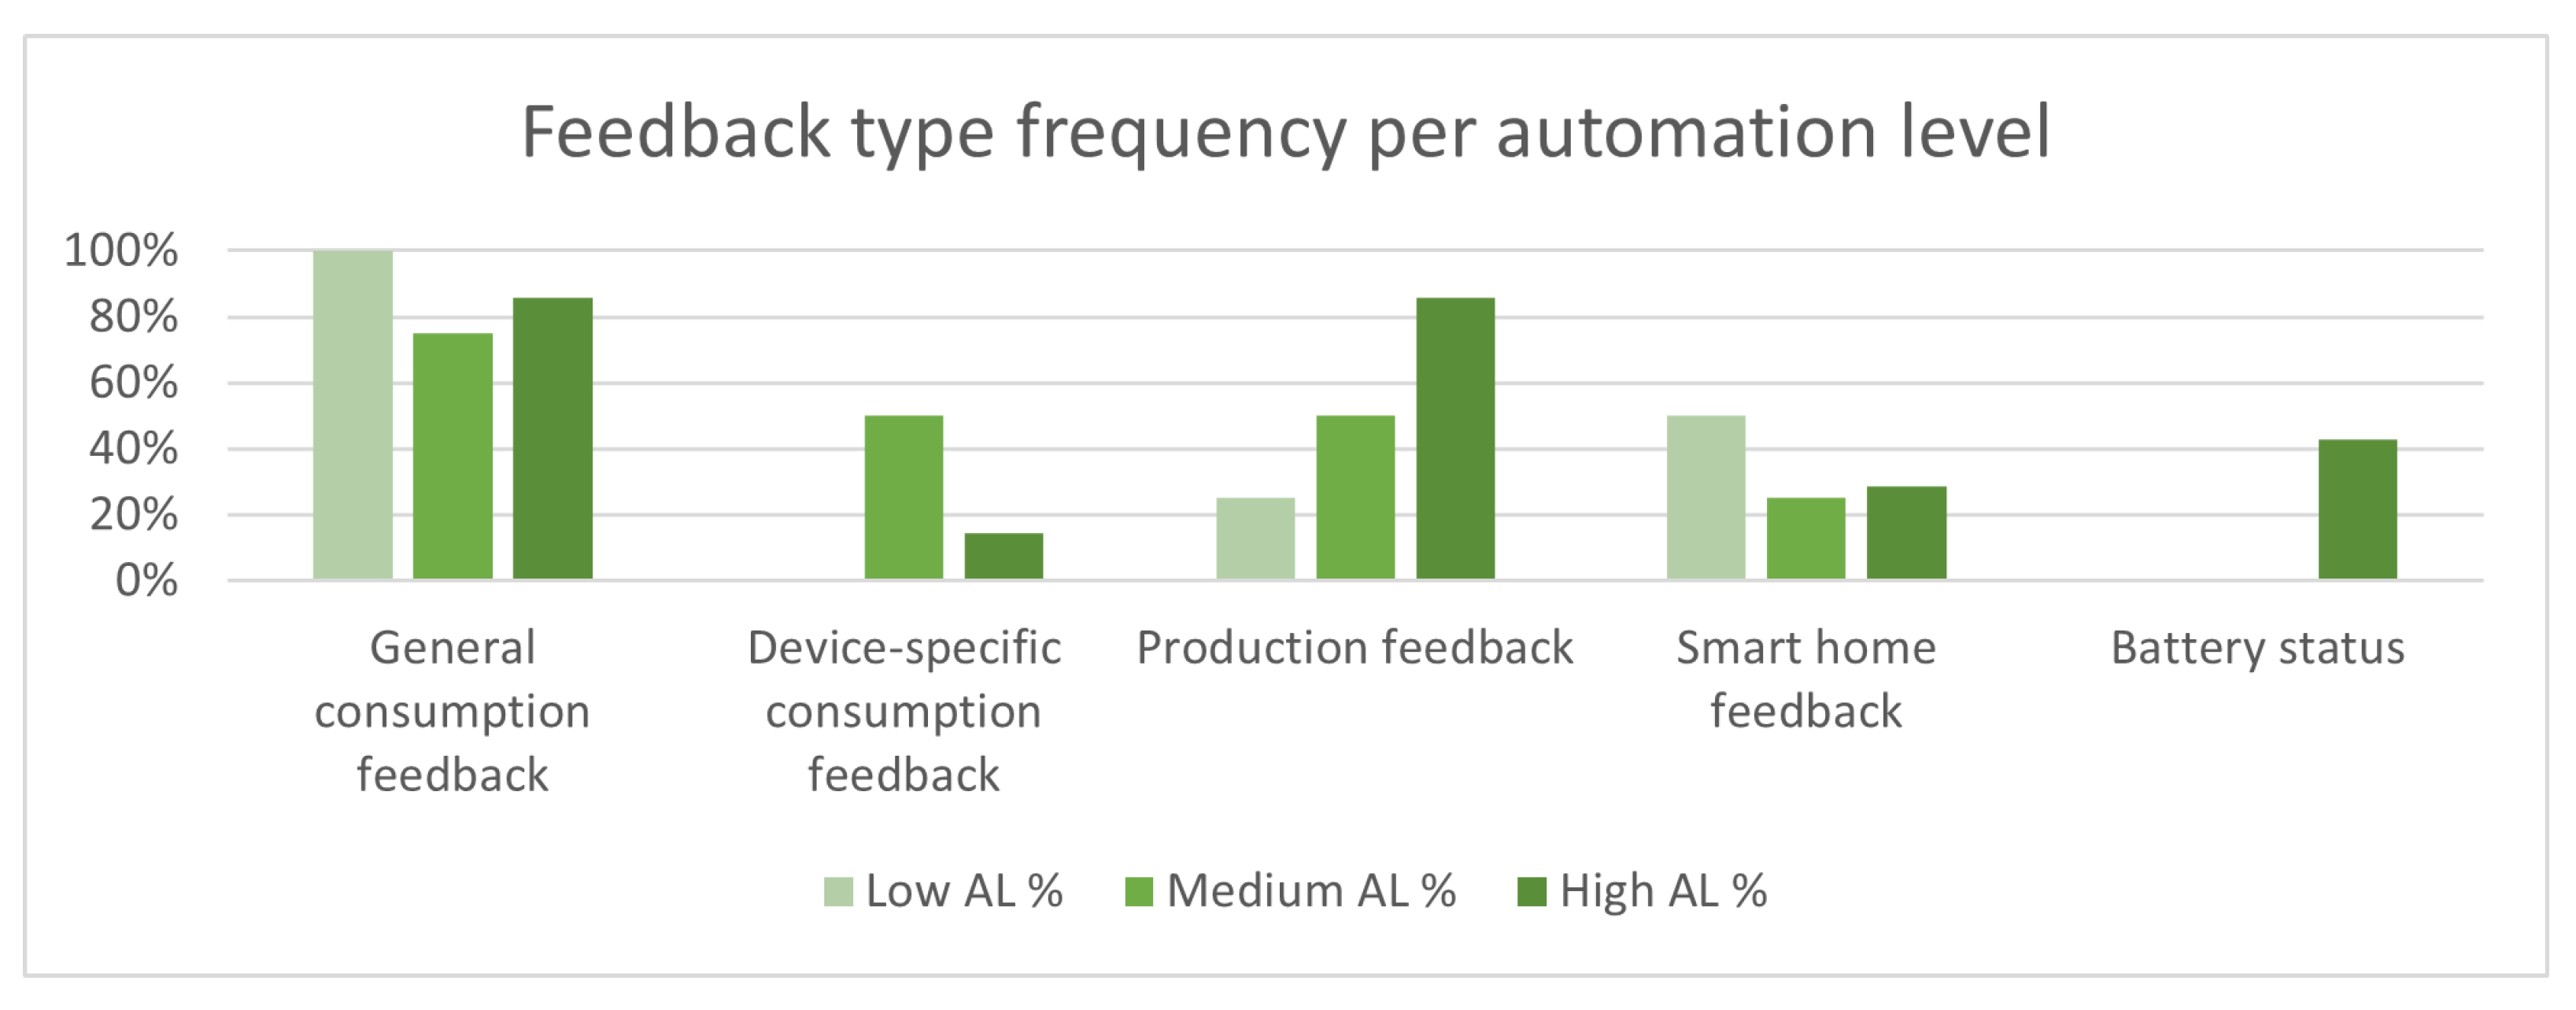
  • General consumption feedback was present in most cases and did not relate to automation level while device-specific feedback was mostly limited to low levels of automation
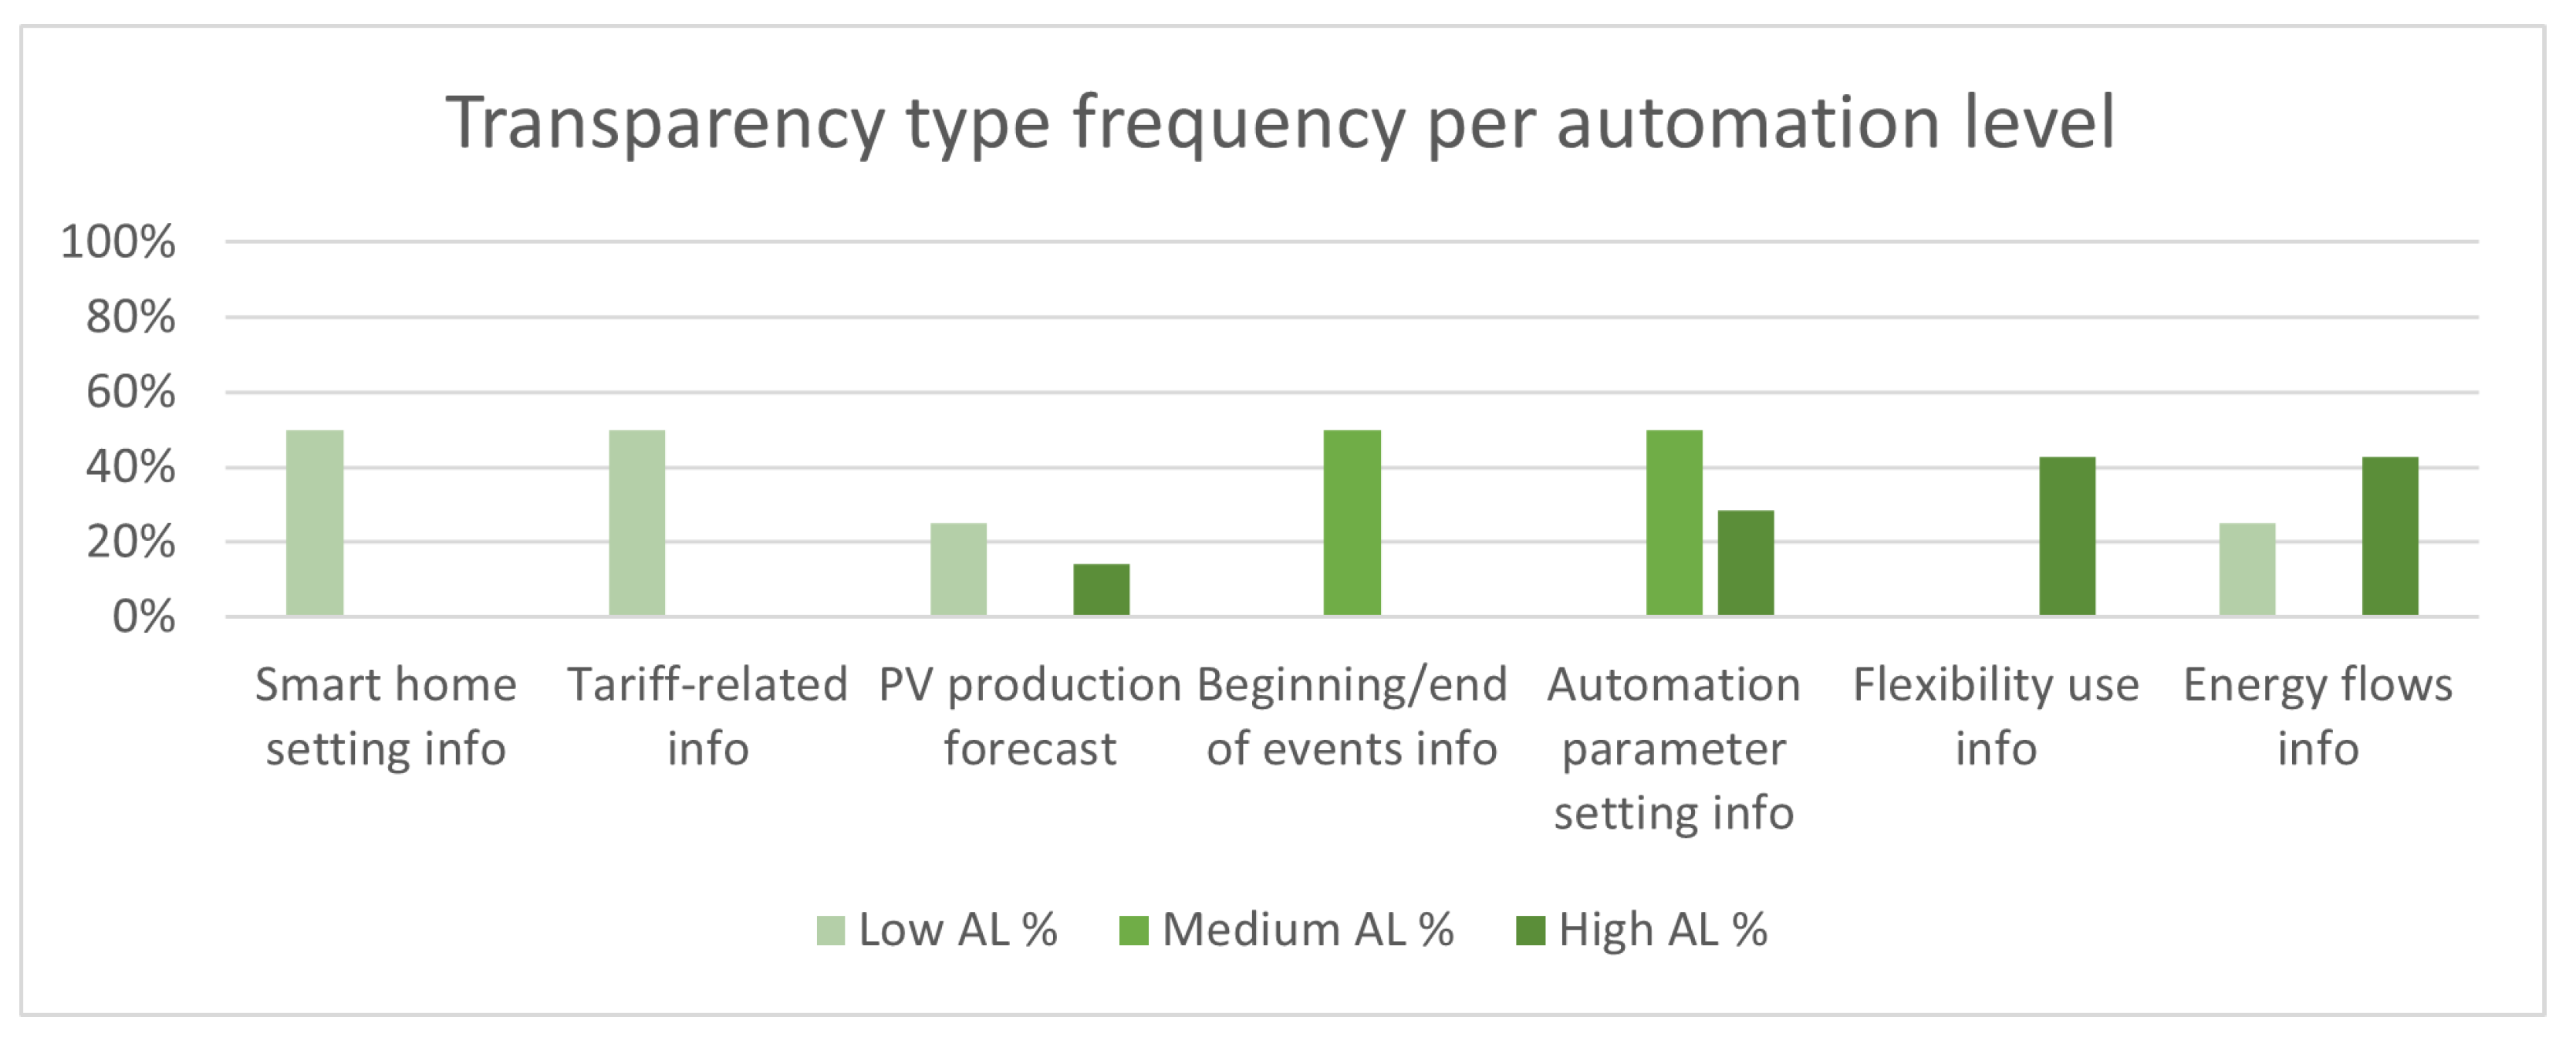
  • Automation transparency and control options were present throughout all automation levels but showed a high variability with regards to the form they took in relation to automation level
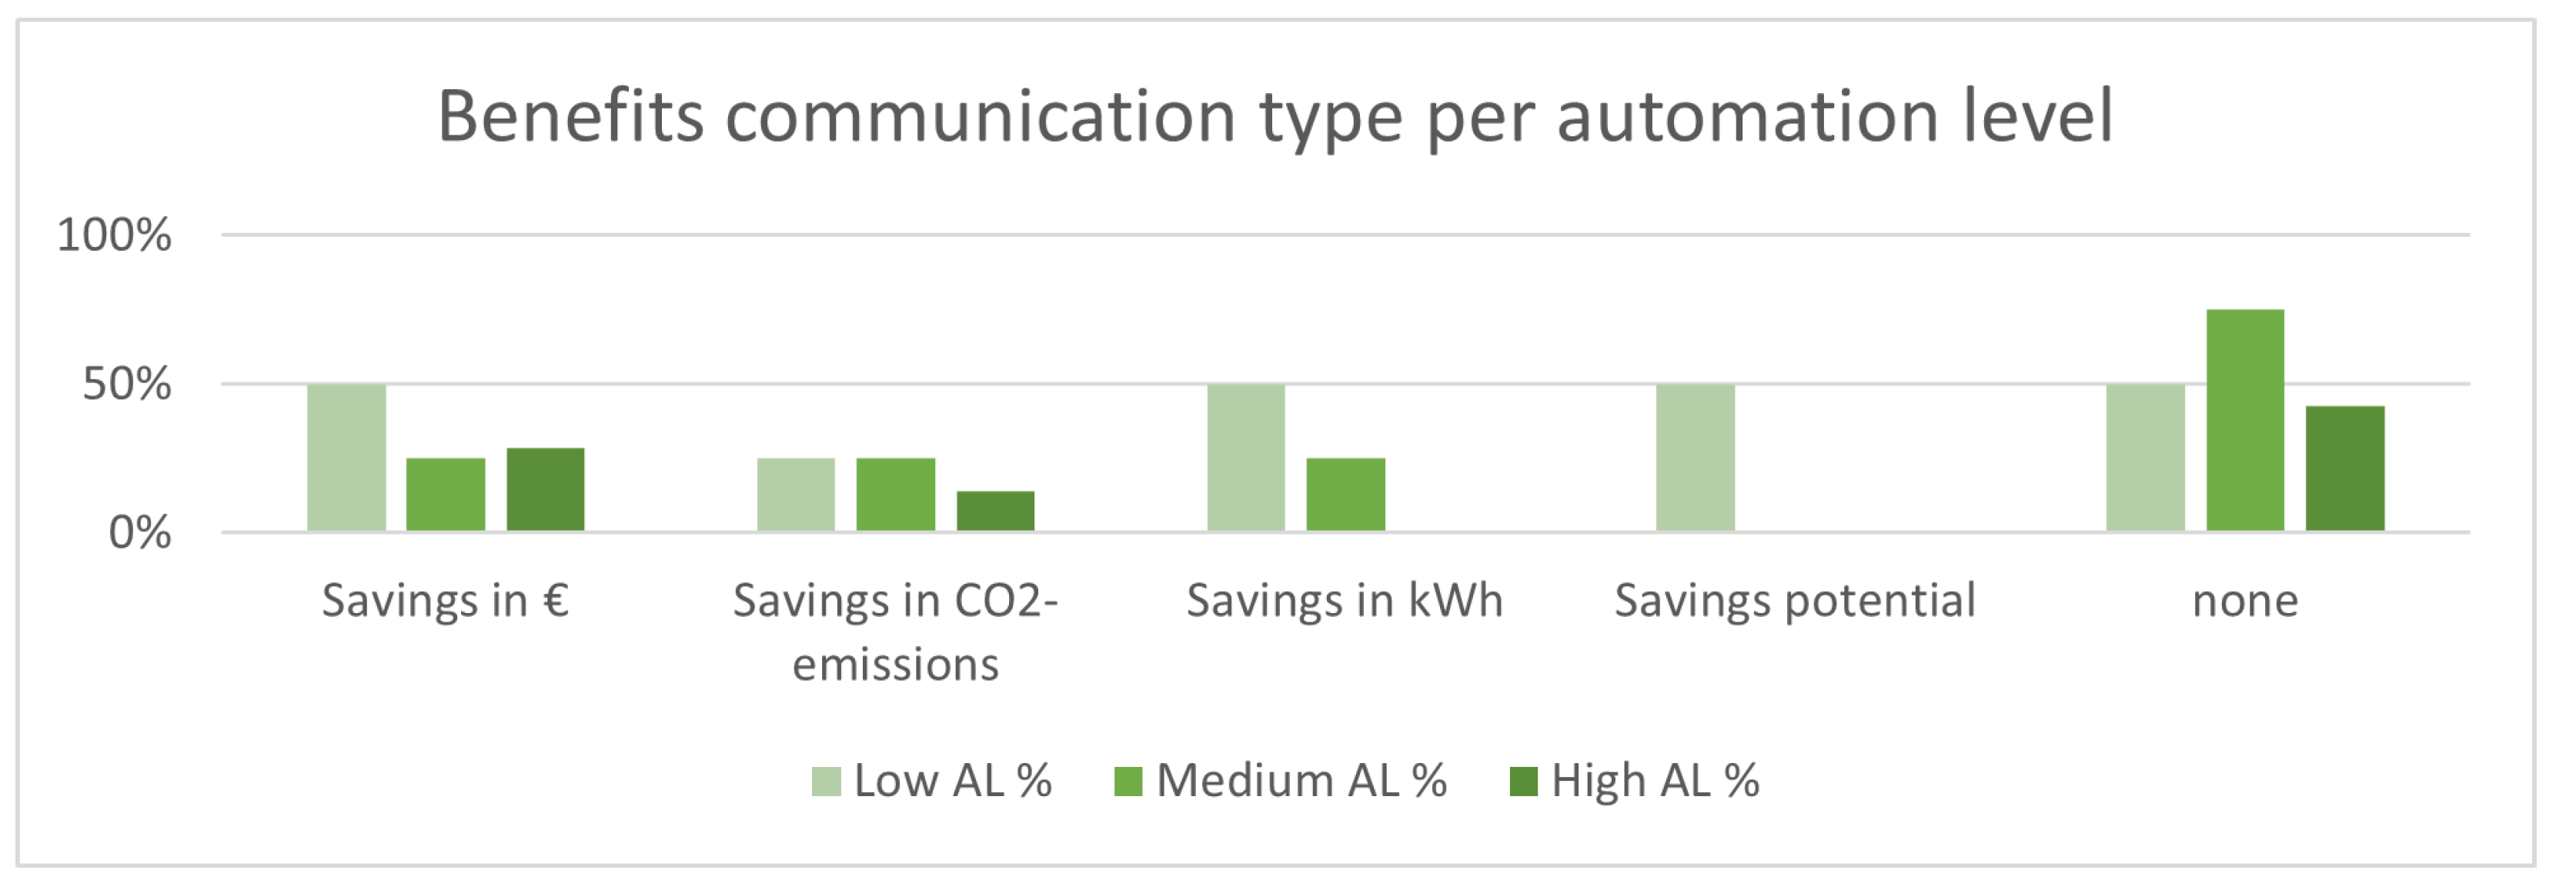
  • Benefit information was provided only in around half of the cases, more often at low and medium automation levels, and most commonly in the form of monetary savings

3.3. Engagement and Enablement Features

Actionable information was provided in four cases, all of which being low AL. In two cases, the information consisted of energy saving tips. In two other cases, target consumption periods were shown and one of these cases further provided target consumption shaving periods.
Direct interaction elicited by the system was only found in low and medium AL cases. Text messages or push notifications with target consumption periods, which were intended to encourage participants to shift their consumption into the indicated target period, were provided in two low AL cases. The notification frequency between both cases differed strongly: in one case, notifications were sent whenever notable PV production could be expected, which ended up being almost daily within the investigated period. In the other investigated case, the frequency of notifications was dependent on the indicated minimum savings potential, resulting in weeks without any notifications and a typical maximum of three to five notifications per week. Push notifications with target consumption shaving periods were used in one low AL case. During the investigated period, such notifications were observed to be sent one to two times per week.
Social information:Social comparison information regarding consumption was provided in two low AL cases and in two high AL cases. Community level feedback was provided in four cases, one of which was low AL, one medium and two high. In three of these cases, the feedback contained information regarding the community’s consumption and production, whereas in one case, it only reported the status of the community’s battery. Out of the 15 reviewed cases, eight (53%) specifically did not provide any sort of social information.
Gamification was only employed in two low AL cases. In one case, this included an energy saving competition game on the building block level. In the other case, the competition was based on the estimation of expected consumption for a day, which included the possibility to “top up” registered consumption via virtual activation of appliances if the estimation was above the actual consumption. The goal of this was to increase participant’s energy literacy [60]. All other (eleven) analyzed cases did not involve gamification.
Summary of main points
  • Actionable information was only provided in cases with low automation level
  • Cases in which the system elicited direct user interaction were limited to medium and low automation levels (and mostly found in the latter, with notification frequencies greatly varying between the cases)
  • Social comparison information was present in approximately half of all investigated cases, all of them at either high or low automation levels
  • Gamification was used rarely and only at a low automation level

Privacy Information

Privacy information was overall rather limited. Whenever present, it took the form of a general privacy statement. The statement was provided as part of the initial contract and/or was available within the web portal or dedicated app. This type of information was only present in two low AL and three high AL cases. No instances of dedicated privacy related control options (e.g., which data is collected, who can access it, what is it used for) or transparency related information (where is data transferred to, who accessed it, when, etc.) could be identified in any of the analyzed cases.

3.4. User Experience Results

In the following, we present user experience-related results clustered according to low, medium and high automation levels. These results provide insight into how frequently the interaction channels were used, how end-users experienced the interface use and which role different features played in this experience, and how end-users experienced their overall project participation (experience of automation, experience of benefit, satisfaction with participation), with again considering the role interactions channels played in this overall experience. The results of this section answer RQ3.

3.4.1. Use of Provided Interaction Channels

In low AL cases, provided interfaces were typically used only to a very limited degree (3 out of 4 cases) although in one case, participants showed themselves to be highly engaged, displayed more behavior change, and paid more attention to the information provided regarding load shifting recommendations. Medium AL cases painted a similar picture, of which one reported high interaction rates (50–75% of the participants) while the others three reported minimal use or, with one case, had no data available to answer this question. Among the high AL cases, available data on channel use was limited with only one case reporting regular use of the provided interface by 26% of the participants. It can therefore be said that interface use was limited at all levels, although in the cases that did use the provided channels, a higher frequency was observed at low and medium AL.

3.4.2. Interaction Experience

At low AL, feedback was reported to be well liked and to provide value, although concerns about accuracy were noted in one project. Suggested target phases for load-shifting were specifically reported as problematic in a another project, as they did not match living circumstances of participants and shifting was not possible (apartments, low-income participants, only electricity consumption affected without heating or hot water) during the suggested times, showing a need for the possibility to state specify available flexibility. Further reported was a positive reception of remote control options in two projects with smart home systems and issues with the transparency of temperature control settings in one case.
At medium AL, participants also reacted positively to provided feedback and specifically praised control and transparency aspects. Requests for acceptance of automation were only partly approved (20%; 52%) and in case of AL 4 with the option to reject, were vetoed 20–22% of the time. The option to set single automation event parameters was more often for white goods, such as washing machines and dishwashers, than for EVs where participants found the available interface inconvenient, as they wanted to set their parameters directly in the car rather than use the mobile app. There were again notable issues due to insufficient personalization options that did not allow participants to specify when automation requests where welcome and benefit communication beyond financial feedback (as kWh or CO 2 -emissions) was noted as hard-to-understand by participants. In the case study that provided end-users with the option to veto the automation of relative sensitive loads, such as power-boards with IT-equipment, complaints about lack of automation transparency were noted.
At high AL, feedback was, where available, appreciated and praised by participants as increasing awareness and understanding towards automation. It did, however, also receive some specific negative comments with usability being criticised in one case and missing actionability being critically remarked upon in another. A perceived lack of transparency caused issues in one of the analysed high AL cases with participant voicing complaints that it was unclear what was actually going on in their homes with regards to automation and, related to this, insufficient communication of setting requirements that led to issues with automation procedures. Another results of the high AL case analyses was that despite the high AL, there is still a need for interaction, as too infrequent interaction leads to disengagement with the project and their participation in it. Finally, an interest in being able to compare consumption with similar households was noted.

3.4.3. Project Participation Experience

At low AL, insufficient and too infrequent interaction with participating end-users led to disengagement with the project in multiple cases, with project participation not being on users’ minds as a relevant factor anymore. A further repeated issue observed was the small profit margin that failed to motivate participant sufficiently to take on the inconvenience of manual adjustment of consumption patterns in three out of four analysed cases. Privacy concerns were only noted as an important factor in one case, but were so pronounced that they kept end-users from interacting with the smart home system provided to them to support energy conservation. The one low AL project that did truly succeed in engaging end-users successfully to change their energy practices was implemented in a pre-existing community of single-family homeowners and included daily interaction and strong benefit communication both in regards to community benefits and savings potential which reached up to €60/y.
Limited financial benefits were an issue in medium AL cases as well, with only one project providing noticeable benefits (around $10 per automation event). Further, there was an issue with negative impact of experienced comfort in three out of the four medium AL projects, with decreased comfort being mention in one case, 24% of the participants stating automation events as noticeable in another, and problems with unavailable heating and loss of work due to impact on ICT equipment. Participants of one project remarked positively on the increased independence and community participation.
At high AL, project participation experience was typically reported as relatively positive, although in one case, lack of automation transparency impacted the participation experience negatively, as it led to feeling under-informed and caused irritation. Further expressed concerns were loss of comfort and independence. Engagement varied within the analysed high AL cases with both framing and communication form, as well as the communication frequency impacting it. Community-oriented framing had a particularly positive impact with participants noting pride in being part of a community. In one case, spill-over effects on other environmentally sustainable behaviors concerning resource conservation prompted by feedback-based increase of awareness were reported.

3.5. Additional Information—Successes, Failures, Missed Opportunities

Lastly, we report the results from the additional questionnaire, highlighting the relevant reported issues and successes mapped to the ALs, and also contribute to the answering of RQ3.
  • Interaction successes: In low AL cases, experts noted consumption feedback, information on both expected and achieved savings, as well as forecasts providing actionable information with regards to recommended shifting times as particularly important with regards to success. At medium AL, the possibility of controlling automation events but also, where available, the setting of parameters for these events were noted as core success aspects. Transparency in form of weekly reports on automation that was carried out and provided detailed insights were received very positively, as well as interface simplicity and the provision of multiple different channels. Within high AL cases, parameter setting as a means to control automation at least to a degree were appreciated wherever they were provided, as well as transparency with regards to automation and information on benefits. Again, the availability of interaction channels and the provision of multiple forms was mentioned positively with the main value lying in ensuring awareness and transparency rather than encouraging specific behavior.
  • Interaction issues: Here, we summarize the results from the questions regarding both interaction failures, as well as missed opportunities observed by the participating experts. At low AL, missing personalization options to enable end-user to indicate flexibility potential for specific time periods were noted an as issue, as well as insufficient or completely missing benefit communication. Further, end-user engagement suffered from low interaction frequency and insufficiently actionable information to support manual consumption shifting or shaving. Furthermore, although only one case was concerned, missing assurance of privacy protection in one project led to an avoidance of the platform altogether. Among the medium AL cases, it was noted that the actual acceptance of automation events was relatively limited and participants did not sufficiently understand CO 2 -emission and kWh saving related feedback. Further, missing control over automation requests put forward through regulating parameters was noted as an issue, as well as missing social comparison information. Evaluations of high AL cases showed issues with regards to unsuccessful control through parameter setting and problems due to a failure in providing sufficient transparency on automation processes. Again, unavailable social comparison information was noted as a missed opportunity, as well as insufficient benefit communication. Important to note is that in cases that did not allow for parameter-setting via the interface or provide the option to veto an automation event, this missing control affected acceptance negatively. Finally, in high AL cases interface usability was lower, which also affected to overall experience negatively.

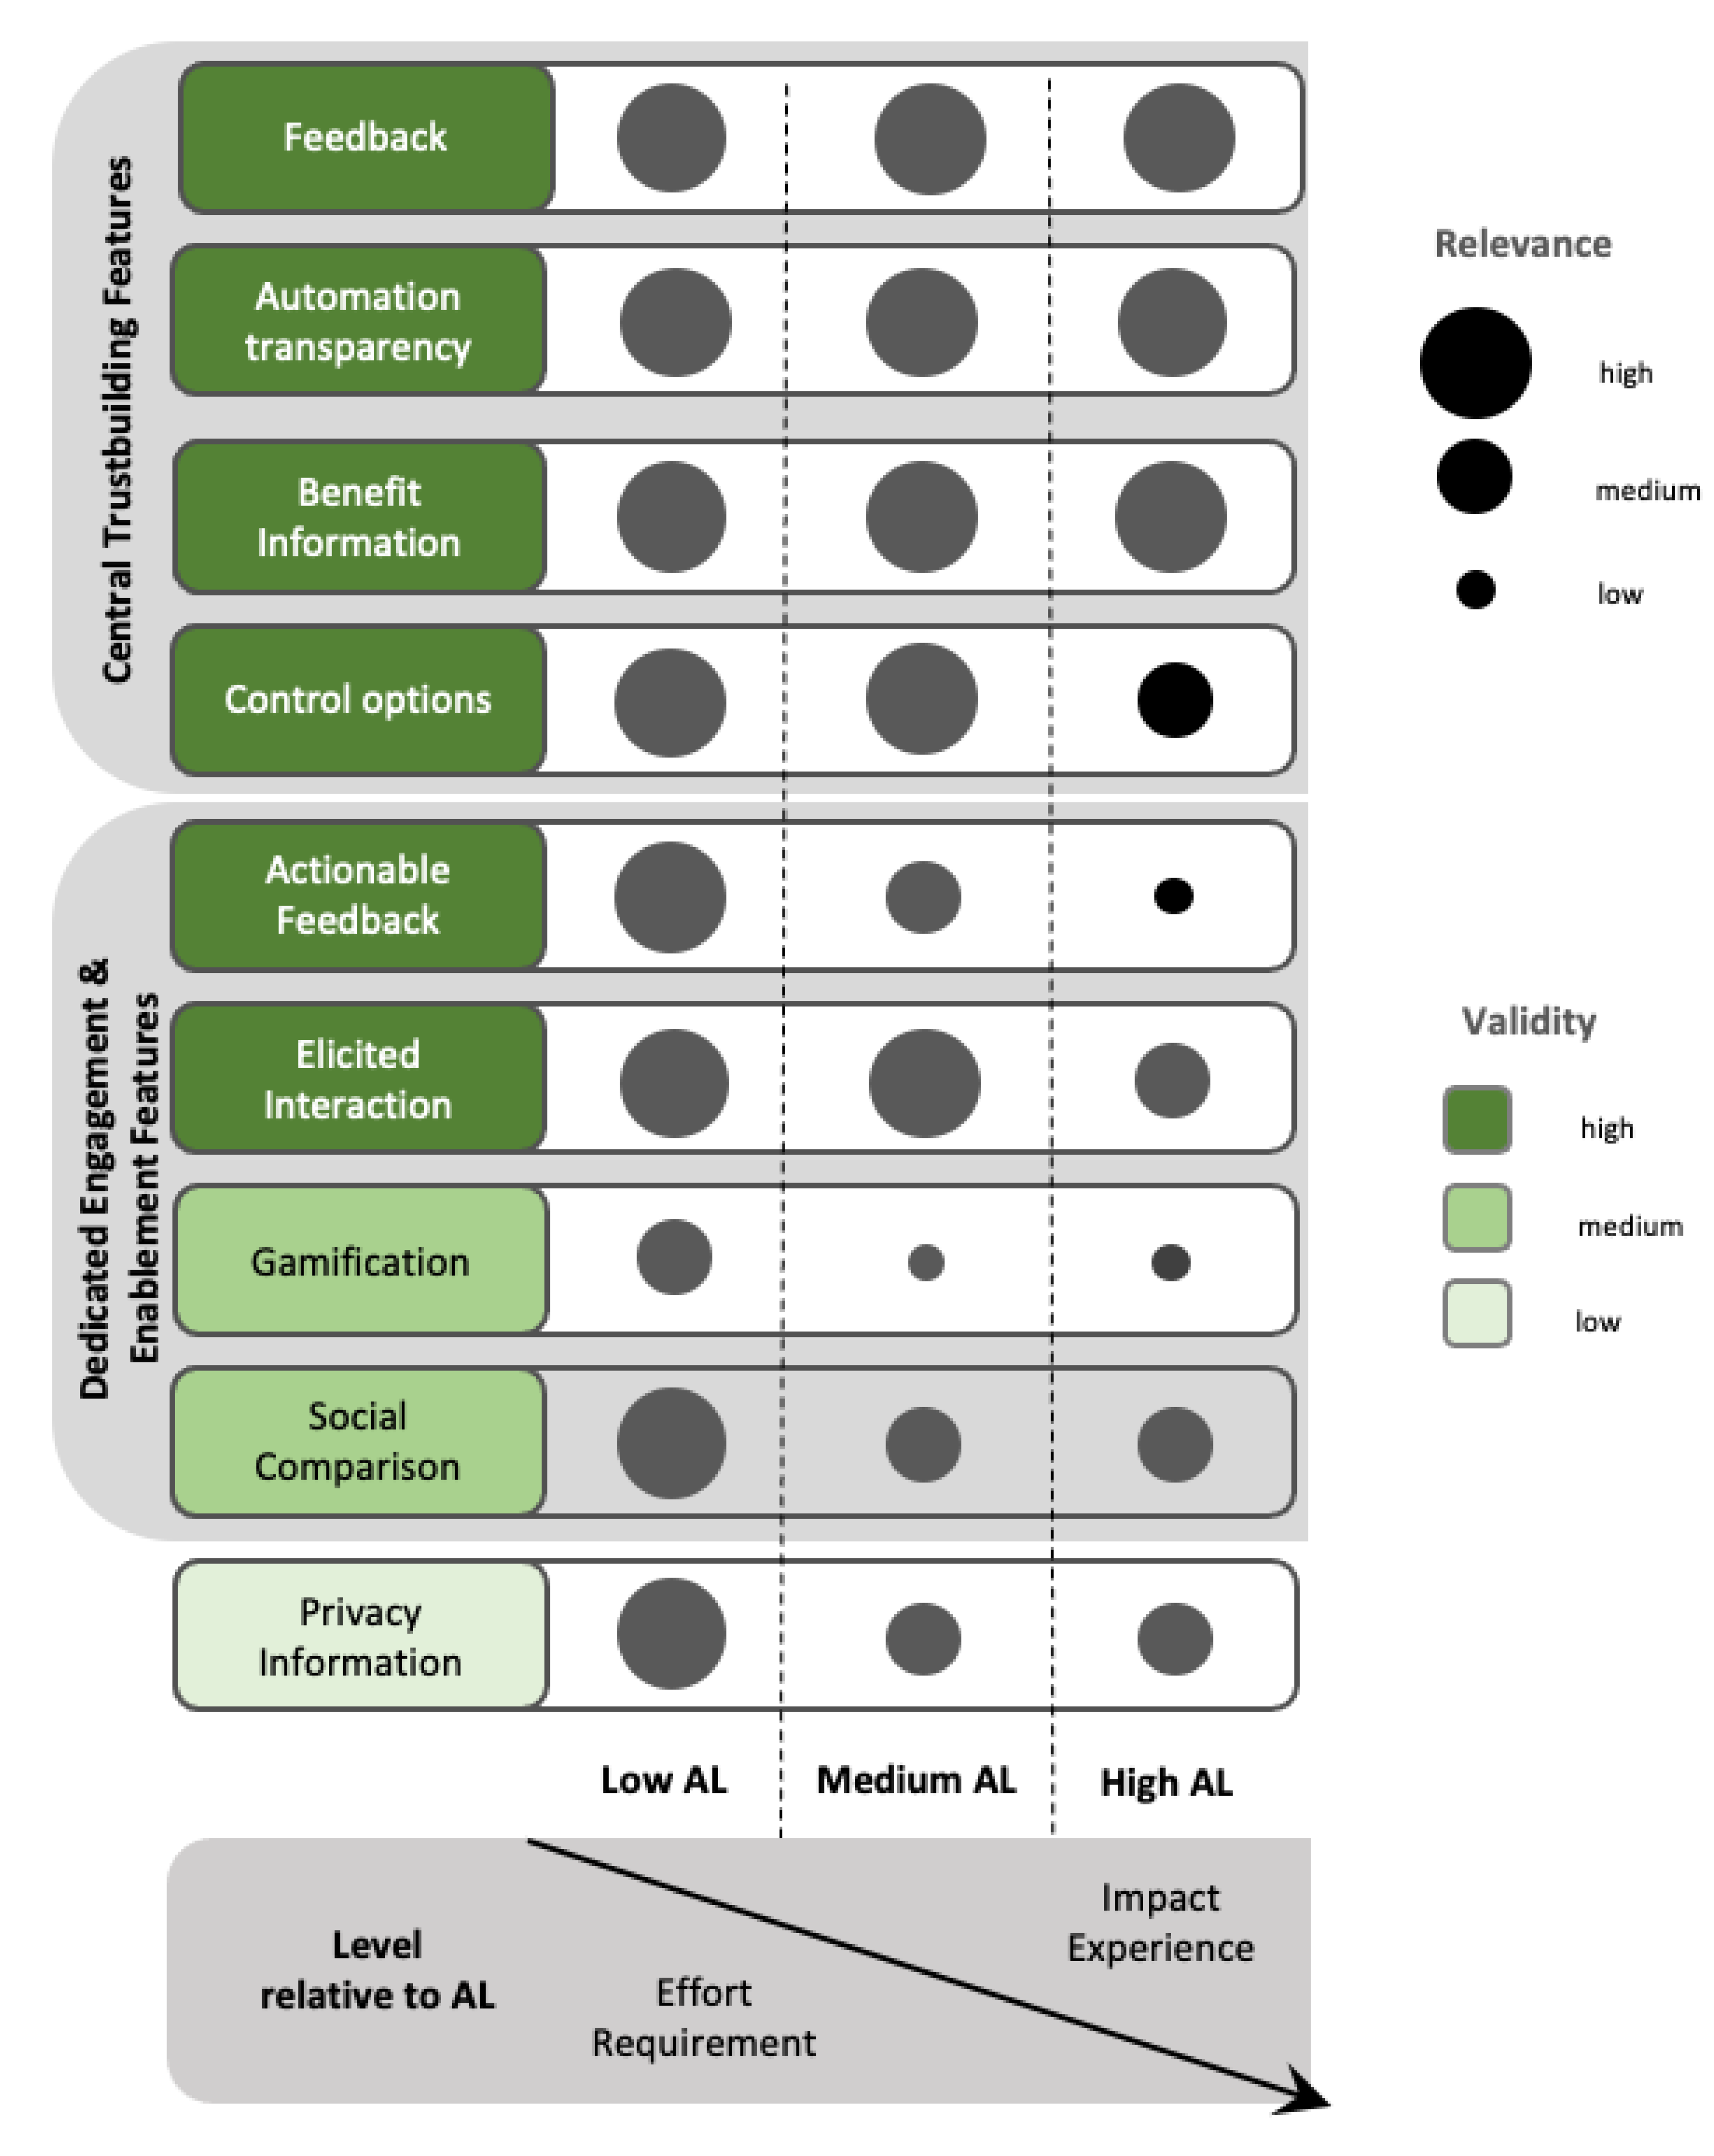
4. DSM Interaction-Based Trust Framework

As outlined in Section 2, the obtained results were categorised, noted with regards to their frequency and value orientation (positive or negative), prioritised regarding their impact on acceptance, and finally mapped to their effects relative to each AL. From this mapping we derived the expected impact of each investigated interaction feature in relation to the different automation levels. The result is a framework for interaction-based trust towards DSM, consolidating the results within an easy-to-read and applicable frame. This framework is our answer to RQ4. We first describe the impact of each acceptance factor within the identified categories, and then describe the resulting trust framework.

4.1. Acceptance Factors in Relation to AL

What the interface needs to provide to further trust and acceptance strongly depends on the degree of impact on their lives people can expect to experience (impact experience) and the degree of effort people are expected to invest in order to assure successful DSM (effort requirement). Based on the recorded affected loads and expected active participation of end-users, the experience impact and effort requirement levels were rated for all reviewed cases. Levels were rated according to the the scheme shown in Table 2.
The graph shown in Figure 2 indicates the distribution across the cases (numbers on the x-axis indicate detailed automation levels). Impact Experience and effort requirement both typically decrease with an increase of AL although impact experience to a lesser degree.
General feedback (see Figure 3) is valuable and typically provided at all ALs with component-specific feedback relevant as applicable within use case set-up. Device-specific feedback is specifically underused in low AL cases, where it would be of value to support the development of actionable energy literacy.
Automation transparency (see Figure 4) is of continued importance at all automation levels but type of needed transparency changes depending on the automation level (from providing actionable information at low AL to providing information on the use of flexibility at lower or higher levels of detail at medium and high AL). Automation transparency is, beyond a small number of fails, well integrated at all automation levels.
Control options (see Figure 5) regarding automation parameters and interaction preferences are of particular importance when impact experience and/or effort requirement are high and decrease in relation to these factors (although the need does not disappear completely at high automation levels). Control options are severely underused at low automation levels and somewhat underused at medium automation levels regarding control through preference/availability specification.
Benefit communication (see Figure 6) is most employed at low automation levels and more commonly consist of information on savings in € or kWh than CO 2 -emission savings. Overall, benefit communication is crucial but underused at all automation levels, most prominently at medium automation levels. Particularly neglected is the communication of environmental benefits which are typically a driving factor for participation, making this fail even more significant. This ties into the lack of community-level benefit communication which is just as significant. Regarding environmental benefit communication metrics used are a sensitive point and translating them into easily comprehensible units beyond kg of CO 2 emissions saved is advisable.
Dedicated engagement and enablement:Social Comparison Information is most used at low automation level (50%), and available to a much less er degree at medium or high automation levels (0% and 29%, respectively). There is, however, explicit interest in it at all levels and it can therefore be recommended to include it independent of automation level. Gamification was only employed at low automation level cases. It most commonly aims at competition and typically fails in creating high engagement levels. A better use of gamification techniques might be to increase energy literacy and perceived empowerment of end-users through small quizzes or similar which would have value at all automation levels with it being highest at low levels.
Actionable information in the form of target consumption/shaving phases and energy saving tips was only employed at low automation levels. Providing actionable information to interested end-users who would like to engage more at medium or high automation level could, however, add to experienced benefits and succeed in engaging participants to a higher degree. Active Interaction is an integral part at low and medium automation levels and employed to a much lesser degree at higher automation levels. Interaction is important and needs to be matched to effort requirement and to a degree impact experience. The more effort is required, the more interaction is needed (although a personalisation of frequency preferences should be possible). However, even if user effort requirement is minimal at high AL, regular communication (e.g., 1 monthly report) should be kept up do keep participation present and communicate achievements/benefits actively.
Privacy communication did not take a prominent place in any of the projects and privacy concerns caused an engagement fail in a low automation level project. Privacy communication is likely to be of higher importance at low automation levels when end-user feel that there is a close eye on their behaviour within their households. If transparency and benefits communication are successfully addressed and the rationale of user involvement including data collection is clear and aligns with end-user interests and values, privacy concerns will be unlikely to cause trust issues. To further alleviate such concerns end-users can additionally be provided with control options and transparency regarding the collection, access and use of their data and transparency.

4.2. The Framework

We transformed the condensed results for each impact factor and its relation to AL into a framework for DSM interaction acceptance factors (see Figure 7). The model describes the core features of DSM interaction channels and allows to deduce the importance of a feature for acceptance building in relation to it. Within the model, each of the nine identified factors is mapped to each of the grouped ALs (low, medium, high) and shows the overall as well as the varying levels of relevance relative to each AL. Factors are either grouped into the main overarching categories of core trust-enhancing features or dedicated engagement and enablement features or additional factors outside of the main categories (only privacy information is not in any of the main categories in the current iteration of the framework). The framework further shows the relation between effort requirement and impact experience and AL, which are inversely proportional, meaning that the higher the AL, the lower both effort requirement and impact experience are. This, in turn, is reflected in the generally diminishing relevance from low towards high ALs within the individual factors.
Lastly, the framework shows the level of validity or confirmation for each factor. While most factors have been confirmed to have high validity, ratings were medium for gamification, and social comparison, and low for privacy information. We added this information to reflect the empirical foundation of each part of the framework, based on the data we had collected. It is intended that especially the medium and low rated factors are tested, validated, and potentially revised or expanded as the framework when the framework is applied. The framework is to be used as a basis for designing and assessing user experience with regards to trust of and acceptance in DSM systems, where the relative impact of automation level can be modelled via the framework.

5. Discussion

In the following section, we discuss and summarize our findings, clustered according to automation level, present some additional insights specifically regarding rationale and benefit communication, discuss limitations, and suggest pathways for potential further research. The findings and the derived DSM trust framework are based on a systematic analysis of 15 expansive use cases across 6 different nations with regards to the impact different implemented interaction features had on user experience and trust [75]. A key insight that also forms the base of the developed framework is that the impact of interaction features on the users’ trust and acceptance is mediated by a given system’s level of automation. In tandem with the degree of automation, the affected loads play a further mediating role and both affect the level of impact on the user when load shaving or shifting occurs, as well as the level of effort that is required on the part of the user within that process. Thus, the required effort and the experience of impact form the central nexus of engagement requirements, conceptualization, communication, and control needs.
At low automation levels, which are characterized by manual load shifting or manual automation based on automatic identification of optimized energy utilization curves, an important guideline underlining previous findings [76] is to actively reach out to participants. A further requirement for low-automation DSM settings is to provide actionable information on how shifting of sufficiently sized loads can be achieved, as well as detailed and prompt feedback to strengthen energy literacy and self-efficacy feelings among household tenants [77]. The results summarized in this paper confirm and further extend previous findings on actionable information design [60,61] for the application field of DSM. A further clear recommendation to be drawn with regard to low-automation scenarios is that benefits should be made visible to incline towards participation [13], as significant personal effort is required for intrinsic behaviour change. Further, continuous system-elicited interaction for a prolonged period of time in order to keep awareness high and support the building of new habits is recommended. A long-term change in behavior can only be achieved through the development of new habits [78]. In addition to the above-mentioned aspects, dedicated intervention strategies, such as commitments, prompts, social norms communication and rewarded goal-setting, are necessary until behavioral adaptation has solidly been formed. It is essential that tailoring and personalization options are provided within this process to account for people’s realities regarding flexibility, further building on Sardianos et al. [79].
When increasing the extent of automation towards medium levels, involvement of end-users is reduced to acceptance or the option to veto single, actively proposed automation events. Correspondingly, there is a lower level of exigency to engage users continuously and provide actionable information to support behavior change. As long as users don’t have to actively request load shifting and shaving, but can expect to experience demand-side management through automation requests as well as affected loads, control options and transparency about what exactly has been done and will be done are crucial [80]. Therefore, providing appropriate intelligibility of system behavior poses a great design challenge for human-computer interaction, and progress in insights in this area should be closely monitored [37]. In these medium automation levels, efficient benefit communication remains essential, since these levels are the most likely to cause participants to feel impeded (compare [81]).
At high automation levels with a limited to no noticeable impact on persons in their households, the need to involve them actively and continuously offer prospects of personal benefits is reduced. The function of provided human interfaces transitions towards mediating reassurance and accountability, therefore providing transparency. In this form, interfaces offer end-users insights into already occurred, occurring, and planned automation events, as well as the involved devices and systems in their household. This enables predictability, a better understanding of automation patterns and their relation to perceived impacts, and a possibility to check and potentially interfere directly, should any issues be experienced. It is still recommended to provide end-users parameter setting options even at high automation levels so that they are able to override automation events should this prove necessary at any point [82] and to communicate achieved benefits regularly.
Benefit communication can be shaped more strongly towards a community perspective, having shown itself to play a larger role in positive project participation experience of end-users at this automation level. In terms of communication channels, the one which tends to be preferred and receives the best responses is the smartphone via a dedicated app or text messages, as it is typically easily accessible and a large percentage of the population is equipped with one. Emails work well as support channel if end-users do not possess a smartphone or experience issues with the app, for regular summarizing reports, and if communication does not need to be as frequent as is often the case at high automation levels. Web-portals can be problematic due to the need for additional sign-ins and access issues and are therefore less popular.
The overall conclusion of this case analysis is that human-computer interaction (HCI) takes on different roles at different levels of automation and experience impact for users. This role varies specifically with regards to changes in the need for control options and the type required due to the level of directly experienced impact, as well as with the degree of active involvement that is required from end-users. However, providing transparency, benefit information, and sufficiently detailed feedback remains a continuous endeavor throughout all automation levels.
We also identified an imbalance between the recorded motivations of end-users, where environmental reasons play a core role, and the hard-to-interpret and often only to a very limited degree provided benefit communication regarding this point since most benefits are communicated in terms of savings. Associated with this insufficient consideration of self-transcendence-value-related motivations for participation is a lack of a dedicated integration of a community perspective in provided benefit communication. We, therefore, see the active furthering of shared green identities as a potential pathway to build intrinsic motivation among end-users towards independent actions implementing a sustainable lifestyle also beyond the scope that has been targeted.
Summarizing these results, human-computer interaction in demand-side management varies according to the degree of automation and the impact, experience, and effort requirements associated with it. A human-computer interface can act as a helper, a reminder, a teacher, a feedback provider, and an encouragement agent when automation level is low, while experienced effort and impact on convenience and comfort are high. With an increase in automation level, the task changes from emphasizing control at a medium automation level to providing insight and sharing accomplishments in order to foster accountability, transparency, and justification at high automation levels. Consequently, measurement of HCI success with the goal of furthering trust and acceptance within automated DSM programs changes from active engagement and empowerment to trust derived from information availability and monitoring ability.

6. Conclusions

In this paper, we presented the results of a large-scale investigation across six European countries into trust and acceptance of automated demand-side management (DSM) in order to better address the challenges of energy management via the utilization of end-user flexibility. Through a systematic comparative case analysis, we identified, extracted, and consolidated the factors that ultimately affected end-user interactions in terms of trust and acceptance within each investigated use case. In this process, we discovered an interrelation between the level of system automation and the role different interface features played for end-user trust and acceptance. We determined that the higher the level of automation was, typically leading to less effort being required of end-users and less impact experienced due to the loads automated at higher levels, the more the task of provided interaction channels shifts from engaging and supporting towards providing transparency and maintaining a certain level of awareness, putting the emphasis accordingly on different interface features.
We further consolidated and transferred these findings into a DSM trust framework. The framework describes core interaction features in automated demand-side management and their impact on user trust and acceptance under consideration of the level of automation, along with the general proportionally inverse effect of automation level on effort requirement and impact experience. The framework is designed to be (a) expandable towards additional factors as well as additional validation of existing factors, (b) extendable towards an eventual model for user trust and acceptance in DSM, and (c) adaptable towards other automation contexts. It therefore provides both a guide for practitioners designing trust-furthering interaction systems for automated DSM programs and a base for he continued development through further research. It also provides insights for policy makers and industry stakeholders with regards to motives and participation requirements end-users have regarding automated DSM, highlighting pathways for engagement and empowerment of consumers within the energy transition.
Limitations of this research are the limited number of use cases that were available per automation, variations in the methods implemented to collect the original data within the case studies affecting the comparability of the data, and variations in user characteristics. External validity can nevertheless be seen as solid, since all analysed cases were field trials involving end-users in their everyday lives. As potential pathways for future research, we suggest the application of the framework for interaction design at different automation levels in order to validate the proposed feature impact on trust- and acceptance-building. We further suggest to investigate the potential of green identity-building and how to apply it in benefit-communication in more detail in order to engage end-users successfully within their value systems and improve alignment of program goals and end-user interest. Finally, as the importance of considering the realities of participants more strongly in the design on DSM programs was very present in the case analysis, we recommend that designers investigate and implement appropriate and inclusive control options that allow the degree of personalization needed for a more diverse group of users.

Author Contributions

Conceptualization, L.D. and P.F.; methodology, L.D.; formal analysis, L.D. and A.M.; investigation, L.D.; data curation, L.D.; writing—original draft preparation, L.D. and A.M.; writing—review and editing, L.D., A.M. and P.F.; funding acquisition, P.F. All authors have read and agreed to the published version of the manuscript.

Funding

This work was completed within the IEA research cooperation framework on behalf of and funded by the Austrian Federal Ministry for Climate Action, Environment, Energy, Mobility, Innovation and Technology represented by the Austrian Research Promotion Agency.

Institutional Review Board Statement

Not applicable.

Informed Consent Statement

Not applicable.

Data Availability Statement

Not applicable.

Acknowledgments

The authors would like to acknowledge all the participant of the Social License to Automate task of the IEA Users technology collaboration program (Users TCP), as well as thank all the interview partners from the various case studies.

Conflicts of Interest

The authors declare no conflict of interest.

Abbreviations

The following abbreviations are used in this manuscript:
ALAutomation level
DSMDemand-side management
DSODistribution system operators
EVElectric vehicle
HCIHuman-computer interaction
IEAInternational Energy Agency
TCPTechnology collaboration program
LEDLight-emitting diode

Appendix A. Analysis Template

This is the Common Case Analysis Template developed in the “Social License to Automate” Task within the IEA Users Technology Collaboration Program (IEA UsersTCP). Slight modifications were made to the formatting in order to fit the journal template, it is otherwise identical in presentation and content to the one used in the use case analyses.

Appendix A.1. Section 1: Project Details

This section concerns basic information around the project and should be fully completed.
1.
Project name:
2.
Project lead organization:
3.
Project partner organizations:
4.
Project funding bodies:
5.
Project funding amount:
6.
Project start date
7.
Project end date:
8.
Project website:
9.
Contact Name:
10.
Contact Role:
11.
Contact eMail:
12.
Project aim:
13.
Research focus:
14.
Data sharing: possibilities and constraints:
15.
Number of cases within study:
16.
Case description:
17.
Case location (Country, City/Region):
18.
For how long has the automation system been tested?

Appendix A.2. Section 2: Context, Aims and Framing

This section of the template covers the local starting point including the regional energy system characteristics and the user segment involved, the automation goal, and the involvement of end users to achieve it. This included the communicated rationale, expectations towards end-users, and opportunities provided for feedback and dialogue.
19.
What are the characteristics of the local/regional energy system (including energy mix, status of the grid in the area)?
20.
What are the characteristics of the energy users involved?
21.
How were end-users recruited?
22.
What was the rationale for automation communicated to end-users?
23.
What is the purpose of the automation? (i.e., solve distribution grid congestion, transmission grid congestion, grid balancing, minimize network charges, minimize costs at day-ahead-market, maximization of self-consumption, innovation …)
24.
What is expected from them in the project?
(a)
If this includes a change of energy practices, which practices were changed?
25.
Which expectations and benefits are presented to end-users? Were costs and cons communicated as well?
26.
Was a sense of fairness and reciprocity established and if yes, how?
27.
Was dialogue with consumers (ways to receive feedback, answer questions, etc.) enabled and were consumers encouraged to give feedback?
28.
Was accountability communicated to end-users and if yes, how?
29.
Which technical components to enable the automation were installed in the house of clients and which actor owns them? (i.e., smart meters, smart sensors, smart appliances, smart heating systems, batteries, EV charging systems…)

Appendix A.3. Section 3: Involved Actors and Regulatory Aspects

This section of the template covers involved actors, their roles and tasks performed within them, as well as establishment of relationships and interactions between stakeholders. Further addressed are regulatory framework, market framework, and any accountability-related protocols.
30.
Who controls automated flexibility activation? (i.e., consumer/prosumer, aggregator/retailer, distribution system operator…)
31.
Which actors were involved?
  • Suppliers
  • DSOs
  • TSOs
  • Component manufacturers
  • Regulatory instances/authority
  • Aggregators
  • Other technology providers -> Please specify:
  • Others: Please specify
  • Which tasks each actor performed/currently performs within the project?
32.
Which tasks each actor performed/currently performs within the project?
Task/RoleActor                             
Frequency control
Congestion management
Voltage control/regulatory
Trading flexibility in day-ahead of market
Trading flexibility in intra-day market
Providing power reserves
Technology provider
Other, please specify
33.
With whom do the actors interact and why?
  • Option 1: Draw a diagram instead of answering yes or no, and write down the characteristics of the interaction. Example: Energies 16 02393 i001
  • Option 2: Example:
    Actor 1               Actor 2               The Relation            
    DSOConsumerDirect load control
    AggregatorConsumerSmart meter roll out
34.
How were the relationships between involved stakeholders established and how are they governed? (i.e., on mutual regard, bilateral contracts, regulatory framework (protocols etc.), market rules, …)
35.
Briefly describe the regulatory framework for automation projects within the corresponding country context:
36.
Briefly describe the market framework (e.g., rules) for automation project within the country context:
37.
Are there any rules, protocols that hold energy companies accountable for their mistakes and unjust practices?

Appendix A.4. Section 4: Technical Parameters of Automatization and Impact

This section of the template covers the details of the implemented automation procedures including level of automation, load types to activate, restrictions around activation (frequency and duration) and communication of such restriction to end-users, advance notice of automation activation and options for end-users to veto such processes. Further addressed is the expected impact of automated processes on end-users.
38.
Which loads can be automatically activated? (i.e., in-home-Battery, community battery, heat pump, e-car, electric boiler, EV charging system, air conditioning, smart appliances, other: please specify)
39.
Did you specify a uniform maximum duration per activation? (yes—same value for all participants, no—different values for each participant or choice, no—we did not specify this)
  • What was the maximum duration per activation? (hours)
40.
Did you specify a uniform maximum activation frequency? (yes—same value for all participants, no—different values for each participant or choice, no—we did not specify this); If yes:
  • Which units were used to specify maximum activation frequency? (none, activations per year/month/week)
  • What was the maximum frequency using these units? (activations per unit)
41.
Did you specify the time-window, when activations would take place? (yes—same value for all participants, no—different values for each participant or choice, no—we did not specify this)
  • During which time of the day were activations allowed? (please specify all allowed time-windows)
SeasonWeekdayHour
Summer/Winter/anytimeWeekday/weekend/anytime1, 2, … 24, anytime
42.
Did you specify how many times participants could veto activations? (yes—same value for all participants, no—different values for each participant or choice, no—we did not specify this); If yes:
  • Which units were used to specify maximum veto frequency? (none, vetos per year/month/week)
  • What was the maximum frequency using these units? (activations per unit)
43.
Did you specify a minimum advance notice period? (yes—same value for all participants, no—different values for each participant or choice, no—we did not specify this)
  • What was the minimum advance notice period? (hours)
44.
What is the automation level? (i.e., manual demand response, manual automation, consensual automation, monitored automation, full automation…)
45.
Is a home energy management system involved?
46.
How does flexibility activation impact end-users? (Please provide details on fluctuation/availability impact and if measures have been taken to minimize that impact)

Appendix A.5. Section 5: Incentives

This part of the template covers questions surrounding consumer incentives such as if incentives were offered to consumers for initial participation and if yes of which type and size, as well details on provided incentives for load shifting and the prize signals that served as base (TOU, CPP, RTP, etc.).
47.
Was there an incentive for consumers/prosumers for initial program participation? (yes, no)
  • What form of incentive was chosen? (Bonus paid as reduction of monthly bill, shipping voucher, maintenance voucher, discount on purchase of new technologies but also sustainability reasons, curiosity (early adopters), …). If the incentive was monetary, how much/what was the value?
  • How high was this incentive?
48.
What price signals were used to incentivize load shifting? (None, Time of Use pricing, Critical Peak Pricing, Peak Time Rebate, Real Time pricing, spot market prices, balancing market prices, other: please specify)
49.
What was the ratio between the highest price and the average price?
50.
What are the overall achievable revenues of flexibility activation (for all stakeholders)? (i.e., €/activation, €/component/a, €/customer/a, % of costs)
51.
How are the revenues split between stakeholders?
52.
Have there been developed any business cases within the project? If yes, please describe them shortly.

Appendix A.6. Section 6: Information Provision and Data Sharing

This section of the template covers information and data provided to consumers and channels used to do so. This includes reasons for DSM (only to include if not already addressed before/if communicated per automation incident), status- and process information, details provided on benefits, information on privacy and security measures, and options to access data.
53.
Which information channels are used to communicate with end-users? (i.e., App, Online Portal, In-Home-Display, alternative ambient display, SMS, E-mail…)
54.
Which general information on the automation does the system provide? (automation rationale, automation conditions, general expected benefits)
55.
Does the system provide process information to end-users such as automation status, as well as post and planned automation?
56.
Does the system provide specific information on gained benefits (e.g., money saved, reduced CO 2 -Emissions, etc.)
57.
Does the system provide information on safety, privacy and security measures?
58.
Where is the consumer data stored and managed? (i.e., Completely local, centralized cloud, decentralized cloud/blockchain, …)
59.
Which consumer data was accessed, and which actors have access to the data?
Which Actors Have Access to the Data?
DataTSODSOAggregatorTechnology
Provider
Component
Manufacturer
Other
Power demand (smart meter reading)
Household temperature
Hot water temperature
Boiler temperature
Photovoltaic production
Battery charging level
Charging levels of cars

Appendix A.7. Section 7: End-User Interaction with the Automation System

This section covers questions regarding interaction offers provided to consumers such as if a a system-interface for end-users exists, forms of engagement implemented including active contacting of end-users, and choices offered to end-users through the system. Any available information regarding the use and evaluation of such interaction offers is of interest.
60.
Does automation system provide an interface for end-users?
61.
Are consumers actively contacted by the system and if yes
(a)
For which reasons? (i.e., to inform about flexibility activation, for confirmation/rejection of flexibility activation, to suggest/request manual flexibility…)
(b)
How often? (i.e., multiple times a day, once a day, weekly…)
(c)
Is a response required?
62.
Are end-users actively engaged through the system and if yes, how? (i.e., self-monitoring and feedback, social comparisons, challenges, cooperation, rewards…)
63.
Does the system provide choices to end-users regarding:
(a)
Opt out
(b)
Flexibility activation (e.g., interruption or adjustment)
(c)
System personalization (e.g., comfort ranges)
(d)
Data access
(e)
Other
64.
If available:
(a)
Do end-users use the system actively?
(b)
Did any aspects receive positive feedback?
(c)
Did any system aspects receive negative feedback?

Appendix A.8. Section 8: Project Results (As Available)

This section of the template collects any information available regarding relevant results of the project. This includes the number of consumers who signed up, achieved flexibilization (in comparison to expected flexibilization), and any acceptance measures that were taken such as overall satisfaction, specific positive and negative experiences, experiences usefulness and ease of use, and experienced trust. Further covered are if users’ lives were experienced as changed, if users would like to continue within the program and why/why not, and any further lessons learned.
65.
What were the main project results?
66.
What percentage of invited consumers signed up for the project?
67.
What was the average peak shifting that was achieved?
68.
Was the desired automation-outcome (e.g., shifts, peak-shaving) successfully achieved?
69.
If acceptance of the system was directly measured:
  • How was this done?
  • Which acceptance factors were looked at? (such as usefulness, ease of use, trust, etc.)
  • What were the results? (if possible please rate considered acceptance factors on a scale of 1 = very low to 10 = very high additionally to your answer)
70.
What has been learned so far?
  • What was the overall experience of the users? (broadly positive, negative, or mixed)
  • What are the strengths and weaknesses of the system?
  • Did it work as expected and if not, why?
  • For whom did it work and for whom not?
  • Other:
71.
Has the system changed the users’ lives and if yes, how?
  • Were energy practices changed?
  • Were household/workplace dynamics impacted?
  • Other changes?
72.
Would users want to keep the automation after the demo?
(a)
Reasons for continuing:
(b)
Reasons for quitting:

References

  1. Impram, S.; Nese, S.V.; Oral, B. Challenges of renewable energy penetration on power system flexibility: A survey. Energy Strategy Rev. 2020, 31, 100539. [Google Scholar] [CrossRef]
  2. Papaefthymiou, G.; Dragoon, K. Towards 100% renewable energy systems: Uncapping power system flexibility. Energy Policy 2016, 92, 69–82. [Google Scholar] [CrossRef]
  3. Kumar, N.; Singh, G. Comparative Study of Performance About the Integrated Power Quality and Optimized Framework for Smart Grid. J. Technol. Innov. Energy 2022, 1, 33–39. [Google Scholar] [CrossRef]
  4. Meeuw, A.; Schopfer, S.; Ryder, B.; Wortmann, F. LokalPower: Enabling local energy markets with user-driven engagement. In Proceedings of the Extended Abstracts of the 2018 CHI Conference on Human Factors in Computing Systems, Montreal, QC, Canada, 21–26 April 2018; pp. 1–6. [Google Scholar]
  5. Goulden, M.; Bedwell, B.; Rennick-Egglestone, S.; Rodden, T.; Spence, A. Smart grids, smart users? The role of the user in demand side management. Energy Res. Soc. Sci. 2014, 2, 21–29. [Google Scholar] [CrossRef]
  6. Hargreaves, T.; Nye, M.; Burgess, J. Making energy visible: A qualitative field study of how householders interact with feedback from smart energy monitors. Energy Policy 2010, 38, 6111–6119. [Google Scholar] [CrossRef]
  7. Friis, F.; Christensen, T.H. The challenge of time shifting energy demand practices: Insights from Denmark. Energy Res. Soc. Sci. 2016, 19, 124–133. [Google Scholar] [CrossRef]
  8. Stelmach, G.; Zanocco, C.; Flora, J.; Rajagopal, R.; Boudet, H.S. Exploring household energy rules and activities during peak demand to better determine potential responsiveness to time-of-use pricing. Energy Policy 2020, 144, 111608. [Google Scholar] [CrossRef]
  9. Li, P.H.; Keppo, I.; Xenitidou, M.; Kamargianni, M. Investigating UK consumers’ heterogeneous engagement in demand-side response. Energy Effic. 2020, 13, 621–648. [Google Scholar] [CrossRef] [Green Version]
  10. Goulden, M.; Spence, A.; Wardman, J.; Leygue, C. Differentiating ‘the user’ in DSR: Developing demand side response in advanced economies. Energy Policy 2018, 122, 176–185. [Google Scholar] [CrossRef]
  11. Mert, W.; Watts, M.; Tritthart, W. Smart domestic appliances in sustainable energy systems—Consumer acceptance and restrictions. In Proceedings of the ECEEE Summer Study; ECEEE: La Colle sur Loup, France, 2009; pp. 1751–1761. [Google Scholar]
  12. Michler, O.; Decker, R.; Stummer, C. To trust or not to trust smart consumer products: A literature review of trust-building factors. Manag. Rev. Q. 2020, 70, 391–420. [Google Scholar] [CrossRef]
  13. Adams, S.; Kuch, D.; Diamond, L.; Fröhlich, P.; Henriksen, I.M.; Katzeff, C.; Ryghaug, M.; Yilmaz, S. Social license to automate: A critical review of emerging approaches to electricity demand management. Energy Res. Soc. Sci. 2021, 80, 102210. [Google Scholar] [CrossRef]
  14. Gelazanskas, L.; Gamage, K.A. Demand side management in smart grid: A review and proposals for future direction. Sustain. Cities Soc. 2014, 11, 22–30. [Google Scholar] [CrossRef]
  15. Boutilier, R.G.; Thomson, I. Modelling and measuring the social license to operate: Fruits of a dialogue between theory and practice. Soc. Licence 2011, 2011, 1–10. [Google Scholar]
  16. IEA International Energy Agency. Users TCP. Available online: https://userstcp.org/ (accessed on 29 November 2022).
  17. Fröhlich, P.; Esterl, T.; Adams, S.; Kuch, D.; Yilmaz, S.; Katzeff, C.; Winzer, C.; Diamond, L.; Schrammel, J.; Lukszo, Z. Towards a Social License To Automate in Demand Side Management: Challenges, Perspectives and Regional Aspects. In Proceedings of the EnInnov 2020, Graz, Austria, 12–14 February 2020. [Google Scholar]
  18. Söllner, M.; Hoffmann, A.; Hoffmann, H.; Leimeister, J.M. How to use behavioral research insights on trust for HCI system design. In Proceedings of the CHI’12 Extended Abstracts on Human Factors in Computing Systems, Austin, TX, USA, 5–10 May 2012; pp. 1703–1708. [Google Scholar]
  19. Mayer, R.C.; Davis, J.H.; Schoorman, F.D. An integrative model of organizational trust. Acad. Manag. Rev. 1995, 20, 709–734. [Google Scholar] [CrossRef]
  20. Adams, S.; Diamond, L.; Esterl, T.; Fröhlich, P.; Ghotge, R.; Hemm, R.; Henriksen, I.; Katzeff, C.; Kuch, D.; Michellod, J.; et al. Social License to Automate: Emerging Approaches to Demand Side Management. (IEA UsersTCP, 2021). Available online: https://userstcp.org/wp-content/uploads/2019/10/Social-License-to-Automate-October-2021.pdf (accessed on 15 February 2023).
  21. Michellod, J.L.; Kuch, D.; Winzer, C.; Patel, M.K.; Yilmaz, S. Building Social License for Automated Demand-Side Management—Case Study Research in the Swiss Residential Sector. Energies 2022, 15, 7759. [Google Scholar] [CrossRef]
  22. Nicolson, M.L.; Fell, M.J.; Huebner, G.M. Consumer demand for time of use electricity tariffs: A systematized review of the empirical evidence. Renew. Sustain. Energy Rev. 2018, 97, 276–289. [Google Scholar] [CrossRef]
  23. Darby, S.J. Demand response and smart technology in theory and practice: Customer experiences and system actors. Energy Policy 2020, 143, 111573. [Google Scholar] [CrossRef]
  24. Chadwick, K.; Russell-Bennett, R.; Biddle, N. The role of human influences on adoption and rejection of energy technology: A systematised critical review of the literature on household energy transitions. Energy Res. Soc. Sci. 2022, 89, 102528. [Google Scholar] [CrossRef]
  25. Boudet, H.S. Public perceptions of and responses to new energy technologies. Nat. Energy 2019, 4, 446–455. [Google Scholar] [CrossRef]
  26. Spence, A.; Demski, C.; Butler, C.; Parkhill, K.; Pidgeon, N. Public perceptions of demand-side management and a smarter energy future. Nat. Clim. Chang. 2015, 5, 550–554. [Google Scholar] [CrossRef]
  27. Golmaryami, S.; Ferreira, P.; Nunes, M.L. Consumer willingness to participate in demand-side management: An agent-based modeling approach. In Proceedings of the 5th International Conference on Energy and Environment—Bringing Together Economics and Engineering (ICEE), Porto, Portugal, 2–3 June 2022. [Google Scholar]
  28. Yilmaz, S.; Weber, S.; Patel, M. Who is sensitive to DSM? Understanding the determinants of the shape of electricity load curves and demand shifting: Socio-demographic characteristics, appliance use and attitudes. Energy Policy 2019, 133, 110909. [Google Scholar] [CrossRef]
  29. Gołębiowska, B.; Bartczak, A.; Budziński, W. Impact of social comparison on preferences for Demand Side Management in Poland. Energy Policy 2021, 149, 112024. [Google Scholar] [CrossRef]
  30. Roberts, M.; Passey, R.; Adams, S.; Whittaker, L.; Russell-Bennett, R.; McAndrew, R.; Caton, S.; Ben-David, R. Opportunity Assessment Report: Rewarding Flexible Demand: Customer Friendly Cost Reflective Tariffs and Incentives. RACE 2030. Available online: https://www.ceem.unsw.edu.au/sites/default/files/documents/H4-OA-final-report-17.11.21.pdf (accessed on 4 December 2022).
  31. Valor, C.; Escudero, C.; Labajo, V.; Cossent, R. Effective design of domestic energy efficiency displays: A proposed architecture based on empirical evidence. Renew. Sustain. Energy Rev. 2019, 114, 109301. [Google Scholar] [CrossRef]
  32. Pink, S.; Dahlgren, K.; Strengers, Y.; Nicholls, L. Anticipatory Infrastructures, Emerging Technologies and Visions of Energy Futures. In Infrastructural Being: Rethinking Dwelling in a Naturecultural World; Springer: Berlin/Heidelberg, Germany, 2022; pp. 33–60. [Google Scholar]
  33. Dromacque, C.; Grigoriou, R. The Role of Data for Consumer Centric Energy Markets and Solutions. Written for ESMIG. 2018. Available online: https://www.esmig.eu/wp-content/uploads/2021/10/The-Role-of-Data-for-Consumer-Centric-Energy-Markets-and-Solutions.pdf (accessed on 3 December 2022).
  34. Shekari, M.; Arasteh, H.; Sheikhi Fini, A.; Vahidinasab, V. Demand Response Requirements from the Cultural, Social, and Behavioral Perspectives. Appl. Sci. 2021, 11, 11456. [Google Scholar] [CrossRef]
  35. Vagia, M.; Transeth, A.A.; Fjerdingen, S.A. A literature review on the levels of automation during the years. What are the different taxonomies that have been proposed? Appl. Ergon. 2016, 53, 190–202. [Google Scholar] [CrossRef] [PubMed]
  36. Fröhlich, P.; Baldauf, M.; Meneweger, T.; Tscheligi, M.; de Ruyter, B.; Paternó, F. Everyday automation experience: A research agenda. Pers. Ubiquitous Comput. 2020, 24, 725–734. [Google Scholar] [CrossRef]
  37. Baldauf, M.; Fröhlich, P.; Roto, V.; Palanque, P.; Lindley, S.; Rogers, J.; Ju, W.; Tscheligi, M. Engaging with Automation: Understanding and Designing for Operation, Appropriation, and Behaviour Change. In Proceedings of the CHI Conference on Human Factors in Computing Systems Extended Abstracts, New Orleans, LA, USA, 29 April–5 May 2022; pp. 1–6. [Google Scholar]
  38. Ajzen, I. From intentions to actions: A theory of planned behavior. In Action Control; Springer: Berlin/Heidelberg, Germany, 1985; pp. 11–39. [Google Scholar]
  39. Klöckner, C.A.; Blöbaum, A. A comprehensive action determination model: Toward a broader understanding of ecological behaviour using the example of travel mode choice. J. Environ. Psychol. 2010, 30, 574–586. [Google Scholar] [CrossRef] [Green Version]
  40. Schwartz, S.H. Normative Influences on Altruism. In Advances in Experimental Social Psychology; Berkowitz, L., Ed.; Academic Press: Cambridge, MA, USA, 1977; Volume 10, pp. 221–279. [Google Scholar] [CrossRef]
  41. Triandis, H.C. Interpersonal Behavior; Brooks/Cole Publishing Company: Belmont, CA, USA, 1977. [Google Scholar]
  42. Reckwitz, A. Toward a theory of social practices: A development in culturalist theorizing. Eur. J. Soc. Theory 2002, 5, 243–263. [Google Scholar] [CrossRef]
  43. Steg, L.; Bolderdijk, J.W.; Keizer, K.; Perlaviciute, G. An integrated framework for encouraging pro-environmental behaviour: The role of values, situational factors and goals. J. Environ. Psychol. 2014, 38, 104–115. [Google Scholar] [CrossRef] [Green Version]
  44. Steg, L.; Vlek, C. Encouraging pro-environmental behaviour: An integrative review and research agenda. J. Environ. Psychol. 2009, 29, 309–317. [Google Scholar] [CrossRef]
  45. Stoknes, P.E. Rethinking climate communications and the “psychological climate paradox”. Energy Res. Soc. Sci. 2014, 1, 161–170. [Google Scholar] [CrossRef] [Green Version]
  46. Wolske, K.S.; Stern, P.C. Contributions of psychology to limiting climate change: Opportunities through consumer behavior. In Psychology and Climate Change; Elsevier: Amsterdam, The Netherlands, 2018; pp. 127–160. [Google Scholar]
  47. Jager, W. Breaking bad habits: A dynamical perspective on habit formation and change. In Human Decision-Making and Environmental Perception—Understanding and Assisting Human Decision-Making in Real Life Settings. Libor Amicorum for Charles Vlek; University of Groningen: Groningen, The Netherlands, 2003. [Google Scholar]
  48. Sweetman, J.; Whitmarsh, L.E. Climate Justice: High-Status Ingroup Social Models Increase Pro-Environmental Action through Making Actions Seem More Moral. Top. Cogn. Sci. 2016, 8, 196–221. [Google Scholar] [CrossRef] [PubMed]
  49. Jackson, T. Motivating sustainable consumption—A review of evidence on consumer behaviour and behavioural change. Technical report. SDRN Sustain. Dev. Res. Netw. 2005, 29, 30–40. [Google Scholar]
  50. Limerick, H.; Moore, J.W.; Coyle, D. Empirical evidence for a diminished sense of agency in speech interfaces. In Proceedings of the 33rd Annual ACM Conference on Human Factors in Computing Systems, Seoul, Republic of Korea, 18–23 April 2015; pp. 3967–3970. [Google Scholar]
  51. Fell, M.J. Taking Charge: Perceived Control and Acceptability of Domestic Demand-Side Response. Ph.D. Thesis, UCL (University College London), London, UK, 2016. [Google Scholar]
  52. Darby, S. Making it obvious: Designing feedback into energy consumption. In Energy Efficiency in Household Appliances and Lighting; Springer: Berlin/Heidelberg, Germany, 2001; pp. 685–696. [Google Scholar]
  53. Desley, V.; Laurie, B.; Peter, M. The effectiveness of energy feedback for conservation and peak demand: A literature review. Open J. Energy Effic. 2013, 2013. [Google Scholar] [CrossRef] [Green Version]
  54. Yang, X.J.; Unhelkar, V.V.; Li, K.; Shah, J.A. Evaluating effects of user experience and system transparency on trust in automation. In Proceedings of the 2017 12th ACM/IEEE International Conference on Human-Robot Interaction (HRI), Vienna Austria, 6–9 March 2017; pp. 408–416. [Google Scholar]
  55. Carmichael, R.; Schofield, J.; Woolf, M.; Bilton, M.; Ozaki, R.; Strbac, G. Residential Consumer Attitudes to Time-Varying Pricing; Imperial College London: London, UK, 2014. [Google Scholar]
  56. Darby, S.J.; Pisica, I. Focus on Electricity Tariffs: Experience and Exploration of Different Charging Schemes; European Council for an Energy-Efficient Economy (ECEEE): Hyeres, France, 2013. [Google Scholar]
  57. Lewicki, R.J.; Wiethoff, C. Trust, trust development, and trust repair. Handb. Confl. Resolut. Theory Pract. 2000, 1, 86–107. [Google Scholar]
  58. Butler, C.; Parkhill, K.A.; Pidgeon, N. Deliberating Energy Transitions in the UK—Transforming the UK Energy System: Public Values, Attitudes and Acceptability; UKERC: London, UK, 2013. [Google Scholar]
  59. Rodden, T.A.; Fischer, J.E.; Pantidi, N.; Bachour, K.; Moran, S. At home with agents: Exploring attitudes towards future smart energy infrastructures. In Proceedings of the SIGCHI Conference on Human Factors in Computing Systems, Paris, France, 27 April–2 May 2013; pp. 1173–1182. [Google Scholar]
  60. van den Broek, K.L.; Walker, I. Heuristics in energy judgement tasks. J. Environ. Psychol. 2019, 62, 95–104. [Google Scholar] [CrossRef]
  61. van den Broek, K.L. Household energy literacy: A critical review and a conceptual typology. Energy Res. Soc. Sci. 2019, 57, 101256. [Google Scholar] [CrossRef]
  62. Di Napoli, I.; Dolce, P.; Arcidiacono, C. Community trust: A social indicator related to community engagement. Soc. Indic. Res. 2019, 145, 551–579. [Google Scholar] [CrossRef]
  63. Dwyer, J.; Bidwell, D. Chains of trust: Energy justice, public engagement, and the first offshore wind farm in the United States. Energy Res. Soc. Sci. 2019, 47, 166–176. [Google Scholar] [CrossRef]
  64. Harding, M.; Knowles, B.; Davies, N.; Rouncefield, M. HCI, civic engagement & trust. In Proceedings of the 33rd Annual ACM Conference on Human Factors in Computing Systems, Seoul, Republic of Korea, 18–23 April 2015; pp. 2833–2842. [Google Scholar]
  65. Johnson, D.; Horton, E.; Mulcahy, R.; Foth, M. Gamification and serious games within the domain of domestic energy consumption: A systematic review. Renew. Sustain. Energy Rev. 2017, 73, 249–264. [Google Scholar] [CrossRef] [Green Version]
  66. Morganti, L.; Pallavicini, F.; Cadel, E.; Candelieri, A.; Archetti, F.; Mantovani, F. Gaming for Earth: Serious games and gamification to engage consumers in pro-environmental behaviours for energy efficiency. Energy Res. Soc. Sci. 2017, 29, 95–102. [Google Scholar] [CrossRef]
  67. Abrahamse, W.; Steg, L. Social influence approaches to encourage resource conservation: A meta-analysis. Glob. Environ. Chang. 2013, 23, 1773–1785. [Google Scholar] [CrossRef]
  68. Goodrick, D. Comparative Case Studies; SAGE Publications Limited: Thousand Oaks, CA, USA, 2020. [Google Scholar]
  69. Pahl-Wostl, C.; Basurto, X.; Villamayor-Tomas, S. Comparative case study analysis. In The Routledge Handbook of Research Methods for Social-Ecological Systems; Routledge: London, UK, 2021; pp. 282–294. [Google Scholar]
  70. Rowley, J. Using case studies in research. Management Research News, 1 January 2002. [Google Scholar]
  71. Popa, F.; Guillermin, M. Reflexive methodological pluralism: The case of environmental valuation. J. Mixed Methods Res. 2017, 11, 19–35. [Google Scholar] [CrossRef]
  72. Niu, X.; Liu, Z.; Li, P.; Glavic, B. Provenance-based Data Skipping (TechReport). arXiv 2021, arXiv:2104.12815. [Google Scholar]
  73. Davis, F.D. Perceived usefulness, perceived ease of use, and user acceptance of information technology. MIS Q. 1989, 319–340. [Google Scholar] [CrossRef] [Green Version]
  74. Ghazizadeh, M.; Lee, J.D.; Boyle, L.N. Extending the Technology Acceptance Model to assess automation. Cogn. Technol. Work 2012, 14, 39–49. [Google Scholar] [CrossRef]
  75. Lee, J.D.; See, K.A. Trust in automation: Designing for appropriate reliance. Hum. Factors 2004, 46, 50–80. [Google Scholar] [CrossRef] [Green Version]
  76. Beauchampet, I.; Walsh, B. Energy citizenship in the Netherlands: The complexities of public engagement in a large-scale energy transition. Energy Res. Soc. Sci. 2021, 76, 102056. [Google Scholar] [CrossRef]
  77. Pestana, C.; Barros, L.; Scuri, S.; Barreto, M. Can HCI help increase people’s engagement in sustainable development? A case study on energy literacy. Sustainability 2021, 13, 7543. [Google Scholar] [CrossRef]
  78. Linder, N.; Giusti, M.; Samuelsson, K.; Barthel, S. Pro-environmental habits: An underexplored research agenda in sustainability science. Ambio 2022, 51, 546–556. [Google Scholar] [CrossRef]
  79. Sardianos, C.; Varlamis, I.; Chronis, C.; Dimitrakopoulos, G.; Alsalemi, A.; Himeur, Y.; Bensaali, F.; Amira, A. The emergence of explainability of intelligent systems: Delivering explainable and personalized recommendations for energy efficiency. Int. J. Intell. Syst. 2021, 36, 656–680. [Google Scholar] [CrossRef]
  80. Wang, R.; Bush-Evans, R.; Arden-Close, E.; Bolat, E.; McAlaney, J.; Hodge, S.; Thomas, S.; Phalp, K. Transparency in persuasive technology, immersive technology, and online marketing: Facilitating users’ informed decision making and practical implications. Comput. Hum. Behav. 2022, 139, 107545. [Google Scholar] [CrossRef]
  81. Kohn, S.C.; De Visser, E.J.; Wiese, E.; Lee, Y.C.; Shaw, T.H. Measurement of trust in automation: A narrative review and reference guide. Front. Psychol. 2021, 12, 604977. [Google Scholar] [CrossRef] [PubMed]
  82. Herrmann, T.; Schmidt, A.; Degeling, M. From Interaction to Intervention: An Approach for Keeping Humans in Control in the Context of socio-technical Systems. In Proceedings of the STPIS@ CAiSE, Tallinn, Estonia, 12 June 2018; pp. 101–110. [Google Scholar]
Figure 1. Research process of template creation, case study selection, data-gathering, classification of automation level, systematic qualitative analysis.
Energies 16 02393 g001
Figure 2. Effort requirement and impact experience per case and automation level.
Energies 16 02393 g002
Figure 3. Feedback per automation level.
Energies 16 02393 g003
Figure 4. Transparency per automation level.
Energies 16 02393 g004
Figure 5. Control per automation level.
Energies 16 02393 g005
Figure 6. Benefit communication type per automation level.
Energies 16 02393 g006
Figure 7. Overview of the DSM trust framework.
Energies 16 02393 g007
Table 1. Overview of all analyzed use cases and their relevant parameters.
Case Name Country Project
Runtime 
Use Case
Context 
Sample Approx.
Trial Runtime 
Analysed
Automation Level 
Sim4Blocks SP 2016–2020 Manual and programmed
load shifting based on
price signals 
appartments, rented 
38 households 
9 mo. Low (1) 
SCDA AT 2014–2017 Manual and remote
load shifting based on
price signals 
appartments, rented 
111 households 
12 mo. Low (1) 
LEAFS AT 2015–2018 Manual and programmed
load shifting based on
availability of PV energy 
appartments, owned 
250 households 
12mo. Low (1) 
GrowSmarter DE 2015–2019 Manual reduction of
energy consumption through
smart home system support 
houses, owned 
50 housholds 
12–18 mo. Low (1) 
FHNW CH 2017–2022 Active acceptance of
automated load-shifting through
single event parameter setting 
apartments 
66 households 
12 mo. Medium (3) 
Quartierström CH 2017–2020 Active acceptance of
load-shifting automation
requests 
houses, owned 
37 households 
12 mo. Medium (3) 
AGL—Sensibo
HEMS/DLC 
AU Since 2018 Active acceptance of
load-shifting automation
requests 
houses, owned 
1000+ households 
9–10 mo. Medium (3) 
RedGrid—
HEMS/DLC 
AU 2020–2021 Automated load-shifting
with veto-option 
houses appartments 
20 households 
9–12 mo. Medium (4) 
LIC CH 2018–2022 Automated load-shifting
with deactivation option 
houses, owned 
10 households 
10 mo. High (5) 
I Flex NO 2020–2023 Automated load-shifting
with parameter setting 
houses, owned 
70 households 
Ongoing since 2021 High (5) 
BeSmart (Tiko) CH Since 2014 Automated load-shifting
with parameter settings 
houses, owned 
6260 households 
Ongoing since 2014 High (5) 
Shine
Community 
DE Since 2019 Automated management of
loads and energy source used 
houses, owned 
5000 inhabitants 
Ongoing since 2019 High (6) 
P2PQ AT 2018–2020 Automated management of
energy source used 
apartments, owned 
23 households 
5 mo. High (6) 
GoFlex CH 2016–2020 Automated load-shifting
and energy source used  
houses, owned 
185 households 
12 mo. High (6) 
AGL—VPP AU Since 2017 Automated load-shifting houses, owned 
500 households 
17 mo. High (6) 
Table 2. Effort requirement and experience impact rating scheme.
Effort Requirement Level Rating Scheme
Action Required/Possible
Impact Experience Level Rating Scheme
Load Affected
Storage Battery1
Drink Fridge2
no veto possible1Electric Boiler2
veto through active monitoring possible1.5Hot Water Boiler2
setting of general automation parameters2Storage Heater2
passive acceptance of shifting (veto possible)2.5Air Conditioning3
active acceptance of shifting3Electric Heater3
programmed shifting4Heat Pump3
setting of single automation parameters4Heating3
Manual shifting5EVs4
Manual saving5Power Board4
Devices5
Lights5
Disclaimer/Publisher’s Note: The statements, opinions and data contained in all publications are solely those of the individual author(s) and contributor(s) and not of MDPI and/or the editor(s). MDPI and/or the editor(s) disclaim responsibility for any injury to people or property resulting from any ideas, methods, instructions or products referred to in the content.

