Article

Economic Performance Indicators for a Geothermal Aquatic Center in Victoria, Australia

1
Faculty of Science, University of Melbourne, Parkville, VIC 3010, Australia
2
School of Geography, Earth and Atmospheric Sciences, University of Melbourne, Parkville, VIC 3010, Australia
3
School of Physics, University of Melbourne, Parkville, VIC 3010, Australia
*
Author to whom correspondence should be addressed.
Energies 2023, 16(5), 2134; https://doi.org/10.3390/en16052134
Submission received: 27 December 2022 / Revised: 10 February 2023 / Accepted: 13 February 2023 / Published: 22 February 2023
(This article belongs to the Topic Geothermal Energy Technology and Current Status)

Abstract

:
The Gippsland Regional Aquatic Centre (GRAC) opened in the town of Traralgon, Victoria, Australia early in 2021. The GRAC utilizes a geothermal energy heating system as an alternative to conventional natural gas furnaces. We have examined 12 full months of heat production from the geothermal system of the GRAC and compared its economic performance against equivalent heat production by natural gas. The geothermal system—the first of its kind in Victoria—operated at >95% availability over its first year of operation. Our economic assessment indicates that the breakeven price for the geothermal energy is about 35% the equivalent price of natural gas and the payback period for the geothermal system is about five years. The results justify the initial capital outlay by Latrobe City Council and are likely to stimulate further development of geothermal heat systems in the region.

1. Introduction

1.1. Status of the Energy Transition in Victoria

Globally, geothermal energy is increasingly being developed as a low-emissions source of electrical power with high availability. Indeed, in 2021 alone, the global installed capacity of geothermal power plants increased by more than 10% [1]. However, in spite of considerable commercial efforts in the first decade of the current century [2] and favorable geological conditions, Australia has no operating geothermal power plant at the time of writing. Commercial challenges for developing geothermal power in Australia are significant; the hottest rocks on the continent are located far from the capital cities in which the great majority of Australian people reside (Figure 1).
Along with the rest of Australia and much of the world, the state of Victoria in the southeast of the country is undergoing a transition away from fossil-fuel-based energy sources. Victoria is seeking renewable energy alternatives to replace an existing energy network powered primarily by brown coal and natural gas for electricity generation, and natural gas for industrial and domestic heating. While crustal temperatures are high enough for geothermal power generation along the south coast of Victoria (see Figure 1), Victoria’s legal framework does not at present permit the exploration or production of geothermal power. Victoria is, instead, focused on increasing generation of renewable power from solar and wind sources at both small and large scales. Australia’s Clean Energy Regulator recognized a total of 645,459 rooftop solar power generating units on dwellings in Victoria as of November 2022, with 42,140 of those units installed in 2022 alone [3]. The Australian census in 2021 recorded 2,810,775 individual dwellings in Victoria, suggesting solar panels sat on about 23% of those dwellings in 2022, increasing by 1.5 to 2 percent of dwellings per year. At the same time, the Government of Victoria is also developing a policy for large-scale offshore wind energy development [4].
The state’s actions are primarily driven by greenhouse gas emission reduction targets legislated under the Climate Change Act (2017), which mandates 28–33% emission reduction below 2005 levels by 2025 and 50% reduction by 2030. The state has also committed to achieving net-zero emissions by 2050. Official energy consumption statistics, however, show the scale of the challenge ahead. Victoria consumed 1057.4 petajoules of primary energy from fossil fuel sources in 2020–2021, and only 88.2 petajoules from renewable sources, corresponding to only 8.3% of the state’s primary energy consumption [5].
While the focus has, until now, been on transitioning away from coal- and gas-fired electrical power to renewable electricity, less attention has been paid to reducing Victoria’s reliance on natural gas for domestic and industrial heating. This is beginning to change, with the release of a Gas Substitution Roadmap in 2022 [6]. The Roadmap recognizes two primary reasons to reduce natural gas consumption: reduction of greenhouse gas emissions, and avoidance of escalating costs. The state government recognizes that continued combustion of natural gas is incompatible with the state’s legislated emission reduction targets, with natural gas contributing 17% of the state’s emissions in 2022 [6]. The price of natural gas has also risen significantly, and price volatility has increased, since Australia started exporting liquefied natural gas in 2016 (Figure 2).
One stated aim of the Gas Substitution Roadmap is for households to source domestic heat from electrical devices that can run on renewable electricity rather than natural gas. Another stated aim is to generate gasses such as hydrogen and biomethane from renewable energy sources for industrial heat supply. The Roadmap, however, fails to recognize the potential of geothermal aquifers to provide low-emissions renewable heat from groundwater basins covering large parts of Victoria (Figure 3). The Roadmap is similarly silent about the possible contribution that ground source heat pumps (GSHPs) could make to reducing Victoria’s reliance on natural gas for space and hot water heating. While GSHP systems cannot yet be considered mainstream in the Australian context, an increasing body of evidence (e.g., [7,8]) suggests an economic case for their much wider deployment. We surmise the reason that geothermal aquifers and GSHPs are ignored by the Roadmap is a lack of awareness of the opportunity by the authors of the Roadmap, rather than a deliberate exclusion of geothermal energy as an option. Indeed, ref. [9] previously observed that one geothermal aquifer in particular—the Lower Tertiary Aquifer in the Gippsland Basin—is much shallower and, thus, probably cheaper to develop than aquifers of comparable temperature profitably exploited elsewhere in the world.

1.2. Direct Use of Geothermal Energy

Geothermal energy can be defined as heat occurring naturally underground, which can be cost-effectively brought to the Earth’s surface with (usually) water and used for a beneficial purpose. Ref. [12] reported that 29 countries were generating electricity from geothermal energy by the end of 2020. Those countries’ combined generating capacity was almost 16 GWe, and electricity production exceeded 95 TWh/year. Ref. [12] also reported at least 139 countries directly using geothermal heat for purposes other than electricity generation. Those countries reported a combined geothermal heat production capacity exceeding 107 GWt, delivering more than 1000 petajoules of heat per year. These figures indicate that geothermal energy is as important globally as a renewable source of direct heat as it is for conversion to electricity.
Globally, geothermal heat is directly used in applications requiring “low grade” heat of less than 100 °C. Examples include bathing, swimming and balneological facilities, space heating (including district heating), greenhouse heating, aquaculture; agricultural drying, and other industrial processes. The most extensive use of geothermal energy for direct heating in Australia is centered on Perth, the capital of Western Australia (see Figure 1). About 40% of the water consumed by Perth comes from groundwater in the Perth Basin [13]. The deepest production layer, the Yarragadee Aquifer, delivers water between 40 °C and 52 °C from depths between 750 m and 1150 m [14]. The hot water holds geothermal energy that has, in the past, been used by the South Perth Zoological Gardens to heat its reptile enclosure, by a commercial laundry for washing, by a processing plant for drying wool, and for open air bathing [14]. While none of those early uses continue today, at least 14 new geothermal heating systems associated with leisure and aquatic centers have been built in Perth since the late 1990s [15].
In Victoria, however, only a small number of projects have previously utilized geothermal energy. The most significant was a geothermal energy district heating system operated by Glenelg Shire Council in the city of Portland on the southwest coast of Victoria (bottom left corner in Figure 3) between 1983 and 2006. Designed to make use of “waste” heat from the town water supply, which is drawn from an aquifer 1400 m deep at 58 °C, Ref. [16] estimated that Portland’s geothermal district heating system provided 8857 GJ of heat per annum to 18,990 m 2 of public buildings. The average retail price of natural gas was about 12 AUD/GJ (8.90 USD/GJ at the time of writing in January 2023) in Victoria in 2006 [17], suggesting energy savings to Glenelg Shire Council in excess of AUD 100,000 (USD 74,000 at the time of writing in January 2023) per annum at the time the geothermal system was decommissioned. While a council review concluded that replacing aging components of the geothermal system as it was then configured was justified on economic grounds, the geothermal system was instead decommissioned because the production bore was no longer used for town water, the cost of reinjecting the spent water was prohibitive, and there were environmental concerns about discharging spent water to a surface stream [18,19].
In spite of some historical utilization [16], by 2020, there was no ongoing use of geothermal energy in the Gippsland Basin in southeast Victoria.

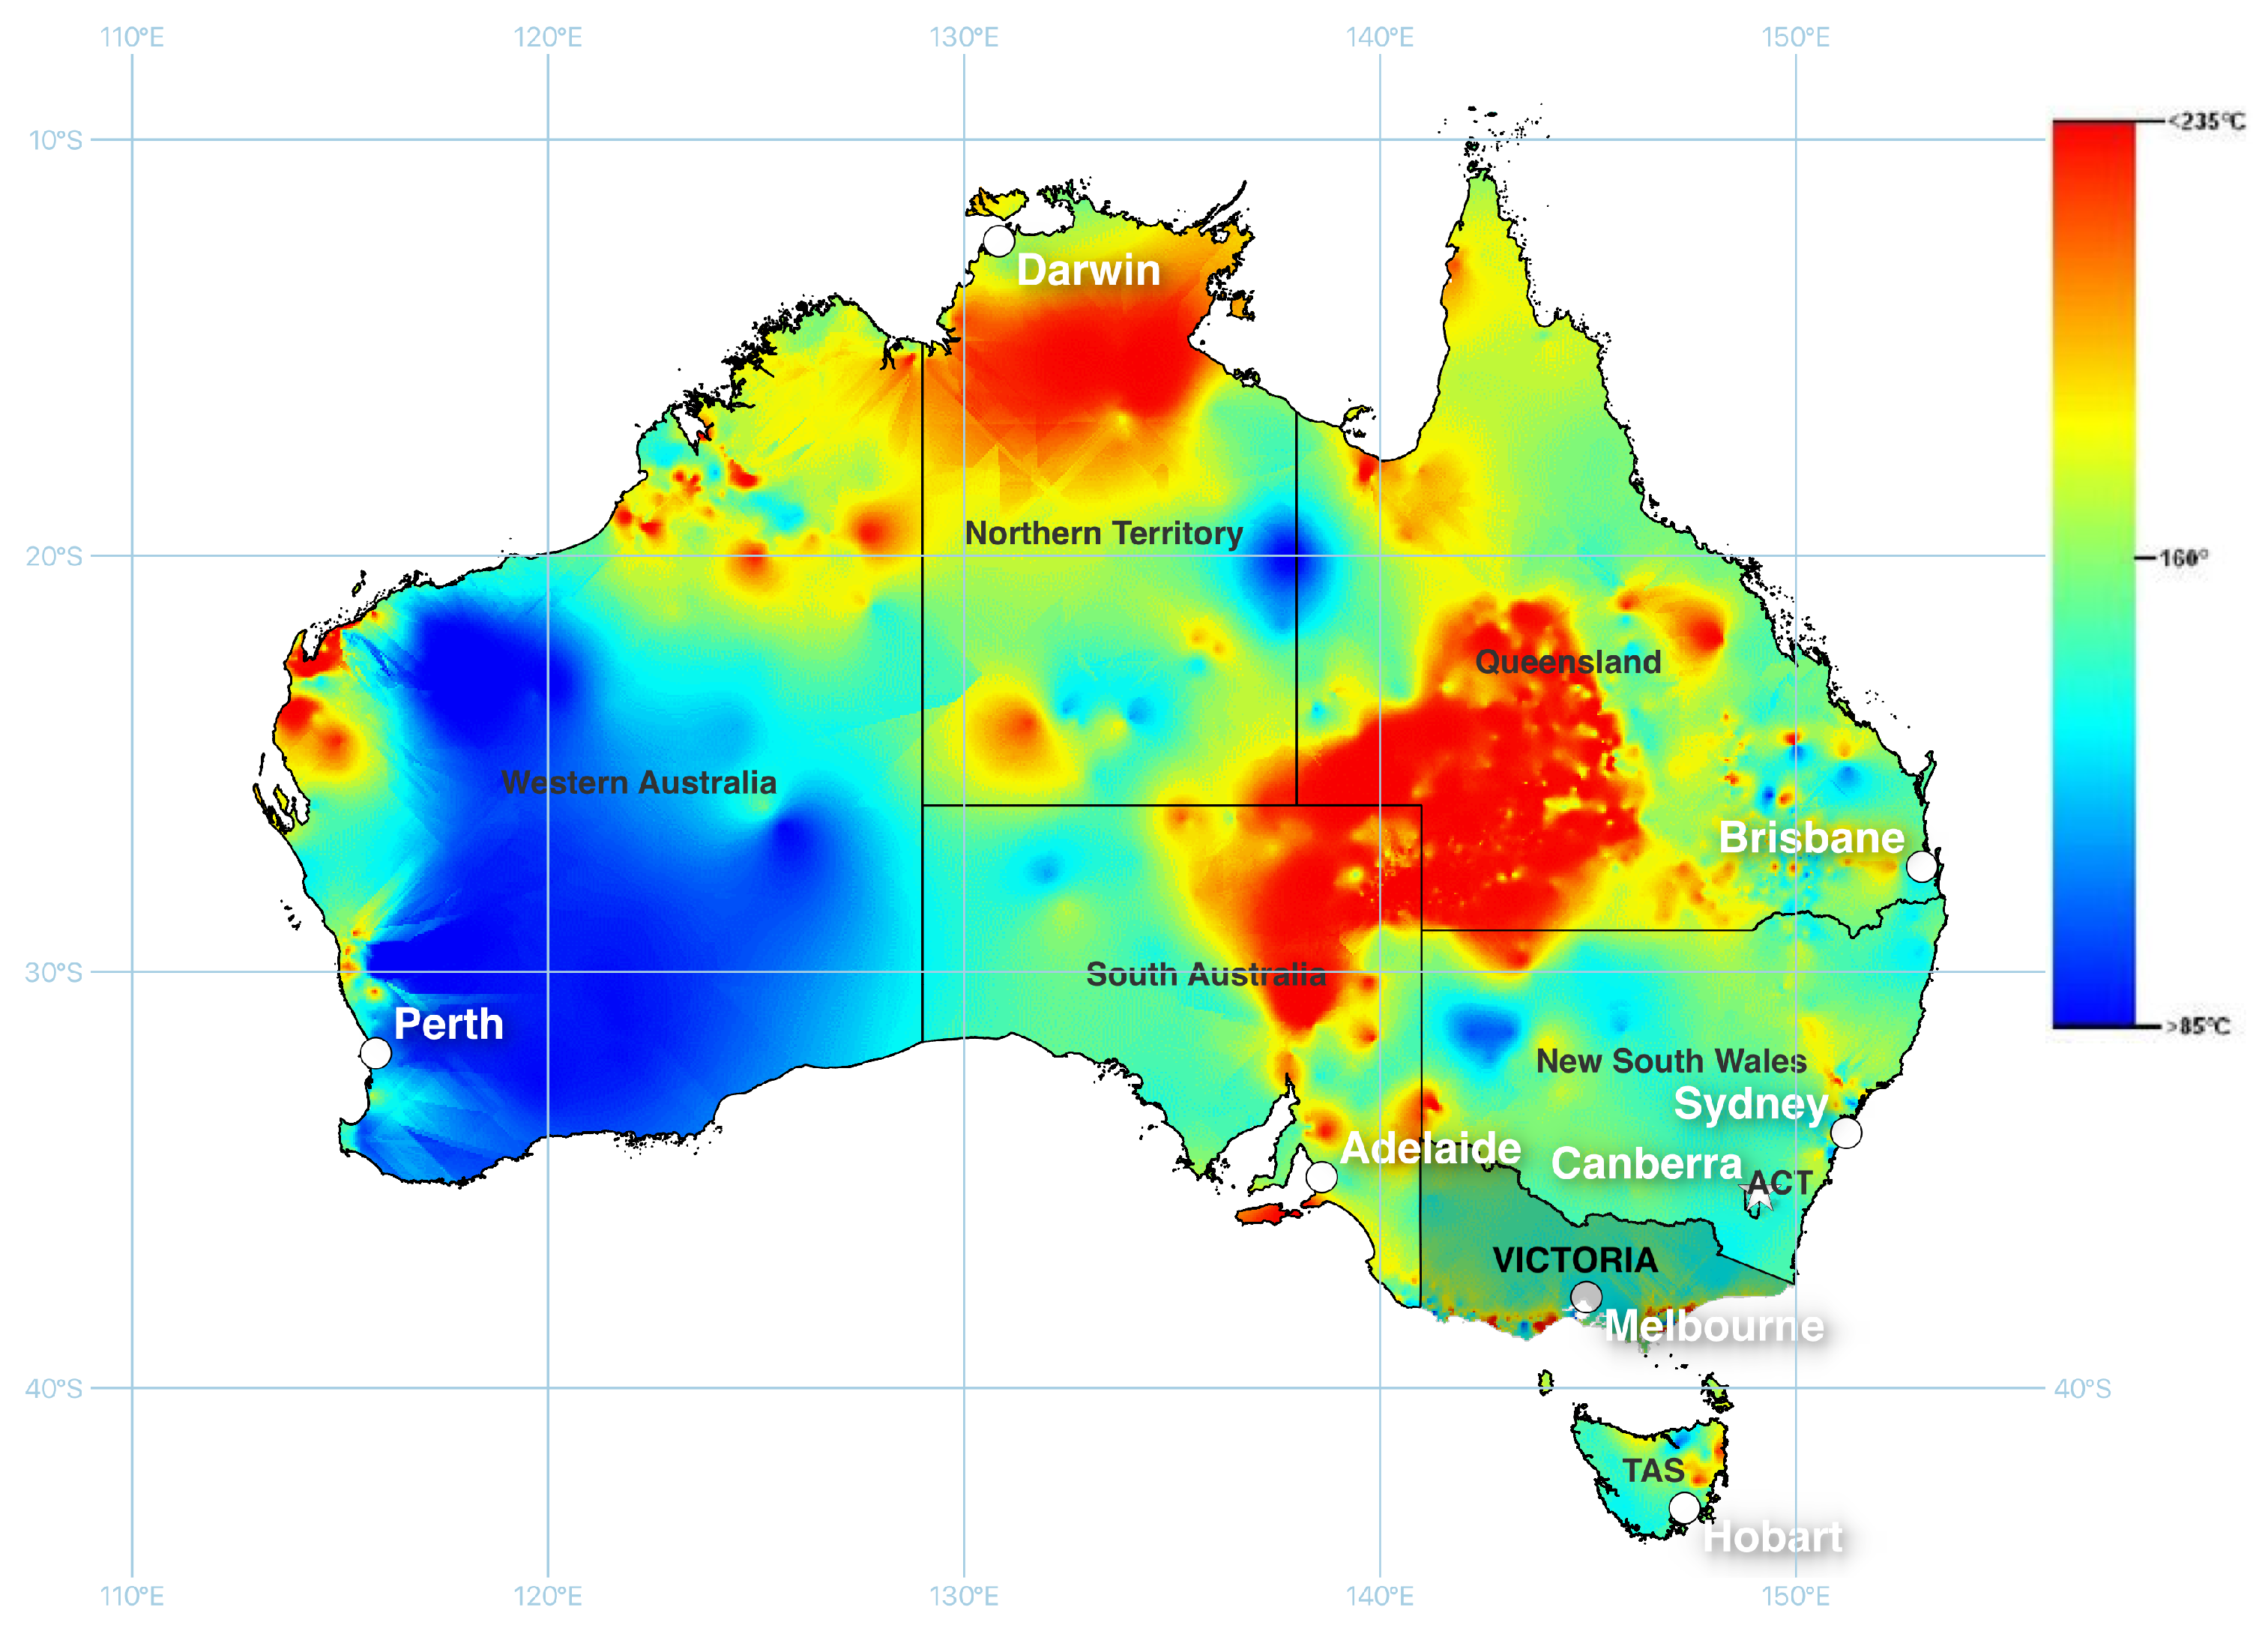
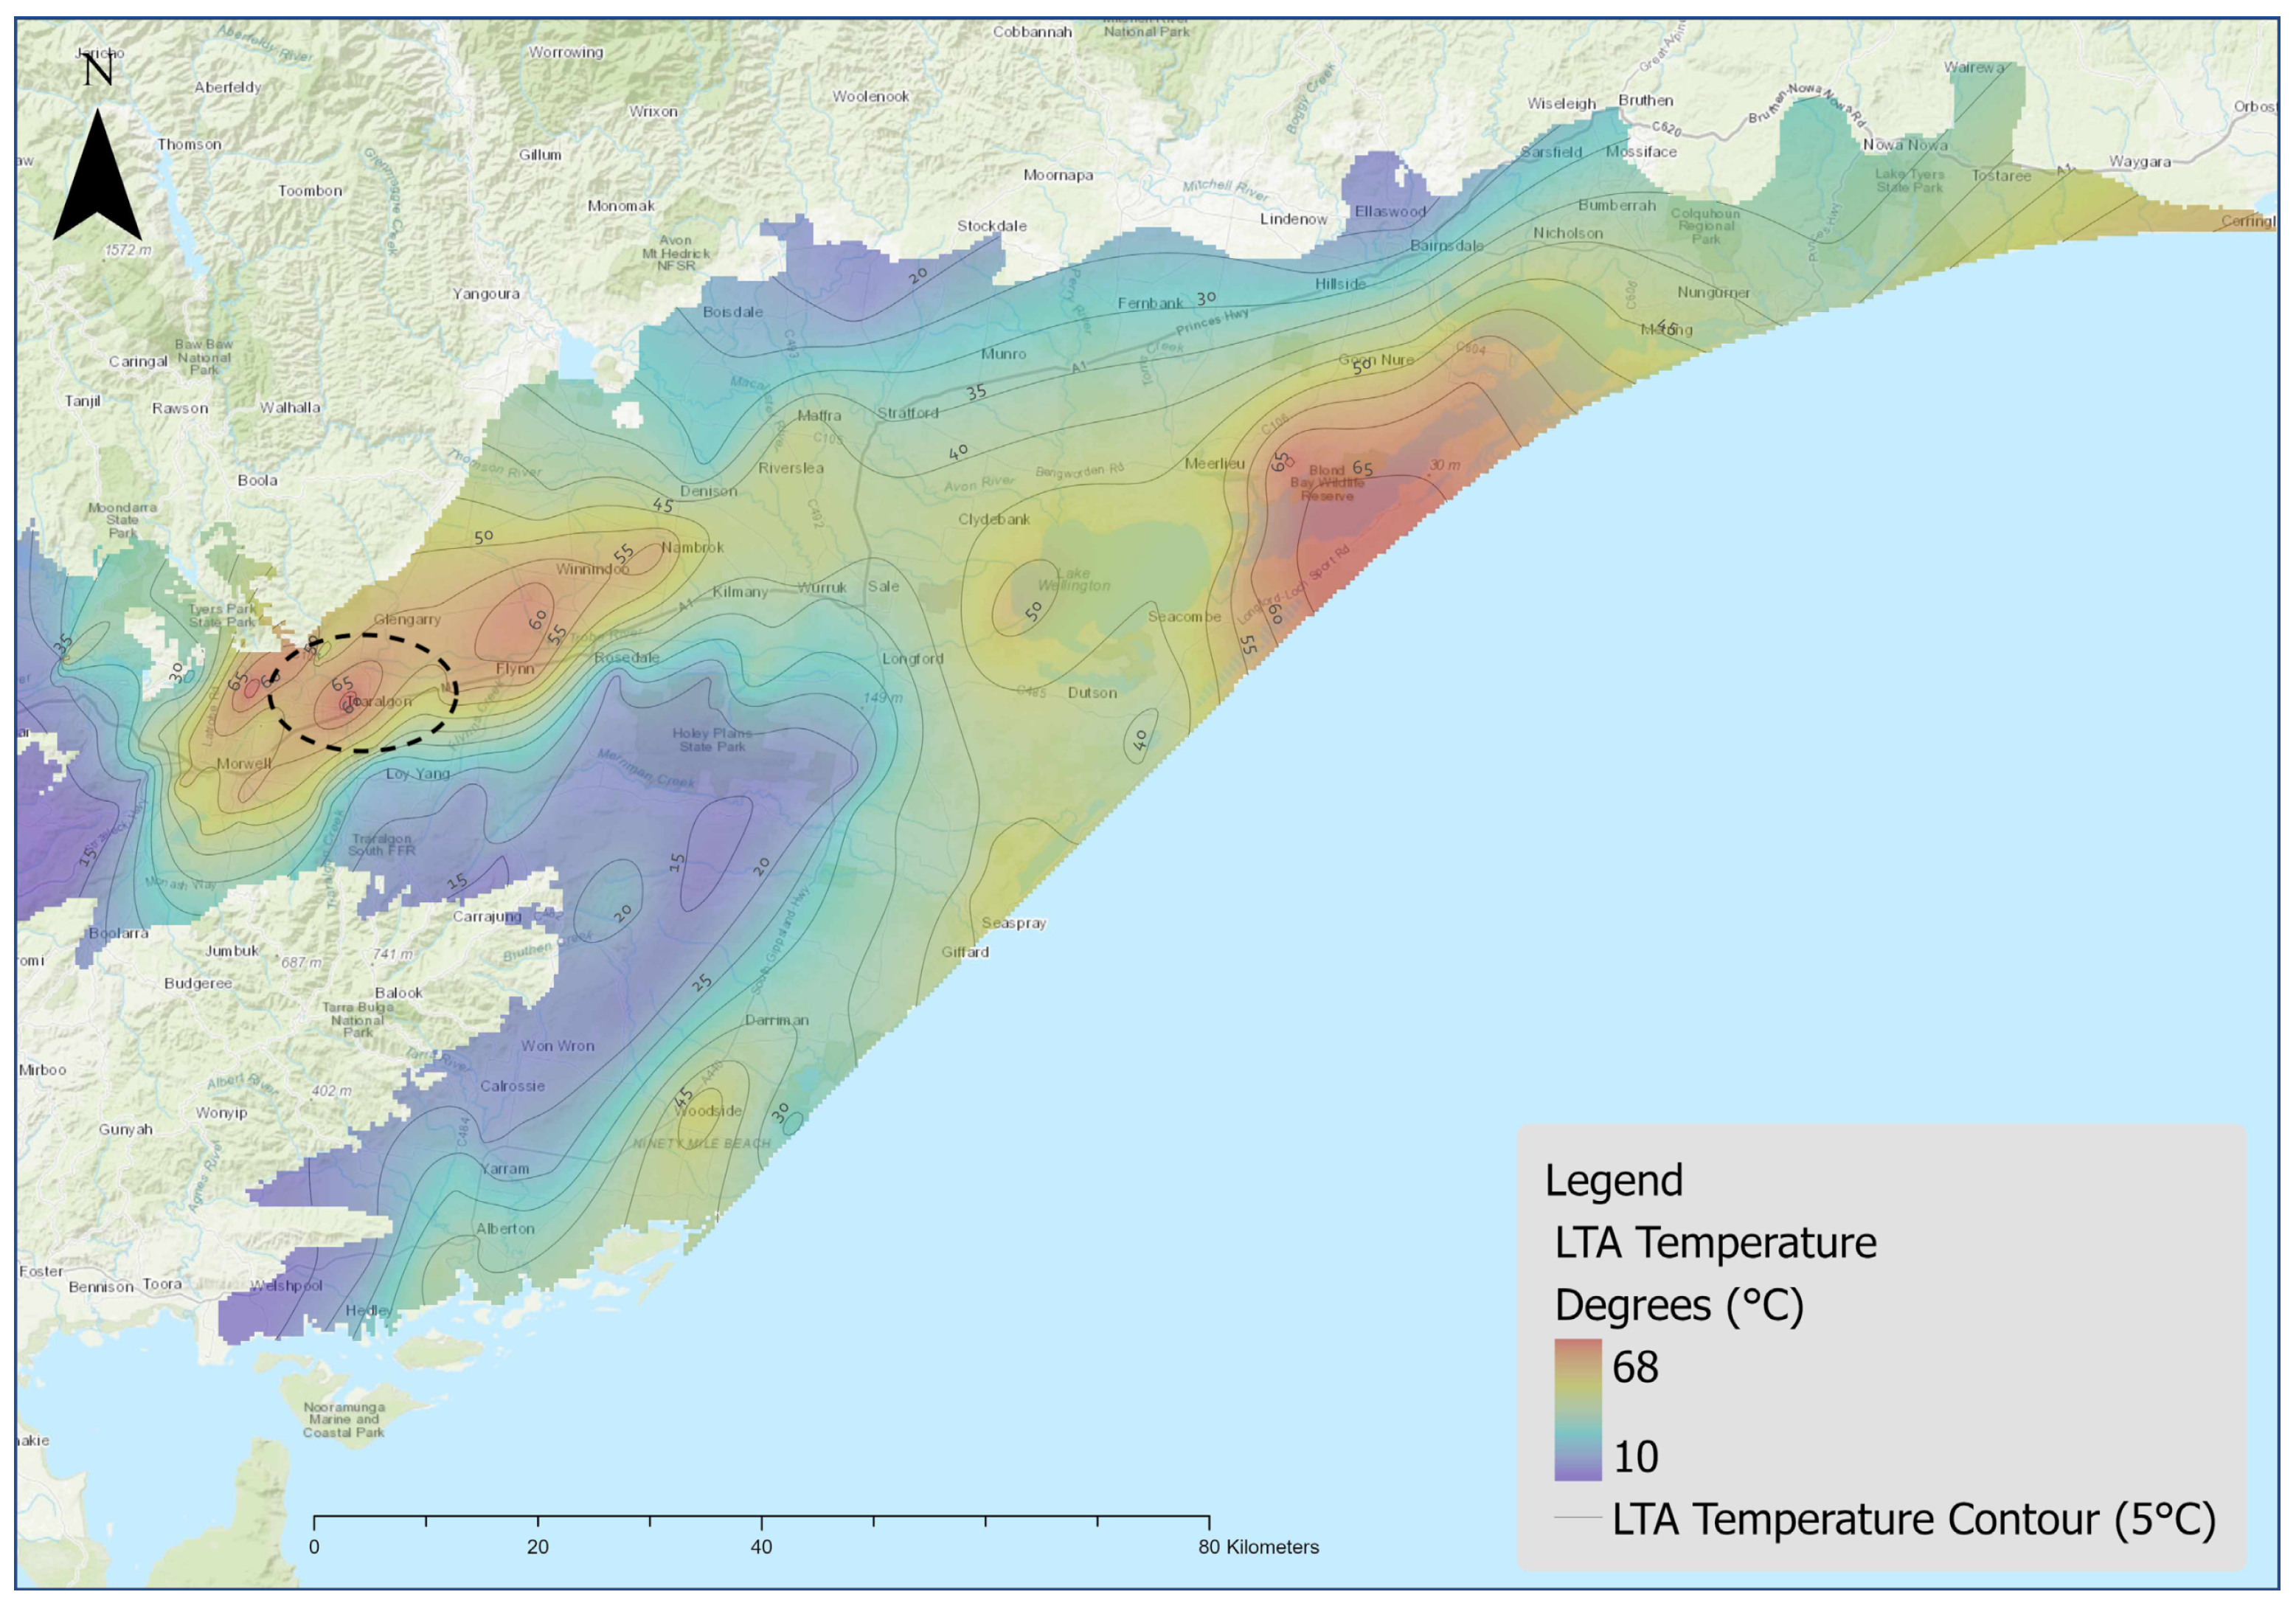
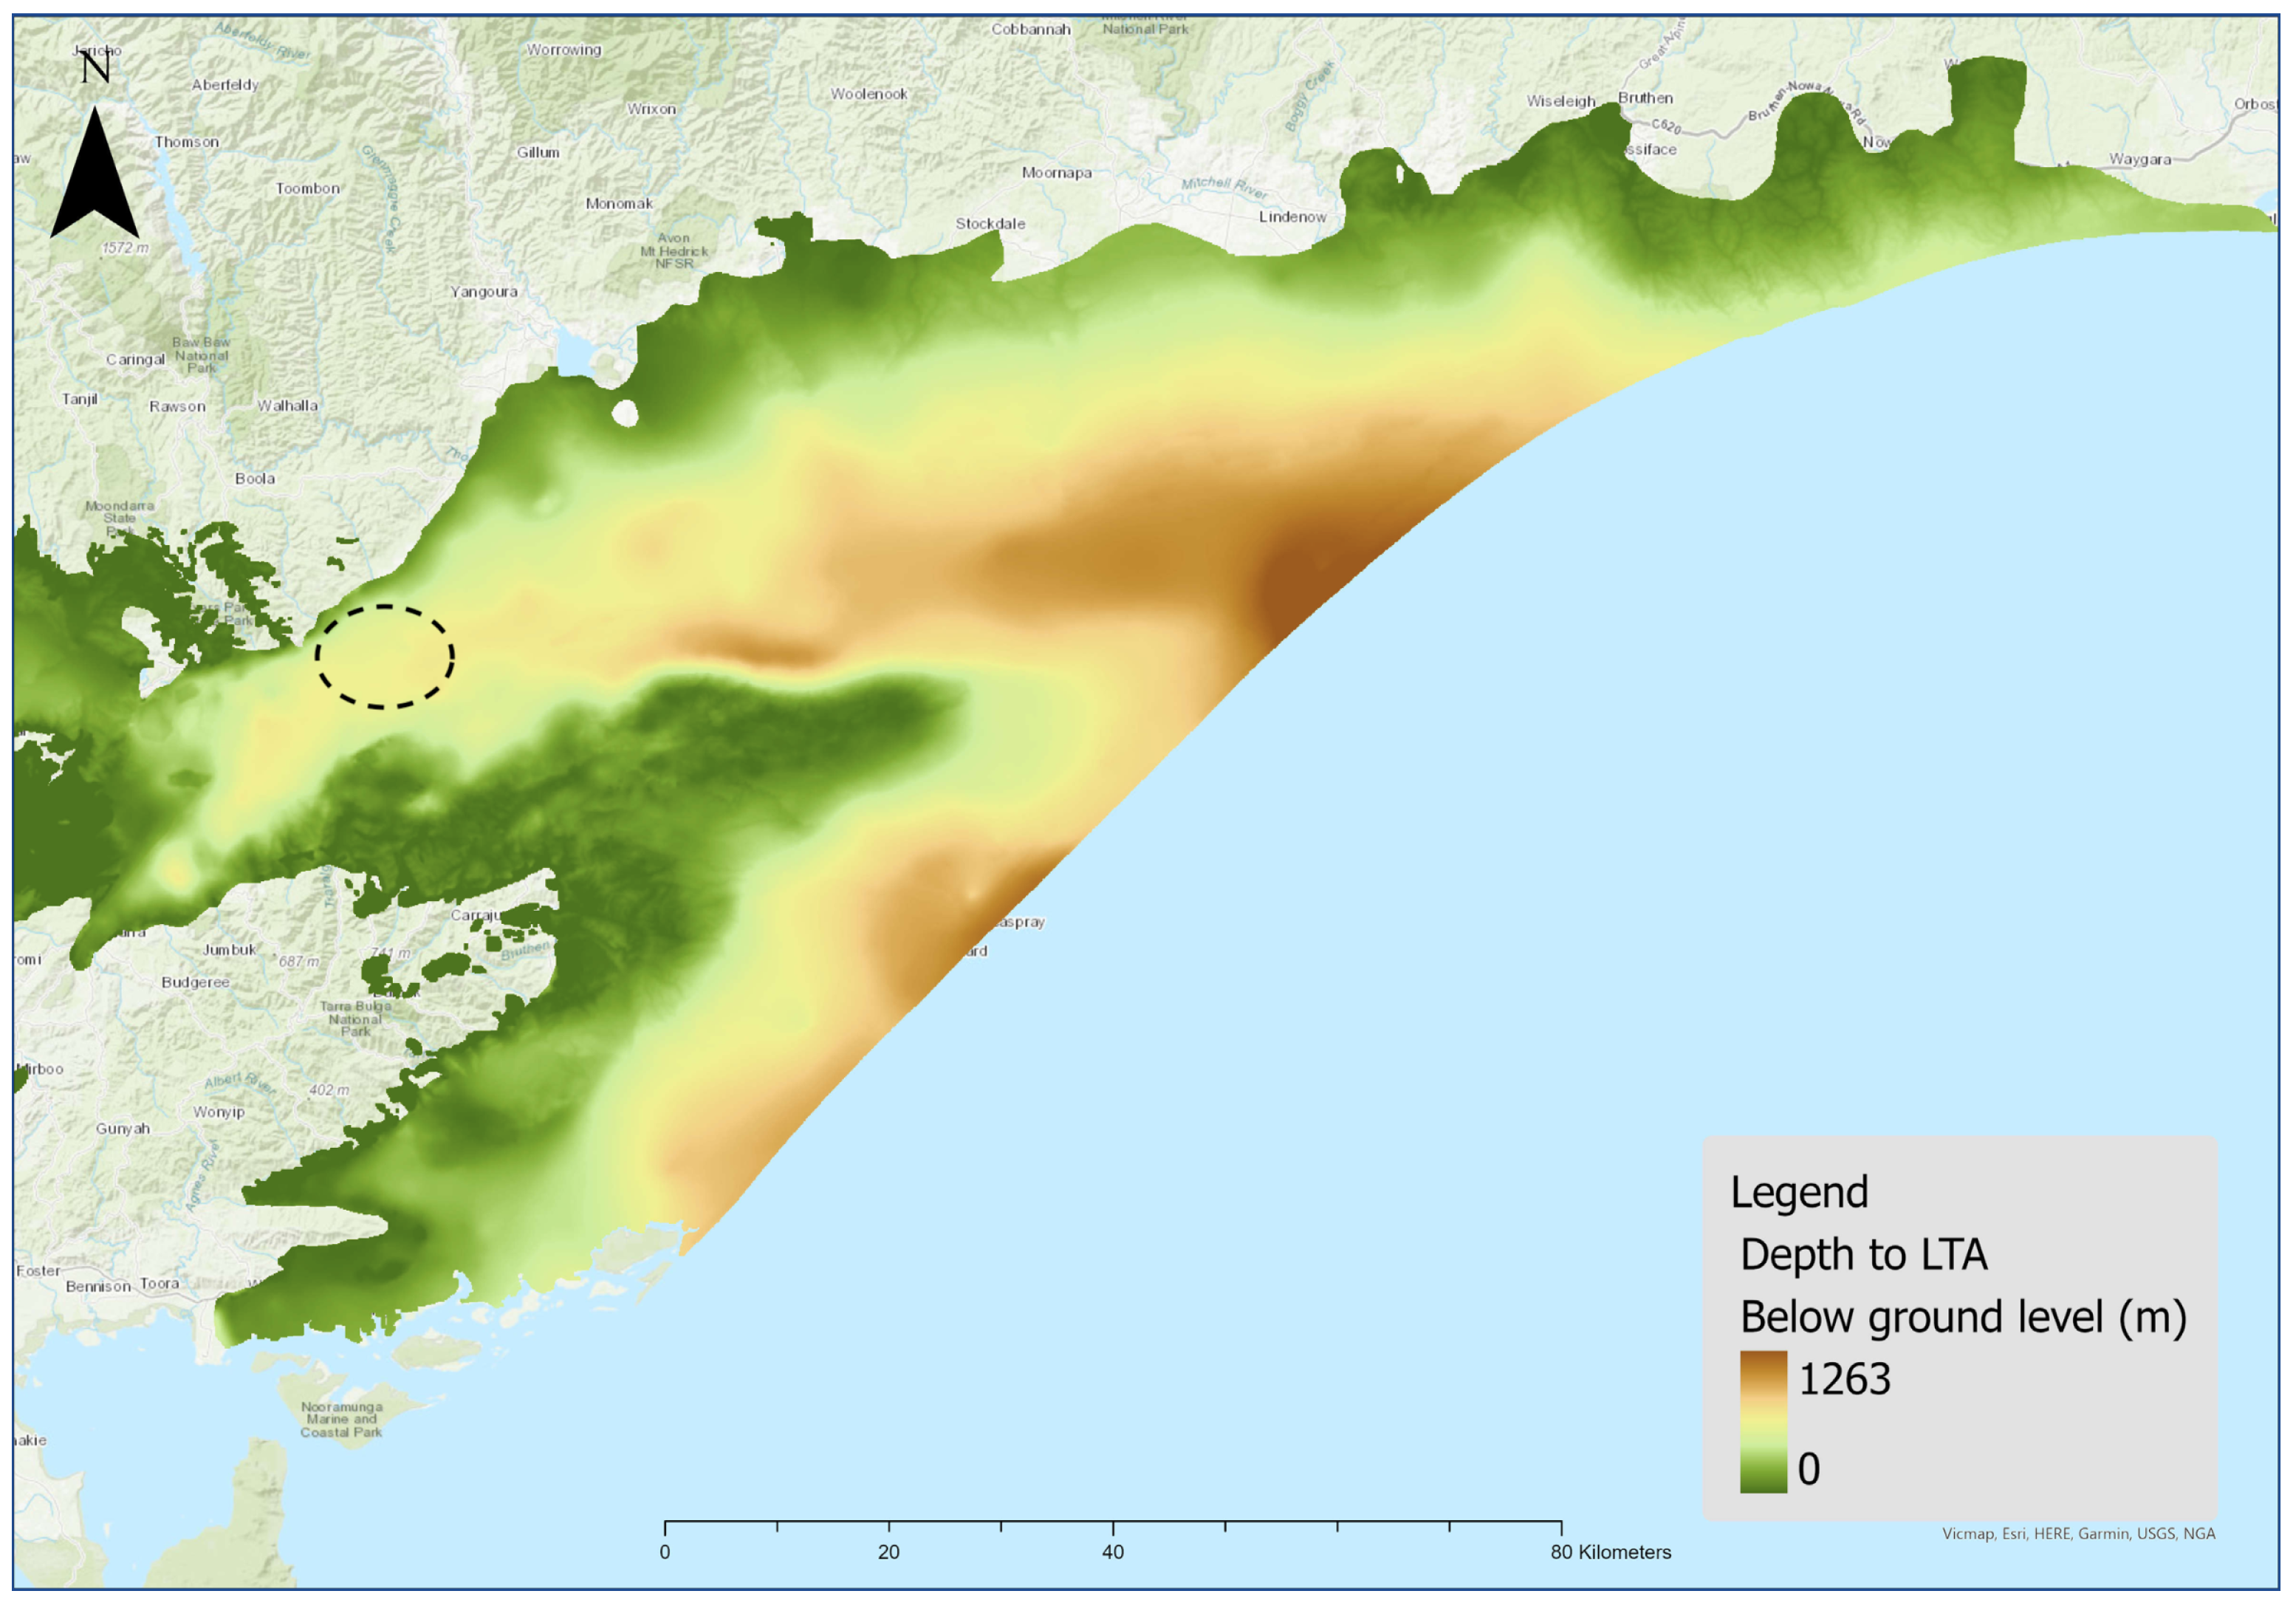
1.3. The Lower Tertiary Aquifer

Natural artesian hot springs are known in all other states of Australia, but none have been identified in Victoria [20]. Although it does not naturally emerge at the surface, however, natural hot water has been known to be beneath Gippsland for decades. In the early 1960s, a Victorian government geologist tabulated many “occurrences of high temperature waters in East Gippsland” [21], including one bore in the town of Maryvale (38.176° S, 146.441° E) from which the driller reported an artesian flow of 70 °C water at up to 70 L per second from a depth of 518 m. Since then, other government geologists have extended knowledge and awareness of the geothermal aquifers [22,23,24]. Brown coal provides thermal insulation, which, over geological time, has caused the temperature of the underlying rocks to increase to levels significantly greater than would otherwise be expected [25]. Some of the underlying rocks are naturally porous and permeable Tertiary-aged sandstone, able to produce groundwater at sustainable rates as high as 100 L per second. The deepest, and thus hottest, of these sandstone units is called the “Lower Tertiary Aquifer” (LTA) in the Victorian Aquifer Framework [26]. Ref. [27] notes that the LTA underlies about 6000 km 2 of Gippsland, from approximately Morwell in the west to Lakes Entrance in the east, and from Maffra in the north to Yarram and the coast in the south (see Figure 3). The LTA represents the primary target for geothermal energy, although shallower aquifers also hold warm water. Ref. [24] published the most recent maps of the estimated temperature and depth at the top of the LTA (Figure 4 and Figure 5, respectively).
Geothermal energy should only be considered as a possible option for an energy transition in Gippsland if prima facie evidence suggests it might be economically competitive. The economic value of geothermal energy depends strongly on the unique characteristics of the proposed utilization project, including the depth, temperature, and productivity of the target aquifer; the cost of drilling and well completion; the heat demand of the specific project; operation and maintenance costs; the value of the end product; the cost of alternative energy sources; and so on. The following thought experiment, however, serves to illustrate the notional value of the geothermal energy within the LTA.
Consider a program to drill 3000 wells into the LTA at an average spacing of one well every two square kilometers, with half of the wells (1500) designed to produce hot water and the other half to inject cooled water back into the aquifer. Each completed well is designed for a 50-year life and costs an average of AUD one million (USD 740,000 at the time of writing in January 2023). The cost of the capital program is, therefore, AUD 3 billion with no net consumption of groundwater.
Ref. [27] estimates that the onshore part of the LTA holds 70,000 GL of groundwater. This volume could be fully cycled through the network of 1500 production—injection well “doublets” over 50 years at a rate of 0.93 GL per year (average 30 L/s) per doublet. Each gigaliter of groundwater would yield 42,000 GJ of heat if cooled by 10 °C before reinjection, for a total of 2.94 billion GJ from the full 70,000 GL, or approximately one GJ per AUD of capital investment. One AUD/GJ is a negligible cost compared with the price of natural gas. This is obviously a simplistic analysis. The amount of useful work that could be extracted from the geothermal energy would be best investigated using the concept of exergy and specific end-use cases. However, the hypothetical cost of the heat is so low that it provides a compelling incentive for a more robust economic assessment.
The cost of natural gas is well known in Gippsland from commercial retail supply contracts. Natural gas has been produced and distributed throughout Victoria (see Figure 3) continuously from the offshore Gippsland Basin since its discovery in 1965. As a stable domestic source of energy, it has been widely exploited for industrial and domestic heating in Victoria. There has been little incentive for customers to consider alternative sources of heat until the relatively recent price increases (see Figure 2). While the existence of the LTA geothermal aquifer has been recognized for more than 60 years, no information about the comparative cost of producing geothermal energy from the LTA has been available in the public domain. The circumstances under which geothermal energy from the LTA might represent a cheaper source of heat than natural gas are unknown—a significant disincentive for anyone to develop geothermal heating systems.
Investment in new geothermal heating systems, either private or public, carries a higher level of risk than investment in more conventional heating systems. A significant portion of the total capital must be spent before the resource itself has been confirmed. Drilling is the only way to confirm the existence and productivity of a geothermal aquifer in the precise location of a geothermal project and is a significant component of the total cost of geothermal heating systems. Until 2021, no public geothermal systems had been developed or operated in Gippsland to produce real data about the cost of geothermal heat. This lack of information has been one of the largest barriers to the utilization of geothermal heat in Gippsland.

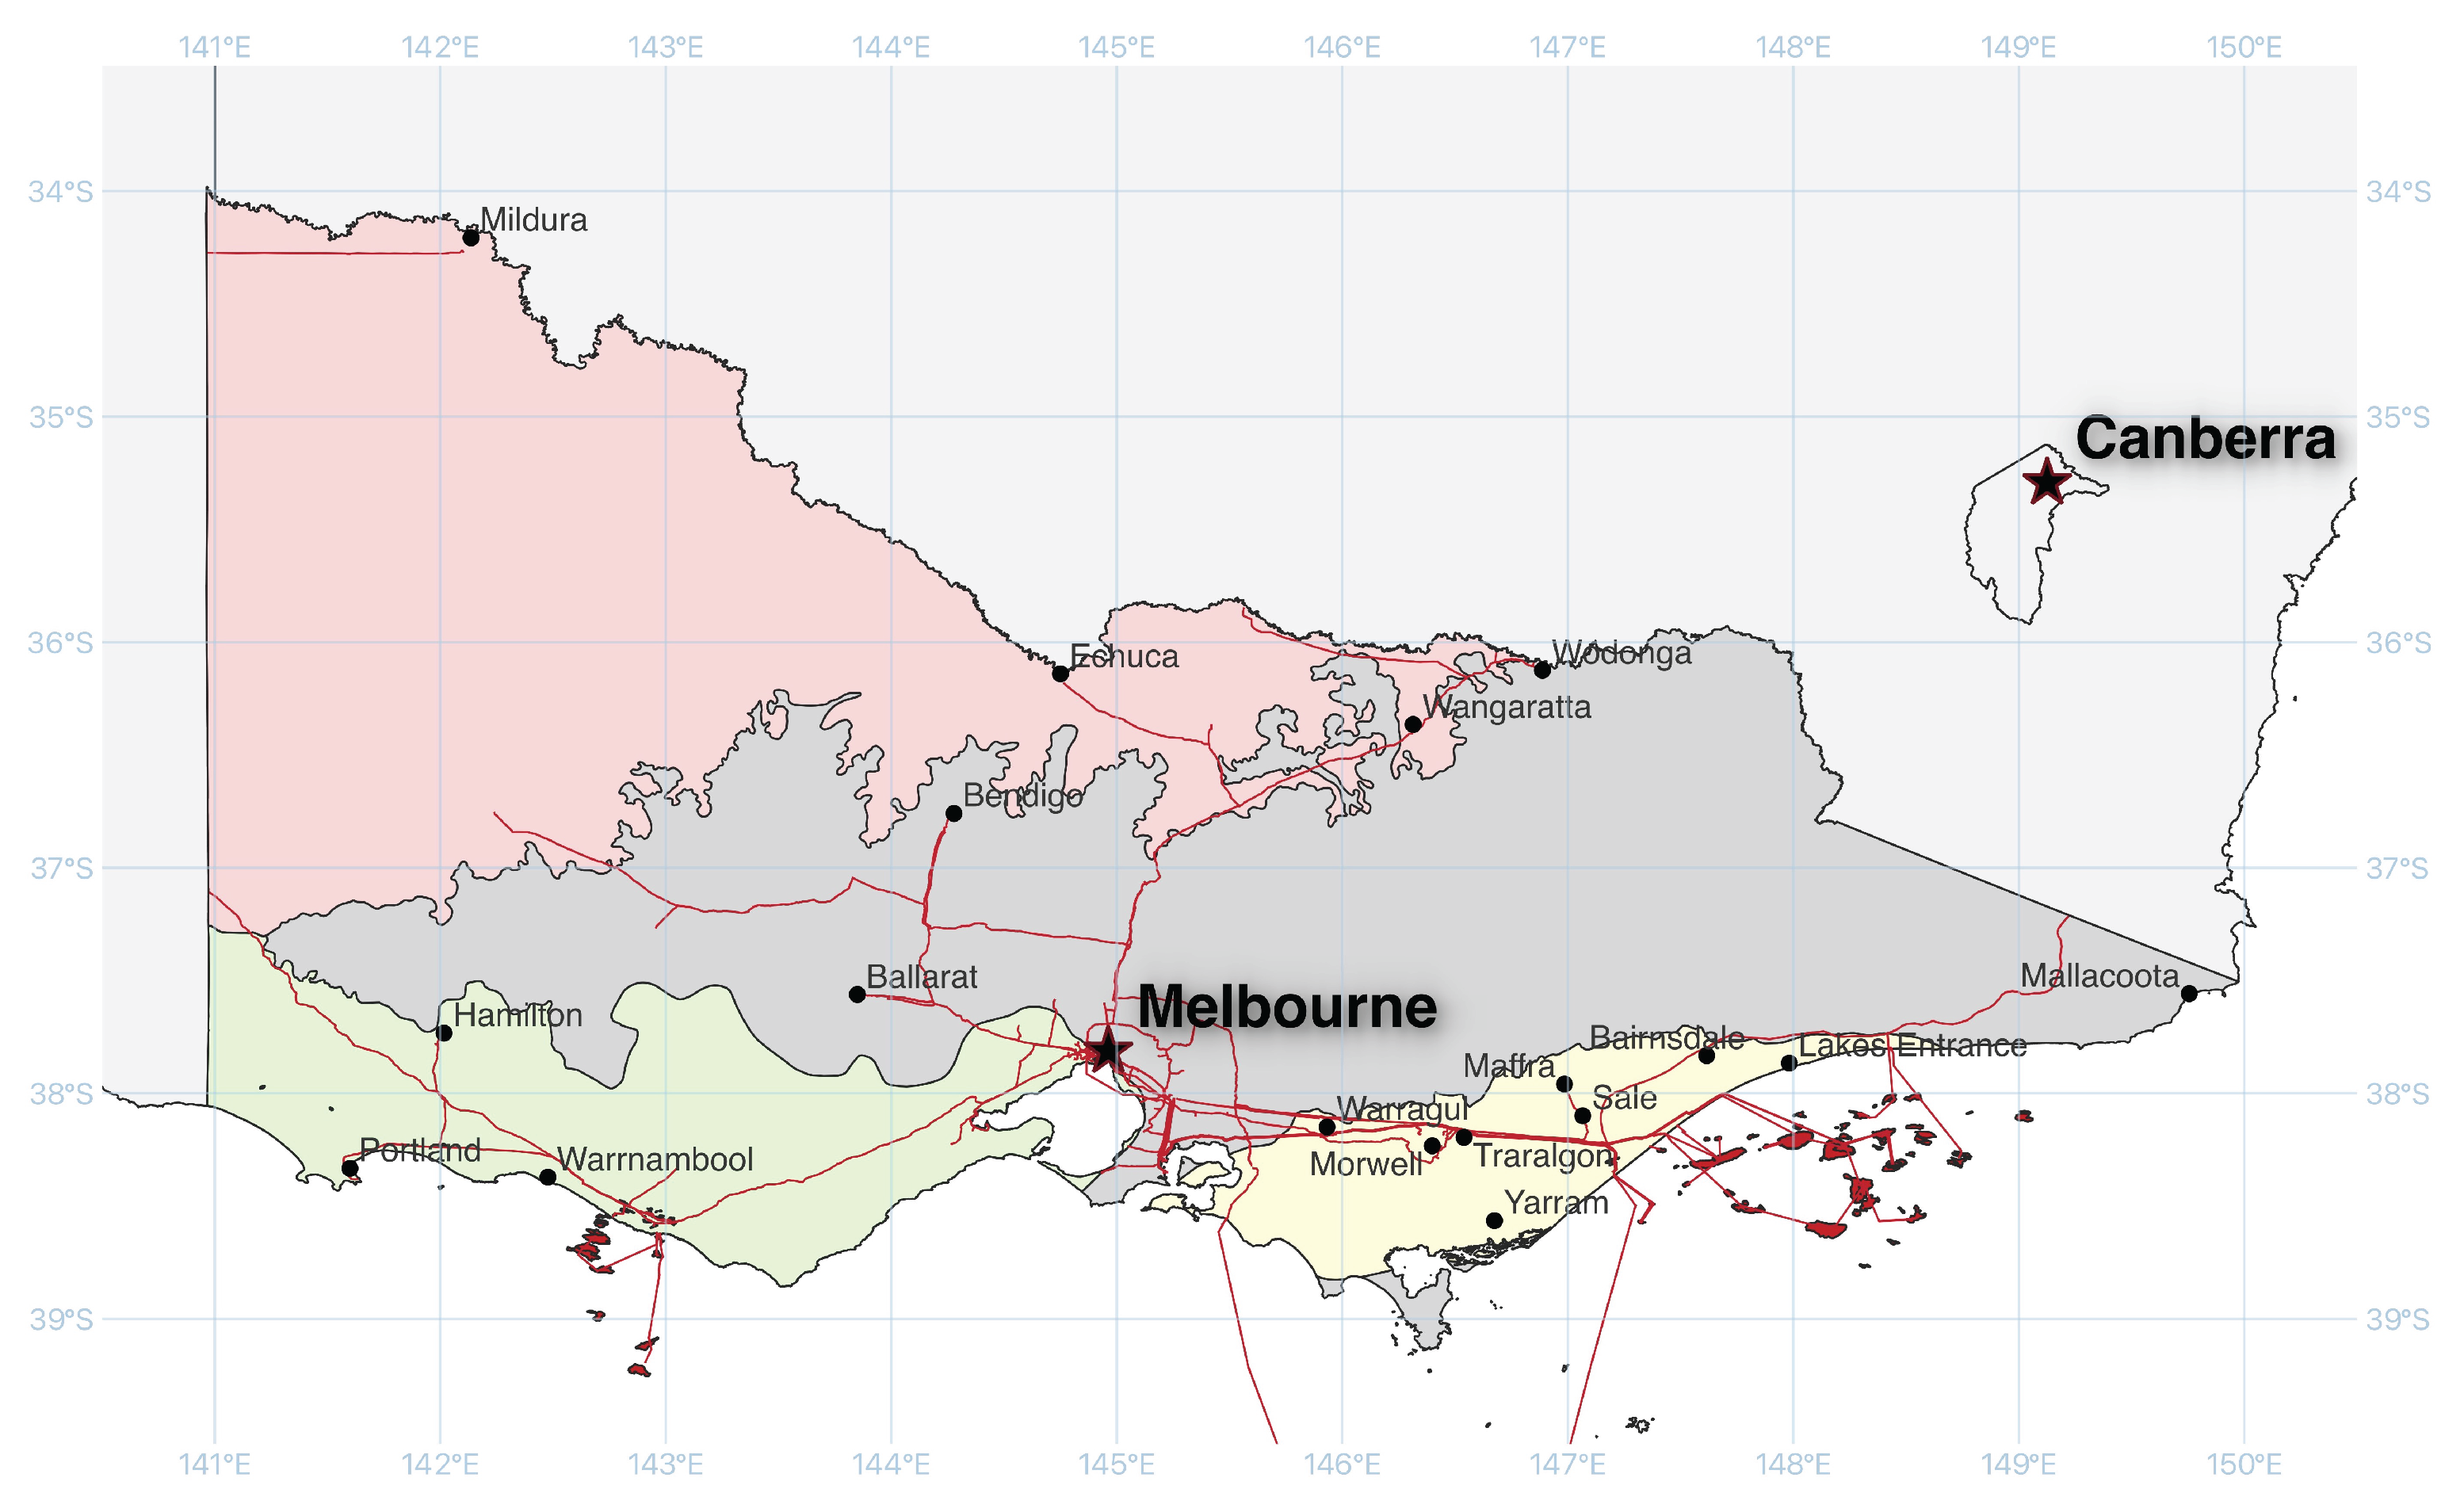
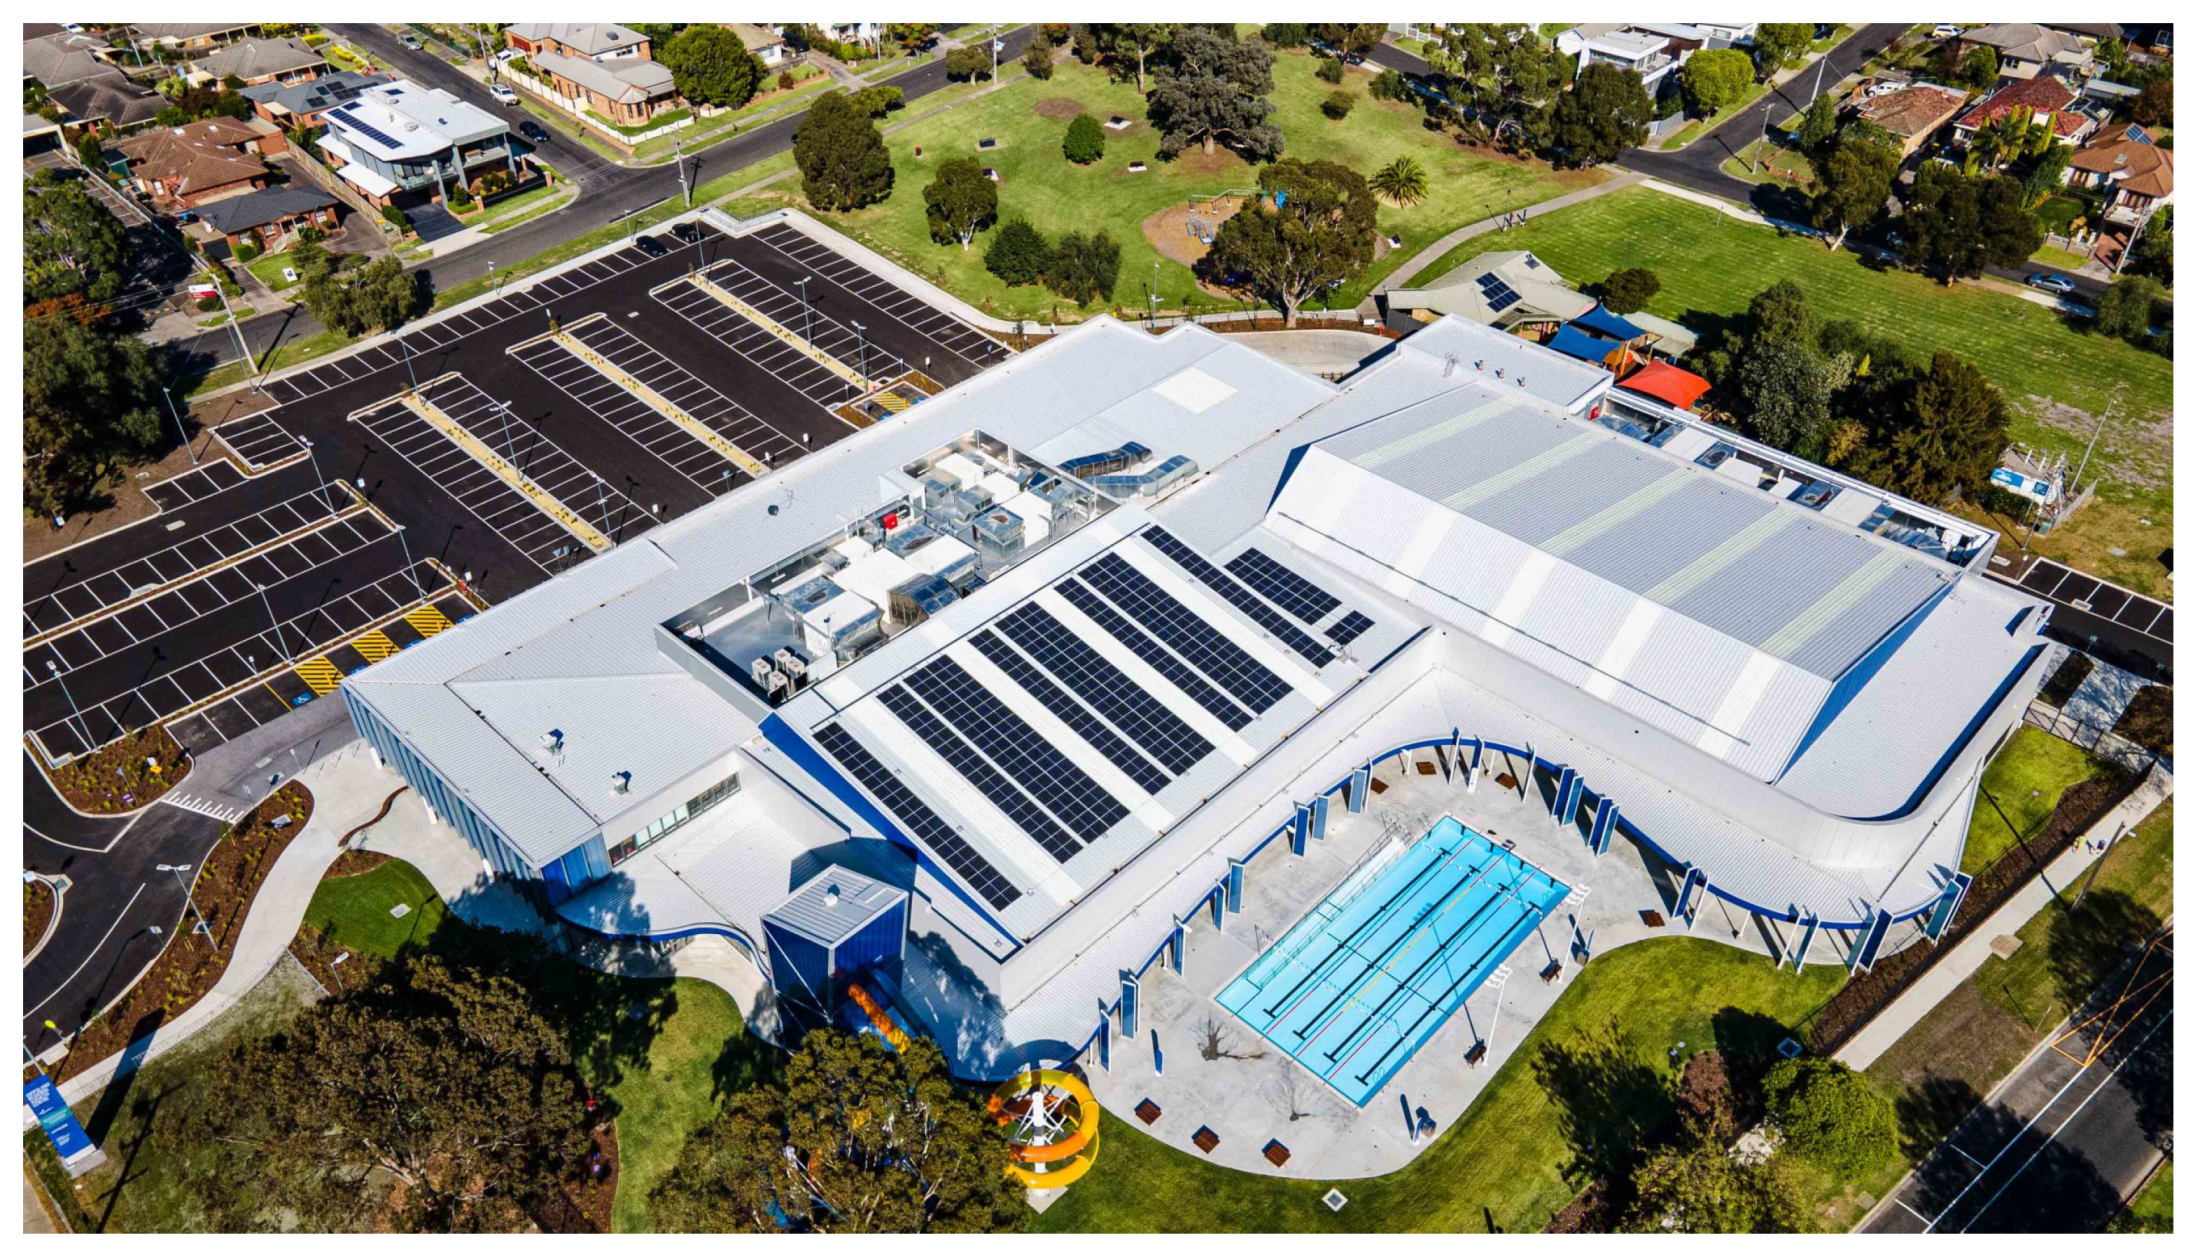
1.4. The Gippsland Regional Aquatic Centre

An opportunity arose in 2022 to quantify the cost of geothermal heat in Gippsland. The Gippsland Regional Aquatic Centre (GRAC) in the town of Traralgon (38.195° S, 146.532° E, altitude 60 m; Figure 3 and Figure 6) is a public recreational facility built and owned by the local municipal government—Latrobe City Council (LCC). The AUD 57 million facility, which opened in March 2021, contains a fully-equipped gymnasium, group fitness rooms, indoor and outdoor heated swimming pools and aquatic play areas, a wellness center, a café, and a retail store. Traralgon enjoys a mild temperate climate. The average daily maximum temperature is about 26 °C in summer and 14 °C in winter. The average nighttime minimum temperature is about 12 °C in summer and 4 °C in winter [29]. The GRAC facility, therefore, requires some level of heating for its buildings and pools year-round. LCC and the Latrobe Valley Authority, a branch of the State Government of Victoria, shared the financial risk of adding a geothermal heating system to the GRAC after learning of similar systems operating successfully in Perth, Western Australia (e.g., [14]).
The GRAC is the first facility of its kind in Victoria to use geothermal energy to heat its swimming pools and buildings. The essential components of the GRAC’s geothermal energy system are a production bore, a filter, a heat exchanger, and an injection bore. The two bores are each about 650 m deep and about 500 m apart. They were designed to produce and inject up to 25 L of geothermal water per second with the aid of an electric submersible pump. The geothermal water is not used directly for bathing. Regulations require 100% reinjection into the original aquifer with minimal change to water quality. The water is of high quality, with only minor risk for scaling in pipes or corrosion of contact surfaces [31]. After a single stage of filtering to remove fine particles, the hot water passes through a small plate heat exchanger where it transfers thermal energy to the pipe network that circulates water and heat throughout the GRAC buildings and pools. The cooled geothermal water exits the GRAC to the injection bore with a target of 100% reinjection back into the LTA.
Figure 7 provides a snapshot from the GRAC’s “Supervisory Control and Data Acquisition” (“SCADA”) sensor and software platform, illustrating the GRAC’s geothermal heating system. Geothermal water enters the GRAC through the red pipe at the top right (at 67.9 °C in the diagram), passes through the plate heat exchanger, and exits (at 49.5 °C in the diagram) through the other pipe in the top right for reinjection into the LTA. The heat exchanger raises the temperature of water circulating throughout the GRAC enclosed spaces and swimming pools (from 49.0 °C to 60.0 °C in the diagram.) The geothermal source is providing 100% of the heat required by the GRAC in the example shown in Figure 7.
Figure 7 also shows three natural gas furnaces (“WH-1”, “WH-2”, and “WH-3”) installed as backup heat sources. The natural gas furnaces are comparable to primary heating systems installed in aquatic centers elsewhere throughout Victoria. LCC buys natural gas for the backup system when required through a commercial contract with an energy retailer. The natural gas system thus provides a benchmark against which the technical, financial, and environmental performance of the GRAC’s geothermal system can be compared. After one full year of operation, LCC provided us with records of geothermal and electrical energy consumed by the GRAC to assess the geothermal system’s performance.

1.5. Economic Analysis of the GRAC

We assessed the financial and environmental effectiveness of the GRAC’s geothermal system within the framework of an economic analysis. In particular, we calculated the system’s net present value, internal rate of return, payback period, levelized cost of heat, and other economic indicators based on a full year of operation. Our methodologies included standard capital budgeting techniques (e.g., [32,33]) that accounted for the time-value-of-money and time-value-of-heat to determine a discounted cost of the geothermal heat supply relative to a conventional natural gas heat supply. We also performed a sensitivity analysis on key input assumptions to estimate the uncertainty range of the outcomes.

2. Data and Methods

2.1. Datasets Provided

LCC provided us with operational and financial data required for our analysis. Specific datasets include the following:
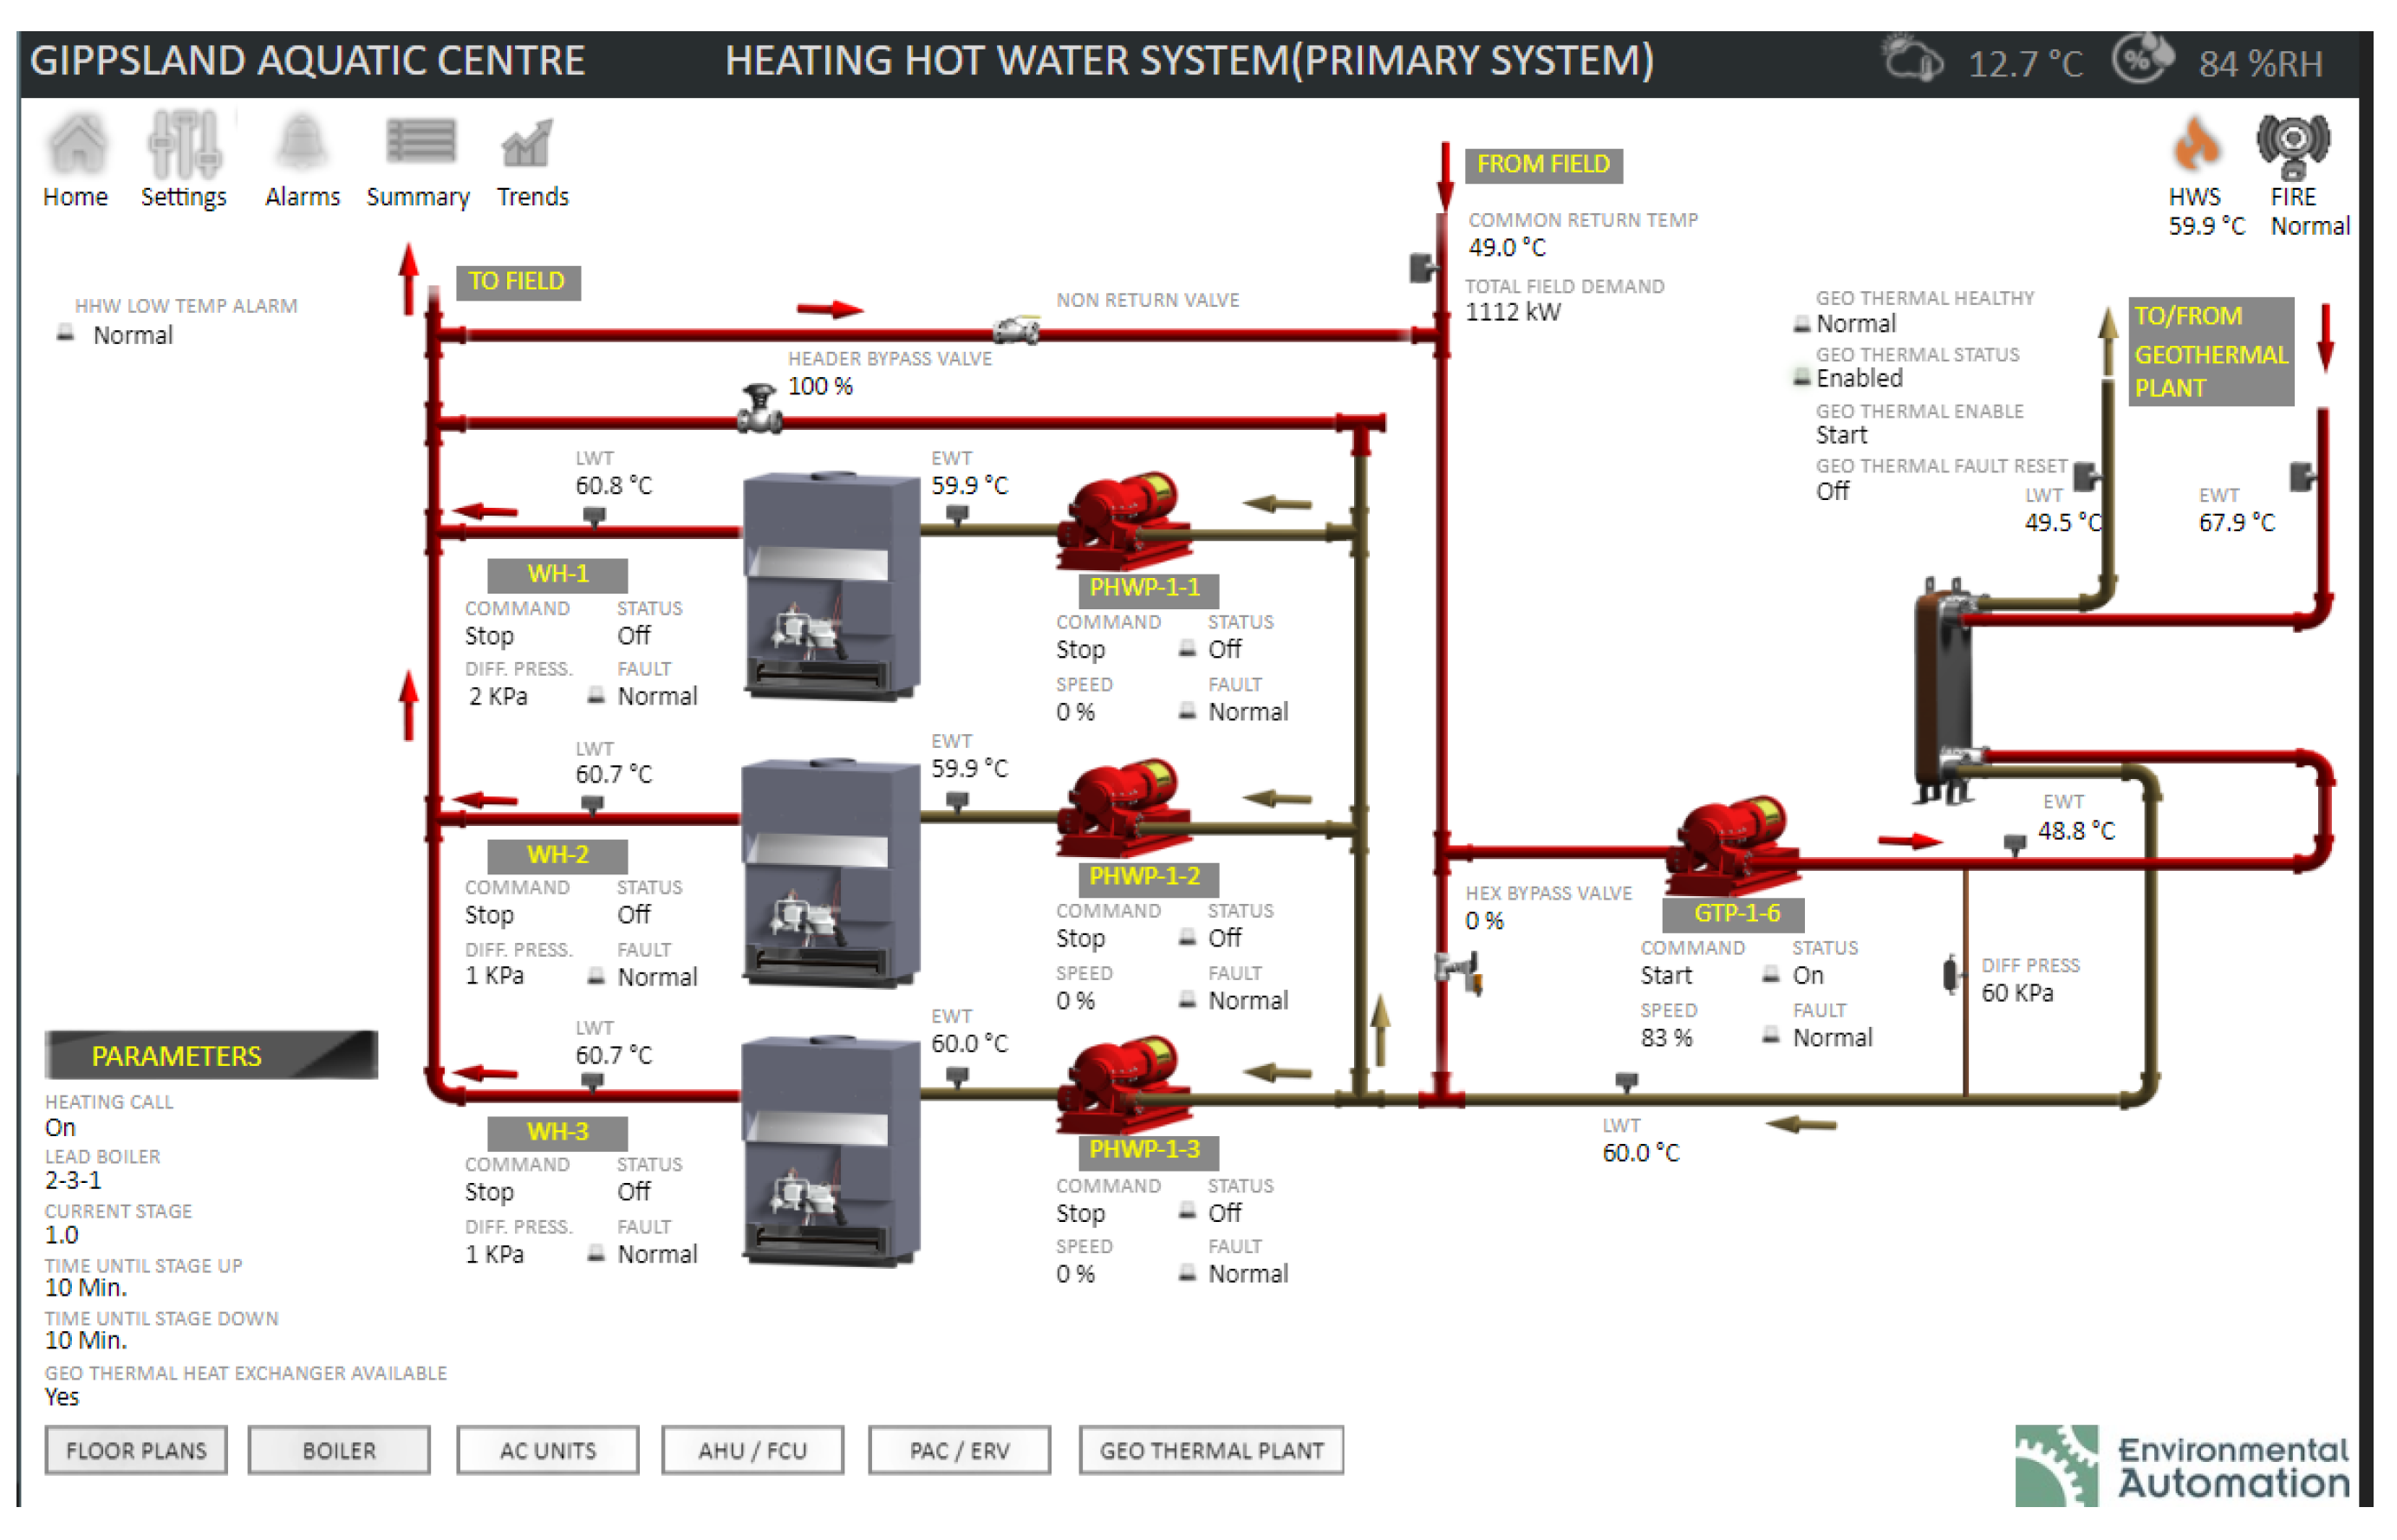
  • SCADA data from the GRAC’s geothermal heating system, covering one full year at 5 min intervals from 22 July 2021 to 21 July 2022:
    -
    Status of the geothermal pump (on/off)
    -
    Production geothermal water temperature ( T p ; °C)
    -
    Injection geothermal water temperature ( T i ; °C)
    -
    Geothermal water flow rate through the system (w; liters per second)
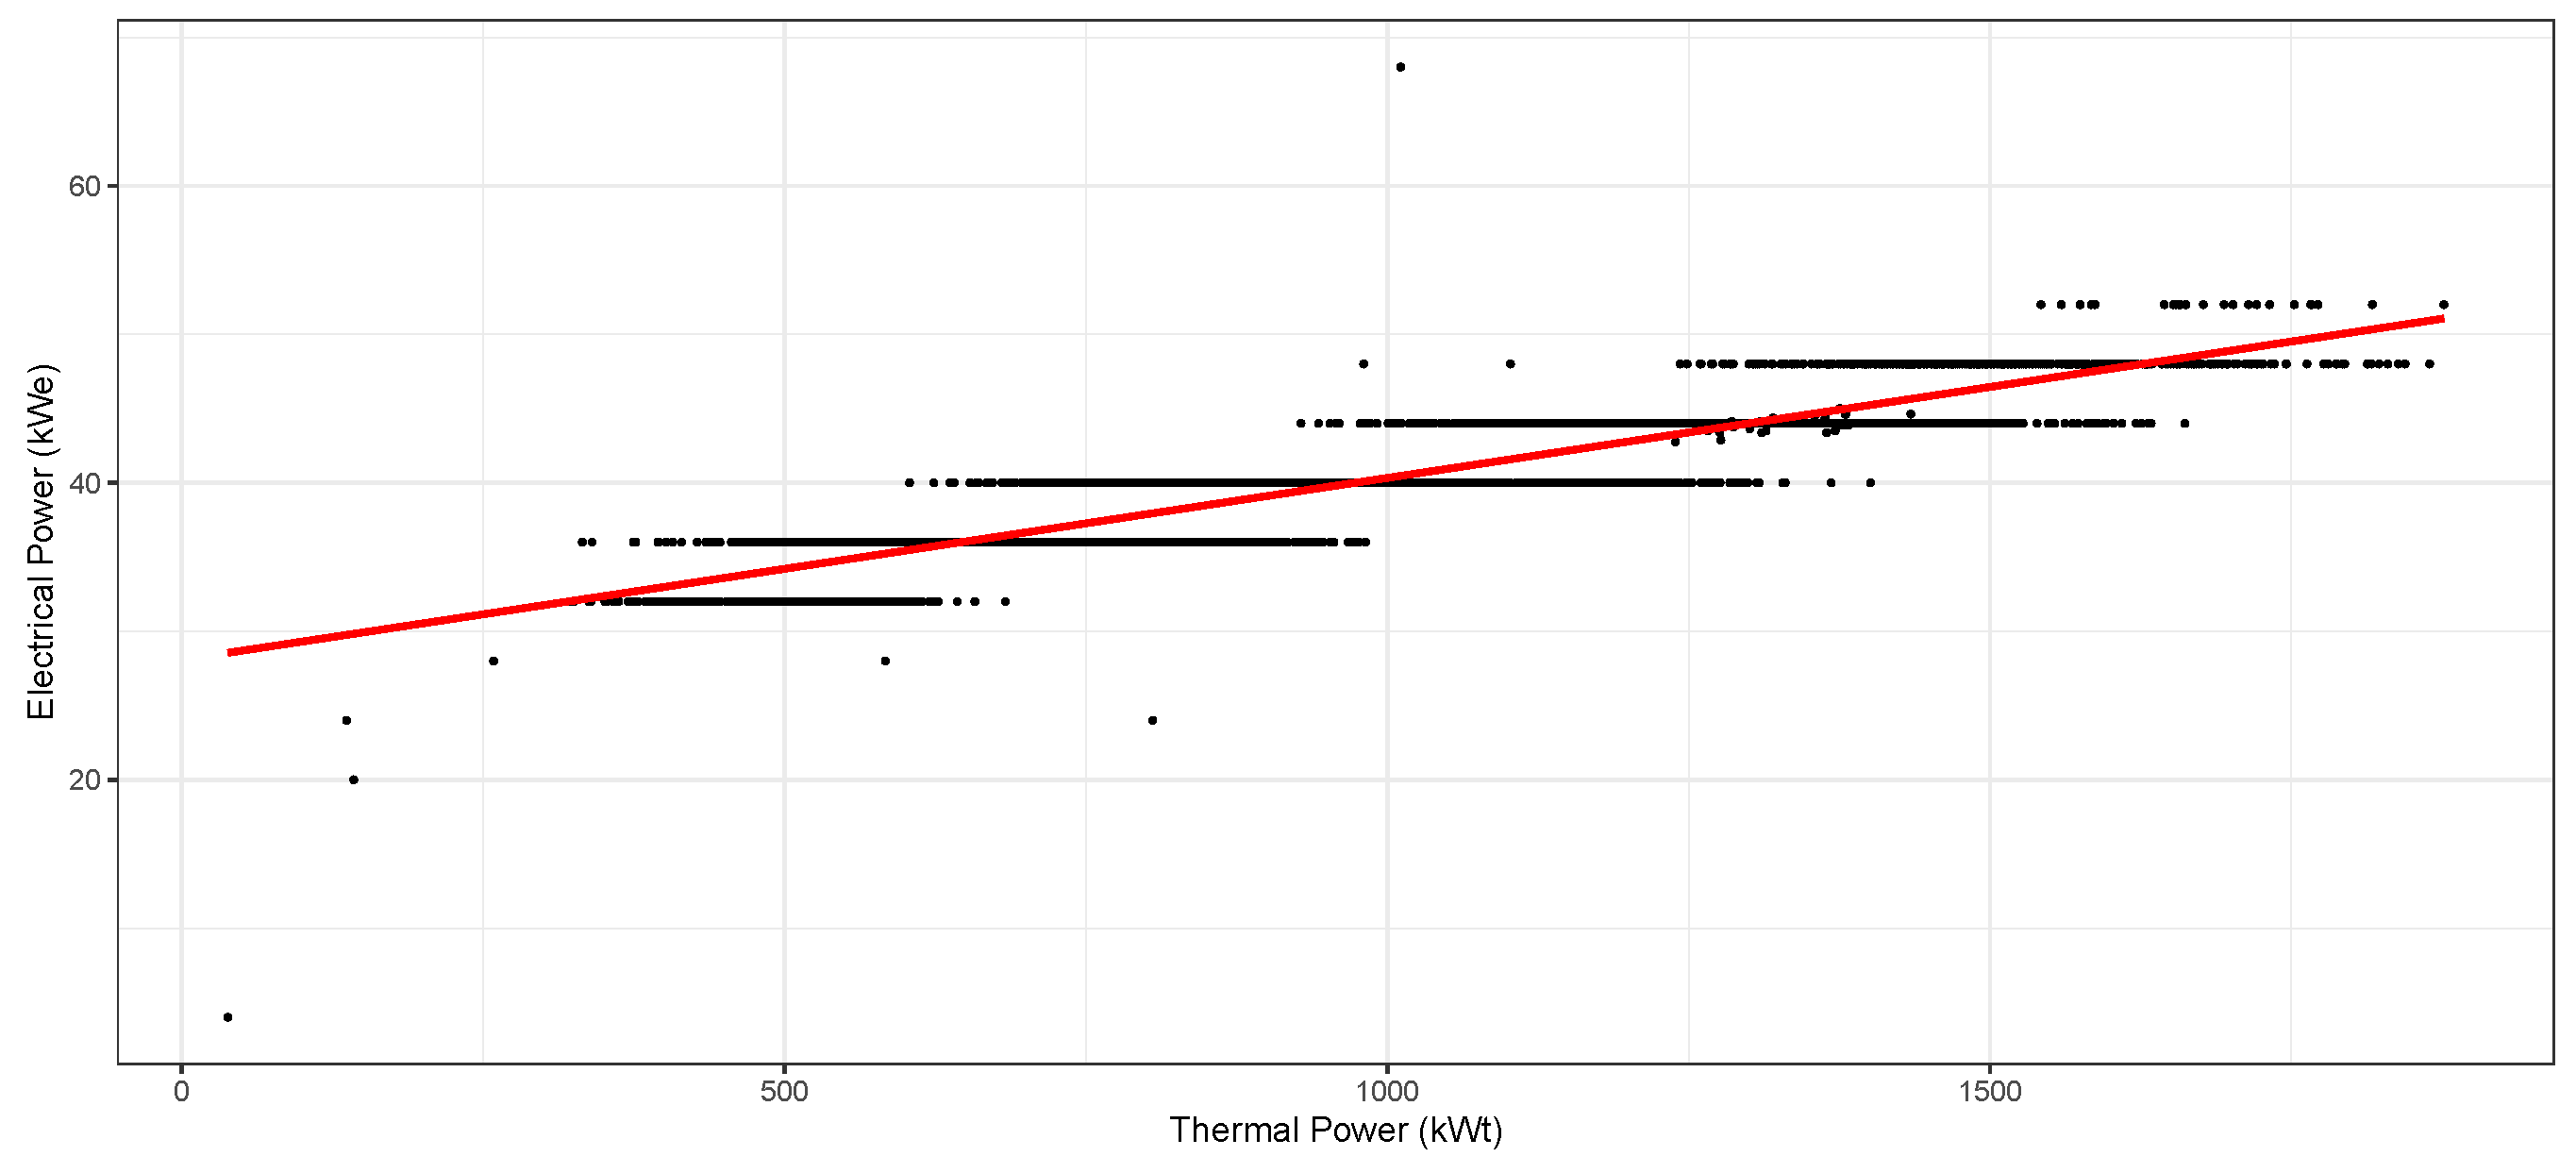
  • Electricity (kWh) consumed by the geothermal pump, covering two three-week periods at 15-minute intervals:
    -
    19 April–10 May 2022
    -
    6 July–27 July 2022
  • Electricity tariff:
    -
    Peak (07:00–10:00 and 16:00–23:00, Monday to Friday): 0.156322 AUD/kWh
    -
    Shoulder (10:00–16:00, Monday to Friday): 0.146115 AUD/kWh
    -
    Off-peak (all other times): 0.122780 AUD/kWh
  • Natural gas tariff: 31.0261 AUD/GJ
  • Capital cost of construction: AUD 3,855,396
  • Anticipated lifetime maintenance costs:
    -
    Annual: AUD 15,000
    -
    Decadal: AUD 125,000

2.2. Data Completeness and Initial Processing

Out of a total 105,120 five-minute intervals in the annual period studied, the SCADA system provided 104,063 valid temperature and flow records—that is, only about 1% of the full record was null or missing. We considered the 1% omission as insignificant and made no adjustments to the dataset to account for the missing records.
We calculated the thermal power delivered to the GRAC by the geothermal system for each 5-minute interval using Equation (1):
P t h = ( T p T i ) × w × c p w
where P t h = thermal power (kilowatts), T p = geothermal production temperature (°C), T i = geothermal injection temperature (°C), w = geothermal water flow rate (L/s), and c p w = specific heat capacity of water (4.172 kJ/kg.K).
The thermal energy (heat) delivered over each 5-minute interval was estimated by multiplying the instantaneous thermal power by the time interval (300 s) according to Equation (2):
H = P t h × 300
where H = heat (kilojoules). We divided H by 1,000,000 to convert to gigajoules, then multiplied by the natural gas tariff (AUD/GJ) to calculate an “effective cost saving” provided by the geothermal system by avoiding conventional gas heating. The cost savings needed to be adjusted, however, by the cost of electricity required to run the geothermal pump.
LCC provided electricity consumption data for only six weeks of the full year of assessment. In order to estimate electricity consumption over the full year, we first calculated the average electrical power consumed during each 15 min interval of the six reported weeks by dividing the reported electricity consumption by the 0.25 h time interval (Equation (3)):
P e = E e 0.25
where P e = electrical power (kilowatts), E e = electricity consumed (kilowatt hours), and 0.25 is the time interval in hours. We correlated electrical power consumption against thermal power production for each 5 min interval of the six weeks of electricity consumption data (Figure 8) and derived a linear relationship by regression (Equation (4)):
P e = 0.01225 × P t + 28.08
Using Equation (4), we estimated the electrical power drawn by the geothermal pump during each 5 min interval of the full year and, hence, the electricity consumed. Its associated monetary costs were calculated by multiplying the usage by the electricity price relevant for that time interval. An “aggregate cost saving” was calculated by deducting each time interval’s electricity price from the “effective cost saving” calculated previously.
Avoided greenhouse gas emissions were calculated for each period by multiplying the emission factor of natural gas combustion (51.53 kg.CO2-e per gigajoule; [34]) by the amount of geothermal energy produced (GJ). Greenhouse gas emissions due to consumed electricity were calculated based on the emissions intensity of Victorian grid electricity (0.96 kg.CO2-e/kWh; [34]).
The total geothermal energy production, aggregate cost savings, and avoided greenhouse gas emissions were tallied to calculate annual figures to inform the main economic analysis of the geothermal system.

2.3. Economic Performance Analysis

The information about costs and cost savings presented above were used to calculate key economic performance indicators for the GRAC geothermal system. Specific indicators included net present value (NPV), internal rate of return (IRR), levelized cost of heat (LCoH), breakeven cost of energy, and the system’s payback period.
The NPV of a project is the discounted net cash flows over the life of the project using a benchmark discount rate. The IRR is the discount rate at which the NPV of the project is zero (breakeven discount rate). The LCoH of a project is the discounted cash outflows divided by either the discounted or nominal heat energy generated. The breakeven cost of energy is the year-zero price of natural gas that produces a breakeven NPV. Finally, the project’s payback period is the number of years required for the project to recoup its original capital expenditure in nominal terms.
The economic indicators are defined mathematically as follows:
N P V = t = 0 n C F t ( 1 + r ) t
t = 0 n C F t ( 1 + I R R ) t = N P V = 0
L C o H d i s c o u n t e d = t = 0 n C O F t ( 1 + r ) t t = 0 n H t ( 1 + r ) t
L C o H u n d i s c o u n t e d = t = 0 n C O F t ( 1 + r ) t t = 0 n H t
where n = assumed project lifetime (years), r = discount rate (%), C F t = net cash flow in year t (AUD), C O F t = net cash outflow in year t (AUD), and H t = heat generated in year t (GJ).
In addition to the data provided by the GRAC, assumptions were made in the capital budgeting process. A discount rate of 8% per annum was assigned for the economic calculations, on-par with similar renewable energy projects in Australia over the same time period [35]. A general inflation rate of 2.5%, a natural gas and electricity inflation rate of 5%, and a project lifetime of 30 years were also assumed as per guidance from [28,36].

3. Results

3.1. Base Case Results

Significant cost savings were evident from the economic analysis. On an unlevered basis (removing considerations for debt financing taken on by the project) with all capital expenditures in year 0, the geothermal system has an NPV of AUD 9.49 million and an internal rate of return of 23% (see Table 1). This result indicates that the geothermal system provides LCC with a significant financial advantage relative to conventional natural gas heating.
The benefits of the geothermal system are evident early in its lifetime. Its payback period is estimated to be 4.94 years, indicating that the cost savings delivered by the geothermal system would recoup the initial capital expenditure of AUD 3.84 million in less than five years. After the initial five-year period, the geothermal system continues to generate positive cost savings every year until the end of the project’s lifetime.
Over the data collection period, monthly variations in the net cost savings were observed. The months corresponding to the Australian winter period displayed considerably greater cost savings relative to the summer months (Figure 9). This is to be expected as more thermal energy is required to heat the aquatic center’s various amenities in winter compared to summer. Net positive cost savings were, however, observed throughout the entire year.
The economic analysis yielded an undiscounted LCoH value of 7.19 AUD/GJ. After considering the time-value-of-heat using an 8% discount rate, the discounted LCoH is calculated to be 19.16 AUD/GJ. This indicates that the cost outflows for the geothermal system that is required to generate one gigajoule of heat (nominal or discounted) is significantly below the market gas price GRAC pays of 31 AUD/GJ. The breakeven cost of heat also substantiates the LCoH figures. The NPV of the geothermal system is positive for all market natural gas prices equal to or greater than 10.80 AUD/GJ, giving significant leeway for the project to remain cost-effective over a wide range of natural gas price volatilities from its current natural gas tariff of 31.0261 AUD/GJ.
Over the year of assessment, it is estimated that the geothermal system avoided 914 tonnes of CO2-equivalent greenhouse emissions compared with producing the same amount of heat by natural gas combustion (Figure 10). Over the 30-year estimated lifetime of the system, therefore, it is estimated that over 27,000 tonnes of greenhouse gas emissions are avoided.

3.2. Sensitivity Analysis

A sensitivity analysis was also conducted to investigate the uncertainty range of the calculated economic indicators. Key input assumptions and parameters were individually varied by 50% above and below their base values and the resulting economic indicators were calculated. Table 2 tabulates the sensitivities and their deviations from the base values.
Variations in general inflation and electricity inflation did not have a material impact on the economic performance of the geothermal system. However, variations in the discount rate, gas inflation rate, and project life resulted in noticeable variations in economic performance. The summary results are tabulated in Table 3.
As expected, a high gas inflation rate and a longer project life result in greater predicted economic benefits from the geothermal system. The opposite is true for the discount rate. Despite this, all the NPV values remain significantly positive regardless of the variations, indicating that the geothermal system is economically attractive across a broad range of input assumptions and the base case results are generally quite robust.

4. Conclusions

With extensive legislation under the Climate Change Act (2017) and the commitment of the Victorian state government to achieve net-zero emissions by 2050, economically feasible renewable energy generation has been at the forefront of Australia’s legislative agenda. While not the principal driver, it is also pertinent that natural gas production in southeast Australia, including the Gippsland Basin, is in permanent decline [37]. Continued reliance on natural gas as a fuel could see Australia increasingly exposed to volatile international supply markets with a corresponding reduction in domestic energy security. Through examining 12 full months of heat production from the geothermal system of the GRAC, we have validated geothermal energy as another economically feasible low-emissions source for industrial heat supply.
The economic outlook of the geothermal system installed at the GRAC looks particularly promising under our case study. All key economic performance indicators (e.g., NPV, IRR, LCoH) display a net positive return from the geothermal system as opposed to using natural gas as an alternative. In particular, an NPV of AUD 9.49 million indicates that the geothermal project is economically attractive in present-value terms. We also found that the breakeven price for the geothermal energy is about 35% the equivalent price of natural gas (10.8 AUD/GJ as compared to the current natural gas tariff of 31.0261 AUD/GJ), and that the cost savings from the system only require a payback period of about five years to justify the initial capital expenditure. The system is also environmentally friendly, and is estimated to avoid over 27 thousand tonnes of greenhouse gas emissions over its lifetime compared with traditional natural gas heating.
The sensitivity analysis substantiates the robustness of our results. The input variables that required some degree of subjectivity (e.g., discount rate, inflation rate, project lifetime) were varied by up to 50% from their base values. We found that the project still remains economically viable even under pessimistic assumptions. This lends credibility that geothermal energy as an eco-friendly source of domestic and industrial heating is indeed economically viable and should be seriously considered for further natural gas replacement projects in Victoria.
Our economic assessment methodology described above provides a possible framework for robust economic assessments of other geothermal energy projects in Australia and globally. While beyond the scope of this present work, the application of our methodology across a wide range of direct use geothermal projects could reduce investment risk by providing investors with a standard framework to predict and compare future financial performance of geothermal projects.

Author Contributions

Conceptualization, B.F., G.B. and R.W.; methodology, B.F. and G.B.; software, B.F. and G.B.; validation, B.F. and G.B.; formal analysis, B.F. and G.B.; investigation, B.F. and G.B.; resources, G.B. and R.W.; data curation, B.F. and G.B.; writing—original draft preparation, B.F. and G.B.; writing—review and editing, B.F., G.B. and R.W.; visualization, B.F.; supervision, G.B. and R.W.; project administration, G.B. and R.W.; funding acquisition, G.B. and R.W. All authors have read and agreed to the published version of the manuscript.

Funding

This work was supported by the Victorian Government Department of Jobs Precincts and Regions through Grant #LVA-GS3 for the project “Gippsland Geothermal Mapping and Cost Analysis Tool—Information Gathering and Geothermal Economic Algorithms”.

Data Availability Statement

Data are available upon request.

Acknowledgments

The authors acknowledge Grant Thornton Australia Limited for their contribution to the project. Grant Thornton Australia Limited was engaged by the University of Melbourne to undertake an independent review (the Review) of the Gippsland Regional Aquatic Centre (GRAC) geothermal economics financial template (the Financial Model). The Review involved the verification of the arithmetical accuracy and logical application of the underlying assumptions in relation to the Financial Model prepared by the University of Melbourne for their internal review and to support the evaluation of the economic cost of the geothermal heating of the GRAC compared with the costs if it were heated by gas (the Project), and confirmation that the Financial Model’s stated assumptions are materially consistent with supporting project and financing documentation. Based on the work performed, in Grant Thornton’s opinion, the Financial Model is, so far as its mechanical construction and internal logic are concerned, materially correct and internally consistent; based on the assumptions made, the accuracy of the results can be relied upon. Furthermore, to the extent possible, the assumptions in the Financial Model are supported by way of external documentation or signed agreements, which Grant Thornton sighted as part of the engagement. However, a number of assumptions were determined and factored in the Financial Model based on industry knowledge possessed by experienced staff members at the University of Melbourne. The authors thank Latrobe City Council for providing the data underpinning this paper and for permission to publish the results. Furthermore, the authors thank two anonymous reviewers for their comments, which resulted in a considerably improved paper.

Conflicts of Interest

The authors declare no conflict of interest.

Abbreviations

The following abbreviations are used in this manuscript:
AUDAustralian Dollars
CFNet Cash Flow
COFNet Cash Outflow
CO2-eCarbon Dioxide Equivalent
GJGigajoule
GRACGippsland Regional Aquatic Centre
GSHPGround Source Heat Pump
HHeat
IRRInternal Rate of Return
LCCLatrobe City Council
LCoHLevelized Cost of Heat
LOESSLocally Estimated Scatterplot Smoothing
LTALower Tertiary Aquifer
MWeMegawatts (electrical)
MWtMegawatts (thermal)
NPVNet Present Value
SCADASupervisory Control and Data Acquisition
TWhTerrawatt hours

References

  1. IRENA. Renewable Energy Statistics 2022; International Renewable Energy Agency: Abu Dhabi, United Arab Emirates, 2022. [Google Scholar]
  2. Budd, A.R.; Gerner, E.J. Externalities are the Dominant Cause of Faltering in Australian Geothermal Energy Development. In Proceedings of the World Geothermal Congress 2015, Melbourne, Australia, 19–25 April 2015. [Google Scholar]
  3. Clean Energy Regulator. Postcode Data for Small-Scale Installations; Small Generation Unit–Solar (Deemed). 2022. Available online: https://www.cleanenergyregulator.gov.au/RET/Forms-and-resources/Postcode-data-for-small-scale-installations (accessed on 11 December 2022).
  4. State of Victoria Department of Environment, Land, Water and Planning. Offshore Wind Policy Directions Paper; Technical Report, State of Victoria; State of Victoria Department of Environment, Land, Water and Planning: Melbourne, VIC, Australia, 2022.
  5. Australian Government Department of Climate Change, Energy, the Environment and Water. Australian Energy Update 2022, Table C: Australian Energy Consumption by State and Territory, by Fuel, Energy Units; Technical Report, Commonwealth of Australia; Australian Government Department of Climate Change, Energy, the Environment and Water: Canberra, ACT, Australia, 2022.
  6. State of Victoria Department of Environment, Land, Water and Planning. Gas Substitution Roadmap; Technical Report, State of Victoria; State of Victoria Department of Environment, Land, Water and Planning: Melbourne, VIC, Australia, 2022.
  7. Thomas, L.; Wilkinson, S.; Wyndham, J.; Huete, A.; Biloria, N.; Woods, A.; Kalali, P.; Powles, R.; Srivastava, A.; Liu, Y.; et al. Fairwater Living Lab Residential Heat Pump Study Annual Public Report. 2022. Available online: https://arena.gov.au/knowledge-bank/?keywords=Residential+Heat+Pump+Study (accessed on 16 January 2023).
  8. Lu, Q.; Narsilio, G.A.; Aditya, G.R.; Johnston, I.W. Economic analysis of vertical ground source heat pump systems in Melbourne. Energy 2017, 125, 107–117. [Google Scholar] [CrossRef]
  9. Beardsmore, G.R. Direct Use of Geothermal Energy: Global Market Scan; Unpublished report commissioned by Latrobe Valley Authority; Latrobe Valley Authority: Morwell, VIC, Australia, 2021. [Google Scholar] [CrossRef]
  10. Wickham, H. ggplot2: Elegant Graphics for Data Analysis; Springer: New York, NY, USA, 2016. [Google Scholar]
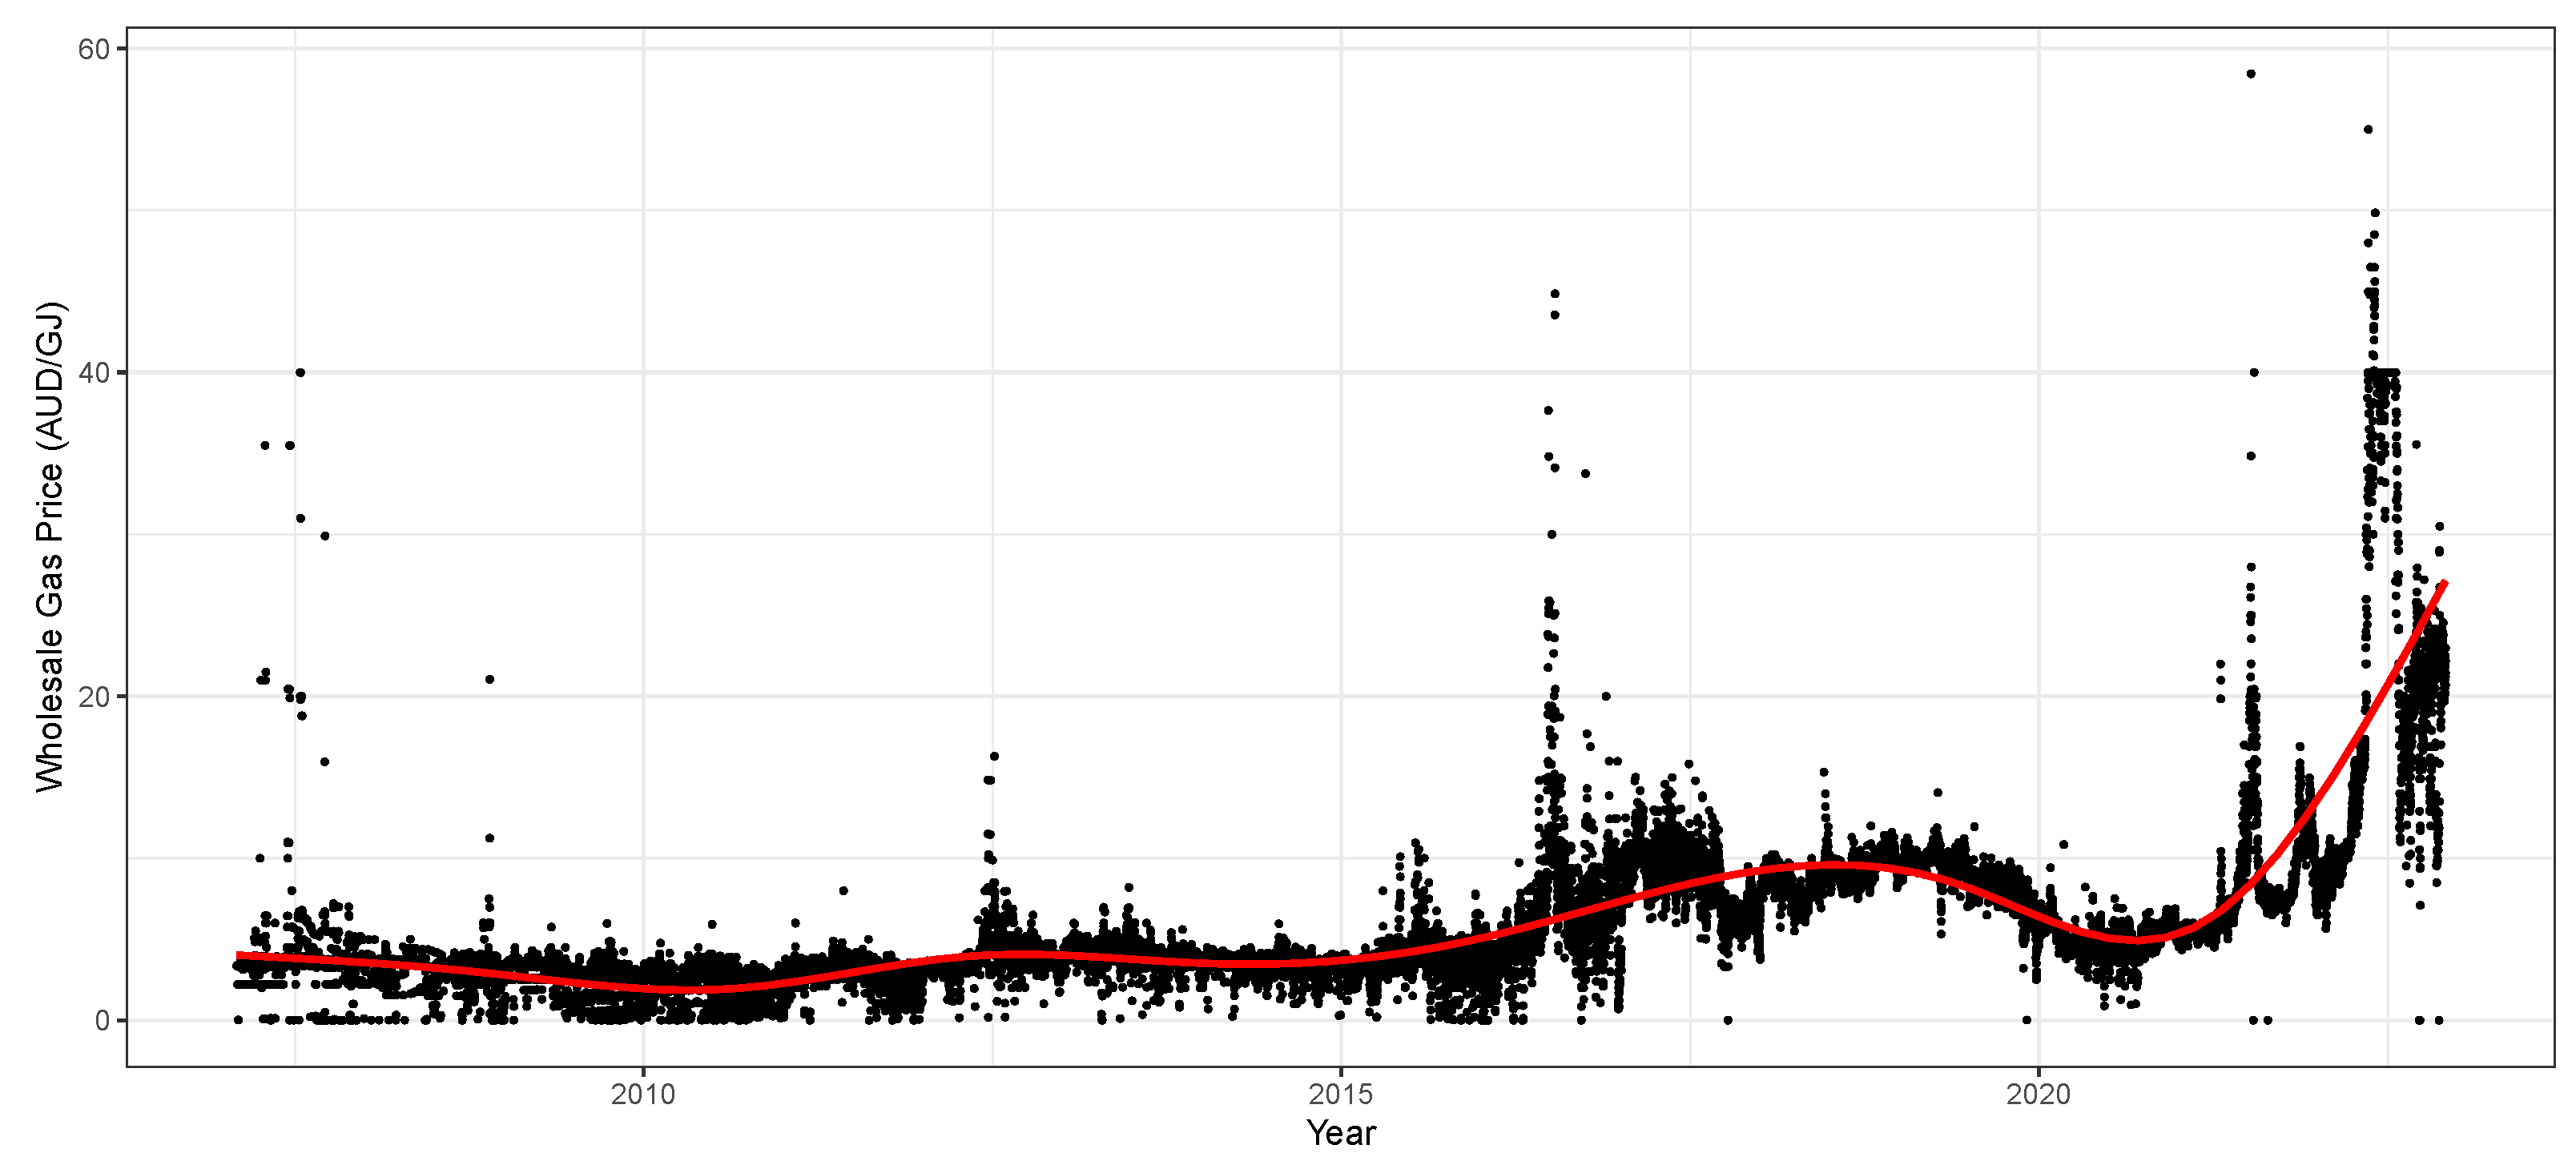
  11. Australian Energy Market Operator. DWGM Prices and Demand. Available online: https://aemo.com.au/energy-systems/gas/declared-wholesale-gas-market-dwgm/data-dwgm/vic-wholesale-price-withdrawals (accessed on 22 December 2022).
  12. Toth, A.; Lund, J.; Huttrer, G.; Fenerty, D. Current world situation for geothermal energy production, based on WGC2020+1 reports from 88 countries. In Proceedings of the European Geothermal Congress, Berlin, Germany, 17–21 October 2022. [Google Scholar]
  13. Iftekhar, M.S.; Blackmore, L.; Fogarty, J. Non-residential demand for recycled water for outdoor use in a groundwater constrained environment. Resour. Conserv. Recycl. 2021, 164, 105168. [Google Scholar] [CrossRef]
  14. Pujol, M.; Ricard, L.P.; Bolton, G. 20 years of exploitation of the Yarragadee aquifer in the Perth Basin of Western Australia for direct-use of geothermal heat. Geothermics 2015, 57, 39–55. [Google Scholar] [CrossRef]
  15. Beardsmore, G.R.; Davidson, C.; Payne, D.; Pujol, M.; Richard, L. Australia—Country Update. In Proceedings of the World Geothermal Congress 2020+1, Reykjavik, Iceland, April–October 2021. [Google Scholar]
  16. Burns, K.L.; Weber, C.; Perry, J.; Harrington, H.J. Status of the Geothermal Industry in Australia. In Proceedings of the World Geothermal Congress, Kyushu-Tohoku, Japan, 28 May–10 June 2000. [Google Scholar]
  17. Australian Energy Regulator. State of the Energy Market 2007—Chapter 11 Gas Retail Markets. Available online: https://www.aer.gov.au/system/files/Chapter%2011%20Gas%20retail%20markets%202007.pdf (accessed on 16 January 2023).
  18. Chopra, P.N. Status of the Geothermal Industry in Australia, 2000–2005. In Proceedings of the World Geothermal Congress 2005, Antalya, Turkey, 24–29 April 2005. [Google Scholar]
  19. Beardsmore, G.R.; Hill, A.J. Australia–Country Update. In Proceedings of the World Geothermal Congress, Bali, Indonesia, 25–29 April 2010. [Google Scholar]
  20. Burns, K.L.; Creelman, R.A.; Buckingham, N.W.; Harrington, H.J. Geothermal Development in Australia. In Proceedings of the World Geothermal Congress, Florence, Italy, 18–31 May 1995. [Google Scholar]
  21. Jenkin, J.J. Underground Water in East Gippsland; Underground Water Investigation Report; Department of Mines, Victoria Geological Survey: Melbourne, VIC, Australia, 1962; Volume 6. [Google Scholar]
  22. King, R.L.; Ford, A.J.; Stanley, D.R.; Kenley, P.R.; Cecil, M.K. Geothermal Resources of Victoria; Technical Report; Department of Industry, Technology and Resources and the Victorian Solar Energy Council: Melbourne, VIC, Australia, 1987.
  23. Driscoll, J. Geothermal Prospectivity of Onshore Victoria, Australia; Victorian Initiative for Minerals and Petroleum Report 85; Department of Primary Industries: Melbourne, VIC, Australia, 2006.
  24. O’Neill, C.D.; Hocking, M.J.; Riley, C.P. Mapping the Geothermal Potential of Cenozoic Aquifers in Gippsland, Victoria; Geological Survey of Victoria, Department of Jobs, Precincts and Regions: Melbourne, VIC, Australia, 2022.
  25. Rawling, T.J.; Sandiford, M.; Beardsmore, G.R.; Quenette, S.; Goyen, S.H.; Harrison, B. Thermal insulation and geothermal targeting, with specific reference to coal-bearing basins. Aust. J. Earth Sci. 2013, 60, 817–830. [Google Scholar] [CrossRef]
  26. GHD. Victorian Aquifer Framework—Updates for Seamless Mapping of Aquifer Surfaces; Technical Report; Victorian Department of Sustainability and Environment: Melbourne, VIC, Australia, 2012.
  27. Southern Rural Water. Gippsland Groundwater Atlas; Southern Rural Water: Maffra, VIC, Australia, 2012; Available online: https://www.srw.com.au/sites/default/files/documents/2022-05/GGA_SmallSize-1.pdf. (accessed on 11 January 2023).
  28. Rockwater Pty Ltd. Gippsland Regional Aquatic Centre Geothermal Assessment; Unpublished Technical Report; Latrobe City Council: Morwell, VIC, Australia, 2018.
  29. Australian Government Bureau of Meteorology. Monthly Climate Statistics Morwell. 2023. Available online: http://www.bom.gov.au/climate/averages/tables/cw_085280.shtml (accessed on 8 February 2023).
  30. Latrobe Valley Events Precinct. Gippsland Regional Aquatic Centre. Available online: https://latrobevalleyeventsprecinct.com.au/venues/gippsland-regional-aquatic-centre/ (accessed on 11 January 2023).
  31. Pujol, M.; Rockwater Pty Ltd., Jolimont, WA, Australia. Personal Communication. 2022.
  32. Peirson, G.; Brown, R.; Easton, S.A.; Pinder, S.; Howard, P. Business Finance, 12th ed.; McGraw-Hill Education (Australia) Pty Ltd.: Haymarket, NSW, Australia, 2014. [Google Scholar]
  33. Aldersey-Williams, J.; Rubert, T. Levelised cost of energy—A theoretical justification and critical assessment. Energy Policy 2019, 124, 169–179. [Google Scholar] [CrossRef]
  34. Australian Government Department of Industry, Science, Energy and Resources. National Greenhouse Accounts Factors—Australian National Greenhouse Accounts; Technical Report, Commonwealth of Australia; Australian Government Department of Industry, Science, Energy and Resources: Canberra, ACT, Australia, 2021.
  35. Grant Thornton. Renewable Energy Discount Rate Survey Results—2018; Technical Report; Grant Thornton: London, UK, 2019. [Google Scholar]
  36. Reserve Bank of Australia. Inflation Target. Available online: https://www.rba.gov.au/inflation/inflation-target.html (accessed on 21 December 2022).
  37. Australian Energy Market Operator. Gas Statement of Opportunities. Available online: https://aemo.com.au/-/media/files/gas/national_planning_and_forecasting/gsoo/2022/2022-gas-statement-of-opportunities.pdf (accessed on 18 January 2012).
Figure 1. OzTemp map of predicted temperature of the Australian crust at 5 km depth. Dark shading: State of Victoria. White dots: State capital cities. TAS—Tasmania; ACT—Australian Capital Territory.
Energies 16 02134 g001
Figure 2. Natural gas wholesale prices (AUD/GJ) in Victoria since records began in 2007. Red line shows a smoothed fit to the data using the LOESS method [10,11].
Energies 16 02134 g002
Figure 3. The state of Victoria showing regional towns (black dots), offshore gas fields (red polygons), gas distribution pipelines (red lines), and basins containing warm groundwater (yellow—Gippsland Basin, green—Otway Basin, pink—Murray Basin).
Energies 16 02134 g003
Figure 4. Temperature range at the top of the Lower Tertiary Aquifer (LTA). Dashed oval highlights the location of Traralgon, above a region with some of the highest LTA temperatures [24].
Energies 16 02134 g004
Figure 5. Depth to the top of the Lower Tertiary Aquifer (LTA). Dashed oval highlights the location of Traralgon, where the LTA lies approximately 620 m below ground level [24,28].
Energies 16 02134 g005
Figure 6. Photo of the Gippsland Regional Aquatic Centre in Traralgon [30].
Energies 16 02134 g006
Figure 7. A snapshot from the SCADA platform showing the heating system of the GRAC, illustrating the geothermal heat supply with three backup natural gas furnaces. The geothermal source is providing 100% of the heat requirement of the GRAC in the example shown; the status of all three gas furnaces is “off”.
Energies 16 02134 g007
Figure 8. GRAC electrical power vs. thermal power regression using April to July 2022 data. As expected, higher thermal power use corresponded to higher electrical power. This regression was used to estimate the electricity usage of the geothermal pump.
Energies 16 02134 g008
Figure 9. Weekly net cost savings over the sample period. Red line shows a smoothed fit to the data using the LOESS method.
Energies 16 02134 g009
Figure 10. Weekly avoided greenhouse gas emissions over the sample period. Red line shows a smoothed fit to the data using the LOESS method.
Energies 16 02134 g010
Table 1. Key economic indicators of the geothermal system.
Economic IndicatorUnitsValues
Net Present Value (NPV)AUDAUD 9,493,003
Internal Rate of Return (IRR)%23%
Levelized Cost of Heat (Undiscounted Heat) (GJ)AUDAUD 7.1904
Levelized Cost of Heat (Undiscounted Heat) (kWh)AUDAUD 0.0259
Levelized Cost of Heat (Discounted Heat) (GJ)AUDAUD 19.1612
Levelized Cost of Heat (Discounted Heat) (kWh)AUDAUD 0.0690
Breakeven Cost of Heat (GJ)AUDAUD 10.8033
Breakeven Cost of Heat (kWh)AUDAUD 0.0389
Availability Factor%95.04%
Avoided Greenhouse Gas Emissionskg.CO2-e/year913,935
Payback Periodyears4.94
Table 2. Sensitivity analysis assumptions.
Economic IndicatorUnitsLow ValueBase ValueHigh Value
Discount Rate% pa4.00%8.00%12.00%
Inflation (General)% pa1.25%2.50%3.75%
Inflation (Gas)% pa2.50%5.00%7.50%
Inflation (Electricity)% pa2.50%5.00%7.50%
Project Lifeyears153045
Table 3. Summary results of sensitivity analysis.
1. Discount Rate (%)
Economic IndicatorUnitsLow ValueBase ValueHigh Value
Net Present Value (NPV)$$19,480,866$9,493,003$4,728,568
Internal Rate of Return (IRR)%23%23%23%
Payback Periodyears4.944.944.94
Levelized Cost of Heat (Undiscounted) (GJ)$$8.4943$7.1904$6.5681
Levelized Cost of Heat (Discounted) (GJ)$$14.7368$19.1612$24.4618
2. Inflation (Gas) (%)
Economic IndicatorUnitsLow ValueBase ValueHigh Value
Net Present Value (NPV)$$5,686,879$9,493,003$15,311,243
Internal Rate of Return (IRR)%20%23%26%
Payback Periodyears5.334.944.62
Levelized Cost of Heat (Undiscounted) (GJ)$$7.1904$7.1904$7.1904
Levelized Cost of Heat (Discounted) (GJ)$$19.1612$19.1612$19.1612
3. Project Life (years)
Economic IndicatorUnitsLow ValueBase ValueHigh Value
Net Present Value (NPV)$$4,203,025$9,493,003$13,004,085
Internal Rate of Return (IRR)%21%23%23%
Payback Periodyears4.944.944.94
Levelized Cost of Heat (Undiscounted) (GJ)$$6.5126$7.1904$7.5720
Levelized Cost of Heat (Discounted) (GJ)$$22.8260$19.1612$18.7606
Disclaimer/Publisher’s Note: The statements, opinions and data contained in all publications are solely those of the individual author(s) and contributor(s) and not of MDPI and/or the editor(s). MDPI and/or the editor(s) disclaim responsibility for any injury to people or property resulting from any ideas, methods, instructions or products referred to in the content.

