1. Introduction
In this article, we discuss the relevant topic of improving the performance of contemporary electronic/microfluidic devices, along with the more general problem of high-density heat flux removal. The need to boost the performance of electronic devices at the same time as reducing their dimensions has led to an intense increase in the heat flux density generated by them. According to existing forecasts, the average heat flux density from the surface of microprocessors will reach 2.5 MW/m
2 by 2025 [
1]. The problem, faced by thermophysics researchers, of ensuring reliable heat transfer from thermally stressed elements of devices is further complicated by the mastery of modern processor technologies’ using 4 nm and lower processes.
Thus, the wide variety of design features for heat-transfer devices and of temperature-time conditions for heat release motivates the search for new approaches, as well as attempts to improve the capabilities of existing thermophysical methods [
2]. The rapid development of surface modification technologies at micro- and nanoscales [
3], along with coolant fragmentation approaches [
4], which are focused on solving the problem under discussion, have opened up new possibilities for the removal of high-density heat fluxes. In a recent review of passive heat-transfer intensification methods, about 100 design variants for increasing the thermal performance of heat exchange systems from tens of a percentage to several hundred percent are presented according to the results of numerical modelling and experiments [
5]. In general, solutions to the problem of ensuring reliable heat transfer in processes involving powerful local heat generation are not limited to modifying the heating surface, channel or pipe.
As well as passive approaches, a number of active methods of heat-transfer intensification have also found application [
6,
7]. However, such systems require the installation of additional equipment (pumps, nozzles, electromagnetic field generators, etc.), which is not always possible under conditions of limited space.
One of the recent classifications of heat-transfer enhancement methods distinguishes eight basic types, including both active and passive approaches [
8]. Despite a number of limitations inherent in the so-classified methods, the classification excludes the development of new types of substances that were not previously used as a heat carrier. Furthermore, from an engineering point of view, replacing the coolant is not a difficult task, because it does not require a change in the design of the heat exchange equipment.
While the publication of works investigating heat transfer to nanofluids comprising a new class of coolants continues [
9,
10,
11,
12], we have identified promising partially miscible mixtures as having a lower critical solution temperature (LCST) that falls outside the mentioned classification [
13]. Superheating an initially stable homogeneous liquid mixture with respect to the liquid–liquid spinodal produces a short-term unstable state. It is characterised by a significant increase in the energy released during the decay of such an unstable mixture into two separated liquid phases. Here, the primary mechanism is spinodal decomposition [
14,
15,
16].
As an example, let us consider the flow of a coolant comprised of an aqueous solution with an LCST. In the course of its flow, the temperature of the channel wall rises to values exceeding the LCST. As a result of the fact that the turbulisation of the flow accompanies the spinodal decomposition of an unstable mixture, the heat-transfer coefficient from the wall to the liquid naturally increases [
17,
18,
19]. For example, under stationary flow conditions, when a liquid in a stable single-phase state at a given flow rate was fed into a 22 × 2 × 0.4 mm microchannel fitted with a titanium heater and temperature resistance sensors, it was possible to achieve an intensification of heat transfer up to 2.5 times compared with that of a single-phase flow of the same system, up to 1.6 times greater compared with water, and up to 2.2 times greater compared with a two-component ethylene glycol-water solution under the same initial conditions [
17,
18]. In the described experiments, the heat flux density varied from 0.025 MW/m
2 to 1.8 MW/m
2. The mass flow rate of the coolant varied from 208.4 kg/(m
2∙s) to 2841 kg/(m
2∙s). Studies on the heat transfer to a mixture in a microchannel with modified heating surfaces show that the intensification can reach 1.8 at
q = 5 MW/m
2 and
m = 600 kg/(m
2∙s) [
19]. The object of study was an aqueous solution of triethylamine (TEA), whose properties in the vicinity of LCST have been well studied [
20,
21]. Along with aqueous solutions’ having an LCST, mixtures with an upper critical solution temperature (UCST) were considered as heat carriers. These included a mixture of acetone–hexadecane quenched in a micro heat exchanger to induce spinodal decomposition [
22]. The heat-transfer augmentation reached 150% when phase separation occurred in microchannels. However, quasistationary research methods do not permit the monitoring of the intensity of heat transfer in the course of the superheating of the mixture or reaching superheat values corresponding to the relatively short lifetimes of a superheated (supercooled) system.
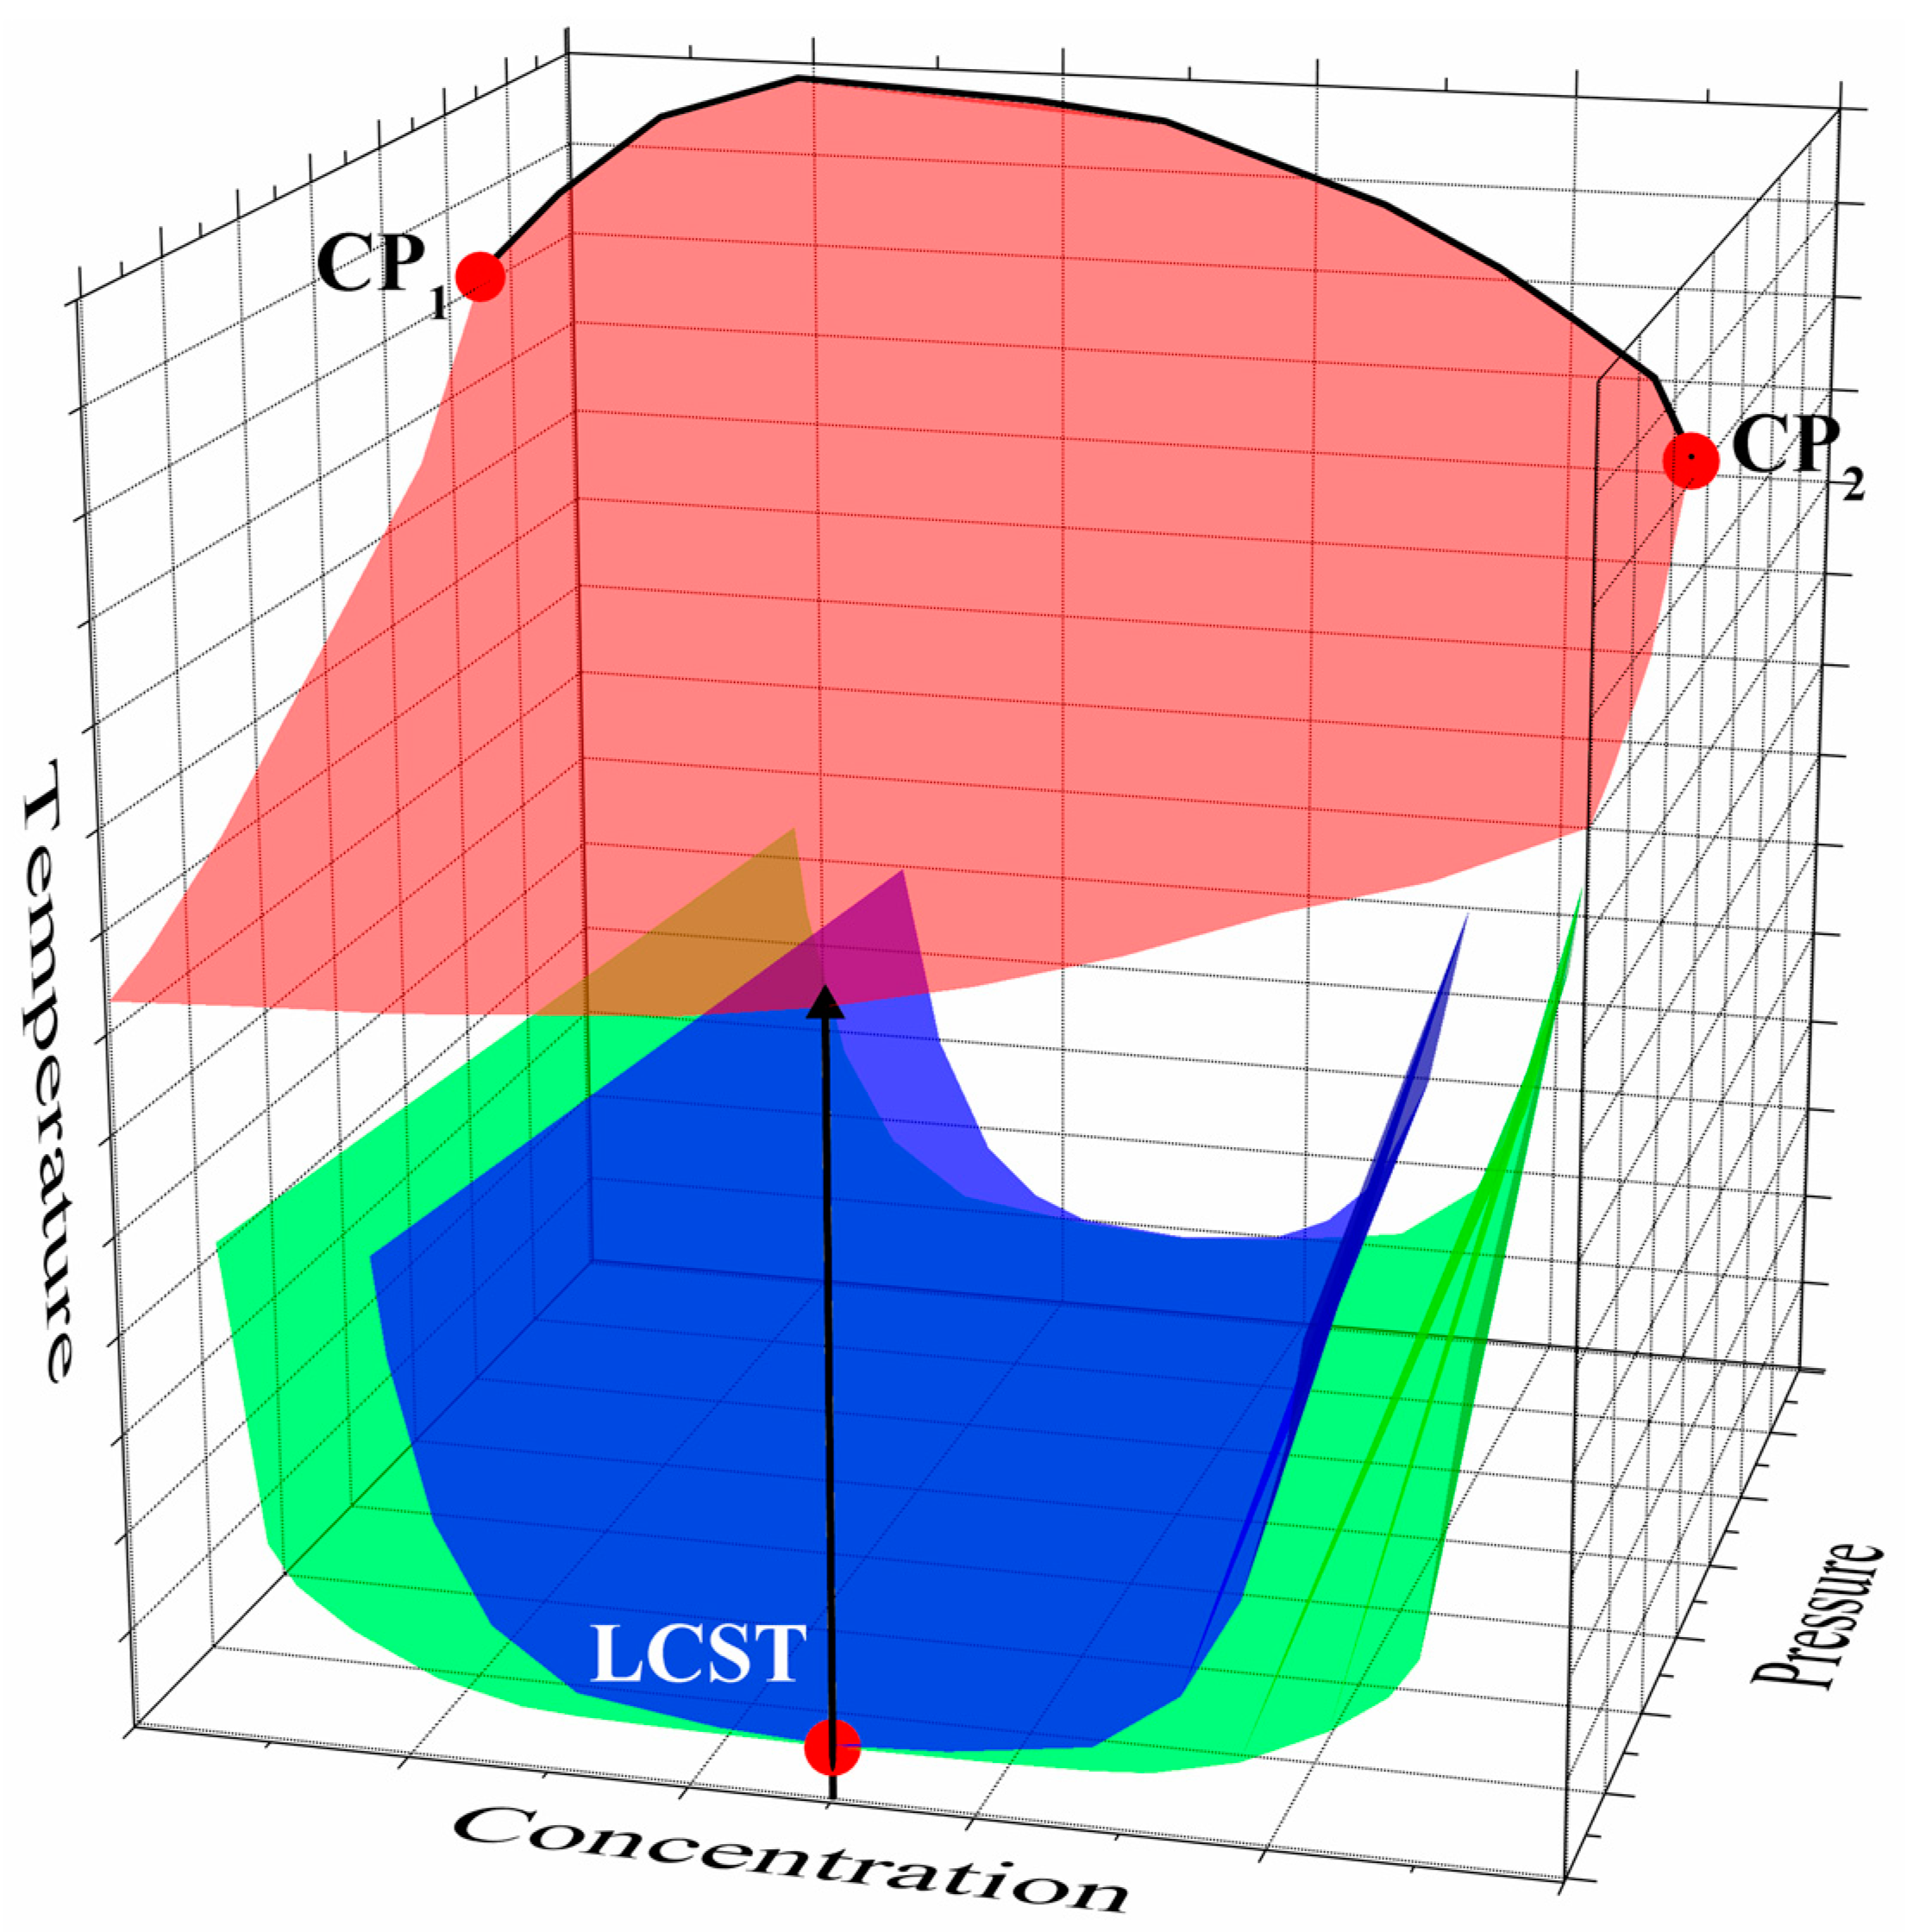
Here, we will take into account the following generally accepted fact: the stronger the impact on the system, the more distinct the readable response. In this regard, attention is drawn to the large extent of the area of unstable states of the solution; see
Figure 1. In order to have a more significant thermal effect accompany spinodal decay by increasing the degree of superheating with respect to the diffusion spinodal, the relatively low-boiling TEA can be replaced with a higher boiling component to increase the penetration rate into the region limited by the spinodal. By analogy with the deep superheating of mixtures relative to the liquid–vapour equilibrium line [
23], this approach will allow us to increase the degree of superheat with respect to the temperature of the attainable superheat of water at a given pressure
T*(
p) and heating rate [
24]. By focusing on the transition to the region of supercritical pressures (at
p >
pc), it will be possible to overcome the limitations inherent in boiling flows [
25]. In this case, the temperature region of study will be formally limited by the thermal stability of the liquid or structural material [
26].
Thus, the present work sets out to study the superheat of mixtures with LCST, along with the thermal effect characterising the decay of an unstable mixture as applicable to the problem of the removal of high-density heat fluxes. The study was carried out by the method of controlled pulse heating, updated versions of which have been described elsewhere [
27,
28]. The object of study was the aqueous solutions of polypropylene glycol-425 (hereafter, PPG-425). The components of the mixture are nontoxic, are easily available and can be used in relatively large volumes. The mixture is isopycnic, which eliminates the influence of the Archimedes’s principle on the process of phase separation. The LCST of the mixture is in the area convenient for study, namely in the region of 50–51 °C. Our data showed that the temperature of the attainable superheat of PPG-425 exceeds the corresponding temperature of TEA by 200 degrees and that PPG-425 has a lower critical pressure. At the same time, the viscosity of the PPG-425 solution exceeds the viscosity of the TEA solution by approximately 1.5 times (20 wt.% of PPG in water) and 2.5 times (30 wt.% of PPG) at room temperature and comparable concentrations [
29,
30].
2. Background
According to common practice, measurements of the thermal properties of liquid mixtures are carried out in absolutely stable states that indefinitely persist with unchanged external parameters. Indeed, such an approach is perfectly acceptable for fully miscible systems. However, an increase in differences in the properties of the components (which is expressed in the deviation of the values
HE ≠ 0,
VE ≠ 0 from zero) is accompanied by a complication of the mixture phase diagram, particularly one involving a narrowing of the stability region of the single-phase liquid state. As a result, extended sections of the phase diagram beyond the liquid–liquid equilibrium line, particularly those above the liquid–liquid spinodal of the mixture, are practically unexplored. We assume the fundamental measurability of heat transfer to the solution in short-lived states (see the hypotheses tested below), owing to the kinetic difficulty of the initial stage of the decomposition of a homogeneous system. By “short-lived systems”, we mean mixtures in not-fully-stable states superheated relative to the liquid–liquid equilibrium line and/or the liquid–vapour equilibrium line, as well as those in thermodynamically unstable states superheated relative to the liquid–liquid spinodal (diffusion spinodal [
31]).
By way of an example,
Figure 1 depicts a phase diagram of a solution with LCST. The scheme incorporates lines (surfaces) are characteristic of short-lived systems. It also shows the course of temperature change in the experiment on the rapid transition of matter to an unstable state. Here, we refer to the lines of the attainable superheat of the solution [
23] and the approximation for the liquid–vapour critical curve [
32] obtained in the course of high-speed experiments. The lines of the attainable superheat of the mixture, in other words, the dependence of its spontaneous boiling-up temperature on the pressure
T*(
p), serve as an approximation from below for a mechanical spinodal that is unattainable under experimental conditions.
There are two possible approaches to constructing such a phase diagram of a mixture with LCST. The first approach is based on an idealised system where an attempt is made to exclude the relaxation of the composition of the system that accompanies heating. In our case, this involves the spinodal decomposition and possible thermal decomposition of PPG in the region of low water content in the solution. This approach is applicable to theoretical constructions. In the experimental context, this requirement is equivalent to small characteristic times (very high heating rates), and this requirement is inappropriate for a number of reasons. The second approach involves the direct experimental study of a real system, where although the degree of its decomposition is not zero, it is minimised thanks to an adequate choice of heating parameters.
The study of the properties of not-fully-stable and unstable mixtures is an ambitious and large-scale scientific task, involving experimental difficulties of a methodological nature. In this regard, we may note two circumstances. First, an increase in the depth of penetration into the area of not-fully-stable and unstable states is accompanied by a decrease in the lifetime of the system; this circumstance imposes strict restrictions on the speed of the research method, which includes methods for creating an unstable state and subsequent measurements. Second, the rapid transition of the system beyond the stability boundary is generally accompanied by metastability and nonequilibrium, which exhibit several signs, each corresponding to its own relaxation mechanism and having its own characteristic times. If a homogeneous solution can be transferred to the region beyond the diffusion spinodal, the most natural relaxation mechanism is a phase transition involving unstable (with respect to concentration fluctuations) states, i.e., spinodal decomposition. The deeper the entry into the region of unstable states, the smaller the critical wavelength of the disturbances λ
c, which are amplified by the reaction of the system itself [
16]. Following the author of [
33], we assume the establishment during the time
t1 <<
t2 of partial (excluding concentration) local equilibrium in the system. Here, the variable
t1 refers to short-wave fluctuations of the scale
l1 << λ
c. The relaxation time
t1 turns out to be much less than the relaxation time
t2 for the scale
l2 ≥ λ
c. This circumstance allows us to introduce local thermodynamic values, specifically temperature and pressure, for
t1 <<
t2.
After we take these considerations into account, it would be interesting to penetrate deep into the region of the unstable states of an essentially superheated solution in order to trace its relaxation processes. The approach is based on our experience of the rapid measurements of not-fully-stable systems. The described technique for processing the primary data of the experiment can be used to reveal changes in the heat flux that accompanies small changes in the properties of the liquid over a wide range of superheating degrees, as well as pressures and heating rates. This technique can also be applied to estimate the position of the unknown elements of the extended T-c-p phase diagram, elements that are sufficiently high relative to the liquid–liquid equilibrium line, as well as to resolve the details of heat transfer in a significantly superheated solution, including estimating the temperature-time parameters necessary to trigger the spinodal decomposition and transition to the level of enhanced heat transfer.
4. Experimental Method and Measurement Procedure
The approach to the study of heat transfer to partially miscible mixtures in the region of not-fully-stable and unstable states is set to minimise the product of V∙t, where V is the volume of the liquid involved in heating and t is the heating time. The implementation of the approach implies the use of a rapid technique for the creation of such short-term states that also allows the system to respond to small changes in an experimental parameter. Such parameters may include the value of excess pressure in the system, the concentration of one of the components of the mixture or the degree of superheating relative to the diffusion spinodal. A suitable way for implementing this technique uses the pulse heating of a wire probe (resistance thermometer). The technique is tuned to detect changes in the intensity of heat transfer from the probe heater to the liquid under study at specified heat release parameters. These parameters are preserved over the entire series of comparative experiments. The response function is the temperature change of the probe in time T(t) at a given heat release power.
The installation comprises a hardware and software complex that implements the control of the current
I(
t) passing through a wire heater or the power
P(
t) dissipated on the probe during nonstationary heating. The installation is based on a high-speed analogue device, which is controlled by an external rectangular voltage pulse. The primary values recorded in the experiment are as follows: the voltage drop across the probe
U(
t) and the current
I(
t), passing through the standard resistance sequentially connected to the probe circuit, in the course of heating time
t [
27]. The software package allows for real-time tracking and for converting primary data, i.e., the record of power dissipated by the probe
P(
t) =
U(
t)∙
I(
t) and its resistance
R(
t) =
U(
t)/
I(
t). The change in the average integral temperature of the probe ∆
T(
t) =
T(
t) −
T0 is calculated on the basis of the thermometric calibration of platinum. The heat conduction mode as a characteristic of heat transfer in short-term heating experiments is defined as
α(
t) =
q(
t)/Δ
T(
t), where the heat flux density
q(
t) is a smooth function proportional to the heat release power
P(
t).
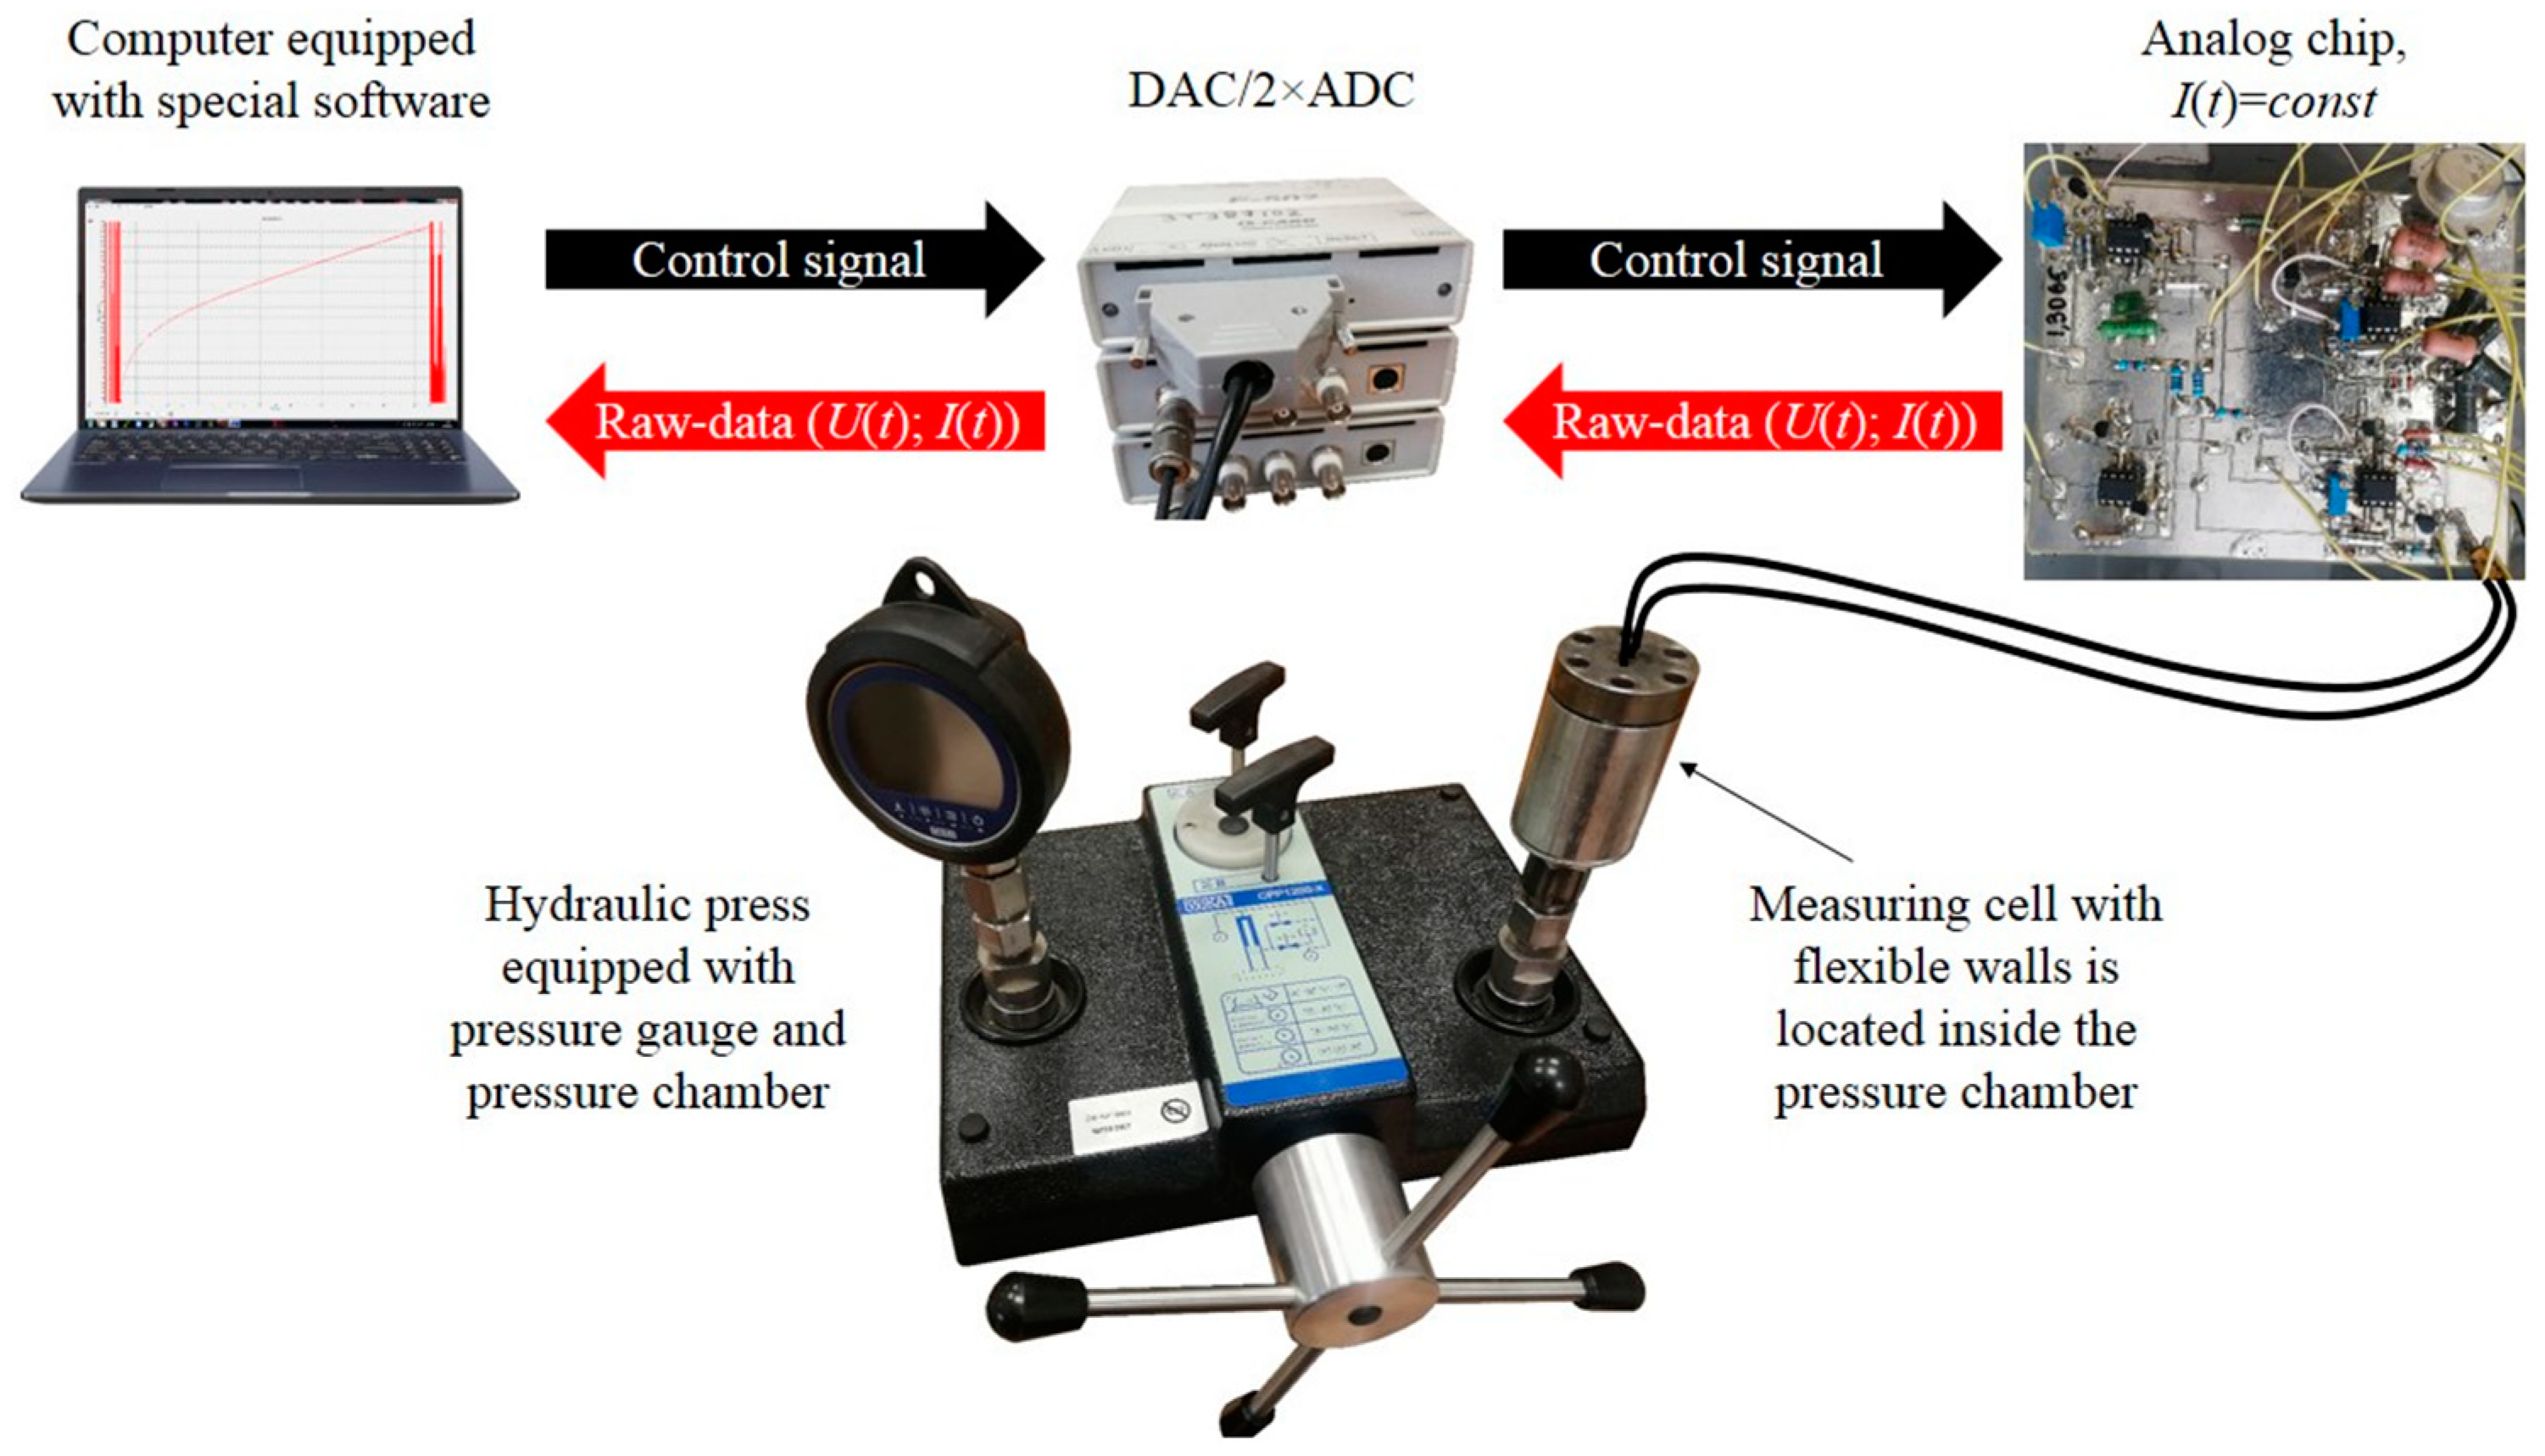
The architecture of the device is based on a PID controller and feedback system. After setting the number of links in the pulse (from 1 to 3), as well as their amplitude and the duration of heating, the specially developed software can be used to record the primary data of experiments in real time. In this way, the heating function of a wire heater can be adapted to solve a specific problem involving a nonlinear heat supply. Communication between the analogue and digital parts of the setup is carried out by using an ADC (analogue-to-digital converter)/DAC (digital-to-analogue converter) connection. A block diagram of the experimental setup is presented in
Figure 2. A detailed description of the architecture of the home-made analogue part of the experimental installation can also be found elsewhere [
34,
35]. The measuring cell containing both the test substance and the probe is placed in a pressure chamber. The flexible walls of the cell are made of silicone. Current leads are soldered into the chamber cover, which can withstand an excess pressure of more than 110 MPa. The relative measurement error of the primary data is 0.2%; the average integral temperature of the probe is 1%; the pressure is 0.025% [
27].
The high sensitivity of the method to changes in the phase state of the substance under study allows heat transfer in the single-phase state to be compared with various systems (including systems with LCST) at subcritical (
p <
pc) and supercritical (
p >
pc) pressures. On the same basis, the position of the line of attainable superheat
T*(
p <
pc) is determined [
23,
26]. Here,
T* is the temperature of spontaneous boiling up,
t* is the duration of the heating of the liquid from the initial state to the boiling-up onset. In turn, the approximation
T*(
p;
t*) at
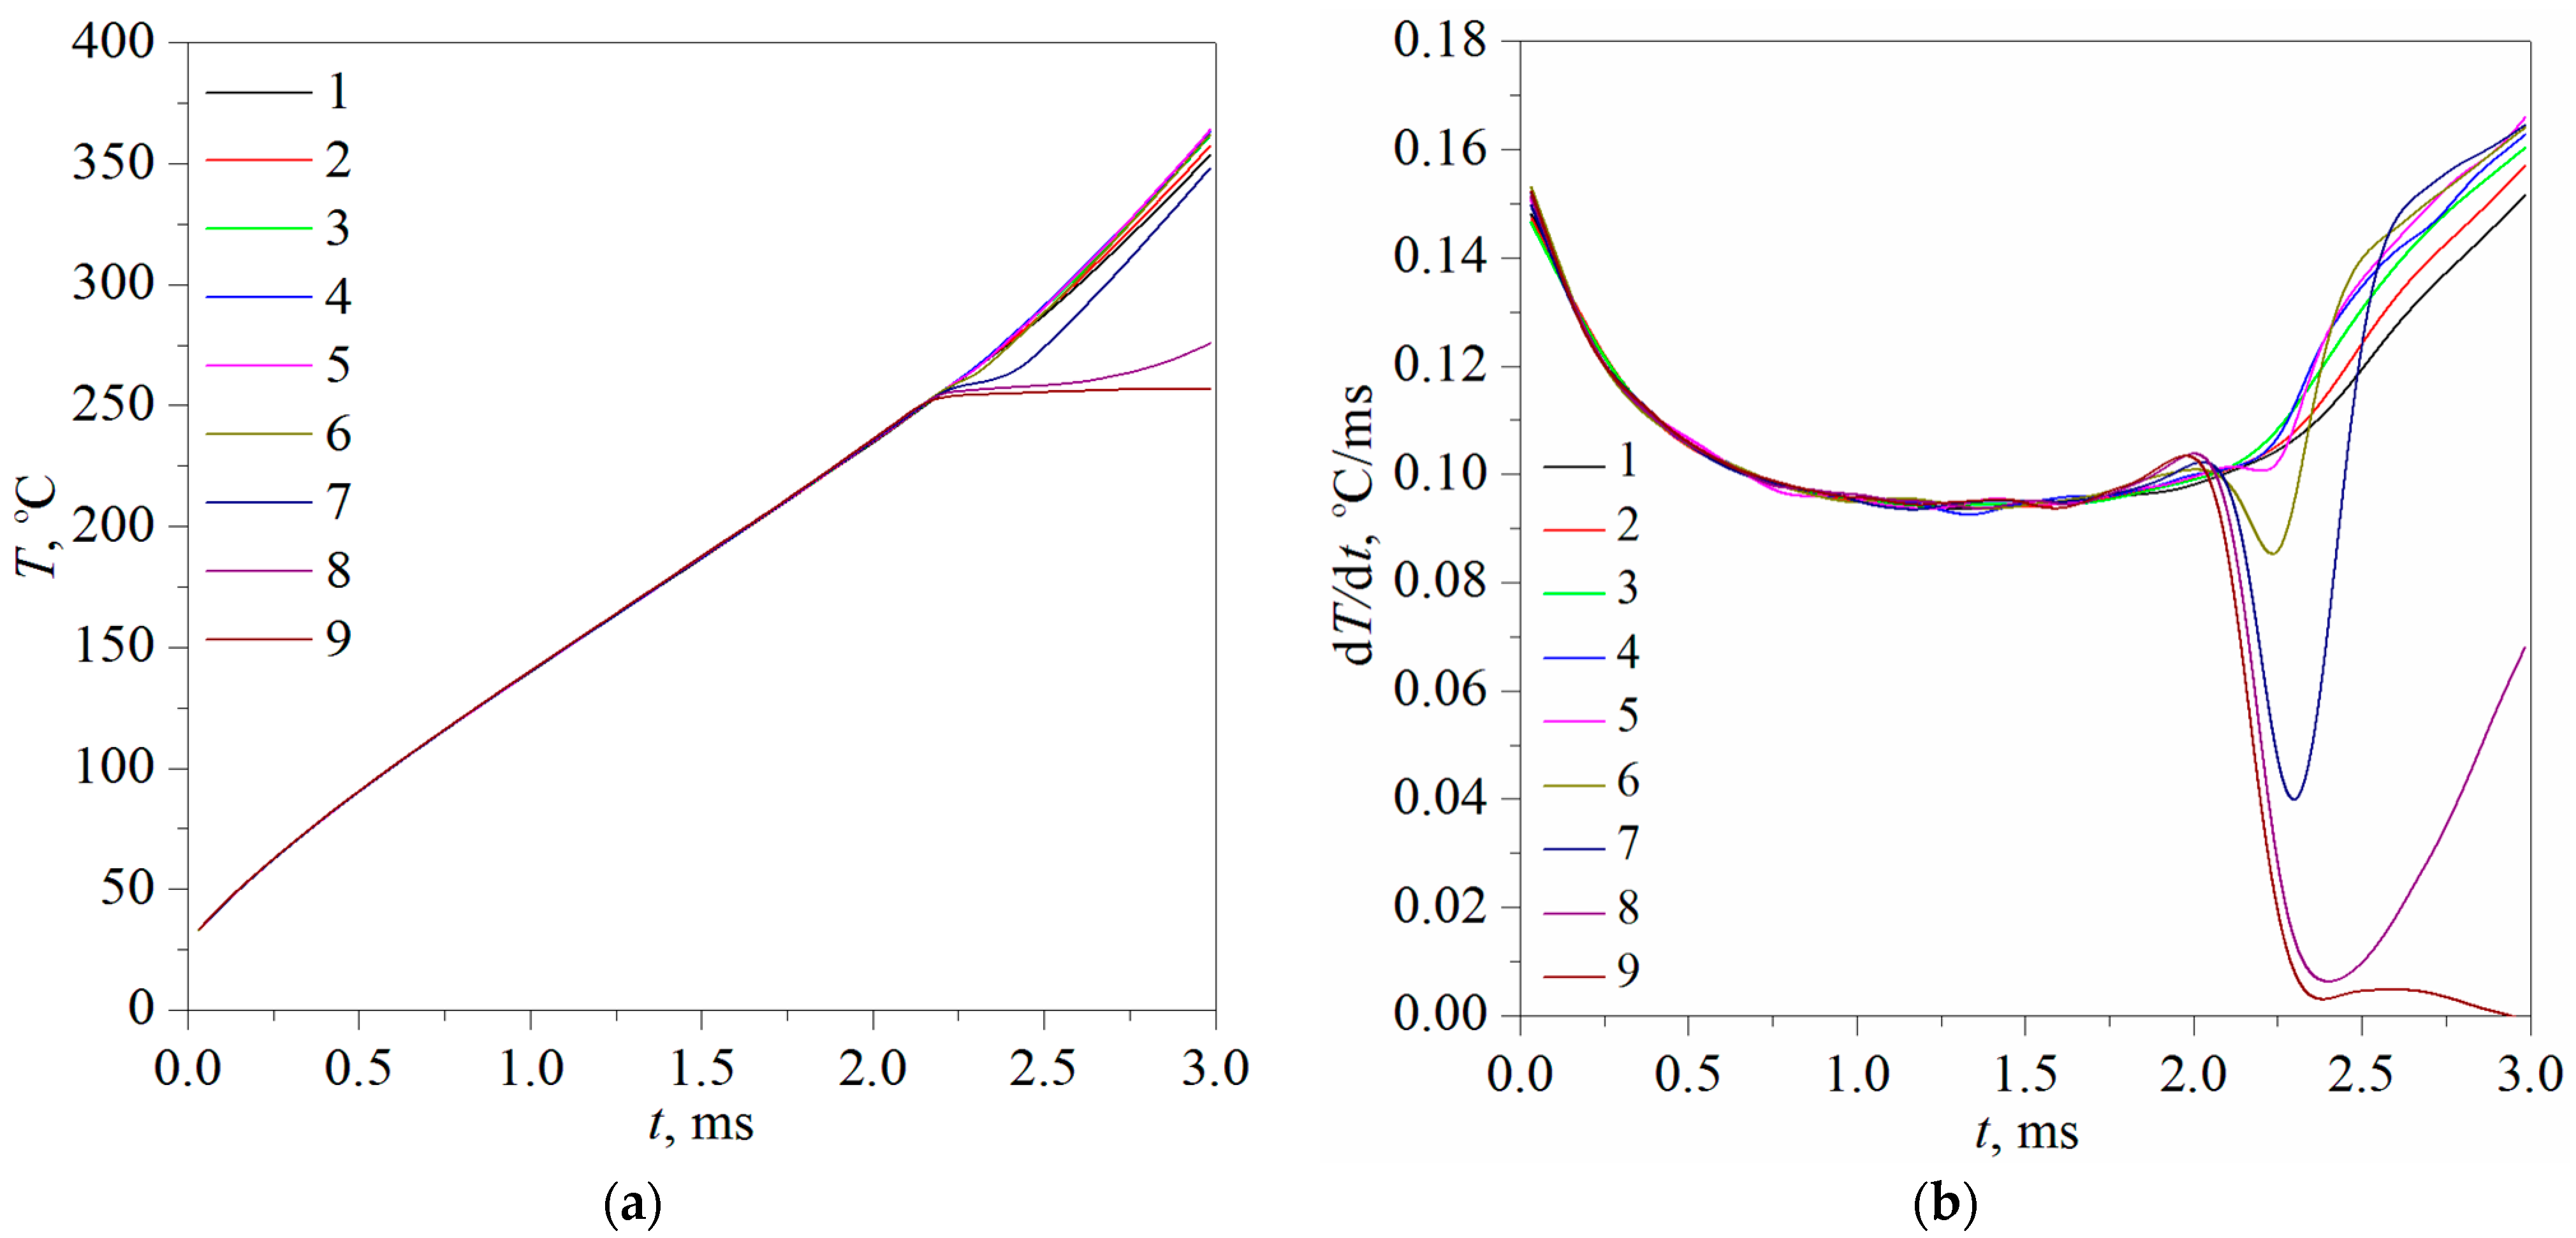
t* → 0 serves as an approximation of the mechanical spinodal of the liquid. The moment of spontaneous boiling up is marked by a characteristic response signal on the probe heating curve; see
Figure 3.
Following the course of the liquid–vapour equilibrium line, the value
T* increases with increasing pressure, while the line of attainable superheat
T*(
p) ends at the critical point. It is significant that the transition to the area of supercritical pressures is accompanied by a change in the polarity of the signal response at
p ≈
pc [
23,
26]. Spontaneous boiling up manifests itself as a downward deviation of the temperature derivative with respect to time (see lines 4–9 in
Figure 3). This curve trend represents the release of latent heat of evaporation as a result of the formation of a new phase. The supercritical transition, conversely, is characterised by a threshold deterioration of heat transfer that is due to the loss of uniformity by the system and, as a consequence, an increase in the rate of temperature change (see lines 1–3 in
Figure 3). A discussion of the establishment of the mode of deteriorated heat transfer under the conditions of powerful heat release at supercritical pressures is presented elsewhere [
35,
36,
37]. Here, it is important to emphasise the applicability of the method of pulse heating, namely the effect of changing the polarity of the signal response, in order to assess the critical parameters of short-lived liquid–vapour systems.
Thanks to the relatively high
T*(
p) values of the pure components of the aqueous PPG-425 solution selected as the study object, it is possible to increase the degree of superheat relative to the liquid–liquid spinodal in order to have a significant thermal effect accompany the spinodal decomposition. Both components comprise readily available and nontoxic substances. The critical point of the partially miscible mixture is in the region of the temperature-concentration phase diagram, convenient for research [
38]. The mixing of the components takes place at room temperature, which corresponds to the region of their full compatibility. A scheme of the phase diagram of the solution, including an evaluation for the diffusion spinodal, is presented elsewhere [
39].
5. Results
The hypothesis of both the short-term existence of a mixture in the region of thermodynamically unstable states and the fundamental measurability of heat transfer to the mixture in this region was tested within the framework of pulse heating in the modes of constant current and constant heat dissipation power. The experiment parameter was the concentration of PPG-425 and excess pressure value.
The analysis of the primary experimental data was based on a procedure for differentiating the heating curves with respect to time and comparing them with the results obtained by heating water under the same conditions. This comparison was carried out in order to determine the moment of the onset of the relaxation of the unstable mixture into a stable two-phase state. As a result of the experiments on the controlled pulse heating of a wire heater, the possibility of superheating a two-component mixture by more than 100 degrees with respect to the liquid–liquid equilibrium line was confirmed. Both the existence of short-term states of the mixture and the measurement of its properties in the region of unstable states are shown to be possible. According to indirect data, the thermophysical properties of the system involved in the formation of the response signal (thermal conductivity, isobaric heat capacity and density) continuously change during the transition to the region of not-fully-stable and unstable states under conditions of short heating times and small sizes.
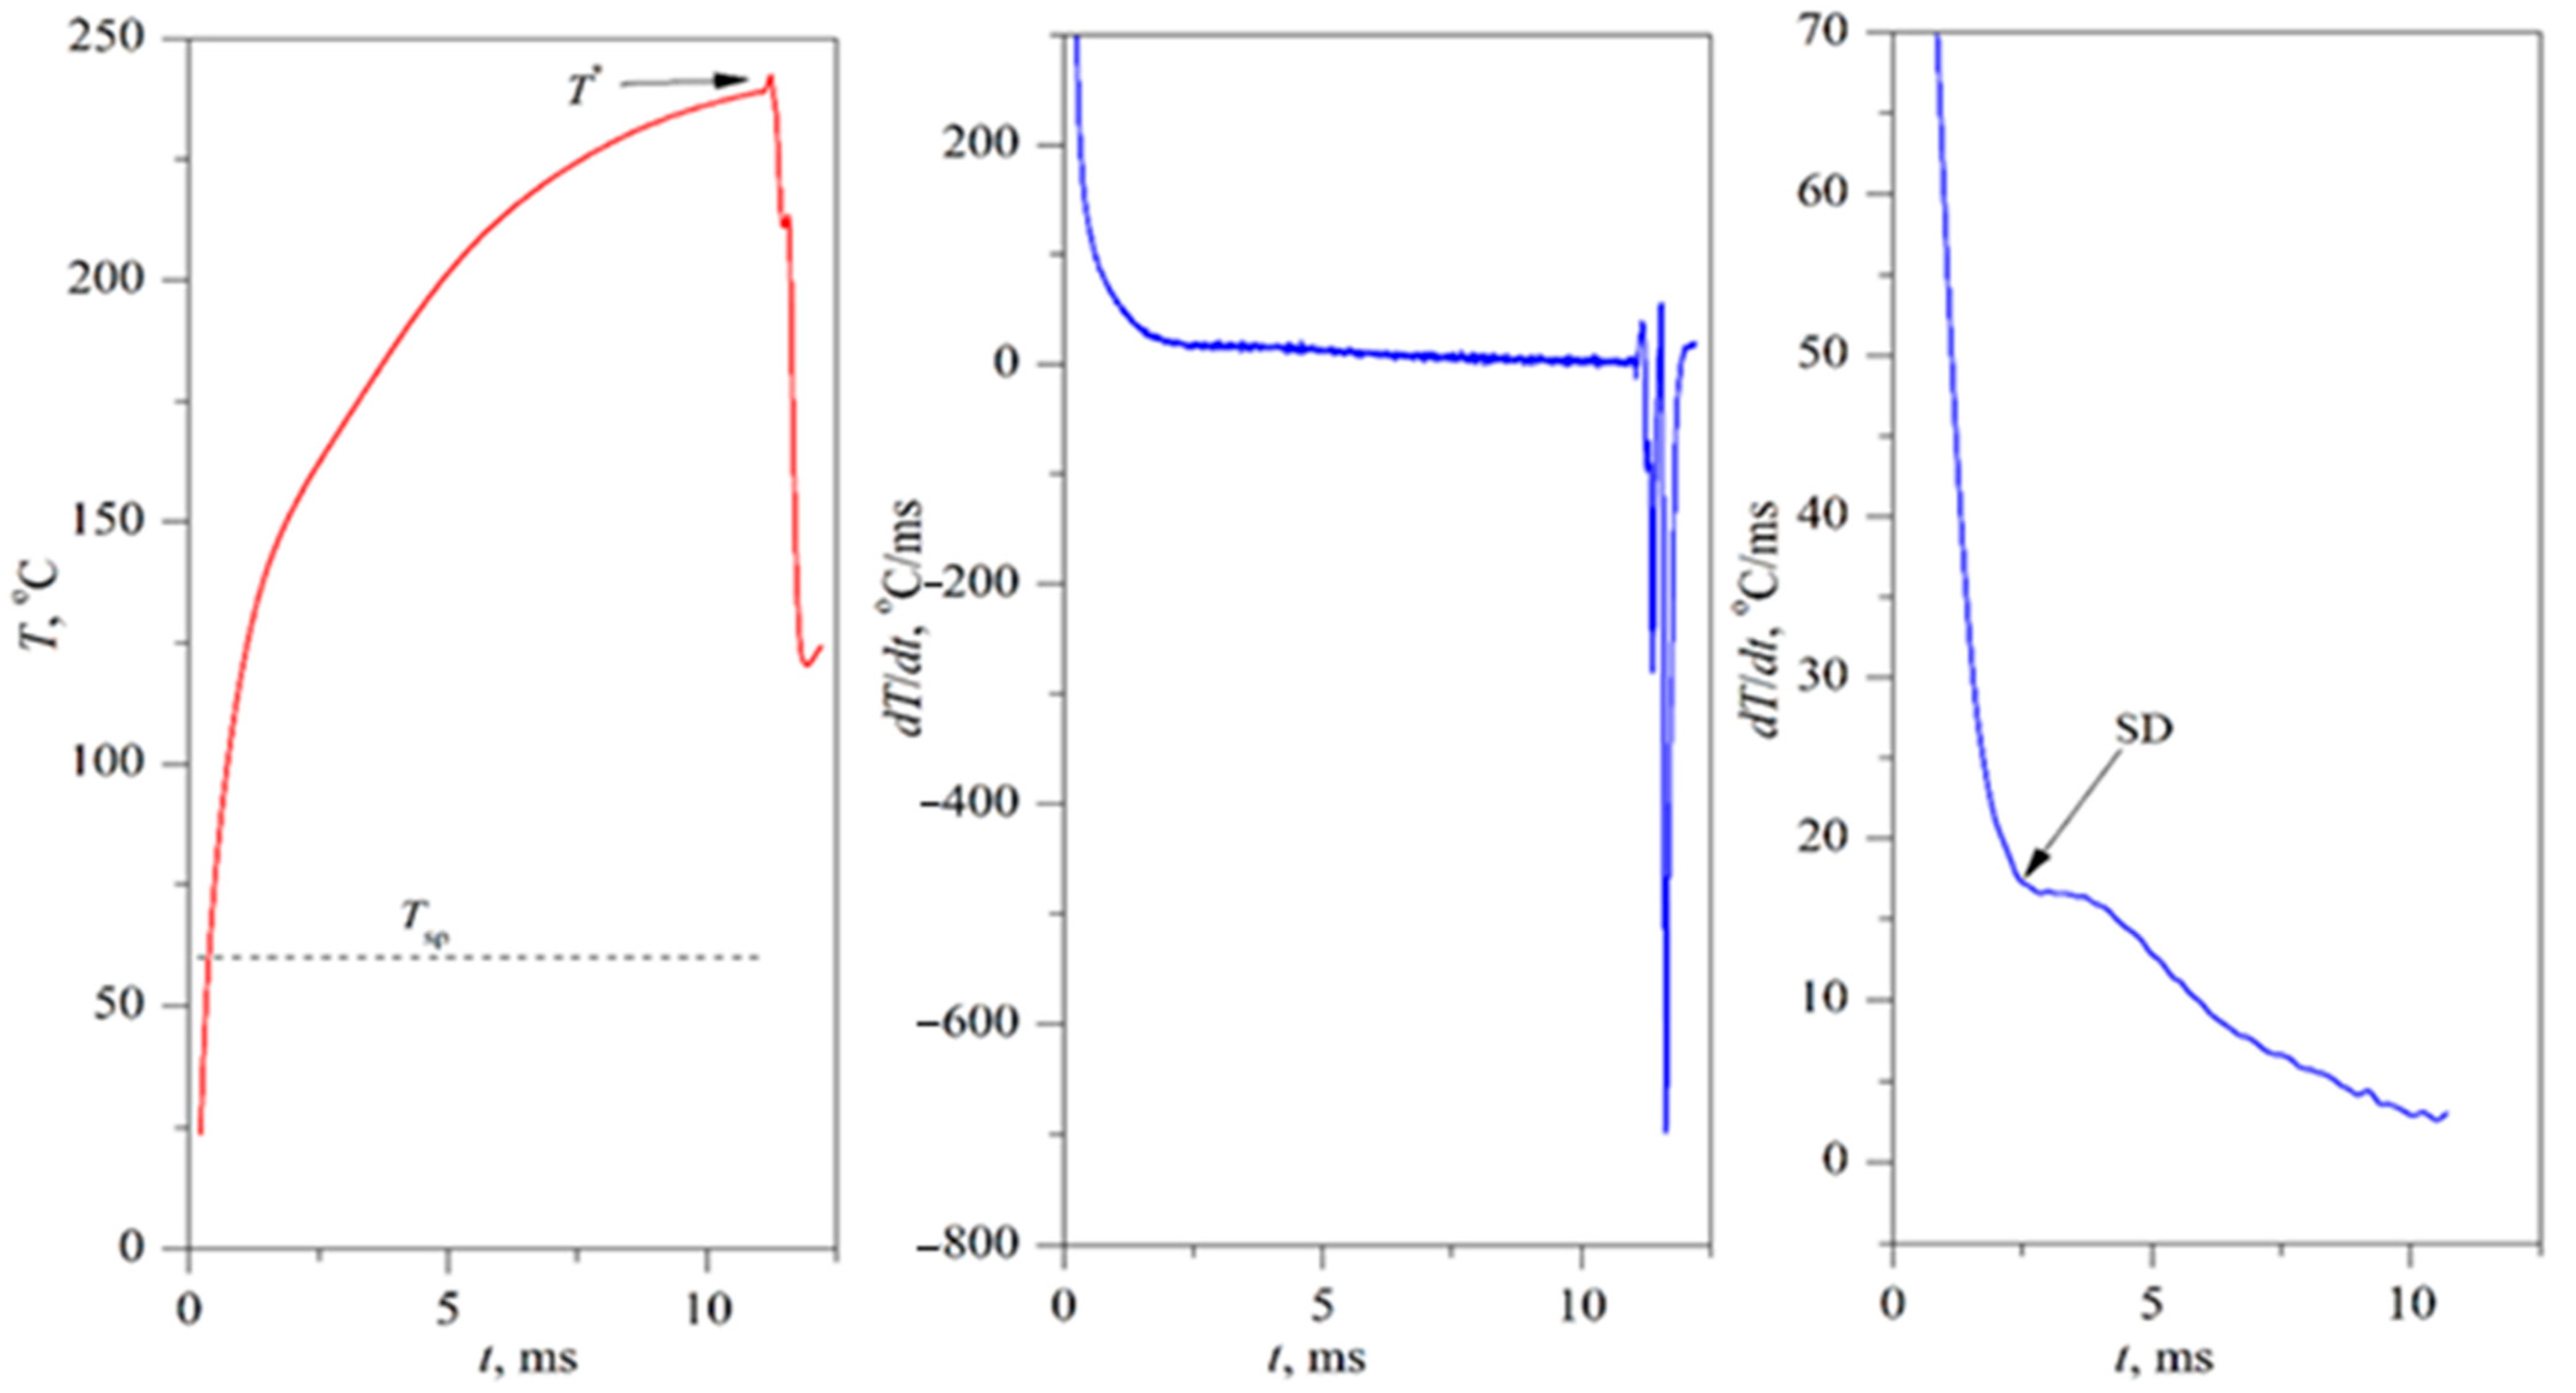
As a first step, we will consider the characteristic heating curve when transferring the mixture to the region of not-fully-stable and, further, unstable states. For determinacy, we will select atmospheric pressure and a heating duration of 12 ms (see
Figure 4). The heating of the mixture is followed first by an excess of the liquid–liquid equilibrium temperature; next, the temperature of the spinodal (
Tsp); and, as a result, the attainable superheat temperature (
T*). The strong thermal effect accompanying spontaneous boiling up represents a convenient circumstance when constructing an expanded phase diagram of the solution. Importantly, this effect occurs against the background of another relaxation process. This process manifests itself in the vicinity of a temperature of 150 °C (which corresponds to the degree of superheat at 100 °C relative to the liquid–liquid equilibrium temperature) and is less concentrated in time than boiling up. We associate it with the beginning of the decomposition of the mixture by the nucleation mechanism. The loss of phase homogeneity by the system creates an additional obstacle to heat transfer [
40]. In this regard, the short-term decrease in the intensity of heat transfer recorded in the experiment is a natural consequence. The choice of PPG-425 proved to be justified within the framework of the task. Indeed, at a heating rate of 10
4 K/s (see
Figure 4), the attainable superheat temperature of pure water is about 110 °C [
41]. Such a temperature level would be insufficient to resolve the relaxation processes shown in
Figure 4.
The analysis of the data presented in
Figure 4 allows two conclusions to be drawn. The first of these concerns the measurability of heat transfer to the solution during the decomposition of its unstable state. The thermal effect accompanying the decomposition can be enhanced by increasing the pressure and shifting to the region of elevated temperatures. The corresponding heat balance equation may be written as follows:
where
ρ represents the density of the mixture, kg/m
3;
cp represents the specific heat capacity of the mixture, J/(kg·K);
V represents the wire probe volume, m
3;
jcond represents the conductive heat flux density, W/m
2;
jconv represents the convective heat flux density, W/m
2;
S represents the surface area of the wire probe, m
2; and
qV represents the heat source, W/m
3. The solution to the equation is presented elsewhere [
27].
The second conclusion considers the possibility of constructing an expansion of the phase diagram of the solution. Here, it is the concept of a nonidealised system as described in the background that is accepted. That is, the phase diagram is constructed for the degree of decomposition of the mixture observed in a short-term experiment with strictly specified heat release parameters.
In what follows, we will discuss a selection of results obtained in the context of the problem under discussion.
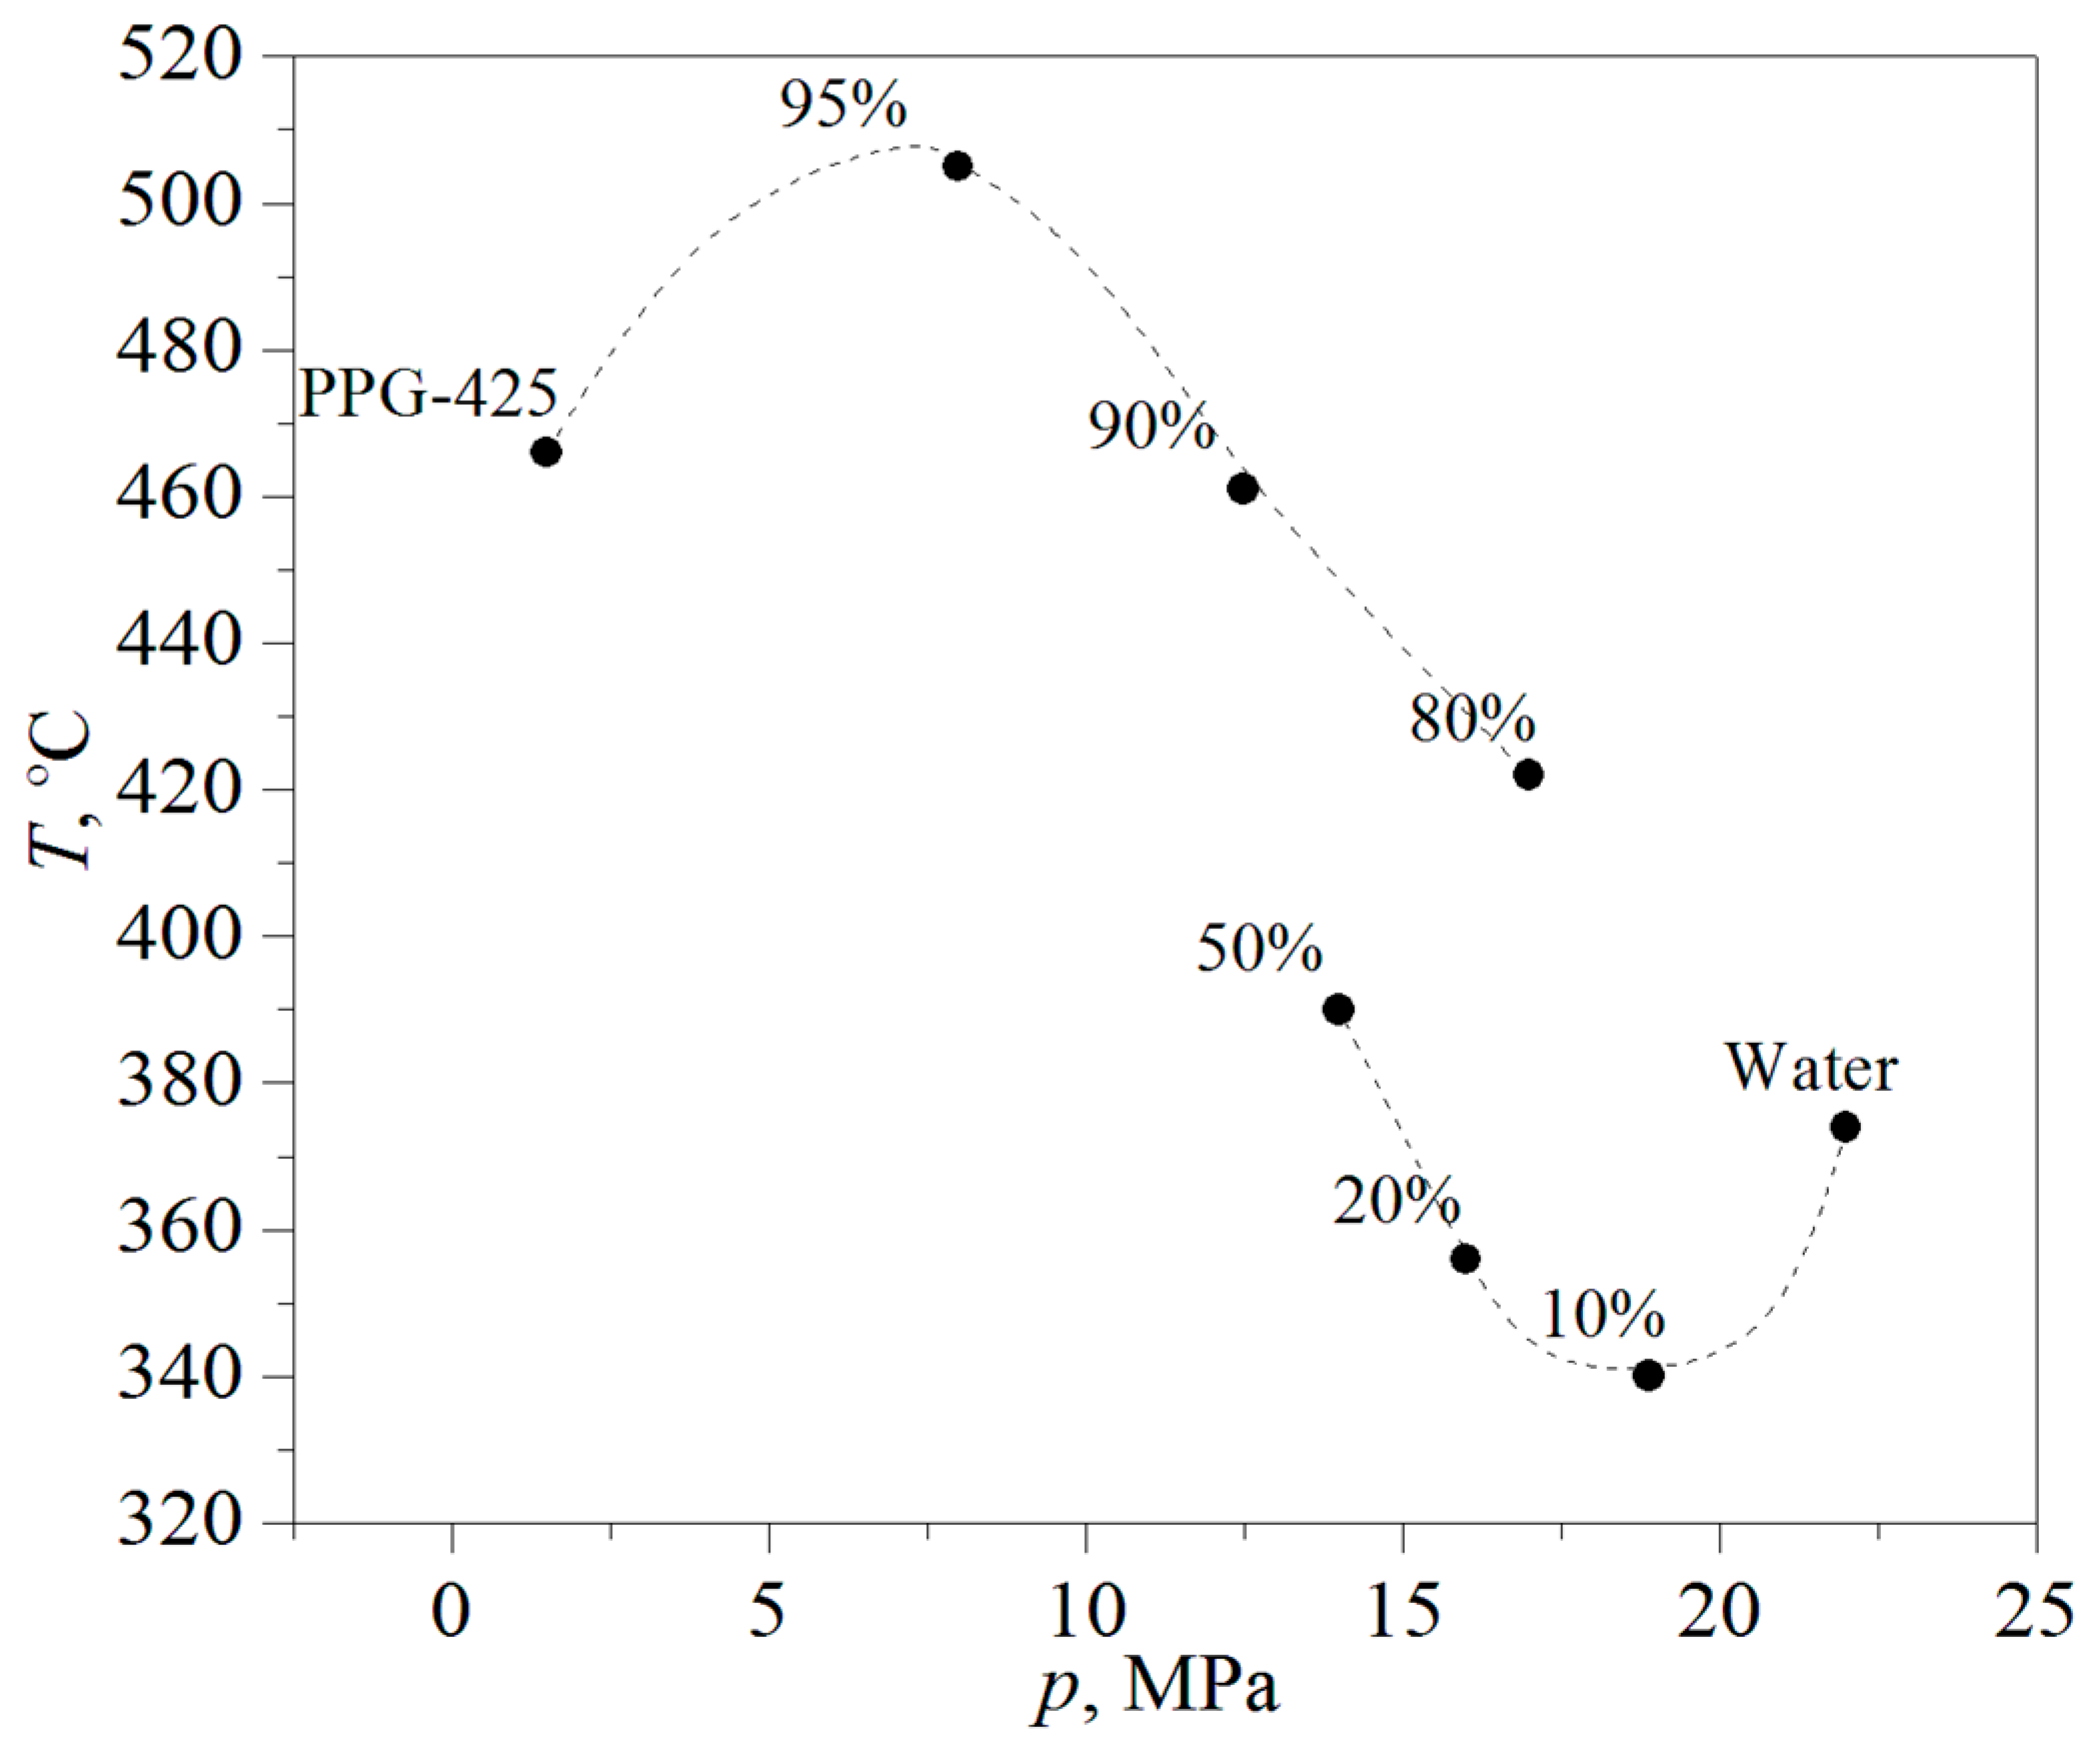
According to the data on the attainable superheat of the water/PPG-425 mixture with a given mass concentration, an approximation was constructed for the liquid–vapour critical curve; see
Figure 5. Here, the heating duration of 200–400 ms was chosen in such a way as to reduce the degree of decomposition of the solution while maintaining sufficient sensitivity of the response signal to the signs of a phase transition against the background of the heating curve.
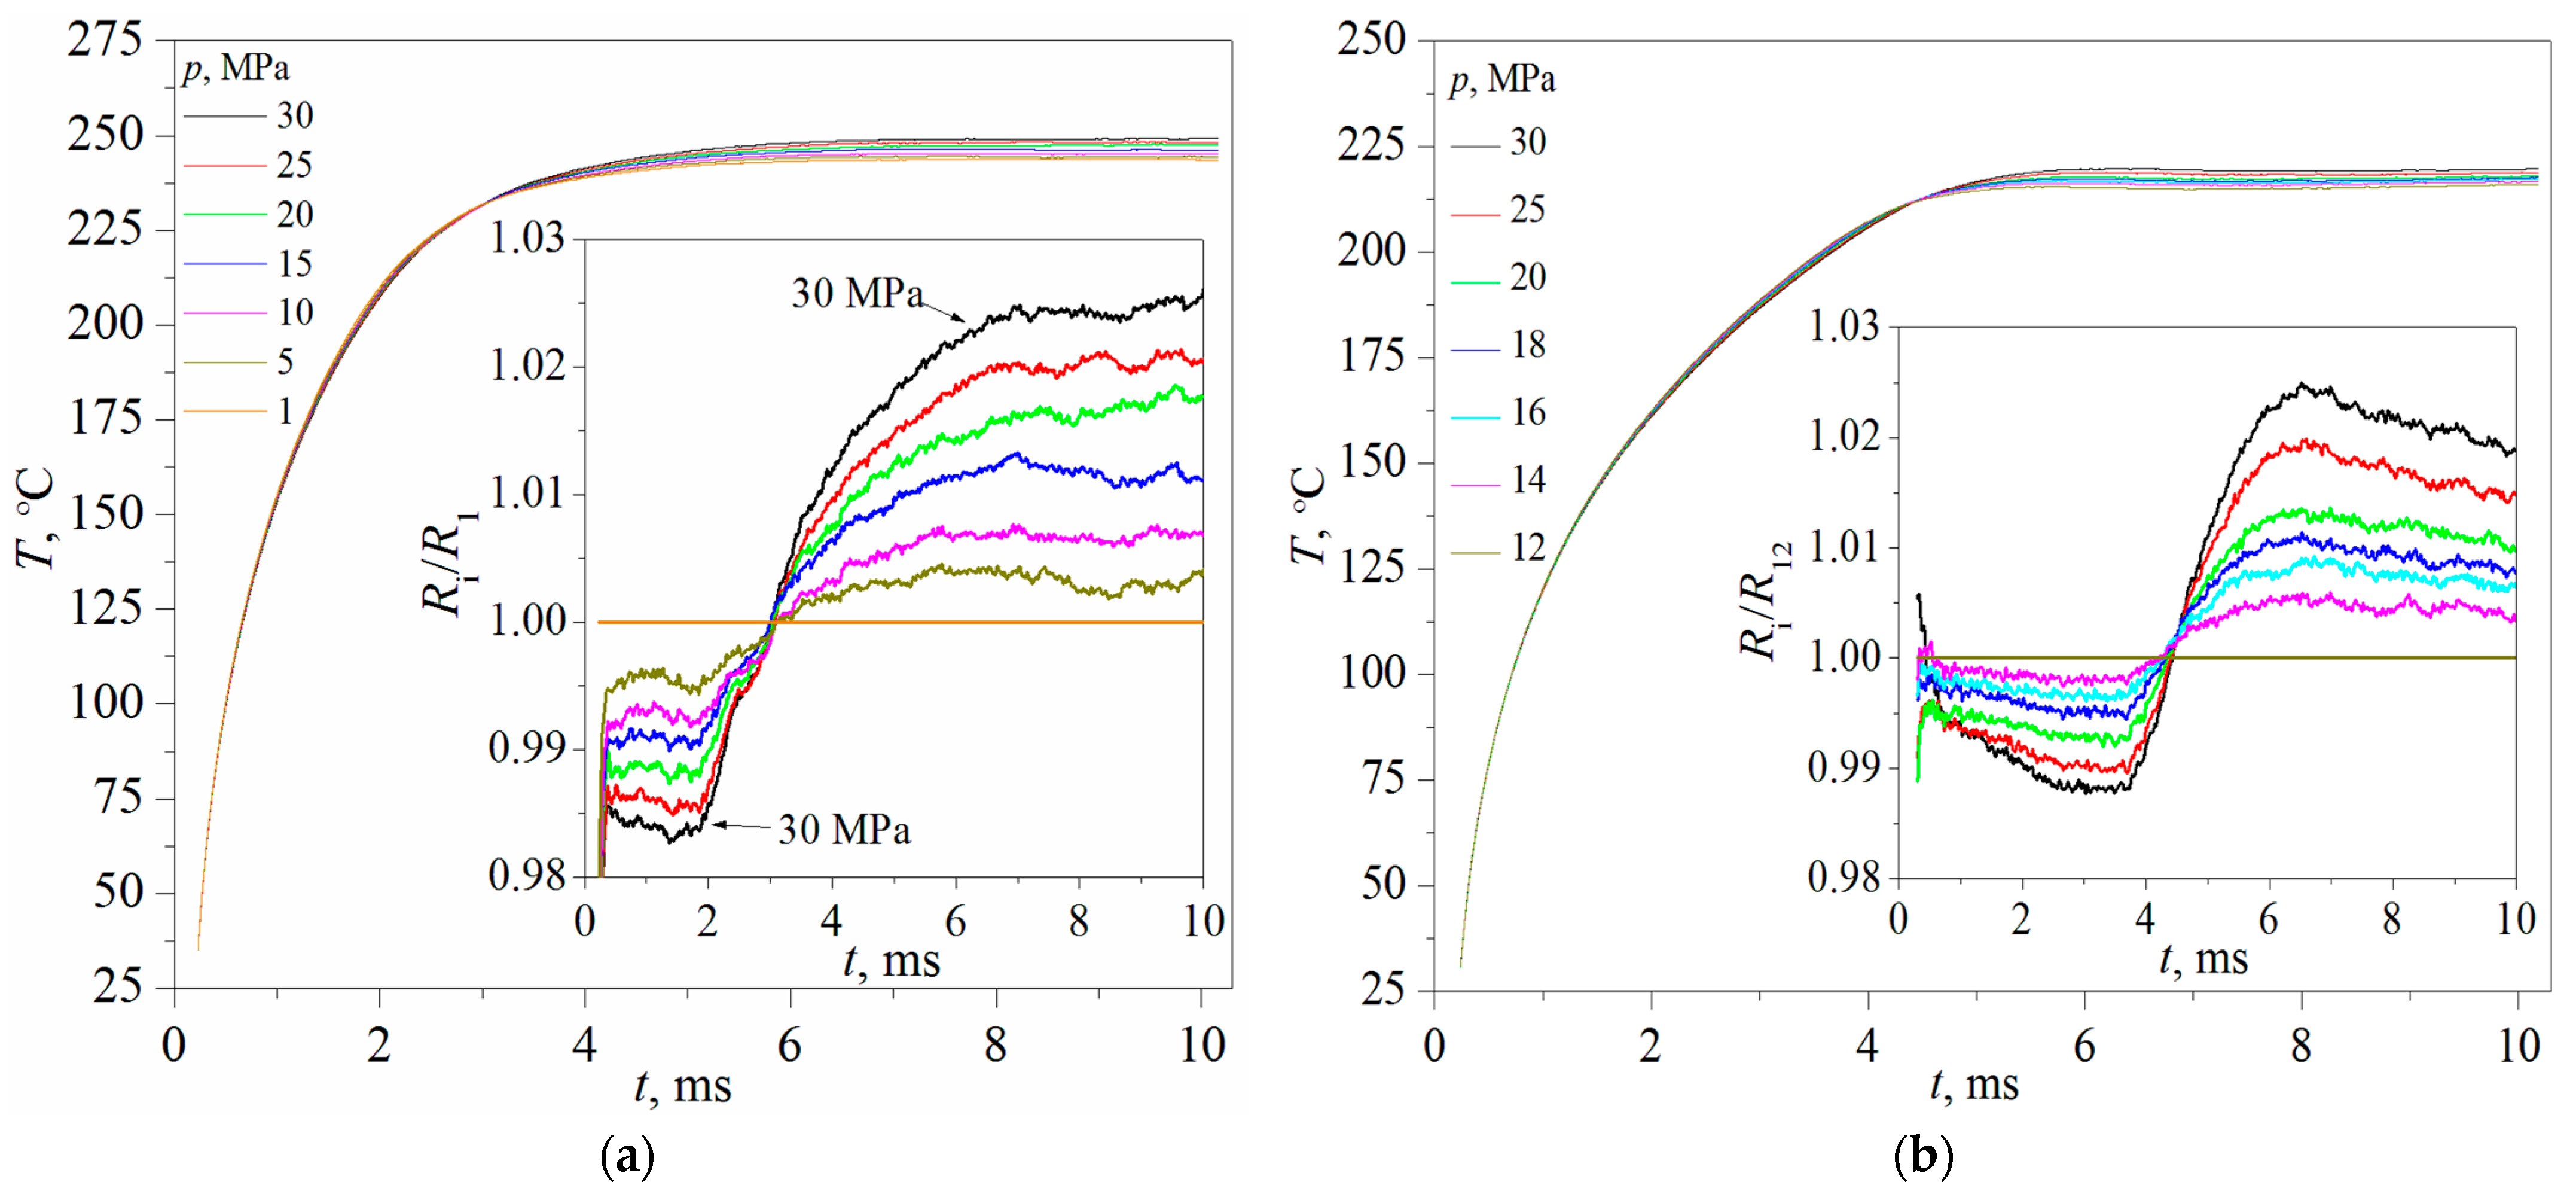
To test the hypothesis about the threshold change in the characteristics of heat transfer during the decomposition of an unstable system, the pulse heating method was used in the mode of constant power dissipated from the probe surface. From the point of view of the heat-transfer characteristics of two-component solutions with a limited mixing area of the components, an unexpected result was obtained for systems with a content of 20 and 30 wt.% PPG-425, respectively (see
Figure 6). A consideration of the heating curves revealed two characteristic features:
The relative thermal resistance value (the reciprocal of heat-transfer coefficient α) is selected as a characteristic of heat-transfer intensity: Ri/R1, where R1 represents the thermal resistance of the mixture at an excess pressure value equal to 1 MPa and Ri represents the thermal resistance of the mixture at other excess pressure values (5, 10, 15, 20, 25, 30 MPa). Because the heat flux density remains constant from experiment to experiment under the selected heating mode (mode of constant power), the value of the relative thermal resistance is reduced to the ratio of the corresponding increments of the probe temperature: ∆Ti/∆T1.
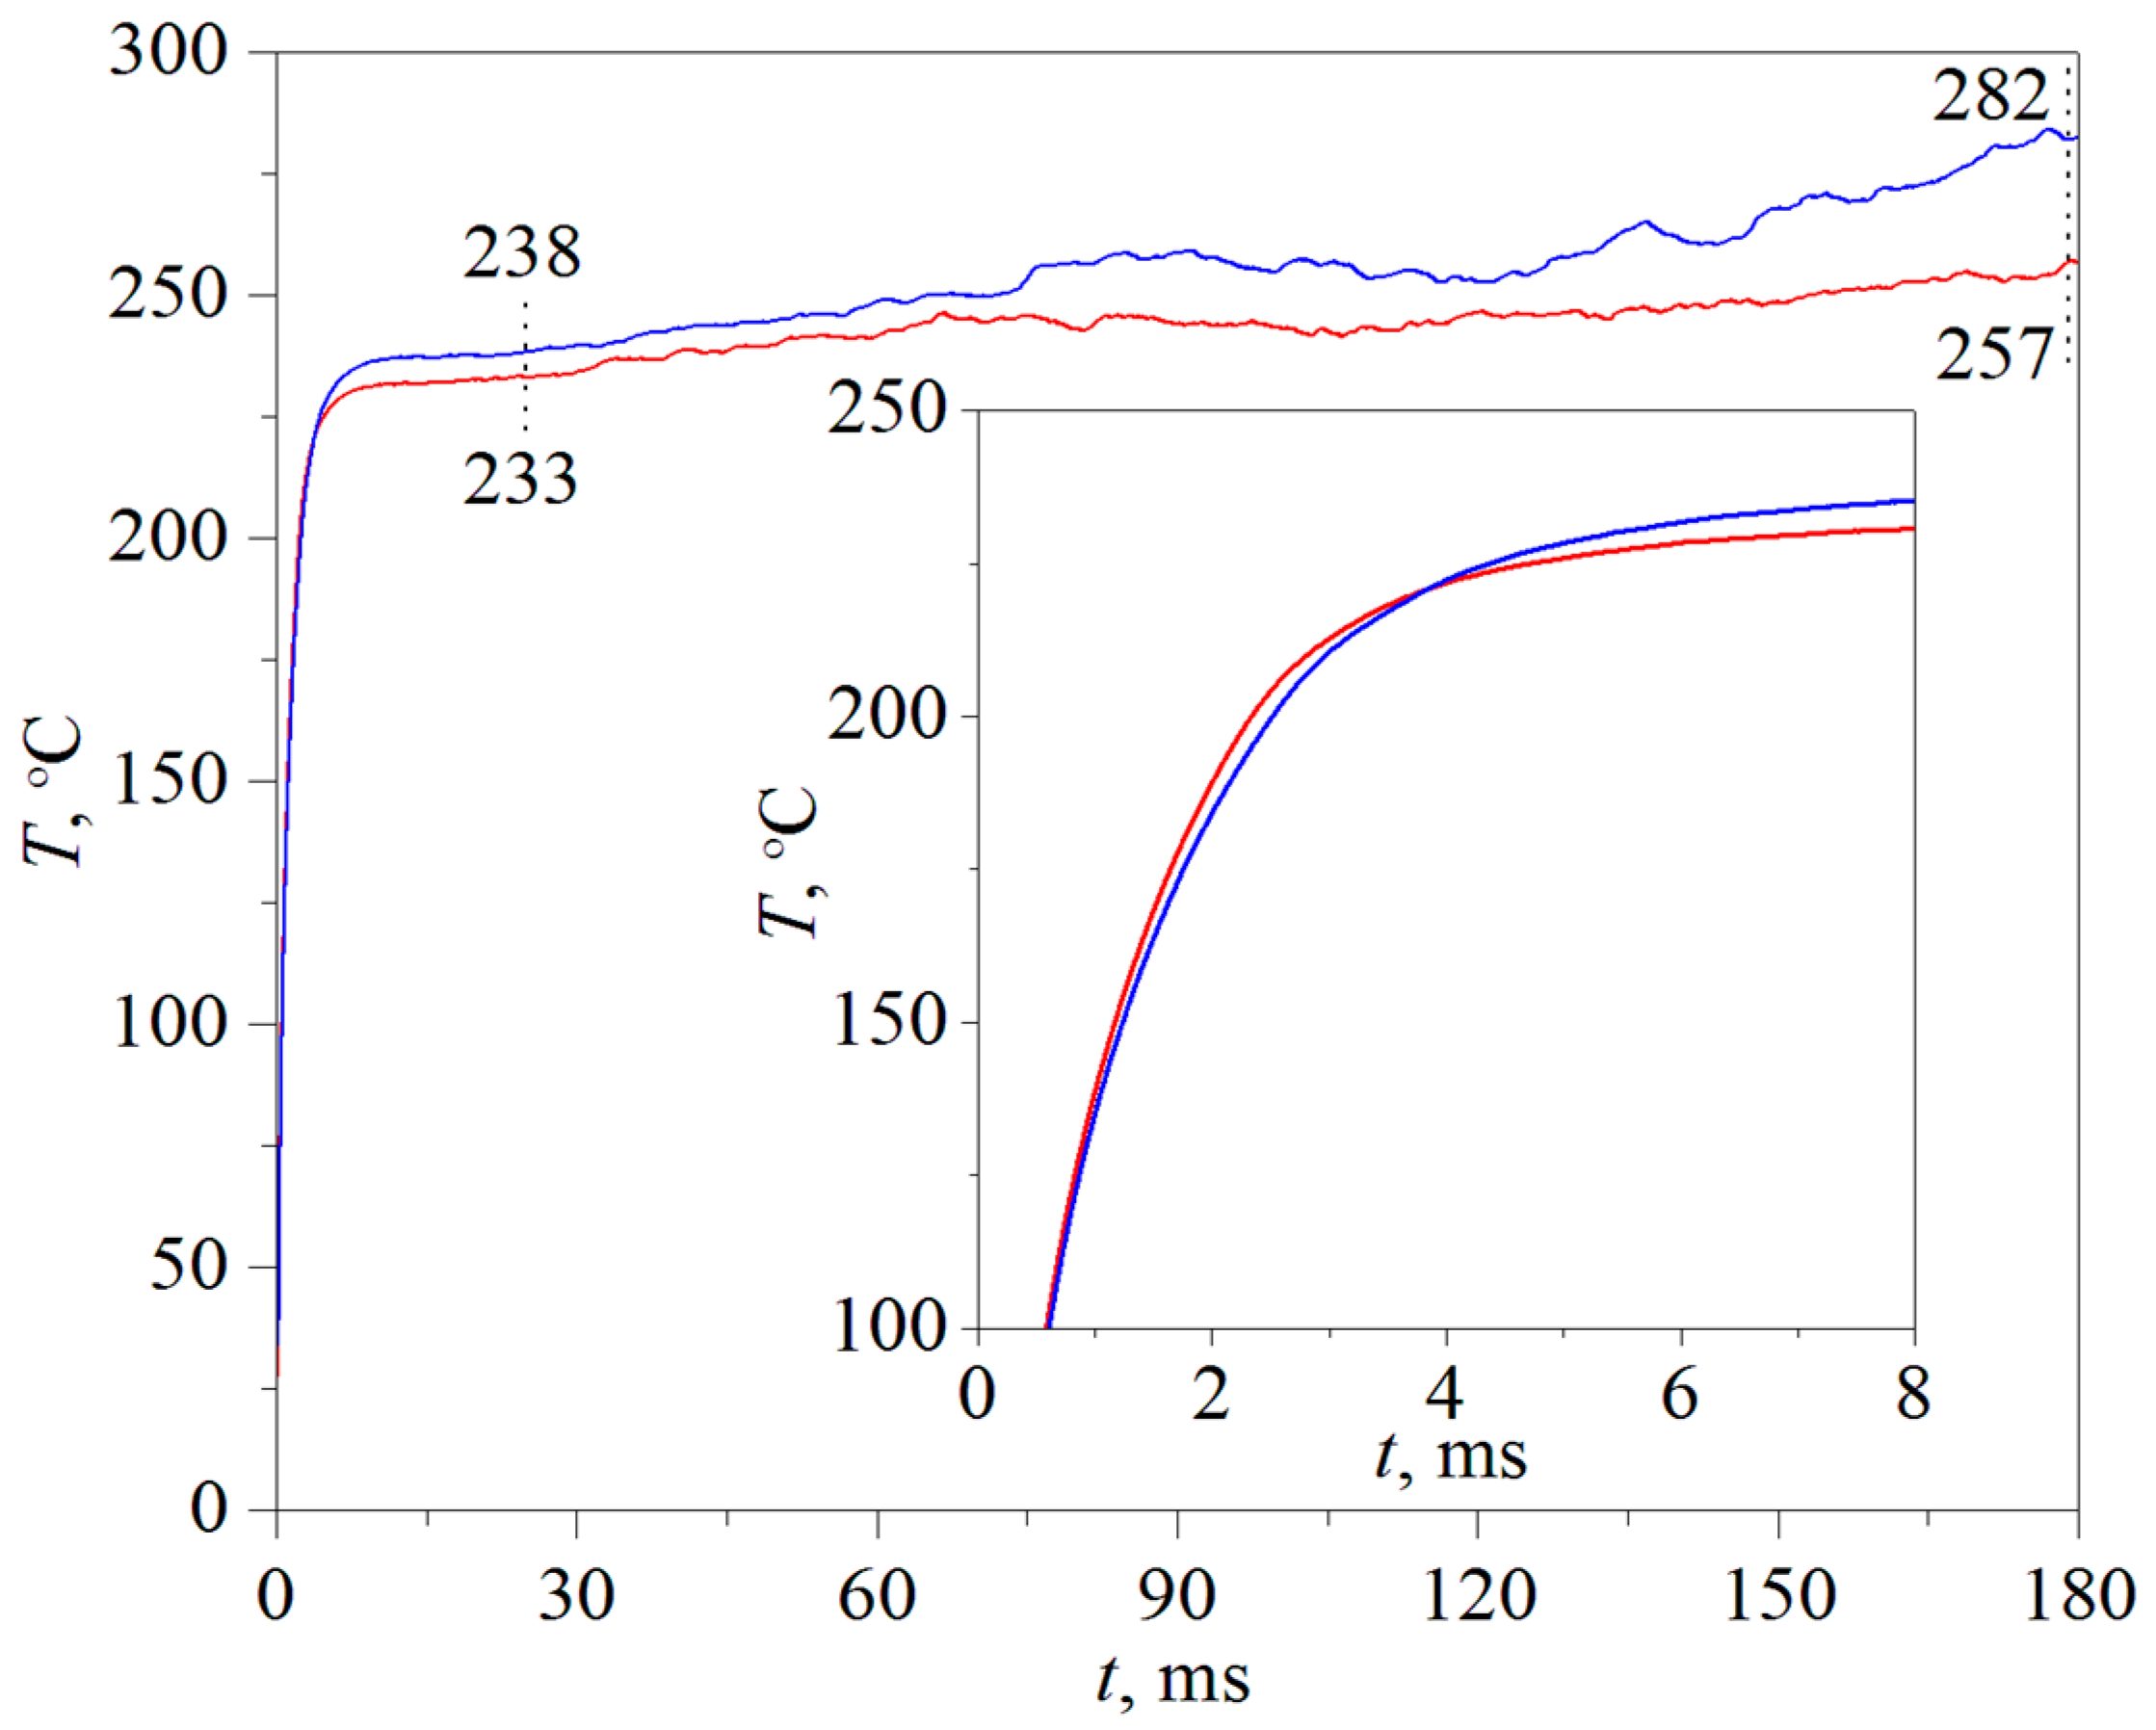
The heat-transfer pattern turned out to be resistant to changes in the heating parameters. No change in the essence of this pattern occurs as a result of either increasing the heat flux density from the heater surface or increasing the heating duration by an order of magnitude (i.e., from 15 to 180 ms; see
Figure 7). The effect of the heating curve output on saturation, according to the authors, appears to be associated with the spinodal decomposition mechanism of an unstable system. Indeed, this mechanism represents the most naturally powerful relaxation process in this region of the phase diagram.
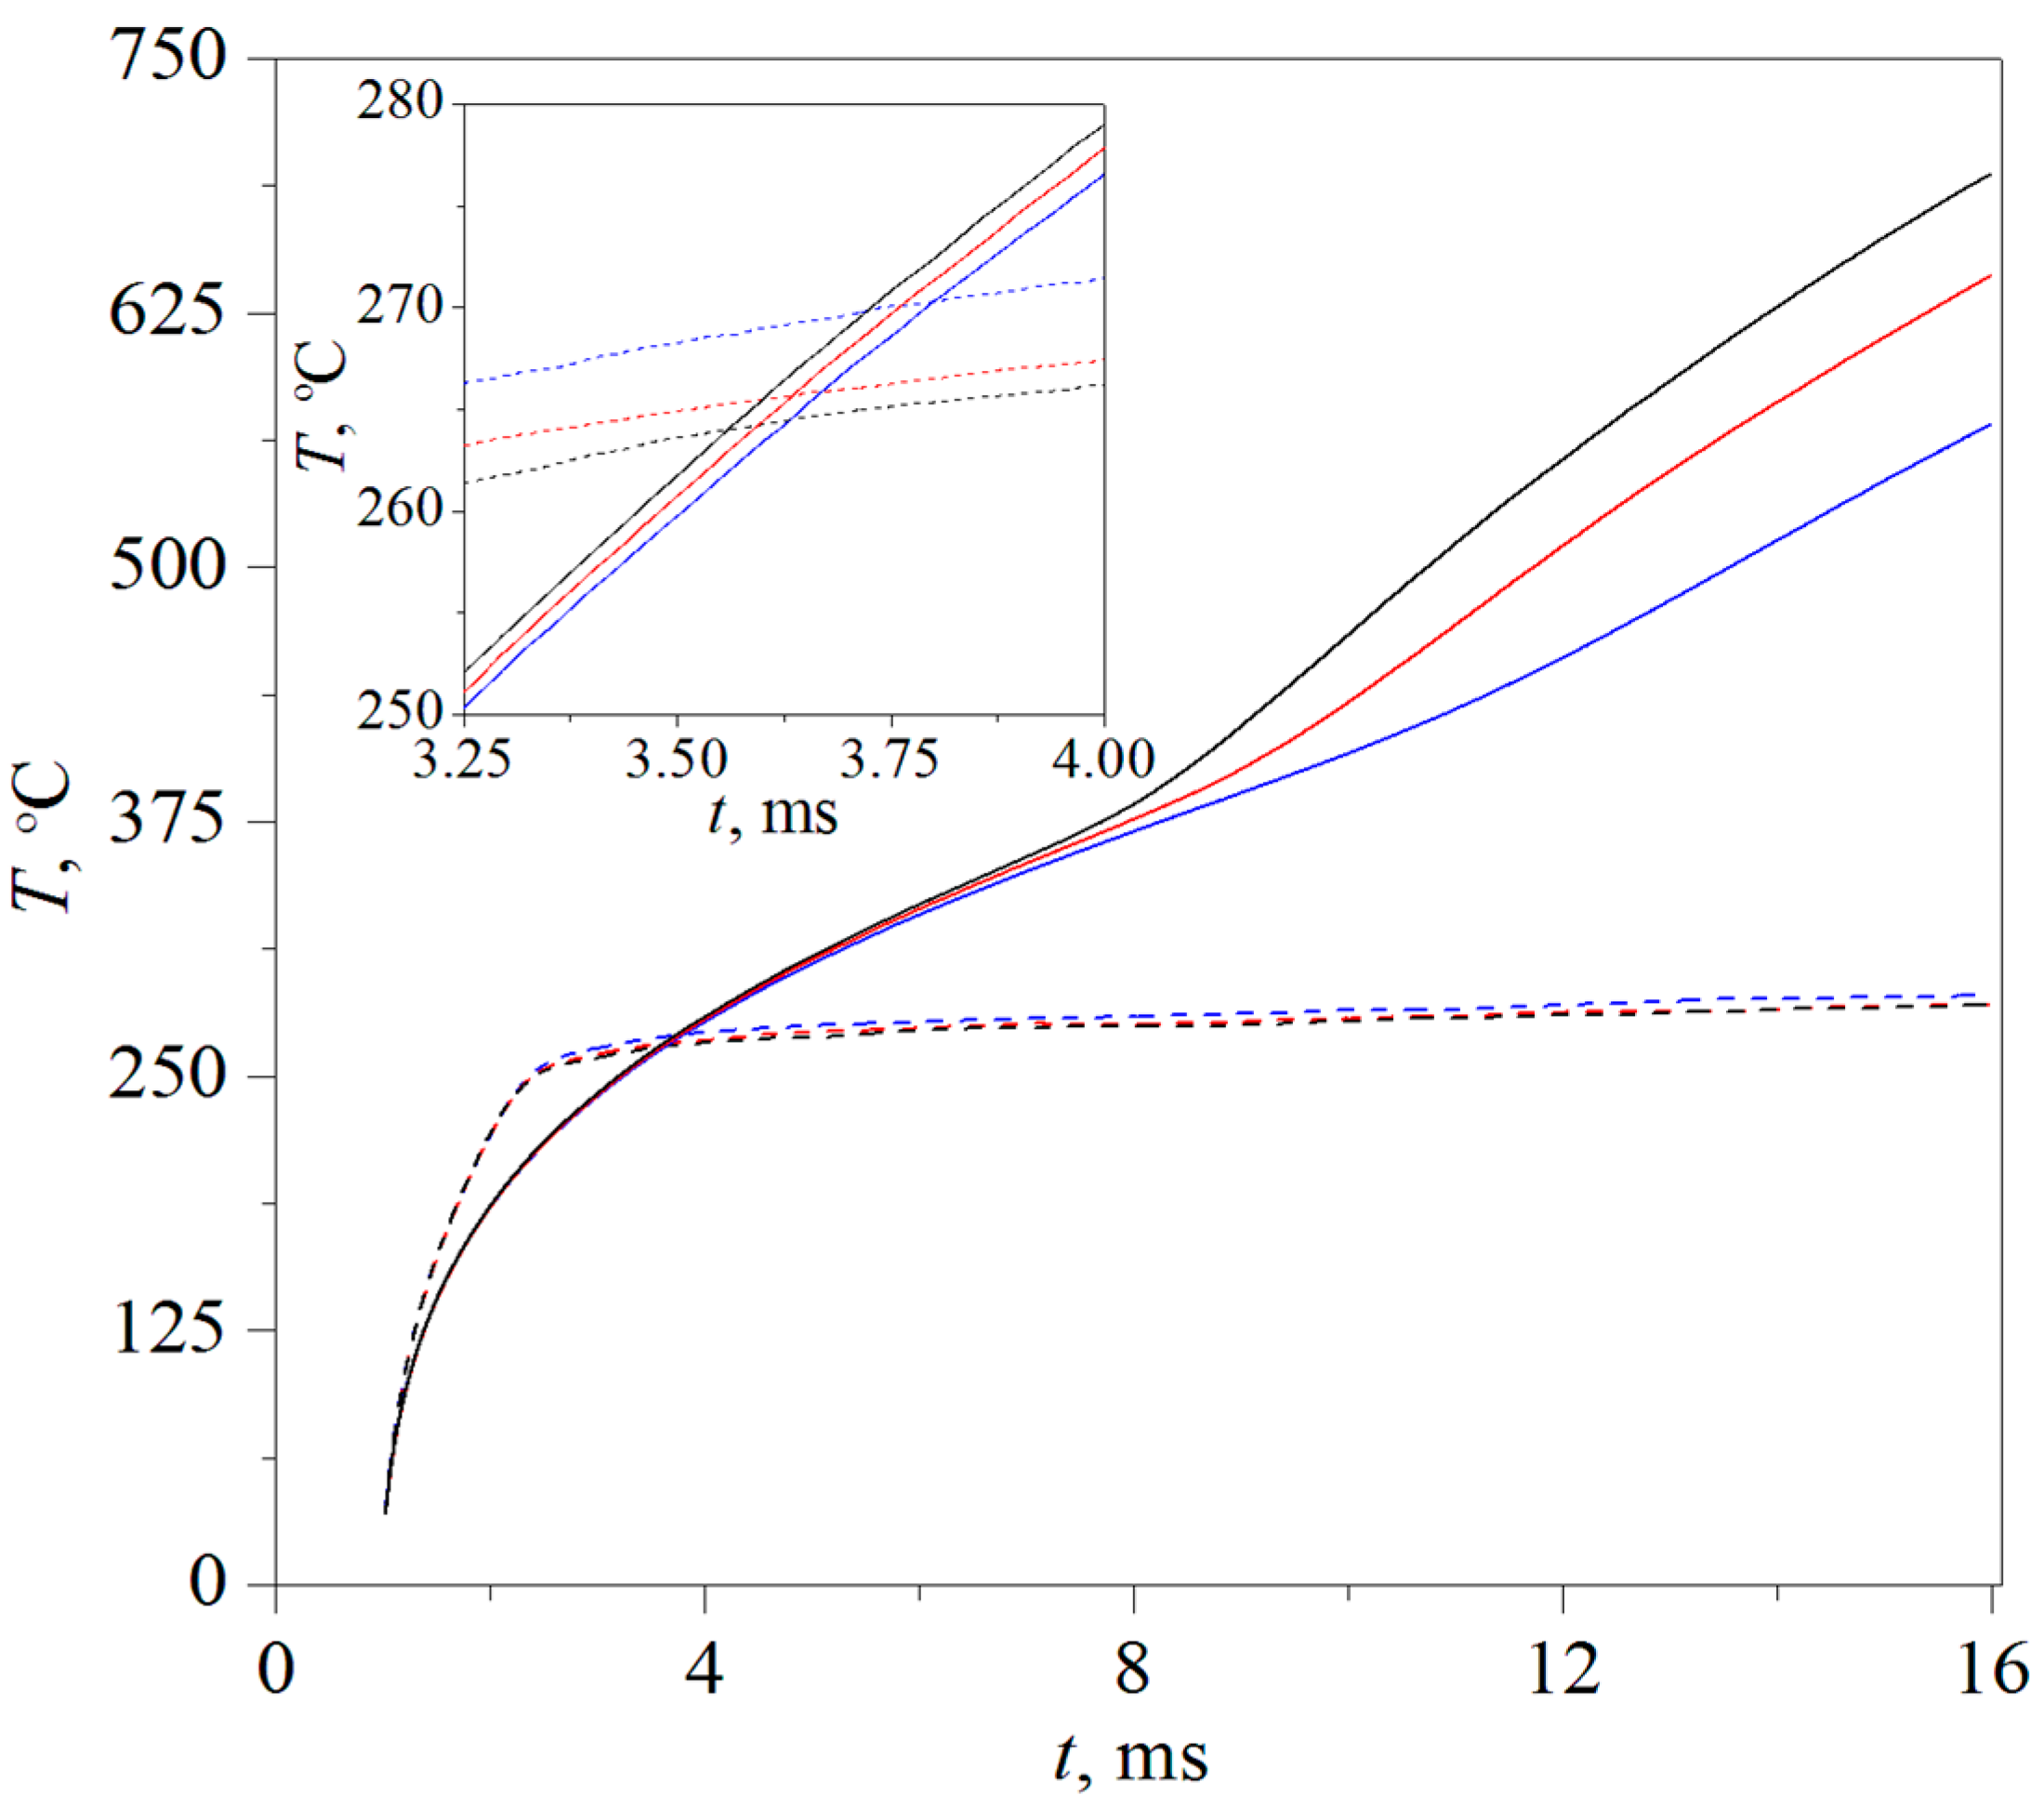
When studying heat-transfer characteristics in the course of the decomposition of an unstable solution, it is reasonable to compare them with the results obtained for traditional single-component heat carriers under the same heat release conditions. This relative version of the presentation of the results significantly improves the accuracy of the method by eliminating the uncertainty of measuring the area of the heater. Accordingly, experiments were carried out on the pulse heating of a mixture containing 30 wt.% PPG-425. The heating duration and the heat flux density from the heater surface, which were the same from experiment to experiment, were equal to 15 ms and 13.7 MW/m
2, respectively. The initial temperature
T0 = 25 °C. The measurements were performed for three pressure values: 25, 30 and 40 MPa. The choice of pressure values is based on the desire to exclude the influence of the spontaneous boiling up of water on the trend of the heating curves. The results of the experiments are shown in
Figure 8. It can be seen that whereas the temperature of the probe in the mixture at a given heat release remains almost constant, the probe temperature in the case of water heating reaches 700 °C at
p = 25 MPa. These values correspond to a deep entry into the supercritical region on the temperature–pressure phase diagram. According to the data obtained, the ratio of the thermal resistances of the compared systems can be obtained at the specified pressure values (see
Figure 9). In turn, the instantaneous heat-transfer coefficient (the reciprocal of thermal resistance) to the mixture reduced to that of water reaches by the 16th ms about two times for 40 MPa and 2.6 times for 25 MPa.
Note that at the initial stage of heating, the ratio Rwater/Rmix, where Rwater is the thermal resistance of water and Rmix is the thermal resistance of a mixture, remains less than 1. This is because the thermal effusivity b = (λ∙p∙cp)1/2 of water in this temperature region exceeds the thermal effusivity of a single-phase binary mixture. This is why the heating of the mixture occurs faster up to the onset of its phase separation.
The heat-transfer pattern at various heat flux density values is presented in
Figure 10. The pulse duration was
t = 20 ms; the power value
P(
t) varied from 4.7 to 6.6 W; and the excess pressure value was 5 MPa. When the heat flux density reaches the value
q(
t) ≈ 10 MW/m
2, the heating curves are shown to have already reached saturation a few milliseconds following the start of the pulse. Evidently, under such heat release conditions, the values of the heating rate associated with the degree of decomposition in the initial system and the degree of superheat required for the threshold that triggers spinodal decomposition are achieved.
Let us summarise the results obtained in the short-term mode of constant heating power. The use of mixtures that have LCST, specifically an aqueous solution of PPG, leads to a significant slowdown in the temperature of the heated wall. This slowdown is due to a manifold increase in the heat-transfer coefficient, caused by the spinodal decomposition mechanism. (After the submission of the article, similar results were obtained for other mixtures that had LCST, namely an aqueous solution of 2-
n-butoxyethanol and 2,6-lutidine.). As a result, first, the data presented in
Figure 6,
Figure 7,
Figure 8,
Figure 9 and
Figure 10 indicate that these mixtures can be used as a coolant in processes where the possibility of powerful local heat release cannot be excluded. Second, they prompt the direction of the scientific development of this problem thanks to the importance of restoring from the primary data the crucial parameter values (heating rate—temperature—heated volume) necessary for triggering spinodal decomposition, i.e., changing the phase transition mechanism from nucleation to spinodal and consequent heat-transfer mode from predominantly conductive to predominantly turbulent. Carrying out such a step provides a key benchmark for predicting the processes of powerful local heat release in the systems under discussion.
The estimates made on the basis of data presented in
Figure 10 for
q = 11.3 MW/ m
2 gave the following values: 1.5∙10
5 K/s, 232 °C, 10
−11 mm
3, respectively. The volume is calculated from the ratio (
a·t)
0.5S (see Equation (1),
a—thermal diffusivity of the mixture). The values of
a were obtained in our experiments by using the laser flash method. These measurements were performed in the region of stable states near the liquid–liquid equilibrium line.
6. Conclusions
In the present work, attention is drawn to a new object of research; namely the characteristic response features of a system (i.e., a mixture having LCST) to a rapid transfer to the region of not-fully-stable and unstable states. A decoding of this response will create the basis for expanding the phase diagram (along the temperature axis) of a real system, taking in the account the current degree of its decomposition. Knowledge of the phase diagram provides the key to modelling heat release processes in unstable systems, including processes that are not feasible under experimental conditions.
The data obtained by the pulse experiment indeed indicate the short-term existence of the solution in the region of unstable states, preceding its decomposition. Both the existence of short-term states of the mixture and the measurement of its properties in the region of unstable states are shown to be possible. According to the attainable superheat data under the given heat release conditions, an approximation may be constructed for the liquid–vapour critical curve and the mechanical spinodal of a nonidealised system. They are the crucial elements of the high-temperature part of the phase diagram involved in the processes of powerful heat release. By decreasing the heating time, the influence of factors caused by the decomposition of the system can be reduced.
As a whole, determining the ratio of the characteristic times of relaxation processes that depend on the reduced pressure and the heating trajectory (in temperature-time coordinates) becomes an urgent scientific problem. Its solution provides an understanding of a novel phenomenon, namely the behaviour of the system across a wide range of temperature changes on the scale of small characteristic times intrinsic to powerful heat release processes. In turn, it also makes it possible to judge the thermal processes accompanying the relaxation of the system to a stable state.
Data on the heat transfer of a system during its superheat and relaxation are presented in the example of an aqueous solution of PPG-425. An unexpected result was obtained for systems containing 20 and 30 wt.% PPG-425. Despite the rather high density of the heat flux from the heater surface set in the experiment (from 9.2 to 13.7 MW/m2), the heating curves showed a tendency to reach saturation. This circumstance indicates a threshold gain in heat transfer from the surface of the heater. The manifold increase in the heat-transfer coefficient can probably be attributed to the effect of the spinodal decomposition of the unstable system. Here, it is significant that the heat-transfer pattern demonstrated resistance to changes in the heating parameters. No significant change in the nature of heat transfer by the mixture occurred as a result of either increasing the heat flux density from the heater surface or increasing heating duration by an order of magnitude. The results clearly indicate that such mixtures can be used as coolants in processes where the possibility of powerful local heat release cannot be excluded. However, in order to clarify the validity of using them as such, a more detailed study will be necessary. In this connection, it will be important to expand the range of types of heating elements, characteristic times and degrees of superheating, such as by involving other experimental groups in the study.


