Article

A Sustainable Method for Evaluating the Activity of Logistics Service Providers (LSPs) in a Turbulent Environment—Case Study Analysis (2020–2021)

by
Małgorzata Zysińska
1,* and
Jolanta Żak
2,*
1
Motor Transport Institute, Transport Telematics Centre, 03-301 Warsaw, Poland
2
Faculty of Transport, Warsaw Technical University, 00-662 Warsaw, Poland
*
Authors to whom correspondence should be addressed.
Energies 2023, 16(4), 1984; https://doi.org/10.3390/en16041984
Submission received: 20 November 2022 / Revised: 14 January 2023 / Accepted: 3 February 2023 / Published: 16 February 2023
(This article belongs to the Topic Energy Economics and Sustainable Development)

Abstract

:
As a result of the COVID-19 pandemic, the ongoing war and the implementation of the so-called Mobility Package there are profound changes taking place in the Polish LSP sector. The competitive struggle on the market is intensifying, and it mobilizes the management to diagnose the condition of companies with the use of effective comparative tools. This article aims to present the conclusions of the study of 46 entities on the Polish LSP market. It uses an original, multi-faceted evaluation method. The authors hope to popularize this method for evaluating LSPs by making it cyclical. The comparative evaluation of LSPs was carried out with the use of economic (index) and statistical analysis tools. A model of rank correlation was used for the values of all variables (ten economic parameters and one greening parameter). LSPs were grouped up based on the average value of the economic variables and according to investment attractiveness and then clustered. Sets of the most correlated characteristics in the assessment of the LSPs were developed based on the k-means method and the Spearman coefficient. A collective ranking of LSPs has been prepared.

1. Introduction

In the last decade, the dynamic development of transport and logistics companies was observed in Poland, accompanied by the intensification of competition, especially during the COVID-19 pandemic. It forced restrictions on mobility and slowed down the majority of LSP sectors, determined by a reduction in production in almost all regions of the world. The “freezing” of the LSP sector was protracted and its consequences cannot be fully predicted in the perspective of subsequent waves of the pandemic. As a consequence of implementing the provisions of the so-called Mobility Package, there were deeper changes in the industry. Initial analyses from the Motor Transport Institute (MTI) indicate a significant impact of the COVID-19 pandemic on the Polish sector of international road freight transport. It was consistent with the situation observed in other EU countries, especially given that Polish international road carriers generate nearly half of their turnover in connection with transports performed outside Poland (Figure 1).
Their average recorded decrease in journeys in Germany amounted to approx. 27% in April 2020 (compared to April 2019). Higher declines in international transport were also recorded in neighboring countries, as well as France, Italy and Spain, in the same period, throughout the EU [1,2]. Figure 1 shows that carriers from neighboring countries also recorded significant decreases, although their dynamics were different. The smallest drops were experienced by German carriers, and the largest by carriers from Slovakia and the Czech Republic. These decreases were higher by several percentage points than among Polish carriers.
Research conducted by the MTI showed that in the period March–June 2000, as many as 87% of enterprises engaged in international road transport recorded a significant decrease in turnover (nearly half by 45%), and only 8.5% did not feel any changes, and only 4% recorded an increase in turnover. The changes affected the smallest carriers the most. There has been a further polarization of the market. This is also confirmed by the indicators showing a sharp decline in transport offers in relations with EU countries (based on the data from Timocom or Trans.eu platforms).
The Polish LSP sector is also struggling with the growing shortage of employees and increasing wage and regulatory pressures, which limit the development of companies.
According to the majority of carriers surveyed in April 2022 by the MTI, the most noticeable effect of implementing the Mobility Package will be an increase in the operating costs of Polish LSPs and the deterioration in the conditions for the competitiveness of their operations (80%). The Mobility Package and the shortage of workers, exacerbated by the war in Ukraine, are the main challenges for Polish transport companies operating on the EU market. The overlap of these two factors will also lead to a further consolidation of the market and the bankruptcy of its smaller players. According to research conducted periodically by the MTI in cooperation with the International Road Carriers Union, the percentage of international carriers reporting a decrease in turnover as a result of the pandemic decreased by 60% in the first half of 2021 compared to the second half of 2020. The study concerned only carriers registered in Poland and operating on the international market. Therefore, from the point of view of companies making mergers or acquisitions in the LSP sector in Poland, access to a universal tool for the quick evaluation of the conditions and development prospects of companies is important. Comparative analysis should be easy to use for the company’s boards and investors, and at the same time be based on a wider set of economic indicators than those used in publicly available rankings. The rankings available in the literature are based on a limited set of indicators, usually only 2–3, which makes inference based on them incomplete and, as a result, often subject to error. The authors of the rankings do not examine the degree of correlation between the assessment indicators. This may contribute to the inadequacy of the assessments and does not eliminate randomness. However, their average ranges obtained for national markets may differ significantly due to the specificity and individual conditions of companies operating in various countries. This may be a cause to extend the research in the field of further comparative analyses of LSP entities from different countries [3].
The tightening of the regulatory sphere (including regulations, e.g., Fit for 55) accelerates demand for research in the field of fleet emissivity. Moreover, in the case of companies from the LSP sector and the planned regulations on emissions, it is important to systematically evaluate LSP companies in terms of the emissions of their fleets. In the opinion of Polish companies, this is currently an important parameter of investor evaluation. Due to the poor availability of LSPs on the stock exchanges and the related lack of information on their results, the authors focused on the Polish market and limited the adopted research method and conclusions to it. For this purpose, they used the search engine for financial statements of companies registered in Poland (EKRS) [4].
Rapid changes in the environment have stimulated interest in effective methods of assessing LSP entities. In recent years, the interest in tools for strategic and economic analysis has grown (Figure 2).
The competitive struggle on the LSP market in such a turbulent environment will not die down, driven by the dynamics of growth in other industries recovering from the pandemic. It should mobilize management staff, owners and investors to diagnose more often the condition of enterprises using effective benchmarking tools. The search for tools for the effective evaluation of the activities of LSPs is particularly important from the perspective of management boards and investors, as the number of acquisitions in this sector in Poland has clearly increased over the last 2 years [5]. There is a noticeable increase in demand for more advanced assessment methods that take into account industry-specific criteria. In view of the rapidly changing conditions, the multi-faceted, time and cost-effective holistic evaluation of LSPs should gain in importance. Similar conclusions are provided by studies conducted in 2018–2019 by a team of Brazilian scientists, C. O. L. Nascimentoa, I. Belcavello, R. Leise, K. Oliveira [6], or the Italian experts specialising in evaluating this industry, M. Akhavana, H. Ghiaraba, I. Mariottia, C. Silligba [6]. Polish scientific works are dominated by the qualitative approach. Meanwhile, stakeholders of companies (owners, managers, current and potential customers) signal the need to use multifactorial methods, taking into account the issue of fleet emissivity, which is important for the LSP sector, instead of focusing only on qualitative or quantitative aspects. Such an approach to the evaluation of LSPs, along with giving it a cyclical nature, would allow to effectively verify the decisions in the area of operational efficiency. The aim of this article is to present the conclusions of the study of the group of the 46 largest entities on the Polish LSP market. It uses the authors’ own multi-criteria evaluation indicator method. It mostly takes into account the economic aspects and single ecological ones/low-emission fleet indicator of the LSPs gathered together. The cyclical application of the presented method should allow a more comprehensive diagnosis of the situation in the sector than conducted rankings, taking into account single criteria. The authors hope to popularize this method for evaluating LSPs by making it cyclical and by expanding the group of entities covered by the study. They are convinced that the use of single-criteria company assessment parameters is incorrect because it does not take into account the interrelationships between the variables and their weights. This study is based on data from LSPs registered in Poland. The criteria for selecting the research sample were the figures concerning turnover, balance sheet total and employment. This type of research, but to a lesser extent, was conducted by academic centers abroad [7,8]. Conducting them in an extended formula at the national level will allow to formulate specific conclusions for the LSP sector in Poland [9].
The Polish LSP sector is still characterized by a high amplitude of changes, although it coped relatively well with the pandemic crisis. In view of the expectations of the representatives of LSPs, expressed in the MTI research, it should be assumed that the market consolidation in post-pandemic conditions will proceed dynamically. More than half of the LSPs surveyed by the MTI (52%) believe that the situation in the sector will improve in the next two years, and 34% that it will remain unchanged, and 14% believe that it will deteriorate further. Large LSP enterprises will grow stronger, small and unprofitable ones will collapse and those from the “business angels” category will develop the digital intermediation and niches market. Only expanding the fully optimized scale of operations or operating in niches while maintaining cost leadership will allow LSP entities to stay on the market within strategic groups [9,10,11]. In view of the expected dynamics of the changes in the sector, it is necessary to disseminate an aggregated economic evaluation tool with an extended set of indicators, and at the same time easy to use by shareholders, management boards of companies and potential investors. This assessment should also take into account the environmental aspect, showing the dynamics of the changes in the sector in terms of fleet emissivity, enforced by the Community regulations introduced or the anticipatory approach of companies in this area [11,12].

Description of the Proposed Research Method

The evaluation method proposed by the authors is universal and innovative.
It is universal because:
  • It is based on known, and commonly used in other countries, measures of the economic evaluation of individual companies, as well as the measure of fleet assessment. These are the following measures:
    • Profitability indicators (ROE, ROA, ROS, gross profit margin indicator, revenue dynamics indicator);
    • Performance indicators (current assets turnover indicator, liabilities turnover indicator);
    • Debt indicators (debt to equity ratio, total debt ratio);
    • Liquidity indicators (quick ratio QR);
    • Fleet emission index (the number of vehicles meeting the Euro 6 standard and higher in relation to the number of vehicles in the company’s fleet) [12].
  • Economic measures are obtained in the same way in all countries, i.e., from published financial statements of companies or based on individual surveys.
  • The evaluation measures have the same component parameters.
  • The fractional measure (one of eleven) concerning the emissivity of the fleet is also a universal tool, because all LSP companies, regardless of the country of residence, must meet the requirements of the EU regulations on the emissivity of the fleet. Therefore, the evaluation of their resource potential based on the assessment of the emissivity of the fleet makes it possible to compare entities from different countries in a universal way.
The method proposed by the authors is innovative because:
  • It includes a wide set of 10 economic evaluation indicators commonly used in the financial analysis of individual companies.
  • Additionally, which is a novelty, it includes one fleet assessment measure, which is important in evaluating the resource potential of companies in the context of changes in the EU regulations in the field of emissions.
  • It provides a better and more reliable evaluation than company rankings based, so far, on sets of 2–3 measures, eliminating the risk of randomness and selective assessments.
  • It guarantees a balanced selection of assessment measures by prior checking the degree of correlation between them.
  • Ensuring a variety of correlation coefficients in the set of 11 aggregate assessment measures ensures sufficient data comparability. The use of only highly correlated indicators leads to the duplication of information and excessive increase in its importance in the whole analysis, which is not taken into account by most of the authors of the rankings. Such errors occur in rankings, where the selection of the indicators is performed randomly, without examining the correlation between them.
  • The compatibility of the segregating of companies was examined in the case of selecting indicators that were differently correlated (−0.2–1) and based on only highly correlated indicators (0.8–1). The results obtained allow us to conclude that limiting the number of indicators used to build a synthetic measure only to highly correlated indicators leads to the creation of a ranking of companies that shows a high randomness of their compilation in two consecutive years.
  • The ranking based on a more diverse set of indicators in terms of the correlation showed a greater convergence in both years than the ranking based solely on indicators with a high correlation close to 1. This was particularly evident in the case of the top ten companies in the rankings and the use of indicators from the same group, i.e., profitability (ROE, ROA, ROS).

2. Emissivity of LSPs and the Method for Its Measurement

The Polish LSP sector is compelled to take into account the EU recommendations for reducing the level of CO2 emissions. It is estimated that transport is responsible for approx. 15%, and in agglomeration areas, even for 30% of global CO2 emissions [12]. LSPs become rather spectacularly involved in pro-ecological activities aimed at reducing greenhouse gas emissions and pollution, especially if it is to improve their image or activities for the benefit of so-called corporate social responsibility (CSR) [12]. Pro-ecological activities are part of the EU policy [12,13] for sustainable development, which sets itself ambitious targets for reducing CO2 [14]. The main assumption is to reduce greenhouse gas emissions by 55% by 2030 and achieve climate neutrality by 2050. The European Green Deal shows that a 90% reduction in CO2 emissions from the entire transport sector is necessary by 2050, which means that almost the entire LSP fleet should be zero-emission by then [13,14]. In reality, however, environmental strategies are relatively reluctantly being implemented by the carriers and logistics operators, due to the lack of sufficient economic incentives in Poland and the availability of an alternative fuel infrastructure. Diesel-powered trucks are standard in Poland, where they still account for over 97% of the entire fleet. According to the data of the Polish Automotive Industry Association, in March 2020 there were 2848 natural gas-powered trucks in Poland, including LNG. However, automotive manufacturers have declared large-scale investments in zero-emission transport in the next dozen or so years. The first step is to reduce CO2 emissions by switching from diesel to LNG. Some LSPs, in cooperation with other entities from the supply chains, develop joint projects of using vehicles powered by electricity or fuel cells in everyday cargo traffic. The main challenge for the companies from the Polish LSP sector is currently a package of climate regulations entitled “Fit for 55”, tightening regulations in relation to the EU’s 2021 emission agreements. Some companies are already trying to make large investments to reduce fleet emissions and adapt to the new regulations in advance. The authors of this article, by evaluating the fleet emissivity index of the surveyed companies, decided to check to what extent the companies’ investment activities, aimed at reducing fleet emissivity, are correlated with the economic position they occupy in the LSP rankings. The results of these analyses are included in Section 4.2, Section 4.3, Section 4.4, Section 4.5 and Section 4.6. The main tools for the greening of LSPs are investments in a so-called low-emission fleet and energy-efficient autonomous solutions for warehouses and terminals. Moreover, the vast majority of MTI respondents, i.e., 39 out of 46 surveyed LSP entities, treat the modernization or replacement of vehicles as the basis for activities aimed at environmental protection. A study conducted by the MTI in 2022 shows, however, that pro-eco investments are not of much importance for LSP customers when choosing logistics and transport services. This opinion is shared by 64% of the surveyed service users. In order to widen the application of a low-emission fleet on the LSP market, it is necessary to introduce appropriate legislative and organizational changes, e.g., related to tax deductions, the simplification of investment procedures in the area of charging infrastructure or the provision of services with the use of this type of fleet based on co-sharing. The carriers will invest in a zero-emission fleet, as long as the system of financial incentives related to the purchase of this type of vehicle will balance the cost of a traditional vehicle with similar parameters. The equalization of prices for electric vehicles, compensated by government subsidies, will take place in Poland in 2025 [10,11,13,14]. Polish transport companies are expanding their fleets, but still have mostly older vehicles at their disposal. The dynamics of the changes in the field of rejuvenation of the fleet, however, are growing. In the first half of 2019, we registered 12% more vehicles meeting the highest emission standards than in the corresponding period of 2018. Although, in 2020, the number of such registrations decreased, it was dictated by the limitations resulting from the pandemic. The highest emission standards, i.e., Euro 6, were met in 2019 by almost 100,000 trucks from Polish transport companies, and another 80,000 met the Euro 5 standard. During this time, approx. 32,000 new trucks were registered annually and approx. 68,000 commercial vehicles [14]. In 2017–2020, the registration dynamics of light commercial vehicles significantly increased, which is in line with the observed trends in the development of the courier sector and groupage deliveries based on the e-commerce market; however, the youngest cars, up to four years old, amounted only to 14% of this vehicle fleet at the end of 2019 (Figure 3) [14].
Polish trucks are generally also not new, and, therefore, not ecological. Most of them, i.e., 30%, are over 20 years old. Vehicles aged 11 to 20 are the second largest group. For comparison, for four-year-old and younger trucks, there were about 22% recorded, at that time (Figure 3 and Figure 4). Trucks at Polish LSPs powered by gas (CNG, LNG, LPG or biomethane), in total, constitute only 0.05% of the entire fleet used by road carriers.
According to the Polish Automotive Industry Association, Polish LSPs are slowly investing in new vehicles, as shown by both the registration and production data. This also applies to companies that are at the forefront of LSPs. The increase in expenditure in this area is associated with an increase in the risk of insolvency. This applies to the greatest extent to transport companies, less often to logistics or courier ones. According to the data of the European Leasing Association, sales in the market of new trucks in Poland increased by 17% in 2020. The development of low-emission vehicles should double within 5 years. Many leading automotive manufacturers are already implementing their eco-solutions among LSP leaders.
The authors of this article decided to check, in their study, the involvement of the largest companies in the Polish LSP sector in the activities aimed at reducing fleet emissions. Therefore, the most appropriate way to measure the degree of greening of Polish LSPs was to count the relative and real share of low- or zero-emission vehicles (Euro 6) in the total fleet used by them [13,14].

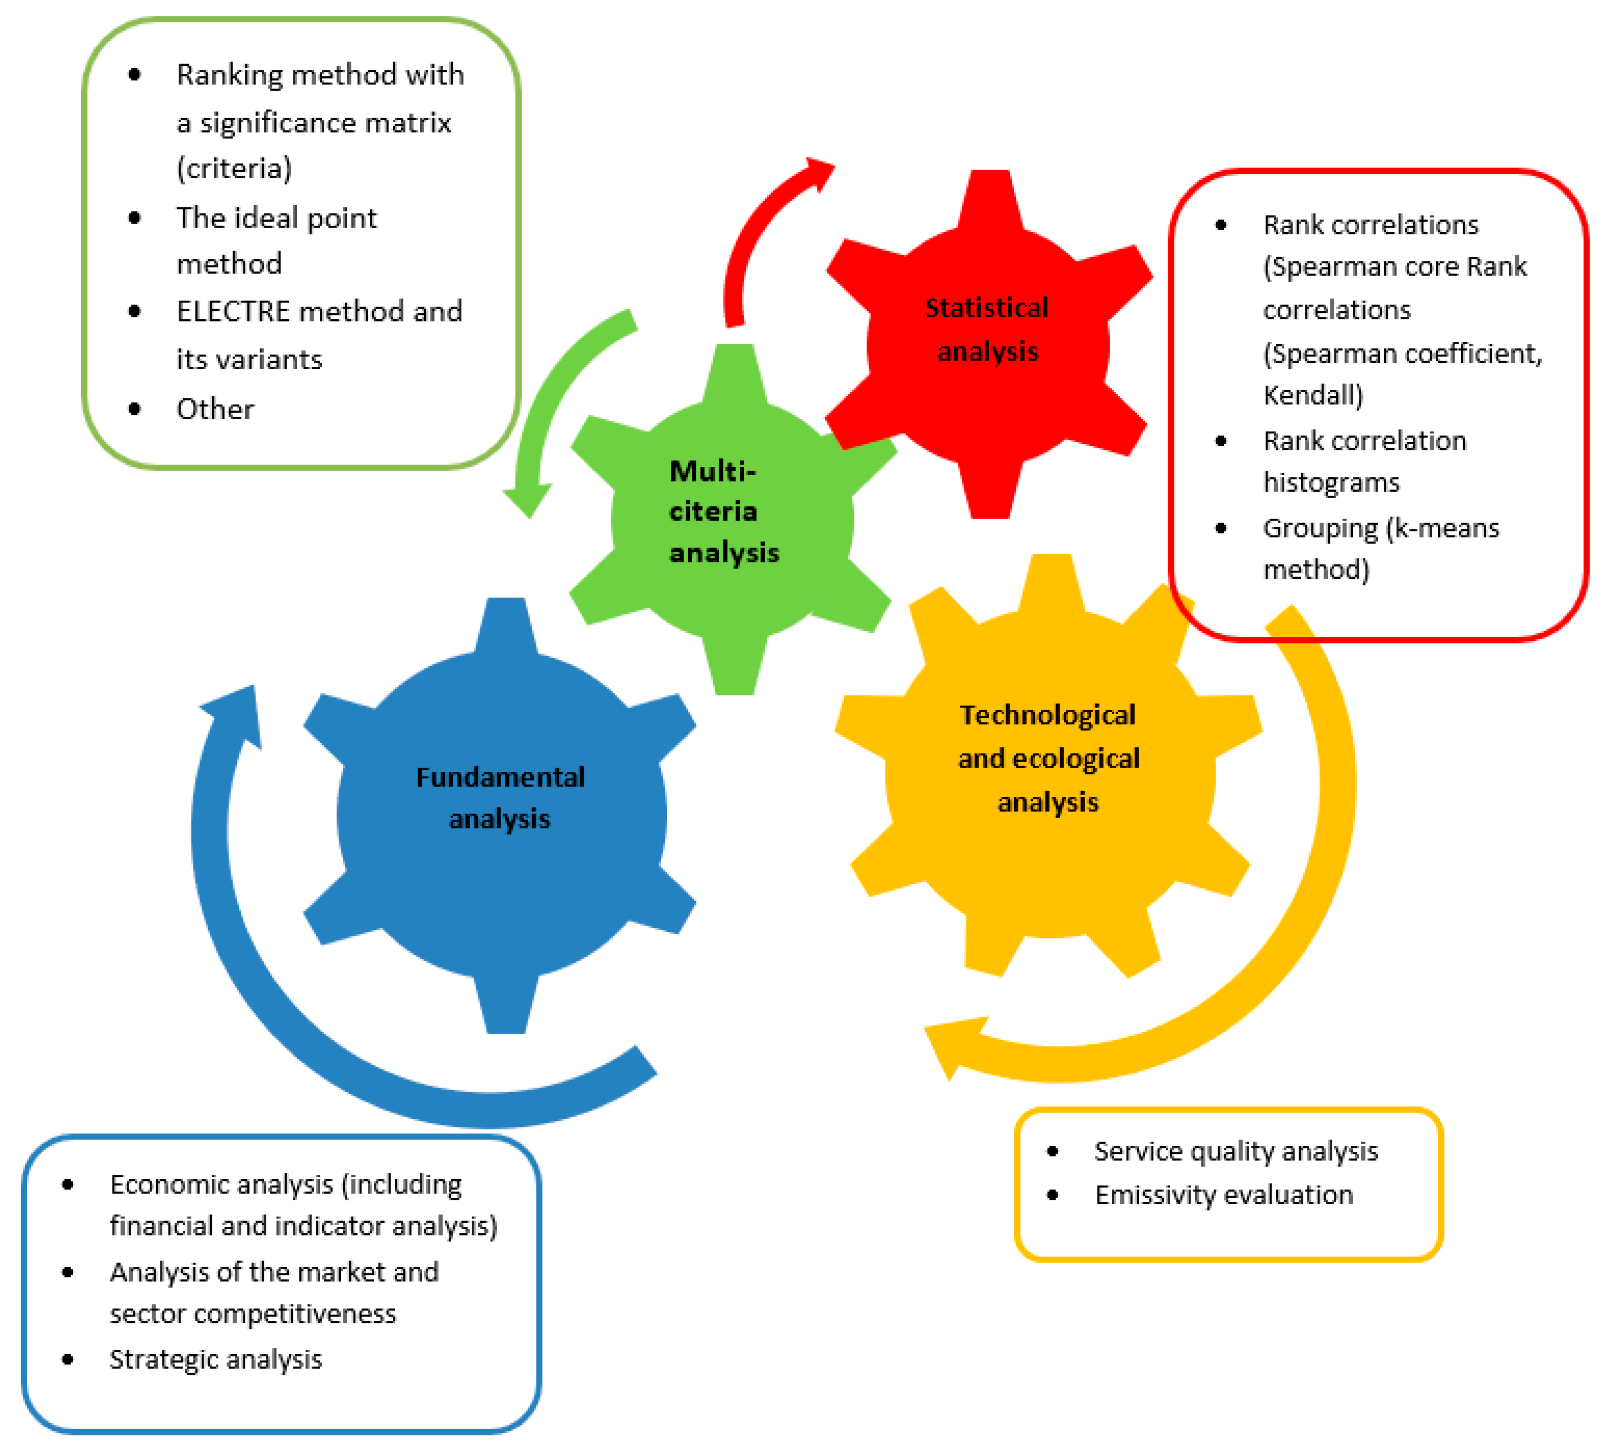
3. Methods Used in the Evaluation of LSPs

The evaluation of the functioning of LSPs is carried out in scientific practice in Poland on many levels, most often involving:
  • Multi-criteria evaluation, allowing to take into account many diagnostic criteria used, for example, in fundamental or technological analysis, and especially in the scope of evaluating the quality of services, arranging them in terms of importance or interaction [15,16].
  • Fundamental analysis [17,18], i.e., economic analysis with elements of macro-environment assessment, the main element of which is the financial analysis of LSPs, including the indicator analysis, often combined with the strategic analysis or market analysis [18,19].
  • Statistical analysis, i.e., the use of statistical tools to create the characteristics most and least correlated in the assessment of LSPs, consisting solely of economic or mixed parameters [20,21].
  • Technological analysis, taking into account the parameters for assessing the quality of LSP services [18,22] or the emissivity [12,13,17,19] in a quantified manner.
While it is impossible to conduct research only in areas 1 and 3, without access to the data obtained under methods 2 or 4, conducting selected types of fundamental or technological analyses is quite common [17,19]. On the other hand, the growing complexity and “networking” of logistics chains, the unflagging amplitude of fluctuations and the disappearance of periodicity in business situation changes condemns to failure most forecasting methods. The postulates of LSP market analysts are right to focus attention on the proven methods of multivariate assessment, taking into account the selection of sector-specific criteria, at the expense of extrapolating the future based on models [22,23].
In schematic terms, the methods and tools most often used in the comparative assessments of companies from the LSP sector can be presented as in Figure 5.

3.1. Multi-Criteria Analysis

In the developed market economies, apart from the traditional economic analysis (to simplify—fundamental one), tools are used that allow to evaluate the conditions of its environment and of the strategy of action in a broader sense. Such combined analyses are often multi-criterial in nature. The method for the multi-criteria evaluation of logistics and transport companies is known in the Anglo-Saxon and German-language scientific literature [8,15,16,24,25]. In the Polish literature on the subject, multiple-criteria decision analysis (MCDA) methods were not used in evaluating LSPs, although they could be used to compare entities using many sets of criteria, with different levels of categorization. This method is rather often used in optimizing decision-making processes at the operational and management level among LSP recipients in Poland. In this case, mainly sets of quality criteria with indicative weights are used. Thanks to those, the choices of suppliers and LSP services at large manufacturing companies are optimized. In the Polish reality, MCDA is most often focused on optimizing decisions related to the selection of an LSP contractor or management and operational activities at the companies in this sector [26,27]. This method does not consider decision variables. Thanks to this method, companies could be assigned to separate LSP categories and evaluated within them, as well as roughly, against the background of the entire sector or an arbitrarily defined group of entities (leaders, background, tail). In the literature on the subject, there are individual studies in the field of multi-criteria analysis of transport companies, including the works of M. Jacyna (2014–2018), K. Lewczuk (2014–2017), J. Żak (2017), T. Trzaskalik (2016), E. Szczepański (2016–2018), T. Gajewska (2015), J. Frąś (2014), T.L. Saaty (2006–2014), R.L. Keeney’a (2010–2012), D. Rogersa (2009–2011), Y.T. Changa (2001–2008). However, they lack studies dealing with the issue of multi-criteria assessment in relation to a wide group of LSP service providers, taking into account their segmentation. Studies on LSPs using this method refer almost exclusively to decision-making processes at the operational and management level [27].
In practice, research on the LSP sector lacks cyclical analyses with the use of its tools. This makes it impossible to infer on the basis of MCDA and it does not allow to follow trends occurring in this sector. Systematic evaluation with the use of multi-criteria tools would be particularly desirable in sectors such as parcel (courier) or contract logistics, or groupage transport characterized by the highest competitiveness and profitability, and with high entry barriers [25,26,27].

3.2. Fundamental Analysis

There are many methods for the fundamental analysis of an LSP enterprise. They are closely related to the accounting and internal information system of the enterprise, they are based on the processing of data from the accounting and statistical records, as well as macro- and micro-economic indicators [16,17,19]. Often, in simplified terms, they are referred to as economic analysis. Tools characterized by the simplicity of use, objectivism and enabling simplified comparative economic analysis along with the evaluation of the investment attractiveness of the companies are particularly sought after in the LSP sector. These are methods that use tools commonly used in valuation in capital markets [22,24,25]. Fundamental analyses for the diagnosis of the economic condition include the analysis of the macro-environment, the sector in which the company operates, as well as the analysis of its finances and the appraisal of its value [17,25]. However, conducting a fundamental analysis of LSPs in the broad sense is difficult due to the problem of obtaining financial data on individual companies. Many entities in the industry delay their publication, which results from a strong competitive pressure, along with low entry barriers to the LSP market. The negligible representativeness of LSPs on the Polish stock exchange makes access to source data more difficult. Classic financial analysis, and in particular its core in the form of ratio analysis, is associated with certain limitations. The excess of economic and financial indicators makes it difficult to clearly diagnose the actual condition of the LSP enterprise. The results of the obtained research should be subject to various evaluation criteria. Classic financial analysis in the case of comparing many entities with each other is associated with the need to process too much data. The large diversity of formulas and standards considered normative for individual indicators is problematic. The most common selection of indicators is based on the classic Du Pont Model [26,28], which shows the interrelationship between indicators in the area of profitability. It allows us to understand that the return on equity depends primarily on three factors: the profitability of net sales, the effectiveness of the use of assets, i.e., their rotation and the equity multiplier. Based on the economic analysis on it, it is easier to find the source of profitability of the LSP company. Although the model itself is one of the oldest and best-known tools for the economic analysis of enterprises, its usefulness has not decreased. In view of the network of economies, which increasingly rely on so-called shared assets, the emphasis of the two key profitability ratios on which the model is based has shifted from ROA to ROE. In order to conduct comparative ranking research for LSPs, it is also necessary to properly select a broadened indicators set, preceded by the opinion of their stakeholders. Establishing a set of indicators for ranking assessment, the Hellwig method or the TMAI model can be used [16,17,24,25,29]. Before the final selection of the partial indicators for collective evaluation, it is necessary to determine the degree of correlation between them. The objective is to obtain an “aggregated” ranking in the form of characteristics with different degrees of correlation. When analyzing financial indicators, the level of their mutual correlation is examined. Selecting only indicators that do not show correlation at the significance level of alpha = 0.05 would mean that the evaluations conducted using such a set of parameters would be defective. The financial analysis adapted to the LSP assessment should include profitability analysis on three levels (assets, capital and turnover, which results from the base model), additionally the debt, operational efficiency, dynamics of revenues, costs, balance sheet structure and liquidity, although there are other specific sets of measures for financial evaluation according to the individual sector of activity [25,26,29].
The parameters for evaluating the profitability of LSPs most often used in the sector statements, in relation to LSP entities, are selected elements of financial analysis, which include revenues and net profit, assets (fixed and current), costs, equity and short-term liabilities, as well as the indicator dynamics of each of these parameters. Profitability indicators are based on the above-mentioned financial data of the companies. The return on equity (ROE) indicator, together with the return on assets and sales indicators, is one of the most frequently used measures of operation and assessment of the development prospects of companies [30]. Return on equity is the most frequently used tool for the fundamental analysis by potential investors, not only in the LSP sector. ROE is the basic indicator for evaluating the development prospects of LSPs [17,22,24,29].
R O E = N e t   p r o f i t E q u i t y ,
Whilst, Equity = Total assets − Liabilities (short-term and long-term). The remaining profitability indicators are defined as follows:
R O S = N e t   P r o f i t S a l e s   R e v e n u e ,
R O A = N e t   P r o f i t T o t a l   A s s e t s ,
and are also called net profit margin and it differs from ROE in the fact that total assets are used as a divisor of net profit, without deducting liabilities [24,25,29].
High ROE values signal that a company that is able to consistently achieve high returns on its equity also has a lasting market advantage, which may justify investing in its shares or planning a possible acquisition. Most often, such an advantage is the technology, in particular in the field of IT, for managing multi-layer supply chains, as well as the brand or trademark. On the other hand, high returns on equity, especially in the LSP sector, foster the sharpening of the competitive struggle, forcing additional expenditure on pro-innovative activities and anticipating the strategies of market rivals. The optimal level of ROE in the Polish LSP sector is considered to be 10–15%, as a higher ROE value is difficult to maintain in the long-term [17,22,24,28,29].
In the case of ROA, the range of 8–10% is considered to be the optimal value in the Polish LSP sector. Although the desired ROE value by investors would be several dozen percentage points. Hence, the stable results of ROE, and ROA at the level of 10–15%, maintained for several consecutive years, are much more appreciated by industry observers than 30%. Similar recommendations apply to the return on sales (ROS). Therefore, when assessing LSPs, it is always worth paying attention to the graph of the historical approach to them, ROE, ROS and ROA, and to compare them with the values for the industry and its individual sectors in the analyzed periods [17,22,28].
In the case of the CR indicator, i.e., the current ratio, it is the company’s short-term liquidity indicator, which shows what its ability to pay off current liabilities is. It is expressed by the formula:
C R = C u r r e n t   a s s e t s C u r r e n t   l i a b i l i t i e s ,
If the value of the current assets is two times higher than the short-term liabilities, it is usually assumed that the company is liquid and has no problems with the repayment of the current liabilities (indicator of 2 approx.). A worrying situation is when the value of the company’s short-term liabilities exceeds its current assets (indicator below 1) [17,22,24,28]. It means financing fixed assets with short-term liabilities and upsets the financial balance. It signals that the company has problems with paying its current liabilities, which may lead to insolvency or bankruptcy as a consequence. In the LSP industry, periodic drops in the CR index below the level of 1 are not uncommon, which is largely caused by rising employment costs. In practice, it is assumed that the appropriate values of the CR index for the Polish LSP sector are within 1.2–1.5 [17,22,24,28].
In analyses of the LSP market in the world, similar values of indicators are being assumed, with much more attention being paid to stock market indicators resulting from the current and forecasted appraisal of companies and their shares, many of which are public entities and listed on international stock exchanges. In addition, logistics and transport companies are assessed more often in the international literature in terms of their net or operational margins rather than only their amount of revenues and their dynamics being analyzed [17,22]. Due to the high susceptibility of LSPs to bankruptcies, risk analysis and dynamic liquidity evaluation are also often conducted, taking into account statistical and econometric tools [17,20,21,22].
Portfolio methods are effective tools for the strategic evaluation of LSP enterprises and the services they provide, while one of the simplest and most commonly used tools is the SWOT analysis [30], less often PEST [31]. SWOT enables a relatively quick diagnosis of the strengths and weaknesses of LSP enterprises in individual sectors of activity, however, it is used to analyze individual companies or their small sets. The SWOT analysis, however, is burdened with disadvantages, which include subjectivism in the evaluation of individual factors, schematism and excessive simplification. This objection also applies to other tools of strategic assessment tools. Among them, the most popular are Porter’s Five Forces Analysis (POAS) [30,31] and key success factors analysis (KSFA) [29,30]. These methods in the case of evaluating many LSPs are too time-consuming, and they also require obtaining a lot of data from the micro- and macro-environment as well as knowledge and skills that make their cost significant.

3.3. Statistical Analysis of LSPs (Including Economic and Ecological Parameters)

Statistical analyses conducted in the LSP sector can serve various research purposes. They determine the selection of statistical evaluation methods and tools [20,21]. The authors decided to examine the degree of correlation between the partial indicators adopted for the study, using static tools for several reasons:
Firstly, to evaluate to what extent partial assessments do not duplicate each other, if the research objective was to create one aggregated assessment indicator. Then, it would be necessary to assign lower weights to the partial rating indicators with high mutual correlation coefficients (especially in the same subgroups concerning debt or profitability).
Secondly, to see the possibility of separating three homogenous subsets clearly distinguishable from the rest of the surveyed companies, characterized by highly similar values of features. The idea was to select subsets of the following character: leaders, background and tail, and the possibility of conducting observations in them over subsequent years, taking into account their common features, if it was possible to identify regularities and similarities between them [21].
Thirdly, to determine the possibility of developing a collective ranking based on the signatures of pairs of numbers obtained on the basis of counting the obtained first and last positions in the partial rankings, given the relative differentiation in the correlation coefficient for all the adopted partial ratings, characterized by a linear relationship.
Statistical analyses are most often conducted using recognized statistical platforms [32], among others, R platforms https://www.r-project.org/ (and Cran (accessed on 10 October 2022)). They contain the basic methods and tools needed in multi-criteria evaluation, which enables to create various layers of LSP rankings. They include, in particular, rank methods, in which the sample is initially put in order, and each value of the distinguished feature is replaced with its position in ascending order—a rank in the list of all the values of this feature, or at least invariant due to the input data ranking operation [32,33,34]. The diagnostic base is the rank correlation according to Spearman, which allows to indicate the interdependence of the variables and the creation of histograms of their frequency, as well as the k-means method, which more graphically allows to group up the studied subjects and make further assessments in separate subgroups. All these tools and methods are available through the statistical platform. The results are presented in the form of appropriate matrices in a classic way. The Spearman (as well as Kendall’s) coefficients have been known for a long time and have a long history of use in research [32,33,34,35]. The tool base is the calculation performed according to the Spearman’s rank correlation formula of random variables (X, Y) with the use of an estimator based on the rank difference [35]. In practical application, the rank correlation coefficient is calculated for any given statistical sample. For this purpose, the formulas being used, the so-called approximations, are called estimators, which determine the level of correlation of a given rank or ranks. However, they should not be confused with the value.
The rank correlation histograms for the studied values give the frequency of occurrence of specific values of the correlation coefficients, according to the principle “the higher the more often” it occurs. In the case of the ranking evaluations of LSPs, the same sets of variables appearing in subsequent years are usually adopted. The heights of the bars in the histogram are in this case proportional to the number of coefficients that belong to a given range, determined on the horizontal axis (X).
There are also more recent statistical studies available, which offer a number of other possibilities of assessing the correlation coefficients, proposing slightly different methods of data ordering or rank estimators [33,34,36].
The rank correlation always assumes values in the range (−1, +1). It is interpreted analogously to the classical Pearson correlation coefficient, but with one exception. The linear relationship between the variables is not measured, and the other interactions are treated as disturbed linear relationships. While the rank correlation shows any monotonic dependence (also non-linear) [32,35,36]. The rank correlation model contains a broader class of dependencies than the classical correlation coefficient model but does not cover all possible relationships.
The calculation formula used in this respect is as follows—definition Equation (5):
ρ s = corr   F x X , F y Y
where
corr is the Pearson correlation coefficient [19],
r   = 1 n ni = 1 xiyi x ¯ 1 n ni = 1 x 2 i x ¯ 2 1 n ni = 1 y 2 i y ¯ 2
Fζ(u) variable distributor ζ in the point u
Fζ(uˉ) left-hand limit of the function Fζ(u) in the point u.
Then, the “accounting” version (7):
r s = 1 6 n 3 n i = 1 n d i 2 T x T y 1 6   n 3 n 2 T x 1 6   n 3 n 2 T y
where
di = Rxi − Ryi
T x = 1 12 j t j 3 t j
T y = 1 12 k u k 3 u k
tj is the number of observations in the sample having the same j-th rank value of the variable X [35,36].

4. An Example of Applying a Sustainable Method for Assessing LSPs

In this study of companies, the use of a balanced method for evaluating TSL companies was adopted. Its purpose was to indicate:
  • A set of indicators for the comparative economic evaluation of LSP companies;
  • Examining the degree of correlation of the economic indicators in order to ensure a reliable evaluation;
  • Determining the fleet emission index and checking its correlation with the economic indicators;
  • Changes in the rankings for 2020–2021 using different sets of indicators;
  • Determining the method for the positioning of companies in the ranking;
  • Determining the indicators for the aggregate evaluation of LSP sector companies based on the convergence of the rankings.
Grouping of the surveyed companies was based on the adoption of the k-means method [33,34,35], based on the tools developed by Lloyd, S.P. (1957, 1982) [35,36,37] and L.M. Le Cam and J. Neyman [29,35,36]. The studying of the correlations between the achieved parameters, as well as their dynamics of the changes, was conducted using the Spearman method. Companies were also ranked using the rank method based on the obtained two-number signatures, which are a derivative of the linear ordering of entities based on the maximization of the obtained values of the partial variables.
Comparing the ranking correlations for both years using different sets of indicators shows that:
  • The use of a set of partial indicators with diversified correlation results in a greater similarity of the rankings in successive years;
  • The use of a set of indicators only from the same group (e.g., profitability) and with a high correlation (above 0.8) causes more randomness of the rankings in subsequent years;
  • When selecting a set of partial indicators for the LSP ranking evaluation, care should be taken to select measures from various groups (profitability, operational efficiency, liquidity and debt) and to examine the correlation between them as well as selecting a set of indicators with a greater dispersion of the correlation coefficient value.

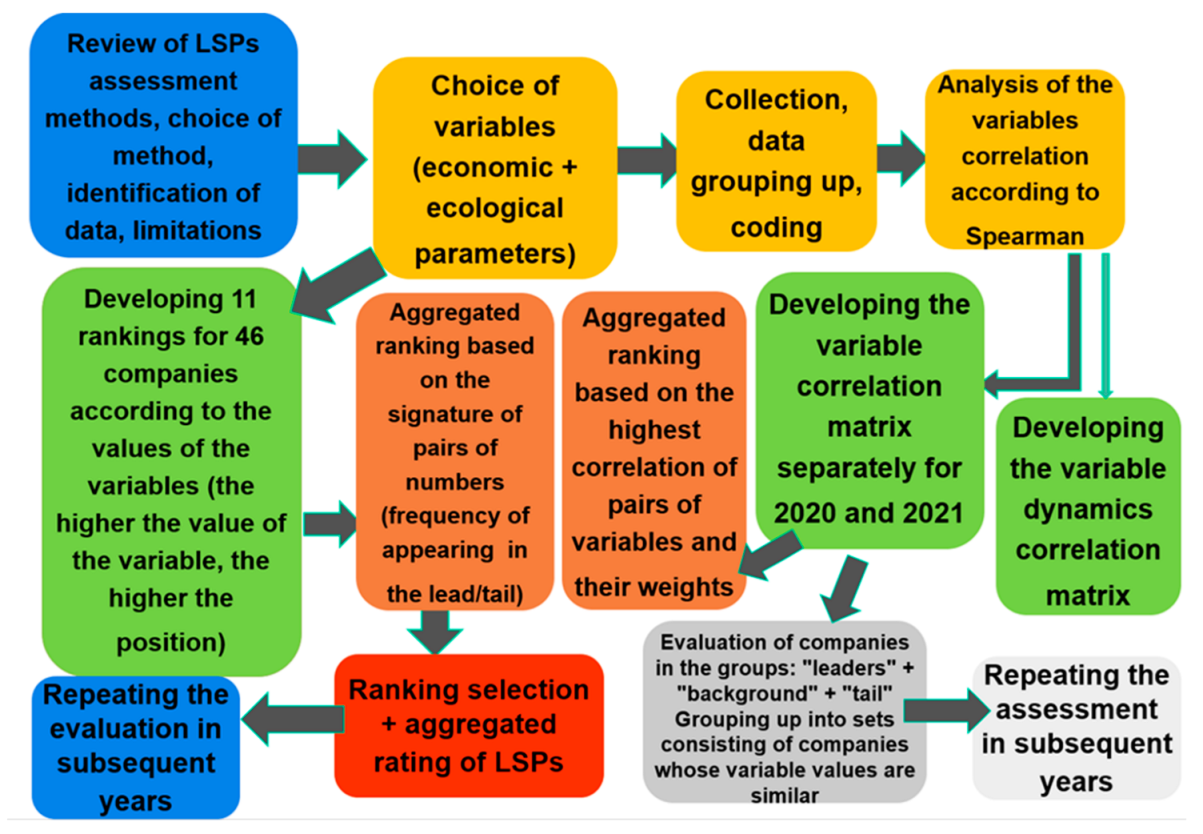
4.1. The Scheme and Stages of the Study

This study, using a sustainable method, evaluated the economic condition of 46 LSPs operating on the Polish international market and registered in Poland. The analysis incorporates 10 economic evaluation parameters, most often used to assess the competitiveness of entities in this sector, i.e., return on equity, current liquidity index, sales profitability, return on current assets, return on fixed assets, return on total assets, income dynamics index, net profit dynamics index, net profit dynamics and debt dynamics index. They are described in detail in Section 3.2, and the tools and methods for statistical inference used to study the correlation between them are presented in Section 3.3. For this purpose, six key types of data of the analyzed entities for the period 2020–2021 were collected, concerning the amount of revenues and net profit achieved, as well as the value of assets, equity and current liabilities. The parameter of their greening was taken into account, based on the coefficient of applying low-emission solutions. The aggregated evaluation took into account 11 parameters, i.e., 10 economic (described in Section 3.2) and 1 environmental indicator (indicated in Section 3.1). It was presented using the index of the share of low-emission vehicles (Euro 6 standard or higher) in the entire fleet of the examined entity. It is the frequently used emissivity evaluation indicator among carriers [11,20,23,25,38]. All the companies surveyed in 2020–2021 had revenues in excess of PLN 3 million net, with at least 60% of their value coming from LSP activities. Average employment, amounting to 71 people in this group, was not a criterion for selecting the sample. Then, the rankings of the companies were developed based on the adopted variables, taking into account the degree of correlation between them. The key factor for the results of the work was the assumption that all the variables considered were similar in the sense that, in principle, the greater the value of a given characteristic, the better the condition of the company [25,38,39].
In the first stage, the data were collected and grouped up for the analysis of the financial standing of the companies, taking into account the evaluation of their profitability (equities, sales, assets), liquidity, dynamics of revenues and profits, as well as the assessment of the value of the companies in connection with the evaluation of the degree of their greening. Carrying out a multi-criteria evaluation of Polish LSPs required the use of statistical as well as economic and technical tools and proceeded according to the following steps (Figure 6):
  • Review of LSP assessment methods;
  • Choice of partial characteristics (indicators);
  • Data collection and grouping up of companies, coding;
  • Analysis of the variable correlation;
  • Developing the variable correlation matrix;
  • Evaluation of companies in the subgroups (leaders, tail, background);
  • Development of 11 partial rankings and aggregated one based on the characteristics of the two-number signatures of LSPs.

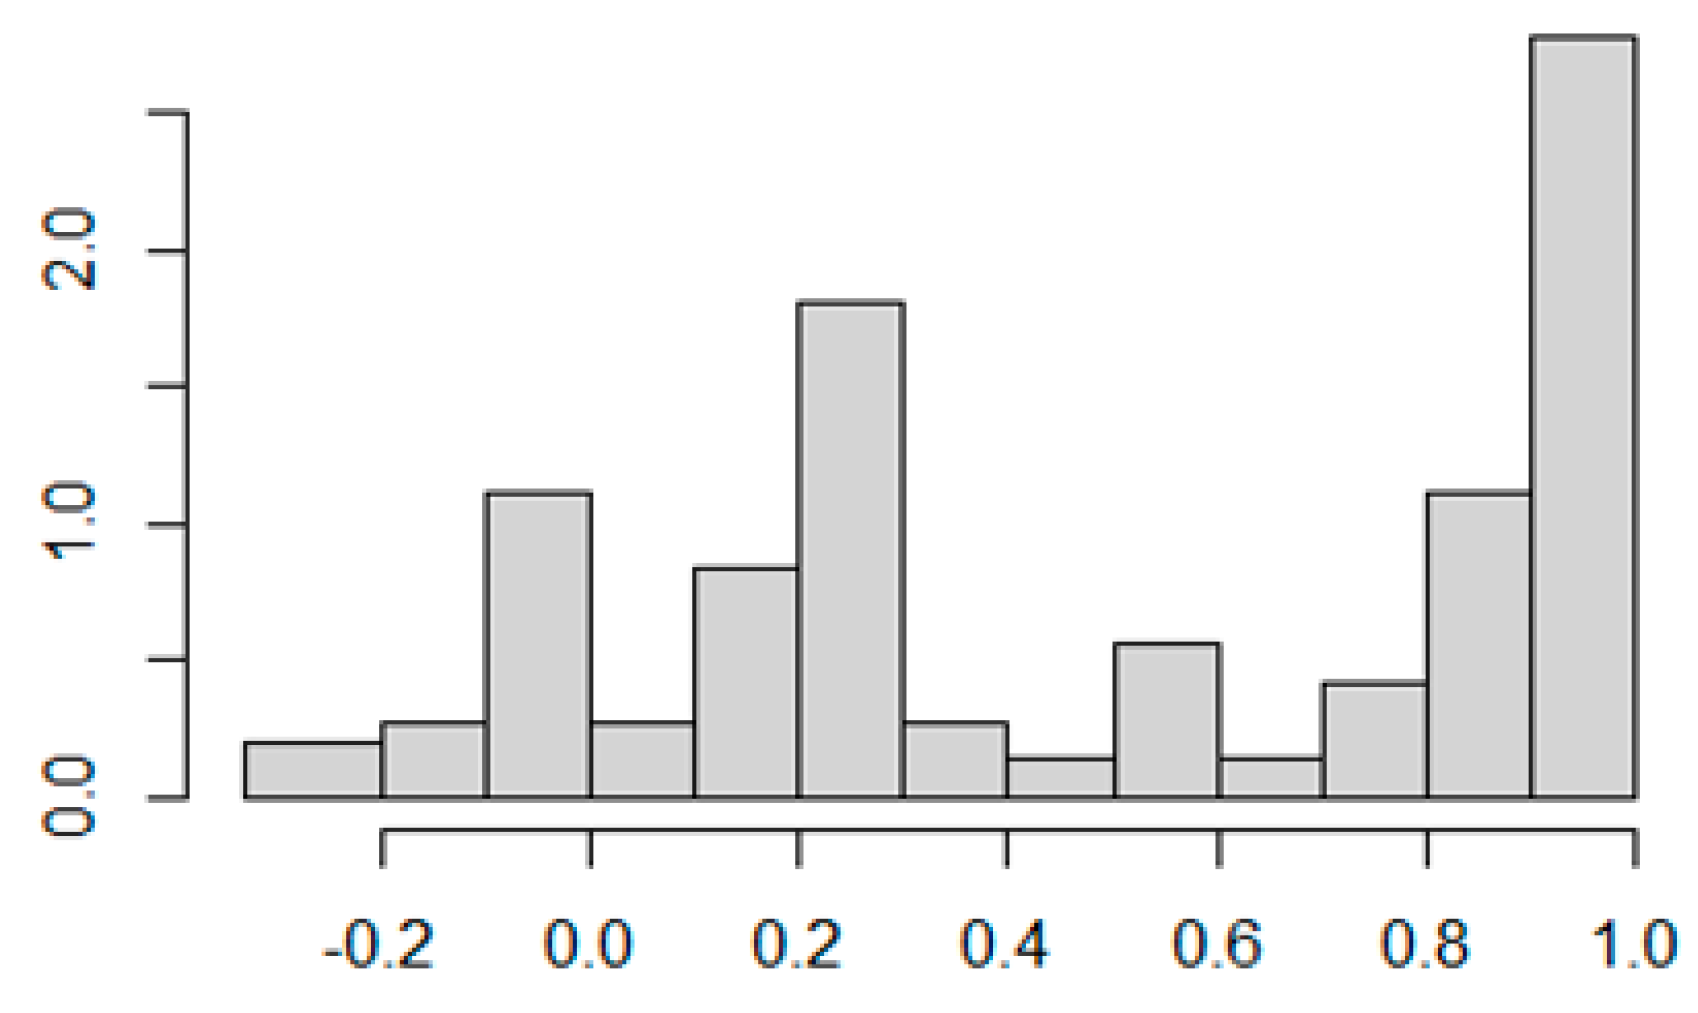
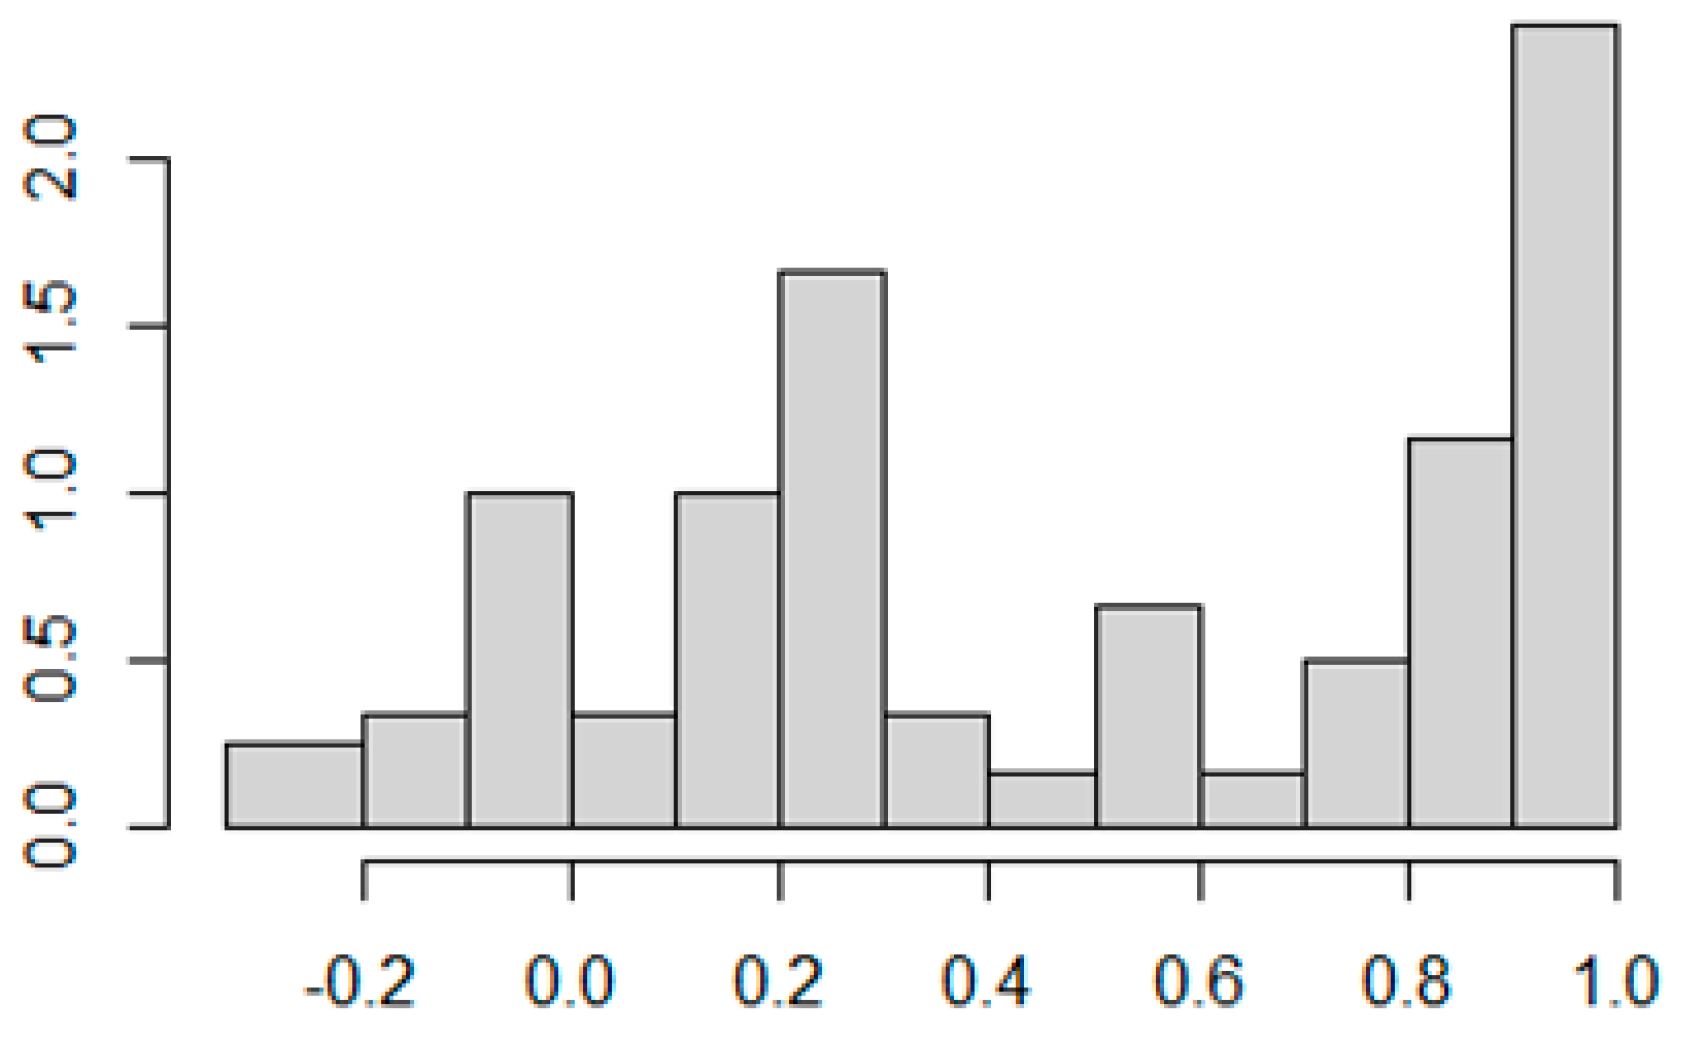
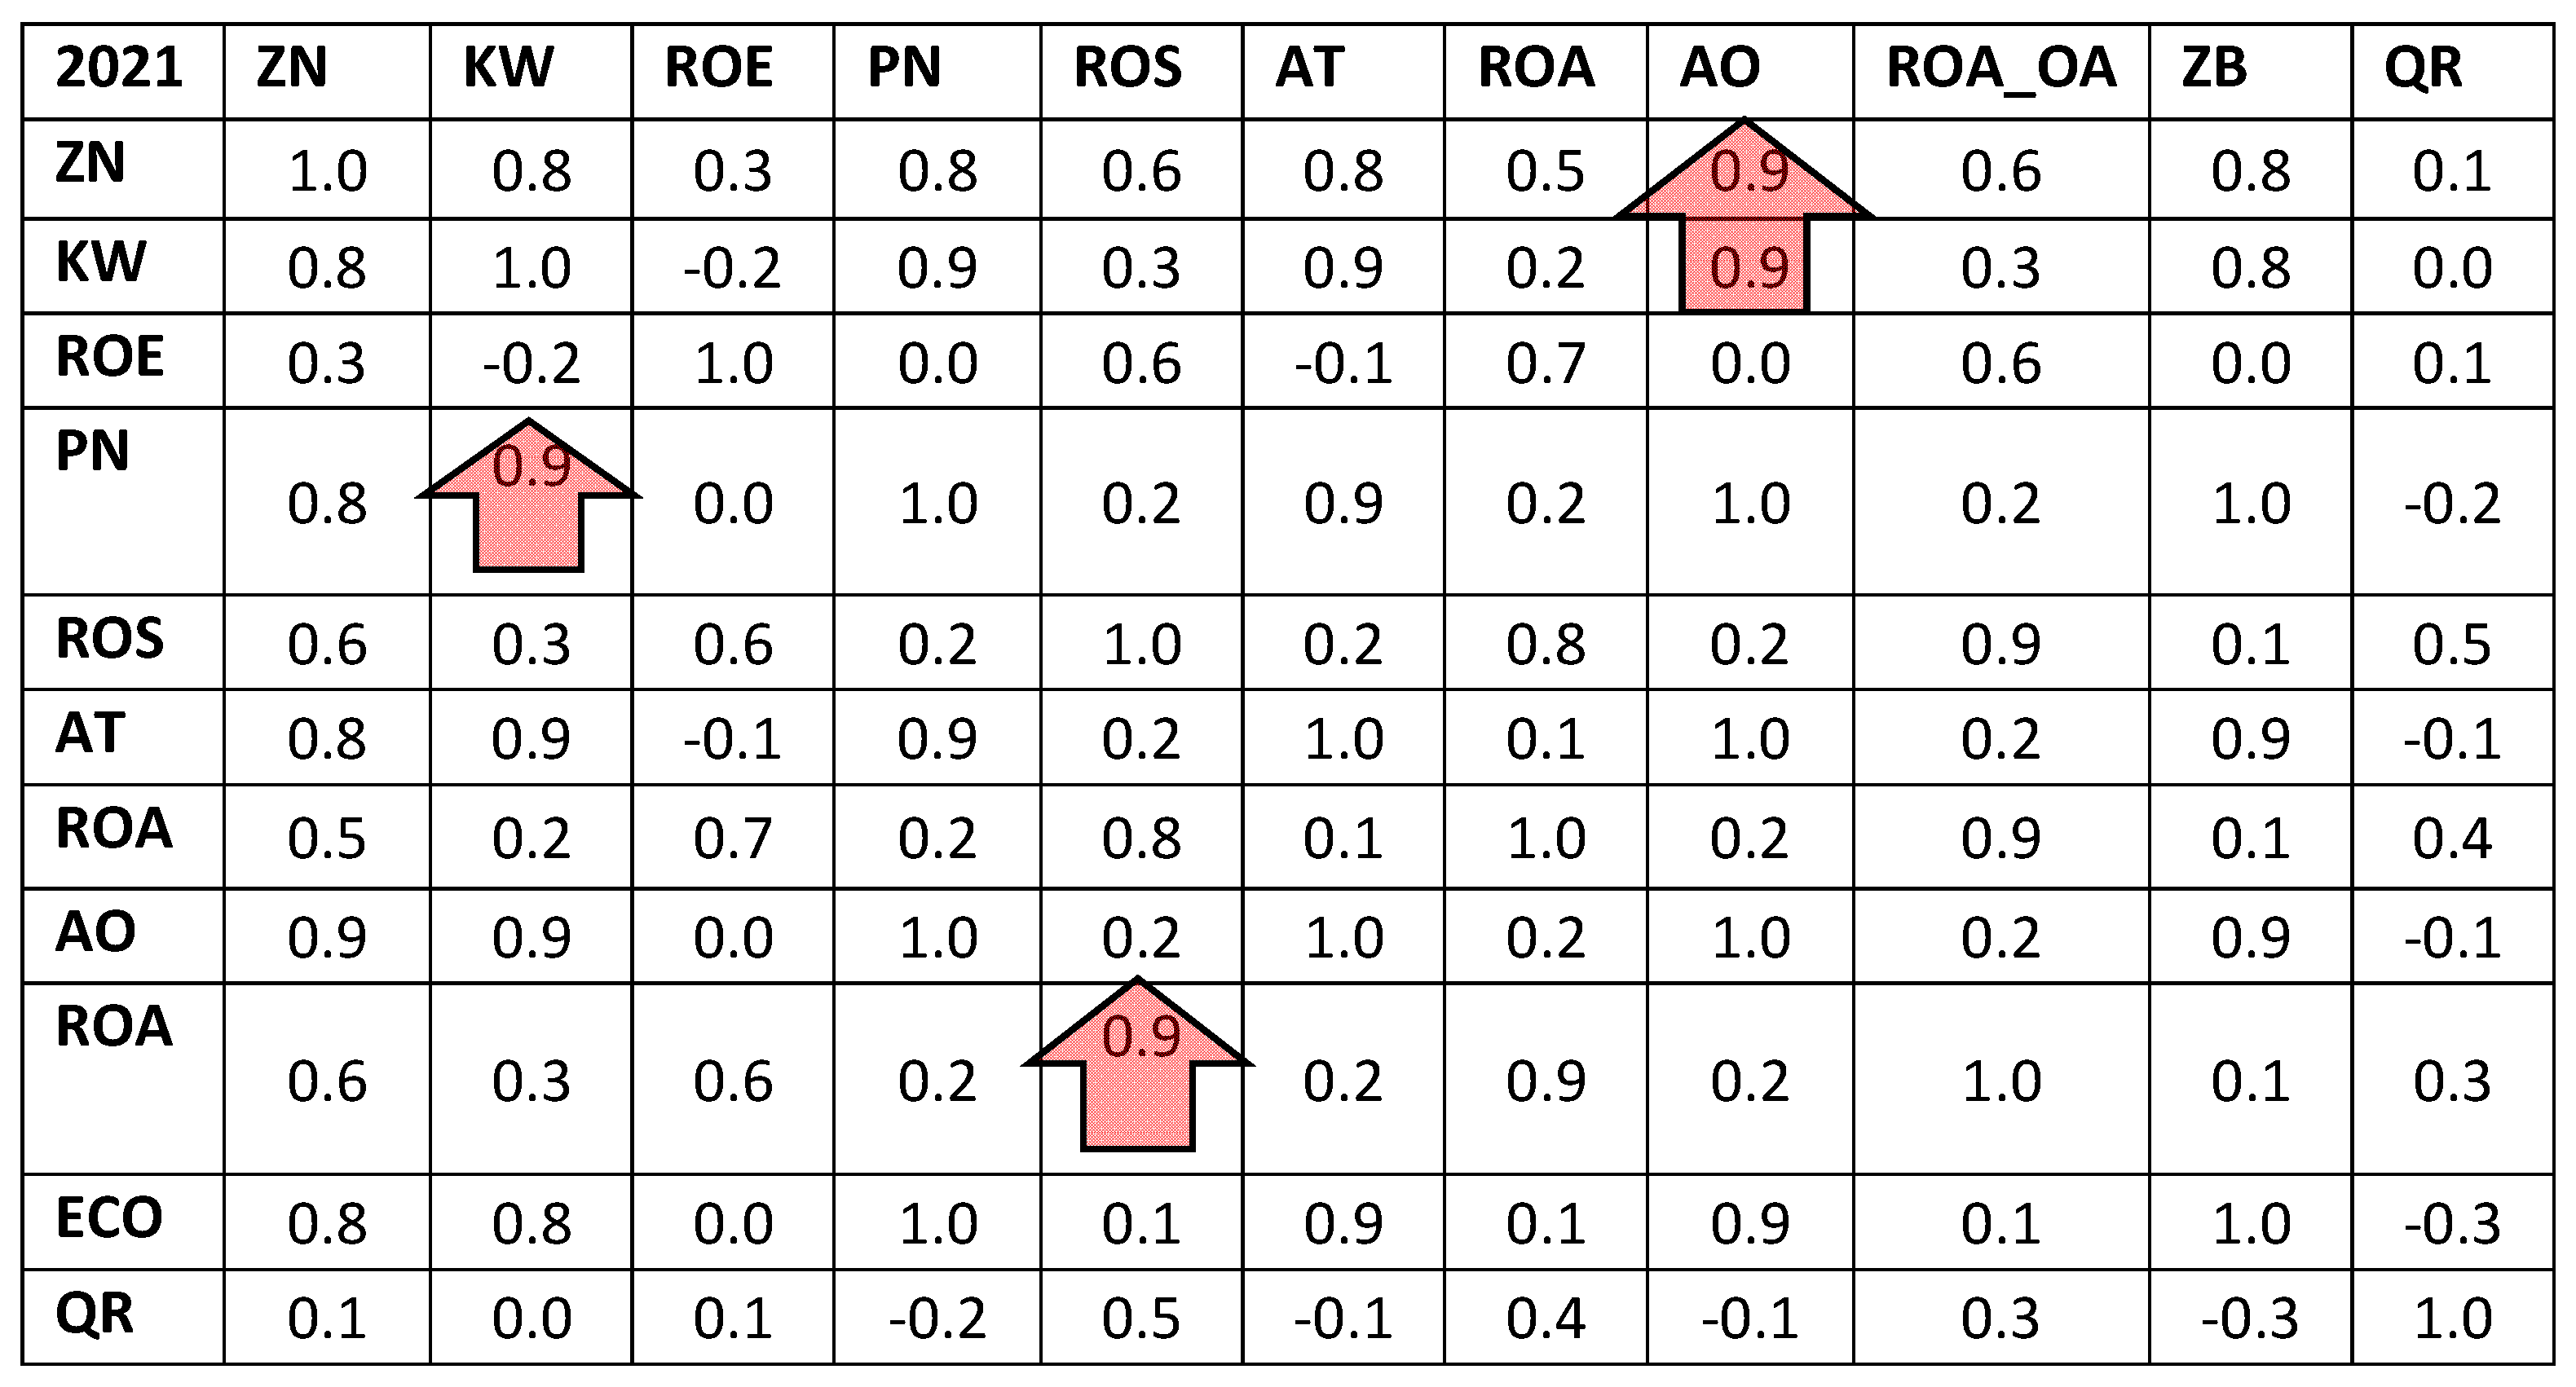
4.2. Characteristics Correlation

In the analysis of the LSPs, numerical parameters and indicators adopted on that basis were used. This study began with the development of the so-called priority matrix of criteria, assuming that there is a difference between the weight of the individual evaluation criteria of the LSPs and the degree of correlation between them. As part of the research, the values of the rank correlation coefficients were calculated according to Spearman for 46 companies and 11 examined variables (10 financial ones and 1 eco emissivity parameter). Based on these results, two matrices were created separately for 2020 and 2021. In the research on correlation, the results in the form of created matrices were quoted, based on the Spearman coefficient, referring to Spearman’s and Kendall’s statistics theory. This tool was adopted because the Spearman’s rank method is only slightly sensitive to outliers, which makes it particularly useful in the analysis of low-quality data. Information obtained from the LSPs is one of these. The values of any statistical measures calculated from the sample are conveniently considered as estimators (approximations) of measures calculated based on the distribution of the random variable from which the sample was drawn. In the case of the correlation measures, for the variables, X, Y, it will be a two-dimensional vector distribution (X, Y). Spearman’s rank correlation of random variables, X and Y, is expressed by the formula given in Section 3.3 [32,33,34,35,36]. It turned out that many financial variables were correlated (at the level ≥ 0.6), slightly fewer at the level of 0.4 and relatively few were correlated in the range 0.4–0.8. The matrices calculated for both years turned out to be similar as the maximum difference in the respective elements did not exceed 0.22. This prompted the claim that the rankings of the companies did not change significantly in the analyzed years. The distribution of the empirical values of these coefficients is presented in Figure 7 and Figure 8 (unit values of the coefficient obtained for pairs of identical variables were omitted). The vertical axis shows the relative frequency of occurrence of r values within a given range. In both periods, the most common are very large values (close to 1), which correspond to a high similarity in the rankings, and values not much higher than zero, which correspond to the rankings of companies that are not very similar to each other [35,36,38,39].
The rank correlation histograms (for the years 2020–2021) indicated the frequency of occurrence of the correlation coefficients’ specific values, according to the rule “the higher, the more often”, and the height of the bars was proportional to the number of coefficients that belonged to a given range (on the horizontal axis). For example, for 2020, the most common coefficients in the correlation matrix were in the range above 0.9 and 0.2–0.3.
The main objective of this study, i.e., obtaining the structure of an “aggregated” ranking of companies in the form of a selected set of comprehensive characteristics, has been achieved. Thanks to this, it will be possible to compare many aspects of the activities of the surveyed LSPs in the coming years based on the proposed solution.
It was found that the highest correlation was achieved by the following evaluation parameters:
  • Net profit and equity (0.9);
  • Net profit and net revenues (0.8);
  • Net profit and fixed assets (0.7–0.8).
Among the economic indicators, the most correlated were the assessments made on the basis of ROA and ROS (0.9), as well as ROE and ROS (0.6). It is presented in Scheme 1 and Figure 9 and Figure 10.
Research conducted on a sample of 46 LSP entities operating on the Polish market shows that only 11% of them made pro-ecological investments in 2020–2021, in particular related to zero- or low-emission vehicles or modernized them. However, the scale and nature of these changes was quite accidental in the studied group, both in 2020 and 2021. On average, every fourth LSP made any investments in low-emission vehicles during the analyzed period. However, the correlation between the greening index and the financial indicators was low or negative. Based on the research conducted, one cannot conclude that the good economic position of Polish LSPs was conducive to investments to reduce CO2 emissions. However, in the whole group of indicators adopted for this study, their correlation varied (−0.2–0.9) and it was appropriate to achieve the set objective.
The correlation matrices for both years developed for the set of indicators correlated within range (−0.2–0.9) was different than for the set of indicators correlated within range (0.8–1). The matrix based on the more diverse set of indicators in terms of correlations showed a greater convergence with the other rankings. In conclusion, the setting of a set of indicators of a diverse correlation convergence (−0.2–0.9) gives a greater convergence of the rankings [33,34,35].
The thesis on the selection of the rating indicators for LSP companies with a diversified mutual correlation to ensure a better convergence of the rankings has been confirmed.
The thesis about the correlation between the financial condition indicators and the degree of application of pro-ecological solutions, in particular in the field of a low-emission fleet, has not been confirmed. Investments in this area are still characterized by negligible nature, high randomness and image-related motivation in response to the trend observed in the world. Rarely are investments in a low-emission fleet influenced by a thoroughly conducted economic analysis. Although, on average, every fourth LSP invested in low-emission vehicles in the analyzed period, the degree of correlation of the greening index with the financial indicators was low or even negative (Figure 9 and Figure 10). The hypothesis that the good economic position of Polish LSPs was conducive to investments to reduce CO2 emissions was not confirmed.

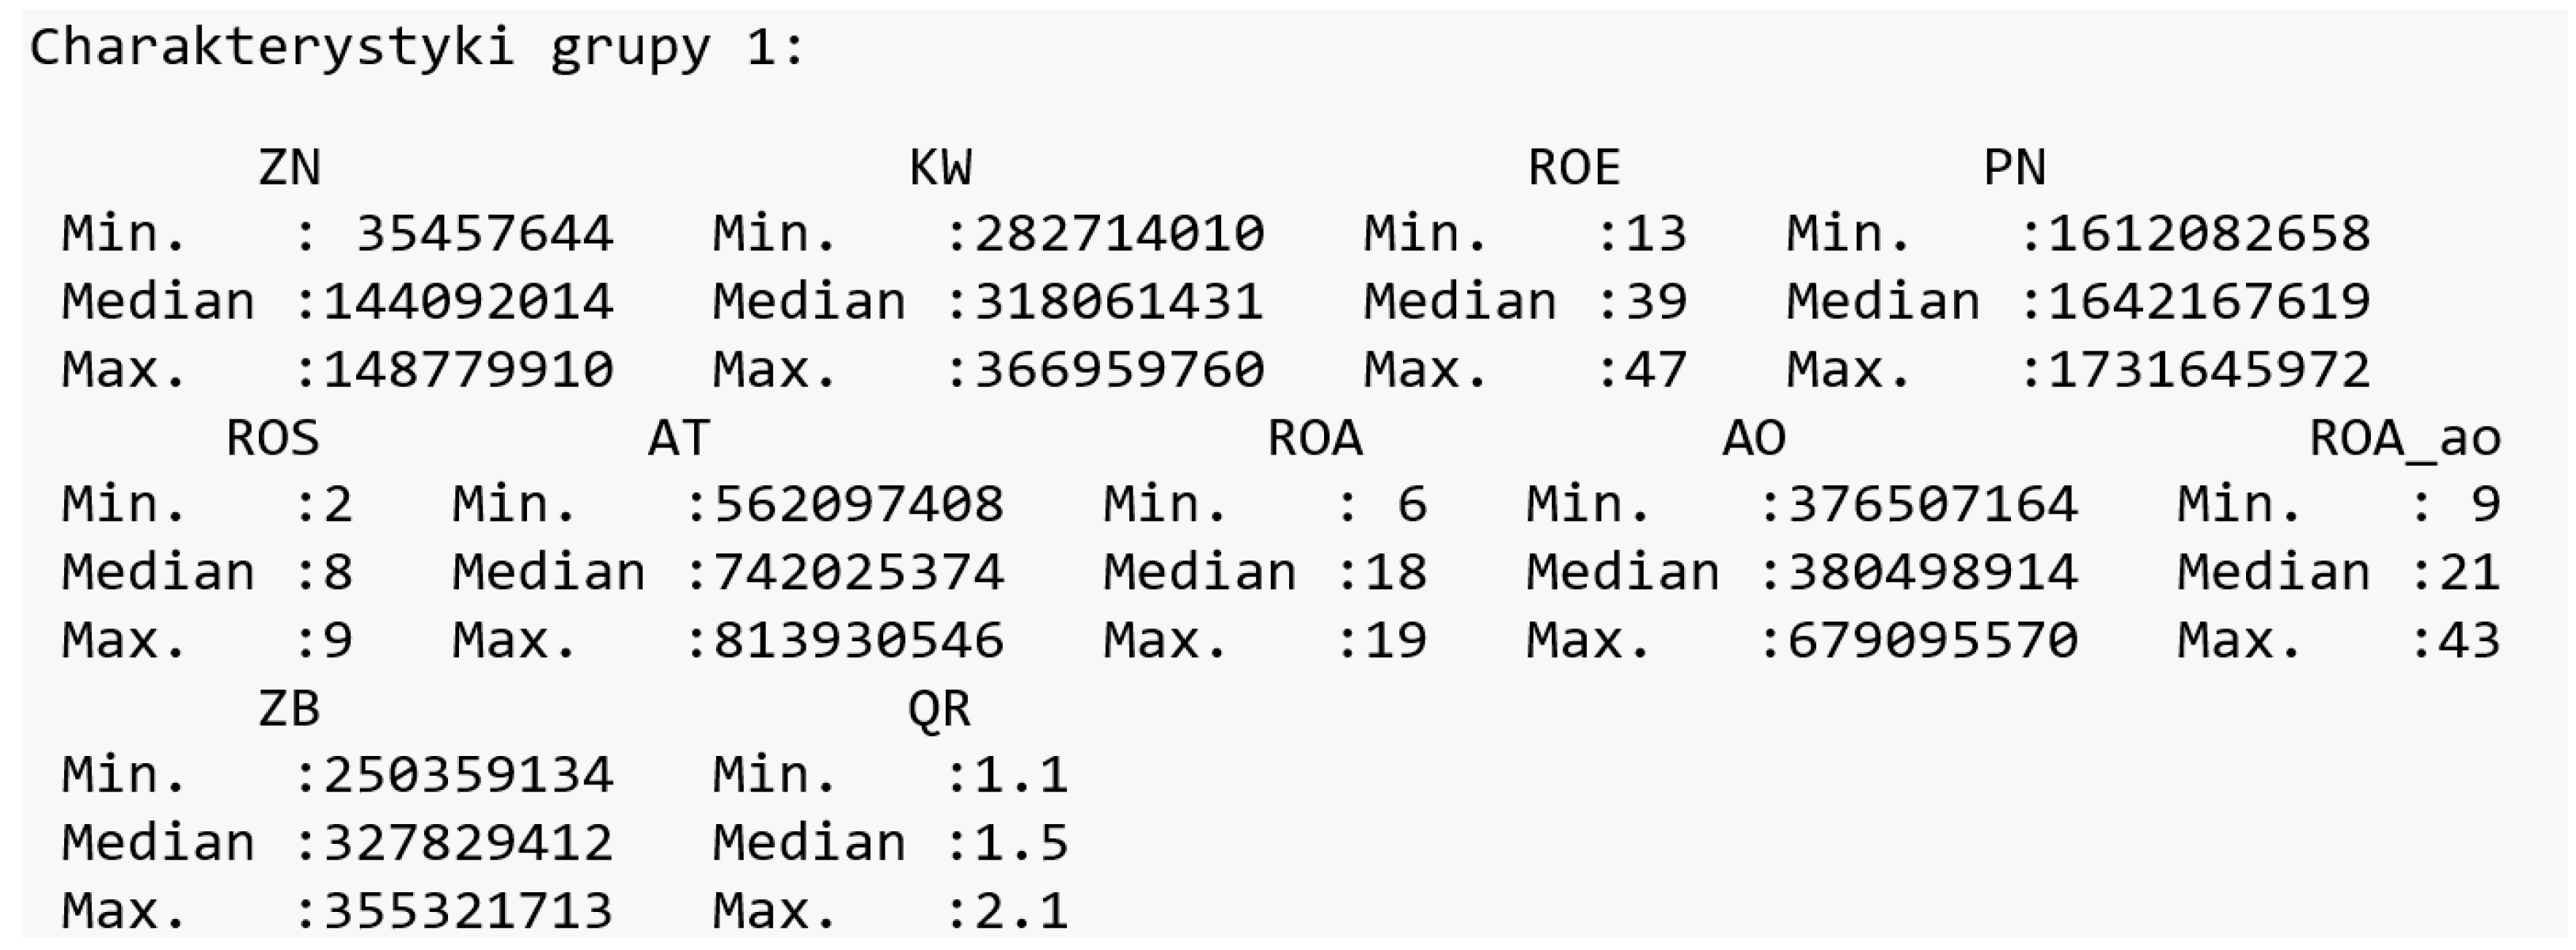
4.3. Grouping Up of the LSPs into Homogeneous Subsets

The authors, through the study of correlations using the k-means method, tried to select three basic subsets in the research group: leaders, background and tail, and to assess the possibility of conducting observations in them over the subsequent years, taking into account their common features [33,34,35,36].
As part of this study, the LSPs were grouped up into clusters consisting of enterprises whose feature values (assumed variables) were similar to each other, and as little as possible similar to the characteristics of companies belonging to other clusters. The basic and most frequently used k-means method was used in the calculations. The same CRAN calculation platform was used in the calculations.
The evaluation of the statistical parameters was limited to the composition (company’s code) and quantiles of the individual variables (0-quantile—the minimum value of the variable, 1/2-quantile, i.e., the median, and 1-quantile, i.e., the maximum value of the variable). The groupings were carried out within two basic sets: I, of the variables of 46 companies obtained in 2020 and 2021 (separately) and II, of the dynamics of the changes between 2020 and 2021 for all 11 variables. Three companies (A, B, C), leaders in the LSP market, were qualified to the first subset (cluster). The characteristics of this subset based on set I (data from 2021) are summarized in Scheme 2.
While the grouping up of LSPs, based on the average value of the variables, separately for both years, was justified, grouping up based on the dynamics of the variables in a short two-year period did not eliminate the randomness or one-off occurrences of events related to changes in the financial condition of the evaluated entities. This was confirmed by the analyses conducted [34,35,36].
The paces of changes were also more “grouped up”, which made it more difficult to choose the number of clusters. The intra-group distances stabilized only at eight clusters, which confirms the observations about the randomness of differences in some values of the variables between the two years [35,36].
The correlation studies in terms of the possibility of separating these three homogeneous subsets failed. To achieve a high level of similarity in the subgroups and adequate differentiation between them, too many clusters (subgroups) were isolated, and this was not the research objective [35,36].

4.4. Signaturization of Companies and Development of a Collective LSP Ranking Up of the LSPs into Homogeneous Subsets

Each of the 11 variables taken into account (net profit, liquidity ratio, greening ratio, etc.) set the criterion for ranking the companies. The rank method adopted allowed for the simple arranging of companies, because in each case it was about maximizing the value of the variable. A linear list of companies was possible, according to the rule, the higher the value of the variable, the higher the surveyed company is in the ranking. However, the partial rankings obtained for the examined variables differed. It was decided to assign pairs of numbers (signatures) to each of the companies, defined as follows. The first part of the company’s signature is the number of partial rankings in which the surveyed company was in the “top ten”. The second part of the signature is the number of partial rankings in which the examined company found itself in the “tail” (the last ten) [35,36].
The companies A and B ranked closest to the ideal signature (11.0). The rankings for individual signature years created this way also allowed to classify companies into three subsets: “The leaders”—the companies with the reference number—signature (“large number”, “small number”), “background”—units with reference number, that form pairs of small numbers. Then, finally, “tail”—companies with signatures of the type (“small number”, “large number”). However, this method would be ineffective in the case of the impossibility of the linear arranging of the companies according to the increasing values of the variables [20,21].
In addition, the signatures obtained for the 46 surveyed companies allowed to put them in the ranking. All entities are presented in the aggregated LSP ranking separately for 2020 and 2021. Scheme 3 shows the top ten (leaders) and Scheme 4 shows all the surveyed companies.
However, the collective rankings obtained for the years 2020 and 2021 differed. The differences deepened significantly from the top ten downward. The differences in the classification of the top ten entities were not significant [39,40].

4.5. Conclusions Based on the Statistics

The statistical research conducted shows that:
  • The thesis about a varied correlation between the economic parameters of the 46 surveyed companies has been proven [39,40].
  • Within each of the subgroups (profitability, efficiency, solvency, liquidity), the analyzed economic indicators were correlated with each other [41].
  • Cases of correlating indicators belonging to different subgroups were less frequent.
  • The thesis on the correlation between the financial condition indicators and the degree of application of pro-ecological solutions, in particular in the field of a low-emission fleet, has not been confirmed. Investments in this area are still characterized by a negligible nature, high randomness and the susceptibility of companies to short-term trends.
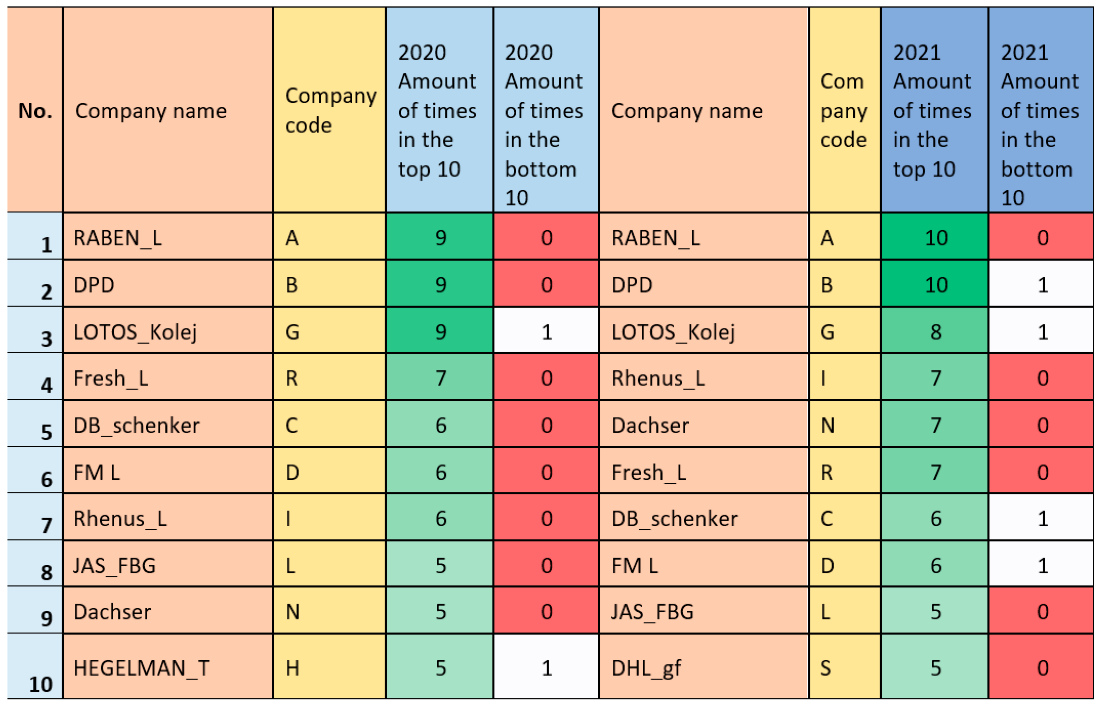
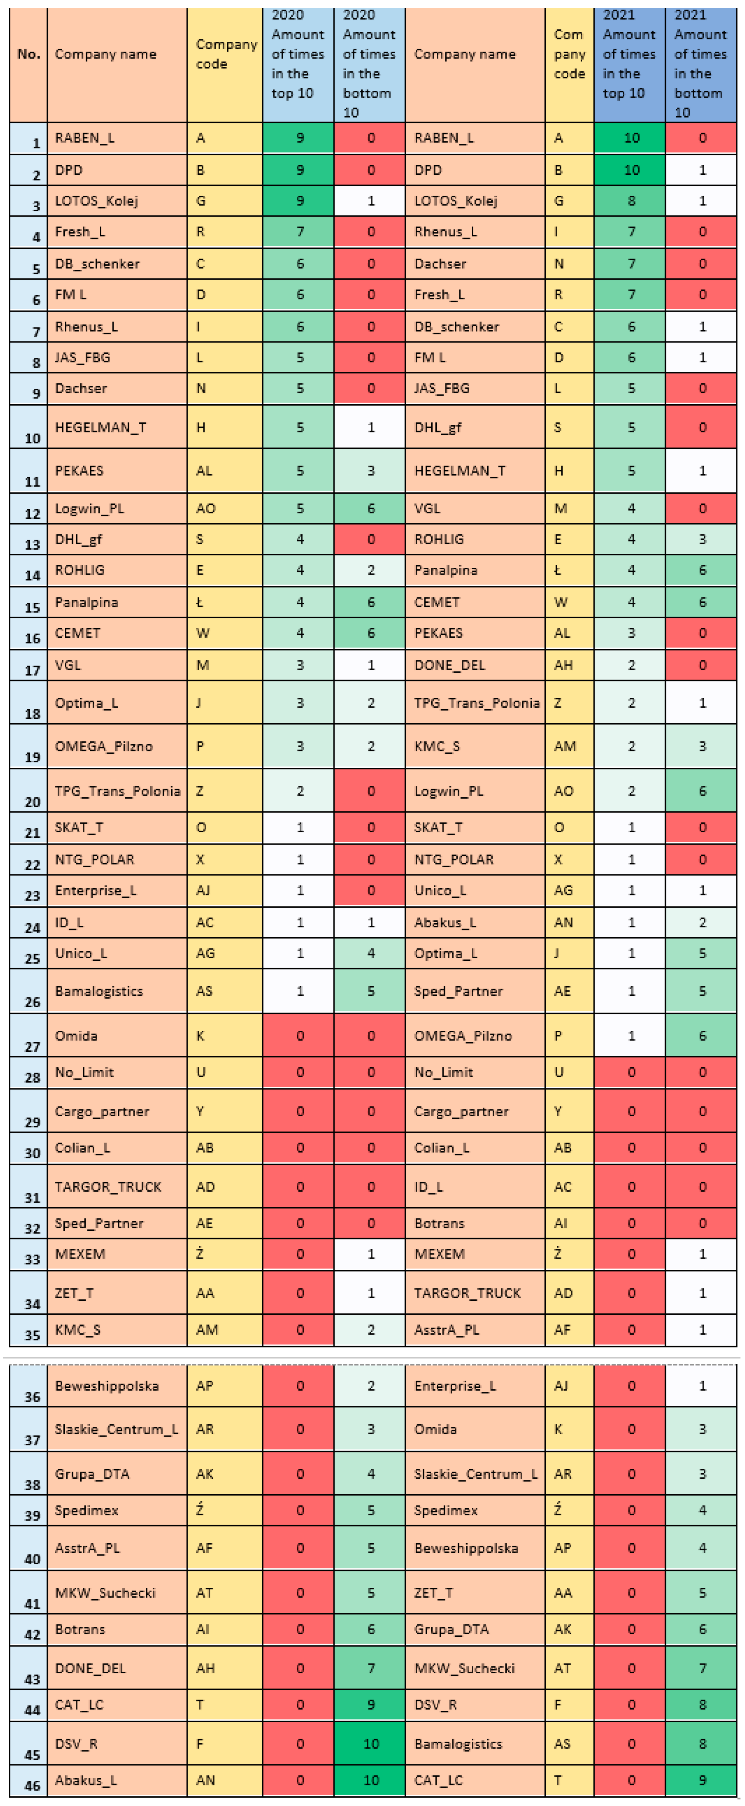
  • Most of the variables were correlated at the level ≥ 0.6, slightly fewer at the level of 0.4, relatively few were correlated between 0.4–0.6. In both years, the relative positions (ranks) of the surveyed companies in the rankings, determined by the values of the adopted variables, did not change significantly. This allows to create only a simplified collective ranking based on two-number signatures obtained in a linear way, by counting the highest/lowest variables in the partial rankings
  • The most correlated companies’ ratings were obtained based on the results in the areas of net profit, revenues and equity (0.8–0.9), as well as profitability—ROA and ROS (0.9), as well as ROE and ROS (0, 6) [17,18,19,39].
  • The lowest correlation among the financial parameters was obtained between the companies’ assessment based on the value of net profit and the current financial liquidity (CR) ratio [22,24,25,41].
  • The similarity of aggregated rankings for subsequent years was also confirmed by the Spearman’s rank correlation coefficient (r), assuming values in the range [−1.0–1.0]. The analysis prompted the conclusion that, in the analyzed years, the rankings of companies did not change significantly. However, if there was a need to develop an aggregated indicator based on partial indicators, then in the case of indicators characterized by a mutually high (above 0.85) correlation coefficient from the same group (e.g., regarding profitability, efficiency), it would be necessary to limit their number with the same simplified weighting factor. Another method that would not narrow down the set of partial indicators would be to assign weights lower than 1 (e.g., 0.5–0.8) for the indicators with mutually high correlation coefficients [17,39,41].
  • Based on the conducted research, it seems most reasonable to evaluate companies on the basis of positioning in the partial rankings for all variables, and ultimately within the aggregated ranking for a given year [18,19,39,41].

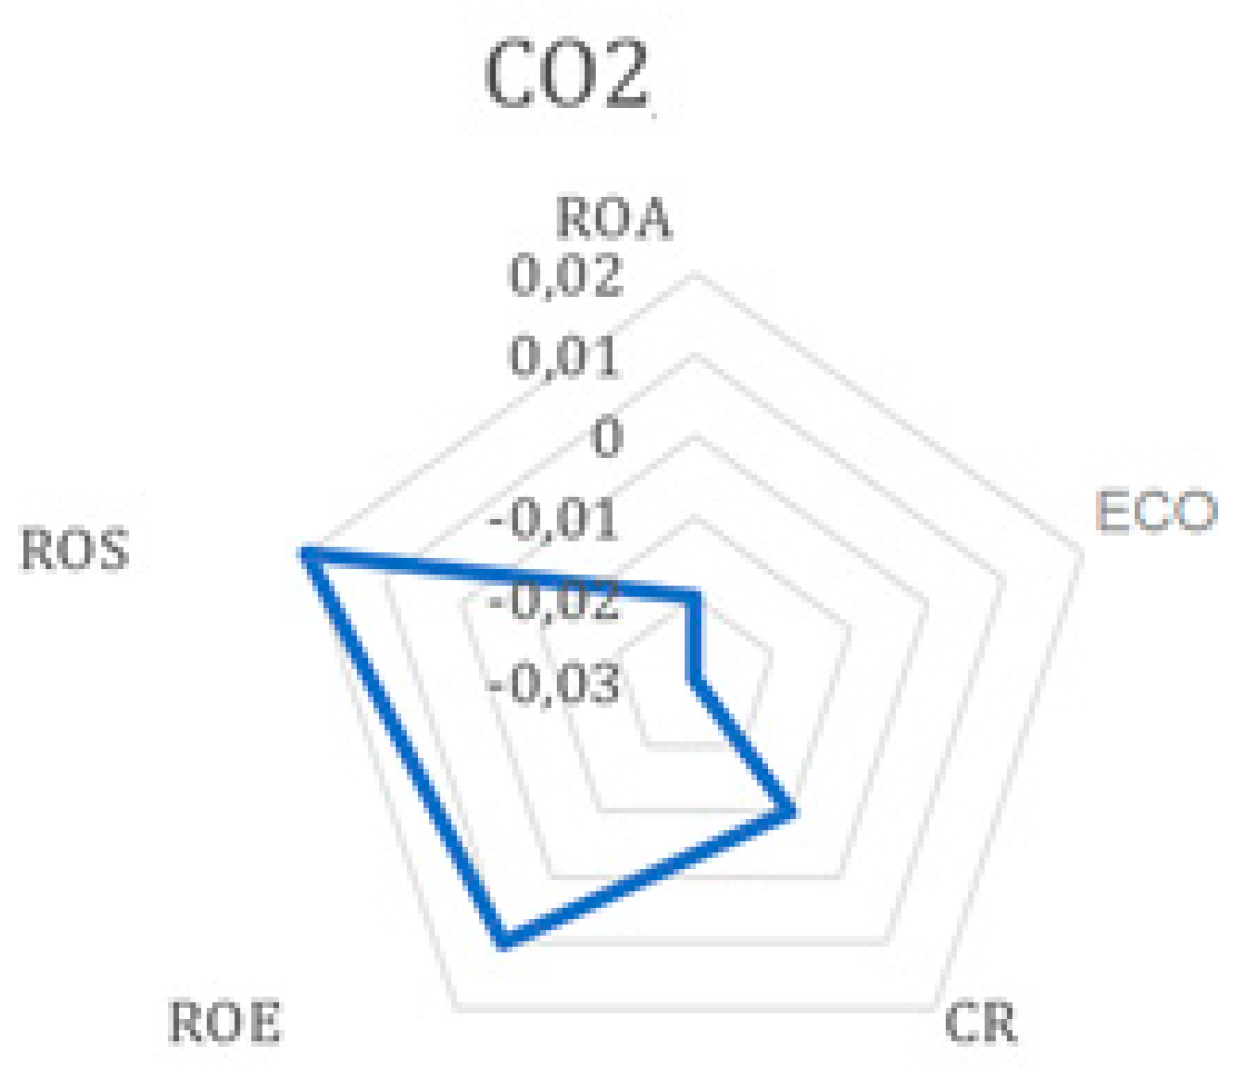
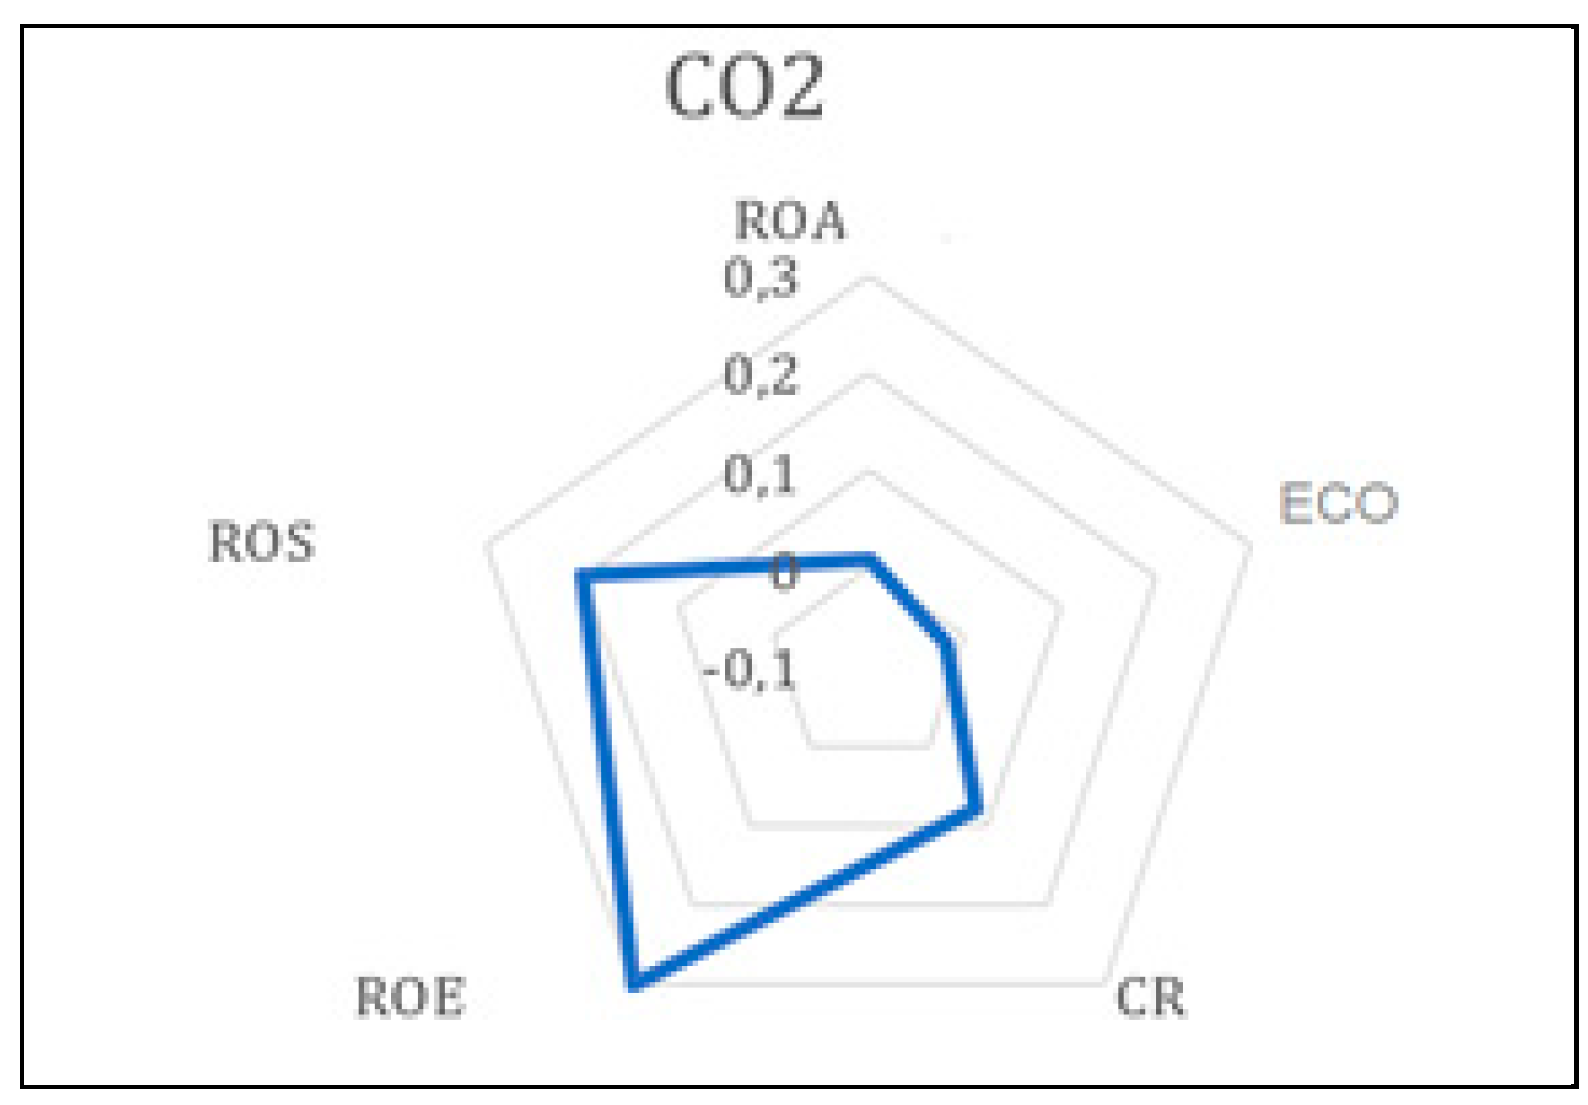
4.6. Economic Evaluation of the Studied Group of LSPs, Taking into Account the Leaders

Based on the economic analysis carried out, derived from the comparative evaluation of 10 selected financial indicators from 46 enterprises, it was found that in the years 2020–2021 a positive trend of changes was maintained on the LSP market with a high correlation of financial indicators. The market growth rate, measured by the value of net revenues from the activities of the surveyed LSPs in 2021 compared to 2020, amounted to 119% (i.e., in 2021, an average increase in the net revenues of companies of 19%, compared to 2020, was recorded). The value of the LSP market, measured with the net revenues of the 46 largest entities, amounted to PLN 14 billion, i.e., PLN 2 billion higher than in 2020. Other indicators also indicated the good economic condition of the analyzed 46 entities. Fixed assets grew by 12% in the entire surveyed LSP group in 2020–2021, showing much greater dynamics in this period than current assets (0.3%). The net profit increased in the analyzed group by an average of 22%, and in the top ten by 26%. The return-on-equity ratios were quite diversified, although their average values, thanks to the above-average results of the leaders, remained at a high level of approx. 30%. The improvement in the return on assets (both fixed assets and current assets) resulted, to a greater extent, from the improvement in the effectiveness of the use of fixed assets, and to a lesser extent from the increase in the net return on sales. The top 10 equity profitability ratios were above the average for the entire group (Scheme 3).
There have been positive changes in all the financial indicators, albeit with a different force of impact. Only in the case of companies for which transport was the main activity, the net return on sales in the entire analyzed period decreased, on average by 11%. It is also interesting that the slightly higher-than-average profitability of net sales was achieved by LSPs, which significantly increased the share of online trade in their turnover. Their net return-on-sales indicators were higher than the average (3.5%) in the group, i.e., at approx. 6.2%. Moreover, companies that rely on logistics or courier services in their activities showed a higher profitability than the other surveyed entities, but with too small a sample size, it is difficult to draw general conclusions for the entire sector on this basis [22,24,25,42]. When it comes to measuring the current liquidity ratio of the surveyed companies, its value compared to the sector was also better than the average (0.8–1%). At the surveyed companies, it reached an average annual value of slightly above 1.5%. Data for both periods were even, although the group leaders reached values of above 2%. The increases in net profit for the remaining 10 companies with the highest net profit ranged from 10% to 20%. The average dynamics of the net sales revenues of the 10 largest companies amounted to 153% and was higher than the entire analyzed sample of 46 entities (119%). This means that in the group of the largest LSP entities, the average annual revenues increased by 53%, and in the entire group of 46 entities under examination, by only 19%. In total, the revenues in the group of the 10 largest companies amounted to over PLN 12 billion and accounted for as much as 74% of the revenues of all 46 analyzed LSPs, which still proves a very strong polarization of the LSP market [3,4,10,22]. Almost half of the surveyed enterprises declared the Polish origin of their capital, and the other half was foreign and mixed. The difference in the dynamics of the revenues in both groups was insignificant, i.e., with a slight predominance of companies with foreign capital. On the other hand, the dynamics of the net profit was higher among enterprises representing Polish capital, and employment grew faster in foreign companies than in Polish ones.

5. Conclusions from the Research

The most reasonable, due to the similarity of the rankings obtained in subsequent years and effective in terms of time, was to group companies in a linear manner, based on two-number signatures. The adopted rank method allowed for a simple and quick ordering of companies, because in each case the aim was to maximize the value of the variable. It was possible to list companies according to the rule, the higher the value of the variable, the higher the company is in the ranking. However, this method would be ineffective in the case of the impossibility of the linear ordering of companies according to the increasing values of the variables.
The evaluation method for the LSPs proposed by the authors is universal and innovative and is based on known, and commonly used in other countries, measures of economic evaluation of individual companies, as well as the measure of fleet assessment [12,43]. It involves profitability indicators, performance indicators, debt indicators (debt to equity ratio, total debt ratio), liquidity indicators and a fleet emission index. It is worth emphasizing that the economic measures are obtained in the same way in all countries and the evaluation measures have the same component parameters [17,18,22,41].
The indicator for the emissivity of the fleet is also a universal tool, because all LSP companies, regardless of the country of residence, must meet the requirements of EU regulations [8,43]. Therefore, the evaluation of their resource potential based on the assessment of the emissivity of the fleet makes it possible to compare entities from different countries in a universal way.
It is also worth noting the method provides a better and more reliable evaluation than company rankings based, so far, on sets of 2–3 measures, eliminating the risk of randomness and selective assessments. It also guarantees a balanced selection of assessment measures by prior checking the degree of correlation between them.
The ranking based on a more diverse set of indicators in terms of correlation showed a greater convergence in both years than the ranking based solely on indicators with a high correlation. This was particularly evident in the case of the top ten companies in the rankings.
The sole weakness of this method is the need to compare a lot of data from several years.
The research conducted by the authors showed a diverse correlation between all parameters used in this study [17,18,19,22,27,37,41].
If it was decided to construct a synthetic measure of the ranking of companies, it would be necessary to select from among the indicators with the highest degree of correlation in the subgroups, or to assign them lower weights in the overall evaluation. The use of highly correlated indicators from the same subgroups may cause the duplication of certain types of information and increase its weight in the entire analysis.
This risk will not occur if a solution based on a linear evaluation of the values obtained in the partial rankings is applied and only two-number signatures are created on that basis, indicating the frequency of occurrence of the examined entity at the top and bottom of the individual rankings. In the collective evaluation, low-correlated indicators within and outside the subgroups were used simultaneously, as well as one fleet emission indicator with a negative correlation with the others. It was, therefore, possible to simply maximize the results, without differentiating the weights. Such an approach was chosen by the authors, and the results of the rank correlation according to the Spearman correlation study of all the indicators gave them an incentive to claim that a comprehensive set of characteristics was achieved, entitling to conduct collective evaluations using the linear method, based on the ranking of two-number signatures [17,18,34,37,43].
On the other hand, the signature ranking of companies proposed by the authors shows a high degree of consistency in the ordering of companies in the top ten entities for the analyzed years, which is consistent with the regularity observed in other sector rankings [44,45,46]. Therefore, it would be advisable to carry out a collective evaluation with its help in subsequent years.

6. Summary

The essential aim of this study, i.e., obtaining the structure of the aggregated ranking of LSPs in the form of a selected set of comprehensive characteristics, was achieved. Thanks to this, it will be possible to compare many aspects of the activities of LSPs. In the case of economic indicators belonging to different groups (e.g., efficiency and profitability), the correlation between them was not so strong. They were counterbalanced by a low correlation with indicators in the area of debt and investment potential, and a very low or negative correlation with this study’s emissivity index. This had a positive impact on the main objective of this study, providing a set of comprehensive and objective characteristics for creating a collective ranking of LSPs [46,47]. The comparison of the results of the economic analysis of companies with the evaluation of the degree of their greening was a novelty in the research on LSPs. It will be justified to extend the research to include elements related to the evaluation of the degree of greening of LSP entities, after introducing more explicit changes in the regulations in favor of a zero-emission policy. It would be interesting to conduct in-depth research on a larger sample of enterprises of other countries [43,44]. However, in view of the existing problems of the data availability in the LSP sector, this task seems difficult. Regardless of the adopted method for preparing rankings of LSPs and drawing conclusions about the results they achieve, the research time horizon should be extended in order to minimize the randomness phenomena resulting from one-off financial events or errors in the selection of the research sample [47].

Author Contributions

Conceptualization, M.Z.; methodology, M.Z.; validation, M.Z.; formal analysis, M.Z.; investigation, M.Z.; writing—original draft preparation, M.Z.; conclusions, M.Z.; review and editing, J.Ż.; resources, J.Ż.; obtaining data, J.Ż.; graphs, printouts, visualization, J.Ż. All authors have read and agreed to the published version of the manuscript.

Funding

This research received no external funding.

Data Availability Statement

Not Applicable.

Conflicts of Interest

The authors declare no conflict of interest.

References

  1. Available online: https://oees.pl/wp-content/uploads/2020/04/EKSPERTYZA-7-1.pdf (accessed on 10 July 2022).
  2. Brdulak, H.; Brdulak, A. Challenges and Threats Faced in 2020 by International Logistics Companies Operating on the Polish Market. Sustainability 2021, 13, 359. [Google Scholar] [CrossRef]
  3. Zysińska, M. Poradnik TSL. Gazeta Finansowa. 28 May—3 June 2021. Available online: https://gf24.pl/wp-content/uploads/2021/06/poradnik_TSL.pdf (accessed on 20 November 2022).
  4. Zysińska, M. Wyzwania firm TSL w dobie pandemii. Gazeta Finansowa, Biznes Raport, Poradnik TSL 2021. 17–23 June 2021. pp. 20–23. Available online: https://g.infor.pl/p/_files/37497000/1-tsl-ranking-27-06-2022-dobry-37496603.pdf (accessed on 20 November 2022).
  5. Available online: https://www.scopus.com/term/analyzer (accessed on 12 July 2022).
  6. Nascimentoa, C.; Belcavello, I.; Leise, R.; Oliveira, K. Characterization and analysis of the economic viability of cycle logistics transport in Brazil. Transp. Res. Procedia 2020, 46, 189–196. [Google Scholar] [CrossRef]
  7. Akhavana, M.; Ghiarab, H.; Mariottia, I.; Silligb, C. Logistics global network connectivity and its determinants. A European City network analysis. J. Transp. Geogr. 2020, 82, 102–624. [Google Scholar] [CrossRef]
  8. Barker, T.J.; Zabinsky, Z.B. A Multicriteria Decision Making Model for Reverse Logistics Using Analytical Hierarchy Process. Omega 2011, 39, 558–573. [Google Scholar] [CrossRef]
  9. Badassa, B.B.; Sun, B.; Qiao, L. Sustainable Transport Infrastructure and Economic Returns: A Bibliometric and Visualization Analysis. Sustainability 2020, 12, 2033. [Google Scholar] [CrossRef] [Green Version]
  10. Jacyna-Gołda, I.; Żak, J.; Gołębiowski, P. Models of traffic flow distribution for various scenarios of the development of proecological transport system. Arch. Transp. 2014, 32, 17–28. [Google Scholar] [CrossRef]
  11. Jacyna, M.; Merkisz, J. Proecological approach to modelling traffic organization in national transport system. Arch. Transp. 2014, 30, 31–41. [Google Scholar] [CrossRef] [Green Version]
  12. Tsakalidis, A.; Mitchell van Balen, G.K.; Pekar, F. Catalyzing Sustainable Transport Innovation through Policy Support and Monitoring: The Case of TRIMIS and the European Green Deal. Sustainability 2020, 12, 3171. [Google Scholar] [CrossRef] [Green Version]
  13. Evangelista, P.; Colicchia, A.; Crezaza, C. Is environmental sustainability a strategic priority for logistics service providers? J. Environ. Manag. 2017, 198, 353–362. [Google Scholar] [CrossRef]
  14. PZPM Automotive Industry Report 2020/2021 KPMG 2021. Available online: https://www.pzpm.org.pl/Publikacje/Raporty (accessed on 29 August 2022).
  15. Pamucar, D.; Chatterjee, K.; Zavadskas, E. Assessment of third-parfty logistics provider using multi-criteria decision-making approach based on interval rough numbers. Comput. Ind. Eng. 2019, 127, 383–407. [Google Scholar] [CrossRef]
  16. Senthil, S.; Srirangacharyulu, B.; Ramesh, A. A robust hybrid multi-criteria decision making methodology for contractor evaluation and selection in third-party reverse logistics. Expert Syst. Appl. 2014, 41, 50–58. [Google Scholar] [CrossRef]
  17. Aw, E.N.W.; Dornick, C.R.; Jiann, J.Q. Combining Quantitative and Fundamental Analysis: A Quant-amental Approach. J. Investig. Summer 2014, 2, 28–43. [Google Scholar]
  18. Gotzamani, K.; Longinidis, P.; Vouzas, F. The logistics services outsourcing dilemma: Quality management and financial performance perspectives. Supply Chain. Manag. 2010, 15, 438–453. [Google Scholar] [CrossRef]
  19. Olah, J.; Kovacs, Z.; Virglerova, Z.; Lakner, M.; Kovacova, A.; Poop, J. Analysis and Comparison of Economic and Financial Risk Sources in SMEs of the Visegrad Group and Serbia. Sustainability 2019, 11, 1853. [Google Scholar] [CrossRef] [Green Version]
  20. Barnard, G.A. The use of the likelihood function in statistical practice. In Proceedings of the Fifth Berkeley Symposium on Mathematical Statistics and Probability, Berkeley, CA, USA, 21 June–18 July 1967; pp. 27–40. [Google Scholar]
  21. Brozyna, J.; Mentel, G.; Pisula, T. Statistical methods of the bankruptcy prediction in the logistics sector in Poland and Slovakia. Transform. Bus. Econ. 2016, 15, 80–96. [Google Scholar]
  22. Zysińska, M. Ocena przedsiębiorstw TSL działających w Polsce—dylematy metodyczne badań. In Studia i Prace Kolegium Zarządzania i Finansów; SGH: Warsaw, Poland, 2019; Volume 173, pp. 141–162. Available online: https://ssl-kolegia.sgh.waw.pl/pl/KZiF/czasopisma/zeszyty_naukowe_studia_i_prace_kzif/D (accessed on 18 August 2022).
  23. Heiko, A.; Darkow, I.L. Scenarios for the logistics services industry. A Delphi-based analysis for 2025. Int. J. Prod. Econ. 2010, 127, 46–59. [Google Scholar]
  24. Forgy, E.W. Cluster analysis of multivariate data: Efficiency vs interpretability of classifications. Biometrics 1965, 21, 768–769. [Google Scholar]
  25. Wiegmans, B.; Donders, A. Benchmarking European Rail Freight Transport Companies. Transp. J. 2021, 46, 19–34. Available online: http://www.jstor.org/stable/20713669 (accessed on 10 November 2022). [CrossRef]
  26. Gupta, A. A stakeholder analysis approach for interorganizational systems. Ind. Manag. Data Syst. 1995, 95, 3–7. [Google Scholar] [CrossRef]
  27. Kaczorek, M.; Jacyna, M. Fuzzy logic as a decision-making support tool in planning transport development. Arch. Transp. 2022, 61, 52–68. [Google Scholar] [CrossRef]
  28. Soliman, M.T. The Use of DuPont Analysis by Market Participants, The Accounting Review. Acc. Rev. 2008, 83, 823–853. [Google Scholar] [CrossRef]
  29. Al-Mashari, M.; Zairi, M. BPR implementation process: An analysis of key success and failure factors. Bus. Process Manag. J. 1999, 5, 87–112. [Google Scholar] [CrossRef] [Green Version]
  30. Valentin, E. Swot Analysis from a Resource-Based View. J. Mark. Theory Pract. 2001, 9, 54–69. [Google Scholar] [CrossRef]
  31. Dobbs, E. Guidelines for applying Porter’s five forces framework: A set of industry analysis templates. Compet. Rev. 2014, 24, 32–45. [Google Scholar] [CrossRef]
  32. Available online: https://www.r-project.org/ (accessed on 12 July 2022).
  33. Kendall, M.G. A new measure of rank correlation. Biometrika 1938, 30, 81–93. [Google Scholar] [CrossRef]
  34. Kendall, M.G. The treatment of ties in rank problems. Biometrika 1945, 33, 67–72. [Google Scholar] [CrossRef]
  35. Boudt, K.; Cornelissen, J.; Croux, C. The Gaussian rank correlation estimator: Robustness properties. Stat. Comput. 2012, 22, 471–483. [Google Scholar] [CrossRef]
  36. Fieller, E.C.; Hartley, H.O. Tests for rank correlation coefficients. Biometrika 1957, 44, 470–481. [Google Scholar] [CrossRef]
  37. Yu, G.; Wenjuan, G. Decision Tree Method in Financial Analysis of Listed Logistics Companies. In Proceedings of the 2010 International Conference on Intelligent Computation Technology and Automation, Washington, DC, USA, 11–12 May 2010; pp. 340–353. [Google Scholar]
  38. Pernestål, A.; Engholm, A.; Bemler, M.; Gidofalvi, G. How Will Digitalization Change Road Freight Transport? Scenarios Tested in Sweden. Sustainability 2021, 13, 304. [Google Scholar] [CrossRef]
  39. Chen, L.G.; Huo, B. Logistics resources, capabilities and operational performance: A contingency and configuration approach. Ind. Manag. Data Syst. 2019, 119, 230–250. [Google Scholar]
  40. Watson, S.; Apostolou, B.H.J.M.; Webber, S. Accounting education literature review (2000–2005). J. Account. Educ. 2007, 25, 1–588. [Google Scholar] [CrossRef]
  41. Karia, N. Antecedents and Consequences of Environmental Capability towards Sustainability and Competitiveness. Sustainability 2022, 14, 12146. [Google Scholar] [CrossRef]
  42. Noor, A. Adoption of Blockchain Technology Facilitates a Competitive Edge for Logistic Service Providers. Sustainability 2022, 14, 15543. [Google Scholar] [CrossRef]
  43. Available online: https://ec.europa.eu/info/strategy/priorities-2019-2024/european-green-deal/transport-and-green-deal_pl (accessed on 19 July 2022).
  44. Bhushan, N.; Mohnert, F.; Sloot, D.; Jans, L.; Albers, C.; Steg, L. Using a Gaussian graphical model to explore relationships between items and variables in environmental psychology research. Front. Psychol. 2019, 10, 1050. [Google Scholar] [CrossRef] [Green Version]
  45. Langfelder, P.; Horvath, S. Fast R functions for robust correlations and hierarchical clustering. J. Stat. Softw. 2012, 46, 392. [Google Scholar] [CrossRef] [Green Version]
  46. Tang, C.; Veelenturf, L. The strategic role of logistics in the industry 4.0 era. Transp. Res. Part E Logist. Transp. Rev. 2019, 129, 1–11. [Google Scholar] [CrossRef]
  47. Bishara, H.J.B. Confidence intervals for correlations when data are not normal. Behav. Res. Methods 2017, 49, 294–309. [Google Scholar] [CrossRef] [Green Version]
Figure 1. Declines in the traffic of international road carriers’ vehicles (by country) registered in Germany (April 2019–April 2020) [1].
Energies 16 01984 g001
Figure 2. Number of publications concerning methods of evaluating transport and logistics companies (1958–2020) [5].
Energies 16 01984 g002
Figure 3. Age structure of commercial vehicles in Poland (up to 3.5 PGW) updated in the last 6 years in CEP (2019) [14].
Energies 16 01984 g003
Figure 4. Age structure of heavy goods vehicles in Poland (over 3.5 PGW) updated in the last 6 years in CEP [14].
Energies 16 01984 g004
Figure 5. Methods and tools for evaluating companies from the LSP sector.
Energies 16 01984 g005
Figure 6. The scheme for conducting the LSP research together with the choice of the method.
Energies 16 01984 g006
Figure 7. The histogram for rank correlation—2020 based on a statistical computing platform [32].
Energies 16 01984 g007
Figure 8. The histogram for rank correlation—2021 based on a statistical computing platform [32].
Energies 16 01984 g008
Scheme 1. Results of variable rank correlation for 2021. Based on own research according to CRAN [32,33].
Energies 16 01984 sch001
Figure 9. The degree of correlation of the greening index and financial indicators of LSPs in 2020.
Energies 16 01984 g009
Figure 10. The degree of correlation of the greening index and financial indicators of LSPs in 2021.
Energies 16 01984 g010
Scheme 2. Characteristics of the subset of leaders based on 2021 variables. Based on own research according to CRAN [32].
Energies 16 01984 sch002
Scheme 3. Aggregated ranking of top ten LSP companies based on signaturization. Based on own research.
Energies 16 01984 sch003
Scheme 4. Aggregated ranking of 46 LSP companies based on signaturization. Based on own research.
Energies 16 01984 sch004
Disclaimer/Publisher’s Note: The statements, opinions and data contained in all publications are solely those of the individual author(s) and contributor(s) and not of MDPI and/or the editor(s). MDPI and/or the editor(s) disclaim responsibility for any injury to people or property resulting from any ideas, methods, instructions or products referred to in the content.

