1. Introduction
Today power systems operate under the paradigm of an architecture based mainly on bulk production, the transport and distribution network, and passive consumers that are connected to various voltage levels of the network. Large wind and solar power plants are also seen as bulk units; however, they bring a new type of challenge due to their weather-dependent production. Their integration in SCADA (Supervisory Control and Data Acquisition) systems and their dispatchability (e.g., through temporary power limitation, usually known as “curtailment”) is somehow easing the control, but in such cases, some renewable energy is lost, which is also not desirable. This situation is progressively changing and becoming more complex, as distributed energy production, mainly based on renewable energy sources (RESs), is increasing its share, especially at the distribution level, where small sources are usually not electronically monitored and not dispatchable.
New challenges are faced under the actual strategy of reaching low carbon or even carbon-free based energy production [
1], while the need for addressing the power system resilience is more and more obvious following the increasing frequency of occurrence of the natural or man-induced extreme phenomena [
2]. Resilience is one of the characteristics recognized as having an essential value for the advanced power grids of the future [
3] in the framework of the ambitious European goal defined as “A secure, efficient and digitalised European energy system, fully decarbonised by 2050, coupling all energy sectors.” [
4].
To address some of these complex challenges, the paper has been shaped with the following structure:
The next section considers definitions of energy resilience and some of the existing preoccupations on the subject.
Section 3 of the paper presents different aspects of the design of a microgrid, with the purpose of increasing its energy community’s safe operation and resilience. The section addresses appropriate electrical network architectures, multiple roles of storage resources related to prosumers and to islanded microgrids with high-RES penetration, and other aspects, such as the impact of electrification of heating through, e.g., heat pumps.
Section 4,
Section 5 and
Section 6 present selected use cases that develop some of these design aspects by using them for the analysis of typical real data and assessing solutions to address resilient microgrid challenges. The first two use cases focus on voltage control with active power (P) contribution in low voltage (LV) networks by using energy from batteries belonging to community members in the conditions of high-RES scenarios and aspects of sizing of storage resources to cope with the needs. These use cases look at the issue (a) from a daily perspective with a one-hour scheduled operation and (b) from a real-time perspective, with a seconds-based reaction of the control within short-time-frame studies (e.g., half hour) in the condition of electrification of heating by using heat pumps with multiple inrush start-ups. A technical and capacity design-sizing impact on a Battery Energy Storage System (BESS) is given for these use cases. A third use case shows the possibility of designing an optimized PV (Photovoltaic) and storage capacity considering a year-long period, for maximizing the self-consumption, by using AI (Artificial Intelligence)-based particle swarm technology.
Conclusions are given in a final section, also presenting future work as a part 2 continuation with other use cases related to the resilient design of energy communities microgrids.
The combination of energy communities and resilient low-voltage microgrids can be seen as a viable solution to reach the policy goals, and this paper discusses various challenges through specific aspects of design and use cases.
The main contributions of the paper are:
- (a)
To emphasize that, in low voltage networks, the voltage (U) level control is more effective with active power (P) regulation, being practical due to the latest advances in batteries; this is a different approach compared with classic control of node voltages based on reactive power (Q), which is widely used in high and medium voltage networks; this different approach less is analyzed at a low voltage level, where X of the lines becomes smaller than R, in networks which are sometimes approximated as being “resistive networks.”
- (b)
The applicability of voltage level control with active power regulation at low voltage is combined in the paper with microgrids and energy communities, giving an integrated concept that needs to detail “Aspects of Design in Low Voltage Resilient Grids”; this does not exclude the applicability of microgrids decoupled from energy communities or energy communities decoupled from microgrids.
- (c)
The bundled concepts of resilient microgrid and energy communities are supported by three different use cases, which target different aspects of the challenges specific to the LV microgrids used by resilient energy communities: short-term daily-based analysis of U-P control, real-time analysis of U-P control effectiveness, and year-based dimensioning of storage versus PV production in a prosumer/energy community environment, based on AI technology. In the real-time use case, real heat-pumps records are used, bringing more realistic results and contributing/sharing with the scientific community specific waveforms presented in this work.
- (d)
Author’s highlights and viewpoints in
Section 2 and
Section 3, in the context of presenting essential information related to these chapters.
As it is evident that there are many more aspects to be analyzed, the paper recognizes that the presented use cases are only a small part of the design aspects, so it leaves open the door for further aspects of design in future papers.
2. Energy Communities and Energy Resilience
2.1. Resilience as Concept
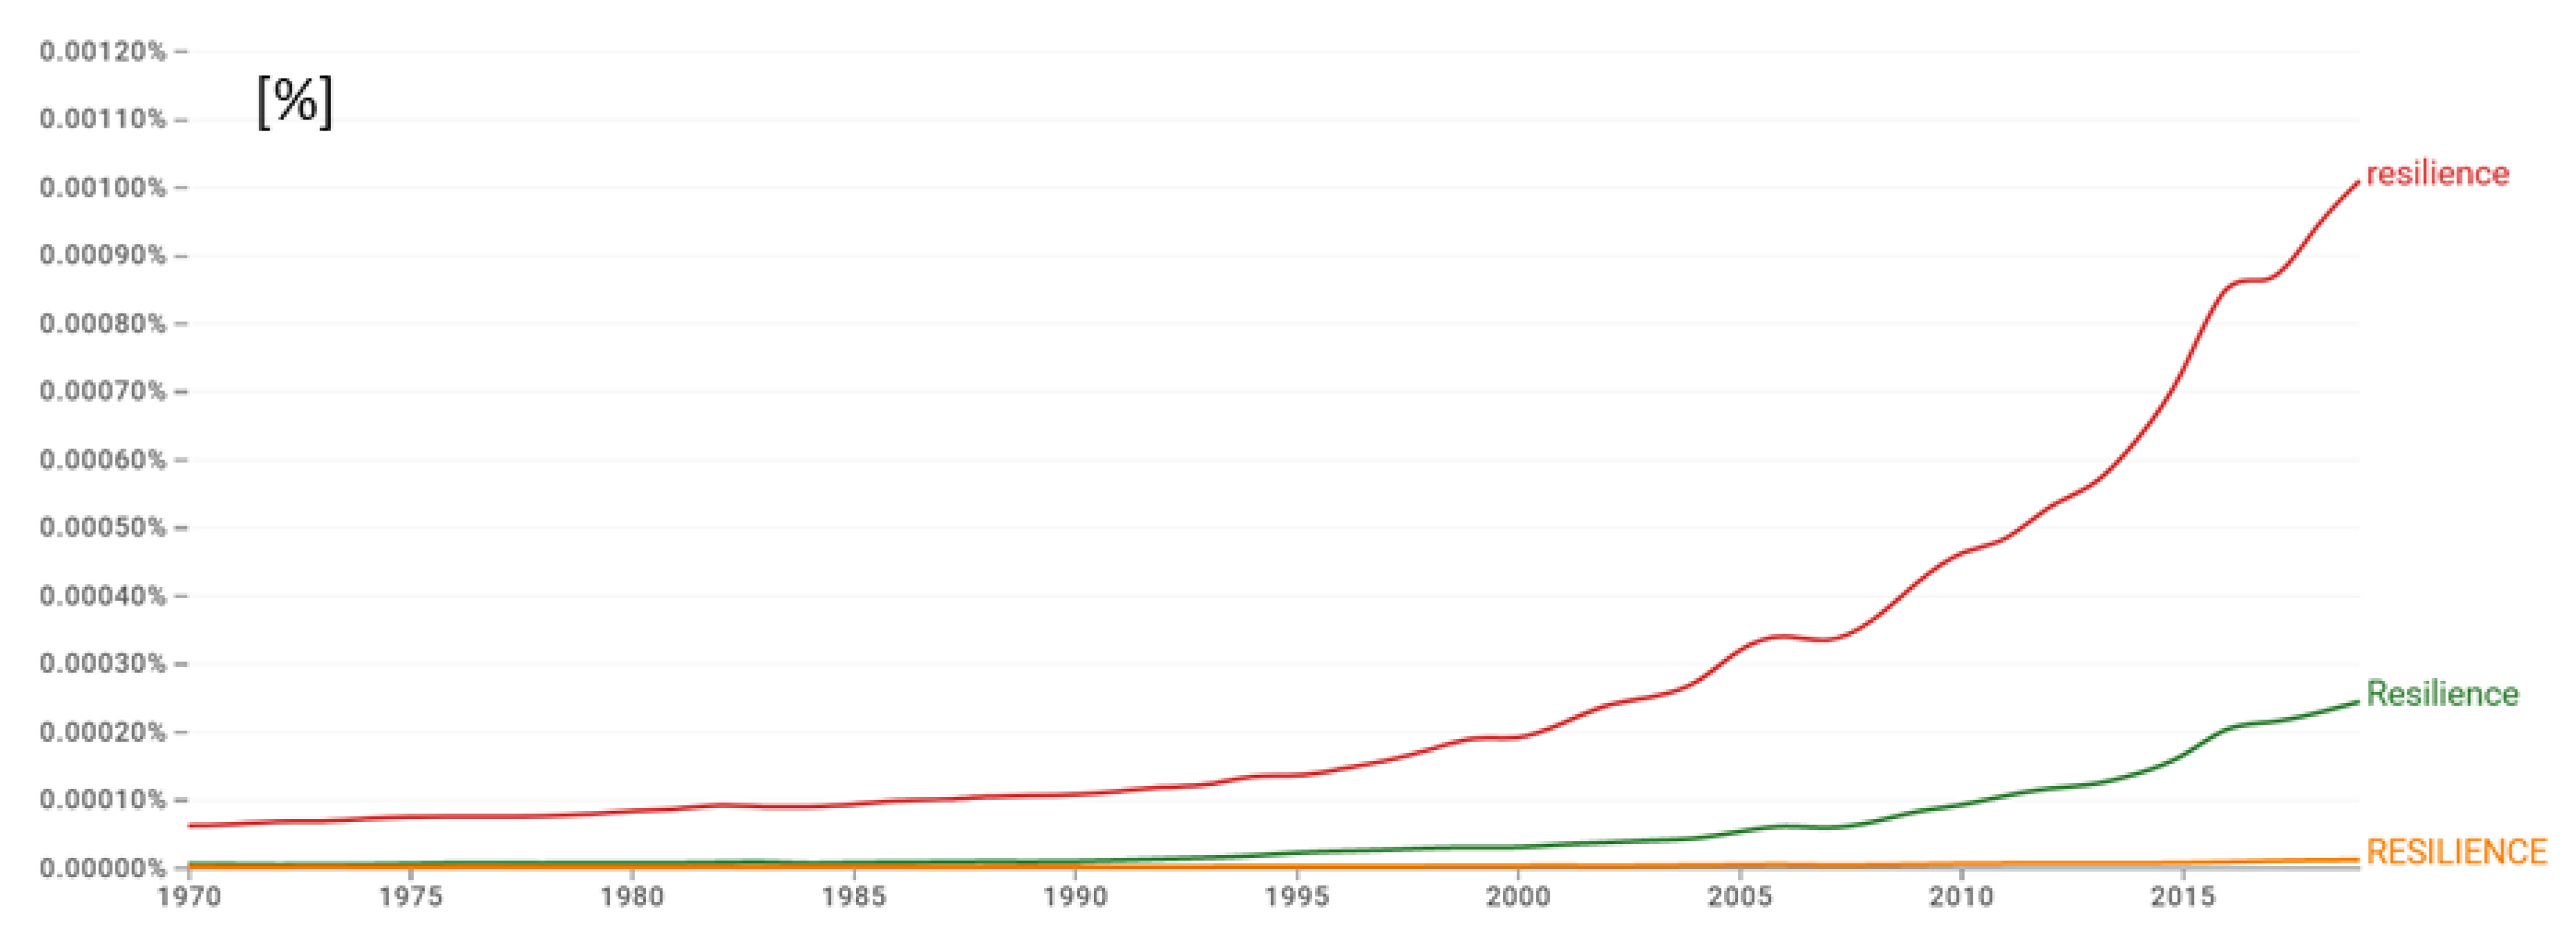
Resilience in its simplest form is defined in the Cambridge Dictionary as “the quality of being able to return quickly to a previous good condition after problems” [
5]. There are many other forms of this concept definition, tailored to the area in which “resilience” is applied. In the current challenging and rapidly changing times, which need the means to recover from problems in many areas, the concept is more and more often used and in a wider spectrum of areas, as reflected by Google Books Ngram Viewer [
6],
Figure 1:
In what concerns the subject of this article, we quote the definitions from [
7]:
Energy resilience is the ability of the energy system to provide and maintain an acceptable level of service in the face of various challenges to normal operation.
The resilience of energy systems is defined as the capacity of an energy system to withstand perturbations from climatic, economic, technological, and social causes and to rebuild and renew itself afterwards.
In applying the concept of resilience to different types of energy systems, it is important to identify the potential causes of perturbations in each possible area of causes. In what concerns the electrical grids or microgrids serving local energy communities with a mix of consumers and prosumers, four main types of perturbations should be considered and assessed, in our opinion.
Climatic and environmental perturbations. Climate change has added new challenges to the environment in which the local grids should function, from extended temperature ranges to violent thunderstorms and indirect effects, such as floods and landslides.
Economic perturbations. The new technologies used in local electricity networks, mainly those for energy storage, require the use of specific materials, some of them like lithium, cobalt, and nickel, being characterized by challenging commodities markets and potential disruptions in supply. The cost of equipment has increased over time, proportional to the increase in complexity, from the unidirectional distribution networks to the current multi-directional and multi-function local grids.
Technological perturbations. With large-scale penetration of distributed generation, distributed storage, and high-power home consumption like electric car charging systems and heat pumps, new challenges arise concerning maintaining the stability of the local grids. The use of smart grid technologies is part of the solution; embedded resilience should be incorporated as much as possible, by design, in the local grids.
Man-made, man-related, and other perturbations. Recent years have highlighted a relatively new class of challenges which includes man-made threats such as cyberattacks and terrorism. 2022 added a new risk: the shelling of civilian energy infrastructure, as in the case of the war in Ukraine. The local grid should be able to re-configure itself, maintaining its functionality as much as possible. Another recent man-related risk is a pandemic. The COVID-19 experience proved, on the one hand, how much a pandemic can change energy use patterns and, on the other hand, that we can face a shortage of network operators and maintenance workers.
Increasing resilience by addressing such perturbations demands increasing resilience at (a) the main grid level (improving resilience for the entire chain of remote (usually bulk) production + transport and distribution network) and (b) at the level of end-user, which can be the prosumer or the more structured energy community. This paper will focus mainly on the resilience of energy communities, which also demand prerequisites for local distributed production and storage means, with a microgrid acting for the community interest, thus being able to also operate in off-grid mode and for reaching harmonious and safe grid operation for the community. The combination asks for specific aspects of design, and some of them are presented in this paper as part of a richer palette of technical and economic challenges.
2.2. Energy Communities in European Union
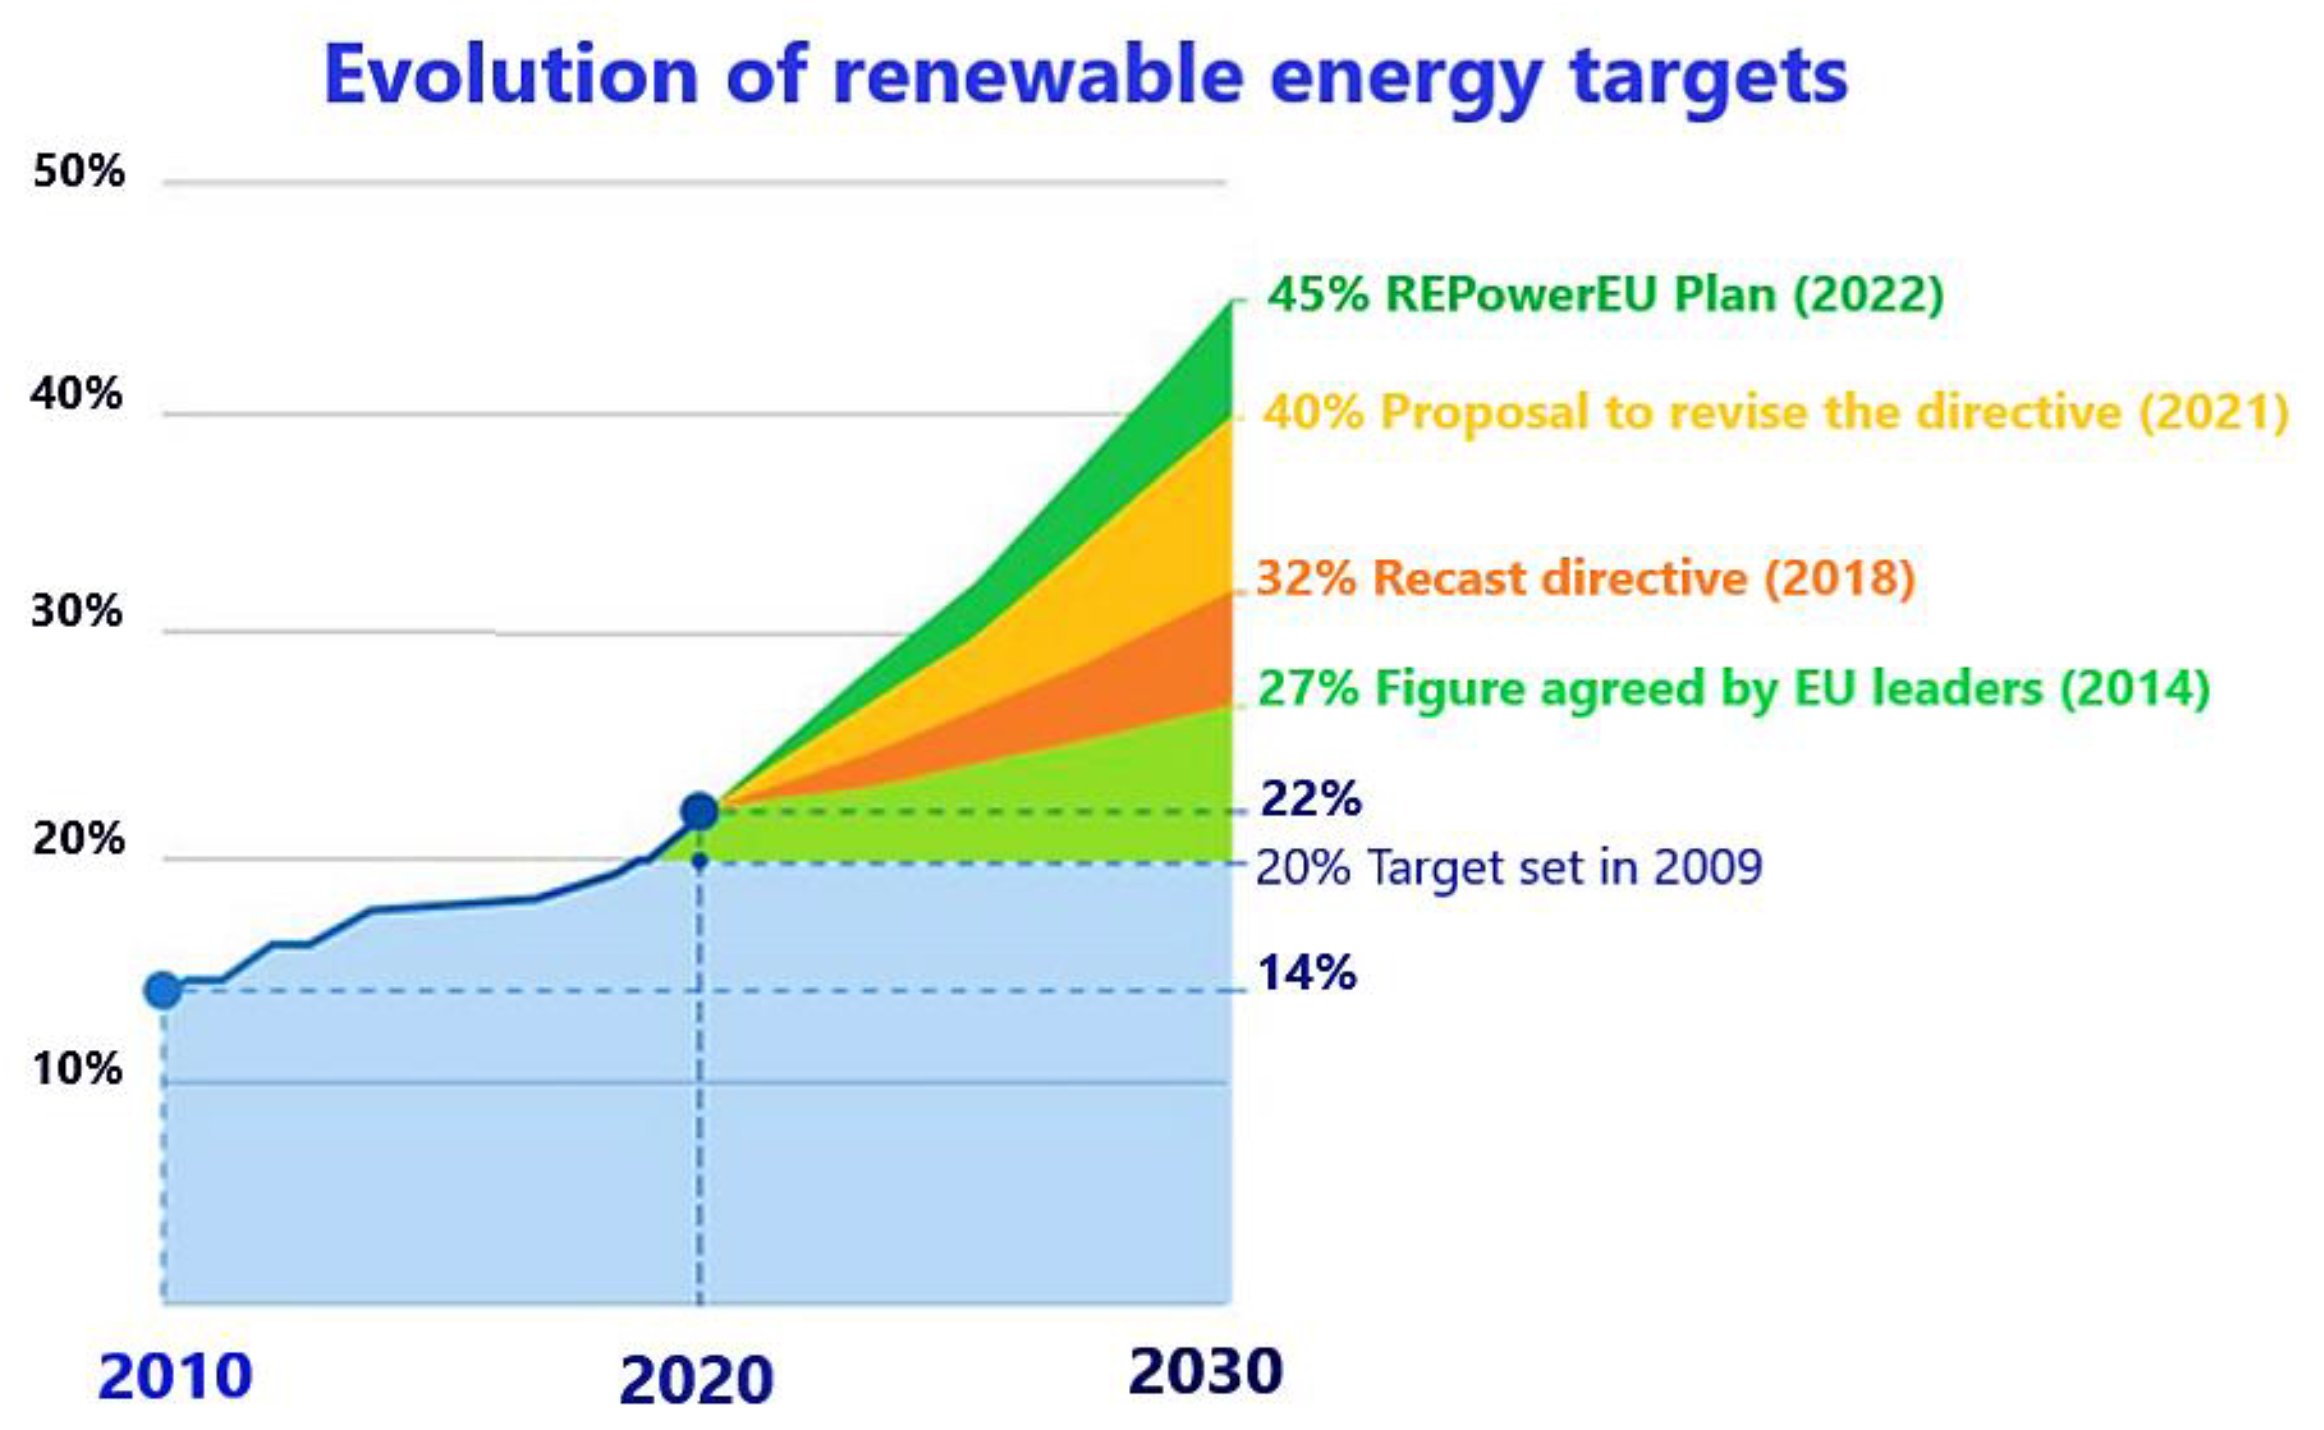
The European Union established a target for itself to be climate neutral by 2050. By 2030, as an intermediary target, greenhouse gas emissions should be reduced by 55% below the 1990 level. In what concerns renewable energy, after successfully meeting the target of a 20% share in the gross energy consumption of 2020, a new target was established for 2030. Starting from a proposed level of 27% in 2014, the recast Renewable Energy Directive (RED II) [
8] issued in 2018 raised the target to 32%, a new increase was added in 2021 to 40%, and finally, in 2022 the target was increased to 45% by the REPowerEU Plan, as shown in
Figure 2.
The renewable target is important because an important part of it should be achieved using distributed generation in small local facilities. In this respect, the EU relies on local communities, which are defined and regulated with two distinct concepts: the Renewable Energy Community—REC, defined by the Renewable Energy Directive (RED II), and the Citizen Energy Community—CEC, defined by the Electricity Market Directive (EMD II)
Both RECs and CECs are voluntary associations of individuals, SMEs, and local authorities, aimed to produce, consume, store, share, or sell electricity. Territorial proximity of participants is a must, but in this regard, requirements vary from country to country.
The EMD II Directive defines a CEC as a “legal entity that:
- (a)
is based on voluntary and open participation and is effectively controlled by members or shareholders that are natural persons, local authorities, including municipalities, or small enterprises.
- (b)
has for its primary purpose to provide environmental, economic, or social community benefits to its members or shareholders or to the local areas where it operates rather than to generate financial profits; and
- (c)
may engage in generation, including from renewable sources, distribution, supply, consumption, aggregation, energy storage, energy efficiency services or charging services for electric vehicles or provide other energy services to its members or shareholders”.
Similarities in definitions of RECs and CECs are obvious, as also are similarities between the other two elements defined, at an individual level, by the RED II Directive as “the self-consumer” and by the EMD II Directive as “the active customer.” All these new entities referred to in the European Union’s legislation have in common the use of renewable sources in a decentralized manner, the vicinity of generation and consumption, the territoriality of their activity, and the empowerment of citizens with electricity system management competencies. The last-mentioned aspect allows the RECs and CECs to actively participate, in their own name, in the competitive electricity market (as per rules from [
9]), providing both electricity and services.
Both the RED II and EMD II are Directives, which means that they should be transposed into national legislation of the EU Member States. Establishing concrete solutions on how RECs and CECs are integrated into electricity markets is left to national legislatures, which should adapt the mandatory principles provided in the EU legislation to the national electricity market particularities.
2.3. Microgrids
Both RECs and CECs are based, from a technical point of view, on a physical infrastructure consisting of a microgrid. As a definition, according to the US Department of Energy, a microgrid is “a group of interconnected loads and distributed energy resources within clearly defined electrical boundaries that acts as a single controllable entity with respect to the grid. A microgrid can connect and disconnect from the grid to enable it to operate in both grid-connected or island mode.” [
10]. As defined, there are several important characteristics of a microgrid: the existence of both loads (controllable or non-controllable) and generators (dispatchable or not); usually a single Point of Common Coupling with the regional distribution network; the possibility to function both in grid-connected and island mode, disconnected from the public grid.
3. Aspects of Design in Low Voltage Resilient Grids
Introduction
Affordable RESs (Renewable Energy Sources) and BESSs (Battery Energy Storage Systems) are essential for expanding the distributed generation, which can change the vision for redesigning electricity infrastructure, allowing microgrid deployment, enhancing the efficiency, and achieving higher resilience of prosumers and energy communities connected to the local grid.
Microgrids are decentralized energy supply systems that could form the cells of a smart, adaptive, and resilient power grid of the future [
11]. A bottom-up development into such architecture implies a wide spread of low-voltage microgrids.
A set of emerging technologies are enablers for the implementation of low-voltage microgrids:
- -
Advancements in power electronics, which trigger new equipment such as Solid-State Transformers (SST) [
12,
13], hybrid AC–DC networks, distribution versions of FACTS devices (to be named FACDS [
14]), advanced solutions to bring more dynamic ancillary/energy services with storage devices—to cope, e.g., with low or even no rotational inertia in the microgrid.
- -
Advancements in storage technologies for short-medium—such as BESS—up to long-term storage (e.g., with P2X solutions such as production and then use of green hydrogen) to address various needs.
- -
Better technologies and more affordability for RESs (e.g., emerging hybridization of silicon and perovskite for higher efficiency)
- -
Electrification of other domains such as mobility (new loads due to electric vehicles—EV penetration) and heating (use of heat pumps and of combined heat and power—CHPs, including fuel cells),
- -
ICT (Information and Communication Technology) advancements to bring more intelligence through advanced digitalization and so on.
When microgrids are operated by energy communities, there are new aspects that also need to be considered, and an important one is the capability to combine safe operation and resilience. This asks for several aspects to be analyzed:
- -
Grid architectures: adapting existing ones, designing new concepts, readiness for islanded operation, and for increased resilience.
Here, an essential aspect is to be able to provide a “grid-former” device in the microgrid when it is operating in the islanded mode, which needs to switch to grid-follower when going back to the on-grid mode. BESSs are appropriate for this purpose if their power electronics and automation are appropriately designed. A second candidate can be the solid-state transformer (SST), which has, by design, a grid-former functionality.
Other distributed generation can be a grid-follower (it takes the frequency and voltage of the grid as a reference) and usually acts with droop control (thus also being considered “grid supporting” converters), meaning that they can increase or decrease the injected power based on the frequency value, as a signal usually provided by the grid-former device.
- -
Energy storage roles and their needed capacities to support off-grid operation and resilience; this includes voltage regulation in LV networks as well as an all-time equilibrium between the production and consumption of electrical energy.
An essential aspect of LV microgrids is the fact that they are near-resistive networks (R of the lines is usually much higher than X), thus making reactive power Q control less effective and bringing additional energy losses, while active power P control becomes more attractive, which also comes with a reduction in losses due to the fact that it is increasing neighborhood coupling between production and consumption. These particular aspects are treated in the first two use cases below.
The first use case looks for measures of increasing self-consumption as a design KPI for increasing resilience as well by using appropriate storage means at the prosumer level. The analysis brings more clarity on the recommended ratio ( as the nominal capacity of the BESS and as peak power of the PV installation), which is found in real applications in a wide range between 0.5 and 4. A higher value of ratio (nominal energy of the BESS versus the nominal power of PV) allows more flexibility and resilience, with the disadvantage of higher cost due to the increase of battery capital costs.
A more general analysis is the size of a prosumer’s BESS such that the total energy exchange with the main grid is reduced to a minimum over a year by taking into consideration also economic aspects related to the cost of storage. This can be seen as well as an aspect of design for the energy community resilience and is treated in use case 3.
- -
The trend towards electrification of mobility (increased electromobility share) and of heating (e.g., use of heat pumps instead of traditional fossil-fuel solutions) and its impact on microgrid planning and operation is a new burden to be addressed.
A particular aspect is the effect on the voltage level in the neighborhood of these new loads, which frequently also have in-rush currents, especially in the case of heat pumps (due to their multiple compressor start-ups). This particular aspect is treated in the second use case of the next chapter.
- -
ICT role for supporting intelligent microgrid features, resilience, cyber-security, etc.
ICT can have an important role in the energy community microgrids, as it can give technical support for various functionalities such as SCADA, automatic smart meters readout, microgrid automation, local market of energy services and energy supply, and so on. A particular aspect is cyber-system resilience, which demands ICT architectures that allow basic ICT solutions to provide support even in the case of temporary communication breakdown at the regional or national level.
There are many aspects of design to be considered for such microgrids. Ref. [
15] investigates how a district with a high penetration of renewable resources can entirely self-consume its production at a community level by using storage and other means. This type of task is, for sure, an aspect of design for energy communities, which is complemented in the present paper by using BESSs for voltage control through P means, which is another aspect of design in the community. In [
16] is treated optimal scheduling of the real-time operations of the BESS coupled with a higher-level grid optimization, using technical and economic information and forecasting techniques. While having valuable contributions, the approach does not also consider voltage level constraints in nodes, which is a typical problem when a microgrid has a high penetration of renewables, with dependence on the microgrid topology and parameters. Our use case 1 is a technical use case that focuses particularly on BESS use for preserving hourly average voltage in a microgrid. In [
17], BESSs contribute to maintaining frequency stability, which is another important parameter in grids, however, not addressed in the present paper. Many other aspects are addressed in scholarly works, and they are the subject of a special paper making an overview of such preoccupations. Sizing storage addresses, therefore, many different aspects, e.g., increasing self-consumption, increasing resilience, and maintaining voltage level during operation, bringing various challenging issues in microgrids with high-RES penetration, as there are important differences between (a) mid-day high production (one of the two off-peak periods of a day) with reduced consumption and (b) the evening peak period when, e.g., solar power is missing.
Related to voltage level control, as other studies focus on classical measures such as transformer tap changing (if they exist) and Q control, this paper is instead concentrated on the potential of using active power P of BESSs to control the voltage level in a community microgrid. Moreover, aspects of design regarding the BESS needed the capacity to perform the U control with P are also considered in the use cases below by combining U energy service and energy supply in one package.
The first use case addresses the need of the prosumer’s BESS for increasing self-consumption, while part of it can be used to help improve voltage level in its point of common coupling (PCC) to the grid, while the needed capacity to do that can be used to design the BESS needed size. Node 11 and its prosumer Pors#1 are used for the particular study.
A second use case shows the potential of using distributed/local BESSs to improve in real-time the voltage level in a neighbor’s grid PCC node, using as an example new loads as a consequence of electrification of heat through heat pumps. Node N12 and the aggregated consumption in this node are used in combination with the prosumer Pros#1 connected to node N11. The active power (P)-based control also gives indications regarding the extra needed BESS capacity for this service. The example shows that local neighborhood energy supply combined with local voltage regulation based on P (as an alternative to traditional Q regulation) can be considered as a combined energy service + energy supply pack to be applied in new business models.
A third use case shows a solution for optimizing the prosumer battery capacity considering the load and PV conditions of the prosumer, which maximizes self-consumption on a year-based timeframe.
The use cases focus on BESS capacities to contribute to the microgrid design and underline their P-control potential for regulating voltage levels in the energy community microgrids.
A set of three time horizons has been proposed: year, day, and real-time, suggesting that the “aspects of design” need to address all these three horizons, each with different challenges, in the low voltage resilient microgrids of energy communities. Use cases 1 and 2 focus on proving technical solutions regarding U control using P means provided by BESSs, while BESS capacity needs are also presented, while use case 3 is a yearly-based optimization that considers both technical and financial aspects applicable for sizing resources for an energy community.
4. Use Case 1: Energy Storage for Voltage Level Control in Microgrids of Energy Communities with High-RES Penetration
High-level penetration of RES production in distribution networks brings several challenges, such as power direction reversal on transformers, increased power on some line sections, and power quality issues, such as voltage level problems. The latest challenge is treated in this use case with prosumers connected to an LV microgrid by showing the potential of combined use of local energy storage for (a) increasing self-consumption, (b) reducing the maximum injection power in the grid, and (c) for mitigating voltage level problems in the PCC of the prosumer as well as of neighborhood users.
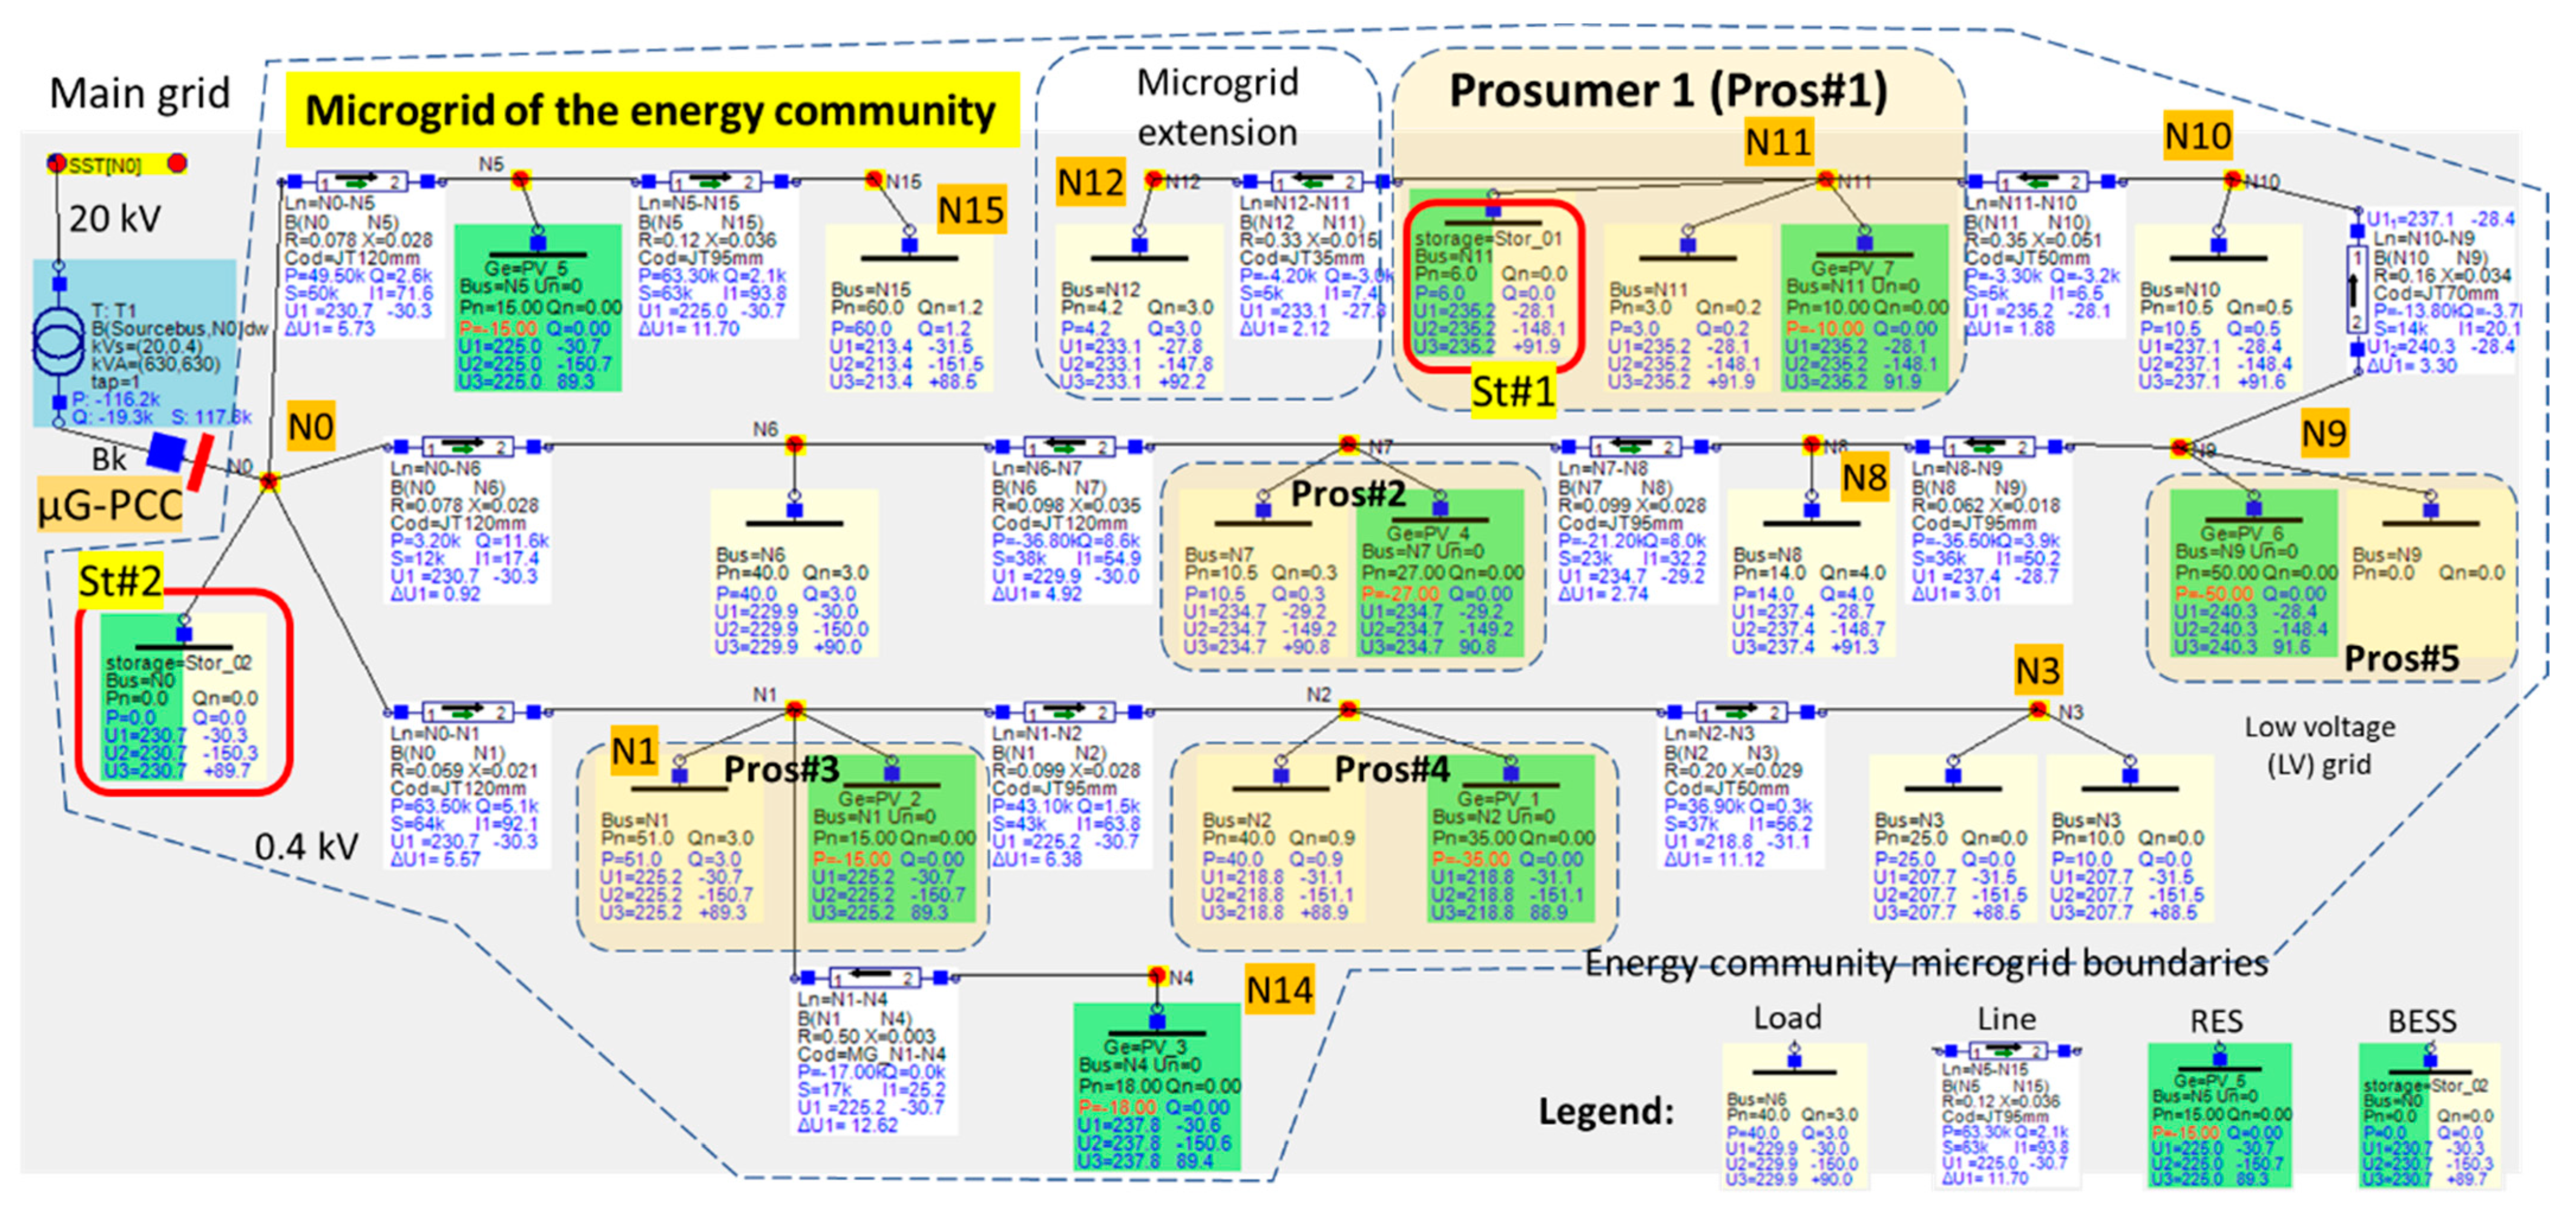
Figure 3 shows the proposed LV network with a load flow calculation for a particular situation. Network topology and parameters, as well as values of the load and generation resources, are displayed in the rectangle of the objects (load, line, RES, BESS, transformer), while the grid and objects representation user interface (UI) is more similar to Simulink UI representations (objects are clearly drawn, nodes are connections between the poles of the objects). All objects have in the selected setups a symmetrical behavior, as all are three-phased equilibrated items.
The LV network supplied by the MV/LV transformer T1 can be considered a microgrid that can work both on-grid and off-grid (subject of µG-PCC status ON or OFF for the breaker Bk), while in the latest situation, the St#2 resource need to become “grid former” for the entire microgrid. The setup has five prosumers (consumption and production). Prosumer 1 (Pros#1) also has BESS and will be used to show the potential of multiple services of its St#1 resource. All scenarios of this use case have been analyzed by using OpenDSS load-flow engine [
18] and GridMonK open-source user interface developed by one of the authors [
19].
It is widely known in practice and in assessed in various studies that reactive power can be used to influence voltage level, thus for voltage control [
20,
21]. In high voltage networks, it is the basic mechanism for voltage control, while at a medium voltage, it also proves to be useful. It is, however, less studied and sometimes even not known that in low voltage networks, the effectiveness of reactive power in voltage control is much lower than at higher voltage networks and that, in fact, the reduction of power factor
(due to increased reactive power Q) is more related to increase in energy losses rather than to voltage control. The main policy in LV networks is, in fact, to keep K higher than a certain value, e.g.,
, also known as the “neutral factor.”
Then, while in LV networks, the PCC-connected actors are more likely encouraged to increase the power factor K, one of the main tools for voltage level control remains the more dynamic use of the transformer’s tap changer, if it exists. However, in practice, this solution is challenging as well, as each day may ask for an increase or decrease in the position of the tap changer.
For example, in the studied microgrid, in the evening period, the consumption can reach nominal values while PV production goes to zero (evening peak hours), which may require high tap-based voltage in node N0 to its limit or even being able to exceed the upper limit of accepted voltage (UN + 10%). Similarly, in the middle of the day (mid-day lower consumption or “off-peak”), the PV production may reach nominal/maximum values while the consumption can be 70–80% of the nominal one. In the latter situation, taps can be used to bring far nodes (e.g., N11 here) below maximum voltage, but in node N0, the voltage may be near or under the lower acceptable value. Moreover, excessive use of taps (considering that the transformer has them) reduces the lifetime of the transformer.
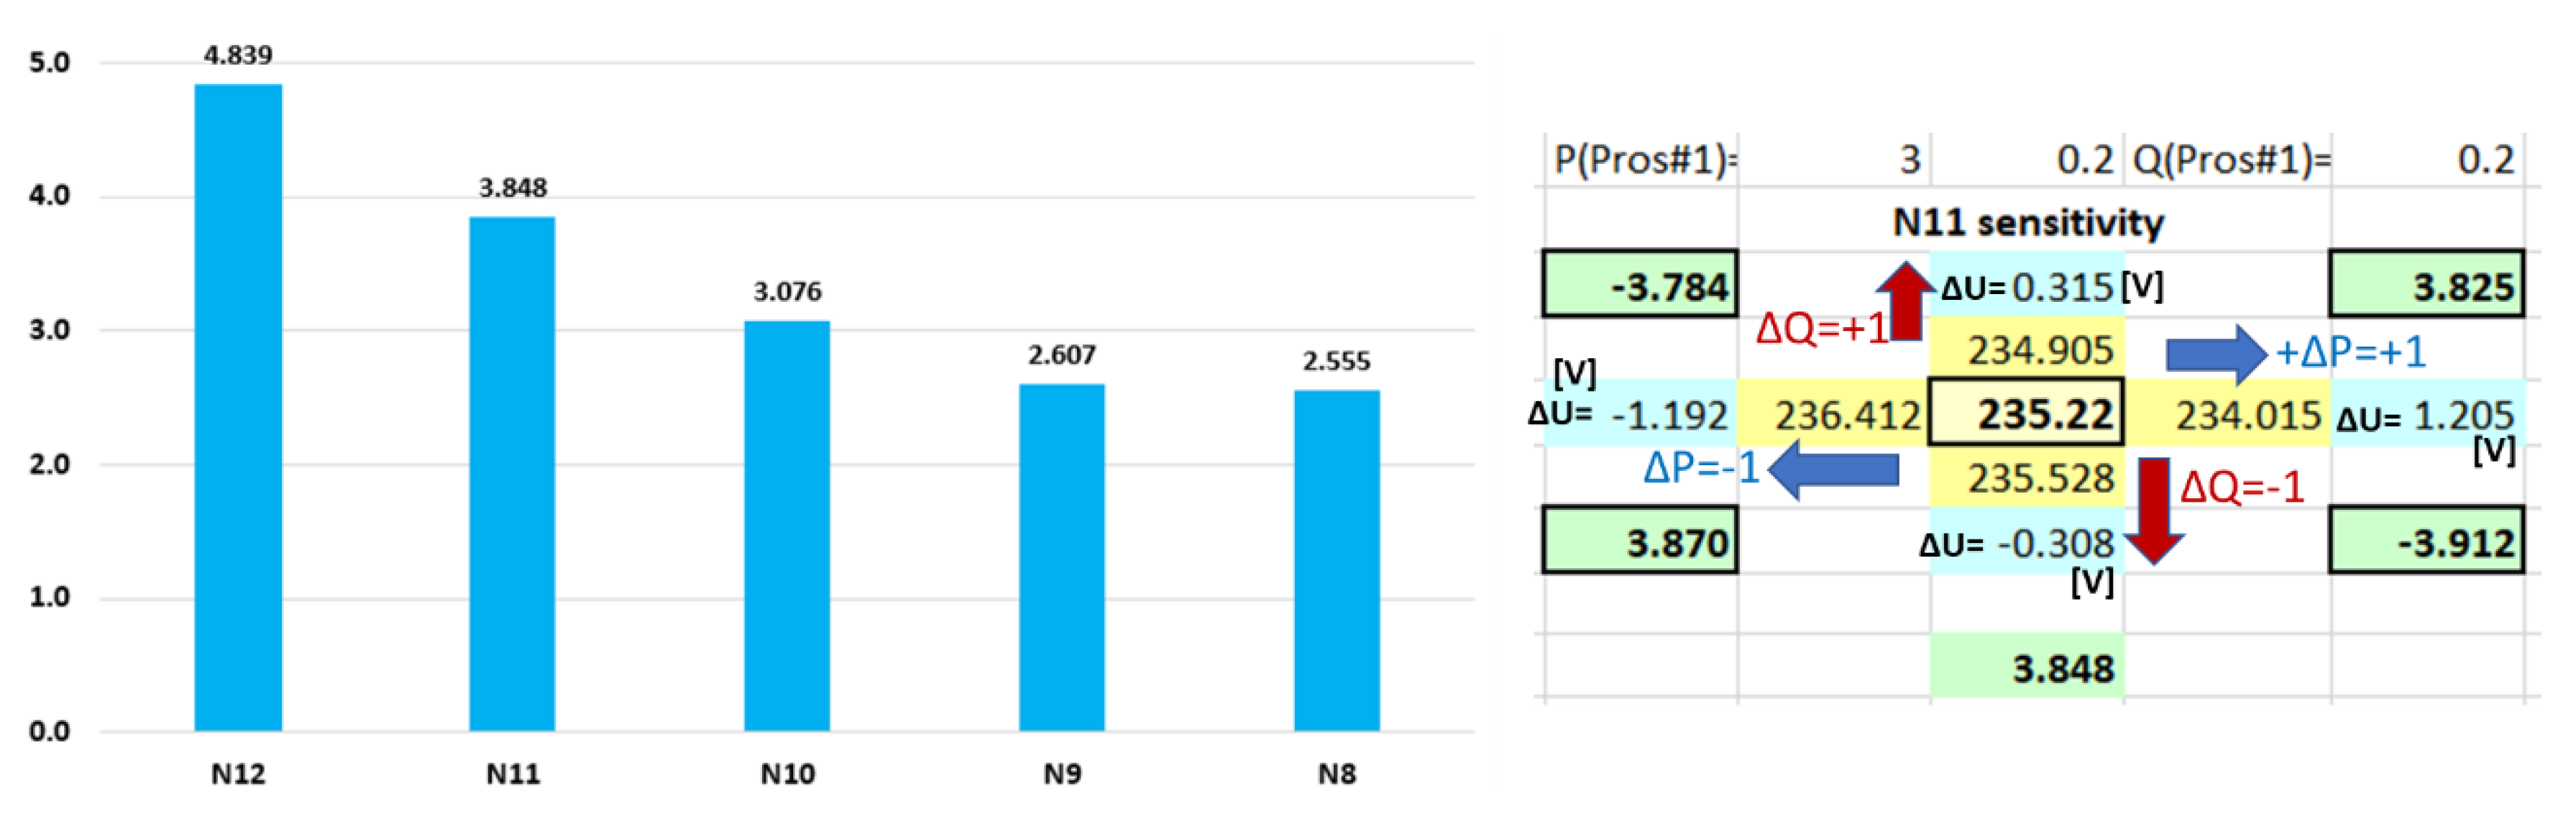
In order to understand which dynamic measure has a bigger impact on voltage level: the use of Q or the use of P control, a sensitivity analysis can be made. In this respect, each far node (N11, N10, etc.) is tested by increasing or decreasing the P in the node with one unit (±1 kW), then by increasing and decreasing Q with one unit (±1 kvar) and by looking at the voltage change in each case.
The ratio between ΔU change if it is applied ΔP = ±1 kW or ΔQ = ±1 kvar, for nodes N12–N9 is shown in
Figure 4. While N11 is used for Scenarios S0, S1, S2, and S3, N12 is an extension used in S4.
In all situations, the sensitivity of the grid shows that the P control is much more effective (2.5 to 4.5 times) than the Q control. The furthest nodes from N0: N11 in this use case and N12 in the following use case 2—which proposes an extension of the grid—also show the highest sensitivity to P control.
The prosumer connected to N11 is selected for the use-case study. N12 is considered as being an enlargement of the grid and used in Scenario S4, while N11 can provide, in this case, a voltage regulation service for the new consumer connected to N12.
The higher controllability of voltage with P instead of Q is presented in fewer works, as low voltage is also a rather recent focus and deserves a separate overview of such preoccupations in future work. Our study is based on sensitivity analysis; thus, it can be used when similar results of sensitivity apply to other microgrids with their specific topology and parameters.
The following scenarios are considered for the evolution of main parameters for Pros#1 (N11):
S0 (
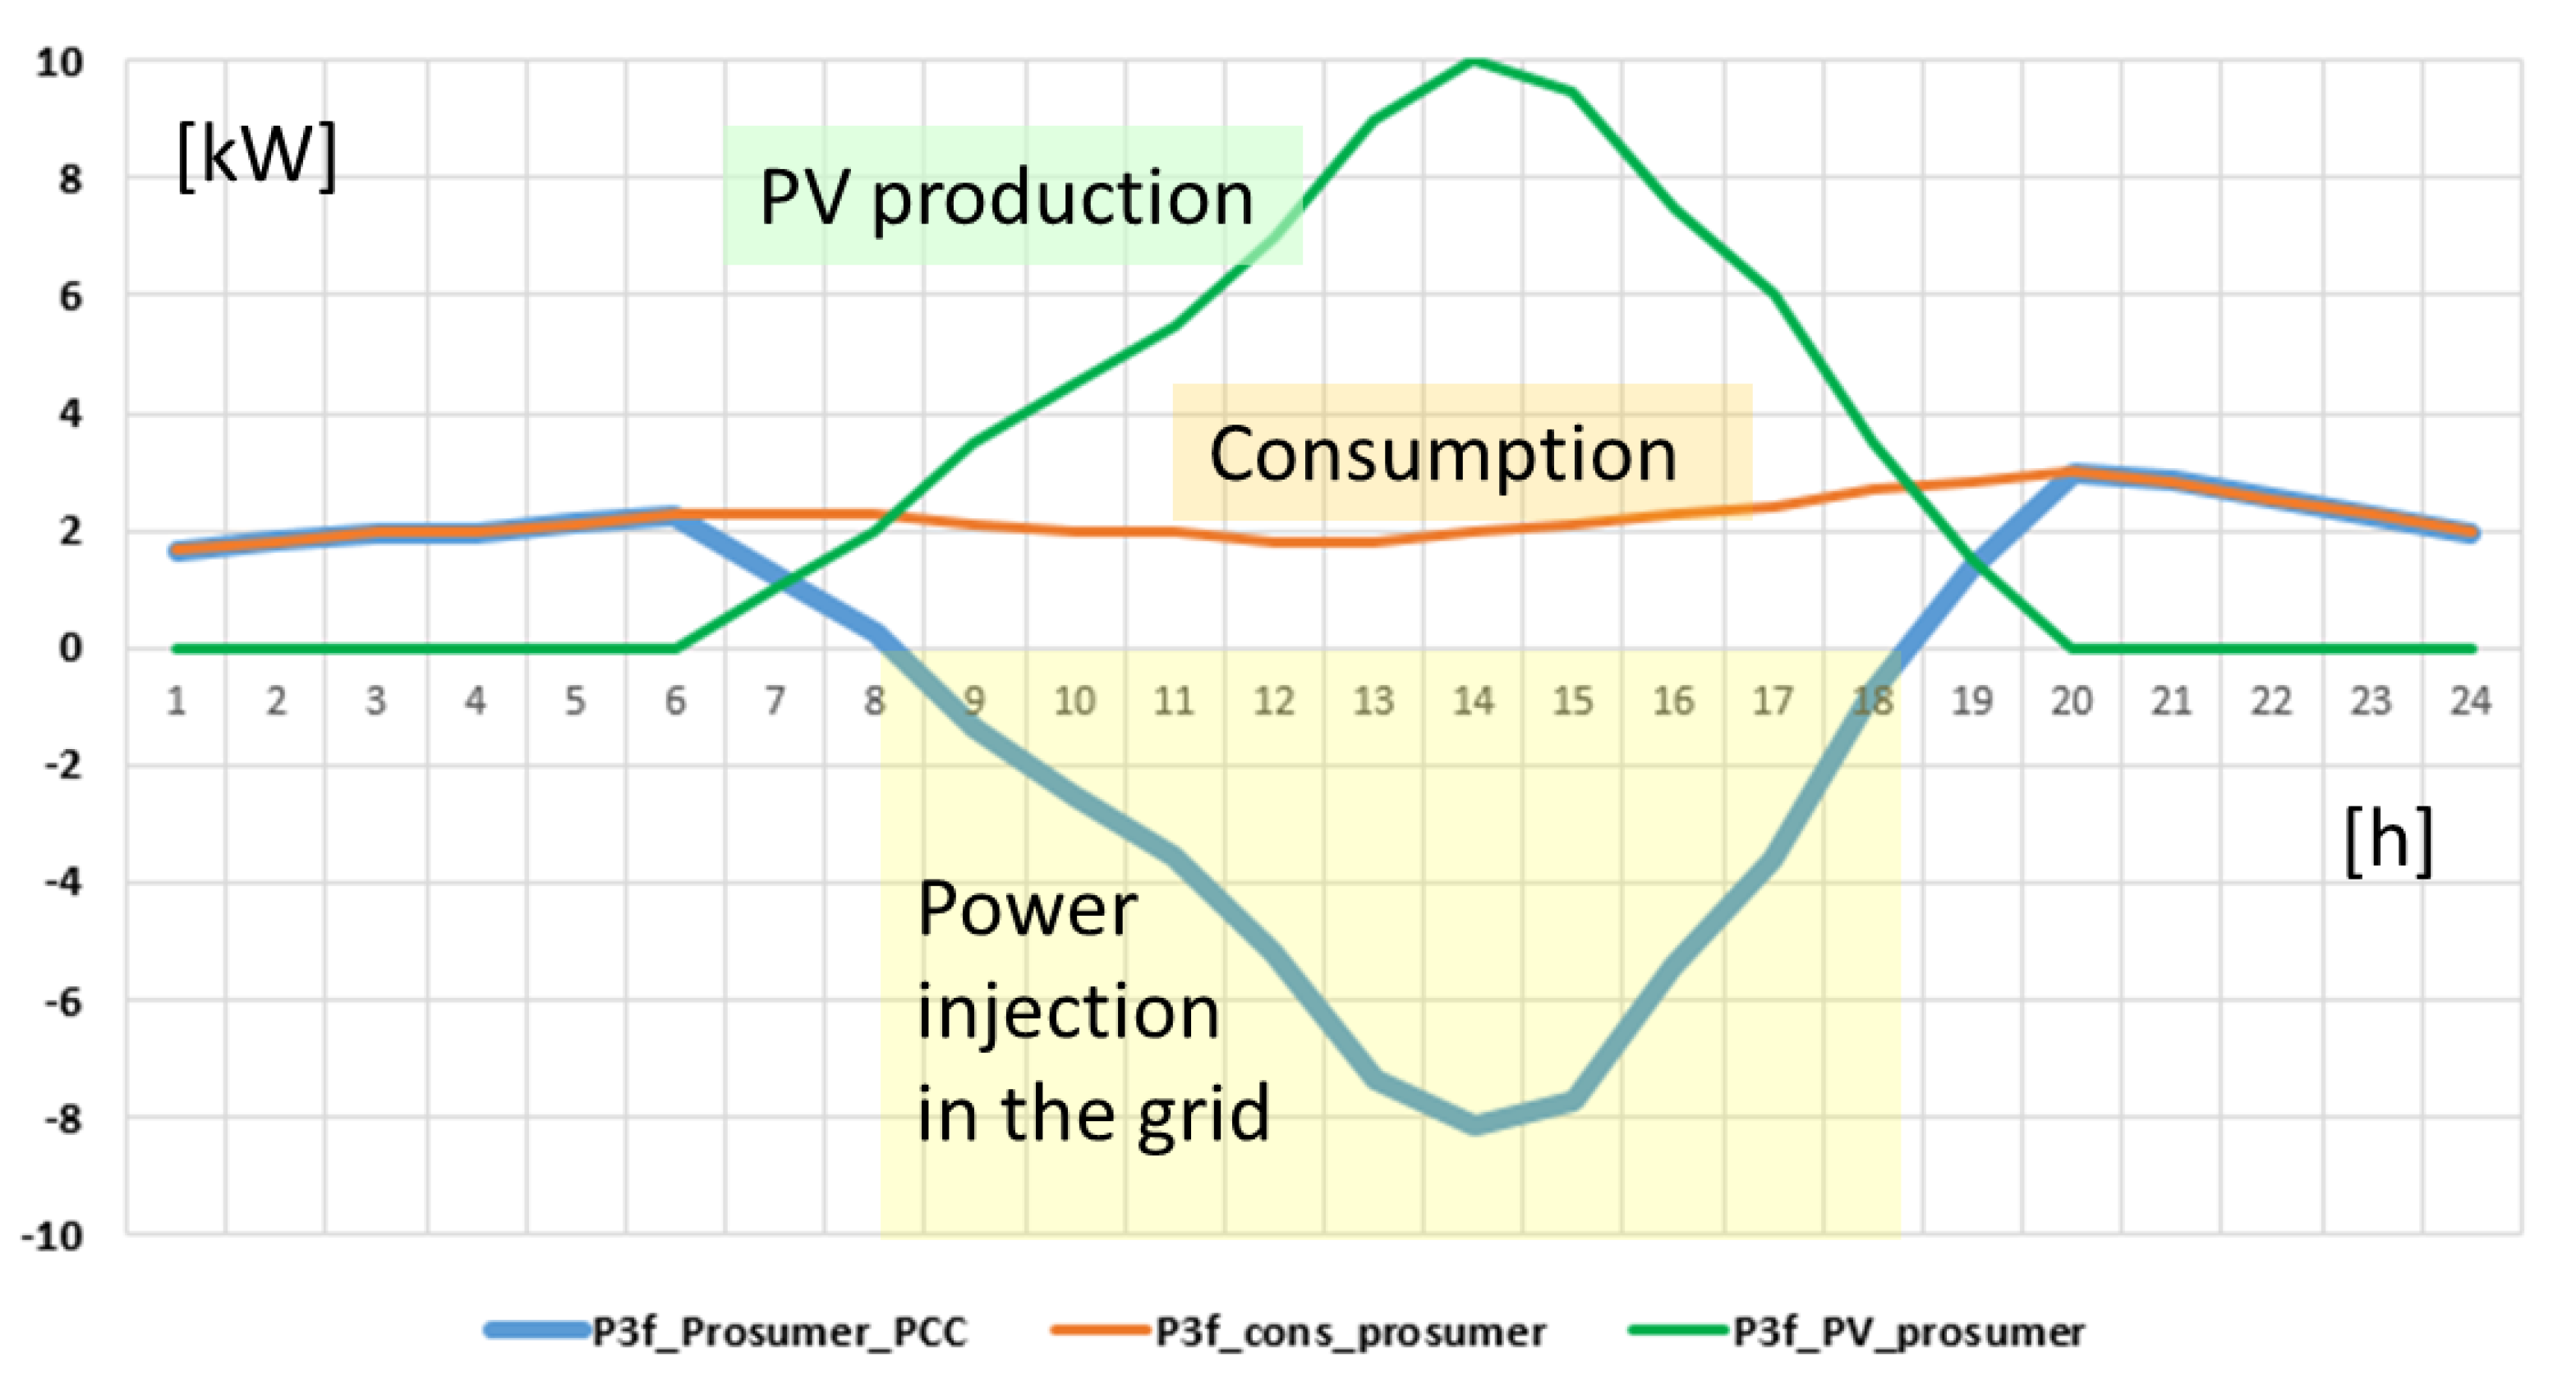
Scenario 0—basic), with the prosumer without storage but having a 10 kW PV installment. The studied consumption and production profiles are shown in
Figure 5.
The daily consumption is 52.65 kWh, while the daily PV production is 70.5 kWh (it is chosen a sunny day in summer), giving an extra 17.85 kWh of extra energy, which can be used for energy community purposes. However, in S0, the self-consumption is only 35.2% due to the time mismatch between the production and consumption profiles.
Excessive power injection back in the grid is not wanted by grid owners (either DSO or owned by an energy community), such that in some countries, there are limitations regarding the maximum power allowed to be sent back to the grid to preserve its functionality within acceptable boundaries of power flow and voltage level. In this particular case, a maximum hourly power of 8 kW is recorded during the mid-day, which can bring grid troubles.
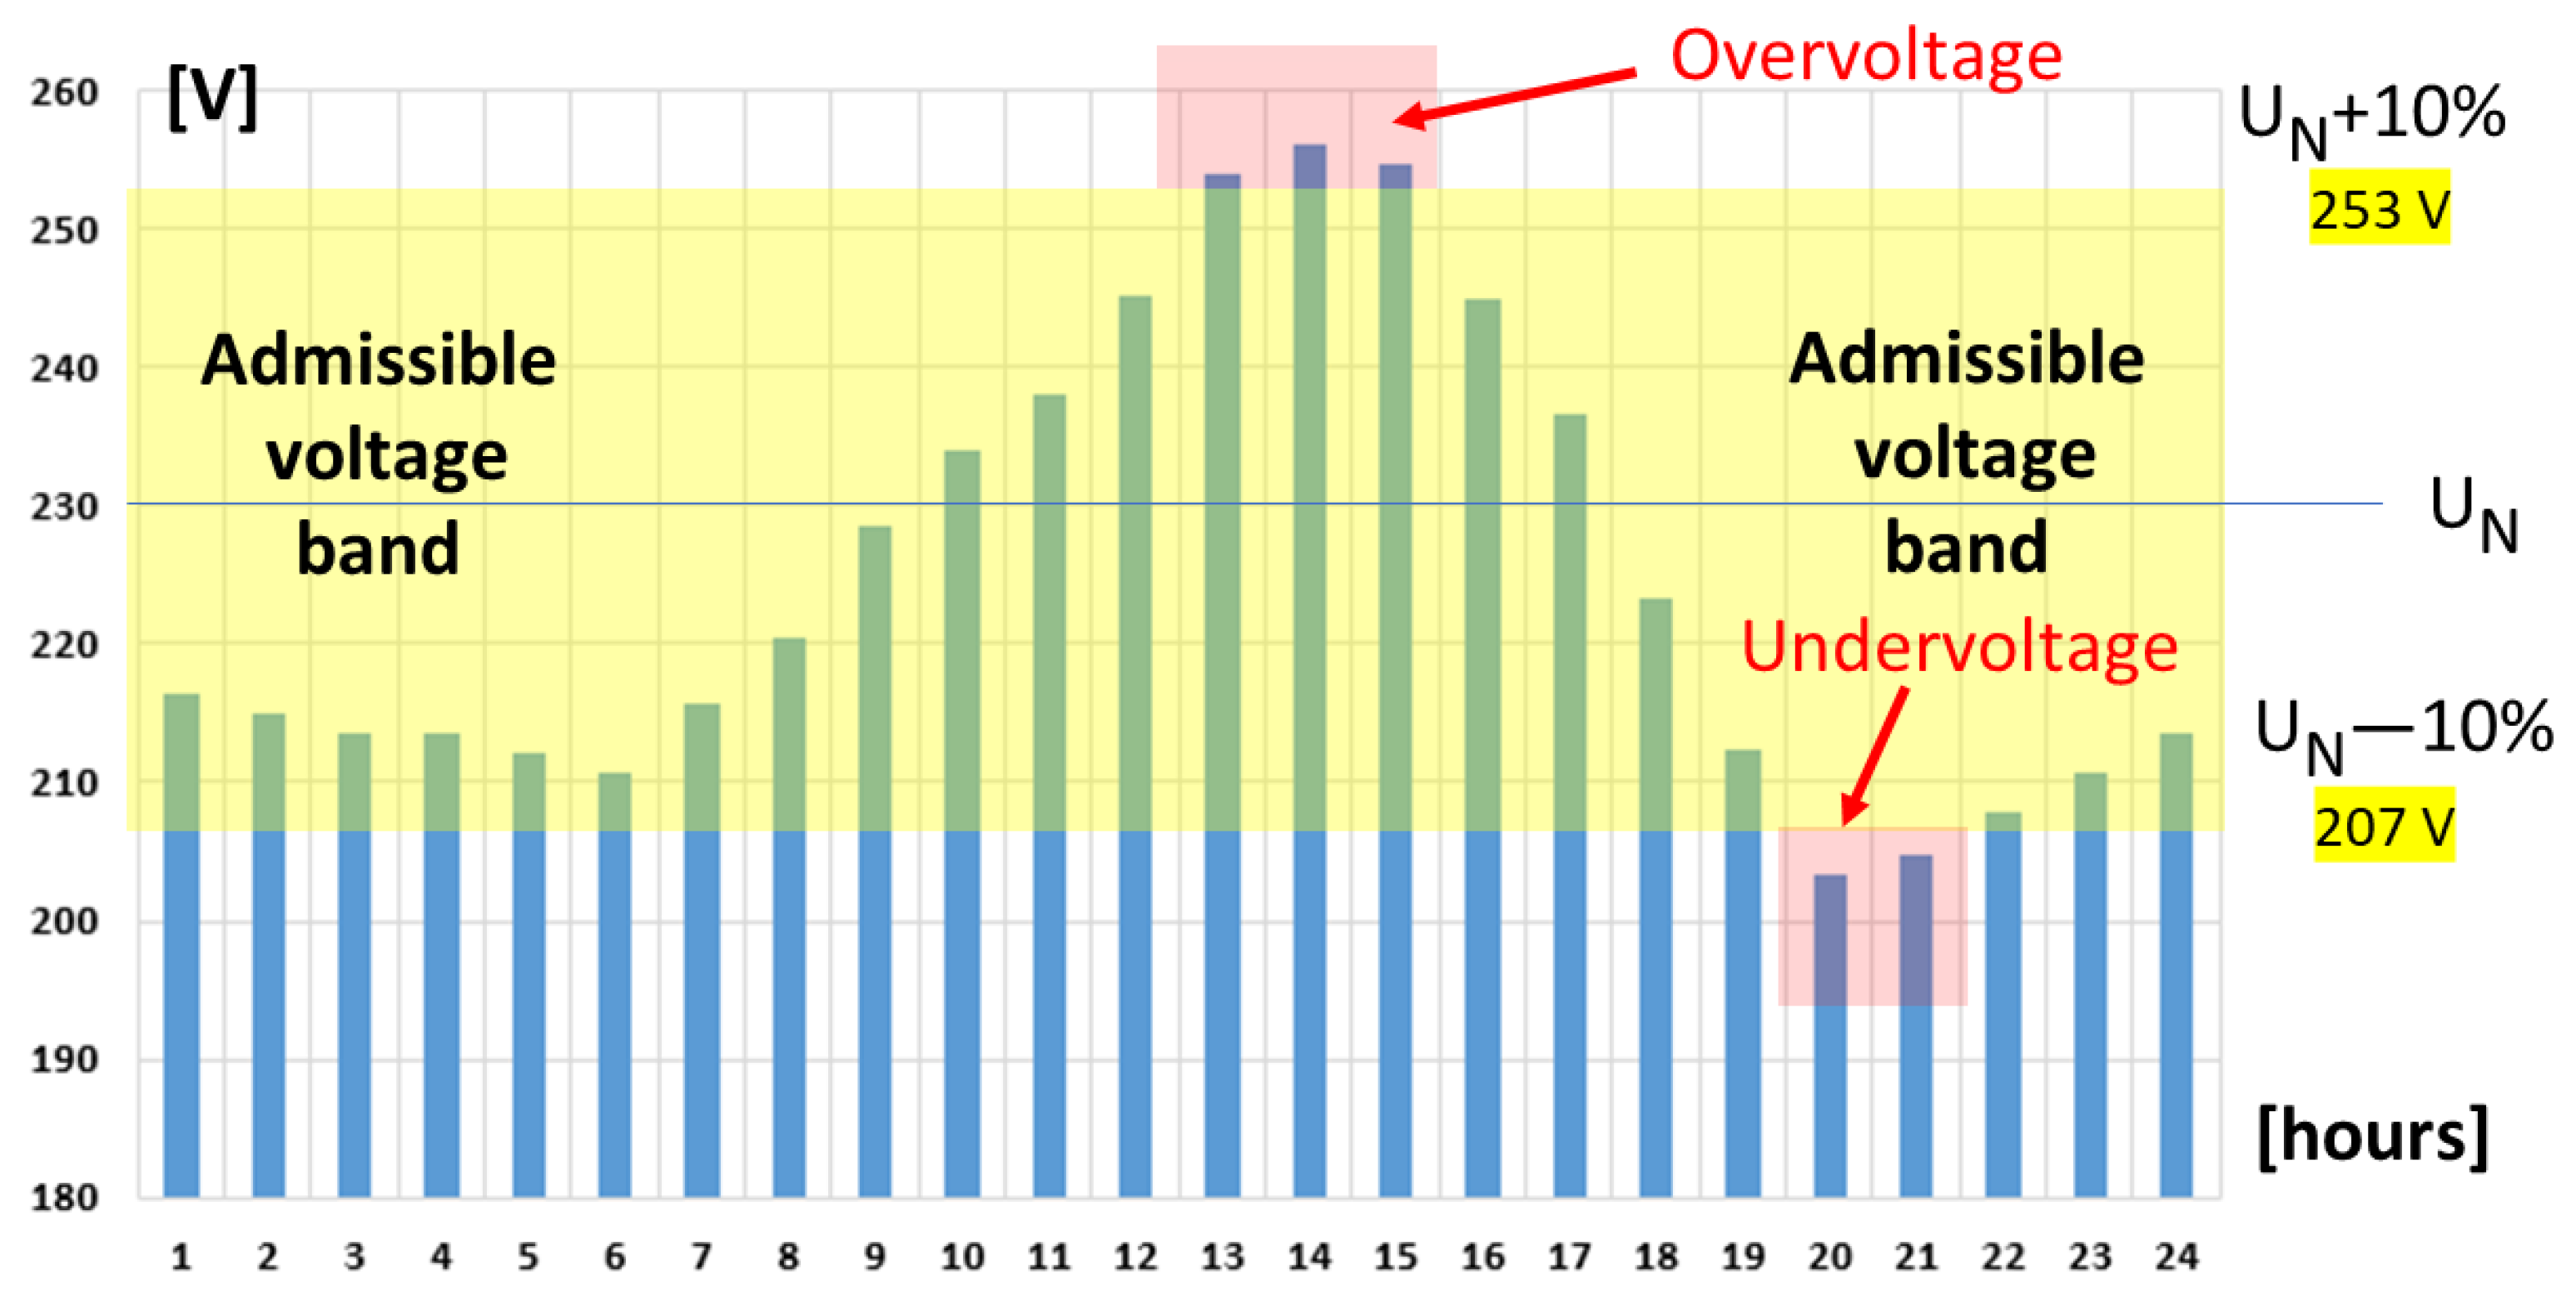
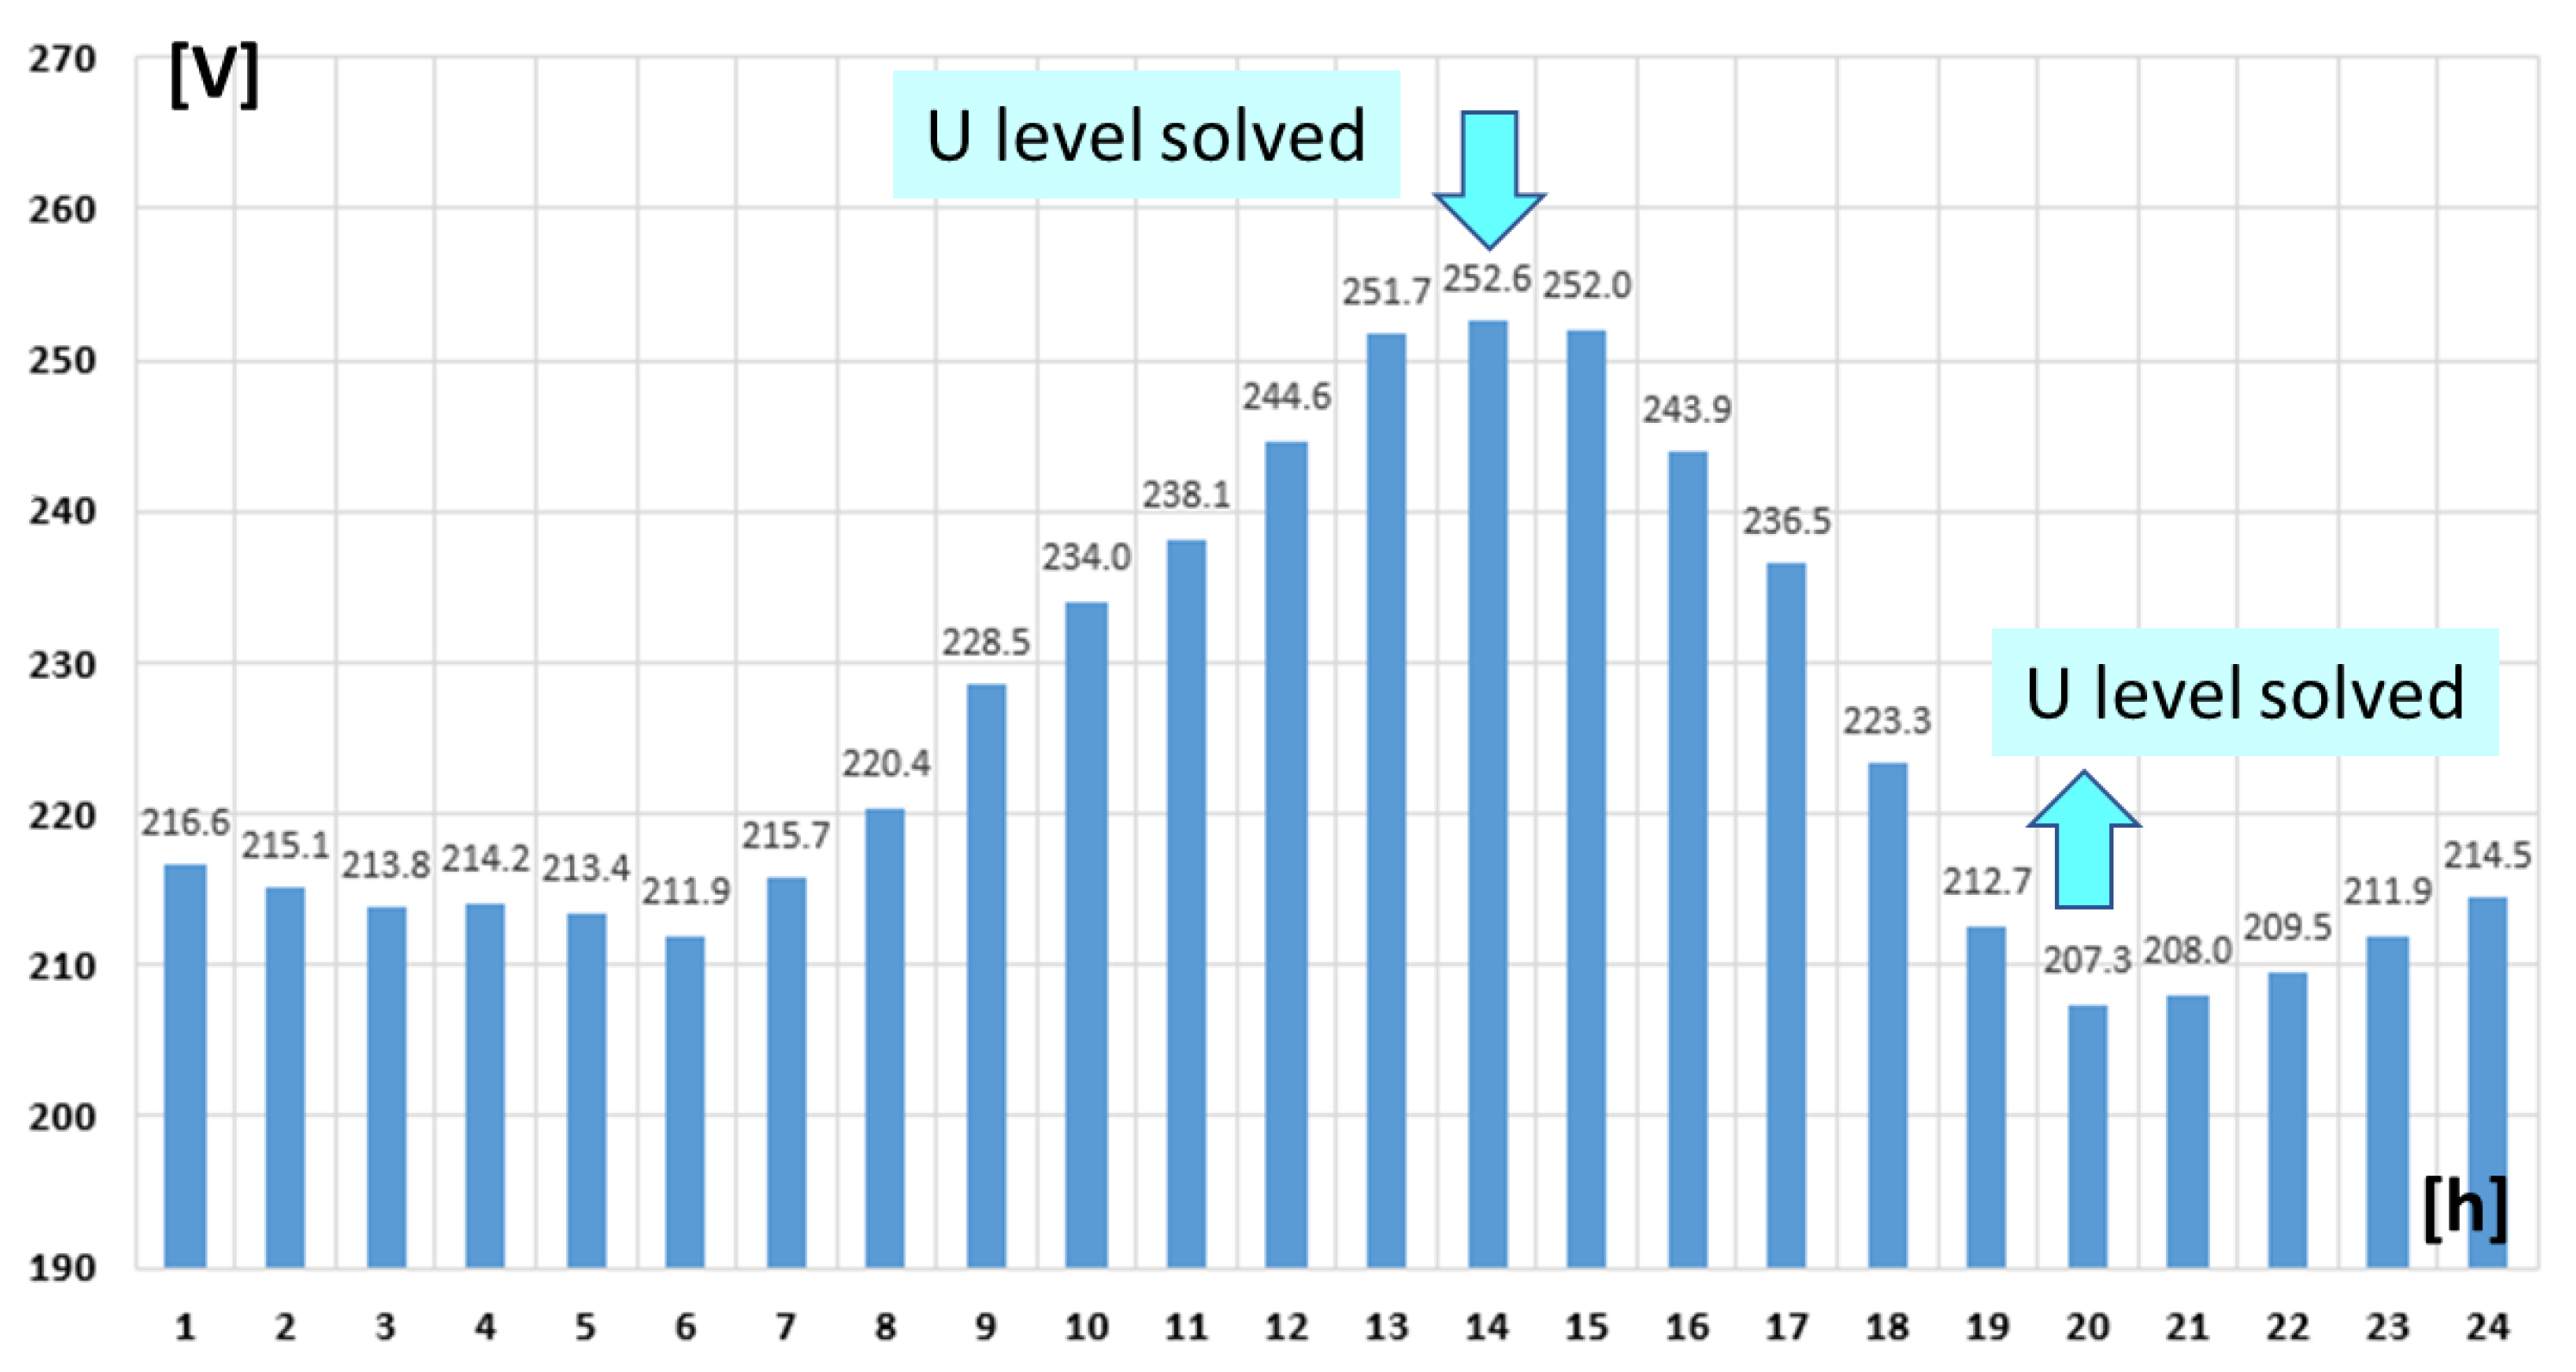
An analysis of the hourly voltage level in N11 is shown in
Figure 6.
It shows that voltage is too high during the mid-day “off-peak” period (hourly intervals 13, 14, and 15) and too low in intervals 21 and 22. The awareness of this situation asks for Scenario 1.1., next.
S1.1. (
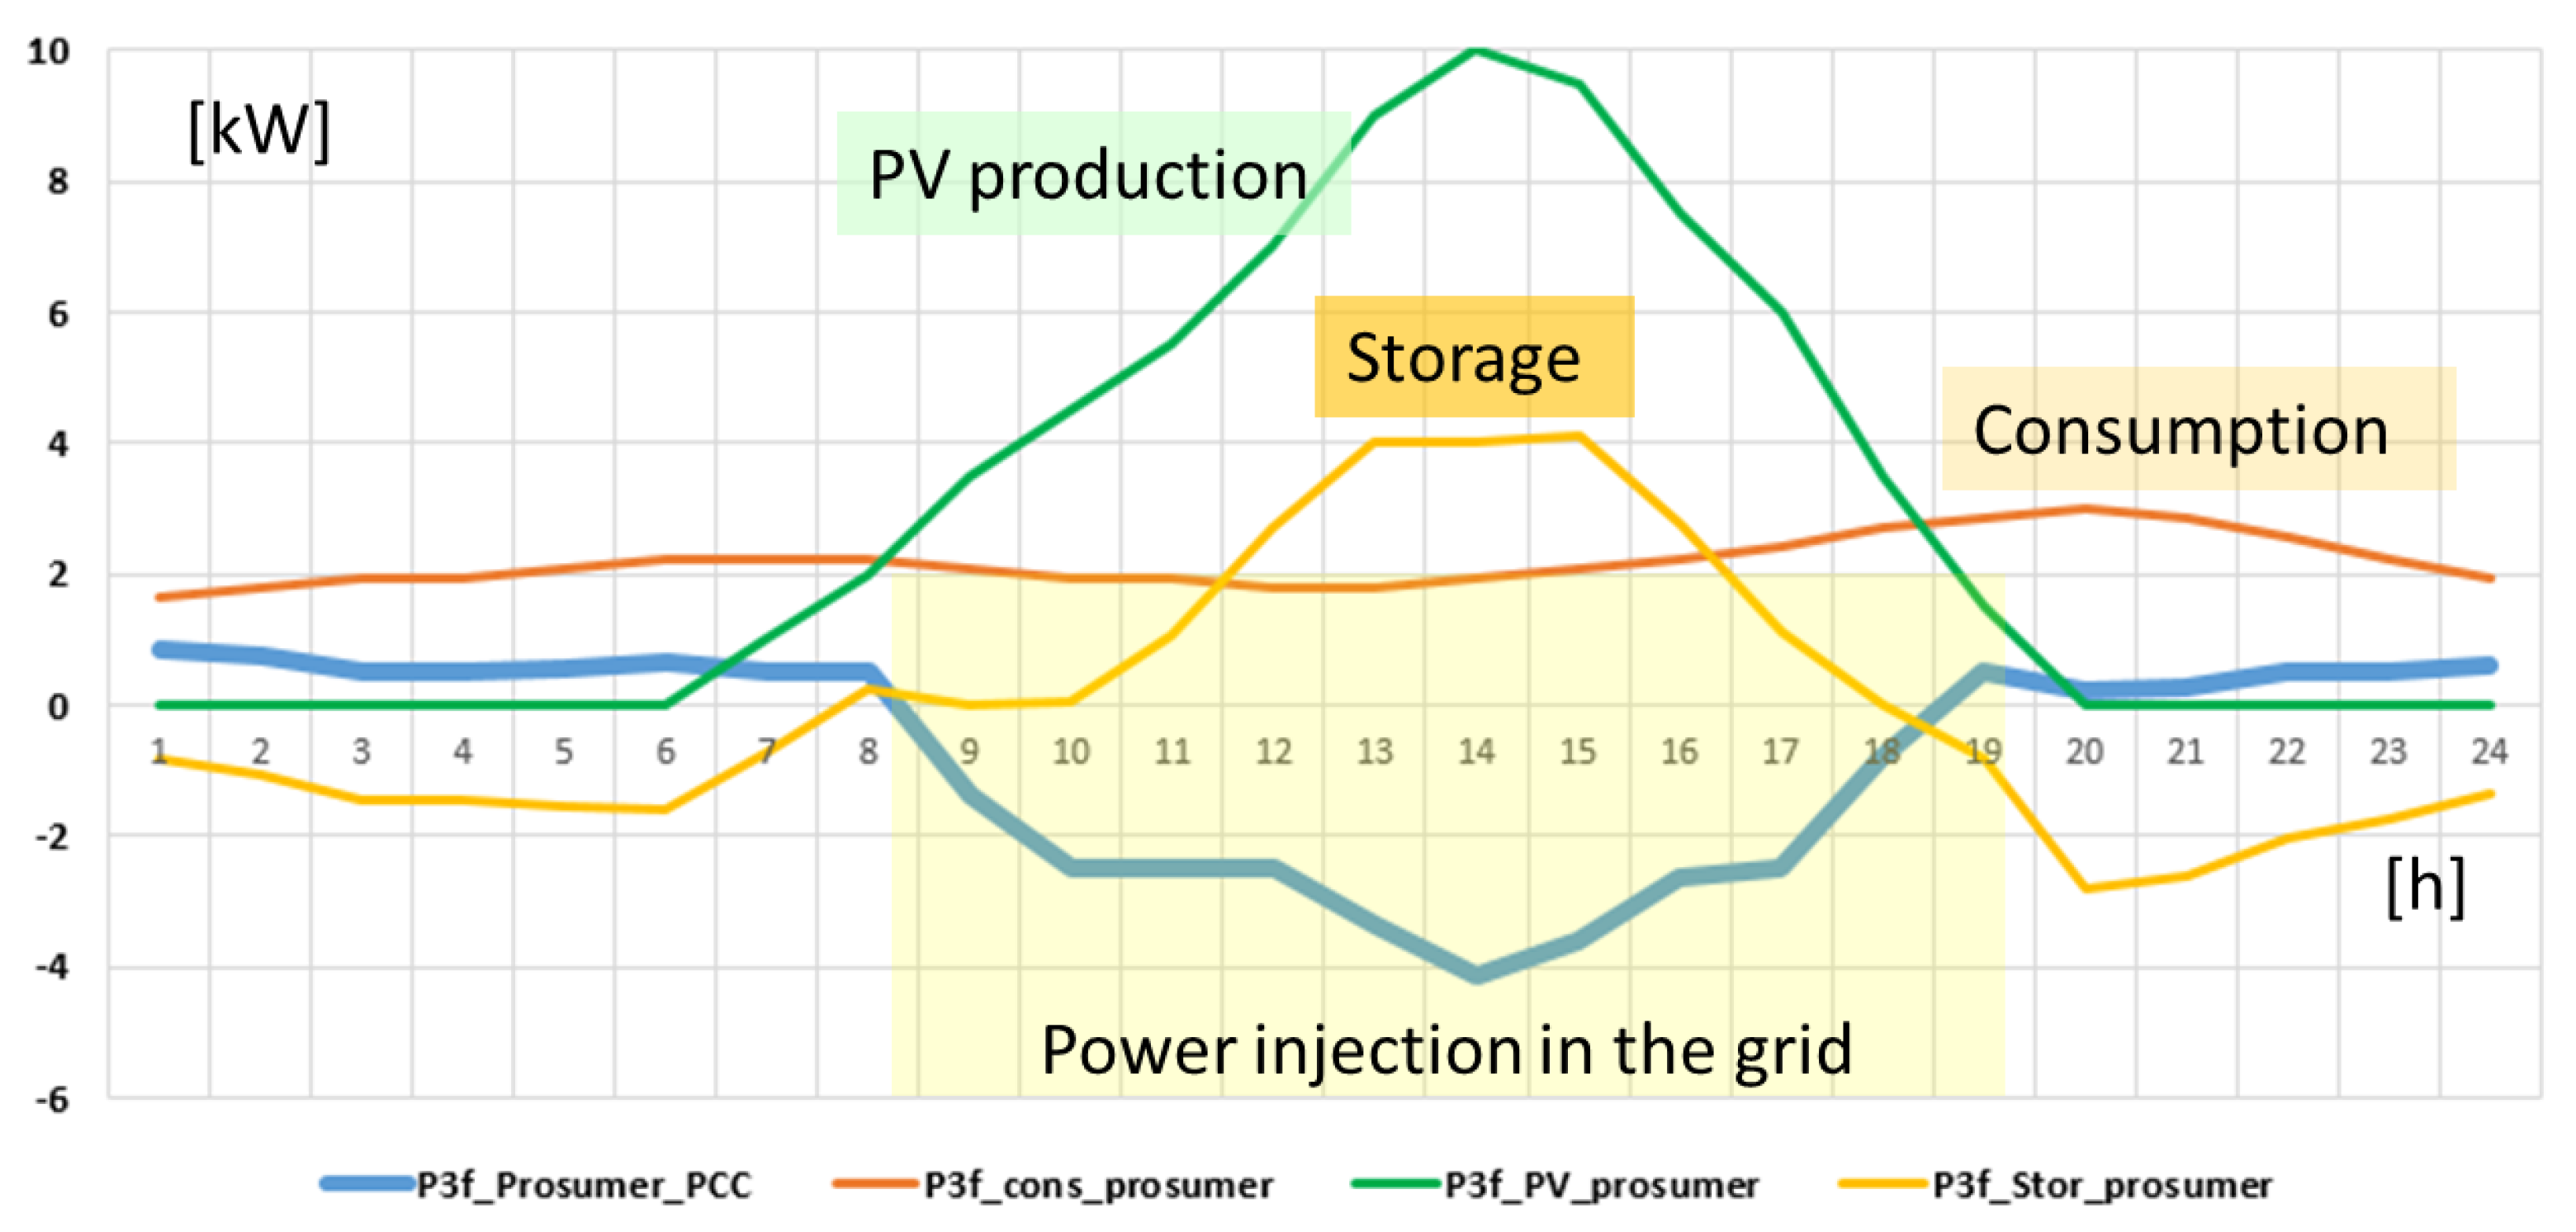
Scenario 1.1 with storage) uses a 10 kWh battery at the prosumer’s site (node N11), which is used as a first purpose to increase self-consumption. In this respect, the battery capacity is used to reduce the PCC consumption when P > 0 and to reduce the injected power in the grid when P
PCC < 0, which is made with a simplified method. BESSs have during 24 h a full cycle of charging starting from morning (using its full capacity during the period) and discharging up to the next morning, and the cycle uses a simplified model without losses.
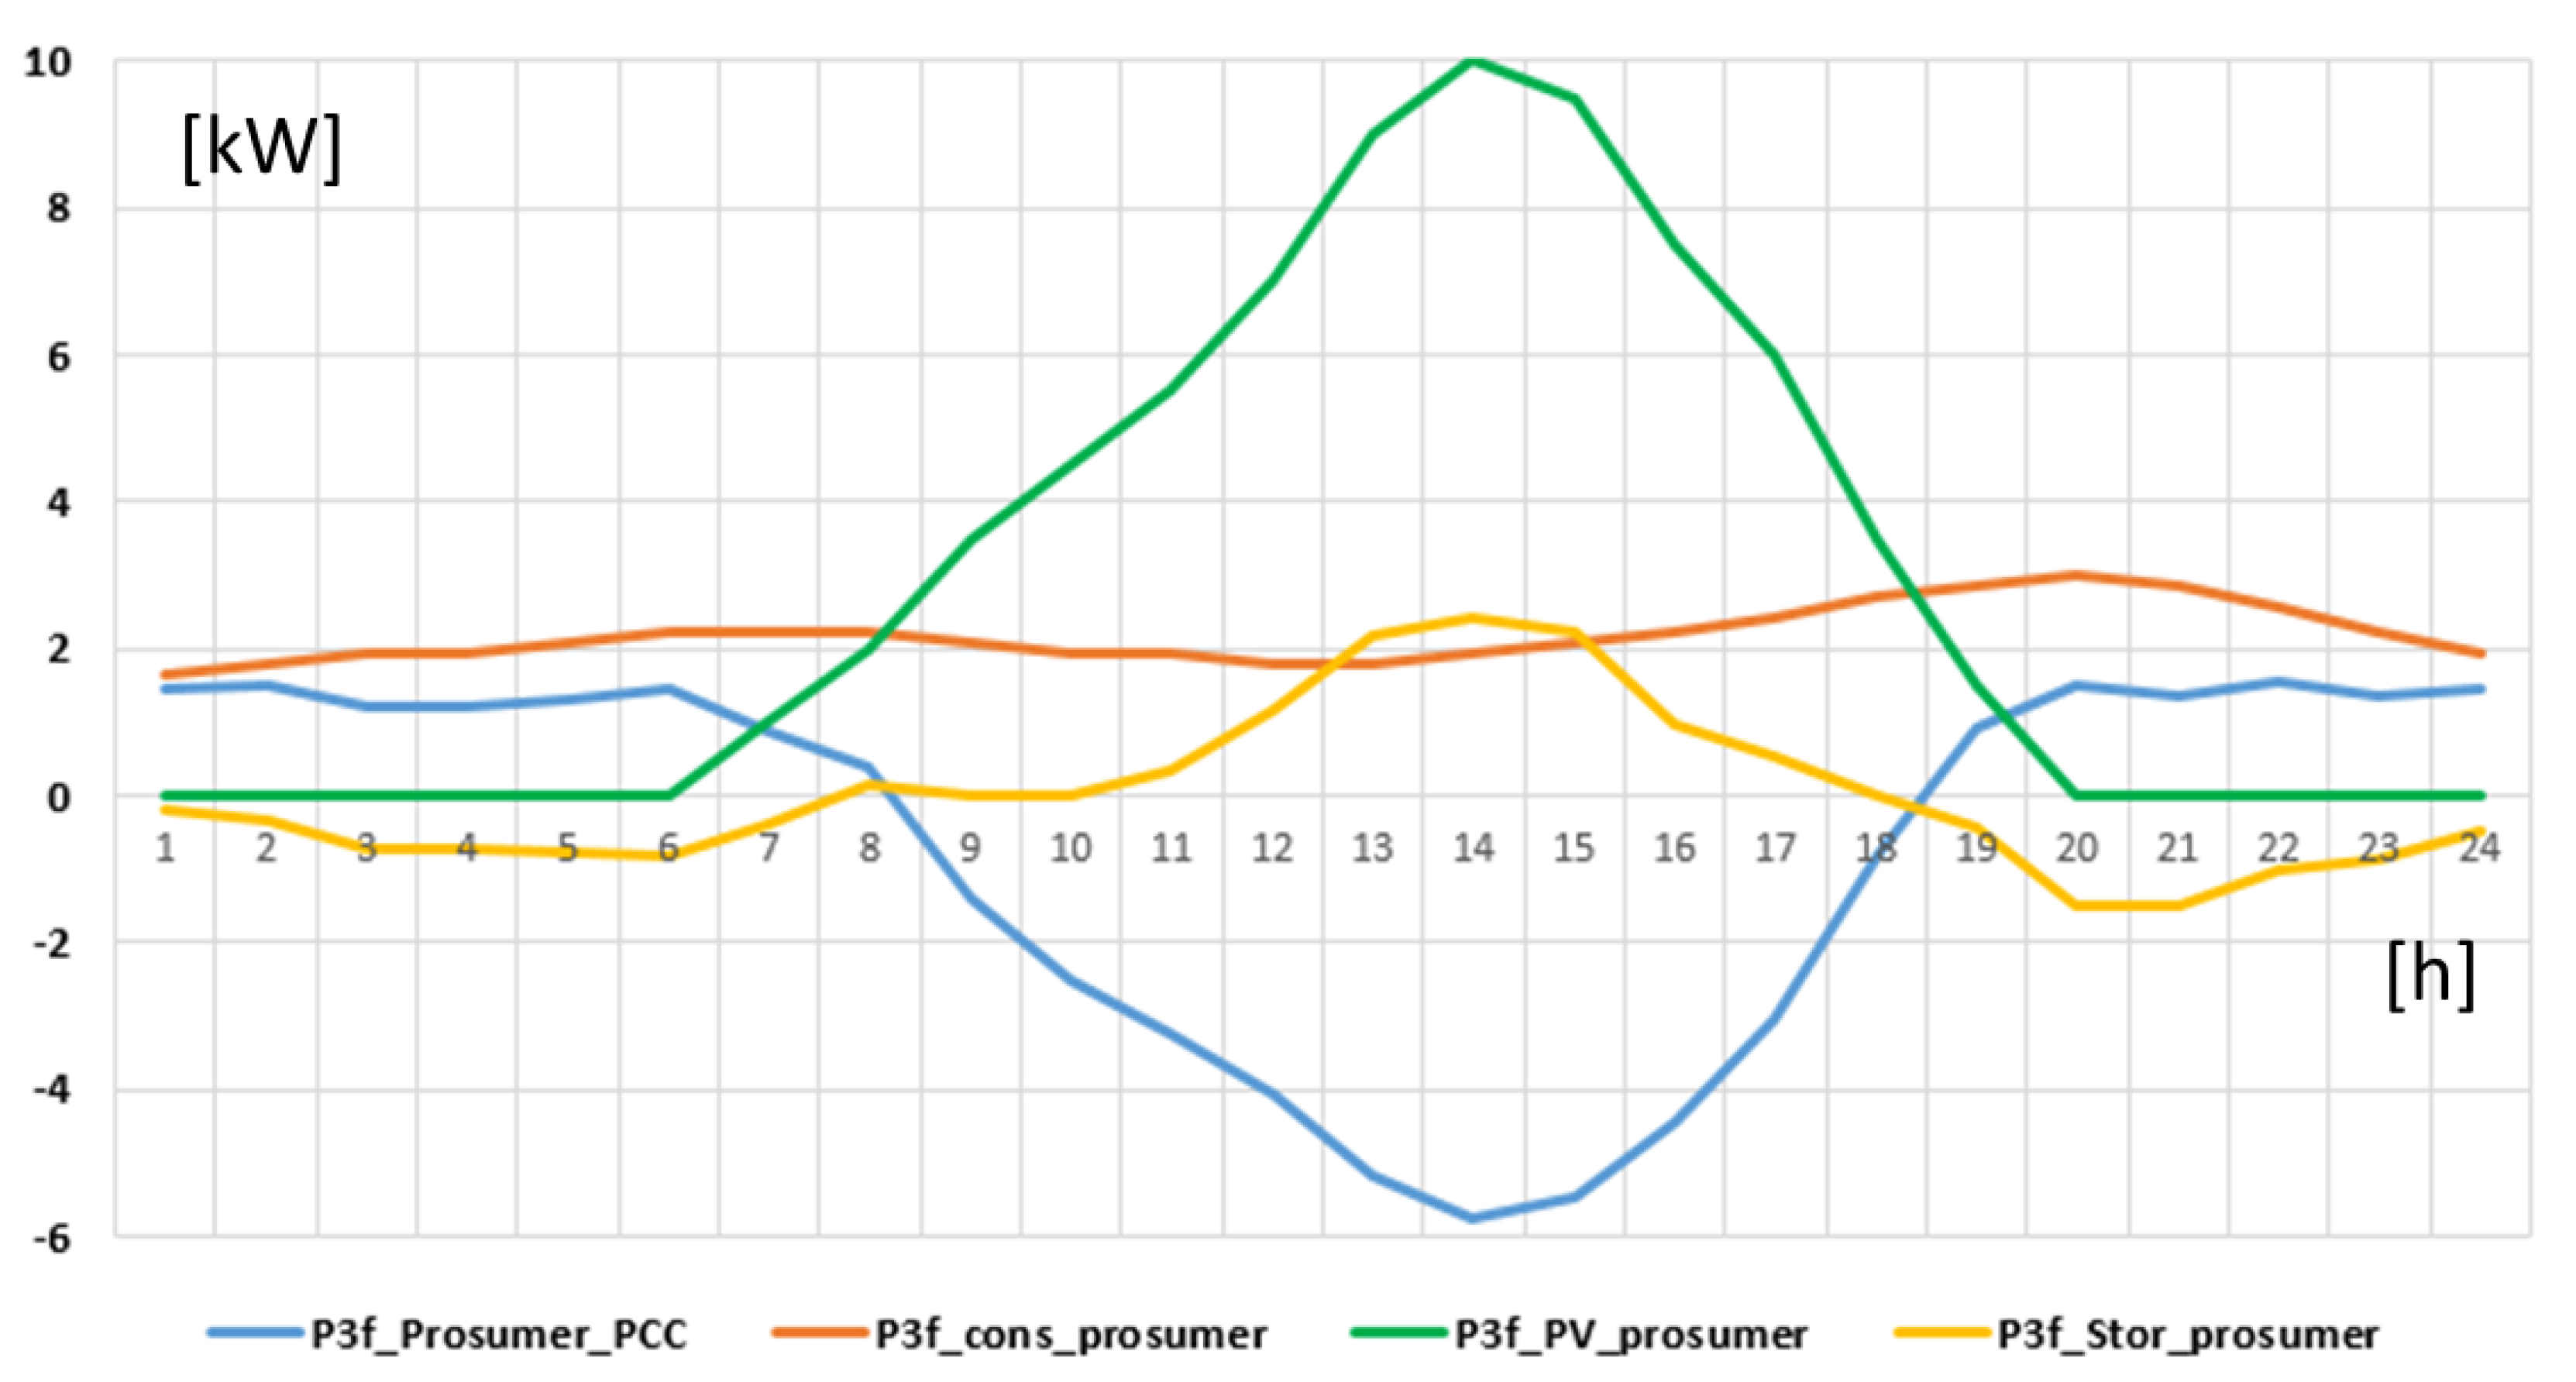
Figure 7 shows the power evolution during the day. It is to be noted that the BESS schedule preserves the same state of charge (SOC) at the beginning and at the end of the daily process. This condition is kept for all daily tests of use case 1. Moreover, for simplicity, the BESS is considered in an ideal situation, meaning that stored energy is fully retrieved during discharge. From a technical point of view, a real BESS situation may ask for a small increase in its capacity in order to perform the same U control with P means.
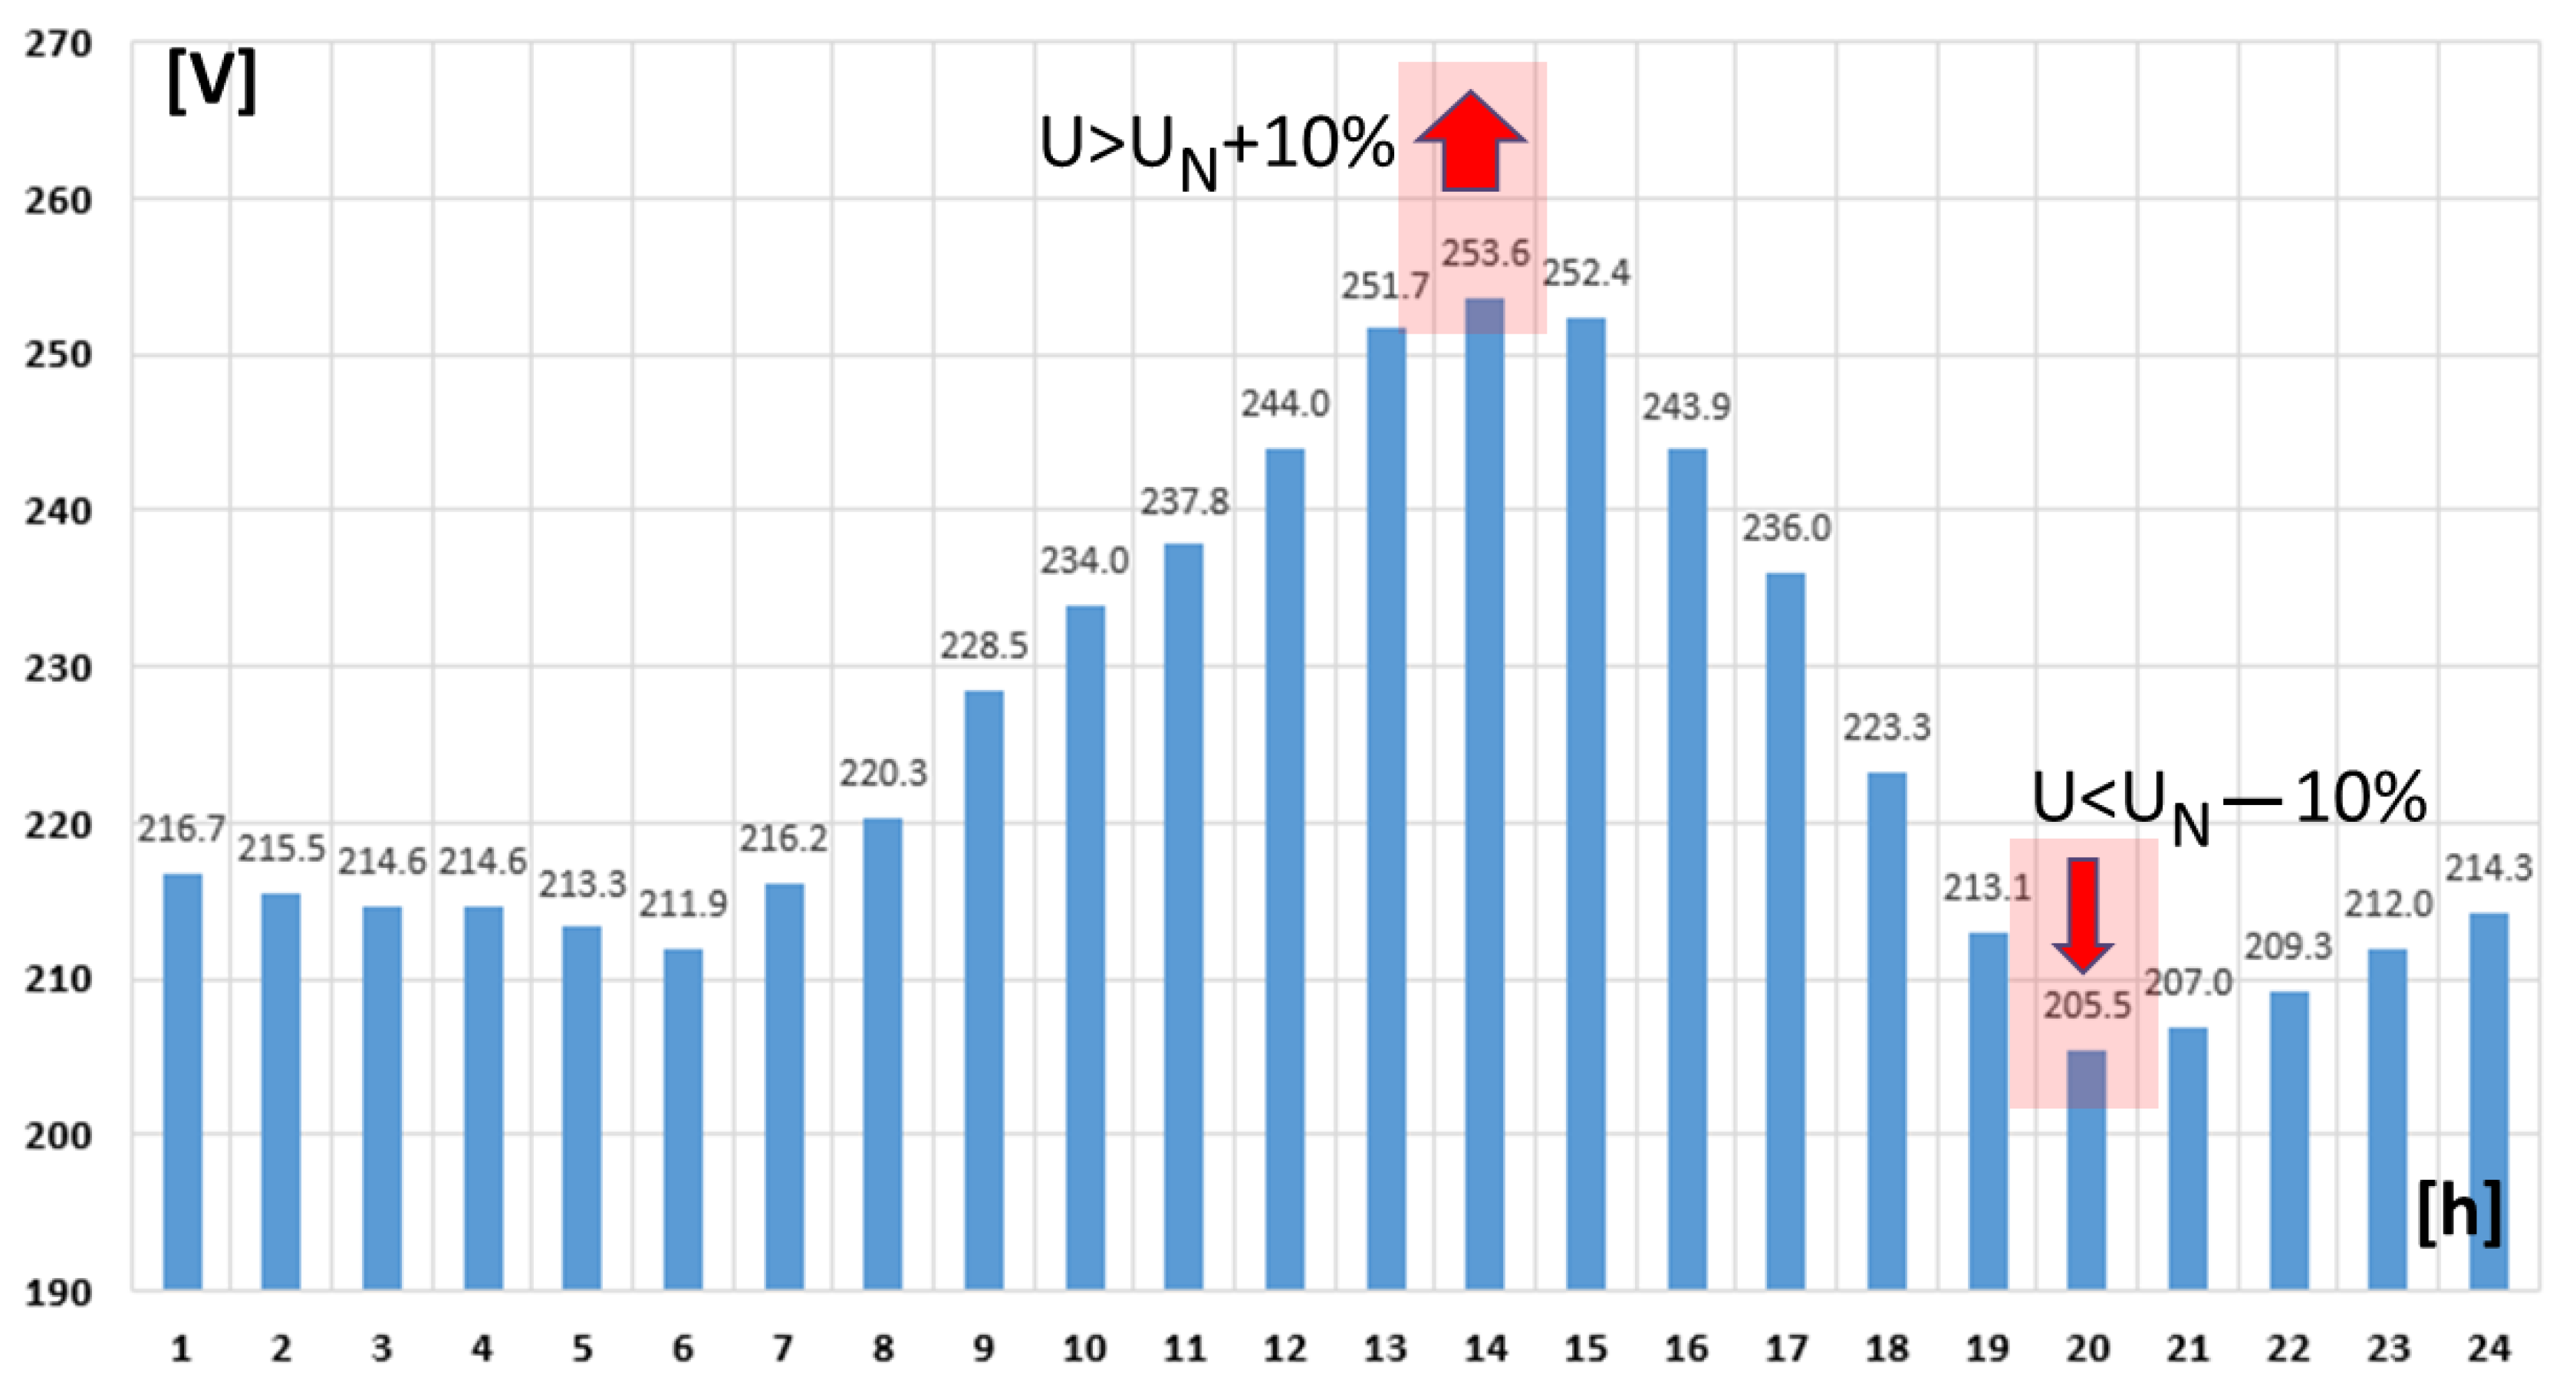
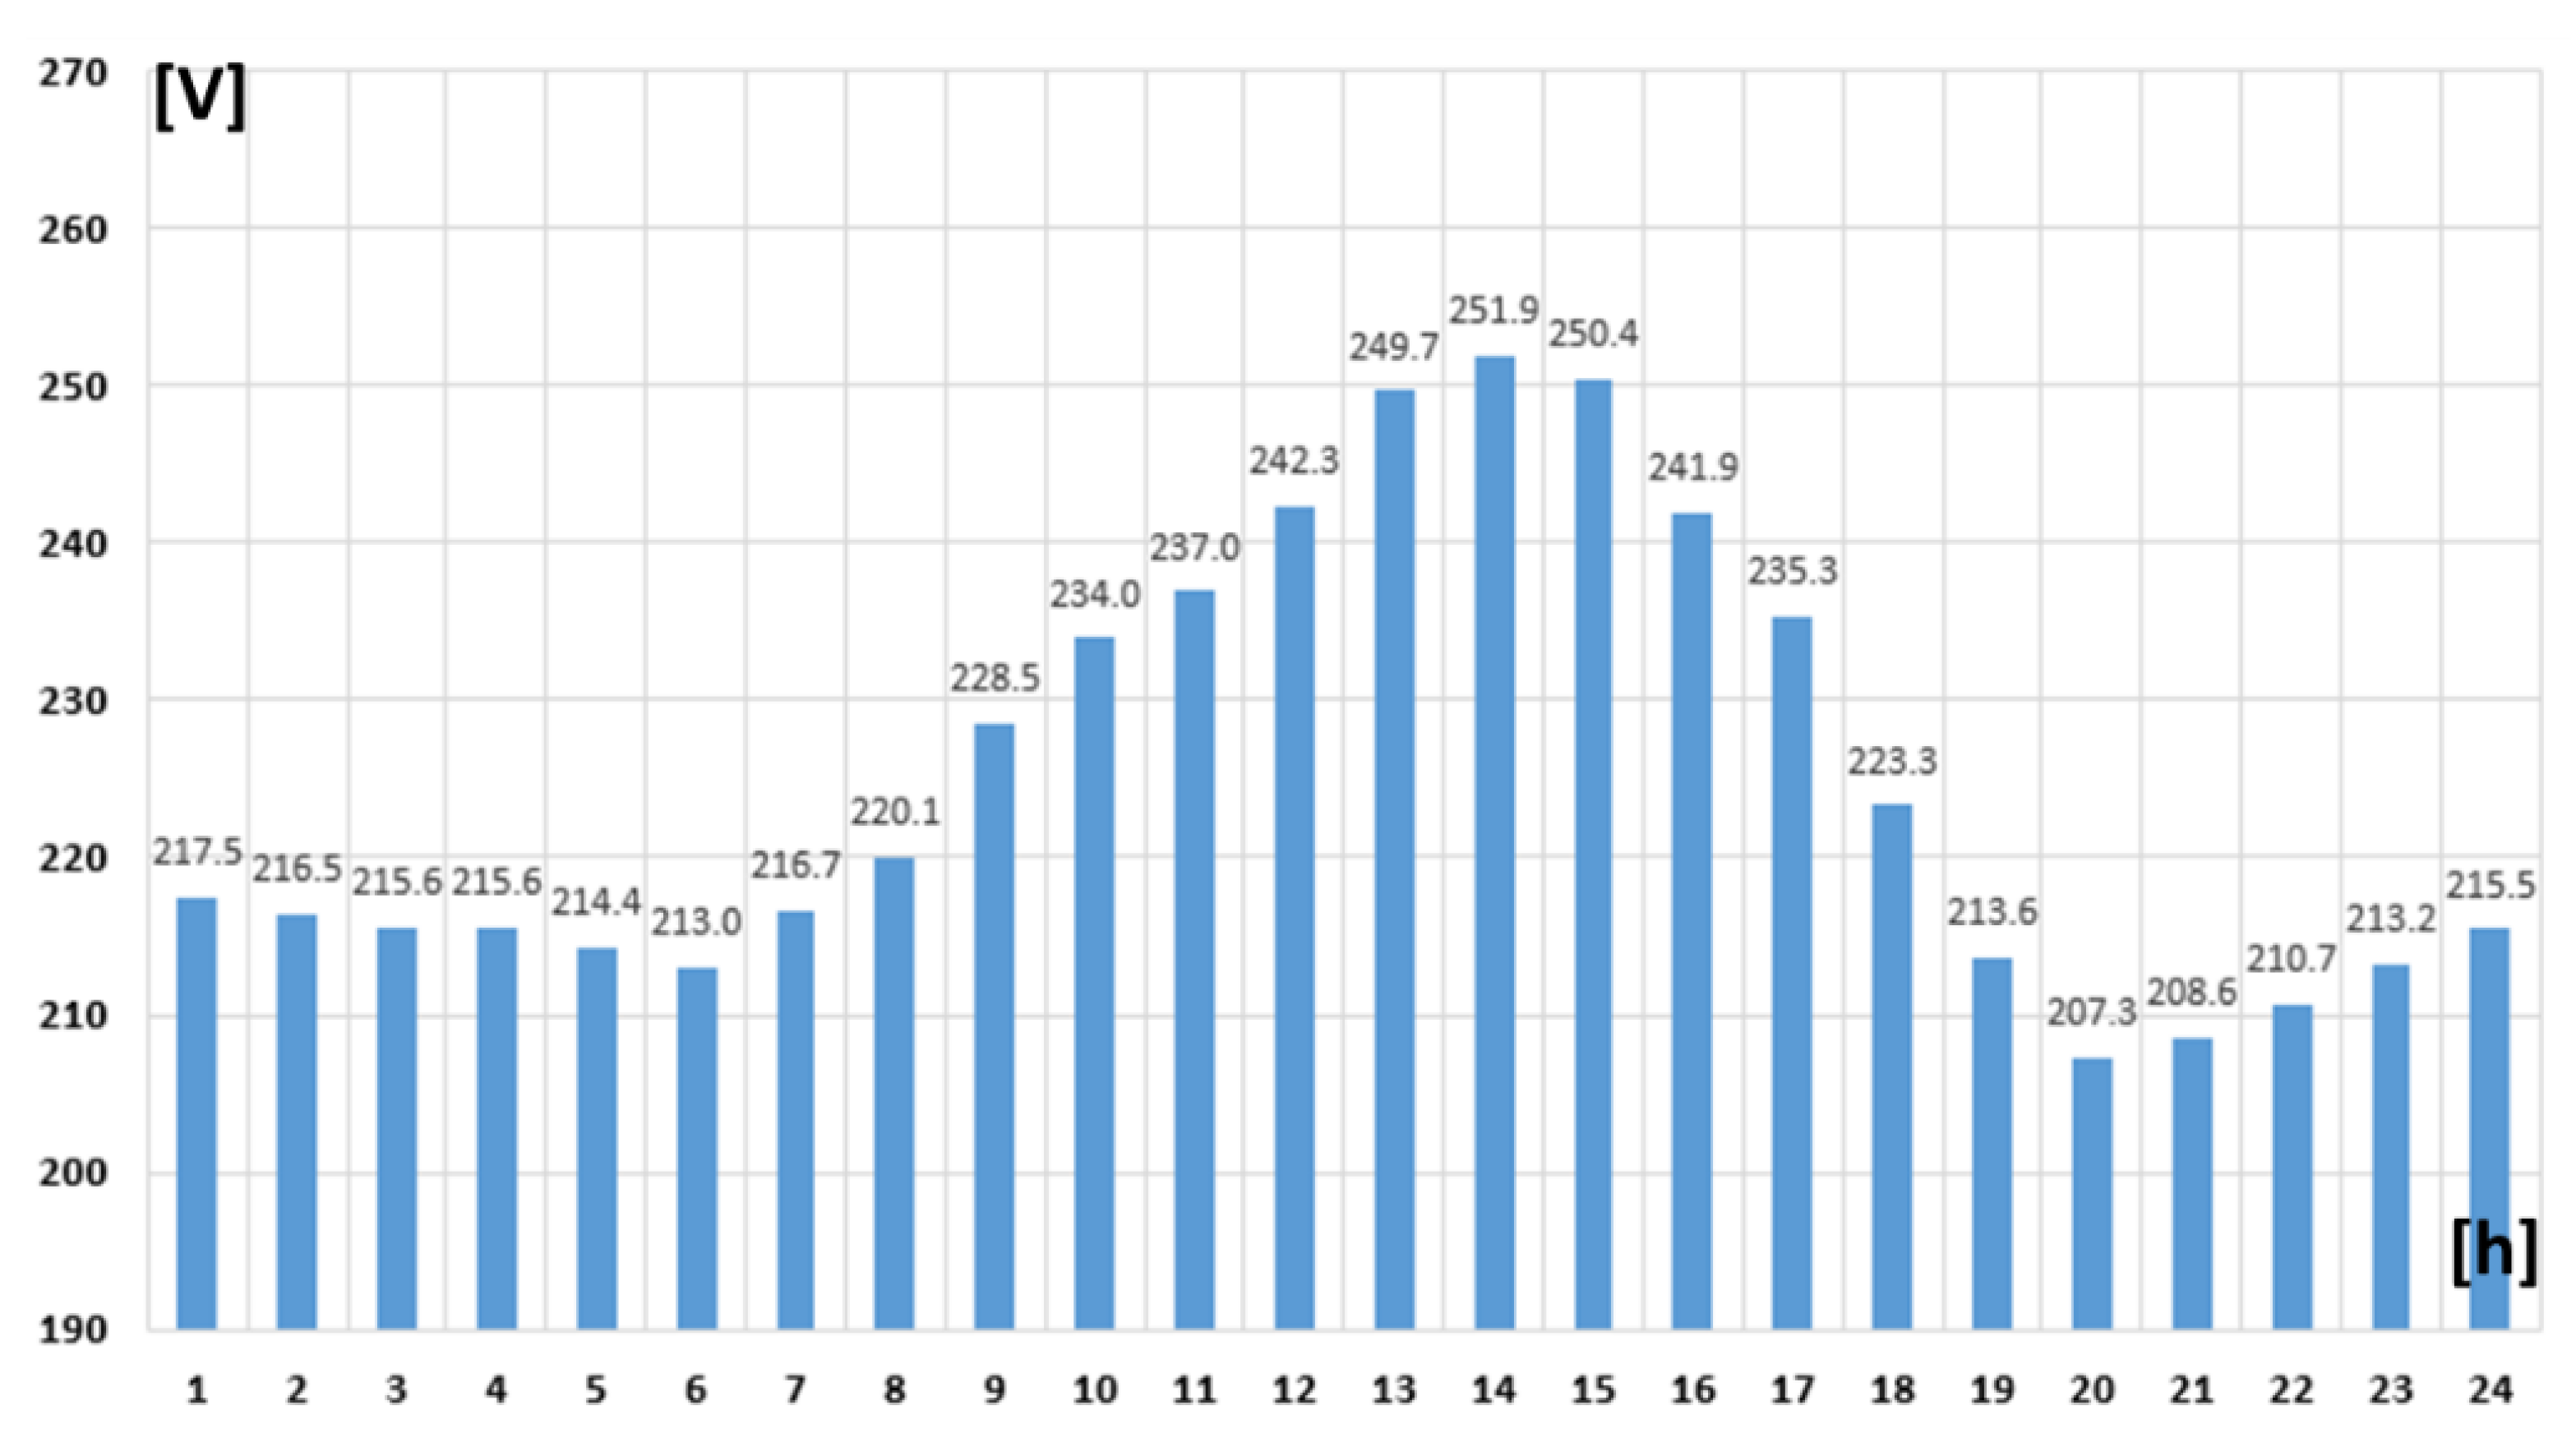
The self-consumption has improved to 49.2%, which shows the effectiveness of an increased BESS for this purpose. The voltage level in N11 during the whole day has hourly averages as per
Figure 8.
Despite an improvement in the reduction of injected power and in self-consumption, the voltage level is still too low in hour 20 and slightly higher in hour 14. With this small deviation, a small change in battery schedule can bring the node within limits during the entire day, which is addressed by Scenario 1.2.
S1.2 (
Scenario 1.2 with BESS and improved voltage level—U_Improve) uses the same 10 kWh battery at the prosumer’s site (node N11), which is used in addition to alleviate, with
P control, the voltage level and to bring it in the accepted boundaries. A small change in the battery schedule of its P hourly value makes voltage level in boundaries for the whole day, as per
Figure 9.
S2.1 (
Scenario 2.1 with storage) uses a 20-kWh battery at the prosumer’s site (node N11), which is also used to increase self-consumption with the same simplified method.
Figure 10 shows the power evolution during the day (considering one average value for each hourly timeframe), and
Figure 11 shows the average voltage level each hour during the day.
The voltage level is appropriate during all hourly intervals. Self-consumption reaches 63.2% (as the primary effect of BESS use)—which is only 11% from maximum self-use (52.65 kWh/70.5 kWh = 74.7%). Power injection in the grid is now only 4.1 kW (as the second effect of BESS use).
The next scenarios are more briefly presented, the focus being on the BESS’s multiple effects on self-consumption, reduction of power injected into the grid, and voltage level improvement with P aid.
S2.1 (Scenario 2.2) uses the same 20 kWh battery at the prosumer’s site (node N11) and improves the average voltage level each hour during the day.
S2.3 (Scenario 2.3) uses the same 20 kWh battery at the prosumer’s site (node N11) and improves the average voltage level each hour during the day.
S3.1 (Scenario 3.1) uses the 30 kWh battery at the prosumer’s site (node N11), with a “natural” (as expected) additional improvement in both self-consumption and voltage level.
S3.2 (Scenario 3.2) improves the average voltage level each hour during the day.
S3.3 (Scenario 3.3) improves the average voltage level each hour during the day.
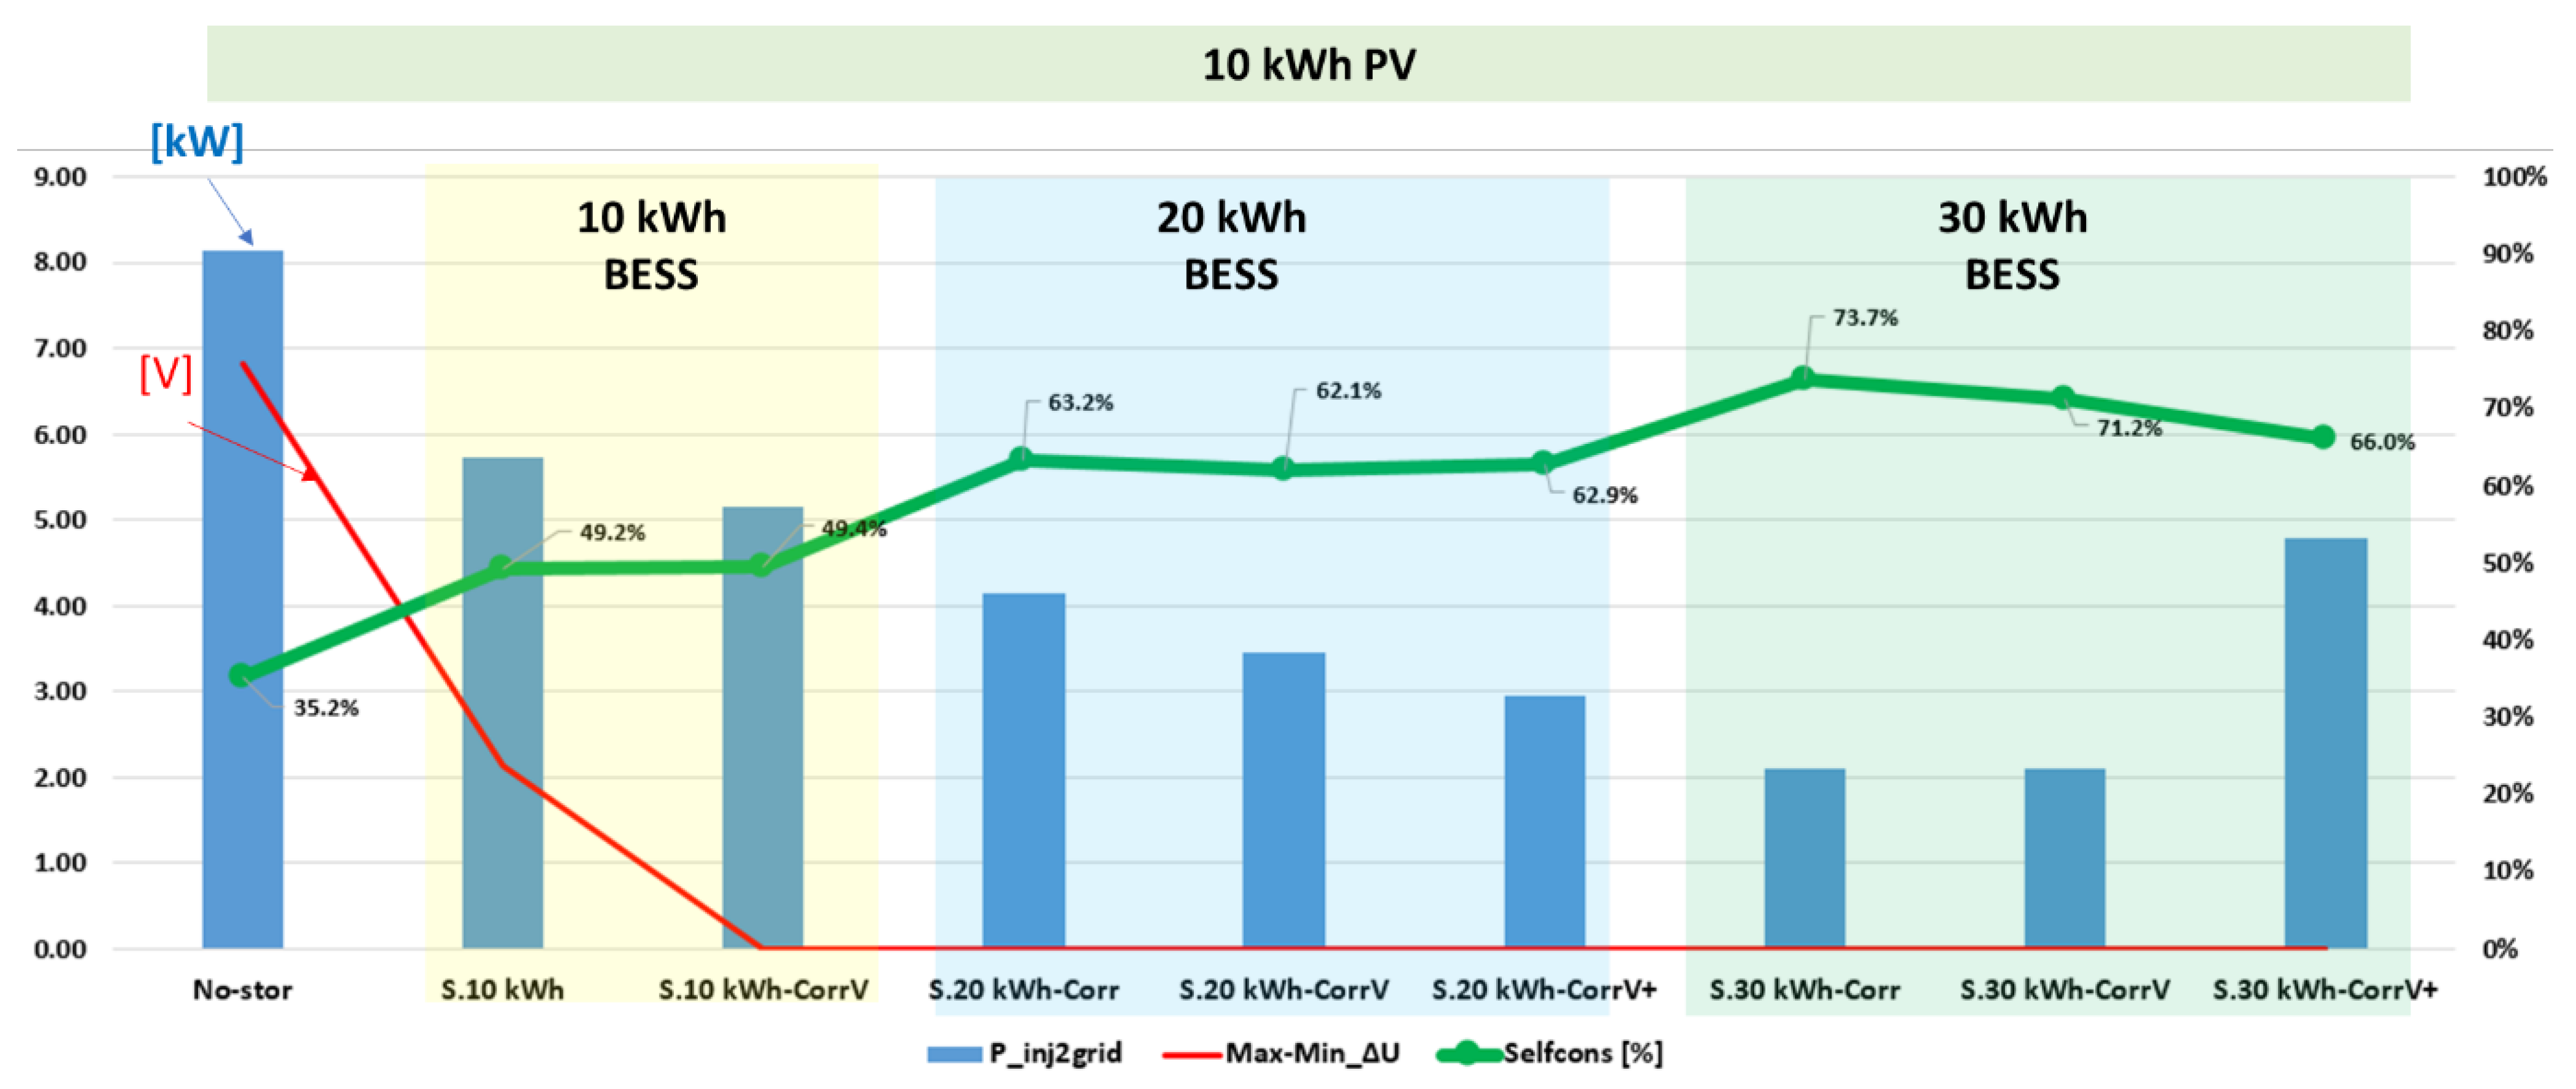
A review of these scenarios and of their achievements is presented in
Table 1Figure 12 gives a view of the evolution of different parameters in the three main scenarios (with a capacity of 10, 20, and 30 kWh BESS for the prosumer connected in node N11).
The simulations show that the increase in battery capacity brings more self-consumption, decreases power injection in the grid, and reduces or eliminates voltage level violations.
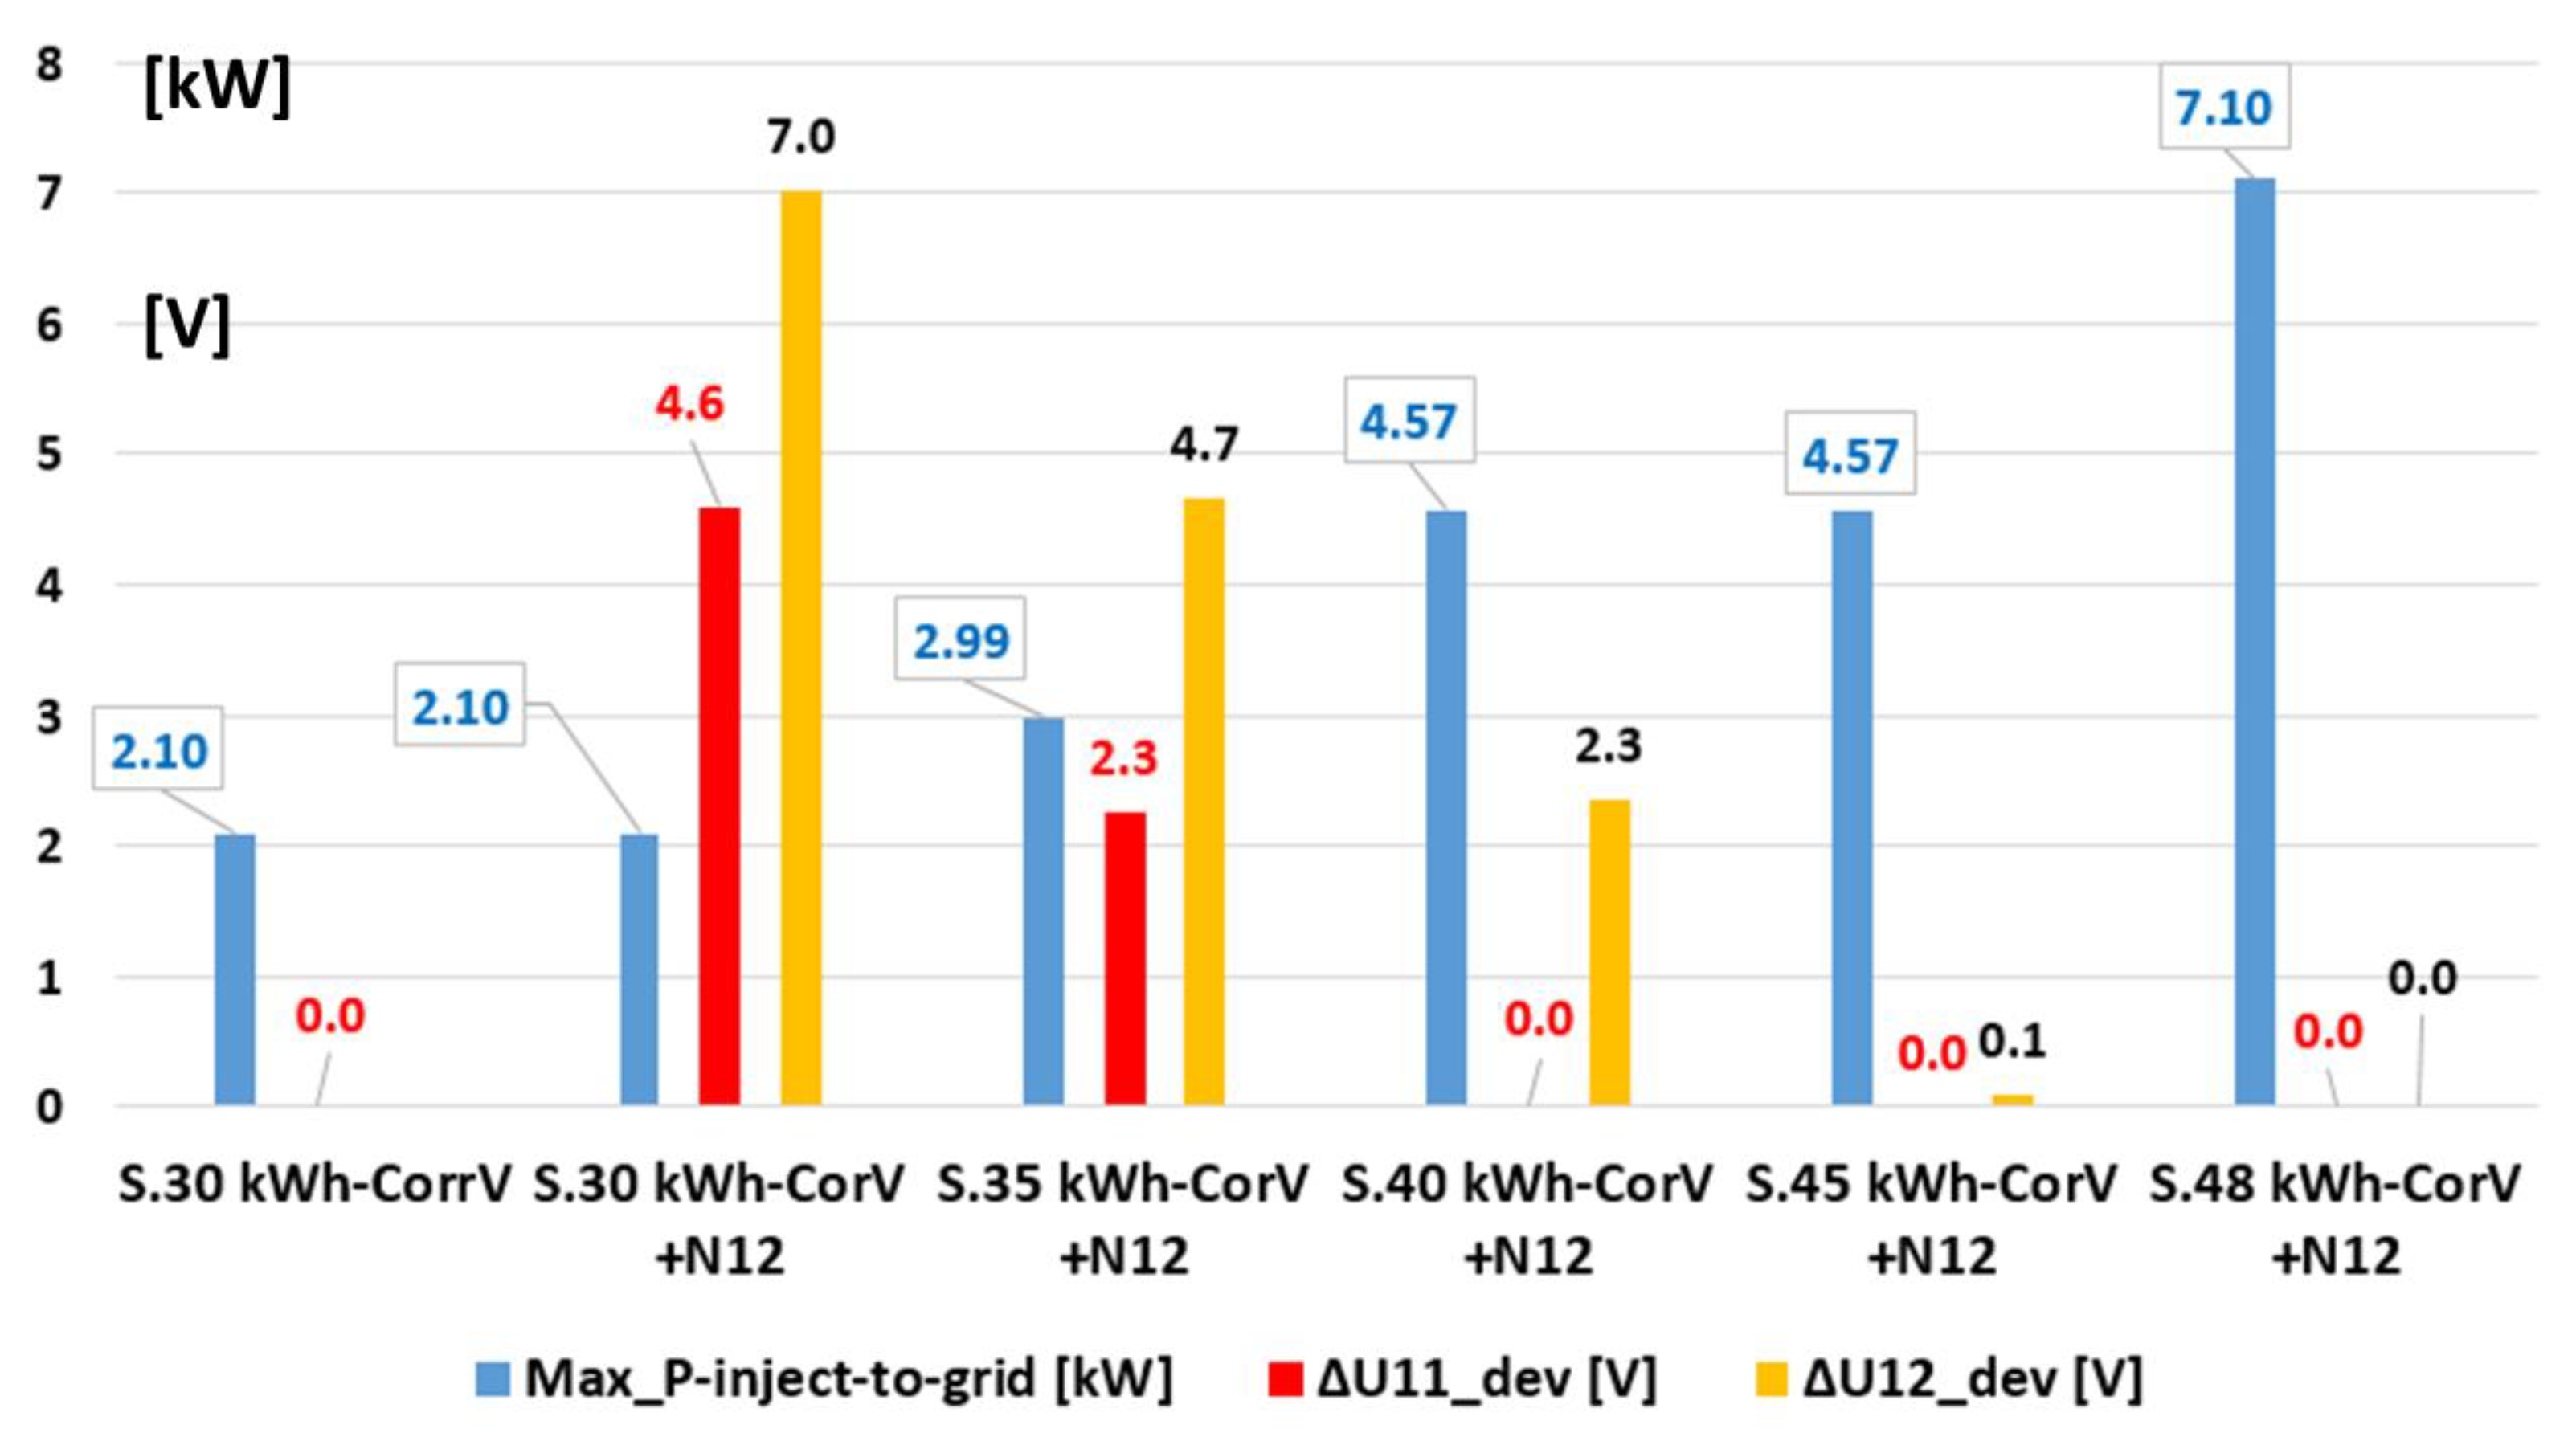
A final set of Scenarios 4.1–4.4 show that the control of U with the active power of the prosumer’s battery can also be used for voltage services for a neighbor seen on an hourly basis in a daytime period. A graphical overview of these scenarios is presented in
Figure 13, with the scenarios details presented below:
S4.1 (Scenario 4.1) uses the same 30 kWh battery at the prosumer’s site (node N11) from scenario 3.1, seen as a basic scenario for the U service provided to a neighbor.
S4.2 (Scenario 4.2) has the same functionality in node N11, but having introduced the additional node N12, as a grid extension. This additional grid segment and its consumption degrades the voltage level in both nodes N11 and N12
S4.3 (Scenario 4.3. labeled “S.35”) improves battery use and reduces the degradation of the voltage level in both nodes N11 and N12
S4.4 (Scenario 4.4) improves battery use and reduces the degradation of the voltage level in both nodes N11 and N12
The following comments can be made for use case 1:
A “voltage level quality” service can be provided to a neighbor by a prosumer with its battery’s (BESS) active power as a relatively new type of control means.
Extra battery capacity may be needed, while self-consumption of the basic actor will decrease in order to provide the service, which shows that the service may be paid as a combined energy service + energy supply model. The microgrid market of energy for consumption and for voltage improvement may be a business model for the future and fits well with microgrids belonging to energy communities.
The power injection near the new consumer (node 12 in this case) can reduce the grid losses, which is also a good outcome for the energy community that is operating the microgrid.
Resilience is automatically improved, as this implies both more self-consumption capabilities and better operation of the grid, especially in off-grid situations (scenarios 1, 2, and 3)
An effective factor between 2 and 3 has the consequence of simultaneously increasing the self-consumption and readiness for resilience and to support 24-h planned operation to support voltage level compliance in energy community microgrids with high-RES penetration (scenarios packages 2 and 3).
A value of 3 also has some reserve to perform voltage improvement to some neighborhoods of the energy community (scenario package 4).
5. Use Case 2: Heat Pumps Integration in the Electrical Realm—Impact of Their Functionality on Local Voltage Level and BESS Active Power Use for Neighborhood Voltage Control
An energy community has to support both the electrical and thermal needs of the community. While some of the electrical needs are addressed in the previous section, one tendency is to “electrify” the heating and cooling, while the impact on the microgrid of this new type of consumption also needs to be analyzed. In [
22] a district designed for clean heating is treated (where a city district is seen as a community) by using heat pumps supplied by electricity covered on a yearly basis with the district’s PV production. An overview of concepts is presented in [
23], which has also been the starting point for analysis related to the subject treated in use case 2. In this use case, an analysis is proposed on the same distribution grid which has been used in the previous use case. It is considered that the community microgrid is extended with a pool of small consumers, which adds heat-pump (HP) consumption placed in node N12. The impact on the voltage level in the grid is assessed, and voltage control based on P-injection control with the BESS of the prosumer from node N11 is analyzed as possible mitigations.
Real measurements of active power consumption of an air-to-air heat pump [
24] have been used, with real-time records (2-s resolution) on different days and consumption time-shifts, to increase variety and to better simulate multiple households using this type of electrified heat.
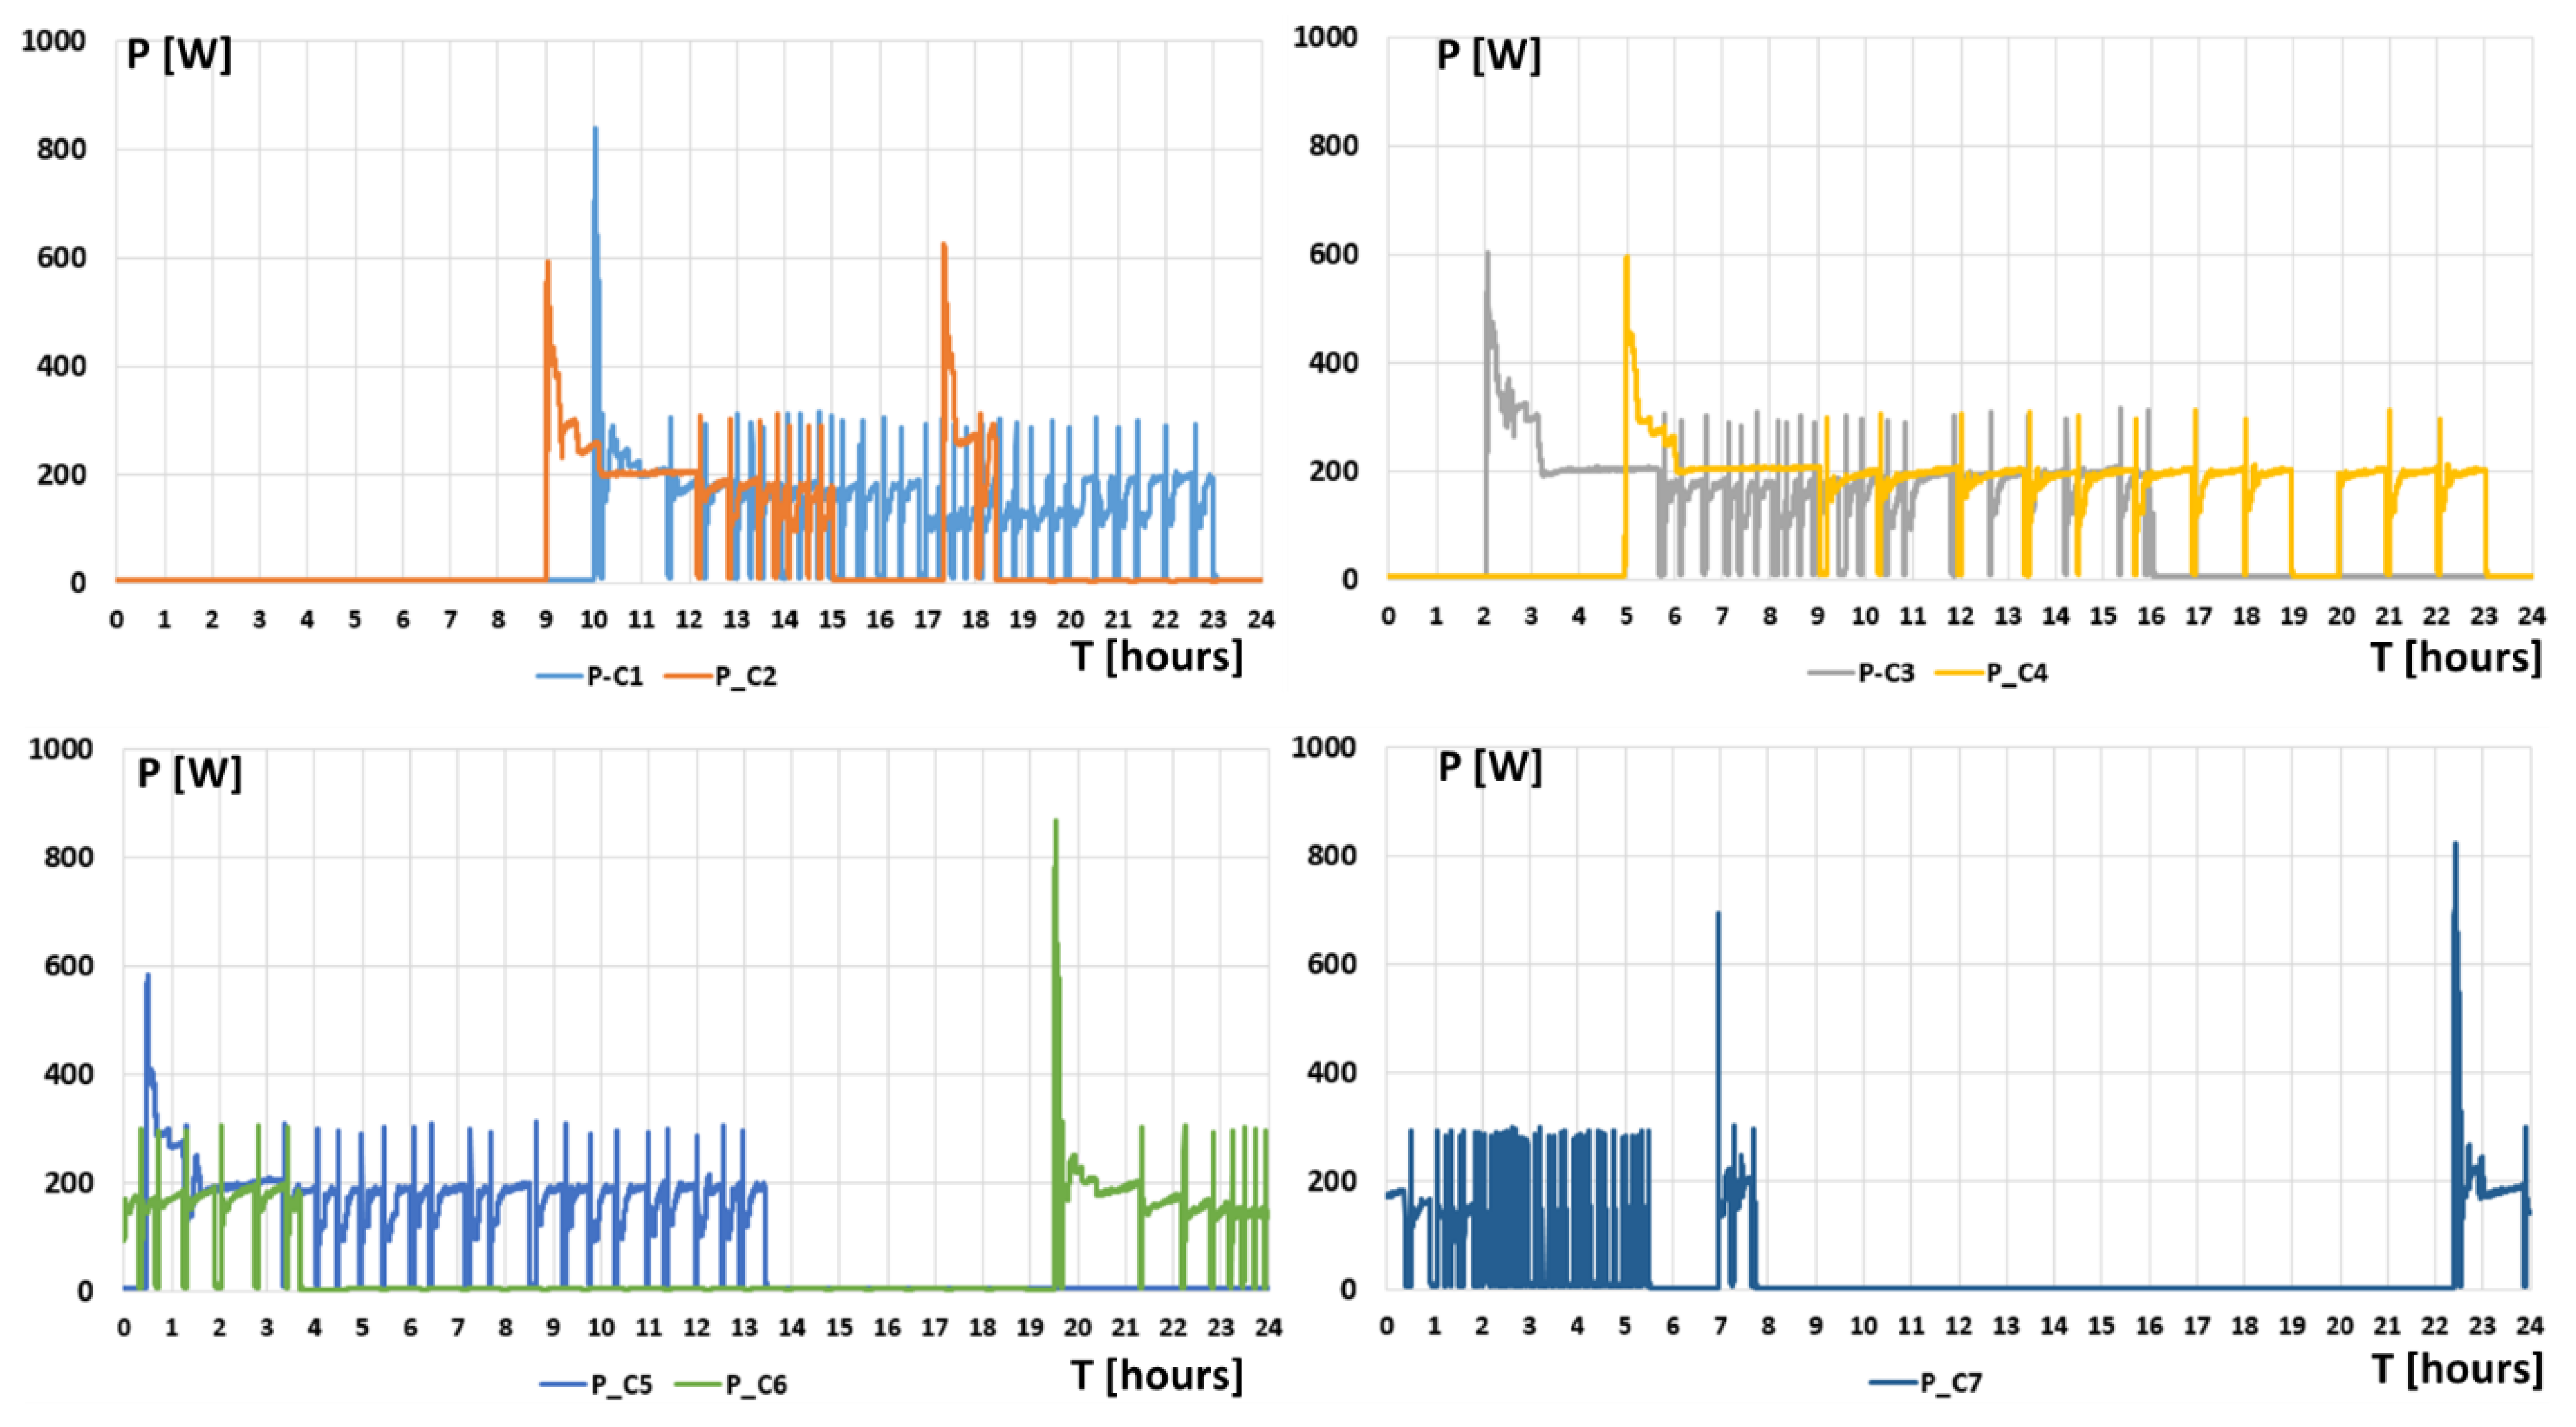
Figure 14 shows measurements of HPs consumed electricity by using seven daily profiles which correspond to real evolutions of the air-to-air heat pump, with profiles used for bringing an HP function similarity and high dynamics in the studied network to stress it at its limit of voltage operation.
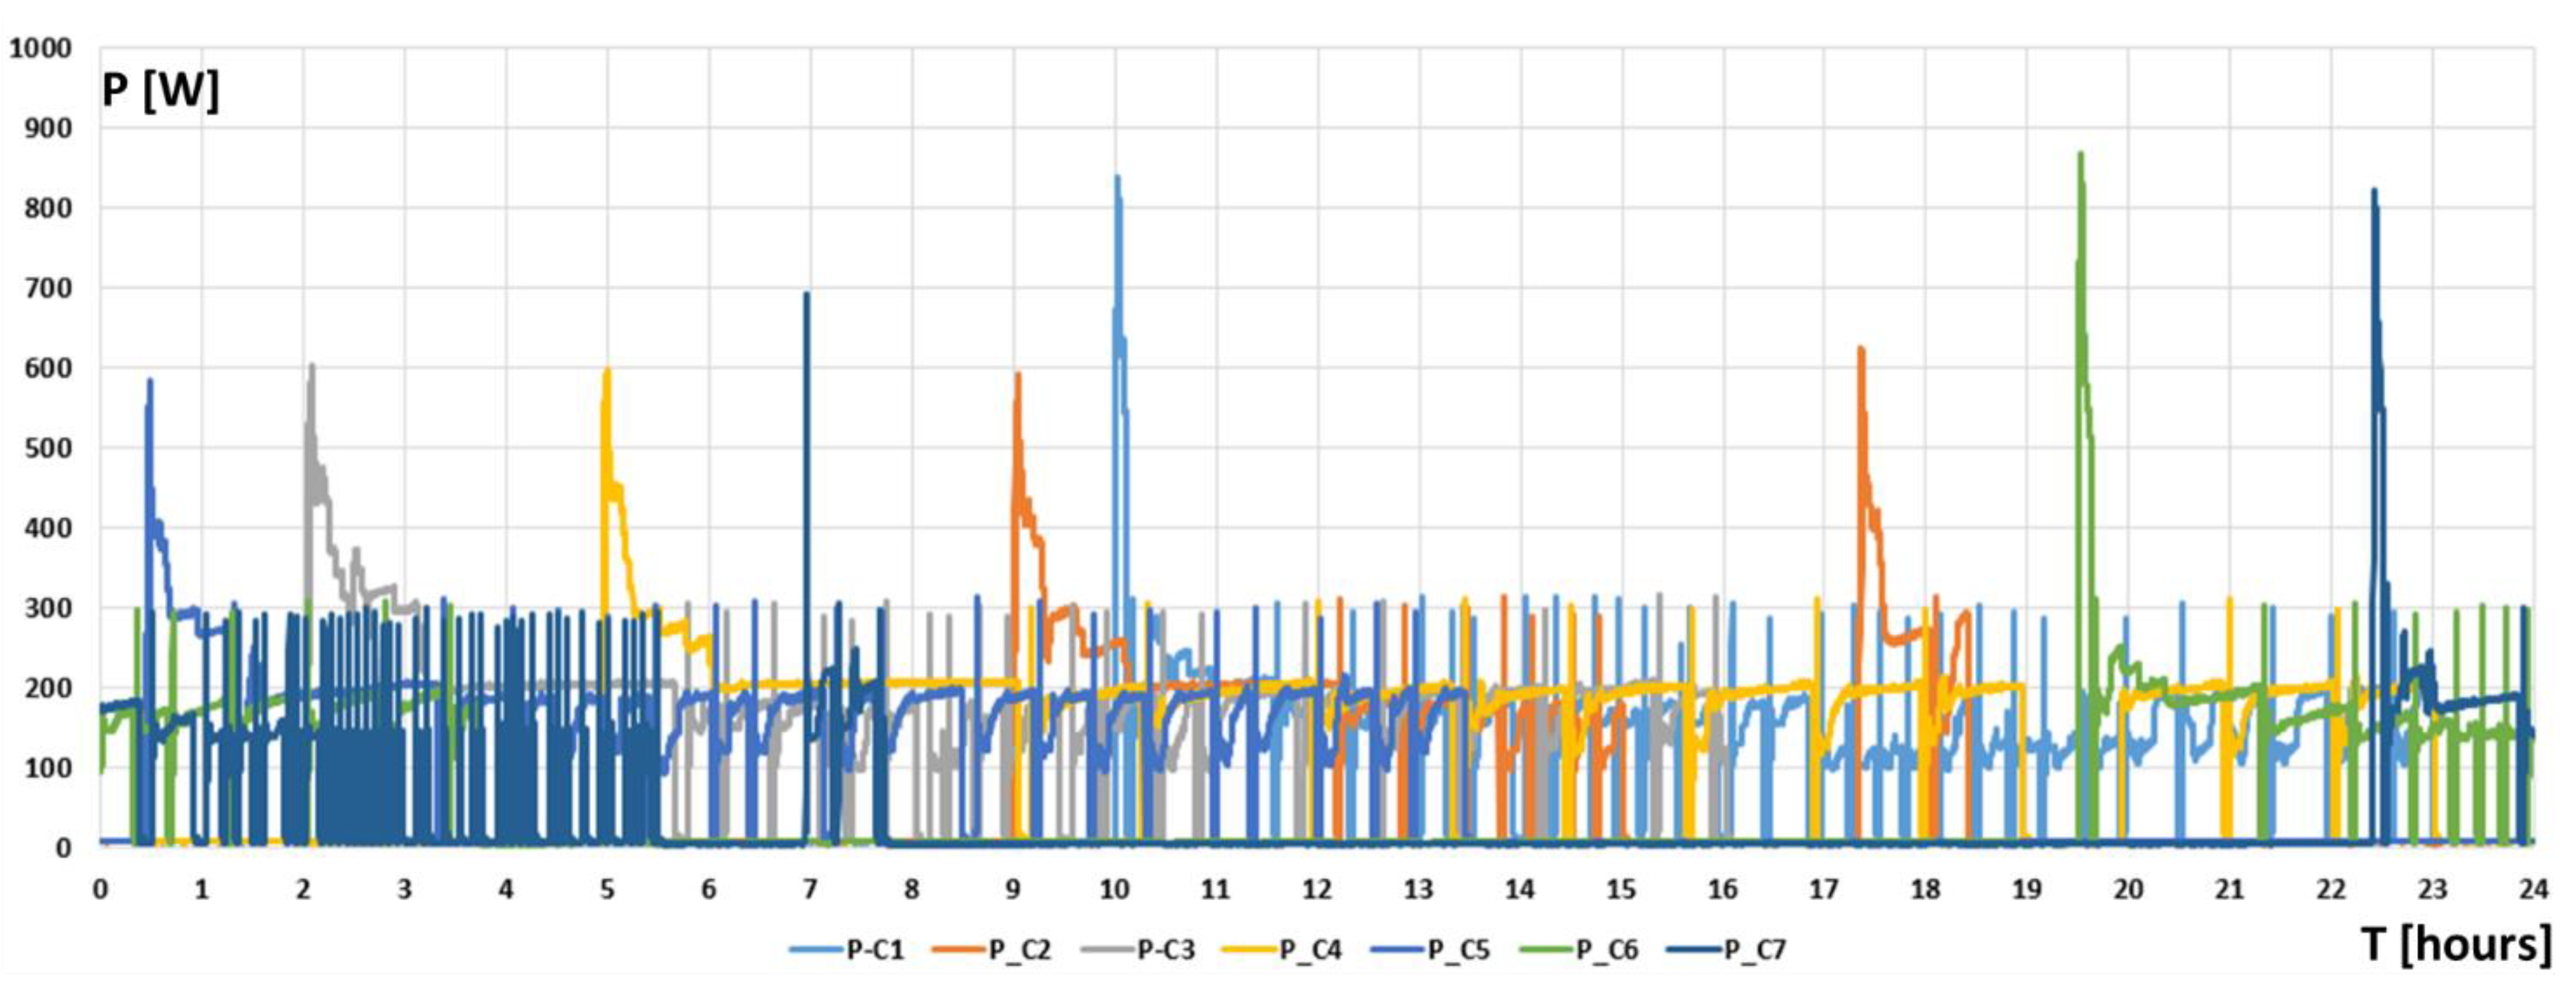
The superposition of these daily profiles is shown in
Figure 15, while in
Figure 16, they are aggregated, bringing more dynamics for the use-case test of U control in node N12 through P regulation of the battery belonging to the neighbor in node N11, as possible voltage level improvement suitable for microgrids belonging to energy communities.
The daily energy for each of the seven HP profiles is presented in
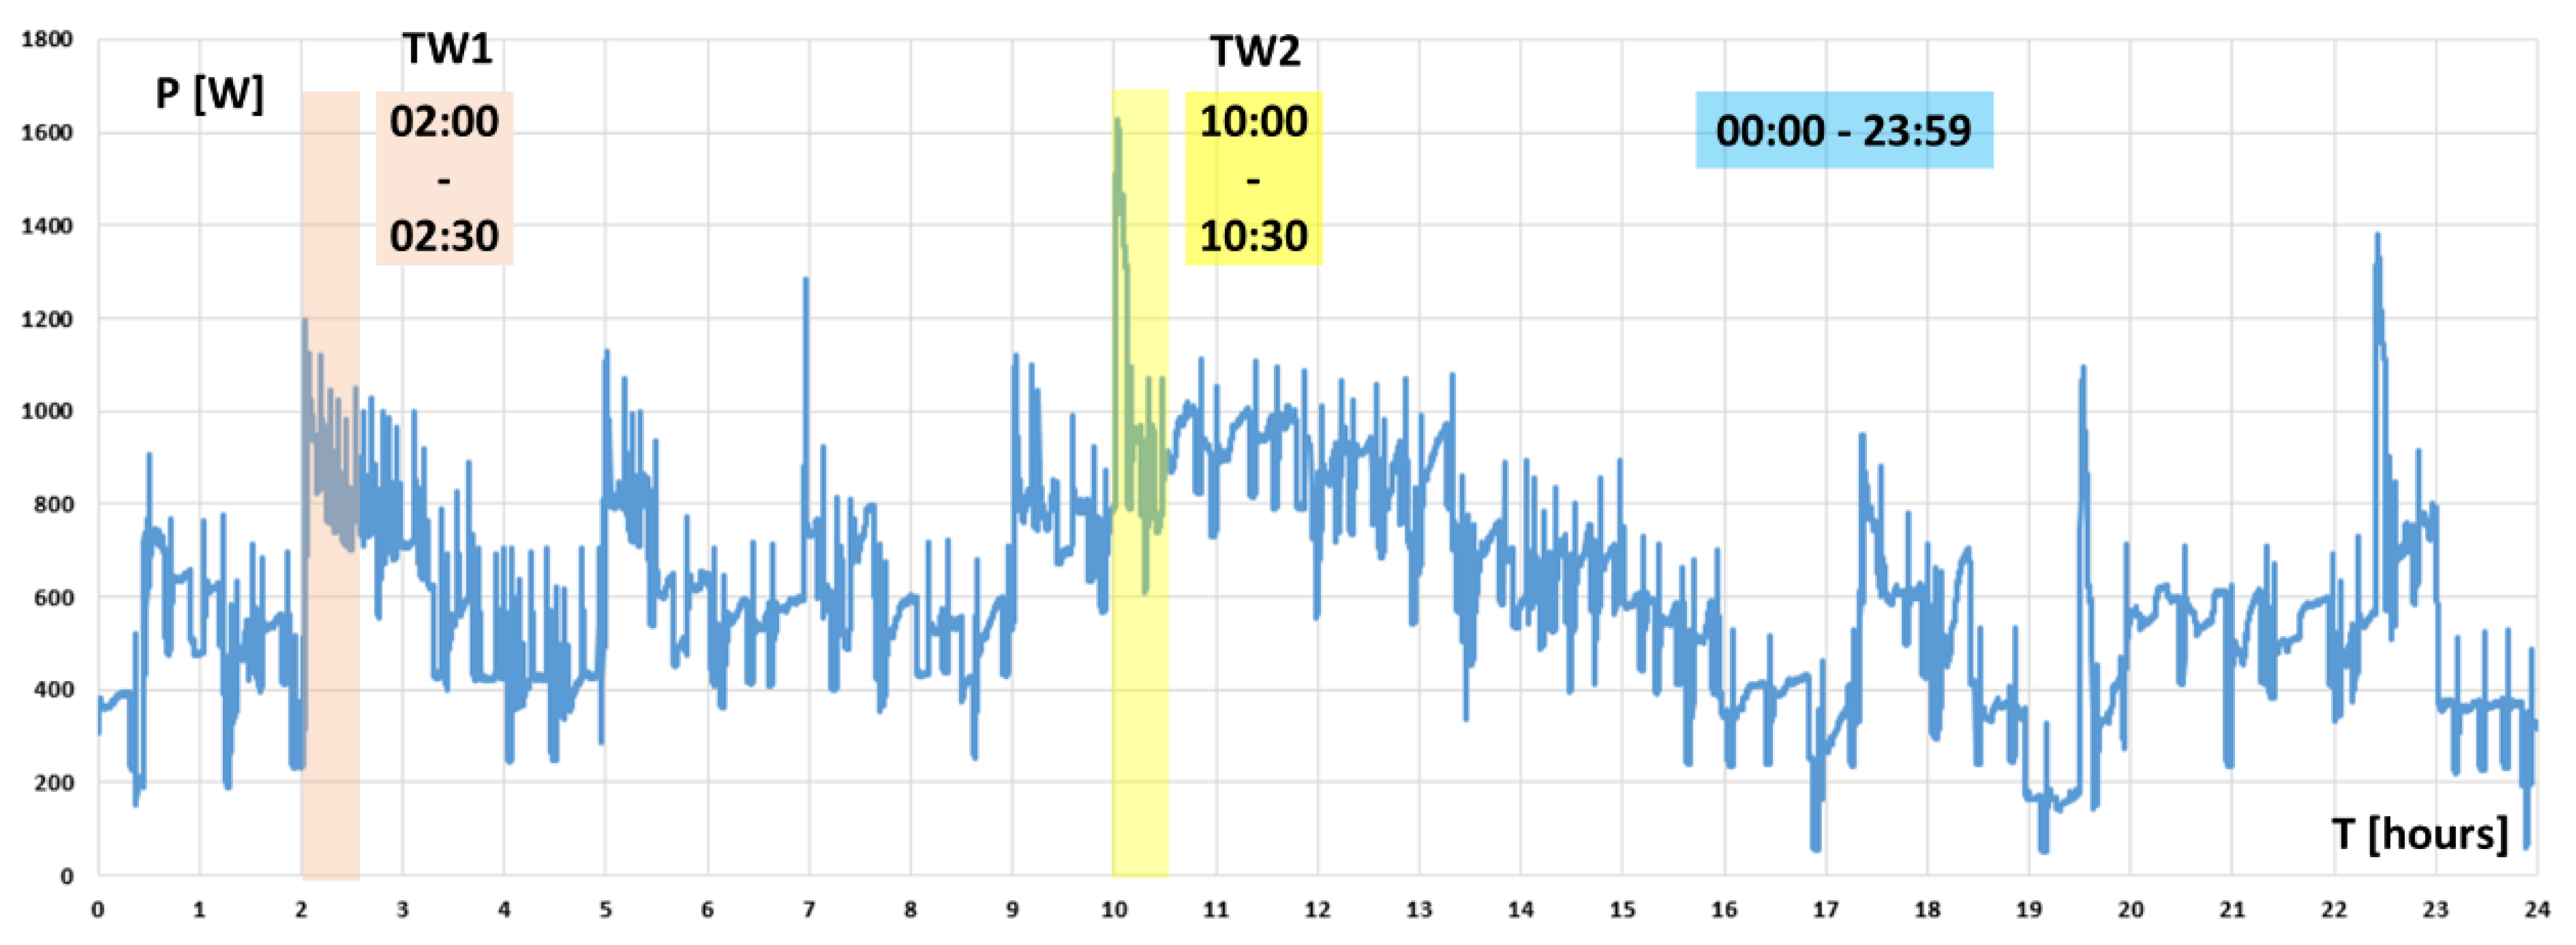
Table 2The aggregated power from
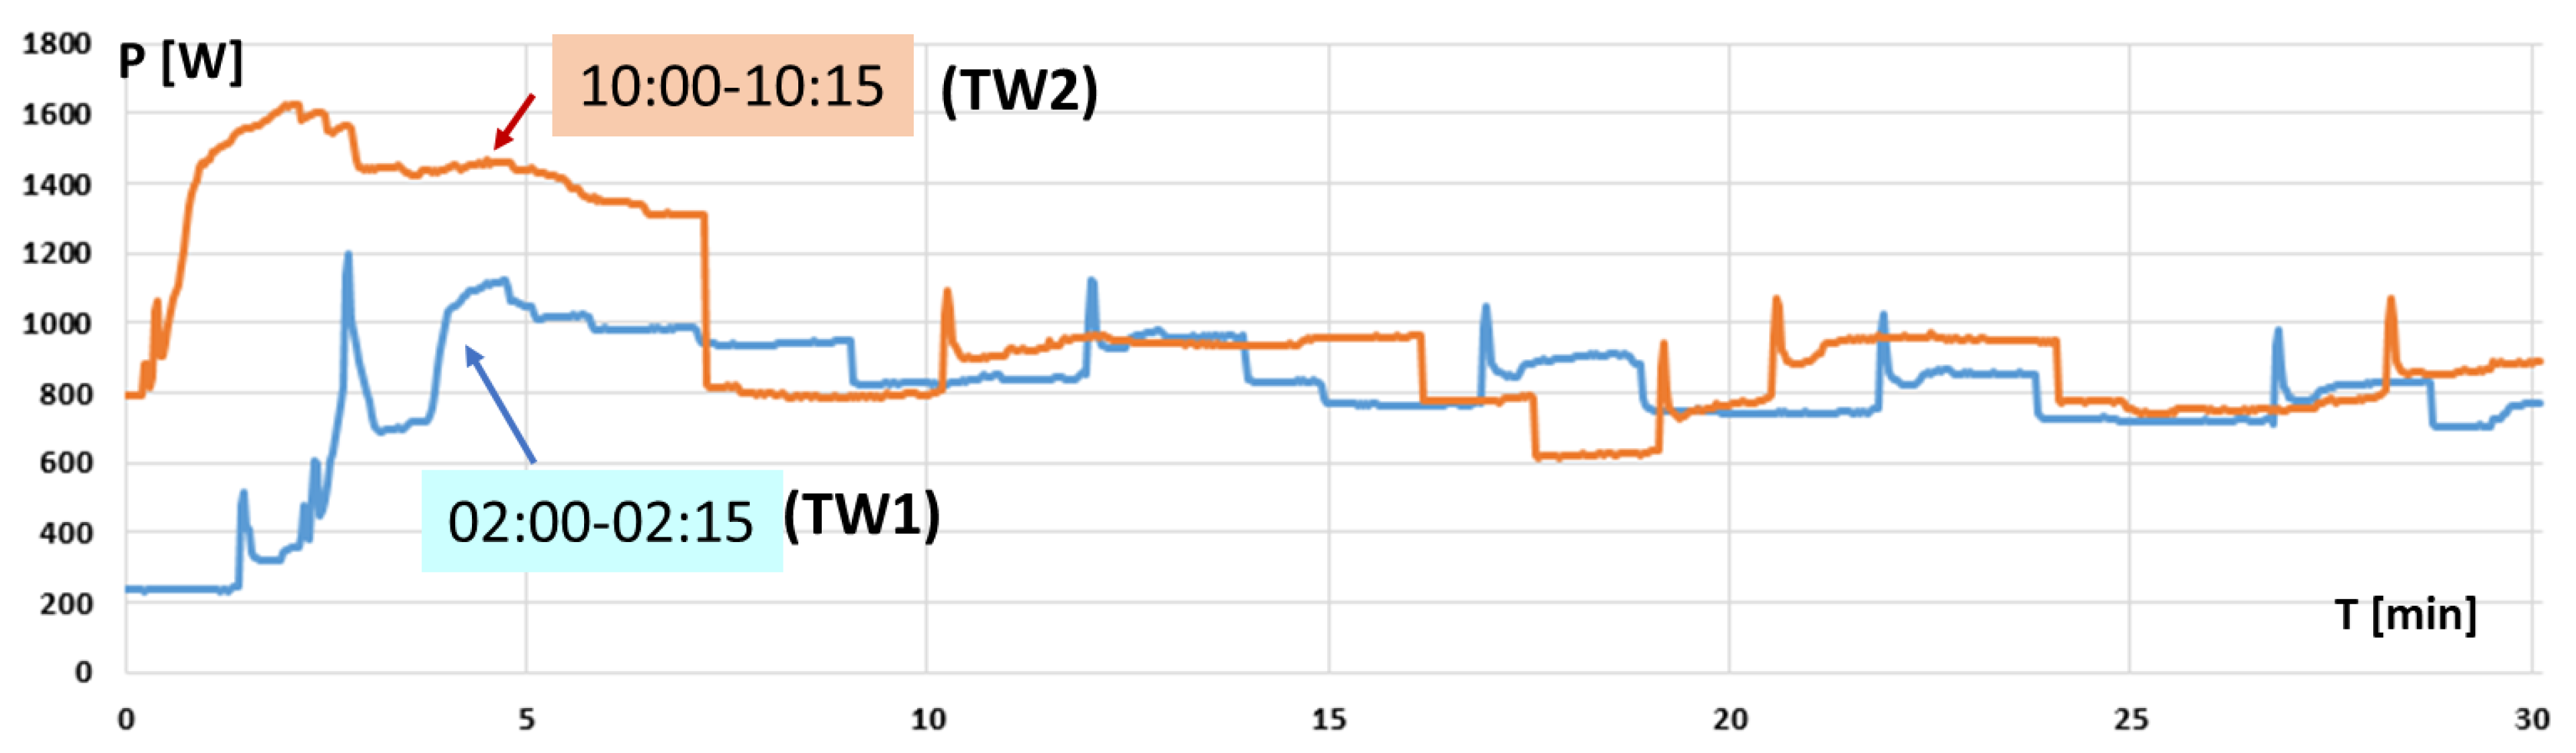
Figure 16 is placed in the new node N12 to analyze its impact on the voltage level and the efficiency of voltage control with P from the BESS in node 11. The analysis has been made in 30 min time windows, and from the day-based HP evolution depicted in
Figure 16, two time windows of 30 min have been selected, in the intervals H02:00–02:30 (TW1) and H10:00–10:30 (TW2), with the HP evolutions (magnified time windows) presented in
Figure 17.
With a time-step of 2 s for the N12 load evolution, the analysis of voltage in node N12 for 30 min needed 900 consecutive load-flow (LF) calculations, which has been performed by using the OpenDSS LF program, which is well adapted for such task. The blue line graph evolution of
Figure 17 (corresponding to TW1 timeframe 02-00–02:30) and
Figure 18 show that the voltage in N12 (named U
ORIG, blue line) has in both timeframes a level under U
N-10% = 207 V for long periods.
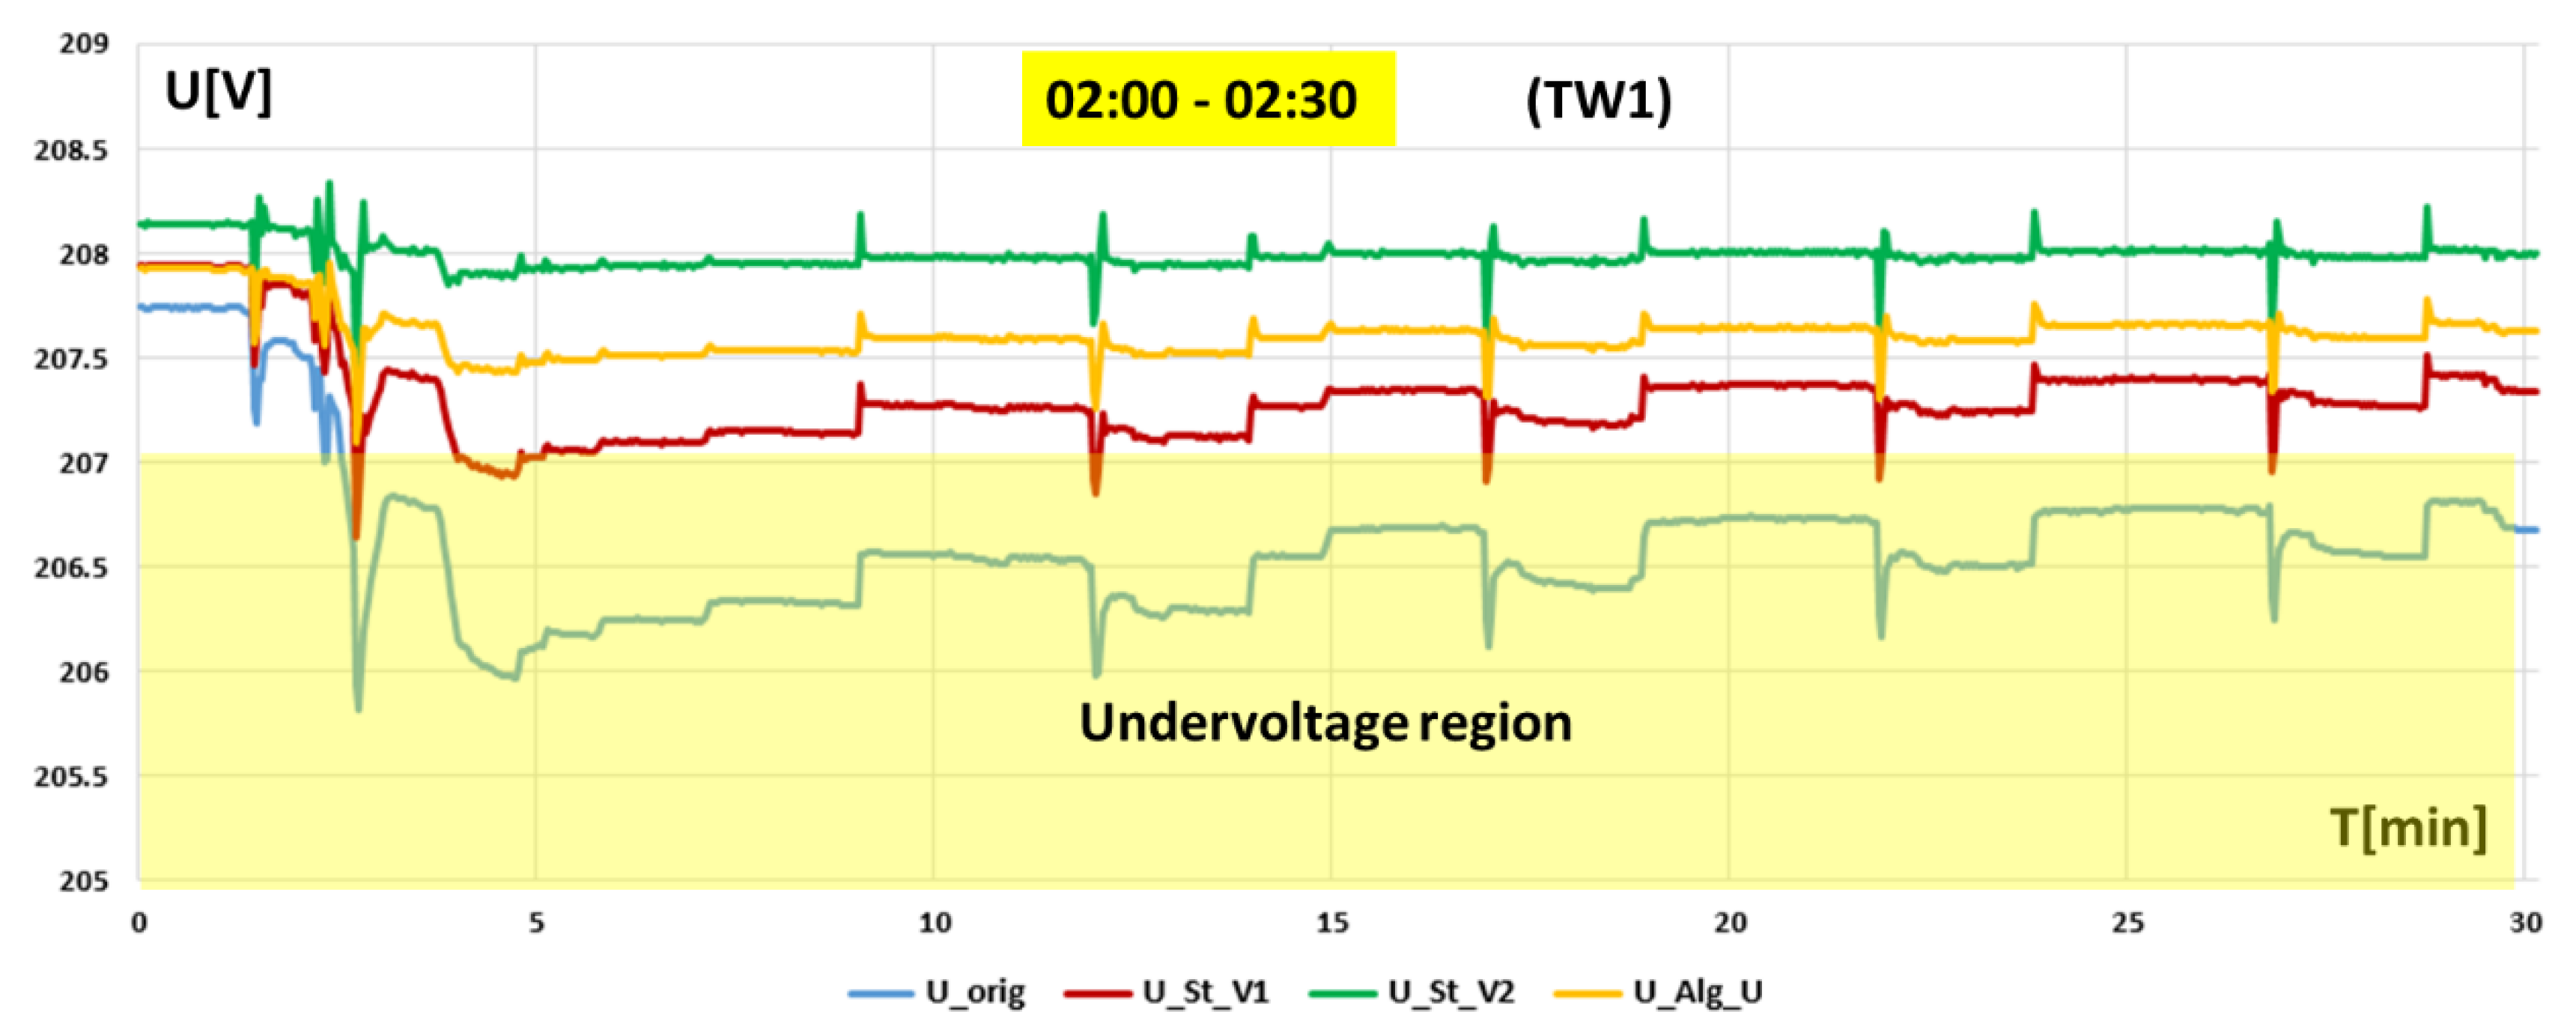
To solve voltage problems in N12, several P injection methods have been applied to the BESS of the prosumer in N12, which has been chosen to act as a U-level service provider combined with energy supply for N12 aggregated HP consumption.
The first two methods used P
BESS as having a value proportional to the consumption in N12 (P
BESS = K×P
N12), as the consumed power can be either transmitted in real-time from N12 or can be measured in N11 on the line N11–N12. The voltage evolution in node N12 appears as U_St_V1 and U_St_V2 (version 1 and 2) in
Figure 18 and
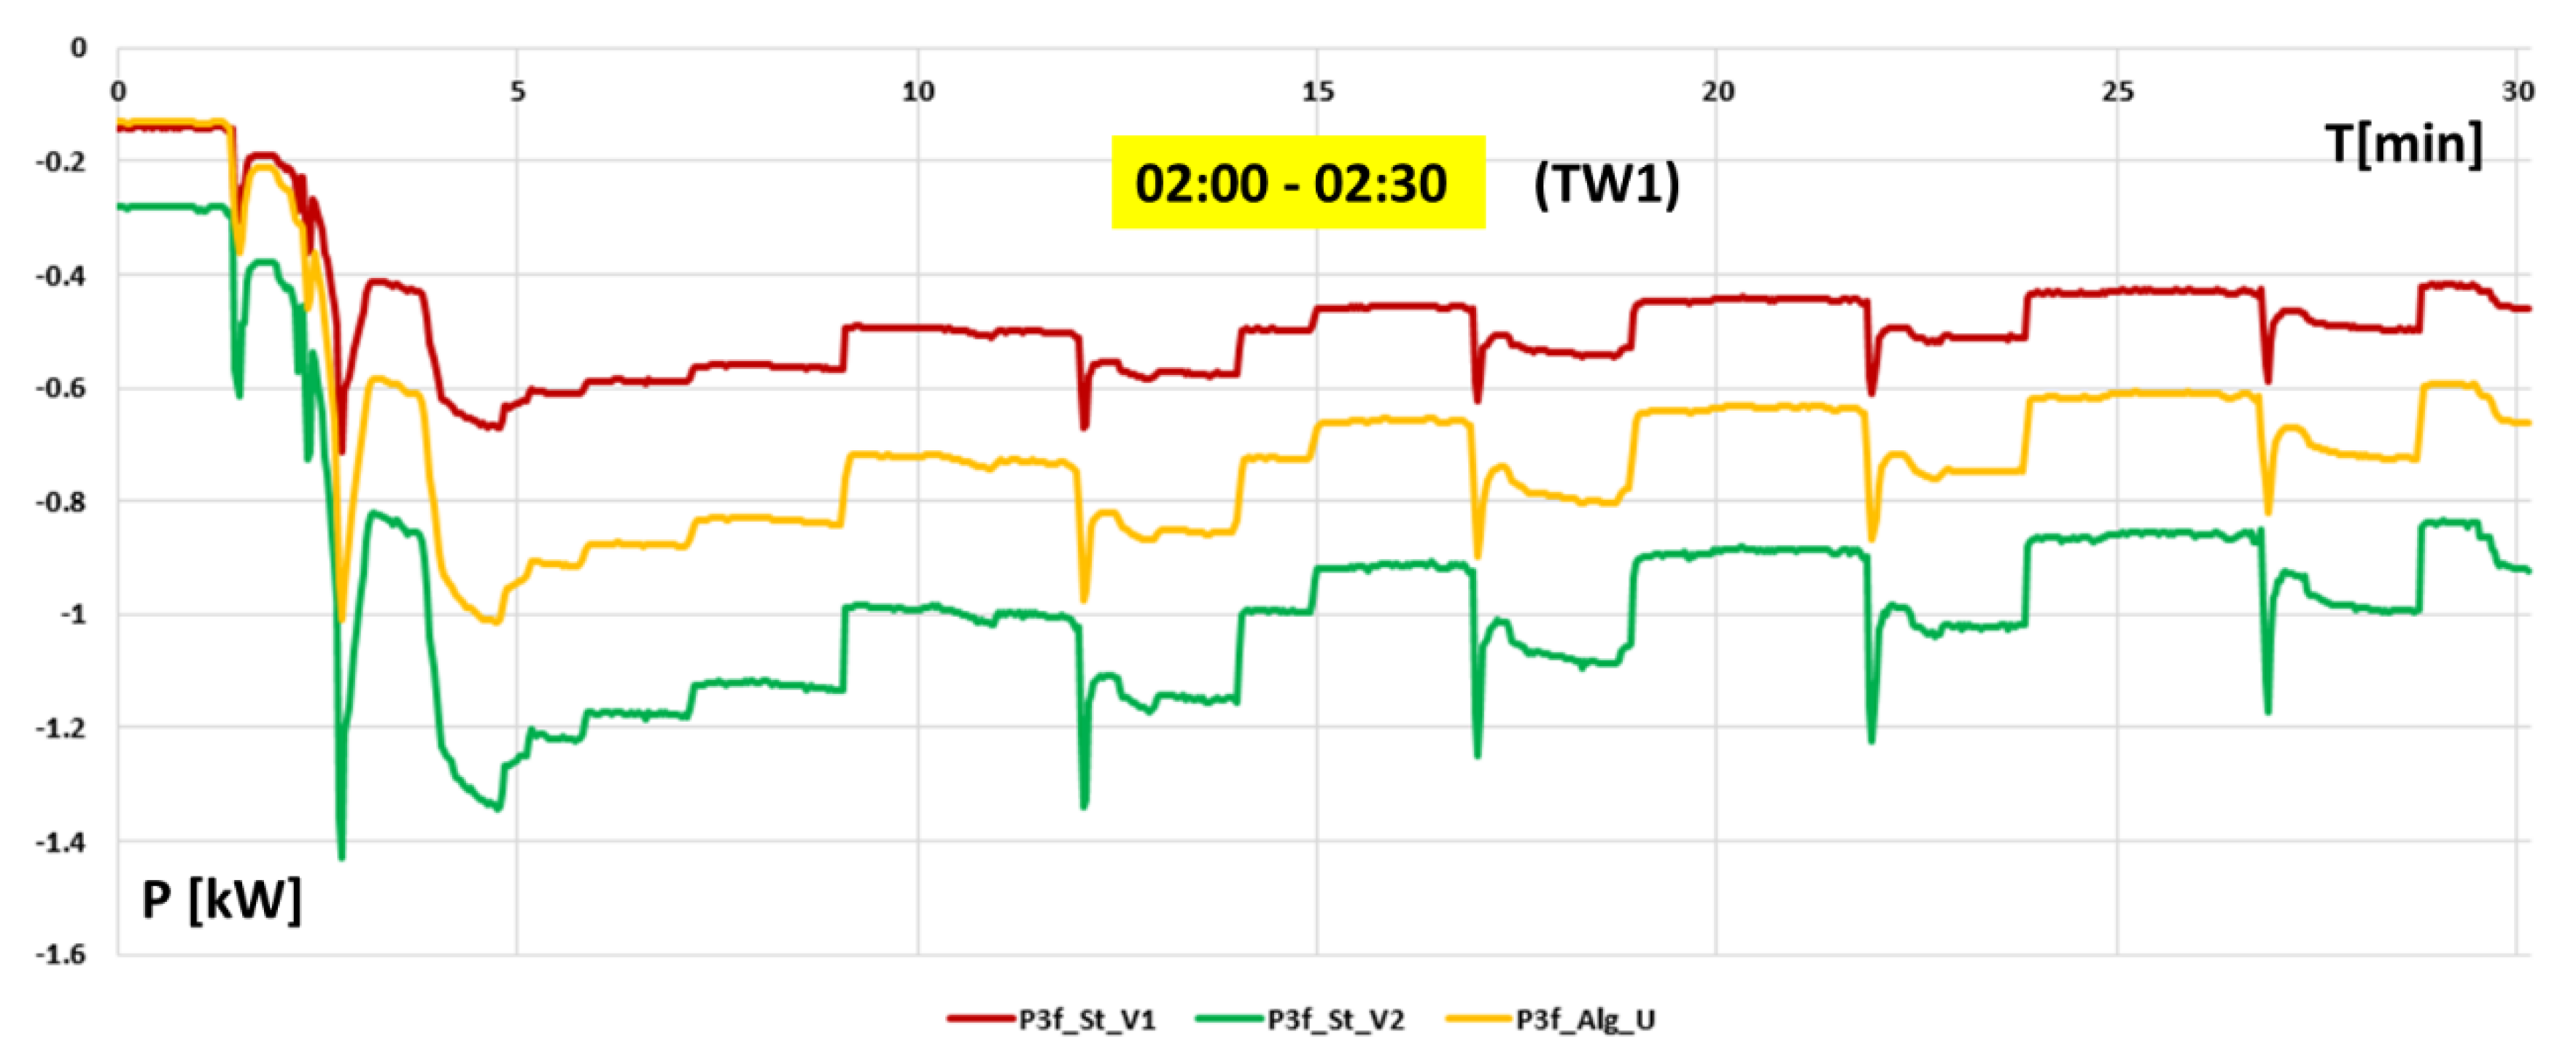
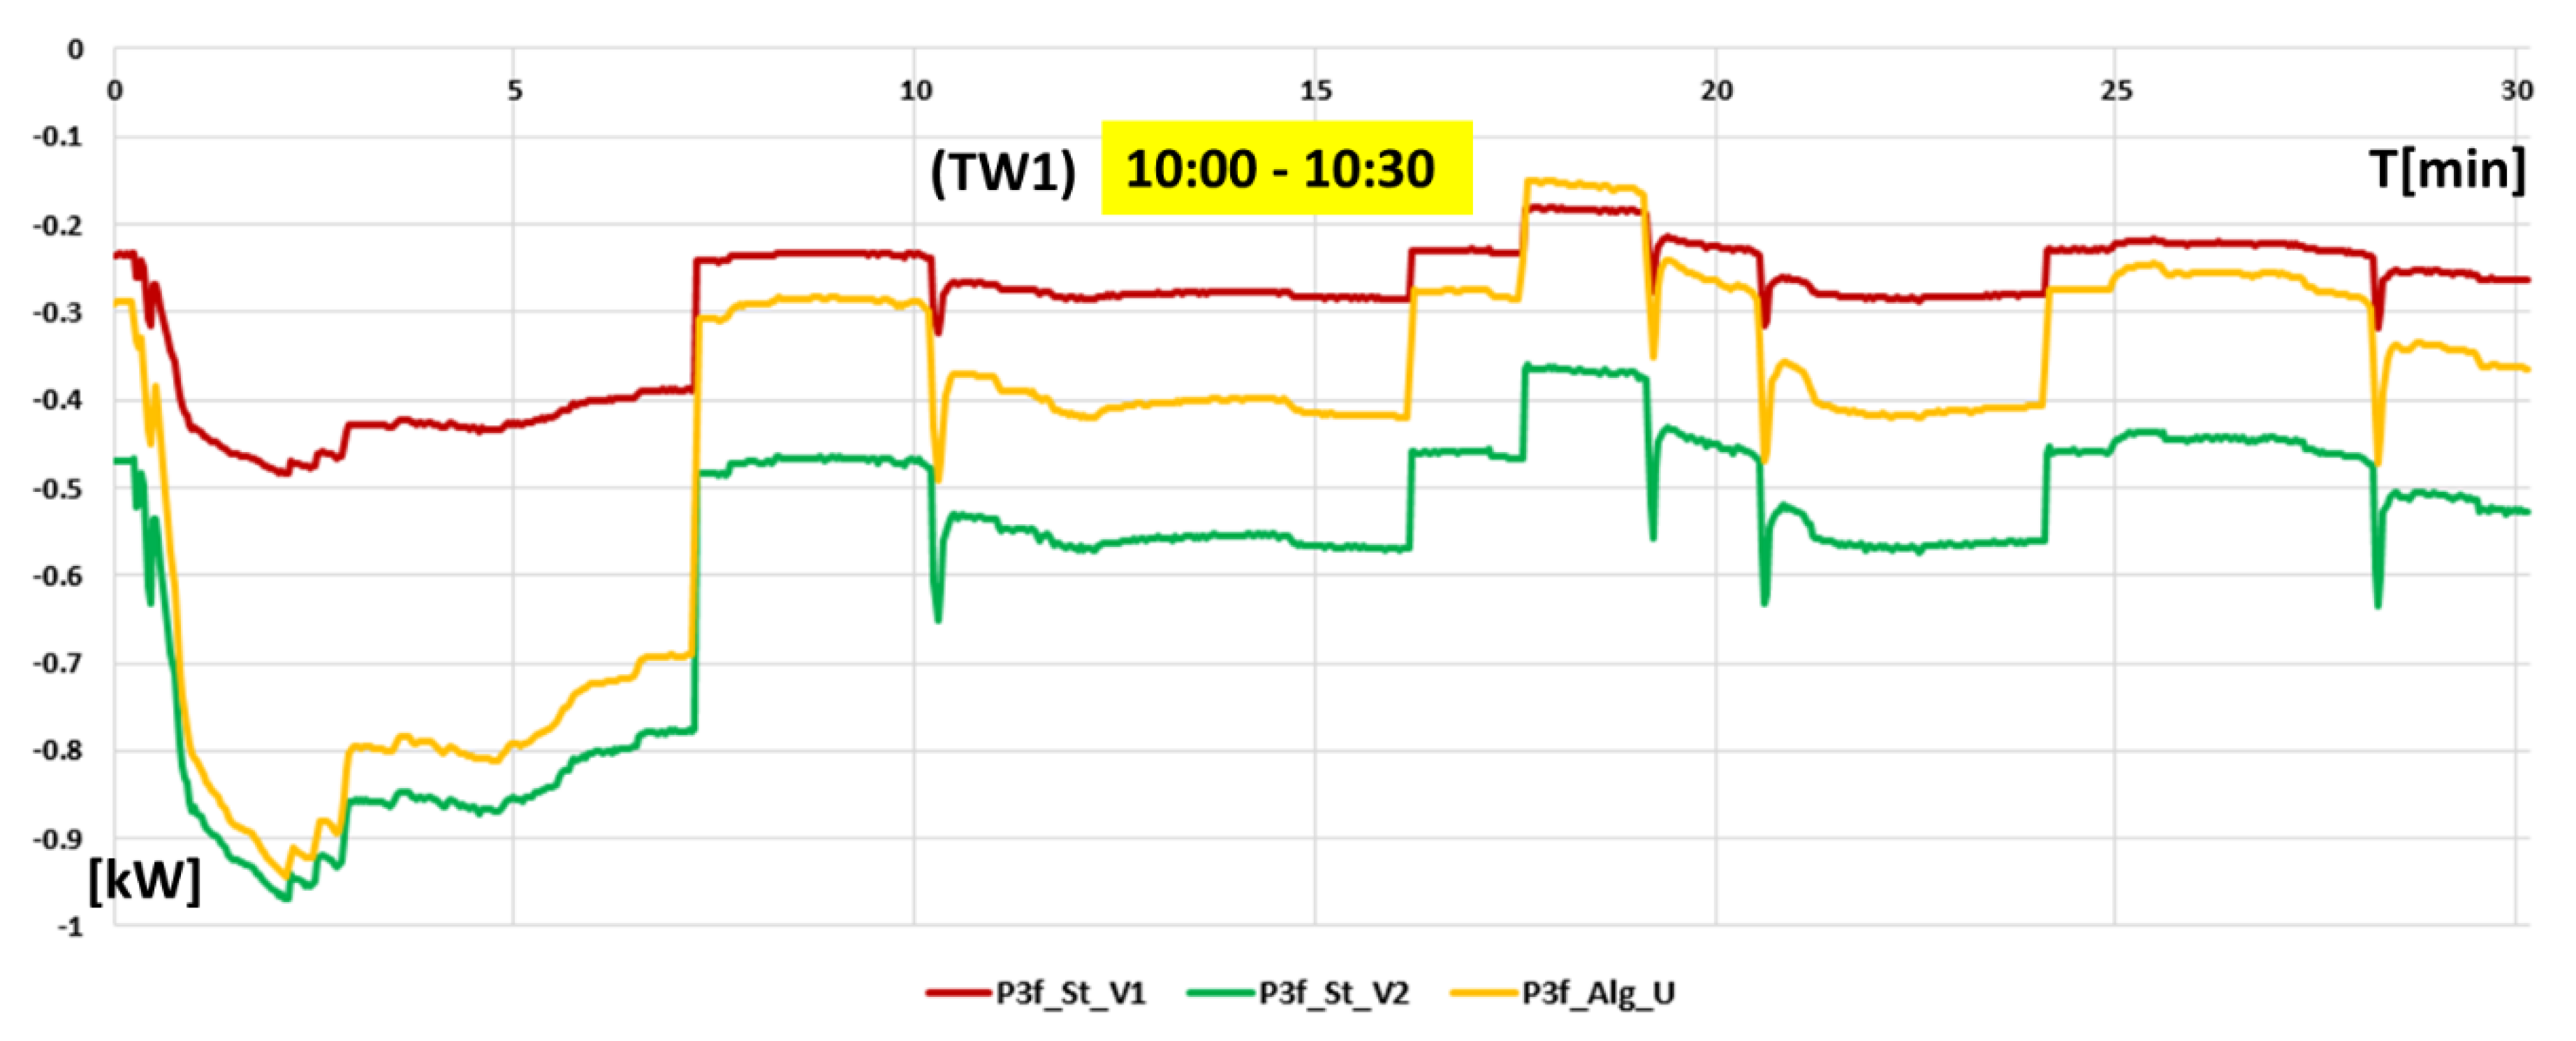
Figure 20, while the used BESS active power P injected in N11 is shown in
Figure 19 and
Figure 21, as P3f_St_V1 and P3f_St_V2 (P3f means 3-phase power).
The third method used P
BESS as having a value proportional to the deviation of voltage in N12 from an acceptable setpoint limit (chosen to be 208 V, as one volt more than the limit): P
BESS = K×(208—U
N12). U
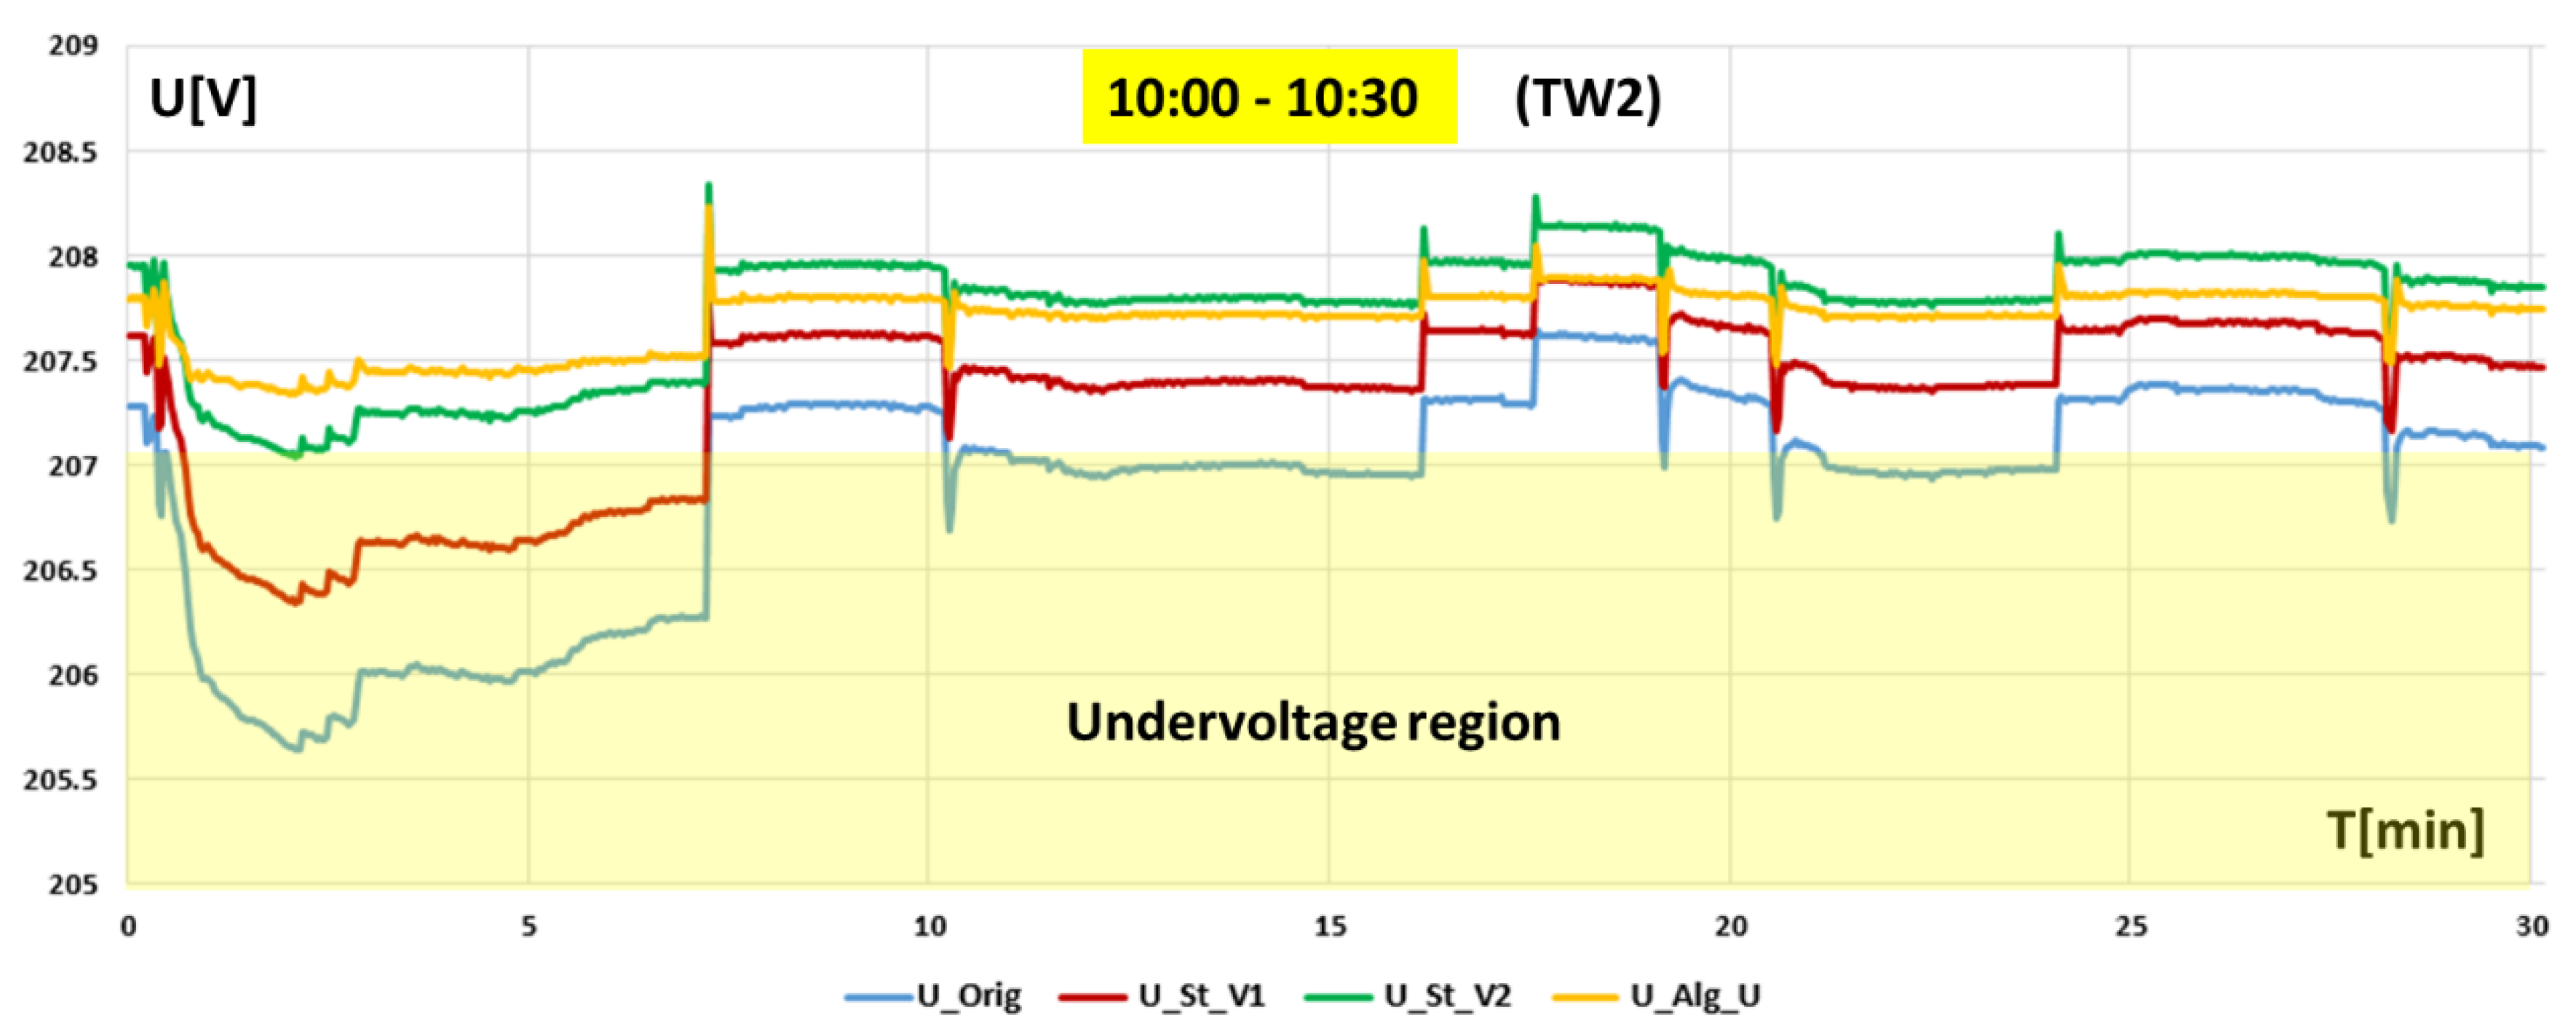
N12 can be, in practice, measured in N12 with the SCADA system of the community microgrid and given to the BESS regulation algorithm. The voltage evolution in node N12 appears labeled as U_Alg_U in
Figure 18 and
Figure 20, while the used BESS active power P injected in N11 for U regulation is shown in
Figure 19 and
Figure 21 as P3f_Alg_U.
Figure 18.
TW1 Voltage evolution in N12: without U service and with 3 × U regulation methods.
Figure 18.
TW1 Voltage evolution in N12: without U service and with 3 × U regulation methods.
Figure 19.
TW1: BESS active power (P) evolution in node N11 used for U control in node N12.
Figure 19.
TW1: BESS active power (P) evolution in node N11 used for U control in node N12.
Figure 20.
TW2 Voltage evolution in N12: without U service and with 3 × U regulation methods.
Figure 20.
TW2 Voltage evolution in N12: without U service and with 3 × U regulation methods.
Figure 21.
TW3: BESS active power (P) evolution in node N11 used for U control in node N12.
Figure 21.
TW3: BESS active power (P) evolution in node N11 used for U control in node N12.
The maximum power and total energy used for the three regulation methods in each half-hour period are shown in
Table 3.
In both time periods, it can be seen that in the basic situation, without P injection from the N11-based BESS, the voltage level is respected in less than 95% of the measured + simulated situations: UIn_band_limits is 8.6% and 53.9% respected in ΔT1 and ΔT2 respectively.
Using the calculated ECons_HPs, the BESS energy needed for U control in N12 is less than the HP consumed energy in St_V1 and St_U and slightly higher for St_V2, which suggests that the voltage regulation service can be combined with the neighbor’s (N11) provided energy supply (in N12), which can be seen as a “package” of bundled services between the prosumer in N11 and the aggregated consumer in N12.
As an important conclusion, the results show the effectiveness of BESS P control for local voltage regulation by showing that using P control with a BESS can be used with good results in “near-resistive” microgrids (as are usually in LV networks, with R > X lines) to provide local voltage control. An interesting aspect is the fact that the U regulation is made coupled with the energy supply, and this improves voltage level while microgrid energy losses are expected to be reduced due to the local production + consumption. In contrast, Q regulation is less effective and also increases the microgrid losses, which usually makes the distribution company ask for a high K factor.
6. Use Case 3: Increase Resilience through Optimal Selection of PV Angle and Battery Size
Optimization in microgrids containing PV and BESS is a valuable process both in the design phase as well as for grid expansion planning. Therefore, much research is seen in this direction. In [
25], the authors perform a multi-objective optimization of PV system size, converter power, battery storage capacity, capital investment, and electricity tariffs using Particle Swarm Optimization (PSO) in combination with the concept of Pareto Dominance. In [
26], the authors show a genetic algorithm that determines the optimal number of PV panels and batteries while also taking into account battery depth of discharge and PV tilt angle. A similar approach is presented in [
27], in which PVs and batteries are also combined with wind turbines in order to determine the optimal configuration by using a genetic algorithm with an elitist strategy. An elitist non-dominated sorting genetic algorithm is implemented in [
28] with the objective of maximizing reliability while minimizing the cost for off-grid hybrid wind/PV power systems. The variables taken into account are PV panel size, battery capacity, type and size of wind turbine generators, and PV tilt angle. A multi-objective PSO is used by the author in [
29] in order to properly size a PV system while considering the system’s total net profit during its lifetime as well as environmental benefit. However, BESSs were not included in the system.
Still, none of the above-mentioned papers take into account an energy community. More precisely, [
25,
26,
27,
28,
29] consider the load profile of individual households and do not focus on community resilience.
The scenario which will be analyzed consists of an optimal selection of PV mounting angle and energy storage system size in a neighborhood comprising 10 medium-sized residential houses by using a modified multi-objective PSO. The neighborhood plays the role of an energy community, and the use case is, therefore, a method of design for the particular aspect of optimization. The first objective is to generate as much power throughout the year in order to minimize energy taken from the distribution system. Simultaneously, grid energy exchange can be further reduced by using battery systems—this increases self-consumption inside the energy community. However, by increasing storage capacity, the acquisition cost of such battery systems rises. Therefore, the second objective is to reduce costs. As can be observed, the two objectives are antithetic, and it is necessary to find the best balance between grid energy reduction and battery cost.
This scenario is a valid example of a multi-objective optimization problem. To find the optimal solution, we propose the use of
Particle Swarm Optimization. PSO is a method that emulates the social behavior of individuals in large groups in order to solve nonlinear functions [
30,
31,
32]. It is an extremely flexible technique and requires only a small number of process parameters. The method uses a number of particles
i = 1,…,
M, which are iteratively updated in terms of location in space and speed. For each iteration, any particle has a best location (best individual solution), denoted
pb, and a best solution from a group perspective, denoted
gb. The equations which define particle movement are:
where
t is the time step (iteration),
V is the velocity of the particles,
X is the current position,
r1 and
r2 are random variables uniformly distributed from 0 to 1,
c1 and
c2 are constants in the range from 0 to 2, and ω signifies particle inertia.
A multi-objective PSO (MOPSO) can be approached in various ways, such as using evolutionary algorithms [
33], speed-constrained MOPSO [
34], fuzzy-MOPSO [
35], etc. In [
36], the authors propose to limit each objective function between values 1 and 0, with 1 corresponding to the maximum possible value of the objective function and 0 relating to the lowest possible value. A modified version of the method in [
35] will be chosen for this case study.
Each house has a daily energy consumption of 8.589 ÷ 12.6 kWh, depending on the season. Large consumption during winter is attributed to house heating, which is performed using electricity (either with heat pumps or using induction boilers). Furthermore, each house can accommodate PV panels with an output of 3 kWp (p denotes peak power value, as a used notation for PVs). This value has been chosen in accordance with various state incentives, such as [
32], leading to the lowest individual contribution for procurement and installation cost.
The optimization algorithm can provide the optimal PV installation angle (α) between the range of α = {0; 5; 10; 15; 20; 25; 30; 35; 40}, depending on solar irradiance throughout the year and by decreasing costs (as much as possible) of an energy storage system (BES), which can be sized energy range (
B) of B = {0 kWh; 5 kWh; 10 kWh; 15 kWh}. The cost function (
CB) of a BES is presented in Equation (3) and reflects actual prices provided by [
37,
38]:
Each PV panel is considered to have an efficiency of 21.32% and a size of 2.158 m
2. Daily solar irradiance data is extracted from the European Commission Database [
39] for a location in Eastern Europe (44.45 latitude north, 26.10 longitude east).
The two objective functions are presented in Equations (4) and (5) (derived from Equation (3)):
where
is the energy taken from the grid towards the neighborhood,
is the energy produced by PV panels,
is the energy consumed by the houses,
is the energy absorbed or injected by the battery energy system, and
N is the number of houses.
The multi-objective problem can be approached using a modified version of [
35], as presented in Equations (6) and (7). Our adaptation consists of a penalization technique that ensures that results that are furthest from the individual best are scored with “2,” thus ensuring that evaluation results of the objective function are quadratically increased and are considered strongly distanced from the minimum value.
where
high1 and
high2 correspond to the highest possible value related to grid energy (which is 3841 kWh per house per year) and the highest possible value related to BES cost (which is 9913 euros per house per year).
low1 and
low2 correspond to the lowest possible value related to grid energy (which is 0 kWh per house per year) and the lowest possible value related to BES cost (which is 0 euros per house per year).
Using Equations (4)–(7), the objective function becomes:
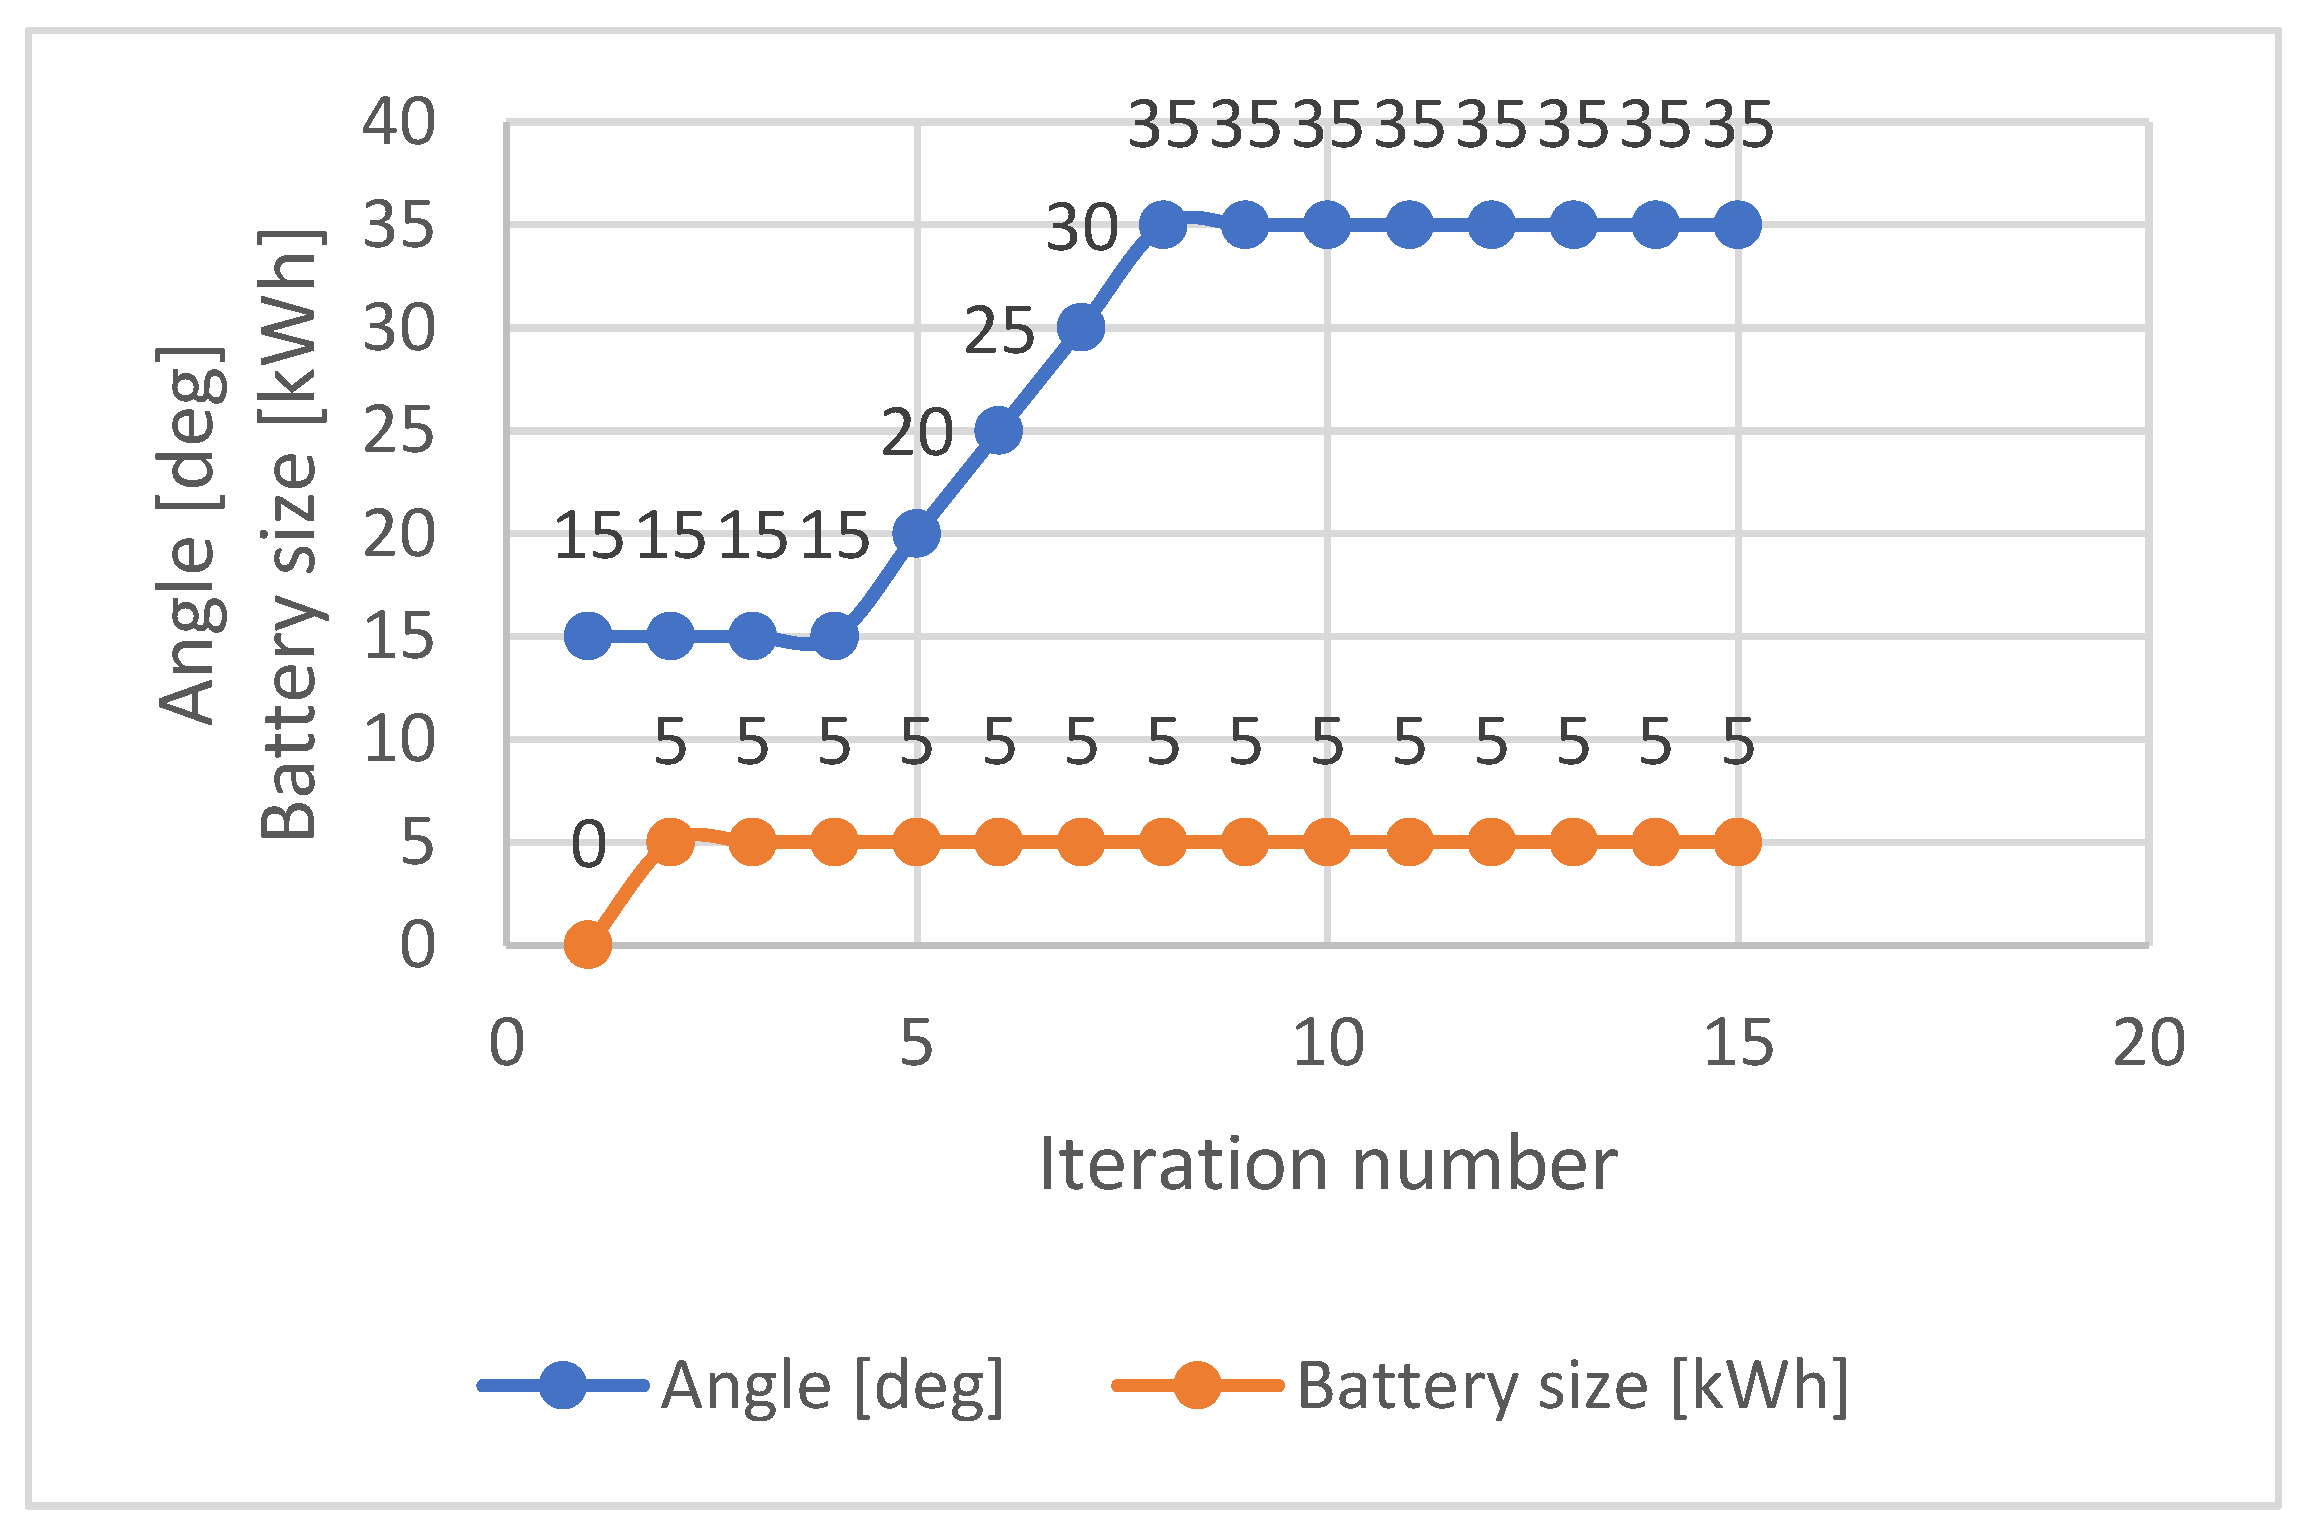
By applying MOPSO, using parameters presented in
Table 4, the optimal values of angle and BES size are α = 35° and
B = 5 kWh, as can be seen in
Figure 22. Furthermore, this figure shows the iterative process, as dictated by the MOPSO algorithm.
Table 5 shows the energy taken by the residential district from the distribution grid in three situations: without PVs mounted on rooftops; with 3 kWp PV mounted on rooftops at an angle of 15°, without BESS; with 3 kWp results obtained using MOPSO.
As it can be observed, by using MOPSO to define the optimal PV angle and BESS size, it is possible to decrease neighborhood dependence on grid energy by 61%, thus increasing resilience.
In use case 3, we demonstrated that it was possible to perform optimization tasks of two parameters that were accessible in the microgrid design phase: PV angle and battery size. Our proposed approach used multi-objective particle swarm optimization by applying an adapted method that strongly penalized results that were furthest from the individual best. Considering the fact that the end goal is to obtain concrete and applicable results, the MOPSO method is sufficiently flexible and can provide adequate computational efficiency. However, other optimization techniques can also be used.

 ,
, 


