Article

Experimental Research to Increase the Combustion Efficiency in the Top-Lit Updraft Principle Based Gasifier

National Institute of Research & Development for Optoelectronics/INOE 2000, Subsidiary Hydraulics and Pneumatics Research Institute/IHP, Cutitul de Argint 14, 040558 Bucharest, Romania
*
Author to whom correspondence should be addressed.
Energies 2023, 16(4), 1912; https://doi.org/10.3390/en16041912
Submission received: 23 January 2023 / Revised: 9 February 2023 / Accepted: 13 February 2023 / Published: 15 February 2023
(This article belongs to the Topic Sustainable Thermal Energy Technologies and Processes)

Abstract

:
The recovery of vegetal waste for energy purposes is one of the ways to increase the amount of energy obtained from renewable sources. The Top-Lit Updraft (TLUD) gasification and combustion process is recognized as the least polluting of all other combustion processes, resulting in a sterile charcoal called biochar, which can be used as an amendment in agricultural soils. The purpose of this research was to determine the influence of excess air in the combustion area compared to the (theoretical) calculated requirement for a TLUD energy module. Most scientific publications on this topic recommend primary/secondary air flow rate ratios of 1/3 or 1/4. In this study, the two recommended ratios were tested, and it was found that better energy results correspond to the ratio of 1/3. For this 1/3 ratio, the investigations continued in order to optimize the combustion process. The results achieved demonstrate that the excess combustion air flow of 30% improves the performance of the energy module due to the increase in oxygen supply and the increase in air speed in the combustion area of the syngas resulting from gasification. Increasing the excess combustion air flow rate by +50% had the effect of lowering the temperature in the flame due to the cooling of the combustion gases caused by a too high rate of excess cold air flow.

1. Introduction

Three main challenges of this century are well known, namely resilience to climate and environmental problems, the need for food security, and the simultaneous reduction in a significant amount of greenhouse gases existing in the atmosphere [1].
The use of vegetal waste for energy production responds to another request of environmental strategies, that is, in addition to the fact that an important area of land is depolluted, green energy (thermal energy) is also obtained that can be used to heat homes, technical spaces, warehouses, greenhouses, or in industrial drying processes.
Therefore, in addition to environmental problems, the development of biomass combustion systems with lower emissions can contribute to increasing human well-being and health, and to social and economic development [2,3,4].
Energy is a key factor in people’s daily life and in all modern economic sectors. Biomass has been one of mankind’s main sources of energy, although currently fossil fuels (oil and gas) are easier to use. The eventuality of exhausting fossil fuels and the growing need for energy, preferably green, lead to new research on the use of the current technological level to find new energy solutions.
Currently, only a small part of the world’s energy needs comes from alternative and renewable sources such as solar (thermal or photovoltaic), wind, hydro, tidal/wave, and bioenergy (biomass, biogas, and biofuels).
Gasification is a process by which solid fossil fuels are transformed into a synthetic fuel gas called syngas (mainly a mixture of carbon monoxide and hydrogen); it is a thermochemical degradation process that takes place at high temperatures (800–1000 °C) in an environment where the amount of oxygen is lower than that required for complete combustion. In order for the combustion process in biomass gasification to be complete, it is necessary for the air and the resulting gas (syngas) to be mixed in a certain ratio under appropriate conditions of turbulence and temperature. If the combustion is incomplete due to the lack of oxygen or if the surplus of oxygen cools the vapors below the optimal point where they will burn, unwanted pollutant emissions and energy waste result.
The Top-Lit Updraft (TLUD) gasification process, by which thermal energy and biochar are produced, is a combustion technology with recognized ecological performance, and applying it on heating or cooking equipment could contribute to a cleaner environment, to the reduction in deforestation pressure, and to the improvement of soil productivity, ensuring efficient protection of the environment and sustainable energy development [5]. Materials considered waste (bark, residues from forest wood cutting, residues from secondary agricultural production, etc.) can be used effectively to produce thermal energy and store carbon in biochar. Practically, the fuel for TLUD facilities can be any chopped and dried wood material, or densified material.
The name ‘TLUD’ derives from the initials of the terms ‘Top-Lit Updraft’ [6,7,8], which describe a type of combustion in which the pyrolytic front advances in the biomass layer from top to bottom [9,10,11].
The gasifier based on the TLUD principle is a monobloc-type equipment composed of a gasifier with an upward gasification air current in which the ignition and initiation of the pyrolytic front is conducted at the upper part of the equipment. During the combustion process, the pyrolytic front advances in the biomass layer, and due to the heat radiated by the oxidation front, the biomass heats up, and in the first phase it dries and then enters a rapid pyrolysis process from which volatiles are released and unconverted carbon remains [12]. At the end, when all the biomass has been gasified, about 10–20% of its initial mass remains on the grate in the form of sterile charcoal, called biochar. This resulting biochar is a charcoal with a high adsorption surface that can be used to restore degraded soils, to sequester carbon in the soil for long periods of time, or as a filter material for air, gases, and water.
The advantage is that the combustion process is carbon-neutral: if the resulting charcoal is also burned, and if the biochar is used in soil amending, the process becomes carbon-negative because the carbon that would have reached the atmosphere is taken up and stored in the soil. Biochar acts in the soil like a sponge that can absorb up to five times its own weight, stores water and nutrients, and allows microorganisms to settle in its pores. In this way, the TLUD technology becomes extremely friendly to the environment.
Theoretically, stoichiometric combustion should extract all the energy from the fuel, but in practice this is very difficult to achieve. Most of the time, the amount of air is increased to ensure the combustion of the entire gasified syngas in order to utilize the energy produced and avoid pollution. The additional air added to the theoretical (calculated) amount is called excess air. The excess air flow requirement for various combustion systems can be in the range of 5–50% depending on the type of fuel and the type of combustion equipment.
In a TLUD gasifier (Figure 1), the flame is produced from the combustion of the syngas mixture—resulting from the pyrolytic phase unfolding inside the gasifier—with the combustion air, which is inserted through some holes located at the upper part of the equipment [13].
The flame temperature can reach 800–1000 °C, and the adjustment of the thermal power is conducted by adjusting the gasification air flow rate (Dag) and the combustion air flow rate (Dard) by means of two mechanically coupled flaps; another way to achieve this control is by varying the fan speed.
Since in the TLUD process the pyrolytic front advances in the fixed biomass layer, the gasifier operates in batch mode with recharging. The gasification process takes place at a low speed rate, with specific hourly consumption of 80–150 kg.bm/m²h; this fact results in reduced specific reactor powers of 250–350 kW/m². Due to the slow gasification process, the surface velocity of the produced gas has very low rates, namely below 0.06 m/s, which ensures a reduction in the rate of entrainment of free ash at concentrations below PM 2.5 to a maximum of 5 mg/MJbm. This value is several times lower than the current norms imposed for solid fuel thermal generators [14,15].
From the turbulent mixture of syngas with combustion air, together with an optimal air excess of 1.3…1.5, a concentration of CO that is below 2% or 0.8 g/MJbm results in the combustion gases; this value is below the currently enforced standards. These aspects make the TLUD thermal generator the least polluting equipment compared to other solid fuel thermal energy production systems. One can read comparative values in terms of carbon monoxide (CO) and particulate matter (PM) emissions from various combustion technologies and systems on the graph below (Figure 2); the displayed amounts of polluting concentrations of CO and PM endorse the benefit of employing the TLUD technology.
Figure 3 shows the block diagram of a TLUD energy module, which also represents the working diagram of the laboratory equipment on which the tests for the current research have been performed.
The input parameters of the energy module are as follows:
  • The consumption of biomass (Cbm);
  • The air flow required for gasification (Dag) and for combustion (Dard);
  • The thermal load control parameter (uPt);
  • The gasification air control (Cag);
  • The combustion air control (Car).
The output parameters of the energy module are as follows:
  • The biochar (Dch) produced by pyrolysis and partially reduced;
  • The thermal power (Pth) of the burned gases at the burner exit;
  • The concentration of CO2 in the combustion gases;
  • The concentration of PM solid particles in the combustion gases.
The biomass used in the TLUD micro-gasification process is separated energetically and by mass into two parts:
  • The part of the biomass that is completely transformed into syngas;
  • The biochar remaining after the gasification phase as an incandescent layer.
The air flow rate for gasification Dag (kg.air/s) enters the gasifier, ensuring the gasification of a mass flow rate of biomass Cbm (kg.bmg/s) and the production of fuel gas with the mass flow rate Dgas (kg.gas/s) and biochar with the mass flow rate Dch (kg.bc/s).
According to the principle of continuity:
C bm + D ag = D gas + D ch ,
it follows that for the production of fuel gas part of the biomass has been used, with the mass flow rate Dbmg = Dgas:
D bmg = C bm D ch = C bm · ( 1 D ch C bm ) = C bm · ( 1 BC ) ,
where Dbmg is the mass amount of biomass transformed into gas and BC is the proportion of biochar resulting from the gasification process.
From the tests previously carried out with TLUD modules, in the literature it is mentioned that the conversion efficiency of fully gasified biomass into gas (including biochar) is in the range of 92–95% [17,18].

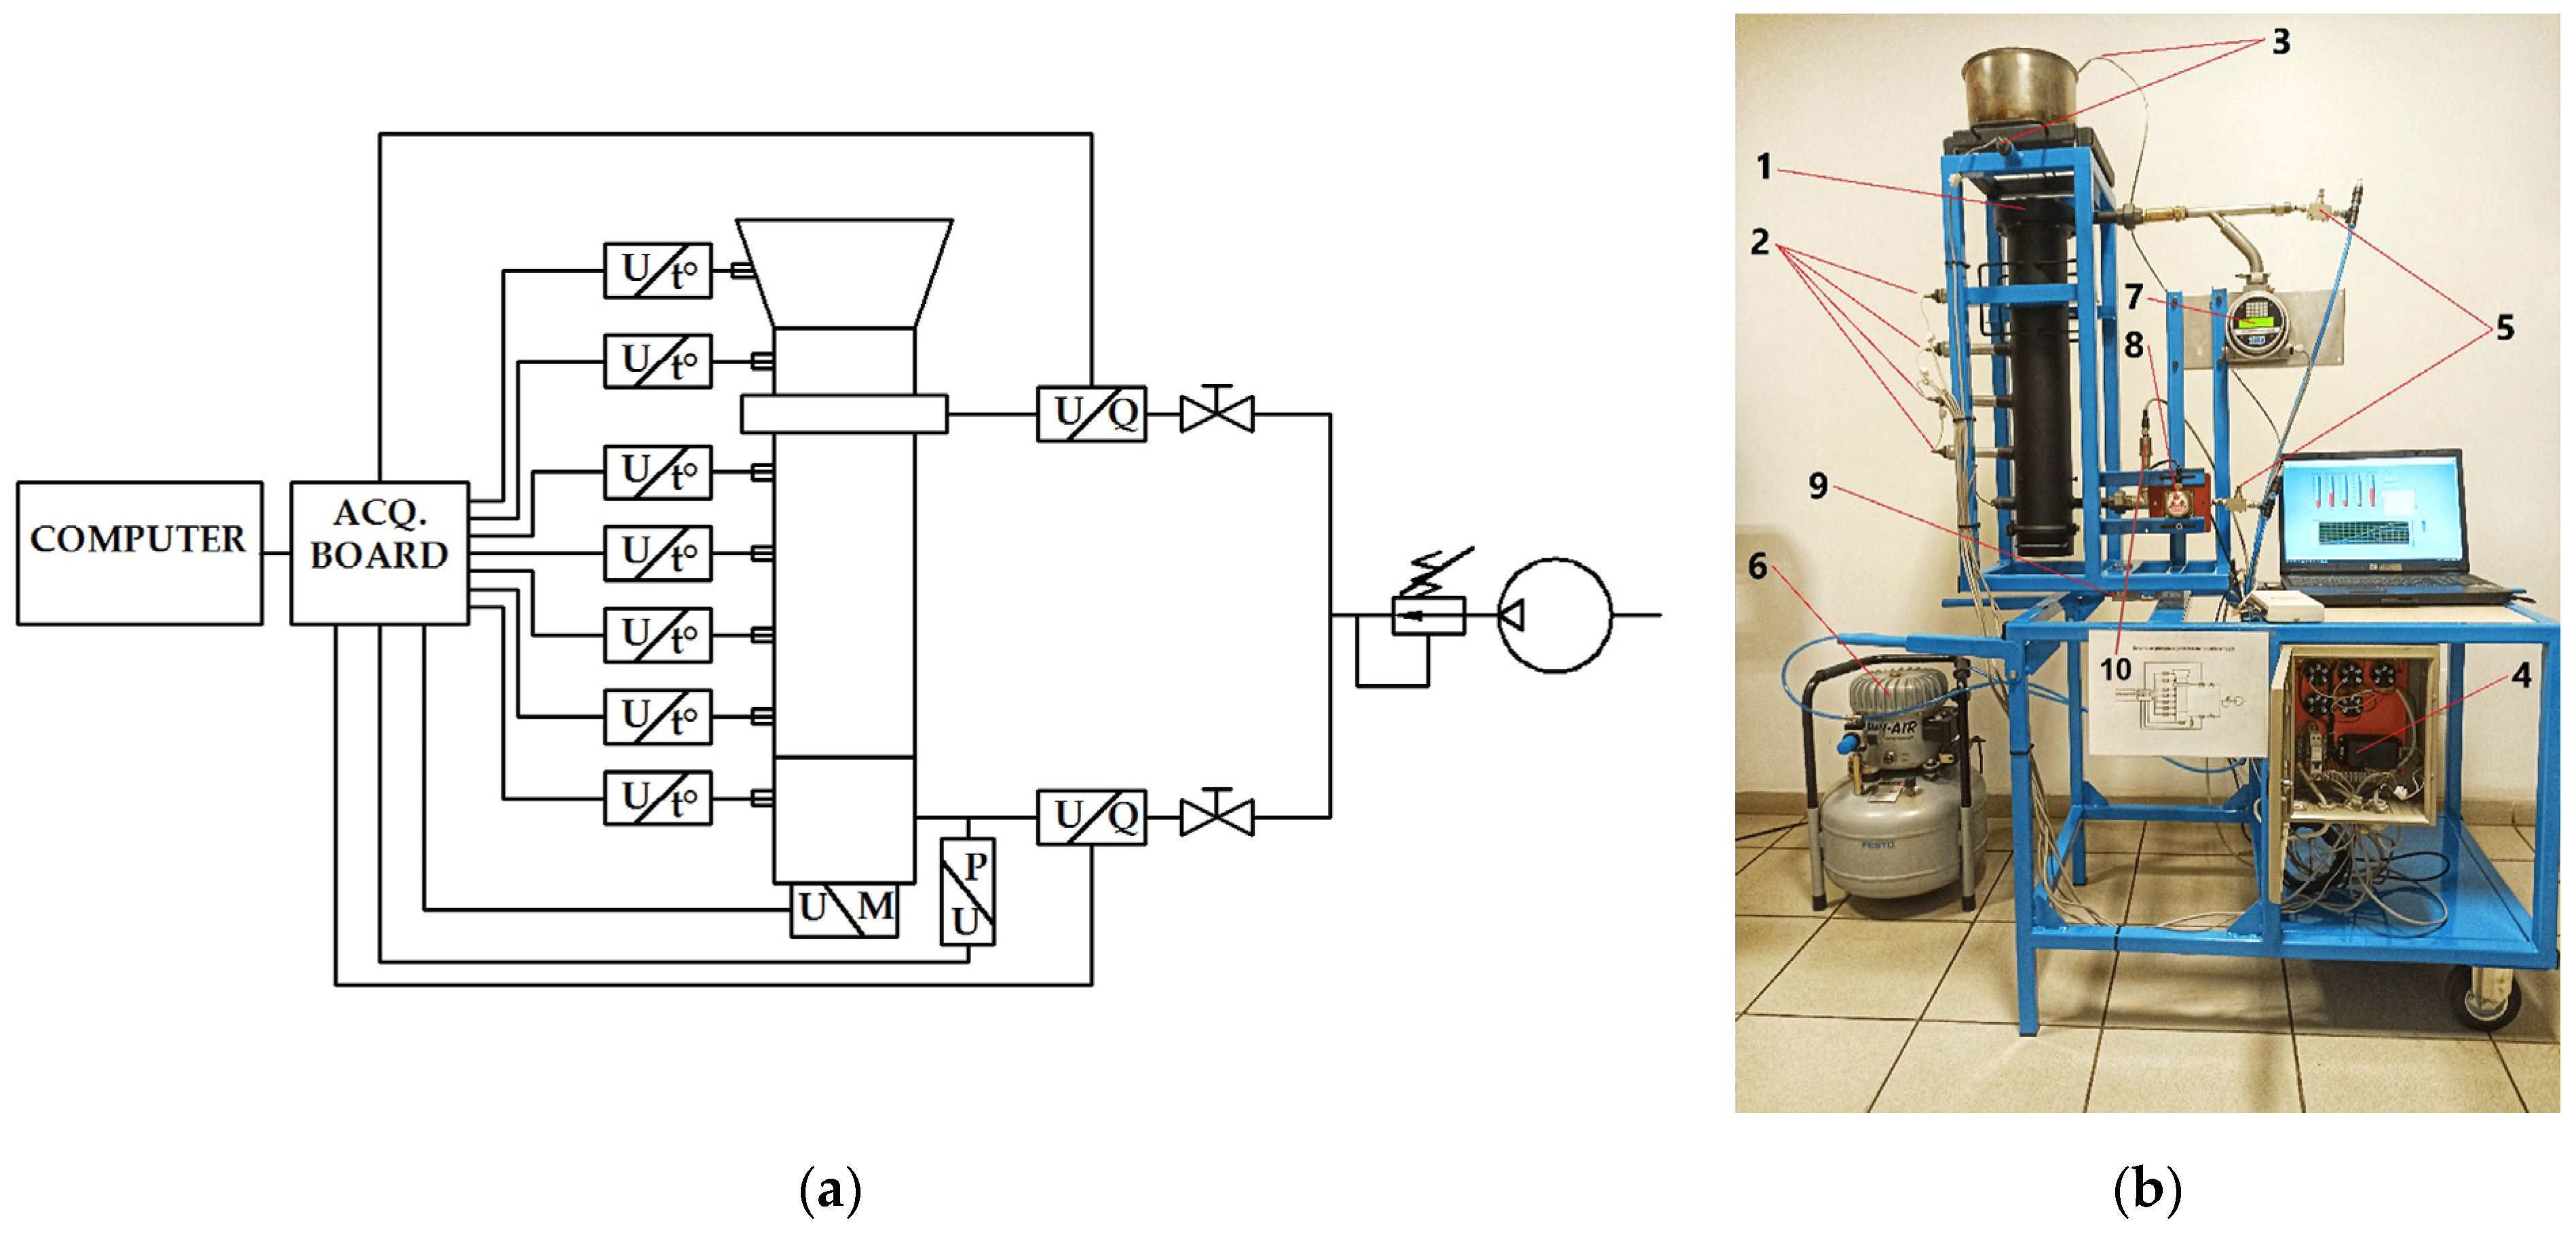
2. Materials and Methods

The aim of the current research was to determine the influence of excess air in the combustion area at a TLUD gasification module, compared to the calculated demand and compared to the ratio recommended in the literature. Most scientific publications on this topic recommend primary/secondary air flow rate ratios of 1/3 or 1/4. The goal was to test the two aforementioned recommended variants, to determine which is the optimal variant, and to maintain the same value for the gasification air flow rate, while supplementing the combustion air flow rate by 30% and 50%, in order to test the influence of excess air in the combustion area at the TLUD gasification module in our own laboratory.
In the burning tests, 1 kg of 6 mm wood pellets with an ENplus A1 quality according to ISO 17225-2:2014 were used in each test [19], and for ignition, 25 g of household liquid fuel were used in each test.
The properties of wood sawdust pellets are as follows:
  • Wood species: 100% spruce sawdust;
  • Moisture: ≤10%;
  • Ash: ≤0.7 %;
  • Calorific power: >4.6 (4.81 kWh/kg);
  • Density: 1.19 kg/dm³;
  • Diameter: 6 mm;
  • Length: 3.15–40 mm.
In order to determine the air control range during the tests, it is necessary to calculate the air flow demand for the complete combustion of the 1 kg of pellets used.
The volume of oxygen required for the complete combustion of the fuel unit (minimum oxygen required for combustion) Omin [20] is calculated via the following equation:
O min = 22.414 ( C 12 + H 4 + S 32 O 32 ) [ m n 3 O 2 kg ch ] .
For spruce, the mass percent composition (the relative quantities of main chemical elements) is as follows: C = 49.9%, H = 8.2%, O = 38.1%, and S = 0.03% [21].
The 1 kg of solid fuel contains 0.499 kg C, 0.082 kg H, 0.381 kg O, and 0.0003 kg S. Entering these values in Equation (3), the following is obtained:
O min = 22.414 ( 0.499 12 + 0.082 4 + 0.0003 32 0.381 32 ) = 22.414 ( 0.0415 + 0.0205 + 0.000009 0.0119 ) = 22.414 ( 0.0620 0.0119 ) = 22.414 · 0.0 = 1.1207 [ m N 3 O 2 kg ch ] .
The minimum volume of air flow required to burn one kg of fuel is calculated via the following equation:
L min = Q min 0.21 = 1.1207 0.21 = 5.33 [ m N 3 dryair kg ch ] ,
where 0.21% is the participation of oxygen in the air.
To burn one kg of fuel in one hour, an air flow rate of
L min 60 = 5.33 60 = 0.0888 [ m N 3 dryair kg ch ] = 5330   L 60   min = 88.83   L / min
is required.
Considering that 1 kg of solid fuel (pellets) yields approximately 10–20% unburned biochar, it means that for the complete combustion of 850 g of fuel, an air flow rate of
0.85 · L min   mass = 0.85 · 88.83 = 75.5   L / min
is required.
It is known from the literature [3,22] that for the gasification of solid fuel, the theoretical ratio between the primary (gasification) air flow and the secondary (combustion) air flow can be 1/3 or 1/4, depending on the type of gasifier, the type of biomass, or its moisture percentage. This result is in line with previous studies that recommend a secondary/primary air flow rate ratio of approximately 3:1 for optimal performance [23,24].
The laboratory device on which the excess air flow tests were conducted (Figure 4) consists of a gas generator based on the TLUD principle (1), equipped with air flow meters (7,8), control throttles (5), and seven temperature probes (2,3), located as follows: four in the furnace area, one for the supply air, one in the flame area, and one in the bowl of water for power testing. All these items are placed on an electronic scale (9) for determining the hourly biomass consumption. A pressure transducer (10) is provided to measure the gasification air pressure (required to cross the biomass layer). The air is supplied by a compressed air source (6).
The data provided by the sensors (Figure 5a) are acquired and stored on the computer by means of an acquisition board.
A data acquisition program was developed in LabView, having a friendly graphic interface (Figure 6) that displays and records all acquired parameters and their graphs in real time.
The test device technical data are as follows:
  • Di = Ø106 mm;
  • Hmax = 450 mm, adjustable by the positioning of the sieve;
  • Biomass volume/0.1 m = 0.78 dm3;
  • Hourly consumption = 0.8 kg/h;
  • Operating time/0.1 m of biomass layer height = 0.7–1 h;
  • Thermal power at the burner = 2.7 kWth;
  • Gasification air flow section = 12 cm2;
  • Combustion air flow section = 2.3 cm2 or 20.3 cm2.
The bench was positioned and prepared for testing; the electrical connections of the sensors and the pneumatic connections were checked. The bench was supplied with air from the tank of a compressor through a pressure regulator set at 1 bar.
Before starting the recording of the tests, the primary and secondary air flow settings were adjusted, and the electronic scale, including the bowl with 2.5 L of water, was set to zero; after that, 1 kg of pellets was introduced into the reactor. The pellets were ignited at the top by adding 25 g of Landmann household liquid fuel used for grill ignition.
On the interface created in LabView, the pressure, flow rates, and speed rates of the primary and secondary air, as well as the mass (1 kg of pellets), were displayed in real time. Separately, the start and end times of the recording were displayed, from which the duration of the test results as well as the evolution of the primary air flow temperatures of the pyrolytic front in two points (a lower height of the material for 1 kg of pellets resulted during tests), the temperature in the flame, and the temperature of the water in the water bowl were obtained.
For this research, in the first phase, two tests were carried out with gasification/combustion air flow rate ratios of 1/3 and ¼, respectively, for a total required air flow rate (calculated) of 75 L/min, that is, ratios of 25/50 L/min and 19/56 L/min, respectively.

3. Results

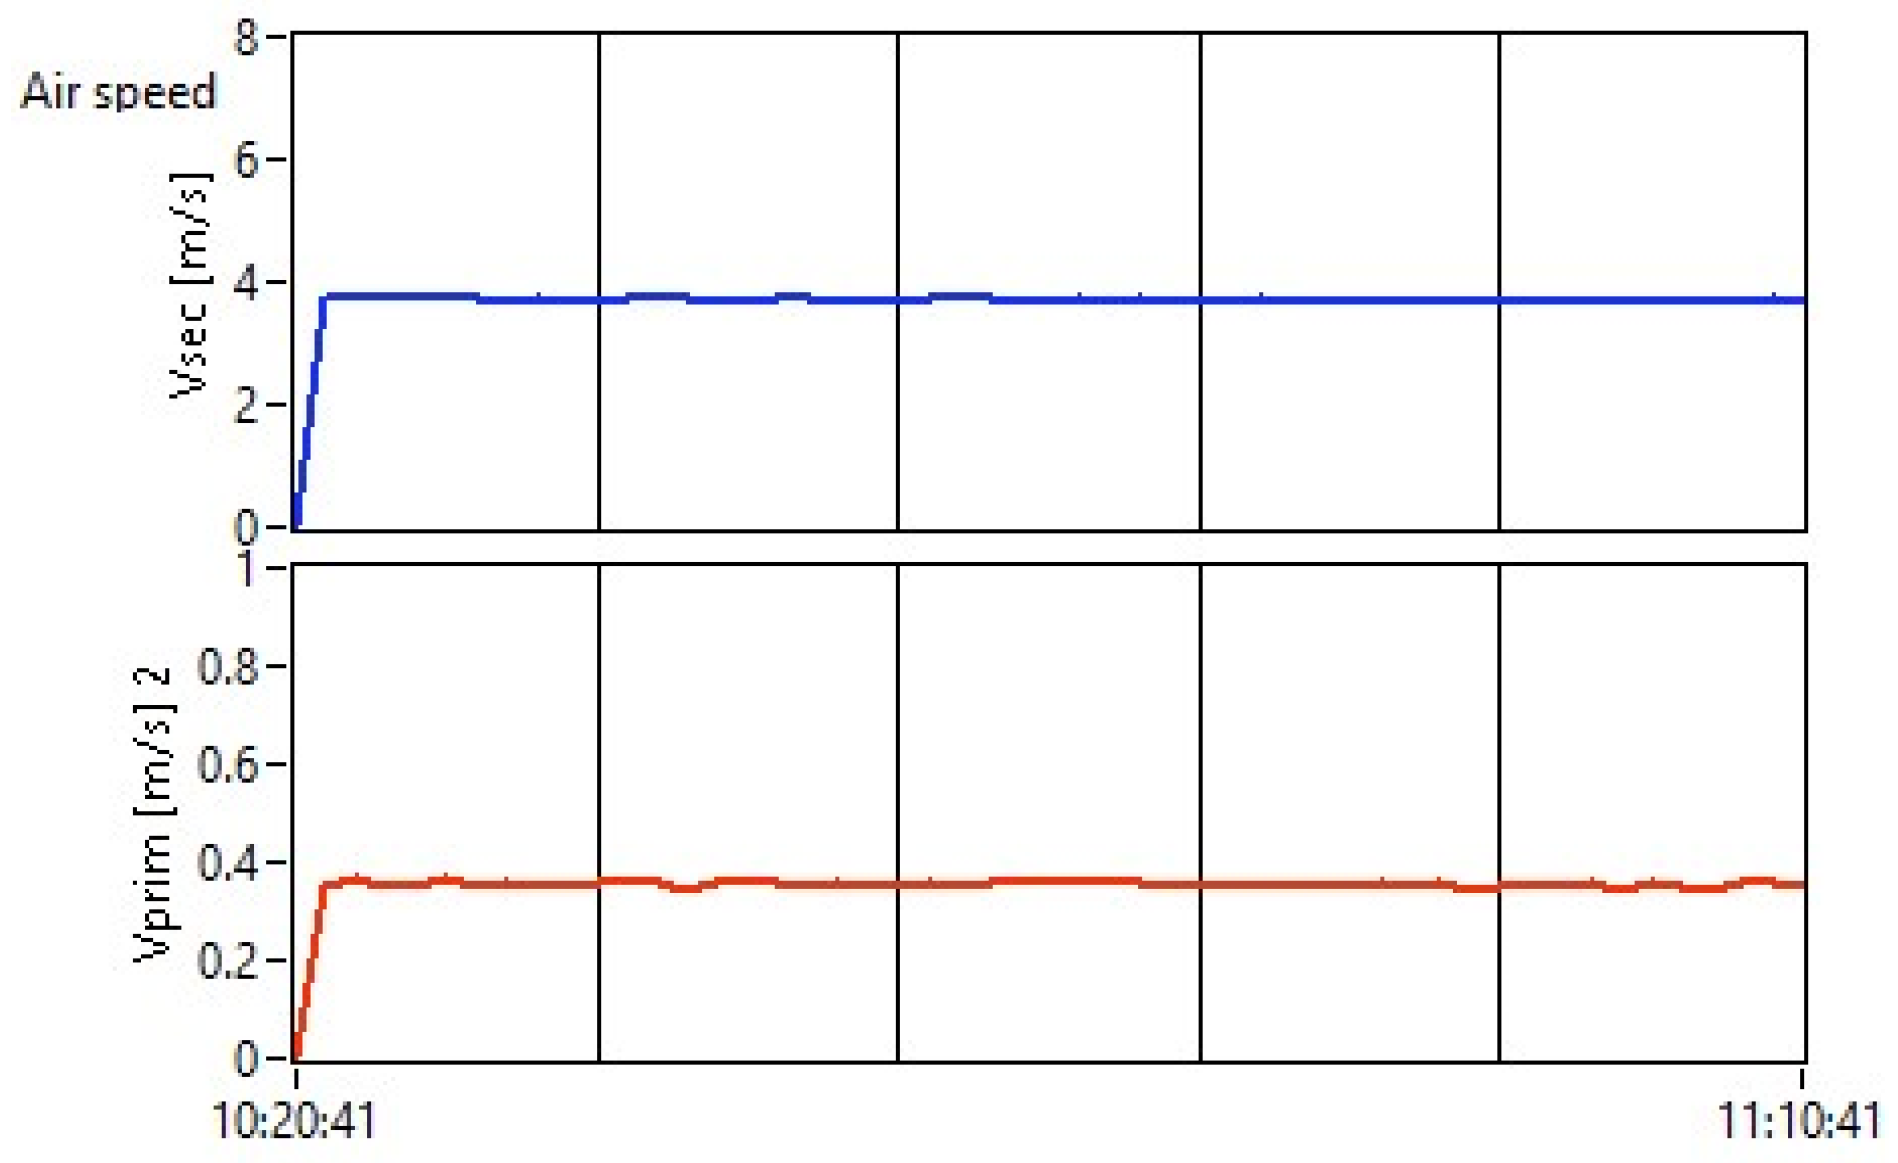
3.1. The Test with the 1/4 Ratio of Primary/Secondary Air Flow Rate—19/56 L/min

The equipment was supplied with primary air flow, 19 L/min, and with secondary air flow, 56 L/min (Figure 7), measured with flow meters 7 and 8 (Figure 4). The pressure measured for the transit of the pellet layer is almost 0.
The calculated speed of the air flow entering the pellet layer (through the sieve) was 0.28 m/s, and the speed of the combustion air flow was 4 m/s (Figure 8).
The flame temperature (Tfire, in red, Figure 9) achieved was 700 °C on average, the temperature of the pyrolytic front (Tpf, in green, Figure 9) was 500 °C, the duration of burning at the maximum value was 50 min (Figure 9), and 150 g of biochar resulted at the end of the test. An amount of 0.5 L of water evaporated from the water bowl throughout the test. The temperature in the water bowl reached 90 °C, not higher.

3.2. The Test with the 1/3 Ratio of Primary/Secondary Air Flow Rate—25/50 L/min

The equipment was supplied with primary air flow, 25 L/min, and with secondary air flow, 50 L/min (Figure 10), measured with flow meters 7 and 8 (Figure 4). The pressure measured for the transit of the pellet layer was almost 0.
The speed of the air flow entering the pellet layer (through the sieve) was 0.35 m/s, and the speed of the combustion air flow was 3.8 m/s (Figure 11).
The flame temperature achieved was 700 °C on average, the temperature of the pyrolytic front was 900 °C (Figure 12), the duration of burning at the maximum value was 35 min, and 208 g of biochar resulted at the end of the test. An amount of 0.75 L of water evaporated from the water bowl throughout the test.
It was found that for the ratio of 1/3 gasification/combustion air flow, the boiling temperature of water (100 °C) was obtained after 25 min from the start (Twater, in violet, Figure 12), compared to the ratio of 1/4 (Figure 9), where the water temperature did not exceed 90 °C throughout the duration of the test. Consequently, for this type of gasifier and this type of pellets, the recommended ratio is 1/3. In order to determine the optimal excess of combustion air flow, we carried out two more tests, keeping the gasification air flow rate at the value of 25 L/min in both tests. Throughout this time, the combustion air flow rate increased by 30% in the first test, namely to 65 L/min, and for the second test it increased by 50%, namely to 75 L/min.

3.2.1. The Test with the 1/3 Ratio and Excess Combustion Air Flow of 30% with Primary/Secondary Air Flow Rate of 25/65 L/min

The equipment was supplied with primary air flow, 25 L/min, and with secondary air flow, 65 L/min (Figure 13), measured with flow meters 7 and 8 (Figure 4). The pressure measured for the transit of the pellet layer is almost 0.
The speed of the air flow entering the pellet layer (through the sieve) was 0.35 m/s, and the speed of the combustion air flow was 5 m/s (Figure 14).
The flame temperature achieved was 800 °C on average, the temperature of the pyrolytic front was 900 °C at the first probe (Figure 15), the duration of burning at the maximum value was 40 min, and 128 g of biochar resulted at the end of the test. One liter of water evaporated from the water bowl throughout the test.

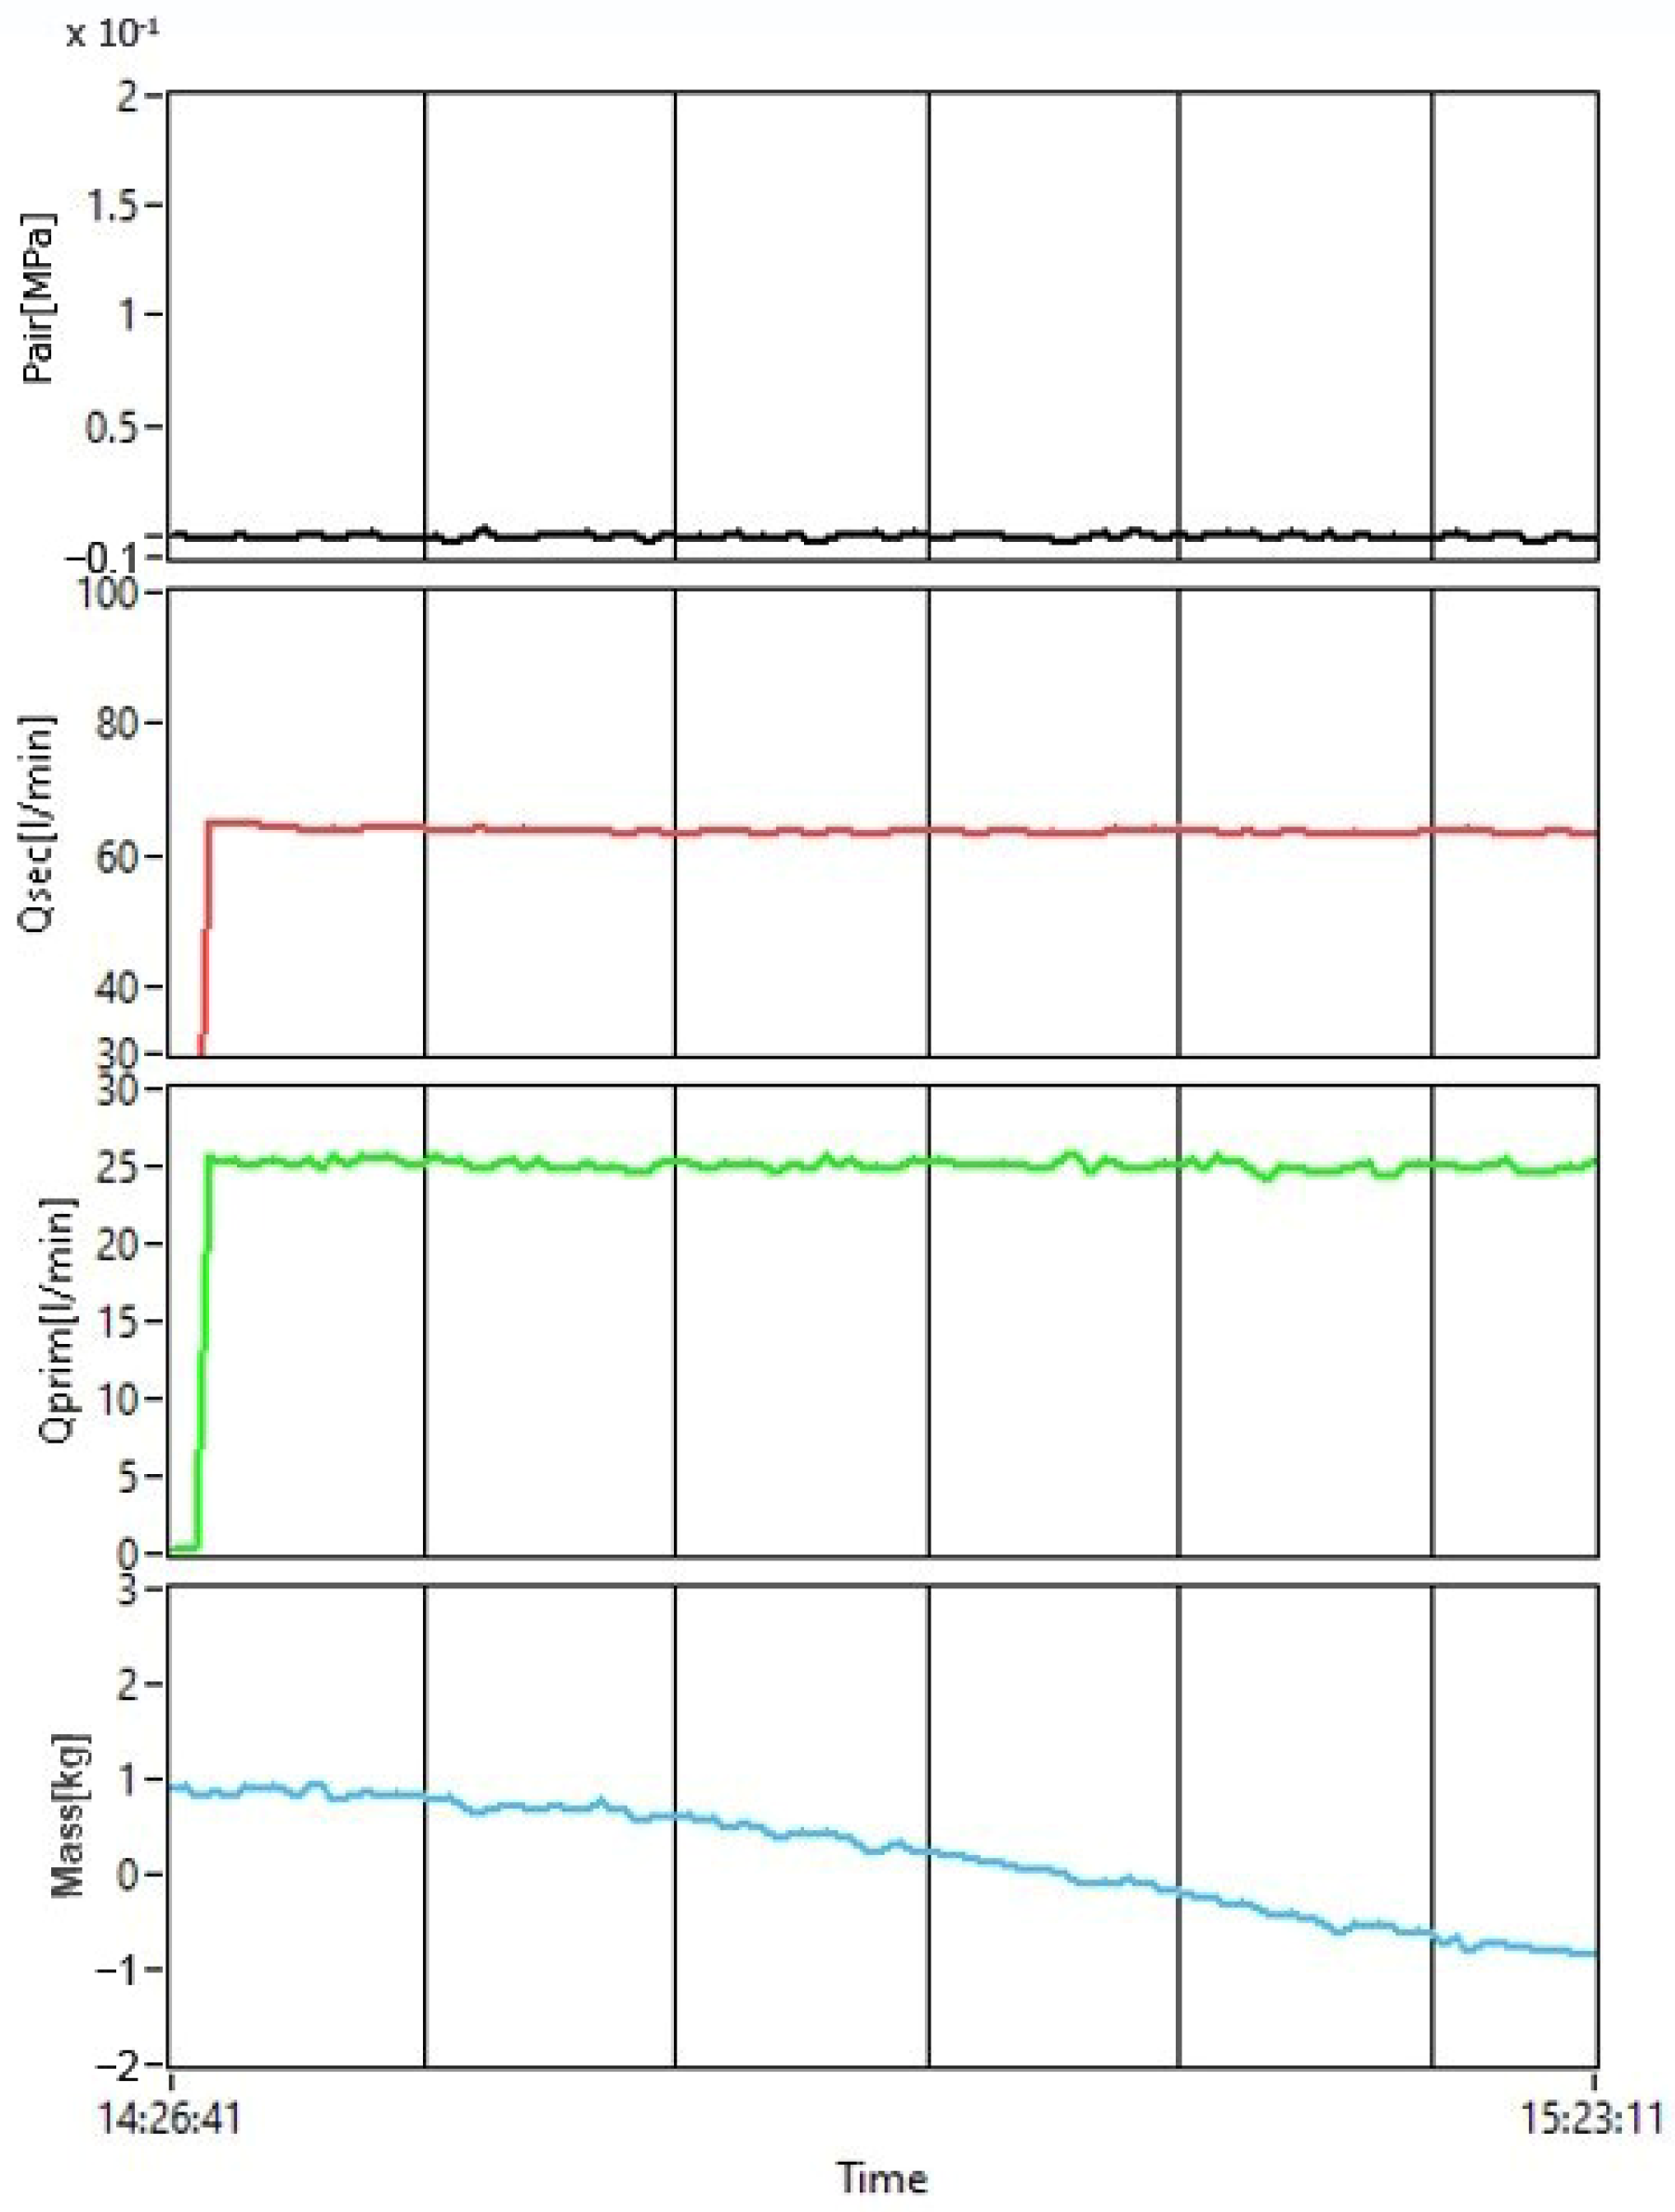
3.2.2. The Test with the 1/3 Ratio and Excess Combustion Air Flow of 50% with Primary/Secondary Air Flow Rate of 25/75 L/min

The equipment was supplied with primary air flow, 25 L/min, and with secondary air flow, 75 L/min (Figure 16), measured with flow meters 7 and 8 (Figure 4). The pressure measured for the transit of the pellet layer is almost 0.
The speed of the air flow entering the pellet layer (through the sieve) was 0.35 m/s, and the speed of the combustion air flow was 5.5 m/s (Figure 17).
The flame temperature achieved was 700 °C on average, the temperature of the pyrolytic front was 800 °C (Figure 18), the duration of burning at the maximum value was 40 min, and 134 g of biochar resulted at the end of the test. An amount of 0.8 L of water evaporated from the water bowl throughout the test.

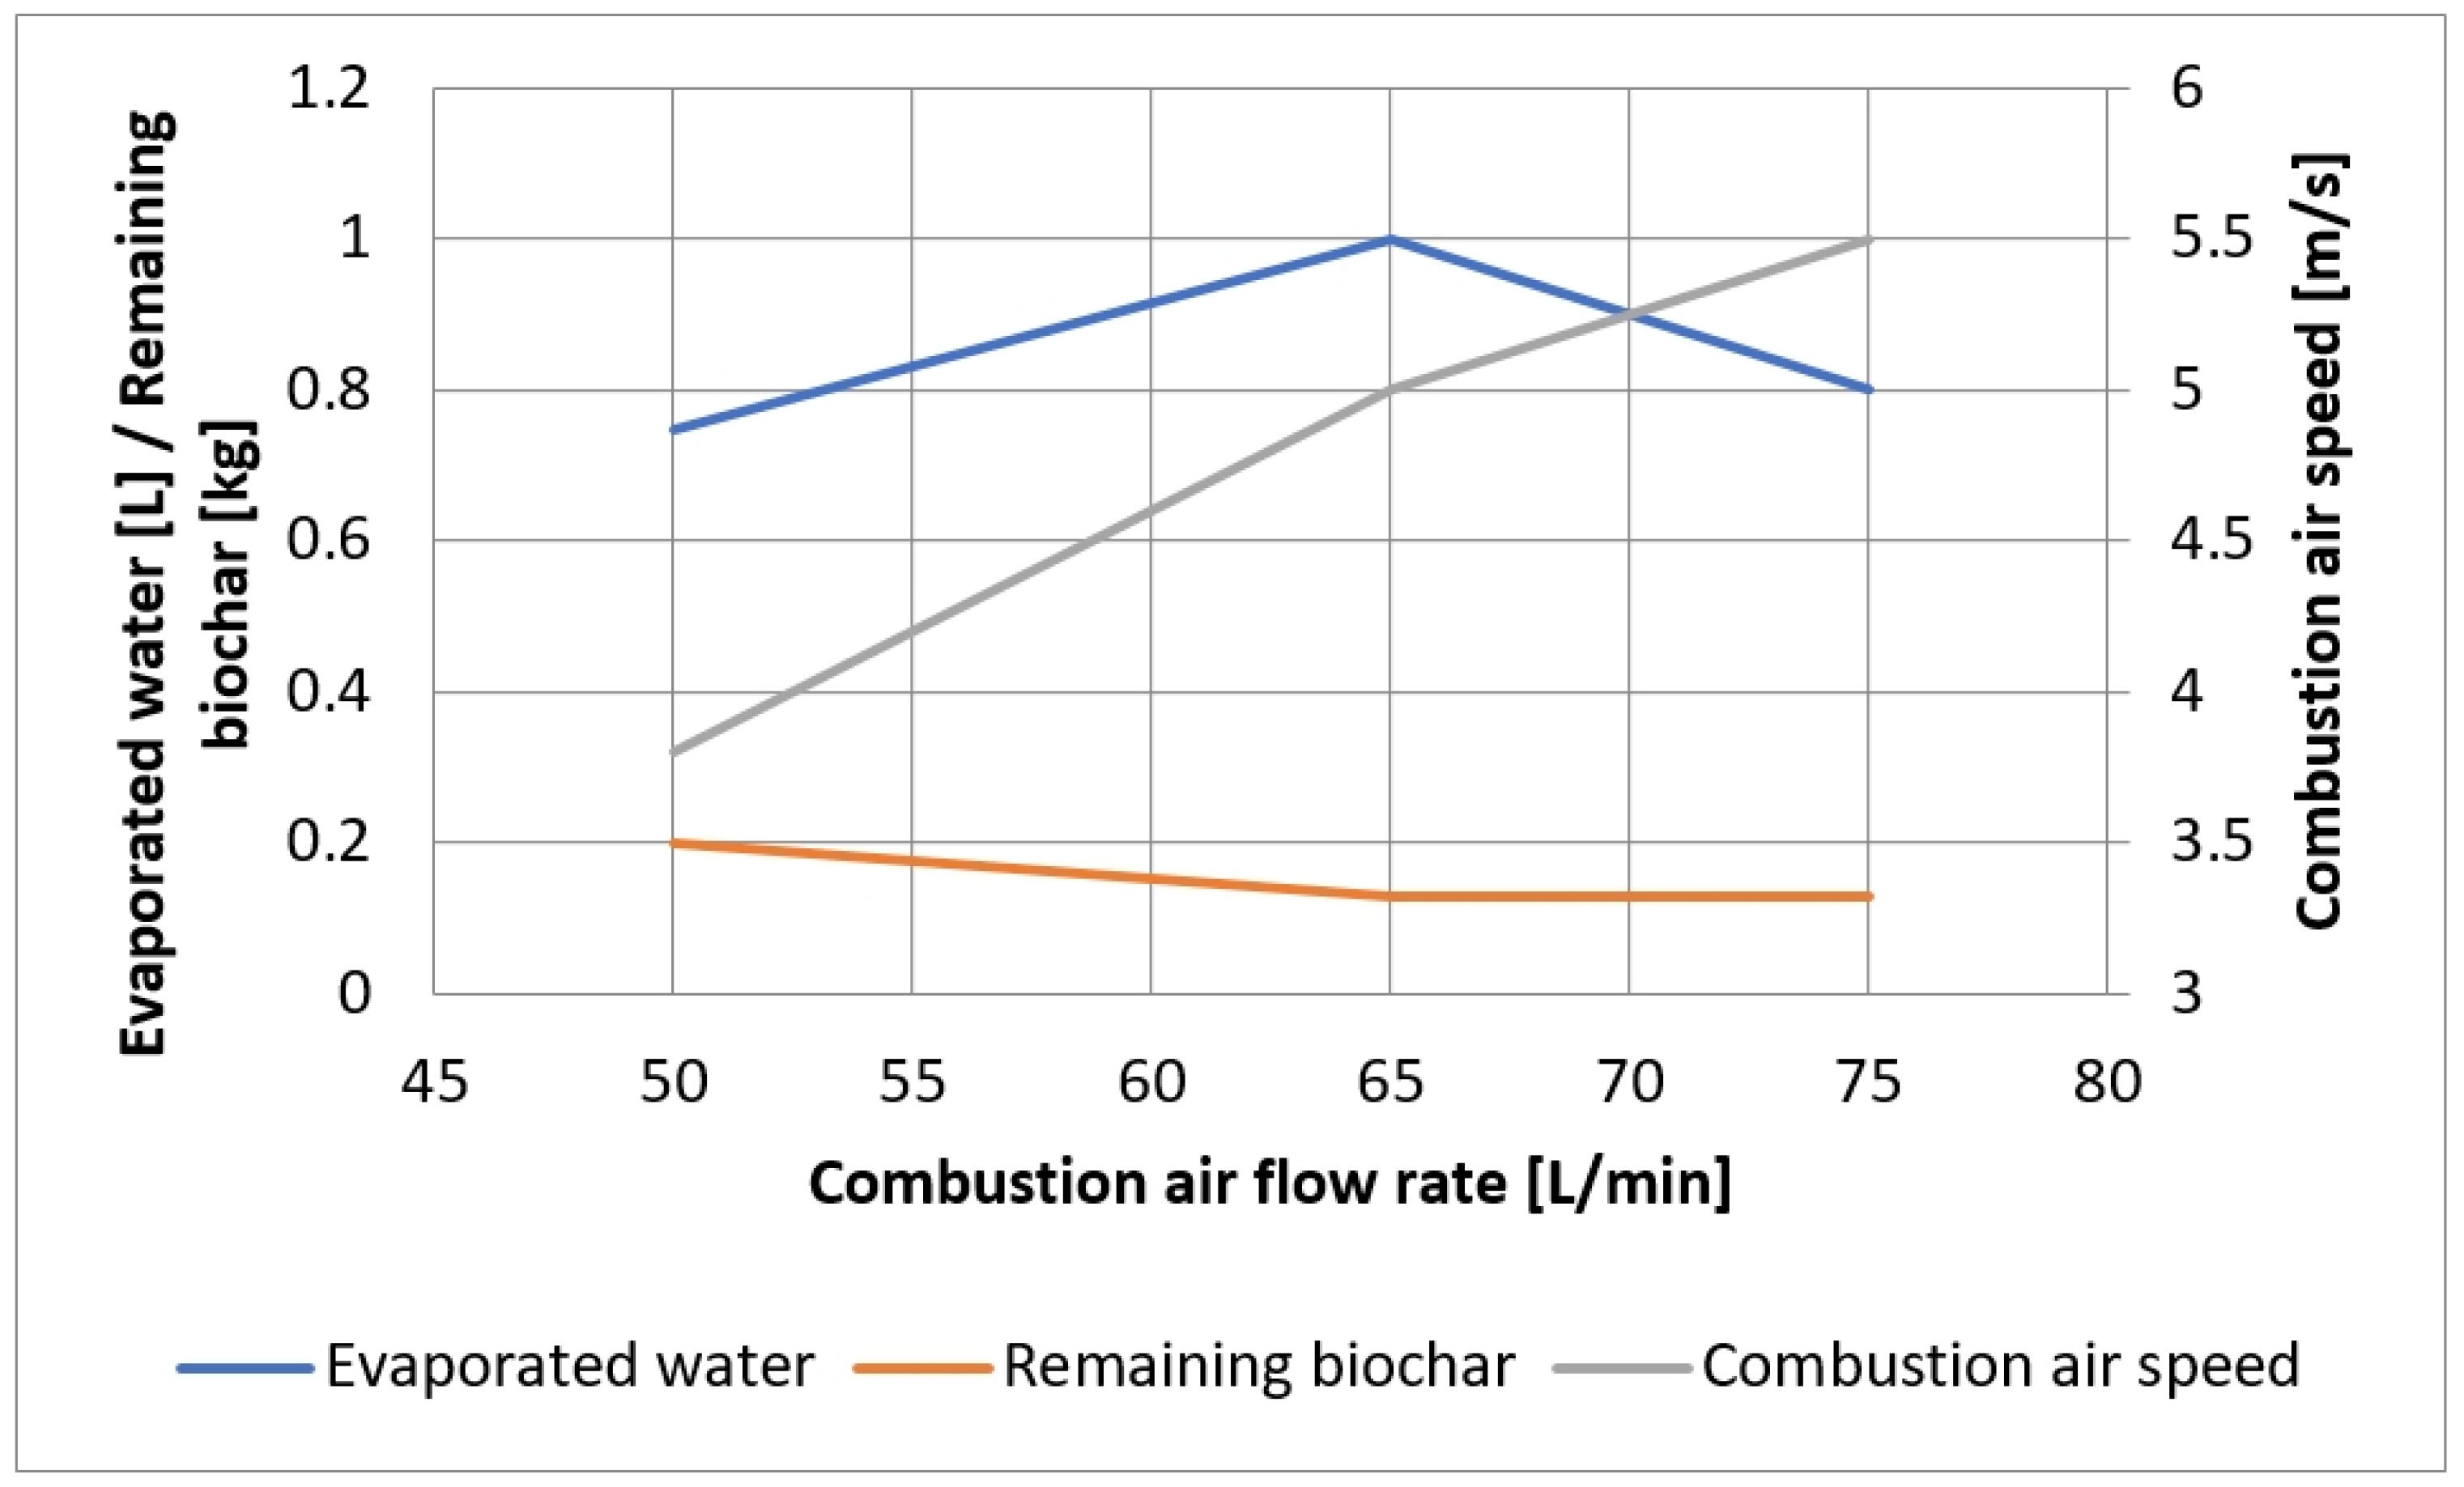
3.3. Interpretation of Results

Controlling the combustion process is aimed at obtaining maximum combustion efficiency and reducing the polluting effects as much as possible. The recommendations in the literature [3,22] regarding the primary/secondary air flow rate ratio of 1/3 or 1/4 are the basis of the research for determining the optimal real (not calculated) ratio for the maximum efficiency of this type of equipment.
The results achieved in the current research highlight the importance of accurately determining the amount of combustion air, including excess air.
From the results of the two tests regarding the excess of combustion air flow, it was found that in the variant of +30% secondary air with the ratio of 25/65 L/min, a flame temperature of 800 °C was achieved. When the excess combustion air flow was increased by 50% with the ratio of 25/75 L/min, a flame temperature of 700 °C was achieved.
The conclusion is that an excess of combustion air flow of up to 30% triggers an increase in the flame temperature by 100 °C compared to the initial version with a ratio of 1/3. On the other hand, increasing the excess combustion air flow by 50% cools the gases, and the flame temperature is 700 °C.
The results of the experimental research carried out are summarized in Table 1.
Variations in the stabilized burning time and flame temperature depending on the rate of combustion air flow are shown in Figure 19. One can notice that, for this version of test equipment, at the gasification air flow rate setting of 25 L/min, the optimum adjusted combustion air flow rate is 65 L/min.
Variations in the amount of evaporated water, the amount of biochar remaining at the end of the tests, and the combustion air speed depending on the rate of combustion air flow are shown in Figure 20. One can notice that for these parameters, too, the optimum combustion air flow adjustment rate is 65 L/min, as well.

4. Conclusions

The gasification and combustion performance of a TLUD gasifier operating with excess combustion air flow was studied experimentally strictly for the test device built and for the biomass used. Starting from the state of the art, presented in the literature of the field, tests were carried out with primary/secondary air flow rate ratios of 1/3 and 1/4. After determining the best ratio of the two previously mentioned parameters, the tests aimed to optimize the combustion process by excess secondary air flow of 30% or 50%, keeping the primary air flow rate constant at 25 L/min. The test results indicate a higher efficiency (flame temperature higher by 100 °C) when the combustion air flow is supplemented by 30%; hence, the excess combustion air flow improves the performance of the TLUD gasifier due to the increase in the combustion oxygen intake and the increase in the air speed (higher turbulence, better mixture) in the combustion zone of the syngas resulting from gasification. Increasing the excess combustion air flow rate by 50% has had the effect of lowering the flame temperature due to the cooling of the combustion gases caused by a too high rate of excess cold air flow.
Designers of TLUD gasifiers should take care with the way they correlate the dimensions of the gasifier with the gasification and combustion air flow rate requirements (including excess air flow rate), and with the sections of the air inlets, in order to obtain the best performance for these devices.
There is still a need for further studies and experiments on the efficiency of the combustion process through gasification on the TLUD principle, since the literature highlights its contribution to maintaining a cleaner environment and to the premises of sustainable development, which are objectives imposed by all development strategies.

Author Contributions

Conceptualization, I.P. and R.I.R.; methodology, G.M.; software, R.I.R.; validation, I.P., R.I.R. and G.M.; formal analysis, R.I.R., K.P. and A.-M.C.P.; investigation, I.P.; resources, K.P.; data curation, R.I.R. and A.-M.C.P.; writing—original draft preparation, A.-M.C.P., R.I.R. and K.P.; writing—review and editing, I.P. and G.M.; visualization, I.P.; supervision, G.M.; project administration, I.P.; funding acquisition, G.M. All authors have read and agreed to the published version of the manuscript.

Funding

This research was supported by a project funded by the Romanian Ministry of Research, Innovation and Digitalization through Programme 1—Development of the national research & development system, Sub-programme 1.2—Institutional performance—Projects financing the R&D&I excellence, Financial Agreement no. 18PFE/30.12.2021.

Data Availability Statement

The data presented in this article are available on request from the corresponding author. The data are not publicly available.

Acknowledgments

This work was carried out through the Core Program within the National Research Development and Innovation Plan 2022–2027, carried out with the support of MCID, project no. PN 23 05.

Conflicts of Interest

The authors declare no conflict of interest. The funder had no role in the design of the study; in the collection, analyses, or interpretation of data; in the writing of the manuscript; or in the decision to publish the results.

References

  1. Scholz, S.B.; Sembres, T.; Roberts, K.; Whitman, T.; Wilson, K.; Lehmann, J. Biochar Systems for Smallholders in Developing Countries: Leveraging Current Knowledge and Exploring Future Potential for Climate-Smart Agriculture; The World Bank: Washington, DC, USA, 2014. [Google Scholar] [CrossRef]
  2. Gitau, K.J.; Mutune, J.; Sundberg, C.; Mendum, R.; Njenga, M. Factors influencing the adoption of biochar-producing gasifier cookstoves by households in rural Kenya. Energy Sustain. Dev. 2019, 52, 63–71. [Google Scholar] [CrossRef]
  3. Tryner, J. Combustion Phenomena in Biomass Gasifier Cookstoves. Ph.D. Thesis, Colorado State University, Fort Collins, CO, USA, 2016. [Google Scholar]
  4. Toklu, E. Biomass energy potential and utilization in Turkey. Renew. Energy 2017, 107, 235–244. [Google Scholar] [CrossRef]
  5. Rabby, M.I.I.; Uddin, M.W.; Sheikh, M.R.; Bhuiyan, H.K.; Mumu, T.A.; Islam, F.; Sultana, A. Thermal performance of gasifier cooking stoves: A systematic literature review. F1000Research 2023, 12, 38. [Google Scholar] [CrossRef]
  6. Jetter, J.; Zhao, Y.; Smith, K.R.; Khan, B.; Yelverton, T.; DeCarlo, P.; Hays, M.D. Pollutant emissions and energy efficiency under controlled conditions for domestic biomass cookstoves and implications for metrics useful in setting international test standards. Environ. Sci. Technol. 2012, 46, 10827–10834. [Google Scholar] [CrossRef] [PubMed]
  7. Jetter, J.J.; Kariher, P. Solid-fuel household cook stoves: Characterization of performance and emissions. Biomass Bioenergy 2009, 33, 294–305. [Google Scholar] [CrossRef]
  8. MacCarty, N.; Still, D.; Ogle, D. Fuel use and emissions performance of fifty cooking stoves in the laboratory and related benchmarks of performance. Energy Sustain. Dev. 2010, 14, 161–171. [Google Scholar] [CrossRef]
  9. Roth, C. Micro-Gasification: Cooking with Gas from Dry Biomass. An Introduction to Concepts and Applications of Wood-Gas Burning Technologies for Cooking, 2nd ed.; Deutsche Gesellschaft für Internationale Zusammenarbeit (GIZ) GmbH: Eschborn, Germany, 2013. [Google Scholar]
  10. Tryner, J.; Tillotson, J.W.; Baumgardner, M.E.; Mohr, J.T.; Defoort, M.W.; Marchese, A.J. Effects of Air Flow Rates, Secondary Air Inlet Geometry, Fuel Type, and Mode of Operation on Gasifier Stove Performance. Environ. Sci. Technol. 2016, 50, 9754–9763. [Google Scholar] [CrossRef] [PubMed]
  11. Marchese, A.; DeFoort, M.; Gao, X.; Tryner, J.; Dryer, F.L.; Haas, F.; Lorenz, N. Achieving Tier 4 Emissions in Biomass Cookstoves; U.S. Department of Energy, Office of Scientific and Technical Information: Washington, DC, USA, 2018. [Google Scholar] [CrossRef]
  12. Saastamoinen, J.J.; Taipale, R.; Horttanainen, M.; Sarkomaa, P. Propagation of the ignition front in beds of wood particles. Combust. Flame 2000, 123, 214–226. [Google Scholar] [CrossRef]
  13. Matache, G.; Pavel, I.; Pantiru, A.; Ciciu, M. Increasing the efficiency of wood biomass gasification boilers. Hidraul. Mag. 2016, 70–76. [Google Scholar]
  14. Murad, E.; Dragomir, F. Heat generators with TLUD gasifier for generating energy from biomass with a negative balance of CO2. In Proceedings of the 20th International Conference of Hydraulics and Pneumatics HERVEX, Calimanesti-Caciulata, Romania, 7–9 November 2012; pp. 440–447. [Google Scholar]
  15. Murad, E.; Achim, G.; Rusănescu, C. Energetic and ecological valorization of the biomass of cuttings from orchards. In Proceedings of the ICEDIMPH-HORTING Session of Scientific Communications, Bucharest, Romania, 20 September 2012. [Google Scholar]
  16. Anderson, P.S.; Schoner, J.S. Origins, History, and Future of TLUD Micro-Gasification and Cookstove Advancement. Version 2.0. White Paper, February 2016. Available online: https://www.drtlud.com/wp-content/uploads/2016/02/TLUD-History-V2-17FEB2016.pdf (accessed on 8 February 2023).
  17. Varunkumar, S. Packed Bed Gasification-Combustion in Biomass Domestic Stove and Combustion Systems. Ph.D. Thesis, Indian Institute of Science, Bangalore, India, 17 February 2012. [Google Scholar]
  18. Sulaiman, S.A.; Romli, R. Combustion performance of cellulosic biomass in a gasifier-based cookstove. AIP Conf. Proc. 2012, 1440, 942. [Google Scholar] [CrossRef]
  19. ISO 17225-2:2014; Solid Biofuels—Fuel Specifications and Classes: Part 2: Graded Wood Pellets. International Organization for Standardization: London, UK, 2014.
  20. Bălan, M.; Mădărăşan, T. Combustion of fuels/Arderea combustibililor. In Notions of Thermotechnics/Notiuni de Termotehnica, Lecture Notes; Bălan, M., Ed.; Technical University of Cluj-Napoca: Cluj-Napoca, Romania, 2013; Available online: http://www.termo.utcluj.ro/termo/06ardere.pdf (accessed on 23 January 2023).
  21. Pavel, I.; Rădoi, R.; Matache, G.; Șovăială, G.; Popescu, A.-M. Eco-efficient combustion in the Top-Lit Updraft biomass gasification process. In Proceedings of the 22nd International Multidisciplinary Scientific GeoConference SGEM, Albena, Bulgaria, 2–11 July 2022. [Google Scholar]
  22. Pradana, Y.S.; Hartono, M.; Prasetya, A. Evaluation of household pyrolitic stove performance: Effect of bottom air apertures. Int. J. Adv. Sci. Eng. Inf. Technol. 2018, 8, 2005–2011. [Google Scholar] [CrossRef] [Green Version]
  23. Mukunda, H.S.; Dasappa, S.; Paul, P.J.; Rajan, N.K.S.; Yagnaraman, M.; Kumar, D.R.; Deogaonkar, M. Gasifier stoves—Science, technology and field outreach. Curr. Sci. 2010, 98, 627–638. [Google Scholar]
  24. Reed, T.B.; Anselmo, E.; Kircher, K. Testing & Modeling the Wood-Gas Turbo Stove. In Progress in Thermochemical Biomass Conversion; Bridgwater, A., Ed.; John Wiley & Sons: New York, NY, USA, 2008; pp. 693–704. ISBN 047069484X, 9780470694848. [Google Scholar]
  25. Pavel, I.; Chirita, A.P.; Matache, G.; Popescu, A.-M.; Caba, I. Combustion test equipment in low power TLUD gasifiers. In Proceedings of the ISB-INMA TEH’ 2021 International Symposium, Bucharest, Romania, 29 October 2021; pp. 632–641. [Google Scholar]
Figure 1. Functional diagram of the gasifier working on the Top-Lit Updraft (TLUD) principle [13].
Energies 16 01912 g001
Figure 2. Comparison of CO and PM emissions from various combustion technologies and systems [16].
Energies 16 01912 g002
Figure 3. Block diagram of the TLUD energy module [13].
Energies 16 01912 g003
Figure 4. Laboratory test device structure (1—gas generator; 2,3—temperature probes; 4—electric panel; 5— pneumatic throttles; 6—compressor; 7,8—air flow meters; 9—electronic scale; 10—pressure transducer. The same components—in their physical form—are shown in Figure 5b below).
Energies 16 01912 g004
Figure 5. Test device in our laboratory: (a) functional diagram; (b) physical embodiment (1—gasifier; 2—pyrolytic front temperature probes; 3—water and flame temperature probes; 4—electric panel; 5—pneumatic throttles; 6—compressor; 7—combustion air flowmeter; 8—pyrolysis air flowmeter; 9—electronic scale; 10—pressure transducer) [25].
Energies 16 01912 g005
Figure 6. Graphical interface developed in LabView.
Energies 16 01912 g006
Figure 7. Evolution of pressure, primary and secondary air flow rate, and pellet consumption during the test with primary/secondary air flow rate ratio of 19/56 L/min.
Energies 16 01912 g007
Figure 8. Evolution of primary and secondary air speed with a ratio of 1/4 and a flow rate of 19/56 L/min, during the test.
Energies 16 01912 g008
Figure 9. Evolution of temperatures acquired during the test with a ratio of 1/4 and a flow rate of 19/56 L/min.
Energies 16 01912 g009
Figure 10. Evolution of pressure, primary and secondary air flow rate, and pellet consumption during the test with primary/secondary air flow rate ratio of 25/50 L/min.
Energies 16 01912 g010
Figure 11. Evolution of primary and secondary air speed with a ratio of 1/3 and a flow rate of 25/50 L/min, during the test.
Energies 16 01912 g011
Figure 12. Evolution of temperatures acquired during the test with a ratio of 1/3 and a flow rate of 25/50 L/min.
Energies 16 01912 g012
Figure 13. Evolution of pressure, primary and secondary air flow rate, and pellet consumption during the test with primary/secondary air flow rate ratio of 25/65 L/min.
Energies 16 01912 g013
Figure 14. Evolution of primary and secondary air speed with a ratio of 1/3 and a flow rate of 25/65 L/min, during the test.
Energies 16 01912 g014
Figure 15. Evolution of temperatures acquired during the test with a ratio of 1/3 and an additional secondary flow rate (30%) of 25/65 L/min.
Energies 16 01912 g015
Figure 16. Evolution of pressure, primary and secondary air flow rate, and pellet consumption during the test with primary/secondary air flow rate ratio of 25/75 L/min.
Energies 16 01912 g016
Figure 17. Evolution of primary and secondary air speed with a ratio of 1/3 and a flow rate of 25/75 L/min, during the test.
Energies 16 01912 g017
Figure 18. Evolution of temperatures acquired during the test with a ratio of 1/3 and an additional secondary flow rate (50%) of 25/75 L/min.
Energies 16 01912 g018
Figure 19. Variation in the burning time and flame temperature depending on the combustion air flow rate.
Energies 16 01912 g019
Figure 20. Variations in the amount of evaporated water, amount of remaining biochar, and combustion air speed depending on the combustion air flow rate.
Energies 16 01912 g020
Table 1. Summarizing table of results.
Test No.Air Flow Rate
Ratio
Ignition Time (min)Burn Time at max. (min)Flame Temp. (°C)Pyrolytic Front Temp. (°C)Time to Boiling (min/°C)Evaporated Water (L)Remaining Biochar (g)Gasification/Combustion Air Speed (m/s)
11/4 (19/56)125065050025/850.51500.3/4
21/3 (25/50)1235700900/70025/1000.752000.3/3.8
3+30% (25/65)1240800950/70030/10011300.3/5
4+50% (25/75)124570080030/1000.81300.3/5.5
Disclaimer/Publisher’s Note: The statements, opinions and data contained in all publications are solely those of the individual author(s) and contributor(s) and not of MDPI and/or the editor(s). MDPI and/or the editor(s) disclaim responsibility for any injury to people or property resulting from any ideas, methods, instructions or products referred to in the content.

