

Experimental Study of Frost Crystals Dendrite Growth on Two Neighboring Separate Frozen Water Drops on a Cryogenic Cold Surface under Natural Convection Conditions


Abstract
:1. Introduction
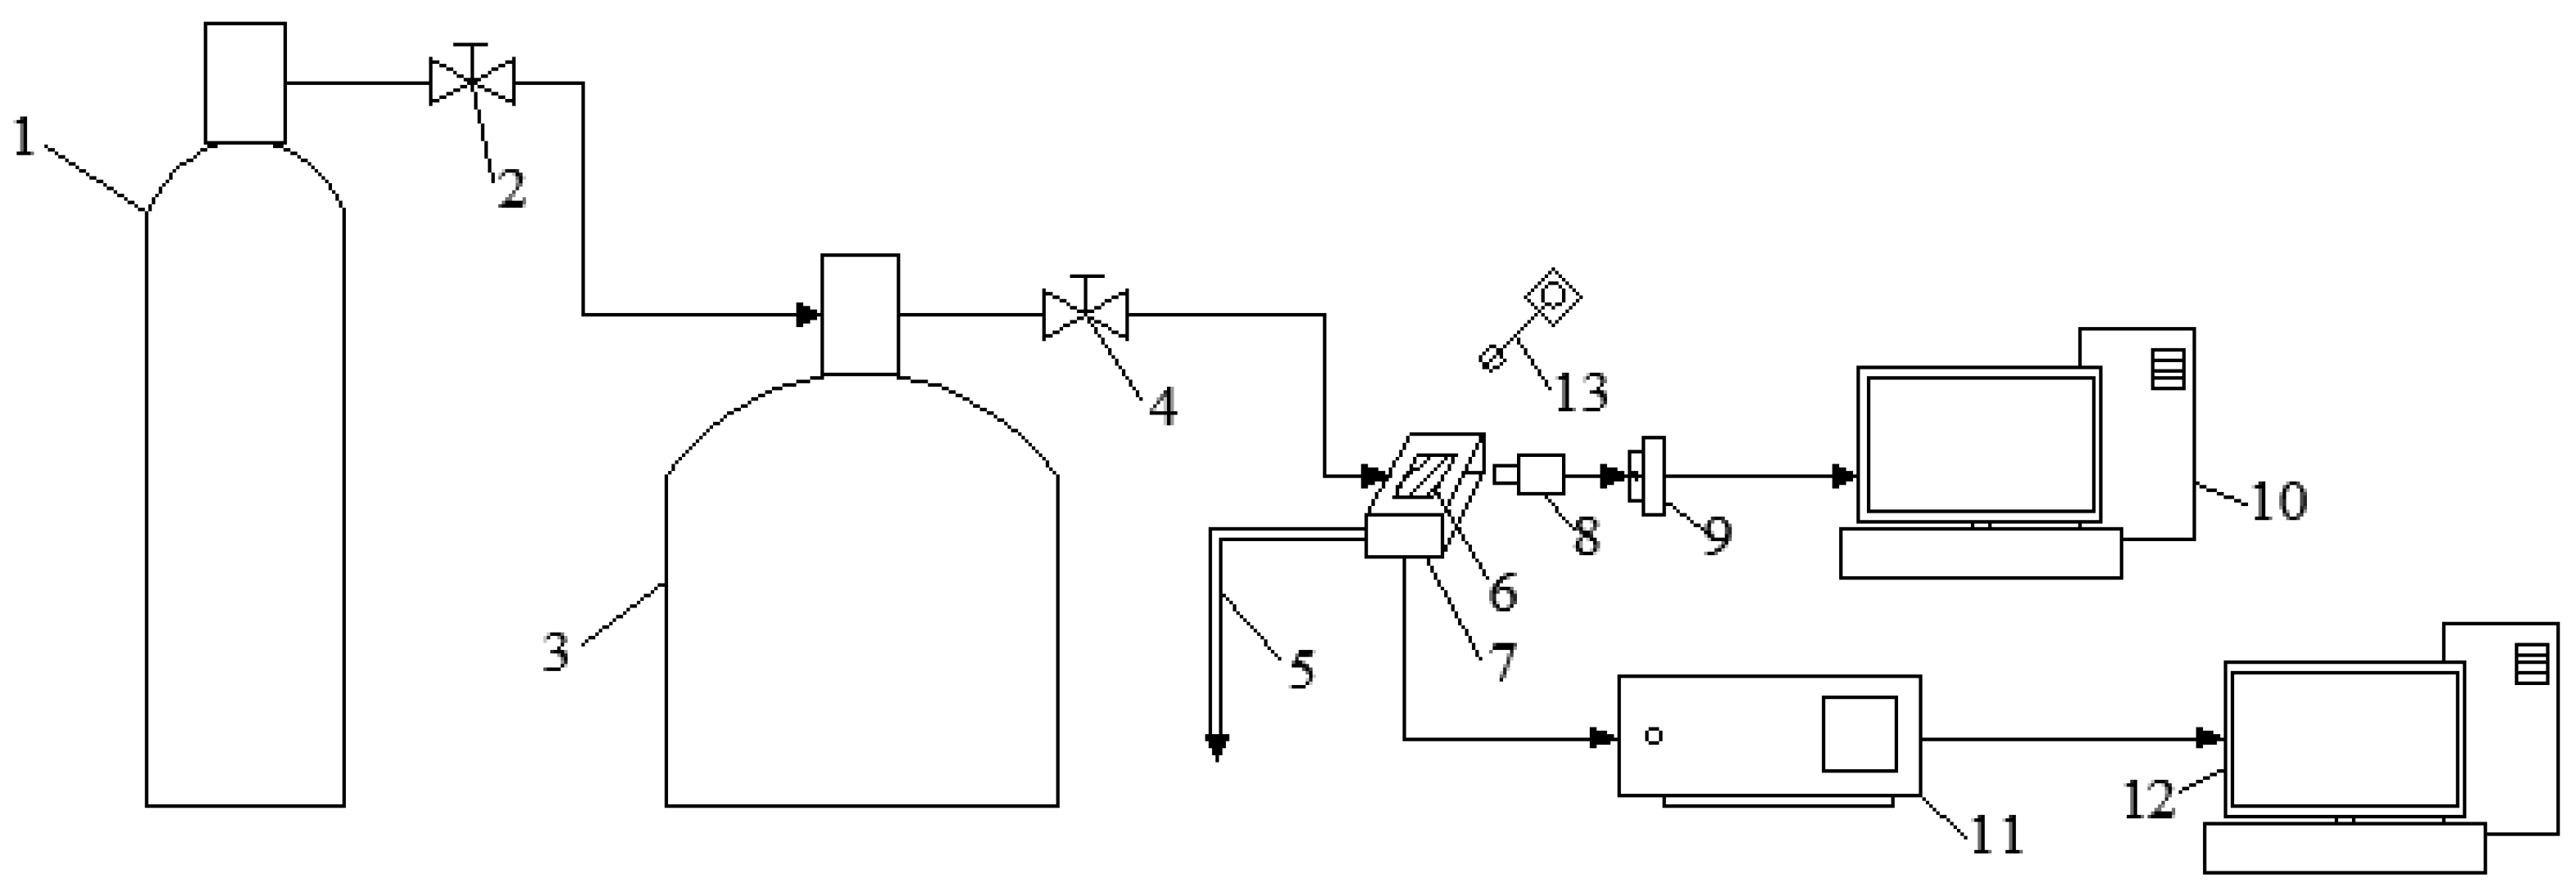
2. Experimental Apparatus and Methods
Experimental System and Method
3. Results and Discussions
3.1. Frost Formation Mechanisms
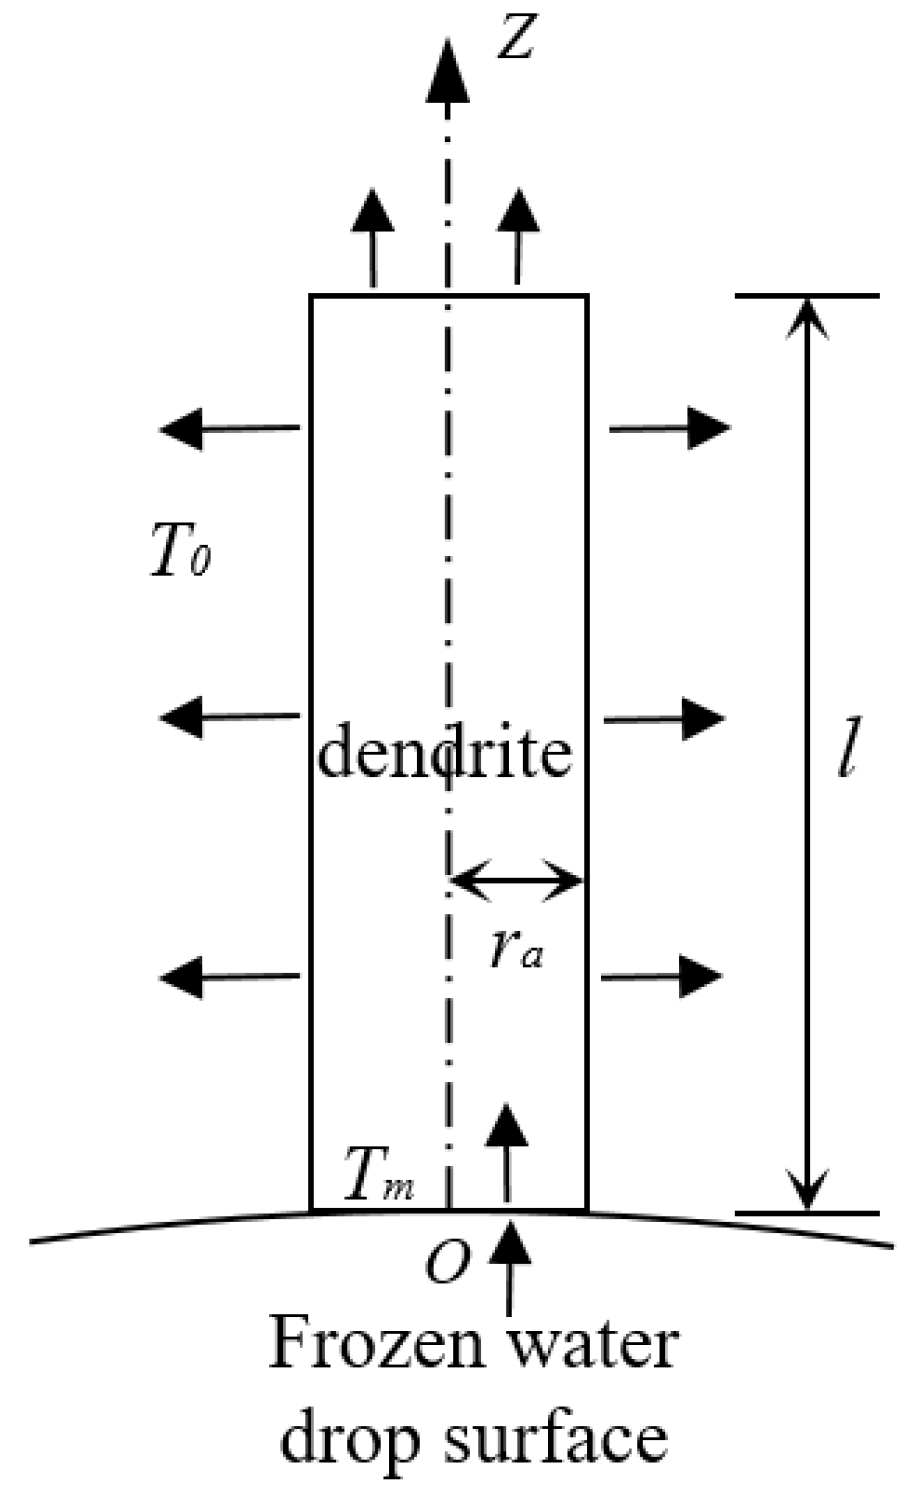
3.2. Dendrite Growth Control Equation
3.3. Frost Crystal Dendrite Growth
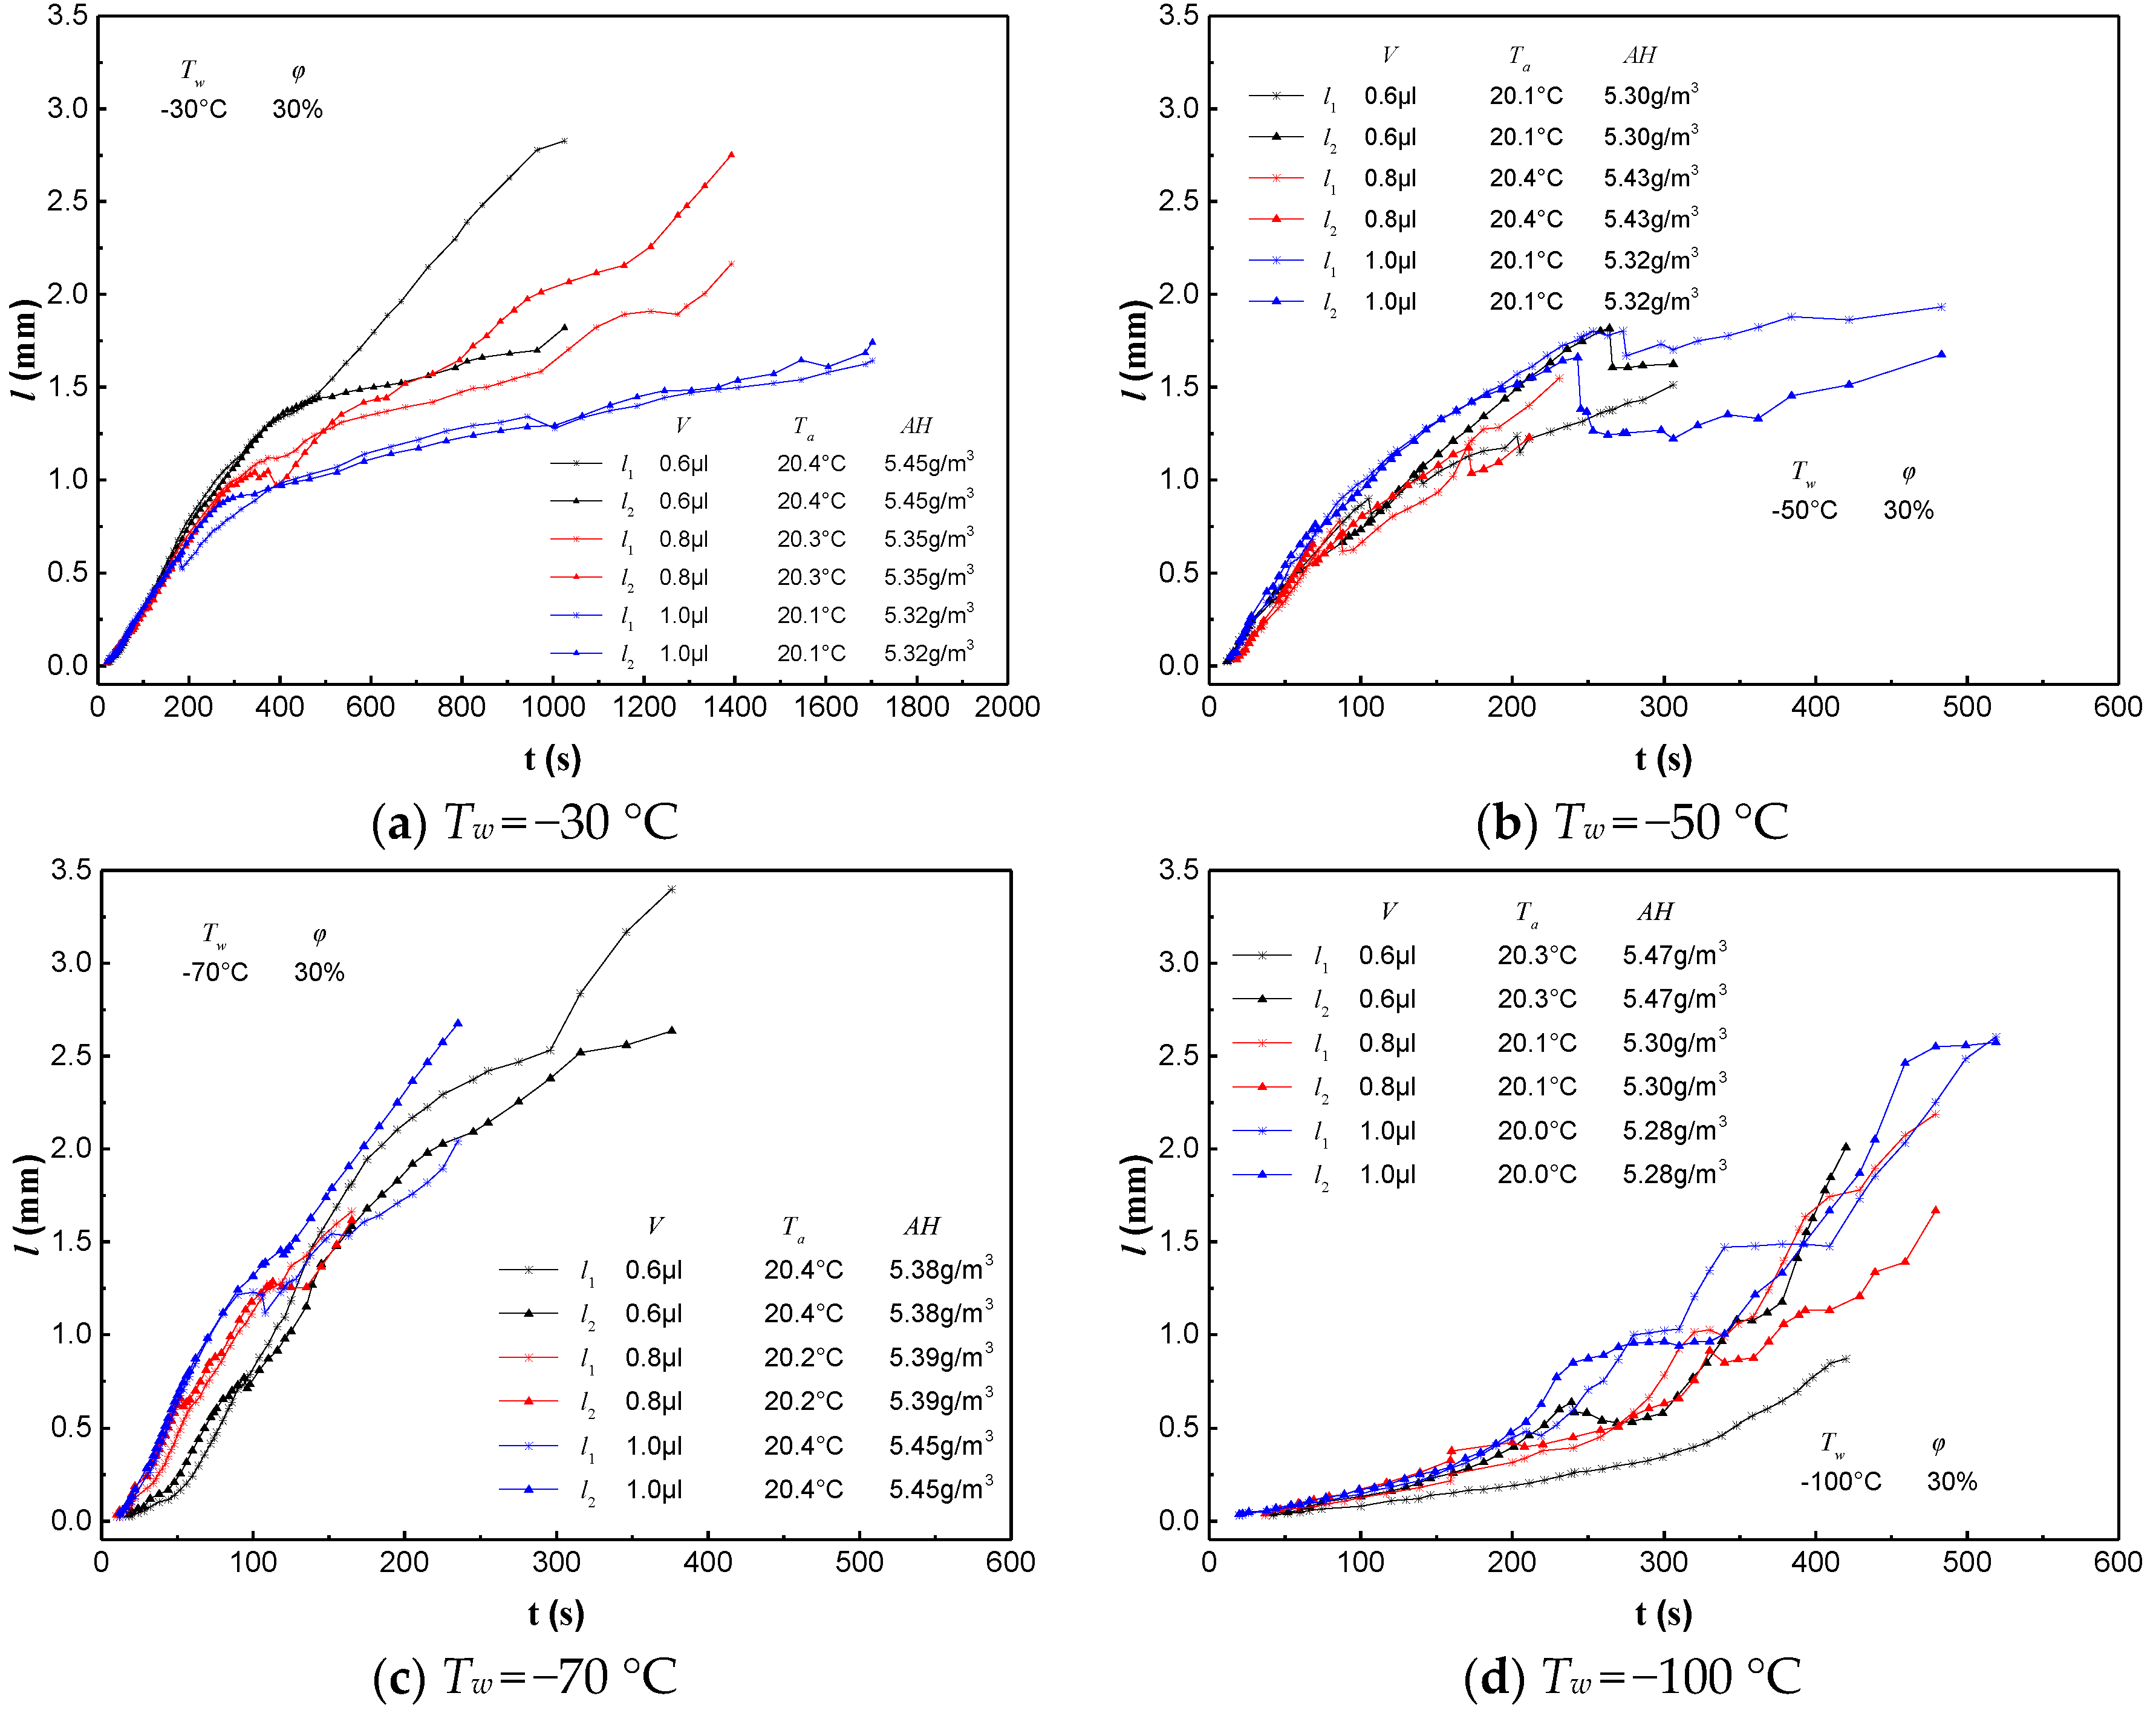
3.3.1. Influences of Cold Surface Temperature
3.3.2. Influences of Air Temperature
3.3.3. Influences of Air Humidity
3.4. Initial Frost Layer Thickness
4. Conclusions
Author Contributions
Funding
Data Availability Statement
Conflicts of Interest
Nomenclature
| Tw | Cold plate temperature, °C |
| Ta | Air temperature, °C |
| φ | Air relative humidity, % |
| A | Dendrite cross-sectional area, m2 |
| AH | Air absolute humidity, g/m3 |
| t | Time, s |
| ra | Dendrite radius, m |
| d | Dendrite diameter, m |
| m | Mass, kg |
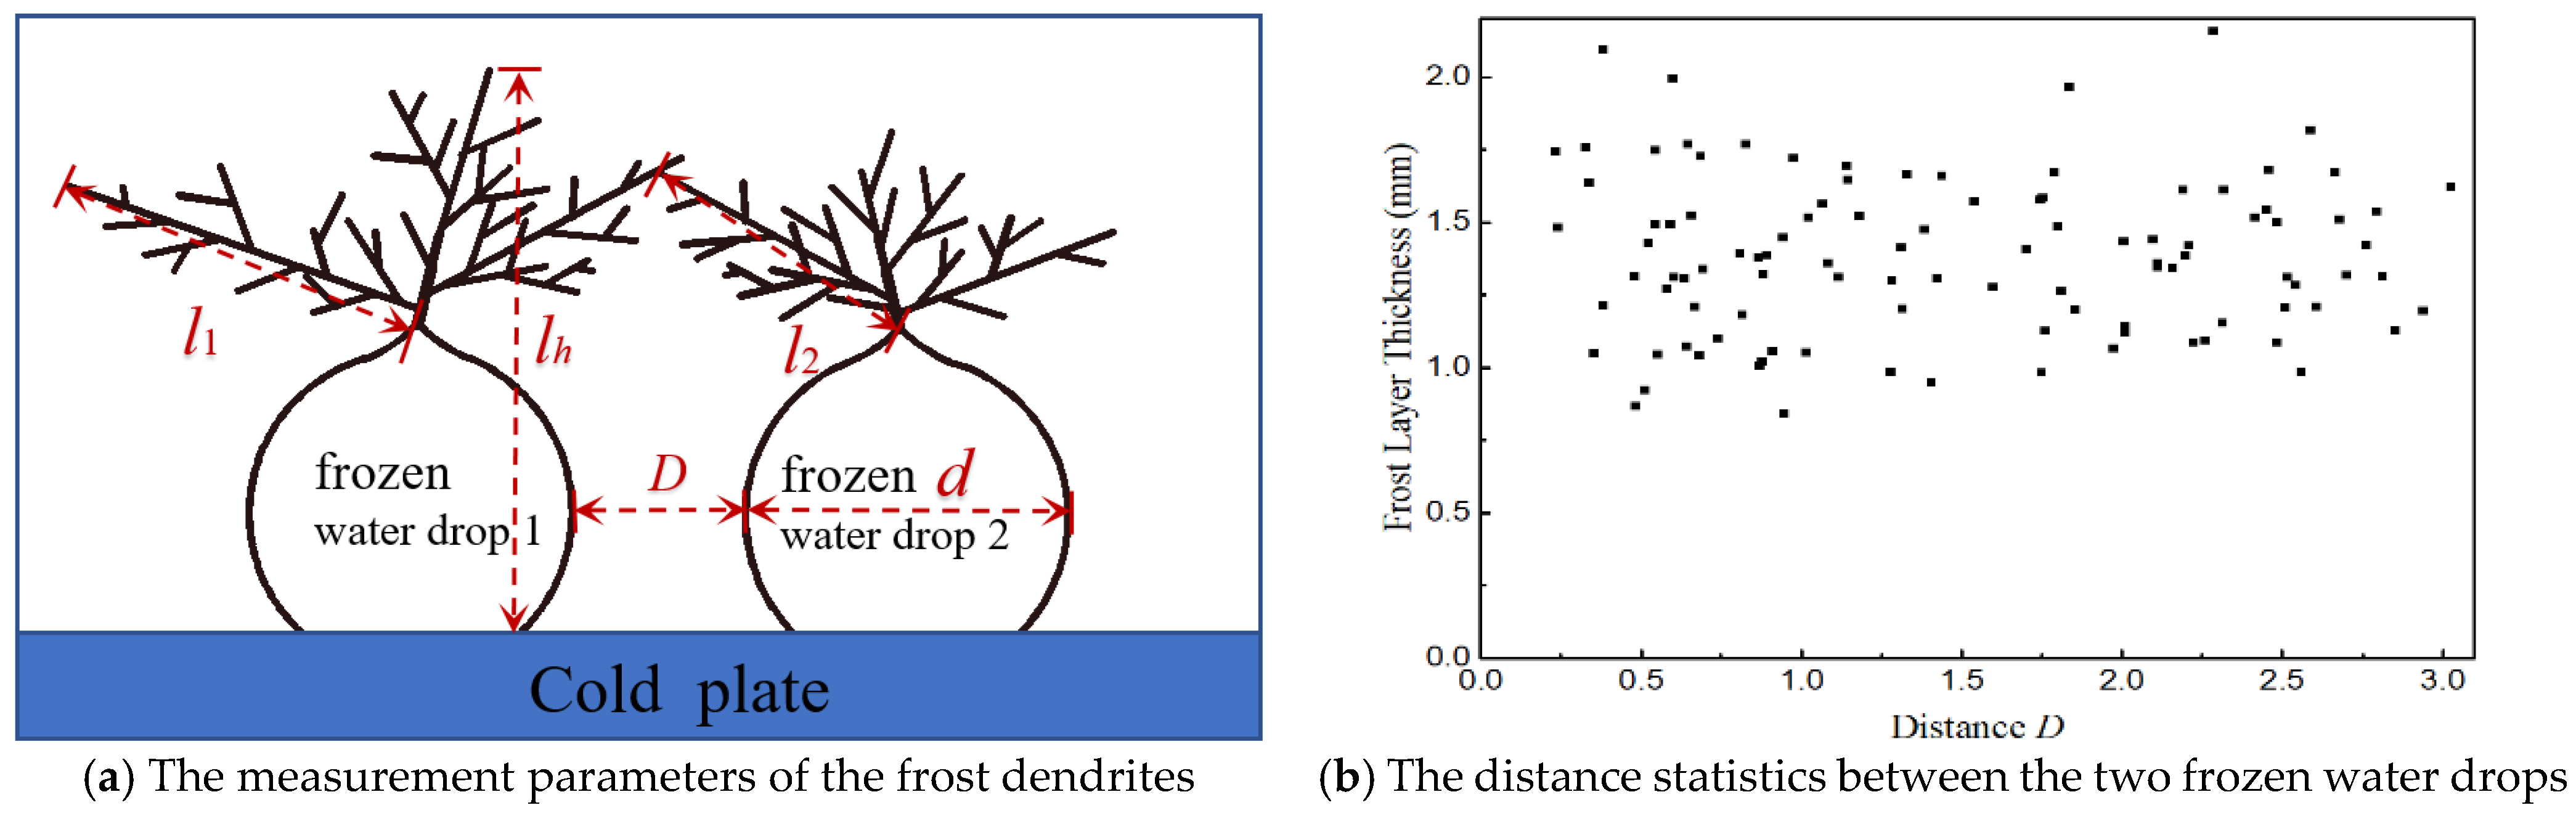
| D | Distance of two frozen water drops, m |
| l | Length of frost crystal dendrites |
| l1 | Longest dendrite on frozen water drop 1, mm |
| l2 | Longest dendrite on frozen water drop 2, mm |
| lh | Height of the frost crystal, mm |
| T0 | Air temperature, °C |
| Tm | Interfacial equilibrium temperature, °C |
| Ts | Temperature of solid phase, K |
| Tg | Temperature of gas phase, K |
| λs | Thermal conductivity of solid phase, W/(m·K) |
| λg | Thermal conductivity of gas phase, W/(m·K) |
| L | Latent heat of solidification, J/kg |
| ρs | Crystal density, kg/m³ |
| h | Convective heat transfer coefficient, W/(m2·K) |
| htip | Dendrite tip convection heat transfer, W/(m2·K) |
| δT | Boundary layer thickness, m |
References
- Hayashi, Y.; Aoki, A.; Adachi, S.; Hori, K. Study of Frost Properties Correlating with Frost Formation Types. J. Heat Transf. 1977, 99, 239–245. [Google Scholar] [CrossRef]
- Kuang, Y.; Yi, C.; Wang, W. Numerical simulation of frosting behavior and its effect on a direct-contact ambient air vaporizer. J. Nat. Gas Sci. Eng. 2015, 27, 55–63. [Google Scholar] [CrossRef]
- Zhang, T.; O’Neal, D.L.; Mcclain, S.T. Analysis of frost thickness and roughness growth from the perspective of frost crystal structure. Int. J. Refrig. 2020, 112, 314–323. [Google Scholar] [CrossRef]
- Kim, J.; Byun, S.; Lee, J.; Lee, K.-S. Frost growth behavior according to the cold surface inclination angle. Int. J. Heat Mass Transf. 2020, 146, 118841. [Google Scholar] [CrossRef]
- Liu, Z. Mathematical Model and Its Numerical Solution of Frost Formation on a Vertical Cold Plate under Natural Convection Conditions(D); Dalian Marine College: Dalian, China, 1984. (In Chinese) [Google Scholar]
- Jones, B.W.; Parker, J.D. Frost Formation with Varying Environmental Parameters. J. Heat Transf. 1975, 97, 255–259. [Google Scholar] [CrossRef]
- Tso, C.P.; Cheng, Y.C.; Lai, A.C.K. An improved model for predicting performance of finned tube heat exchanger under frosting condition, with frost thickness variation along fin. Appl. Therm. Eng. 2006, 26, 111–120. [Google Scholar] [CrossRef]
- Kim, D.; Kim, C.; Lee, K.-S. Frosting model for predicting macroscopic and local frost behaviors on a cold plate. Int. J. Heat Mass Transf. 2015, 82, 135–142. [Google Scholar] [CrossRef]
- Lenic, K.; Trp, A.; Frankovic, B. Transient two-dimensional model of frost formation on a fin-and-tube heat exchanger. Int. J. Heat Mass Transf. 2009, 52, 22–32. [Google Scholar] [CrossRef]
- Brèque, F.; Nemer, M. Frosting modeling on a cold flat plate: Comparison of the different assumptions and impacts on frost growth predictions. Int. J. Refrig. 2016, 69, 340–360. [Google Scholar] [CrossRef]
- Chen, G.; Deng, X.; Zhang, G.; Yan, X. Simulation of frost growth and densification on horizontal plates with supersaturated interface condition. Int. J. Heat Mass Transf. 2019, 133, 426–434. [Google Scholar] [CrossRef]
- Lee, K.-S.; Jhee, S.; Yang, D.-K. Prediction of the frost formation on a cold flat surface. Int. J. Heat Mass Transf. 2003, 46, 3789–3796. [Google Scholar] [CrossRef]
- Byun, S.; Jeong, H.; Kim, D.R.; Lee, K.-S. Frost modeling under cryogenic conditions. Int. J. Heat Mass Transf. 2020, 161, 120250. [Google Scholar] [CrossRef]
- Hermes, C.J.; Piucco, R.O.; Barbosa, J.R.; Melo, C. A study of frost growth and densification on flat surfaces. Exp. Therm. Fluid Sci. 2009, 33, 371–379. [Google Scholar] [CrossRef]
- Lee, J.; Lee, K.-S. The behavior of frost layer growth under conditions favorable for desublimation. Int. J. Heat Mass Transf. 2018, 120, 259–266. [Google Scholar] [CrossRef]
- Jeong, H.; Byun, S.; Kim, D.R.; Lee, K.S. Frost growth mechanism and its behavior under ultra-low temperature conditions. Int. J. Heat Mass Transf. 2021, 169, 120941. [Google Scholar] [CrossRef]
- Lee, J.; Jeong, H.; Kim, D.R.; Lee, K.-S. Frost layer growth behavior under cryogenic conditions. Appl. Therm. Eng. 2019, 163, 114333. [Google Scholar] [CrossRef]
- Liu, Z.; Gou, Y.; Wang, J.; Cheng, S. Frost formation on a super-hydrophobic surface under natural convection conditions. Int. J. Heat Mass Transf. 2008, 51, 5975–5982. [Google Scholar] [CrossRef]
- Liu, Z.; Zhang, X.; Wang, H.; Meng, S.; Cheng, S. Influences of surface hydrophilicity on frost formation on a vertical cold plate under natural convection conditions. Exp. Therm. Fluid Sci. 2007, 31, 789–794. [Google Scholar] [CrossRef]
- Nath, S.; Ahmadi, S.F.; Boreyko, J.B. A review of condensation frosting. Nanoscale Microscale Thermophys. Eng. 2017, 21, 81–101. [Google Scholar] [CrossRef]
- Kim, D.; Kim, H.; Kim, S.W.; Kim, D.R.; Lee, K.-S. Experimental investigation of frost retardation for superhydrophobic surface using a luminance meter. Int. J. Heat Mass Transf. 2015, 87, 491–496. [Google Scholar] [CrossRef]
- Liu, Z.; Dong, Y.; Li, Y. An experimental study of frost formation on cryogenic surfaces under natural convection conditions. Int. J. Heat Mass Transf. 2016, 97, 569–577. [Google Scholar] [CrossRef]
- Li, L.; Liu, Z.; Li, Y.; Dong, Y. Frost deposition on a horizontal cryogenic surface in free convection. Int. J. Heat Mass Transf. 2017, 113, 166–175. [Google Scholar] [CrossRef]
- Song, M.; Dang, C. Review on the measurement and calculation of frost characteristics. Int. J. Heat Mass Transf. 2018, 124, 586–614. [Google Scholar] [CrossRef]
- Yu, F.; Liu, Z.; Li, Y.; Chen, Y.; Li, Y. Experimental study of frost crystal dendrite growth on a cryogenic cold surface under natural convection conditions. Int. J. Refrig. 2022, 144, 305–315. [Google Scholar] [CrossRef]
- Holten, D.C. A Study of Heat and Mass Transfer to Uninsulated Liquid Oxygen Containers. In Advances in Cryogenic Engineering; Springer: Boston, MA, USA, 1961; pp. 499–508. [Google Scholar]
- Min, N. Physical Foundation for Crystal Growth; Shanghai Science and Technology Press: Shanghai, China, 1982. (In Chinese) [Google Scholar]
- Anderson, D.; Worster, M.; Davis, S. The case for a dynamic contact angle in containerless solidification. J. Cryst. Growth 1996, 163, 329–338. [Google Scholar] [CrossRef]


| Wet Air State | V, μL | TW | |||||
|---|---|---|---|---|---|---|---|
| −30 °C | −50 °C | −70 °C | −100 °C | −130 °C | −165 °C | ||
| φ = 30% Ta = 15 °C | 0.6 | 2.848 | 2.243 | 1.972 | 2.988 | 2.706 | 2.393 |
| 0.8 | 2.353 | 2.380 | 2.390 | 2.166 | 2.117 | 2.176 | |
| 1.0 | 2.637 | 2.360 | 2.446 | 2.353 | 2.452 | 3.131 | |
| φ = 30% Ta = 20 °C | 0.6 | 2.546 | 2.453 | 2.916 | 2.129 | 1.813 | 1.756 |
| 0.8 | 2.909 | 2.253 | 2.538 | 2.901 | 2.477 | 2.816 | |
| 1.0 | 2.739 | 2.993 | 2.878 | 2.469 | 2.237 | 2.549 | |
| φ = 30% Ta = 25 °C | 0.6 | 2.242 | 1.902 | 2.330 | 2.390 | 1.837 | 2.162 |
| 0.8 | 2.276 | 2.262 | 2.412 | 2.133 | 2.045 | 1.818 | |
| 1.0 | 2.544 | 2.452 | 2.874 | 2.310 | 2.908 | 2.629 | |
| φ = 50% Ta = 20 °C | 0.6 | 2.056 | 2.093 | 2.099 | 2.424 | 2.402 | 2.919 |
| 0.8 | 2.458 | 2.406 | 2.339 | 2.370 | 2.059 | 2.923 | |
| 1.0 | 2.296 | 2.156 | 2.760 | 2.339 | 2.991 | 2.581 | |
| φ = 70% Ta = 20 °C | 0.6 | 1.892 | 2.137 | 2.413 | 2.164 | 1.922 | 2.123 |
| 0.8 | 2.679 | 2.361 | 2.289 | 2.704 | 2.303 | 2.147 | |
| 1.0 | 2.779 | 2.386 | 2.655 | 2.793 | 2.384 | 2.228 | |
Disclaimer/Publisher’s Note: The statements, opinions and data contained in all publications are solely those of the individual author(s) and contributor(s) and not of MDPI and/or the editor(s). MDPI and/or the editor(s) disclaim responsibility for any injury to people or property resulting from any ideas, methods, instructions or products referred to in the content. |
© 2023 by the authors. Licensee MDPI, Basel, Switzerland. This article is an open access article distributed under the terms and conditions of the Creative Commons Attribution (CC BY) license (https://creativecommons.org/licenses/by/4.0/).
Share and Cite
Yu, F.; Liu, Z.; Li, Y.; Chen, Y.; Li, Y. Experimental Study of Frost Crystals Dendrite Growth on Two Neighboring Separate Frozen Water Drops on a Cryogenic Cold Surface under Natural Convection Conditions. Energies 2023, 16, 1861. https://doi.org/10.3390/en16041861
Yu F, Liu Z, Li Y, Chen Y, Li Y. Experimental Study of Frost Crystals Dendrite Growth on Two Neighboring Separate Frozen Water Drops on a Cryogenic Cold Surface under Natural Convection Conditions. Energies. 2023; 16(4):1861. https://doi.org/10.3390/en16041861
Chicago/Turabian StyleYu, Fengjiao, Zhongliang Liu, Yanxia Li, Yanling Chen, and Yi Li. 2023. "Experimental Study of Frost Crystals Dendrite Growth on Two Neighboring Separate Frozen Water Drops on a Cryogenic Cold Surface under Natural Convection Conditions" Energies 16, no. 4: 1861. https://doi.org/10.3390/en16041861