

A Survey on the Application of Machine Learning in Turbulent Flow Simulations


Abstract
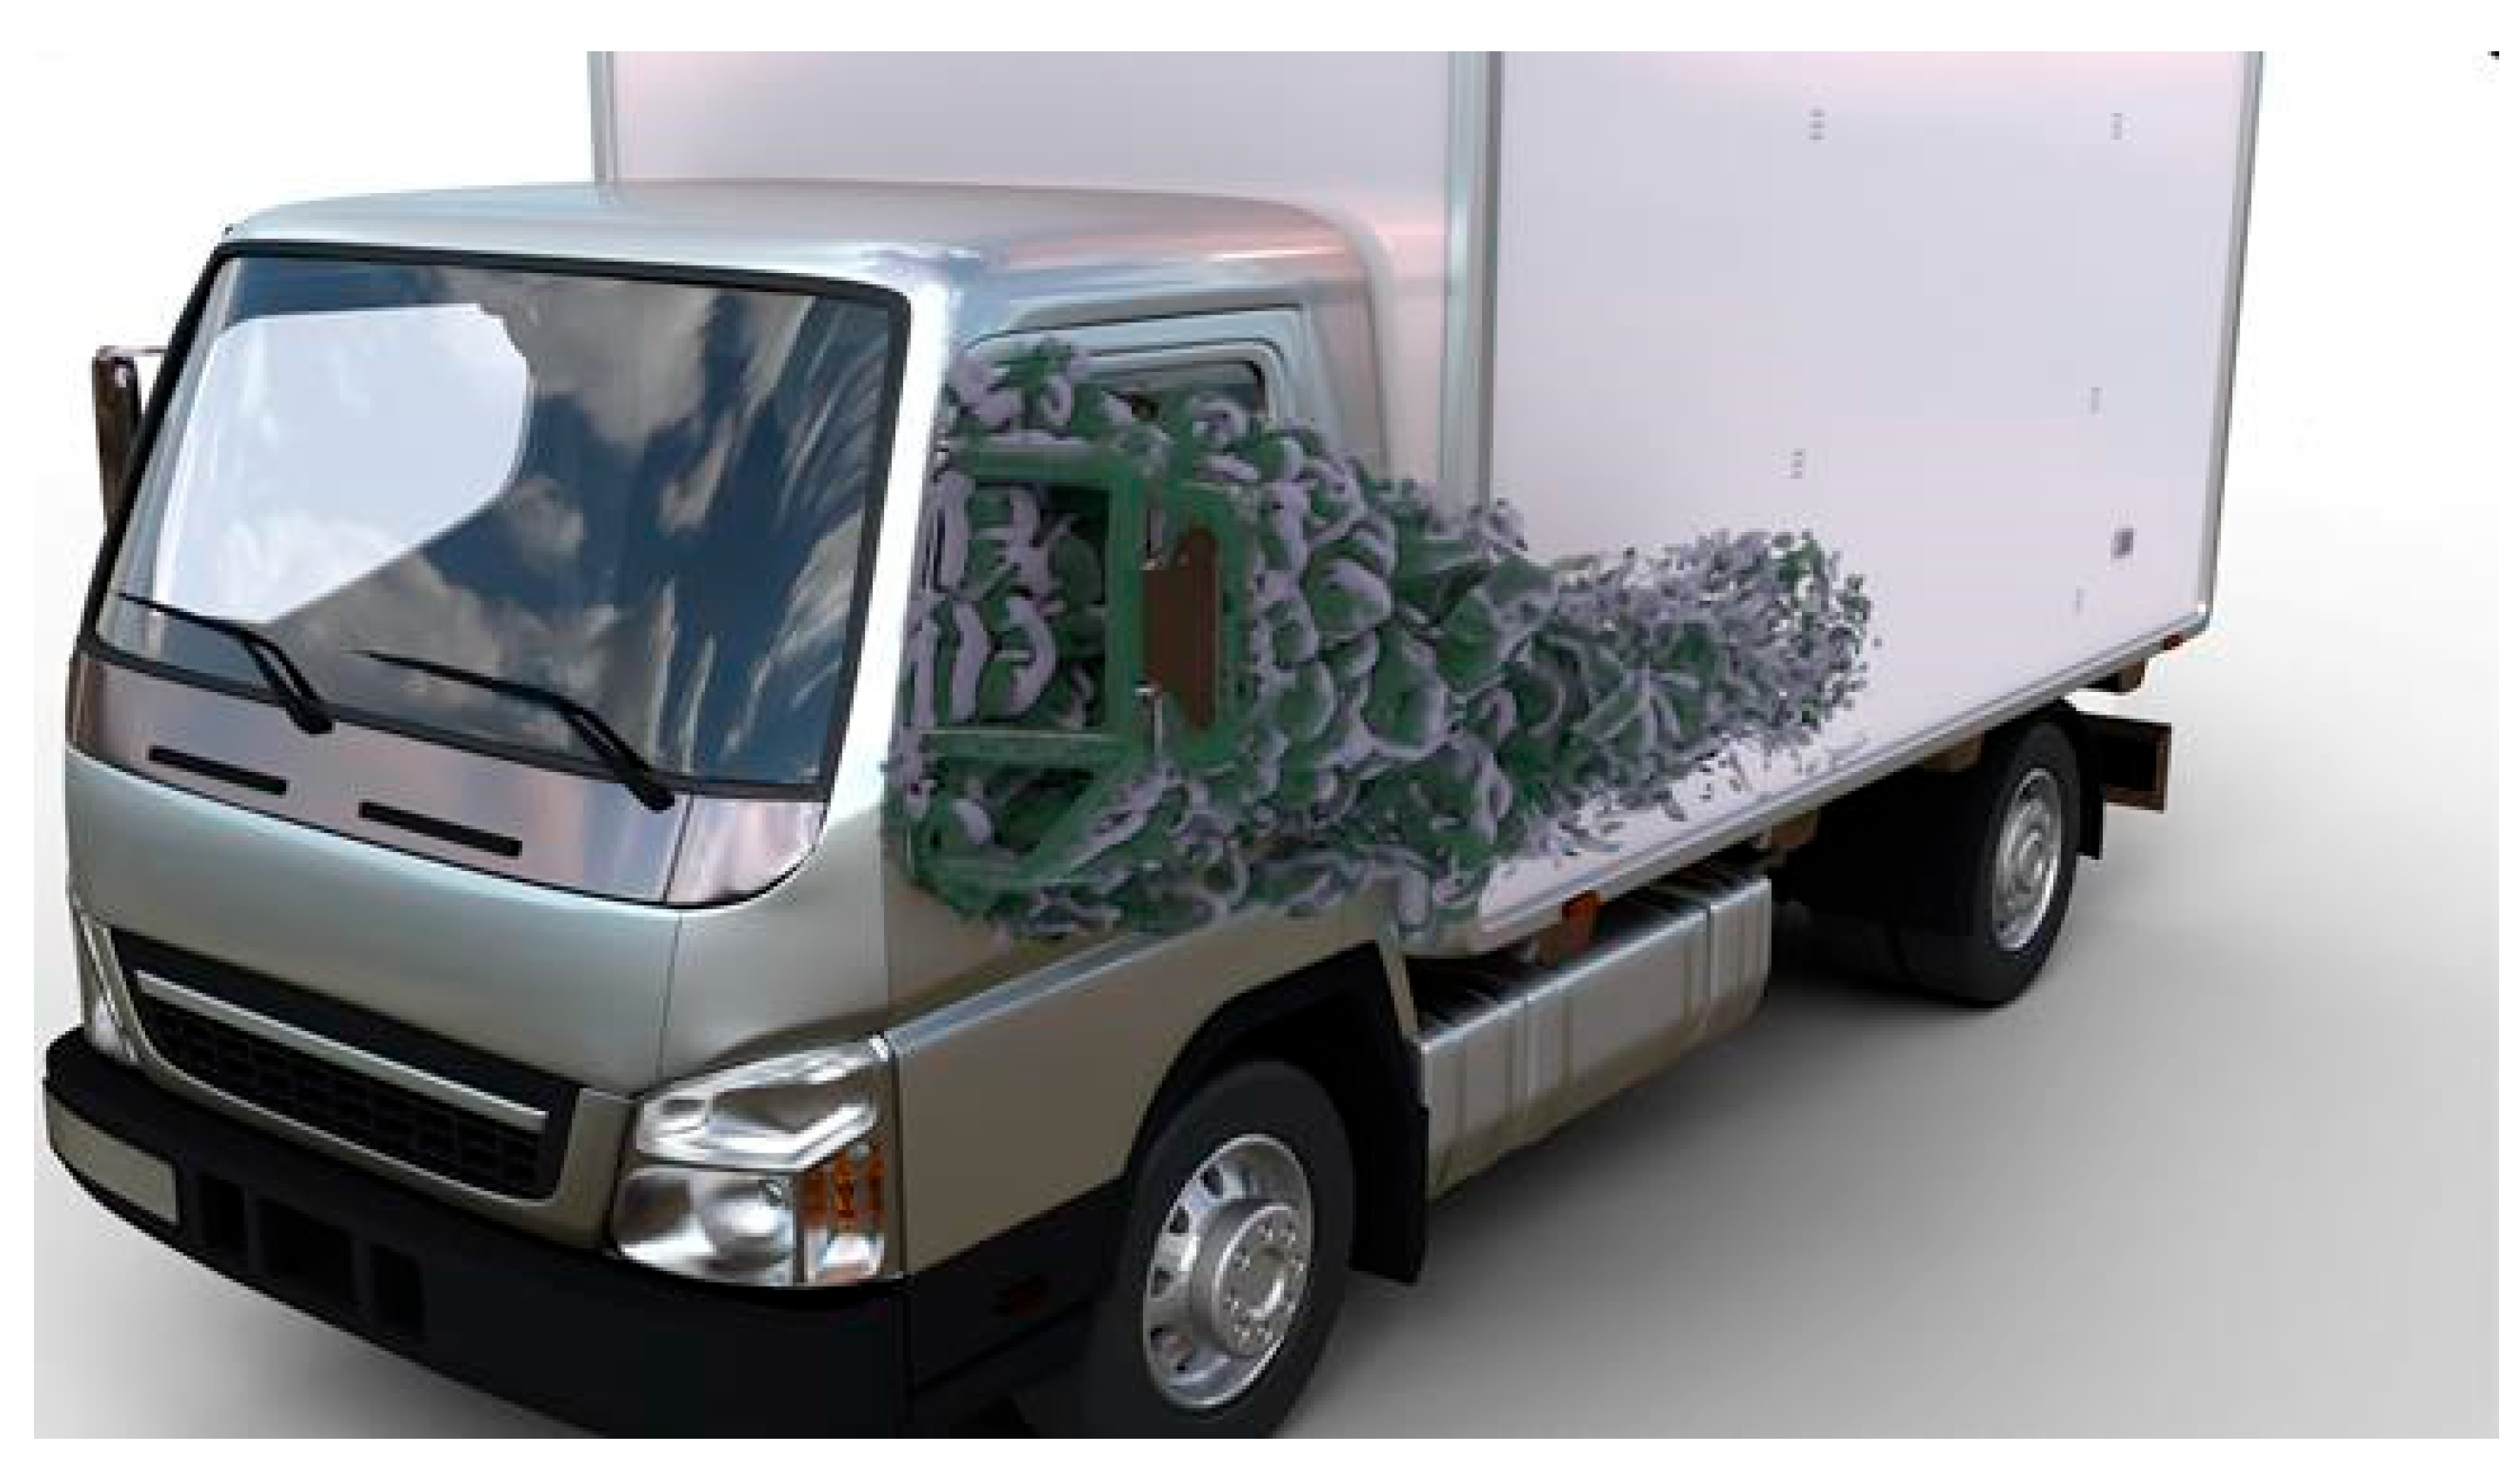
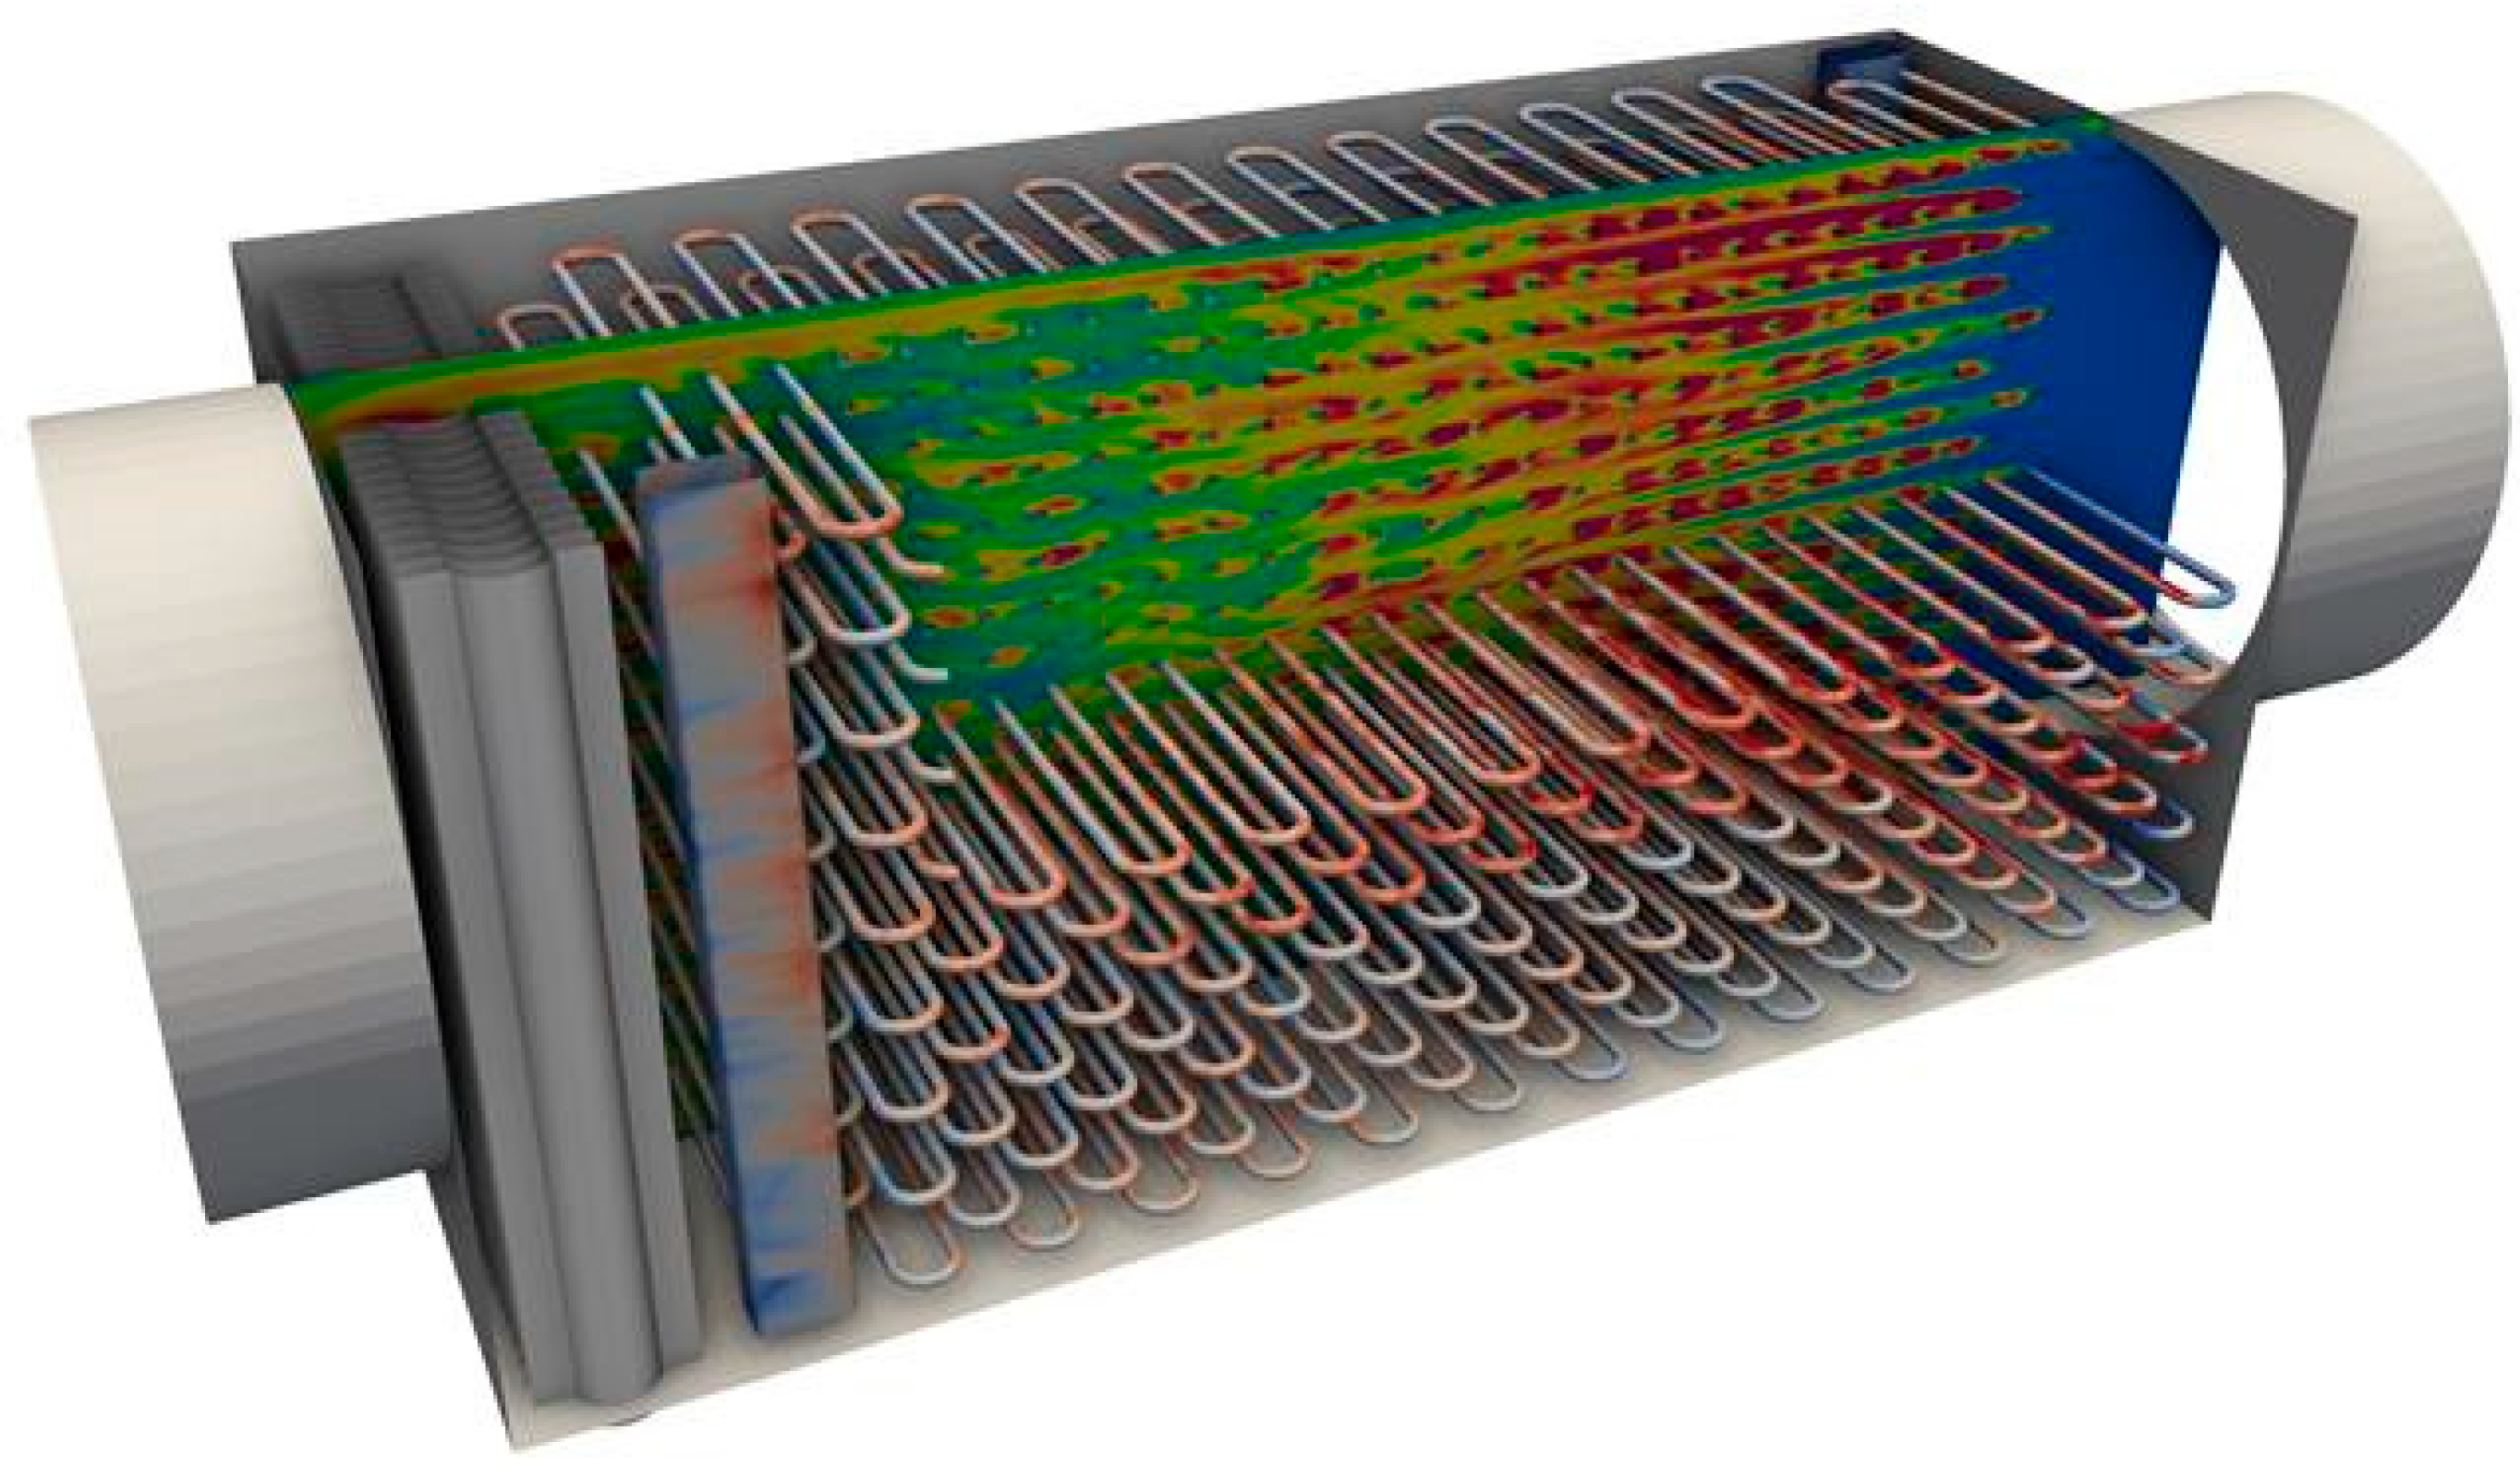
:1. Introduction
- The scale of the problem—body size and channel size;
- The shape of the body and the cross-section of the channel;
- Flow velocity;
- Viscosity of the fluid;
- Compressibility of the fluid;
- Pressure;
- Fluid-structure interactions;
- Surface roughness.
2. Practical Approach to the Problem of Turbulence in CFD
- The momentum equation—application of Newton’s law of motion to a fluid flow;
- The continuity equation—also known as the mass conservation equation;
- The energy equation.
3. Turbulence Modeling Methods
3.1. Direct Numerical Simulation (DNS)
3.2. Reynolds Averaged Navier–Stokes (RANS)
- k-epsilon (k-ε)—[36] the most commonly used in RANS-type CFD calculations. It is based on two equations calculating k—turbulence kinetic energy and ε—turbulence kinetic energy dispersion rate. This model deals well with flow away from walls hence it is preferred for simulation of external flows, such as vehicle aerodynamics
- k-omega (k-ω)—[37] together with k-ε constituting the standard used in industry for the vast majority of calculations. It is based on two equations calculating k and ω—the specific dispersion rate of turbulence kinetic energy. This model is best suited for simulating flows near walls; hence, it is used for calculations of systems consisting of pipes, ducts, and narrow spaces
- k-omega SST—[38] a special variant of k-ω which switches between k-ω and k-ε depending on the distance of a given grid point from the nearest wall—“best of both worlds”
- Spalart–Allmaras (S-A)—[39] a model used mainly in the aerospace industry, not suitable for simulating typical “industrial” flows. It is based on a single equation calculating the turbulent viscosity of vortices.
3.3. Large Eddy Simulation (LES)
3.4. Examples of Additional CFD Methods
4. Conclusions
Funding
Data Availability Statement
Conflicts of Interest
References
- Reynolds, O. An experimental investigation of the circumstances which determine whether the motion of water shall be direct or sinuous, and of the law of resistance in parallel channels. Philos. Trans. R. Soc. 1883, 174, 935–982. [Google Scholar] [CrossRef]
- Sheppard, W.F. Central-Difference Formulæ. Proc. Lond. Math. Soc. 1899, 1, 449–488. [Google Scholar] [CrossRef]
- Richardson, L.F. Weather Prediction by Numerical Process; Cambridge University Press: Cambridge, UK, 1922; p. 219. [Google Scholar]
- Courant, R.; Friedrichs, K.; Lewy, H. Über die partiellen Differenzengleichungen der mathematischen Physik. Math. Ann. 1928, 100, 32–74. (In German) [Google Scholar] [CrossRef]
- Thom, A. The Flow Past Circular Cylinders at Low Speeds. Proc. R. Soc. Lond. 1933, 141, 651–669. [Google Scholar]
- Von Neumann, J.; Richtmyer, R.D.J. A Method for the Numerical Calculation of Hydrodynamic Shocks. Appl. Phys. 1950, 21, 232–237, Republished in Collected Works; Pergamon: New York, NY, USA, 1961; Volume 6, pp. 380–385. [Google Scholar]
- Moore, G.E. Cramming more components onto integrated circuits. Electronics 1965, 38, 114ff. [Google Scholar]
- Roache, P.J. Computational Fluid Dynamics; Hermosa Publications: Albuquerque, NM, USA, 1972. [Google Scholar]
- Baker, T.J. Unstructured meshes and surface fidelity for complex shapes. In Proceedings of the 10th Computational Fluid Dynamics Conference, Honolulu, HI, USA, 24–26 June 1991; pp. 714–725. [Google Scholar]
- Melton, J.E.; Pandya, S.A.; Steger, J.L. 3D Euler flow solutions using unstructured Cartesian and prismatic grids. In Proceedings of the 31st Aerospace Sciences Meeting, Reno, NV, USA, 11–14 January 1993. [Google Scholar]
- Steger, J.L.; Dougherty, F.C.; Benek, J.A. A Chimera grid scheme. In Proceedings of the ASME Mini-Symposium on Advances in Grid Generation, Houston, TX, USA, June 1982. [Google Scholar]
- Buning, P.G.; Chiu, I.T.; Obayashi, S.; Rizk, Y.M.; Steger, J.L. Numerical Simulation of the Integrated Space Shuttle Vehicle in Ascent. In Proceedings of the 15th Atmospheric Flight Mechanics Conference, Minneapolis, MN, USA, 15–17 August 1988. [Google Scholar]
- Message Passing Interface Forum. MPI: A Message Passing Interface. In Proceedings of the Supercomputing 93, Portland, OR, USA, 15–19 November 1993; IEEE Computer Society Press: Washington, DC, USA, 1993; pp. 878–883. [Google Scholar]
- Riggins, D.; Underwood, M.; McMillin, B.; Reeves, L.; Jui-Lin, E. Modeling of Supersonic Combustor Flows using Parallel Computing. Comput. Sci. Tech. Rep. 1993, 36, 217–229. [Google Scholar] [CrossRef]
- OpenCFD Ltd. OpenFOAM Launched 10th December 2004; Archived from the original on 8 February 2005. Retrieved 20 August 2019. Available online: https://web.archive.org/web/20050208124617/http://www.opencfd.co.uk/openfoam/launch.html (accessed on 15 December 2022).
- Kolmogorov, A.N. The local structure of turbulence in incom-pressible viscous fluids at very large Reynolds numbers. Dokl. Akad. Nauk. SSSR 1941, 30, 299–303, Reprinted in Proc. R. Soc. London A 1991, 434, 9–13. [Google Scholar]
- Baez, J.C. Open Questions in Physics, Usenet Physics FAQ; Riverside: Department of Mathematics, University of California: Berkeley, CA, USA, 2006. [Google Scholar]
- Tennekes, H.; Lumley, J.L. A First Course in Turbulence; MIT Press: Cambridge, MA, USA, 1972; ISBN 9780262200196. [Google Scholar]
- Devlin, K.J. The Millennium Problems: The Seven Greatest Unsolved Mathematical Puzzles of Our Time; Basic Books: New York, NY, USA, 2002; ISBN 0-465-01729-0. [Google Scholar]
- Orszag, S.A. Analytical Theories of Turbulence. J. Fluid Mech. 1970, 41, 363–386. [Google Scholar] [CrossRef]
- Leray, J. Sur le mouvement d’un liquide visqueux emplissant l’espace. Acta Math. 1934, 63, 193–248. [Google Scholar]
- Shafiq, A.; Çolak, A.B.; Sindhu, T.N. Reliability In-vestigation of Exponentiated Weibull Distribution Using IPL through Numerical and Artificial Neural Network Modeling. In Quality and Reliability Engineering International; Wiley: Hoboken, NJ, USA, 2022; pp. 1–16. [Google Scholar]
- Çolak, A.B. Experimental study for thermal conductivity of water-based zirconium oxide nanofluid: Developing optimal artificial neural network and proposing new correlation. Int. J. Energy Res. 2020, 45, 2912–2930. [Google Scholar]
- Shafiq, A.; Çolak, A.B.; Sindhu, T.N.; Lone, S.A.; Alsubie, A.; Jarad, F. Comparative Study of Artificial Neural Network versus Parametric Method in COVID-19 data Analysis. Results Phys. 2022, 38, 105613. [Google Scholar] [CrossRef]
- Blazewicz, J.; Borowski, M.; Chaara, W.; Kedziora, P.; Klatzmann, D.; Lukasiak, P.; Six, A.; Wojciechowski, P. GeVaDSs–decision support system for novel Genetic Vaccine development process. BMC Bioinform. 2012, 13, 91. [Google Scholar]
- Blazewicz, J.; Lukasiak, P.; Wilk, S. New machine learning methods for prediction of protein secondary structures. Control. Cybern. 2007, 36, 183–201. [Google Scholar]
- Majchrzak, M.; Jakubowski, M.; Starosta, R. AI-based Method of Vortex Core Tracking as an Alternative for Lambda2. Vib. Phys. Syst. 2020, 31, 10. [Google Scholar]
- Pathak, J.; Mustafa, M.; Kashinath, K.; Motheau, E.; Kurth, T.; Day, M. Using Machine Learning to Augment Coarse-Grid Computational Fluid Dynamics Simulations. arXiv 2020, arXiv:2010.00072. [Google Scholar] [CrossRef]
- Bar-Sinai, Y.; Hoyer, S.; Hickey, J.; Brenner, M.P. Learning data-driven discretizations for partial differential equations. Proc. Natl. Acad. Sci. USA 2019, 116, 15344. [Google Scholar] [CrossRef]
- Kochkov, D.; Smith, J.A.; Alieva, A.; Wang, Q.; Brenner, M.P.; Hoyer, S. Machine learning–accelerated computational fluid dynamics. Proc. Natl. Acad. Sci. USA 2021, 118, e2101784118. [Google Scholar] [CrossRef]
- Sirignano, J.; MacArt, J.L.; Freund, J.B. A deep learning pde augmentation method with application to large-eddy simulation. J. Comput. Phys. 2020, 423, 109811. [Google Scholar]
- Reynolds, O. On the Dynamical Theory of Incompressible Viscous Fluids and the Determination of the Criterion. Philos. Trans. R. Soc. Lond. A 1895, 186, 123–164. [Google Scholar]
- Boussinesq, J. Essai sur la théorie des eaux courantes. In Mémoires Présentés par Divers Savants à l’Académie des Sciences; Imprimerie Nationale: Paris, France, 1897; Volume 23, pp. 1–680. [Google Scholar]
- Schmitt, F.G. About Boussinesq’s turbulent viscosity hypothesis: Historical remarks and a direct evaluation of its validity. Comptes Rendus Mécanique 2007, 335, 617–627. [Google Scholar] [CrossRef] [Green Version]
- Margheri, L.; Meldi, M.; Salvetti, M.V.; Sagaut, P. Epistemic uncertainties in RANS model free coefficients. Comput. Fluids 2014, 102, 315–335. [Google Scholar]
- Hanjalic, K.; Launder, B. A Reynolds stress model of turbulence and its application to thin shear flows. J. Fluid Mech. 1972, 52, 609–638. [Google Scholar]
- Wilcox, D.C. Formulation of the k-omega Turbulence Model Revisited. AIAA J. 2008, 46, 2823–2838. [Google Scholar] [CrossRef]
- Menter, F.R. Two-Equation Eddy-Viscosity Turbulence Models for Engineering Applications. AIAA J. 1994, 32, 1598–1605. [Google Scholar]
- Spalart, P.; Allmaras, S. A one-equation turbulence model for aerodynamic flows. In Proceedings of the 30th Aerospace Sciences Meeting and Exhibit, Reno, NV, USA, 6–9 January 1992. [Google Scholar]
- Roache, P.J. Perspective: A method for uniform reporting of grid refinement studies. J. Fluids Eng. 1994, 116, 405–413. [Google Scholar] [CrossRef]
- Sosnowski, M.; Krzywanski, J.; Scurek, R. A fuzzy logic approach for the reduction of mesh-induced error in CFD analysis: A case study of an impinging jet. Entropy 2019, 21, 1047. [Google Scholar]
- Von Kármán, T. Mechanische Ähnlichkeit und Turbulenz. In Nachrichten von der Gesellschaft der Wissenschaften zu Göttingen, Fachgruppe 1 (Mathematik); NACA: Washington, DC, USA, 1930; Volume 5, pp. 58–76. [Google Scholar]
- Slotnick, J.; Khodadoust, A.; Alonso, J.; Darmofal, D.; Gropp, W.; Lurie, E.; Mavriplis, D. Cfd Vision 2030 Study: A Path to Revolutionary Computational Aerosciences; Langley Research Center, National Aeronautics and Space Administration: Washington, DC, USA, 2014.
- Yarlanki, S.; Rajendran, B.; Hamann, H. Estimation of turbulence closure coefficients for data centers using machine learning algorithms. In Proceedings of the 13th InterSociety Conference on Thermal and Thermomechanical Phenomena in ElectronicSystems, San Diego, CA, USA, 30 May–1 June 2012. [Google Scholar]
- Tracey, B.D.; Duraisamy, K.; Alonso, J. Application of supervised learning to quantify uncertainties in turbulence and combustion modeling. In Proceedings of the 51stAIAA Aerospace Sciences Meeting, Dallas, TX, USA, 7–10 January 2013. [Google Scholar]
- Matta, A.; Li, N.; Lin, Z.; Shanthikumar, J.G. Operational Learning of Approximate Analytical Methods for Performance Evaluation of Manufacturing Systems. In Proceedings of the 10th Conference on Stochastic Models of Manufacturing and Service Operations SMMSO, Volos, Greece, 1–6 June 2011. [Google Scholar]
- Tracey, B.D.; Duraisamy, K.; Alonso, J. A machine learning strategy to assist turbulence model development. In Proceedings of the 53rd American Institute of Aeronautics and Astronautics Aerospace Sciences Meeting, Kissimmee, FL, USA, 5–9 January 2015. [Google Scholar]
- Ling, J.; Kurzawski, A.; Templeton, J. Reynolds averaged turbulence modeling using deep neural networks with embedded invariance. J. Fluid Mech. 2016, 807, 155–166. [Google Scholar]
- Rosenblatt, F. Principles of Neurodynamics: Perceptrons and the Theory of Brain Mechanisms; Spartan Books: Washington, DC, USA, 1961. [Google Scholar]
- Ray, J.; Lefantzi, S.; Arunajatesan, S.; Dechant, L. Learning an Eddy Viscosity Model Using Shrinkage and Bayesian Calibration: A Jet-in-Crossflow Case Study. ASME J. Risk Uncertain. Part B. Mar. 2018, 4, 011001. [Google Scholar] [CrossRef]
- Singh, A.P.; Duraisamy, K. Machine-learning-augmented predictive modeling of turbulent separated flows over airfoils. AIAA J. 2017, 55, 2215. [Google Scholar] [CrossRef]
- Duraisamy, K.; Singh, A.P.; Pan, S. Augmentation of Turbulence Models Using Field Inversion and Machine Learning. In Proceedings of the 55th AIAA Aerospace Sciences Meeting, Grapevine, TX, USA, 9–13 January 2017; pp. 2215–2227. [Google Scholar]
- Duraisamy, K.; Zhang, Z.J.; Singh, A.P. New Approaches in Turbulence and Transition Modeling Using Data-driven Techniques. In Proceedings of the 53rd AIAA Aerospace Sciences Meeting, Kissimmee, FL, USA, 5–9 January 2015. [Google Scholar]
- Parish, E.J.; Duraisamy, K. A paradigm for data-driven predictive modeling using field inversion and machine learning. J. Comput. Phys. 2016, 305, 758–774. [Google Scholar]
- Wang, J.X.; Wu, J.L.; Xiao, H. A physics informed machine learning approach for reconstructing Reynolds stress modeling discrepancies based on DNS data. Phys. Rev. Fluids 2017, 2, 0346039. [Google Scholar]
- Wu, J.-L.; Xiao, H.; Paterson, E. Physics-informed machine learning approach for augmenting turbulence models: A comprehensive framework. Phys. Rev. Fluids 2018, 3, 074602. [Google Scholar]
- Ben Gal I Bayesian Networks. Encyclopedia of Statistics in Quality and Reliability; John Wiley & Sons: Hoboken, NJ, USA, 2007. [Google Scholar]
- Blundell, C.; Cornebise, C.; Kavukcuoglu, K.; Wierstra, D. Weight uncertainty in neural networks. arXiv 2015, arXiv:1505.05424. [Google Scholar]
- Geneva, N.; Zabaras, N. Quantifying model form uncertainty in Reynolds-averaged turbulence models with Bayesian deep neural networks. J. Comput. Phys. 2019, 383, 125. [Google Scholar] [CrossRef]
- Liu, Q.; Wang, D. Stein variational gradient descent: A general purpose Bayesian inference algorithm. Adv. Neural Inf. Process. Syst. 2016, 29, 2378–2386. [Google Scholar]
- Maulik, R.; Sharma, H.; Patel, S.; Lusch, B.; Jennings, E. Accelerating RANS turbulence modeling using potential flow and machine learning. arXiv 2019, arXiv:1910.10878. [Google Scholar]
- Holland, J.R.; Baeder, J.D.; Duraisamy, K. Field inversion and machine learning with embedded neural networks: Physics-consistent neural network training. In Proceedings of the AIAA Aviation 2019 Forum, Dallas, TX, USA, 17–21 June 2019. [Google Scholar]
- Ching, D.S.; Banko, A.J.; Milani, P.M.; Eaton, J.K. Machine learning modeling for RANS turbulence kinetic energy transport in 3D separated flows. In Proceedings of the 11th International Symposium on Turbulence and Shear Flow Phenomena, Southampton, UK, 22–30 July 2022. [Google Scholar]
- Dempster, A.P.; Laird, N.M.; Rubin, D.B. Maximum likelihood from incomplete data via the em algorithm. J. R. Stat. Soc. Ser. B (Methodol.) 1977, 39, 1–22. [Google Scholar]
- Matai, R.; Durbin, P.A. Zonal eddy viscosity models based on machine learning. Flow Turbul. Combust. 2019, 103, 93–109. [Google Scholar]
- Kaandorp, M.L.; Dwight, R.P. Data-driven modeling of the Reynolds stress tensor using random forests with invariance. Comput. Fluids 2020, 202, 104497. [Google Scholar] [CrossRef]
- Ho, T.K. Random Decision Forests. In Proceedings of the 3rd International Conference on Document Analysis and Recognition, Montreal, QC, USA, 14–16 August 1995; pp. 278–282. [Google Scholar]
- Obiols-Sales, O.; Vishnu, A.; Malaya, N.; Chandramouli Sharan, A. CFDNet: A deep learning-based accelerator for fluid simulations. In Proceedings of the 34th ACM international conference on supercomputing, Barcelona, Spain, 29 June–2 July2020; pp. 1–12. [Google Scholar]
- Beetham, S.; Capecelatro, J. Formulating turbulence closures using sparse regression with embedded form invariance. Phys. Rev. Fluids 2020, 5, 084611. [Google Scholar] [CrossRef]
- Donoho, D.L.; Elad, M. Optimally sparse representation in general (nonorthogonal) dictionaries via L1 minimization. Proc. Natl. Acad. Sci. USA 2003, 100, 2197–2202. [Google Scholar]
- Milani, P.M.; Ling, J.; Saez-Mischlich, G.; Bodart, J.; Eaton, J.K. A machine learning approach for determining the turbulent diffusivity in film cooling flows. J. Turbomach. 2018, 140, 021006. [Google Scholar]
- Zhu, L.; Zhang, W.; Sun, X.; Liu, Y.; Yuan, X. Turbulence closure for high Reynolds number airfoil flows by deep neural networks. Aerosp. Sci. Technol. 2021, 110, 106452. [Google Scholar] [CrossRef]
- Ho, J.; West, A. Field Inversion and Machine Learning for turbulence modeling applied to three-dimensional separated flows. In Proceedings of the AIAA Aviation 2021 Forum, Virtual, 2–6 August 2021; pp. 2021–2903. [Google Scholar]
- Smagorinsky, J. General Circulation Experiments with the Primitive Equations. Mon. Weather. Rev. 1963, 91, 99–164. [Google Scholar]
- Deardorff, J. A numerical study of three-dimensional turbulent channel flow at large Reynolds numbers. J. Fluid Mech. 1970, 41, 453–480. [Google Scholar]
- Gamahara, M.; Hattori, Y. Searching for turbulence models by artificial neural network. Phys. Rev. Fluids 2017, 2, 054604. [Google Scholar] [CrossRef]
- Bardina, J.; Ferziger, J.H.; Reynolds, W.C. Improved Turbulence Models Based on LES of Homogeneous Incompressible Turbulent Flows, Rep. TF-19; Department of Mechanical Engineering: Stanford, CA, USA, 1984. [Google Scholar]
- Clark, R.A.; Ferziger, J.H.; Reynolds, W.C. Evaluation of subgrid-scale models using an accurately simulated turbulent flow. J. Fluid Mech. 1979, 91, 1. [Google Scholar] [CrossRef]
- Maulik, R.; San, O. A neural network approach for the blind deconvolution of turbulent flows. J. Fluid Mech. 2017, 831, 151–181. [Google Scholar] [CrossRef]
- Cichocki, A.; Amari, S. Adaptive Blind Signal and Image Processing: Learning Algorithms and Applications; John Wiley & Sons: Hoboken, NJ, USA, 2002. [Google Scholar]
- Stolz, S.; Adams, N.A.; Kleiser, L. The approximate deconvolution model for large-eddy simulations of compressible flows and its application to shock-turbulent-boundary-layer interaction. Phys. Fluids 2001, 13, 2985–3001. [Google Scholar] [CrossRef]
- Beck, A.; Flad, D.; Munz, C.-D. Deep neural networks for data-driven LES closure models. J. Comput. Phys. 2019, 398, 108910. [Google Scholar] [CrossRef]
- Orszag, S.A.; Patterson, G.S. Numerical simulation of three-dimensional homogeneous isotropic turbulence. Phys. Rev. Lett. 1972, 28, 76–79. [Google Scholar] [CrossRef]
- Wang, R.; Kashinath, K.; Mustafa, M.; Albert, A.; Yu, R. Towards physics informed deep learning for turbulent flow prediction. In Proceedings of the 26th ACM SIGKDD International Conference on Knowledge Discovery & Data Mining, Virtual, 6–10 July 2020; pp. 1457–1466. [Google Scholar]
- Bénard, H. Les tourbillons cellulaires dans une nappe liquide [Cellular vortices in a sheet of liquid]. Rev. Générale Des Sci. Pures Et Appliquées 1900, 11, 1261–1271. (In French) [Google Scholar]
- Rayleigh, L. On the convective currents in a horizontal layer of fluid when the higher temperature is on the under side. Lond. Edinb. Dublin Philos. Mag. J. Sci. 1916, 32, 529–546. [Google Scholar] [CrossRef]
- Frezat, H.; Balarac, G.; Le Sommer, J.; Fablet, R.; Lguensat, R. Physical invariance in neural networks for subgrid-scale scalar flux modeling. Phys. Rev. Fluids 2021, 6, 024607. [Google Scholar] [CrossRef]
- Spalart, P.R. Comments on the feasibility of LES for wing and on a hybrid RANS/LES approach. In Proceedings of the 1st Asosr Conference on DNS/LES, Arlington, TX, USA, 4–8 August 1997. [Google Scholar]
- Farge, M.; Schneider, K. Coherent Vortex Simulation (CVS), A Semi-Deterministic Turbulence Model Using Wavelets. Flow Turbul. Combust. 2001, 66, 393–426. [Google Scholar] [CrossRef]
- Haar, A. Zur Theorie der orthogonalen Funktionensysteme. Math. Ann. 1910, 69, 331–371. [Google Scholar]


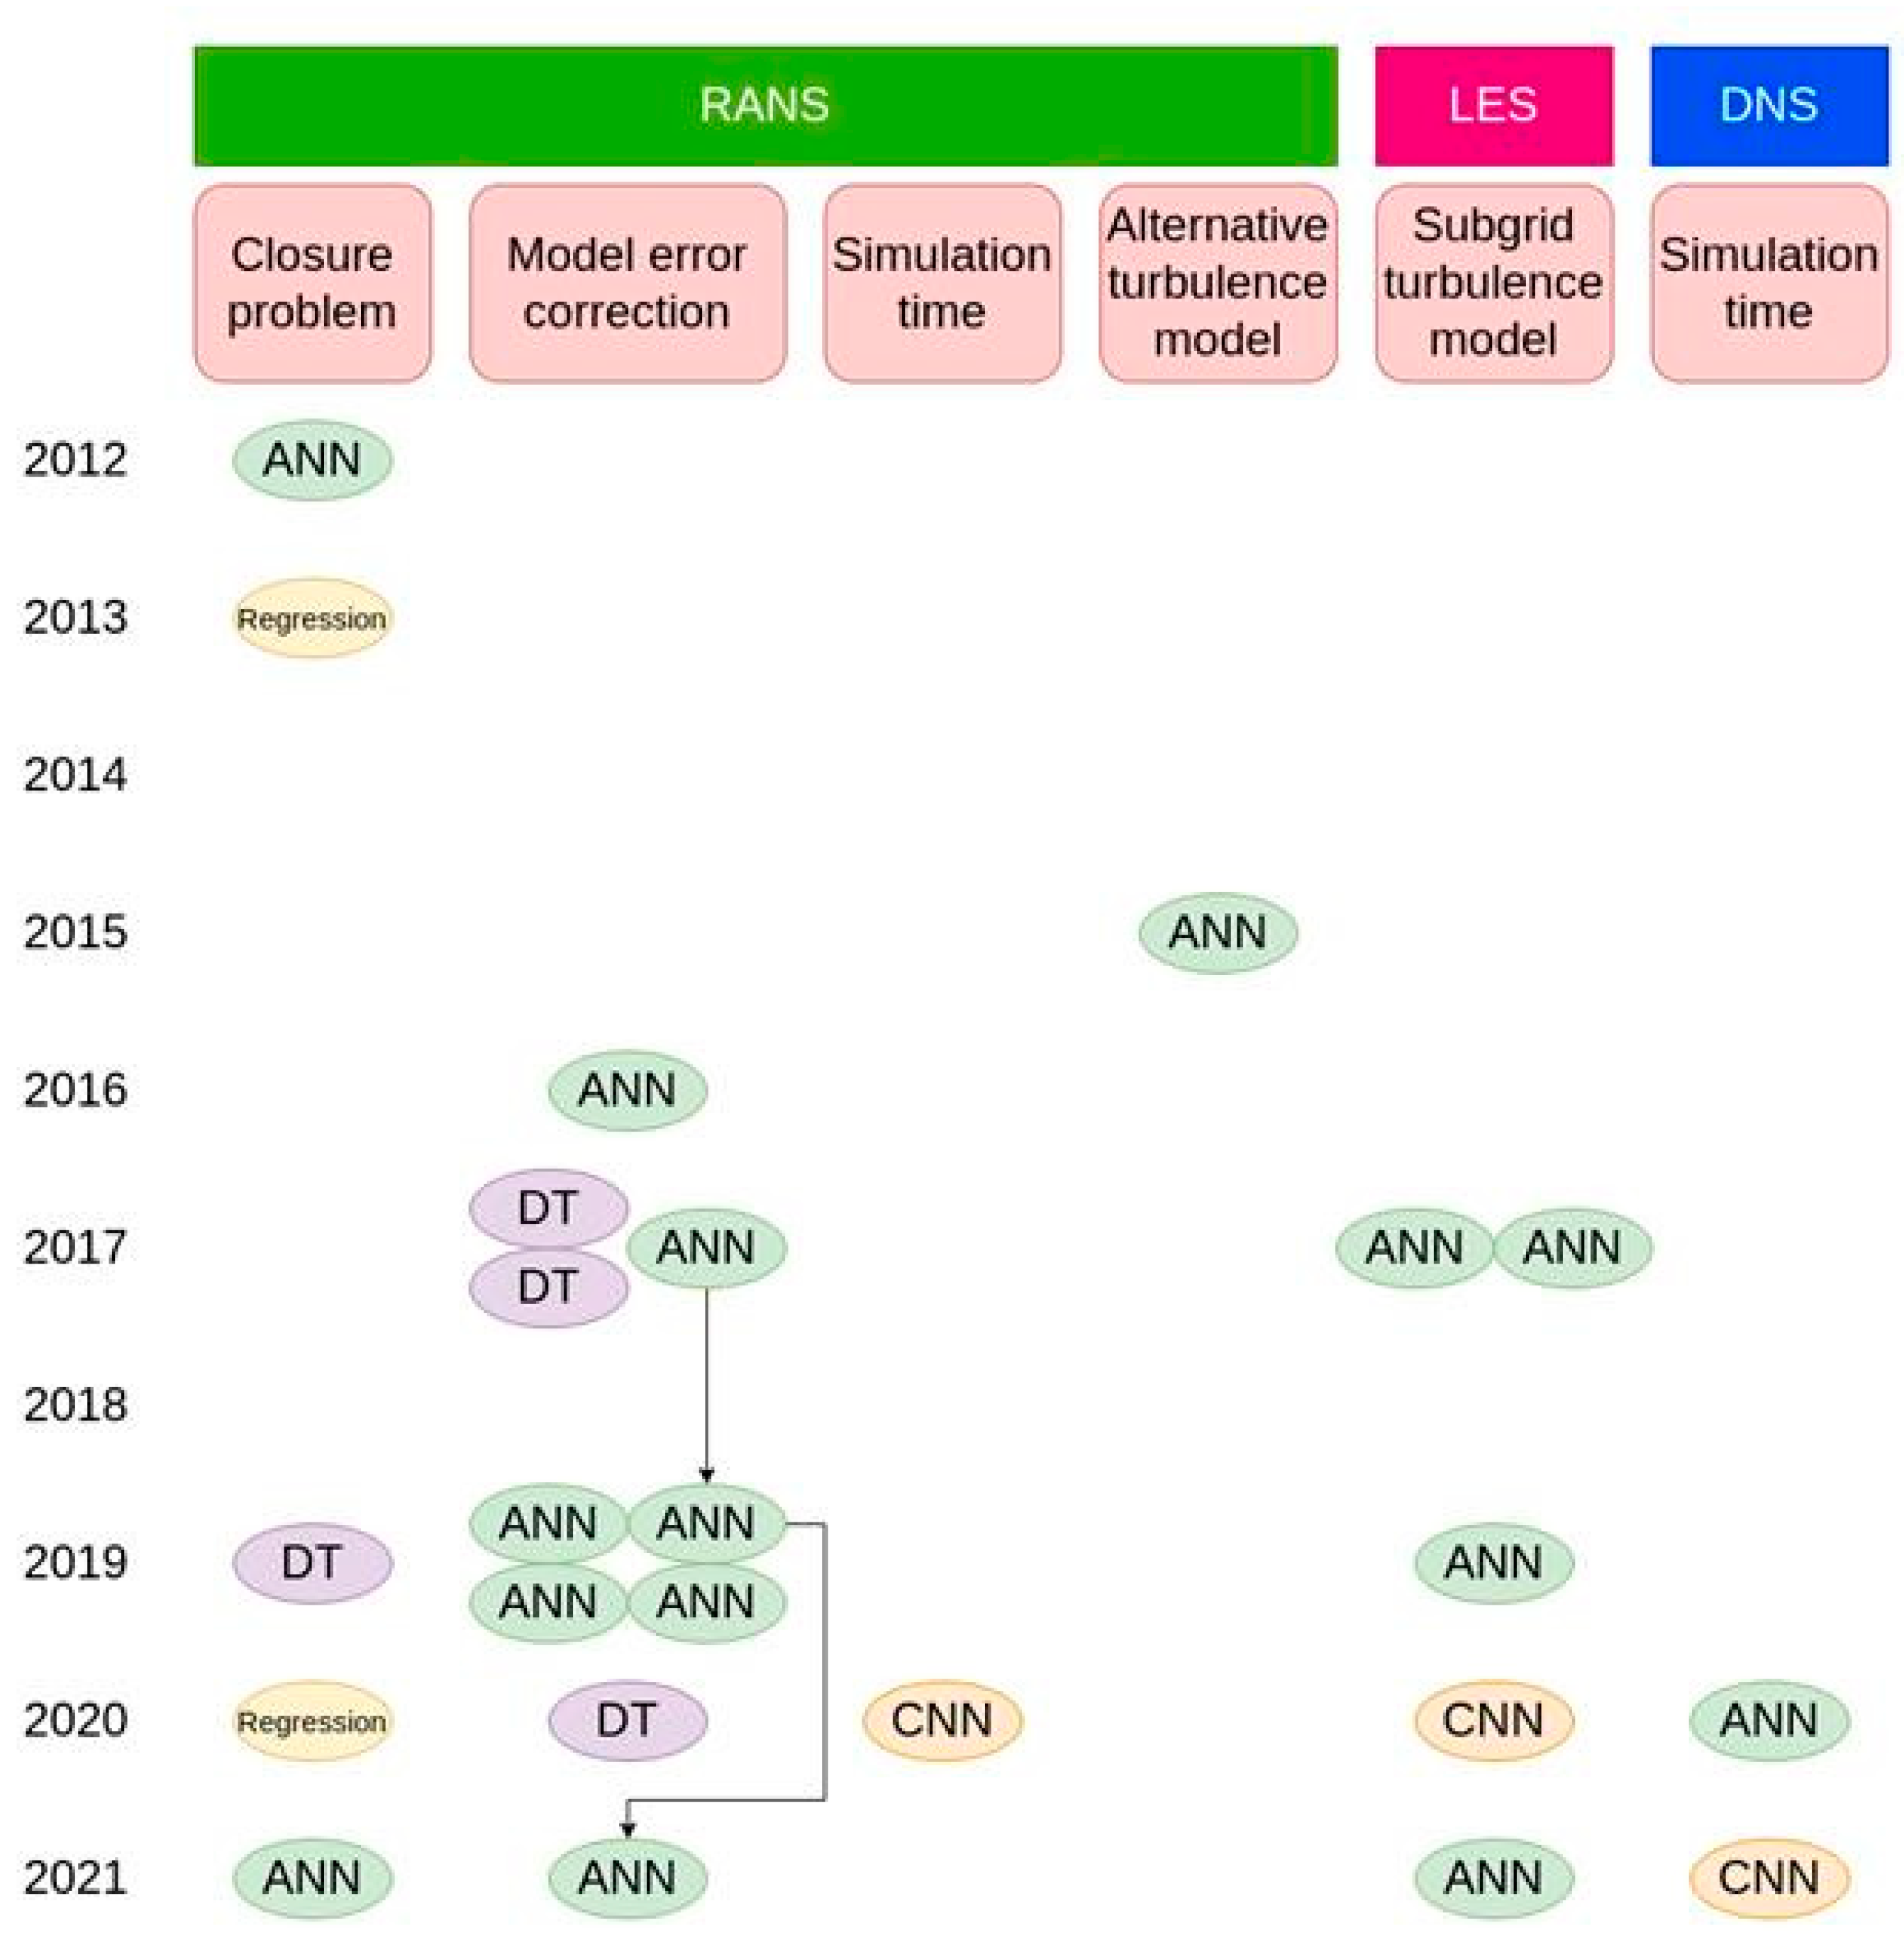
| Authors | DNS | RANS | LES | ANN | CNN | Regression | DT |
|---|---|---|---|---|---|---|---|
| Pathak [28] | ● | ● | |||||
| Kochkov [30] | ● | ● | |||||
| Yarlanki [44] | ● | ● | |||||
| Tracey [45] | ● | ● | |||||
| Tracey [47] | ● | ● | |||||
| Ling [48] | ● | ● | |||||
| Singh [51] | ● | ● | |||||
| Duraisamy [52] | ● | ● | ● | ||||
| Wang [55] | ● | ● | |||||
| Geneva [59] | ● | ● | |||||
| Maulik [61] | ● | ● | |||||
| Holland [62] | ● | ● | ● | ||||
| Ching [63] | ● | ● | |||||
| Matai [65] | ● | ● | |||||
| Kaandorp [66] | ● | ● | |||||
| Obiols-Sales [68] | ● | ● | |||||
| Beetham [69] | ● | ● | |||||
| Milani [71] | ● | ● | |||||
| Zhang [72] | ● | ● | |||||
| Ho [73] | ● | ● | ● | ||||
| Gamahara [76] | ● | ● | |||||
| Maulik [79] | ● | ● | |||||
| Beck [82] | ● | ● | |||||
| Wang [84] | ● | ● | ● | ||||
| Frezat [87] | ● | ● |
Disclaimer/Publisher’s Note: The statements, opinions and data contained in all publications are solely those of the individual author(s) and contributor(s) and not of MDPI and/or the editor(s). MDPI and/or the editor(s) disclaim responsibility for any injury to people or property resulting from any ideas, methods, instructions or products referred to in the content. |
© 2023 by the authors. Licensee MDPI, Basel, Switzerland. This article is an open access article distributed under the terms and conditions of the Creative Commons Attribution (CC BY) license (https://creativecommons.org/licenses/by/4.0/).
Share and Cite
Majchrzak, M.; Marciniak-Lukasiak, K.; Lukasiak, P. A Survey on the Application of Machine Learning in Turbulent Flow Simulations. Energies 2023, 16, 1755. https://doi.org/10.3390/en16041755
Majchrzak M, Marciniak-Lukasiak K, Lukasiak P. A Survey on the Application of Machine Learning in Turbulent Flow Simulations. Energies. 2023; 16(4):1755. https://doi.org/10.3390/en16041755
Chicago/Turabian StyleMajchrzak, Maciej, Katarzyna Marciniak-Lukasiak, and Piotr Lukasiak. 2023. "A Survey on the Application of Machine Learning in Turbulent Flow Simulations" Energies 16, no. 4: 1755. https://doi.org/10.3390/en16041755