Article

Turbine Fast Valving Setting Method Based on the Hybrid Simulation Approach

School of Energy & Power Engineering, National Research Tomsk Polytechnic University, Tomsk 634050, Russia
*
Author to whom correspondence should be addressed.
Energies 2023, 16(4), 1745; https://doi.org/10.3390/en16041745
Submission received: 6 January 2023 / Revised: 5 February 2023 / Accepted: 6 February 2023 / Published: 9 February 2023
(This article belongs to the Special Issue Smart Solutions and Devices for the Power Industry)

Abstract

:
Turbine fast valving is one way to preserve the stability of power systems in case of emergency excess power. The determination of optimal setting parameters of turbine fast valving is a rather complicated task. It is connected with the necessity to determine the parameters of an electrical signal, which controls by means of an amplifier the position of control valves and, accordingly, the value of the output turbine power. The amplitude, duration, as well as the form of the electric signal influence the speed and depth of turbine unloading; they also determine the character of transient process development, including in the post-emergency mode. The proposed approach differs from the currently used one in that the optimal electrical signal shape is selected by multiple detailed modelling in power system simulators, rather than one of three to five initial settings determined at the turbine manufacturer without taking into account the response of the power system. Thus, when using complete and reliable information regarding the processes in the turbine and generator equipment, its control systems, and the power system as a whole, it becomes possible to form the necessary shape of an electrical signal in the event of losing stability in a place of interest in the power system due to the occurrence of an emergency excess of generated active power of various values. The developed approach was tested, and the results of the study were verified by the field data.

1. Introduction

The participation of steam turbines in managing the mode of operation of the power system remains significant [1,2], despite the active introduction of renewable energy sources [3]. An indispensable condition for the normal power supply of consumers is the stable operation of electric power systems (EPS), ensured by the balance of generated and consumed active power, minor changes which are eliminated by the automatic load-frequency control (LFC) of generators [4]. Significant violations of this balance that occur during various accidents in the part of the EPS that is excessive in terms of active power generation are eliminated by the action of emergency automatic (EA) and the corresponding control actions (CA). One of the most technologically and cost-effective CA is the joint use of the momentary fast valving (MFV) of the power turbine, designed to save transient stability, and sustained fast turbine valving (SFV), which is necessary to balance the active power of the post-accident mode (further in the text fast valving (FV)) [5]. The advantages of this type of CA over others are determined by the following factors:
  • Unlike generator tripping (GT): the most commonly used means of reducing surplus generated active power, which provides a discrete reduction in the generated active power and requires a fast startup [6]. FV is not technologically undesirable and does not lead to a decrease in the total inertia of the EPS, which further aggravates the situation during an accident. Additionally, FV does not lead to an increase in the turbine speed due to the use of GT, which can lead to the operation of emergency valves.
  • In contrast to electric (dynamic) braking (EB), FV is a cost-effective CA because its normal operation does not require the additional installation of specialized high-voltage resistors, operating on generator voltage and the appropriate switches in order to form the necessary system to vary the amount of braking power. For example, when faults occur close to the generator terminals, the voltage decreases and the breaking resistor cannot operate until the faulted element is localized. However, from the very beginning of the fault, fast valving can be applied to effectively control the acceleration of the rotor during the period of the fault [7].
At the same time, despite these advantages, for the adequate functioning of the FV, it is necessary to set it up, which is associated mainly with the definition of the most optimal parameters of MFV, which is a difficult but, nevertheless, relevant task [8].
The setting of the FV consists of determining the form of an electric signal fed to the input of the amplifier of the electro-hydraulic LFC and then conversion to the hydraulic actuator rod, which controls the closing of the steam turbine control valves, thereby providing the required level and speed of the FV. The view of the electrical signal is shown in Figure 1.
The designations in Figure 1 are the MFV parameters, the definition of which depends on a set of interrelated processes in a particular prime mover (PM), its control systems, and the influence of the EPS:
Ai: the value of the electric signal supplied to the electrohydraulic converter (EGC) input, normalized by the special unit (value that is equal to one pu after the completion of all the processes in the equipment leads to a reduction in the rated power of turbine generator to zero);
TMFV: the holding time of the MFV electric signal at level Ai, necessary to ensure the required unloading depth;
A0: the value of the electrical signal Ai after the hold time TMFV;
τMFV: the time constant of the exponential zeroing of MFV.
The FV process is controlled as follows: when the signal Ai ≤ 1 pu., the valves of the high-pressure cylinder (HPC) close, and the control valves of the medium-pressure cylinder (MPC) and the low-pressure cylinder (LPC) are in a static state. In this case, only the torque of the HPC changes rapidly; the change in the moment of the MPC and LPC occurs with the time constant of the change in the amount of steam in the intermediate reheater. When a signal exceeding the above value Ai is applied to the turbine, the valves of the MPC and LPC are closed, and therefore the process of reducing the total mechanical torque is significantly accelerated. In order to activate the control valves of the MPC and LPC, as well as to accelerate their closing, the value of Ai must be greater than 1 pu. At present, to achieve the maximum closing speed of the control valves, an Ai value of 4 pu. is almost always used. However, in most cases, this value is excessive and has a dynamic effect on the turbine control system and steam pipeline, which leads to their accelerated wear. It is customary to take the duration of the TMFV with a “margin”; however, the maximum unloading depth obtained with such values or close to it in most cases turns out to be excessive, and excessive braking leads to a power deficit and a decrease in the frequency, which can cause automatic frequency load-shedding, deep synchronous swings, or a loss of stability. The value of A0, which determines the level of overshoot and the magnitude of synchronous swings when the post-emergency level of active power generation is established, is currently taken equal to 1 pu. in all cases, regardless of the degree of the unloading of the turbogenerator. However, such a value of A0 can lead to a significant level of overshoot and a large amplitude of synchronous swings. To minimize them, it is necessary to set the value of A0 based on the specific conditions of FV. The value of τMFV determines the duration of the synchronous swings when the post-emergency level of the active power generation is established. The combination of parameters A0 and τMFV provide the necessary quality of the transient process when the control signal of the MFV is reset to zero. Parallel to the control signal of the MFV, the control signal SFV is supplied to the PM control system, the value of which determines the level of active power generation in the post-emergency mode.
Usually, FV is carried out according to one of three to five initial settings determined at the turbine manufacturer, and it is initiated by a power load unbalance logic [9]. However, this approach is very approximate and can lead to the under- or overshooting of the process; therefore, most of the studies related to the setting the FV parameters aimed at finding the optimal shape of the electrical signal (Figure 1) that determined the FV process [10,11]. The authors [12] developed an approach to determine the characteristics of the output power of the turbine, on the basis of which the parameters of the FV can be more accurately determined. In [13], it was proposed to use EB together with FV to maintain stability. However, in both studies, the proposed approaches were tested only for a single-machine power system and were not tested in an EPS of real scale, taking into account the effect of the EPS on the unloading process. At the same time, there are other approaches to setting up the FV [14,15], where a multi-agent system is proposed that measures the angle of the generator rotor and predicts its behavior (by catching the ball method); in the event of a predicted stability loosing, MFV is performed. However, it remains unclear how such a system will react if the stability is lost in the second cycle. In addition, monitoring the angle of the rotor does not preclude the use of excessive unloading on the wrong characteristic. The authors in [16] focused on the quick prediction of the transient instability, but they used the classical FV characteristic selection scheme [17]. In [18], it was proposed to use PMU devices for primary information regarding the loss of stability. However, it is known that in the case of closed loop control, using phasors from PMUs can be a reason for losing system stability due to a large time delay [19]. Thus, the considered approaches do not provide an unambiguous answer to the question of the optimal setting of the FV parameters, taking into account the influence of processes in the EPS on them. According to the authors, the efficiency of tuning the FV of the turbine also depends on the completeness and reliability of the model of both the turbine itself and the rest of the power system. Such a need may arise when it is necessary to increase the accuracy of the control action time, for example, when decreasing the interconnection power flow due to the condition of the stability of the post-accident state, or if it is necessary to limit the depth of the turbine FV (even by reducing its efficiency) in the presence of a significant local load.
The required efficiency of the FV setting can be achieved under the condition of a high-quality selection of parameters, which is possible only if there is complete and reliable information regarding the processes occurring in the turbogenerator equipment, its control systems, and the EPS as a whole in case of losing stability or long-term synchronous swings due to the occurrence of an emergency excess of generated active power. This information is necessary to determine the FV parameters that are adequate to the real values of the imbalance. Due to the fact that full-scale experiments in a real EPS, especially of an emergency nature, are not allowed, and physical modeling is complex and has limitations; the only way to obtain complete and reliable information about the processes in the unloaded turbogenerator and the adjacent EPS is mathematical modeling, in particular, detailed modeling with using specialized software and hardware simulators (SHS) [20,21]. Using detailed mathematical models in the formation of the MFV signal, it becomes possible to take into account the features of the PM of the unloaded turbogenerator and the effect of the EPS. It is also possible to set the most efficient nature of zeroing the MFV, which, together with the SFV, provides a balance of active power in the post-emergency mode with a minimum amplitude and duration of synchronous oscillations.
Thus, the contribution of this article is determined by the following provisions:
  • Developed and tested in a real EPS method for the optimal setting of the FV parameters, providing the technologically most efficient control of the FV process and taking into account the influence of the external network on these parameters.
  • A complete and reliable mathematical model has been developed based on the data of a real prime mover, consisting of a steam turbine, a boiler unit, and their control systems. This model makes it possible to dynamically change the setting parameters to generate a control signal RT of a complex shape, necessary for the optimal control of the transient process in the event of an emergency power surplus.
The proposed approach differs from the currently used one in that the optimal characteristic of the electrical signal is selected by means of multiple simulation, rather than one of three to five initial settings determined at the turbine manufacturer without taking into account the response of the power system until the turbine unloading process is selected. Thus, with detailed modeling, it is possible to achieve optimal results for a turbine of any type and installed at any point in the power system.
Section 2 contains a description of the developed fast valving setting methodology. Section 3 describes the means of implementing the developed methodology. Section 3 also presents the developed hybrid model of the power unit and its implementation as part of the simulation tool. Section 4 contains a description of the mathematical model of the considered power system and the required system data. The results of experimental studies are presented and discussed in Section 5. Finally, Section 6 concludes the paper.

2. Development of Fast Valving Setting Methodology

Taking into account the influence of the indicated parameters on the unloading process, a methodology for the optimal setting of the FV can be formed, the main provisions of which are presented below:
1.
In the studied electric power system, a station is selected, which includes a power unit allocated for unloading. The selected power unit must meet the following requirements:
(1)
Power unit with long-term synchronous swings in electric power and generator rotation speed, the average value of the turbine power did not decrease by more than 10–15% of its initial power and did not increase by more than 5%.
(2)
The power unit must be able to reduce the generated power to any value that lies within its regulatory range in no more than 4 s. At the same time, automatic time rate limiters should not operate if this is not required to ensure the safety of the unit equipment. After a unit’s power is rapidly reduced to a value within its regulation range, the unit must be able to operate at that power for an unlimited time. In addition, no further shutdown of the equipment shall be required other than that which may be necessary during the normal operational derating of the unit. After a rapid decrease in the power of the unit to a value less than the limit of the regulation range, the short-term operation of the unit with such power should be allowed, followed by the restoration of the power to a value lying within the regulation range.
(3)
The power unit must be able to reduce the turbine power by at least 5% of the nominal value in 0.1–0.2 s after the signal for use is provided. The power unit must be able to reduce the turbine power by at least 5% of the nominal value in 0.1–0.2 s after the signal to use the MFV. The rate of power shedding from 95% to 5% from the moment of applying the MFV must be at least 2 pu/sec. The power of the turbine from the nominal value to the value corresponding to the auxiliary load must decrease in no more than 0.7 s. Decreasing the speed should be allowed to recover the power by applying an exponential signal to power up after the MFV operation.
(4)
The rate of increase in the generated power must be at least 10% in 2 s.
2.
The power flows are determined along the lines outgoing from the station, in all steady-state circuit-mode (summer maximum, winter maximum, repairing, etc.) states of the EPS.
3.
Using a simulation tool that can implement detailed models of the main and auxiliary equipment of the EPS that meet the requirements, a sufficiently complete and reliable continuous spectrum of emergency processes is preliminarily modeled, leading to the occurrence of an excess of generated active power (for example: short circuit, line disconnection, incorrect personnel action) on the sections defined in paragraph 2, on an unlimited interval.
4.
From the transients obtained in paragraph 3, those are selected in which there is a losing of the stability of the generating equipment of the station in question and the emerging power excess are determined.
5.
For each specific emergency process associated with the occurrence of an emergency excess of active power, the numerical values of the MFV parameters are determined:
(1)
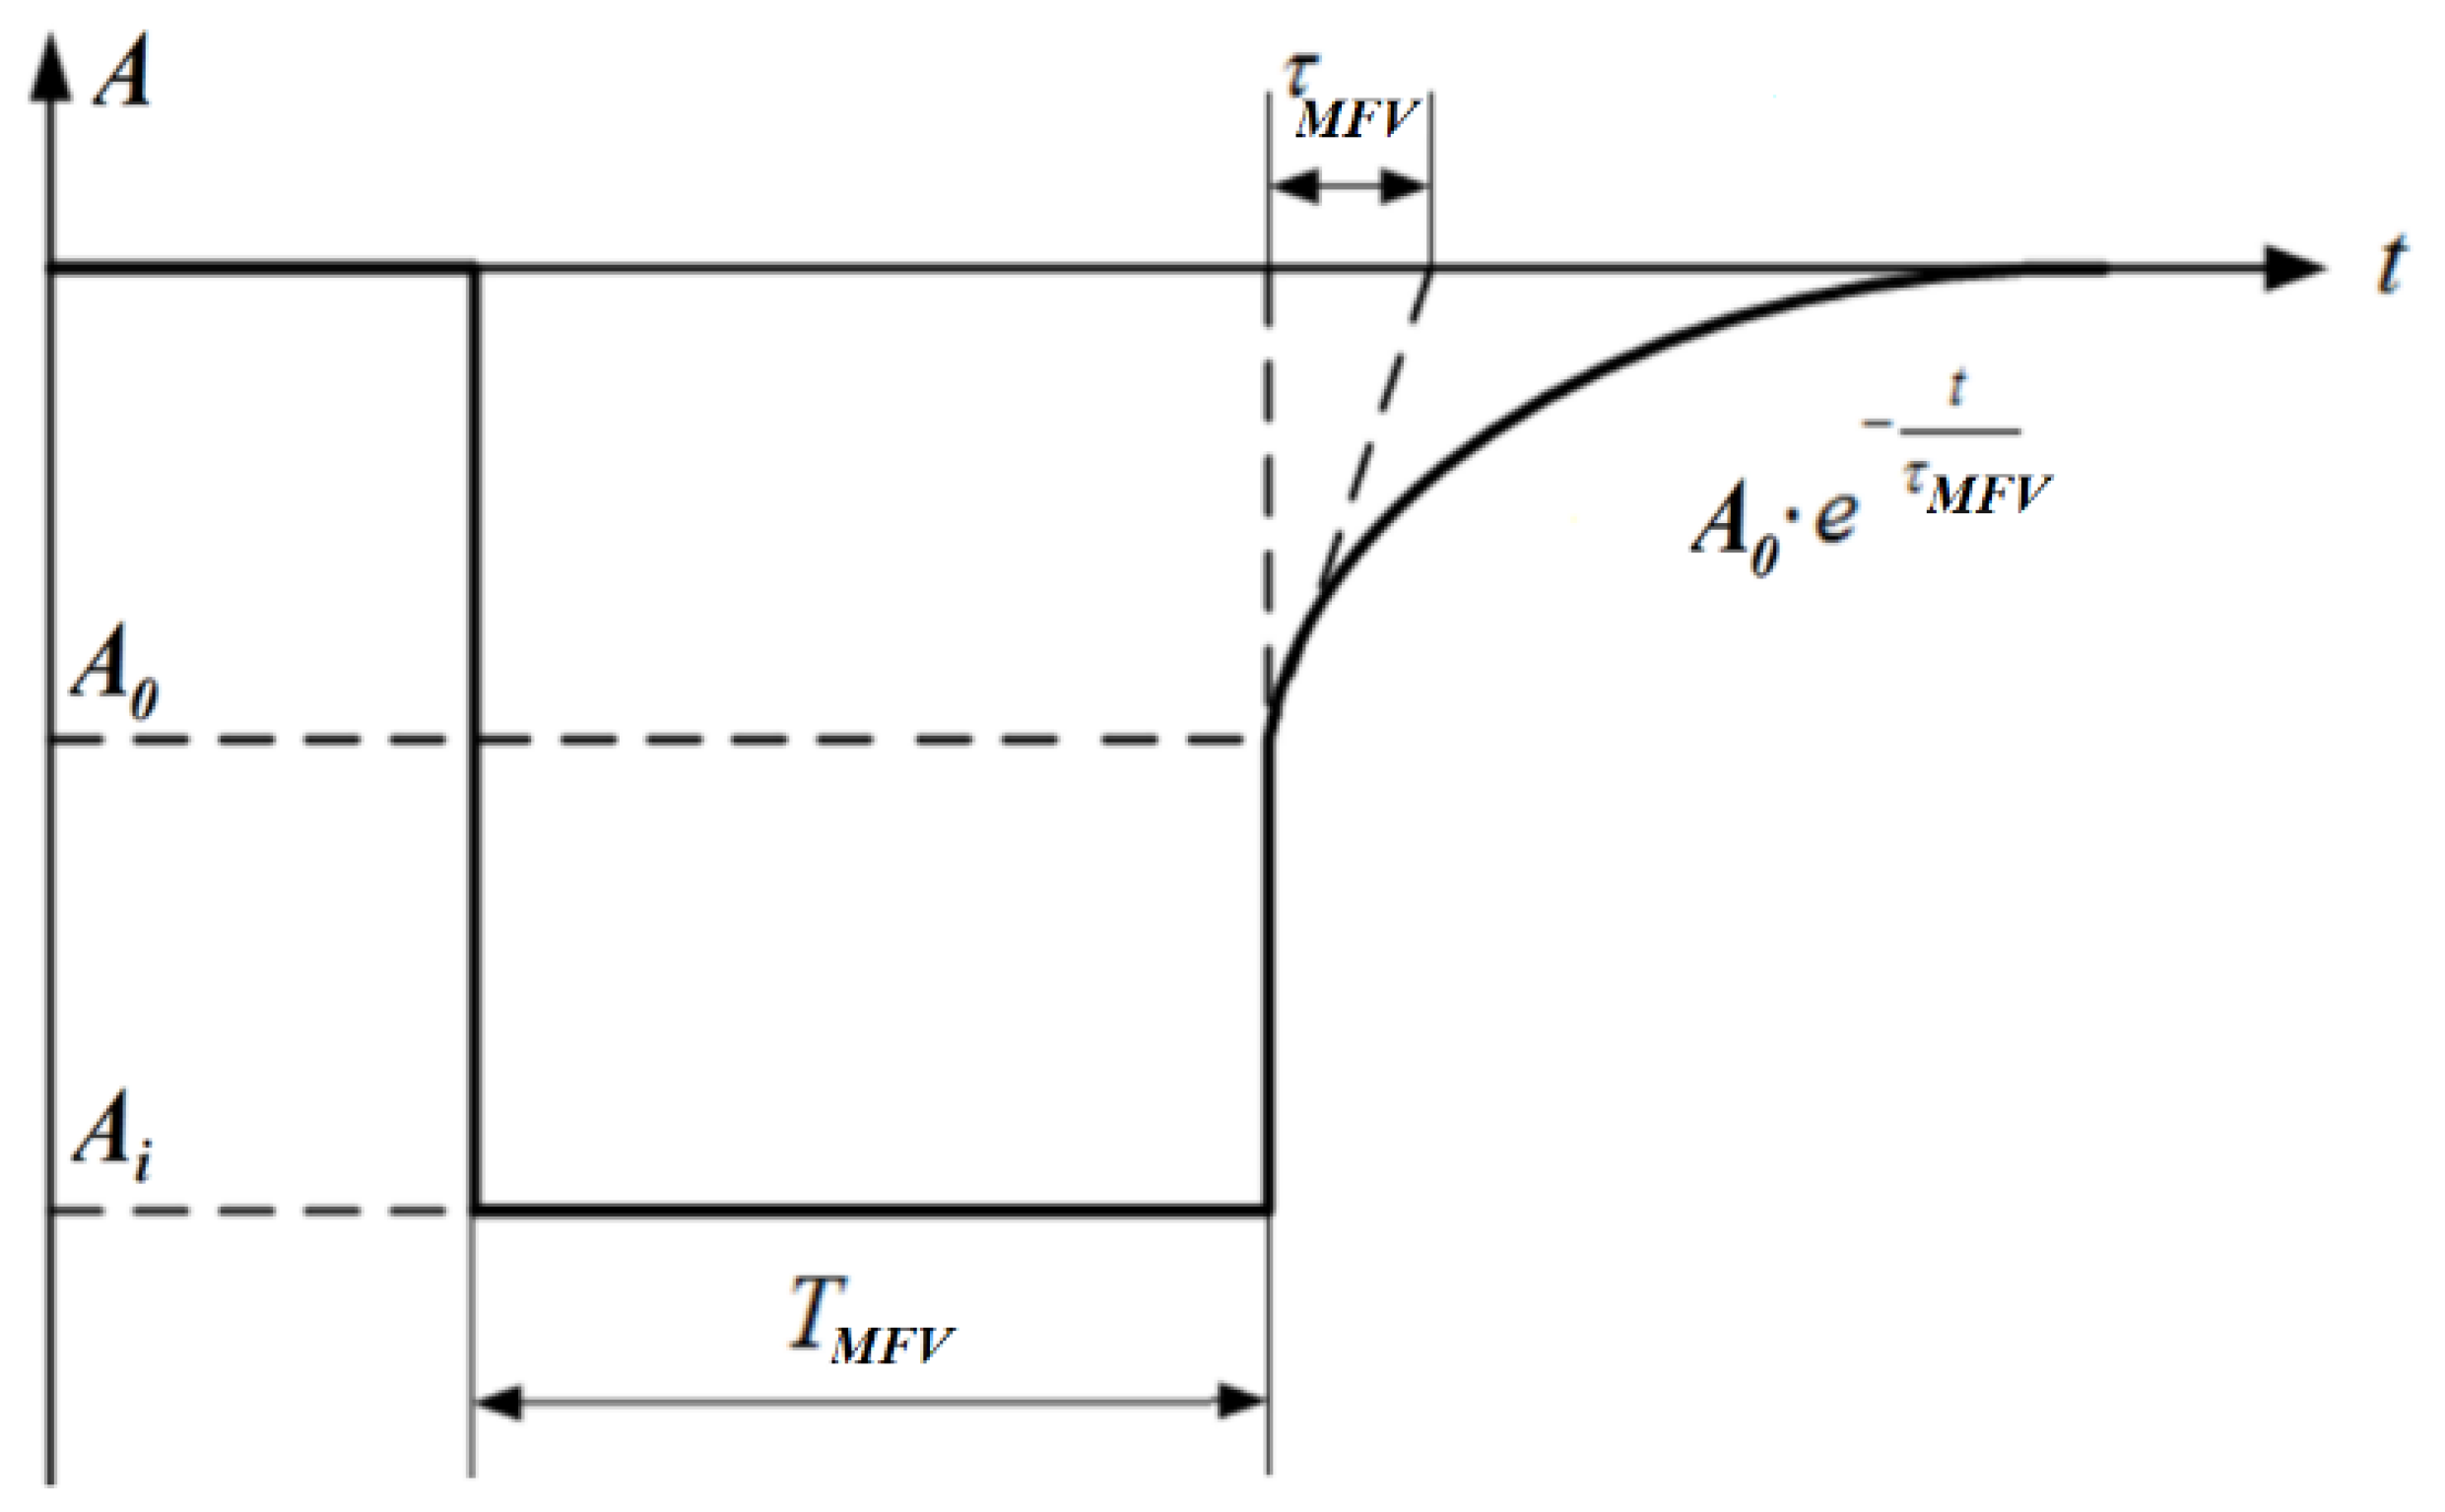
Ai is assigned based on the compensation of the time constants: EGC, pilot valves, servomotors of the HPC, MPC, and LPC, and steam volumes in the turbine cylinders. Focusing on these time constants, the value of Ai is set, with an increase in which (Ai + 1) the rate of change in the turbine torque does not increase. Starting from the value Ai = 4 pu, with a step 0.1 pu in the direction of decreasing, choose the value at which the rate of the decrease in the mechanical torque of the turbogenerator (Vi) meets the following conditions:
{ V i V i 1 > 1.15 V i V i + 1 > 0.98 ,
where V i = M S M M F V t S t M F V : MS is the turbine mechanical torque before MFV, MMFV is the minimum turbine mechanical torque during MFV, tMFV is the time of MMFV, and tS is the MFV starting time.
(2)
TMFV is taken according to the required unloading depth. Selecting the TMFV parameter starts from the value of TMFV = 0.1 sec. in increments of 0.25 upwards, and selecting the value at which the unloading depth will correspond to the following inequality:
P P A 4 P M F V P P A 3
where PPA is the generated active power in the post-accident mode and PMFV is the minimum generated active power during MFV.
(3)
Choice of parameters A0 and τMFV. The definition of these parameters occurs jointly, because the minimization of the power swings when establishing a post-accident mode is achieved by a combination of the parameters A0 and τMFV. Take A0 = 1 pu, starting from the value τMFV = 1 with a step of 0.5 upwards, select the value τMFV at which the minimum level and duration of the synchronous swings are achieved. Repeat the selection of the τMFV values at A0 = 1.5 and A0 = 2. Accept the values of the remaining parameters: Ai found in p. (1), TMFV found in p. (2). From the obtained three MFV characteristics, choose the one at which the minimum level of the overshoot and the duration of the synchronous swings are achieved.
An obvious requirement for the implementation of the methodology is the availability of a complete and reliable mathematical model of the power unit, which makes it possible to dynamically change the parameters of its settings in order to form an FV control signal of a complex shape, which is necessary for the optimal control of the transient process in the event of an emergency power surplus. The next section of the article is devoted to the development of the detail mathematical model of the power unit, as well as the means of its implementation, which uses the hybrid approach to simulate the steady state and transient processes in EPS.

3. Means of Implementing the Developed Methodology

3.1. Justification of the Approach to EPS Modeling

In order to carry out the optimal tuning of the RT parameters, allowing to provide the effective control of the RT process and taking into account the influence of the external network on these parameters, it is necessary to carry out a wide range of calculations of normal and abnormal quasi-steady-state and transient processes in the electric power system. Mathematical modeling is widely used for such studies. For the optimal tuning of the PT parameters, there is a need for the modeling of a large EPP, i.e., it is necessary to detail each functional unit not only of a certain object, but also of the entire aggregate EPP model. This is due to the fact that at the significant equivalization of the EPS schemes, it is impossible to take into account the influence of individual elements on the EPS mode [22] and on the turbine operation in particular. The dynamics of the processes, especially at the occurrence of perturbations, differs for large and for small models of EPP [23].
The mathematical model of a large EPP, even taking into account partial equivalence, always contains a rigid, nonlinear system of high order differential equations. Such a system cannot be solved analytically and according to the theory of discretization methods for ordinary differential equations, is poorly conditioned on the restrictive conditions of the applicability of their numerical integration methods: the solutions of the differential equation must satisfy the Lipschitz condition, the solution interval length is limited by the Dalquist theorem, etc. [24,25]. It is possible to improve the conditionality by reducing the rigidity, the differential order, or by limiting the solution interval. It is realizable only at the expense of essential simplifications and restrictions: the decomposition of modes and processes in EPS; the use of single-line calculation schemes instead of three-phase; the description of network elements by static mathematical models in the form of corresponding algebraic equations; the restriction of the process’ reproduction interval, etc. At the same time, regardless of simplifications and limitations, the methodical error of the solution, inherent in numerical integration, always remains unknown [26]. As a result, the reliability of such calculations is often low and also uncertain, which is confirmed by the comparison of simulation results with the field data performed in recent years [27].
Numerical modeling tools are also subject to these limitations. Parallel processing [28] is used in existing simulators to solve system models on multiple sequential processors. This approach is based on the assumption that the power system can be divided into smaller subsystems because of the communication time delay providing the decoupling necessary to compute the subsystem without temporal conflict. Thus, several subsystems can be divided between consecutive processors by the computational load. In this case, the condition that the time step of the simulation will be less than the time of traversal along the communication lines must be satisfied. However, this method has some limitations [29,30].
There are other approaches to modeling large EPSs that implement the separation of the circuit and the simulated equipment between subsystems of two types [31,32]: in the first type, the calculation of electromagnetic transient (EMT) processes is performed (detailed modeling of an individual element of the EPS); in the second one, the transient stability analysis (TSA) simulation is carried out. The principle of these approaches is based on the fact that EMT is carried out on the SHS, to which the TSA subsystem is connected through the Thevenin (or Norton) equivalent scheme, which represents an external EPS. The use of SHS for EMT makes it possible to study transient processes in specific equipment during short circuits, switching, lightning discharges, and simulate devices based on power semiconductor technology with a small simulation step. However, the use of TSA does not allow for fully and reliably reproducing the processes in the external EPS, since it inevitably uses the simplifications and limitations listed above.
Thus, even with different approaches to modeling large EPS using digital SHS, mathematical models of electrical machines are simplified; network elements are represented by static models; and a different integration step is used in separate “parts” of the EPS (the detailed modeled part, as a rule, has a step of 50 μs; the rest is 2 ms), which leads to the need to exchange information between them with the largest used step. As a result, the problem of the comprehensiveness and reliability of the calculations of the regimes and processes in real EPS still persists.
A methodological alternative that allows for solving the problem of the sufficiently comprehensive and reliable modeling of the FV process for its optimal setting is an approach that is a hybrid simulation [33]. This approach consists of applying several modeling methods at once (analogue, digital, and physical). Based on the hybrid approach, a multiprocessor hardware and software system has been developed, HRTSim [21], which was used as a tool to reproduce the topology, modes, and processes of a fragment of a real EPS to solve the problem of the sufficiently complete and reliable modeling of the FV process and its optimal setting. The block diagram of HRTSim configuration is shown in Figure 2.
  • The processes in the main equipment of the EPS (electric machines, transformers, transmission lines, etc.) are directly interrelated and are determinant, and the mathematical models describing them are very conservative and differ mainly in the values of the parameters. This substantiates the possibility of their simulation by the method of a continuous implicit integration using integrators based on operational amplifiers (analog method). This approach allows us to exclude the decomposition of the modes and processes, the simplification of the mathematical models of equipment, the problem of convergence of a numerical solution, the limitation of the reproduction interval of processes, and the methodological error of solving differential equations.
  • The auxiliary equipment (control and regulation systems, etc.) and the mathematical models describing them are extremely diverse. In this regard, they are simulated at the digital level by the methods of numerical integration and the results of the solution are entered into the analog level by means of digital-analog transformation. Additionally, at the digital level is setting the parameters of the simulated equipment and the processing and transmission of information between different levels of simulation and the user through analog-digital converters. The digital approach provides flexibility in forming the necessary automatic regulation and control systems.
  • Physical method of modeling is used due to the lack of reliable mathematical description of the reproduction of the switching processes, including in power semiconductor switches, by means of digitally controlled analog switches (DCAS). At the physical level, the interaction of the simulated main equipment of the EPS is carried out, similar to how it happens in a real power system. For this purpose, the conversion of continuous input/output current signals into their corresponding model physical currents by means of a precision analog multiplier is used. This approach allows for excluding information restrictions on the scale of the modeled EPS, that theoretically can be unlimited.

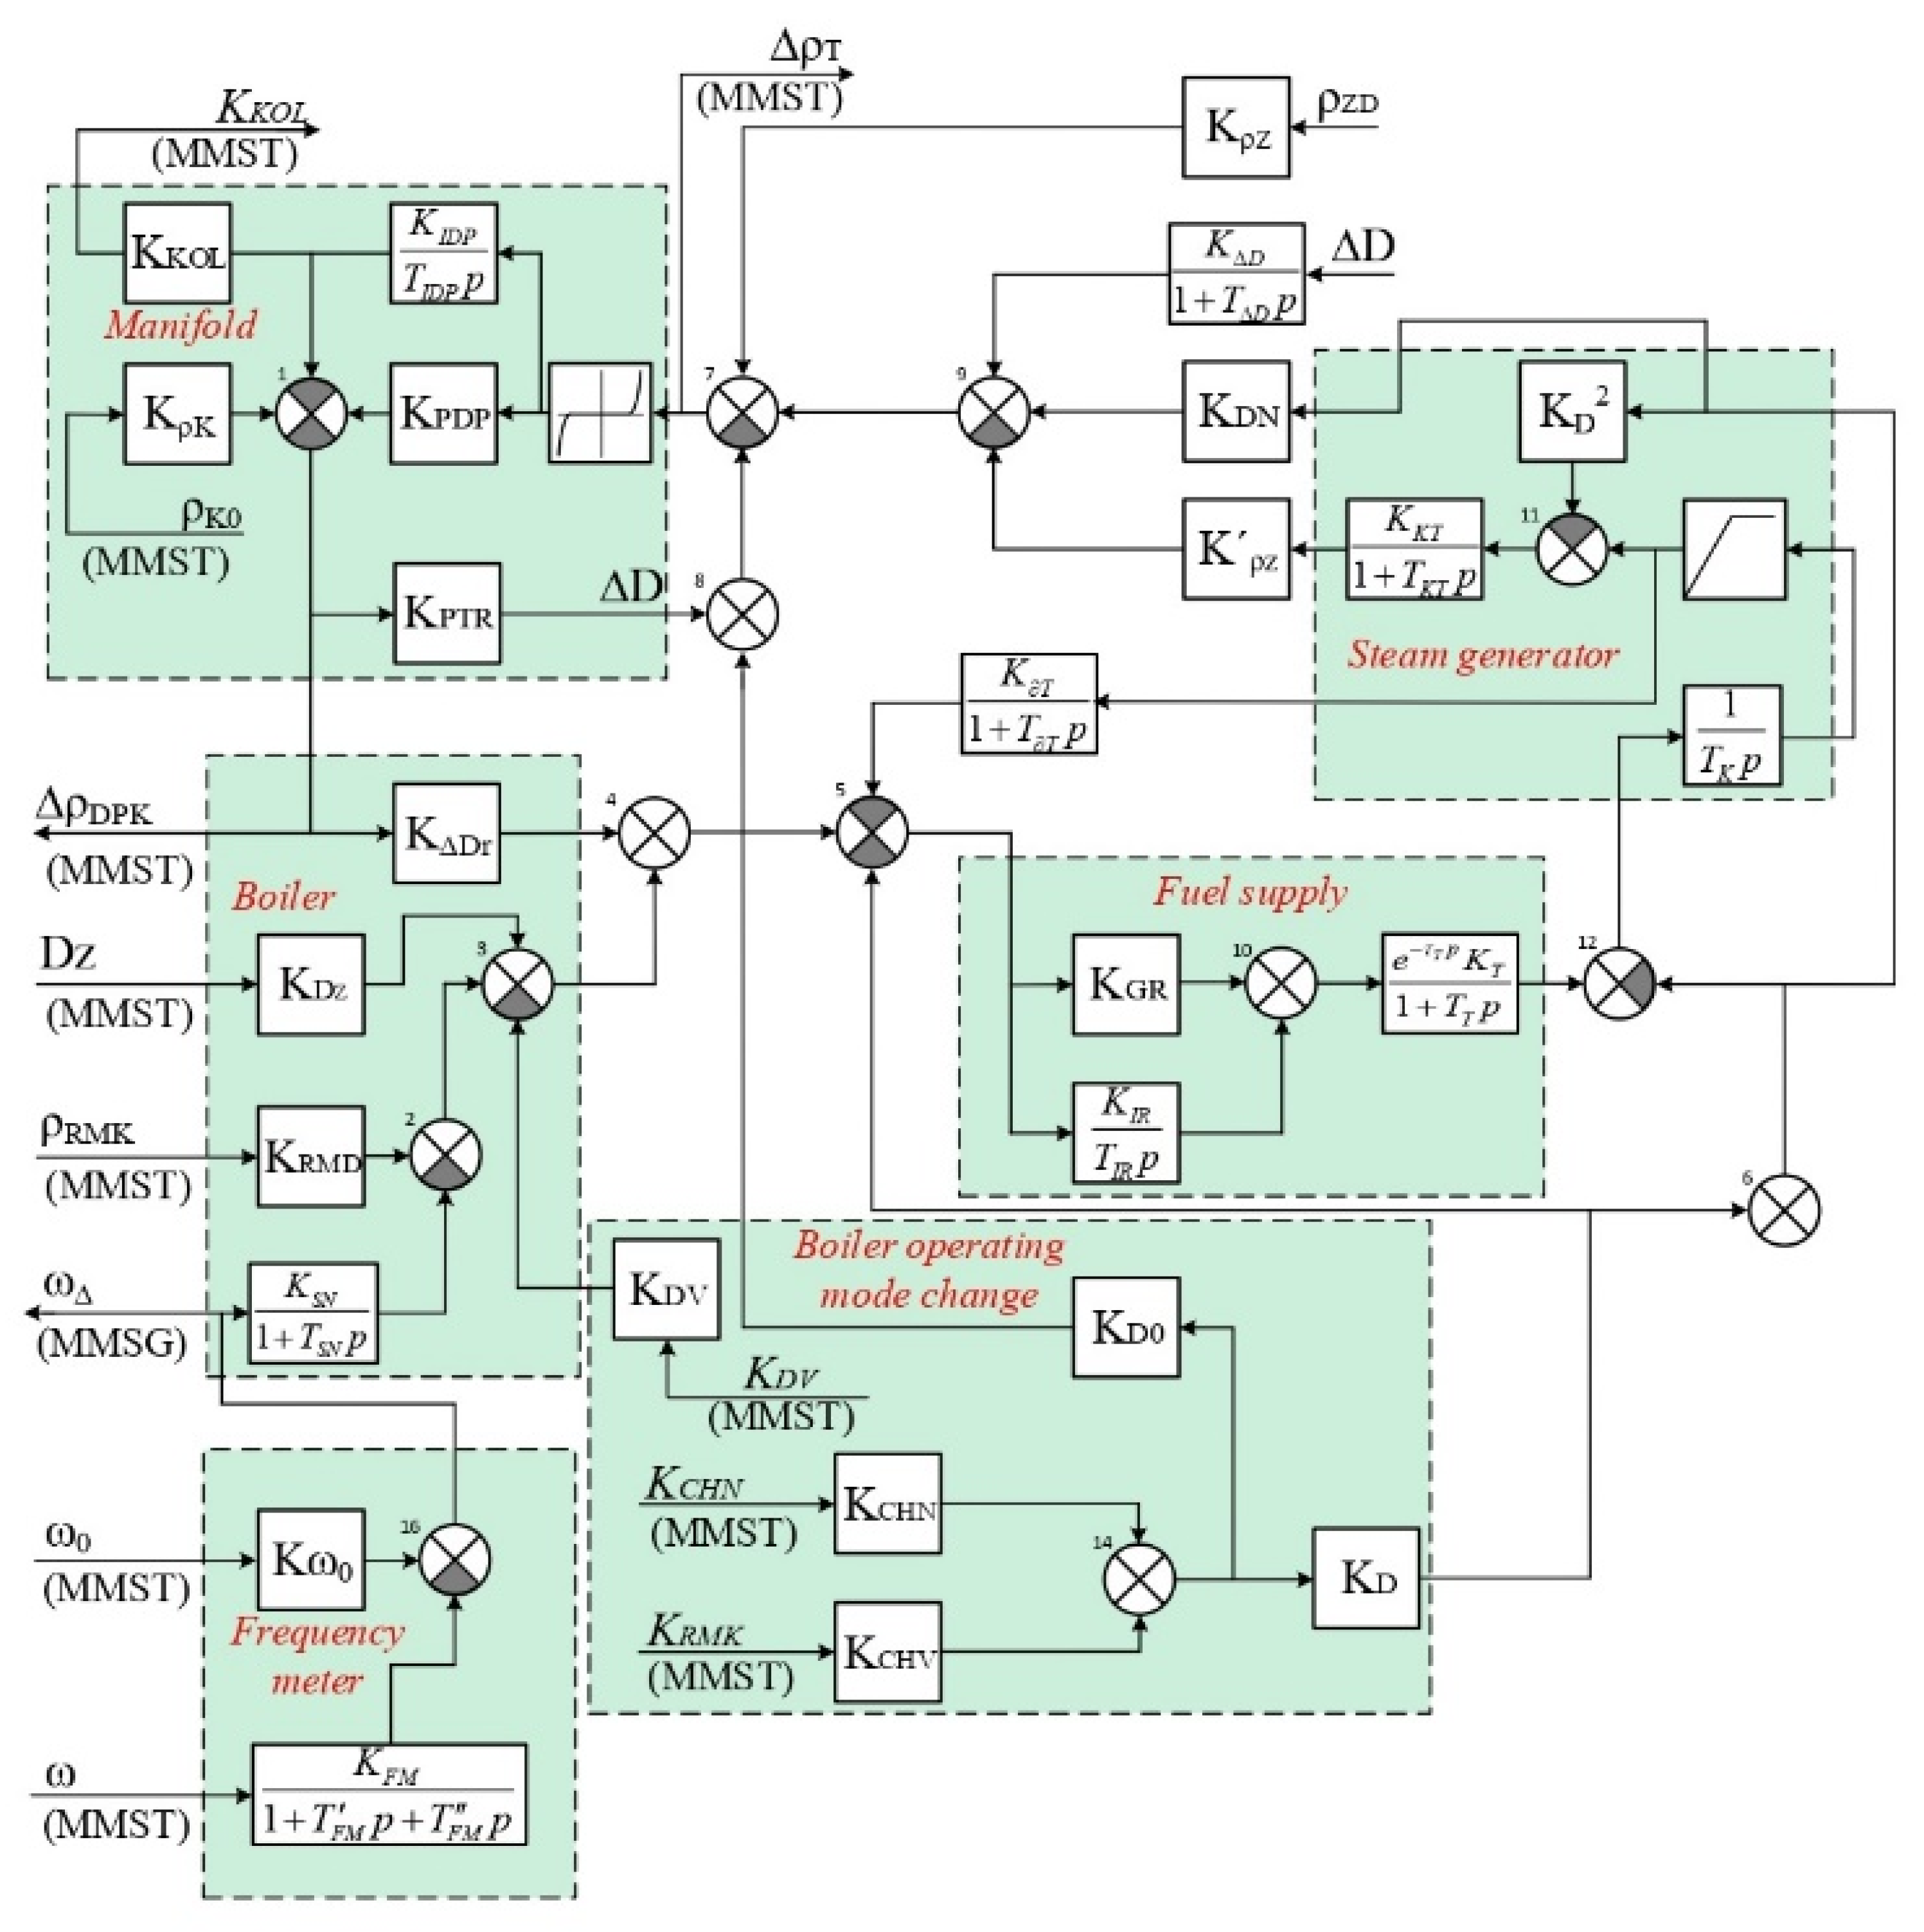
3.2. Development of a Mathematical Model of a Power Unit

In accordance with the hybrid approach, the modeling of the main elements of the power system is carried out by creating specialized hybrid processors (SHPs). The combination of such SHPs is an aggregate model of the power system. The block diagram of the power unit developed by SHP, taking into account the associated additional equipment: the prime mover–turbine and the excitation system (ES) of the synchronous generator (SG), including automatic control systems, is shown in Figure 3.
In this block diagram:
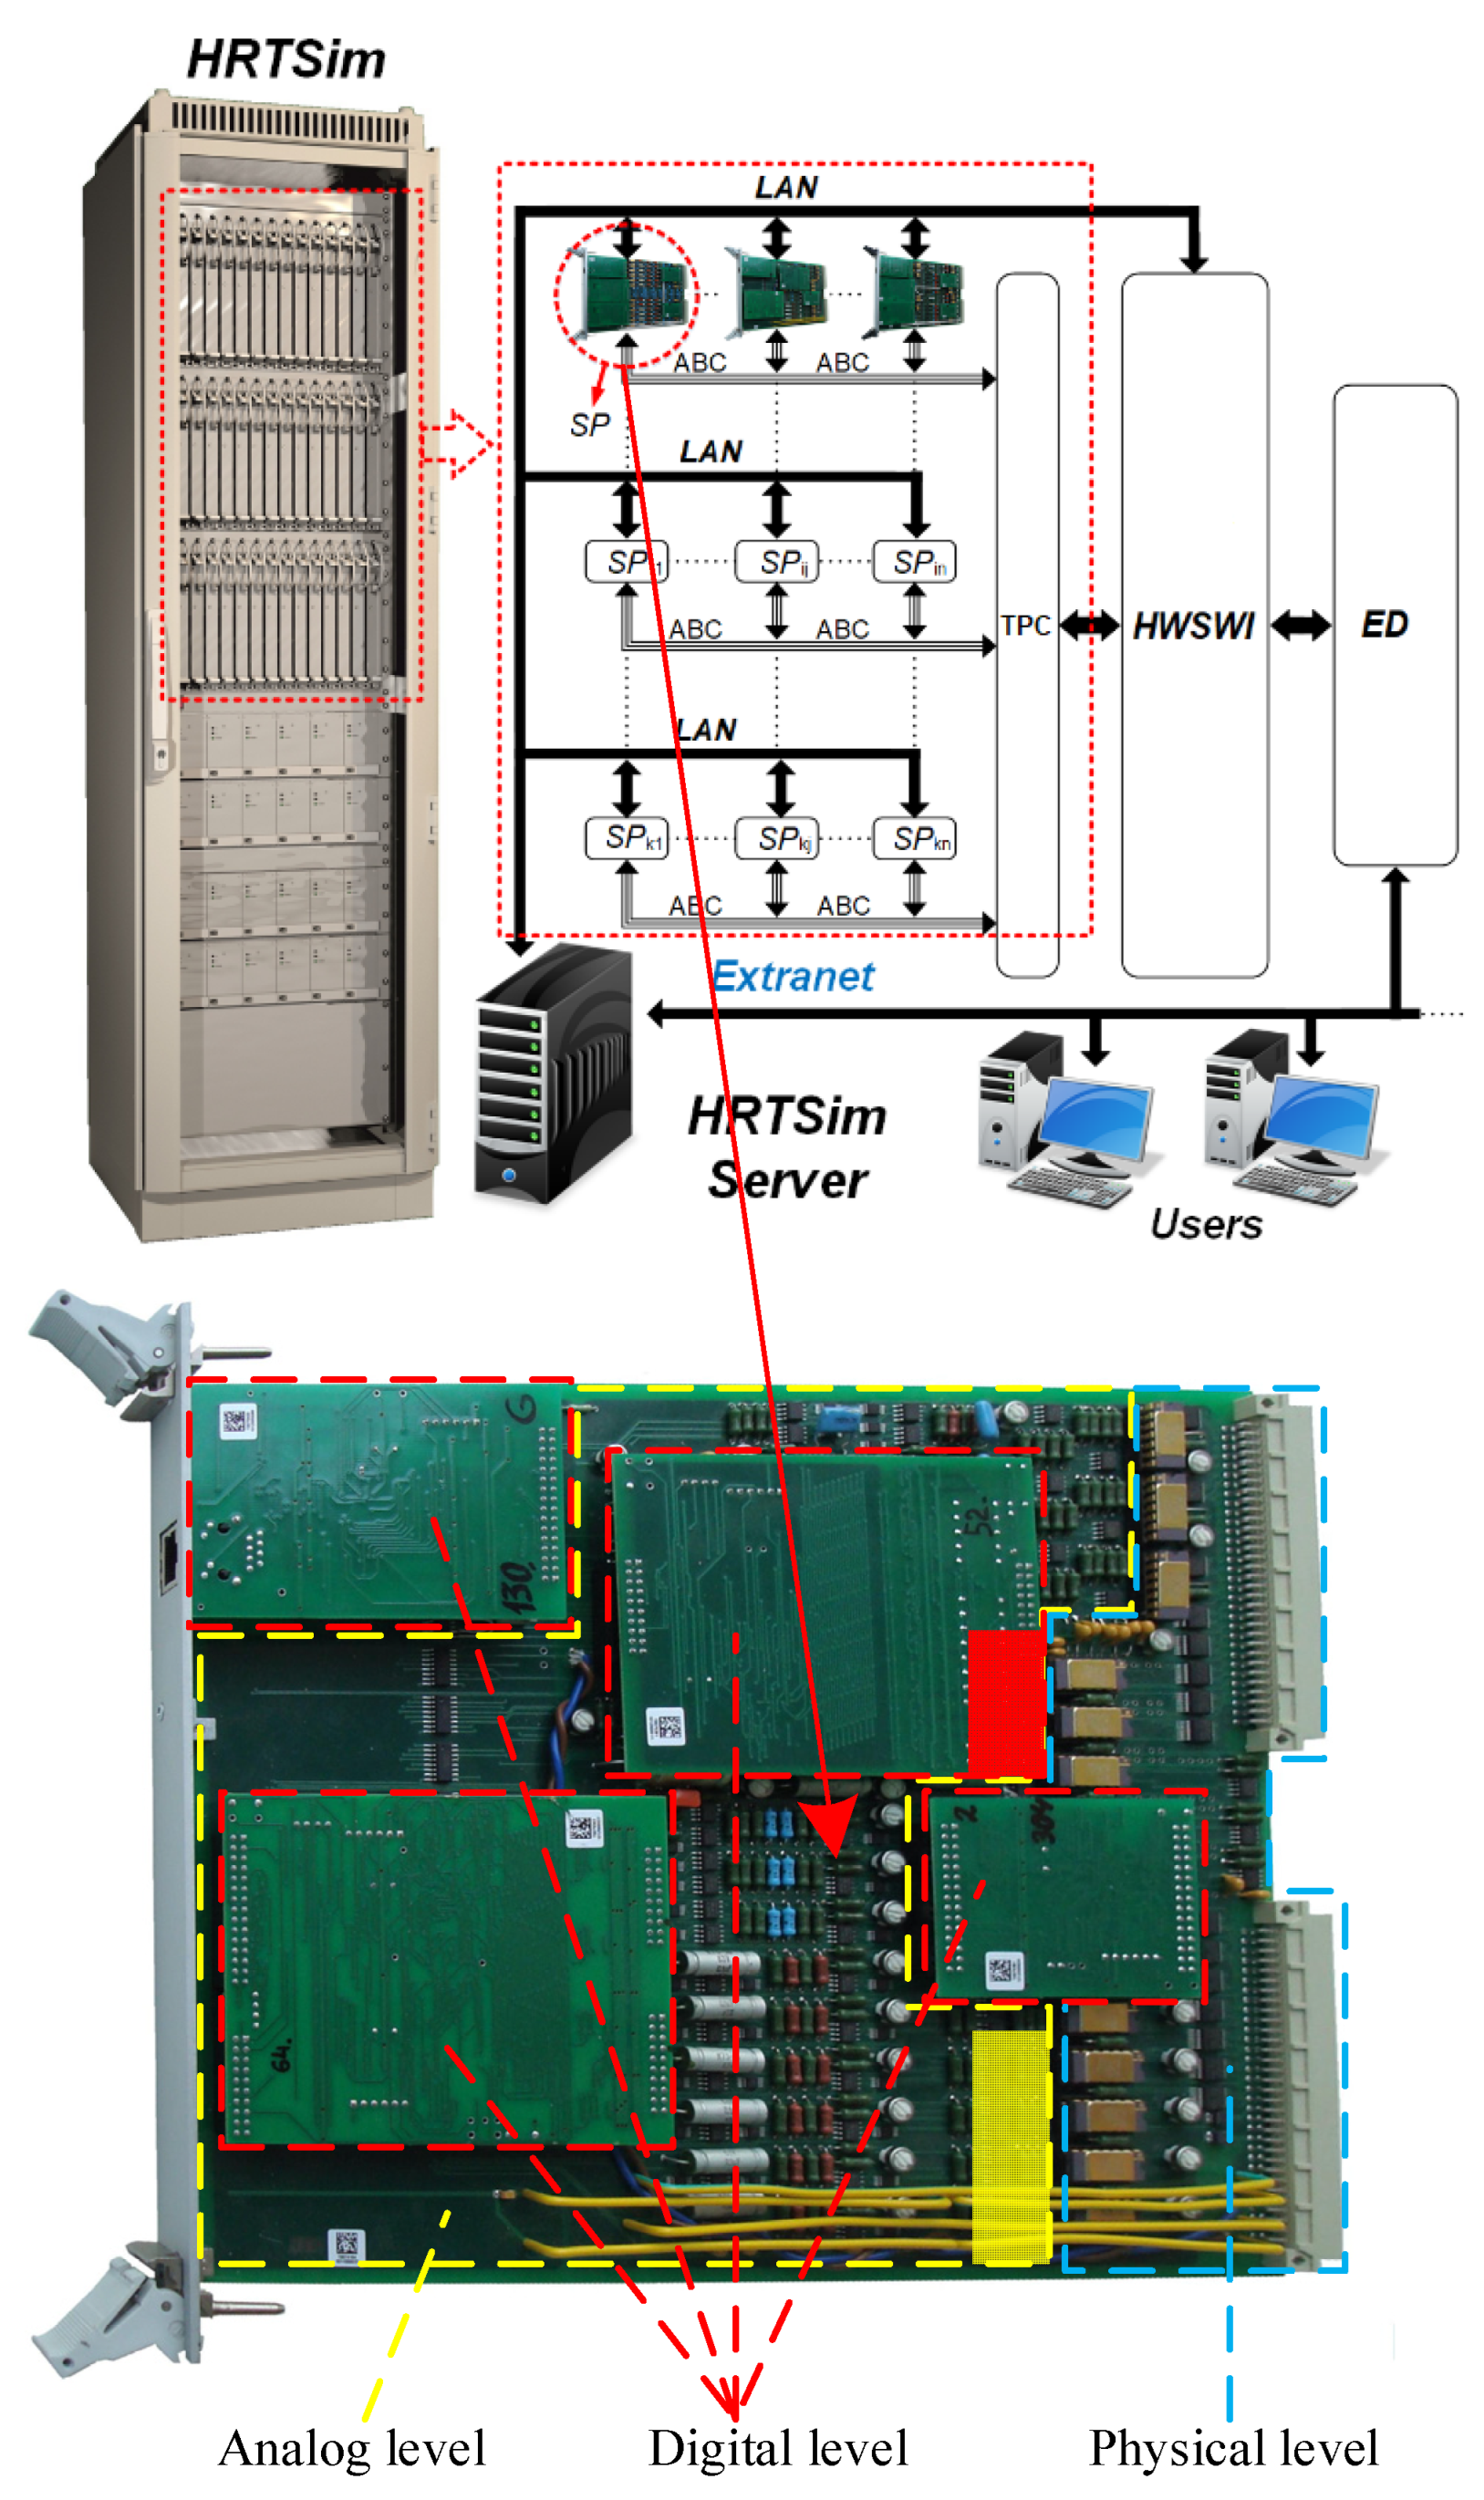
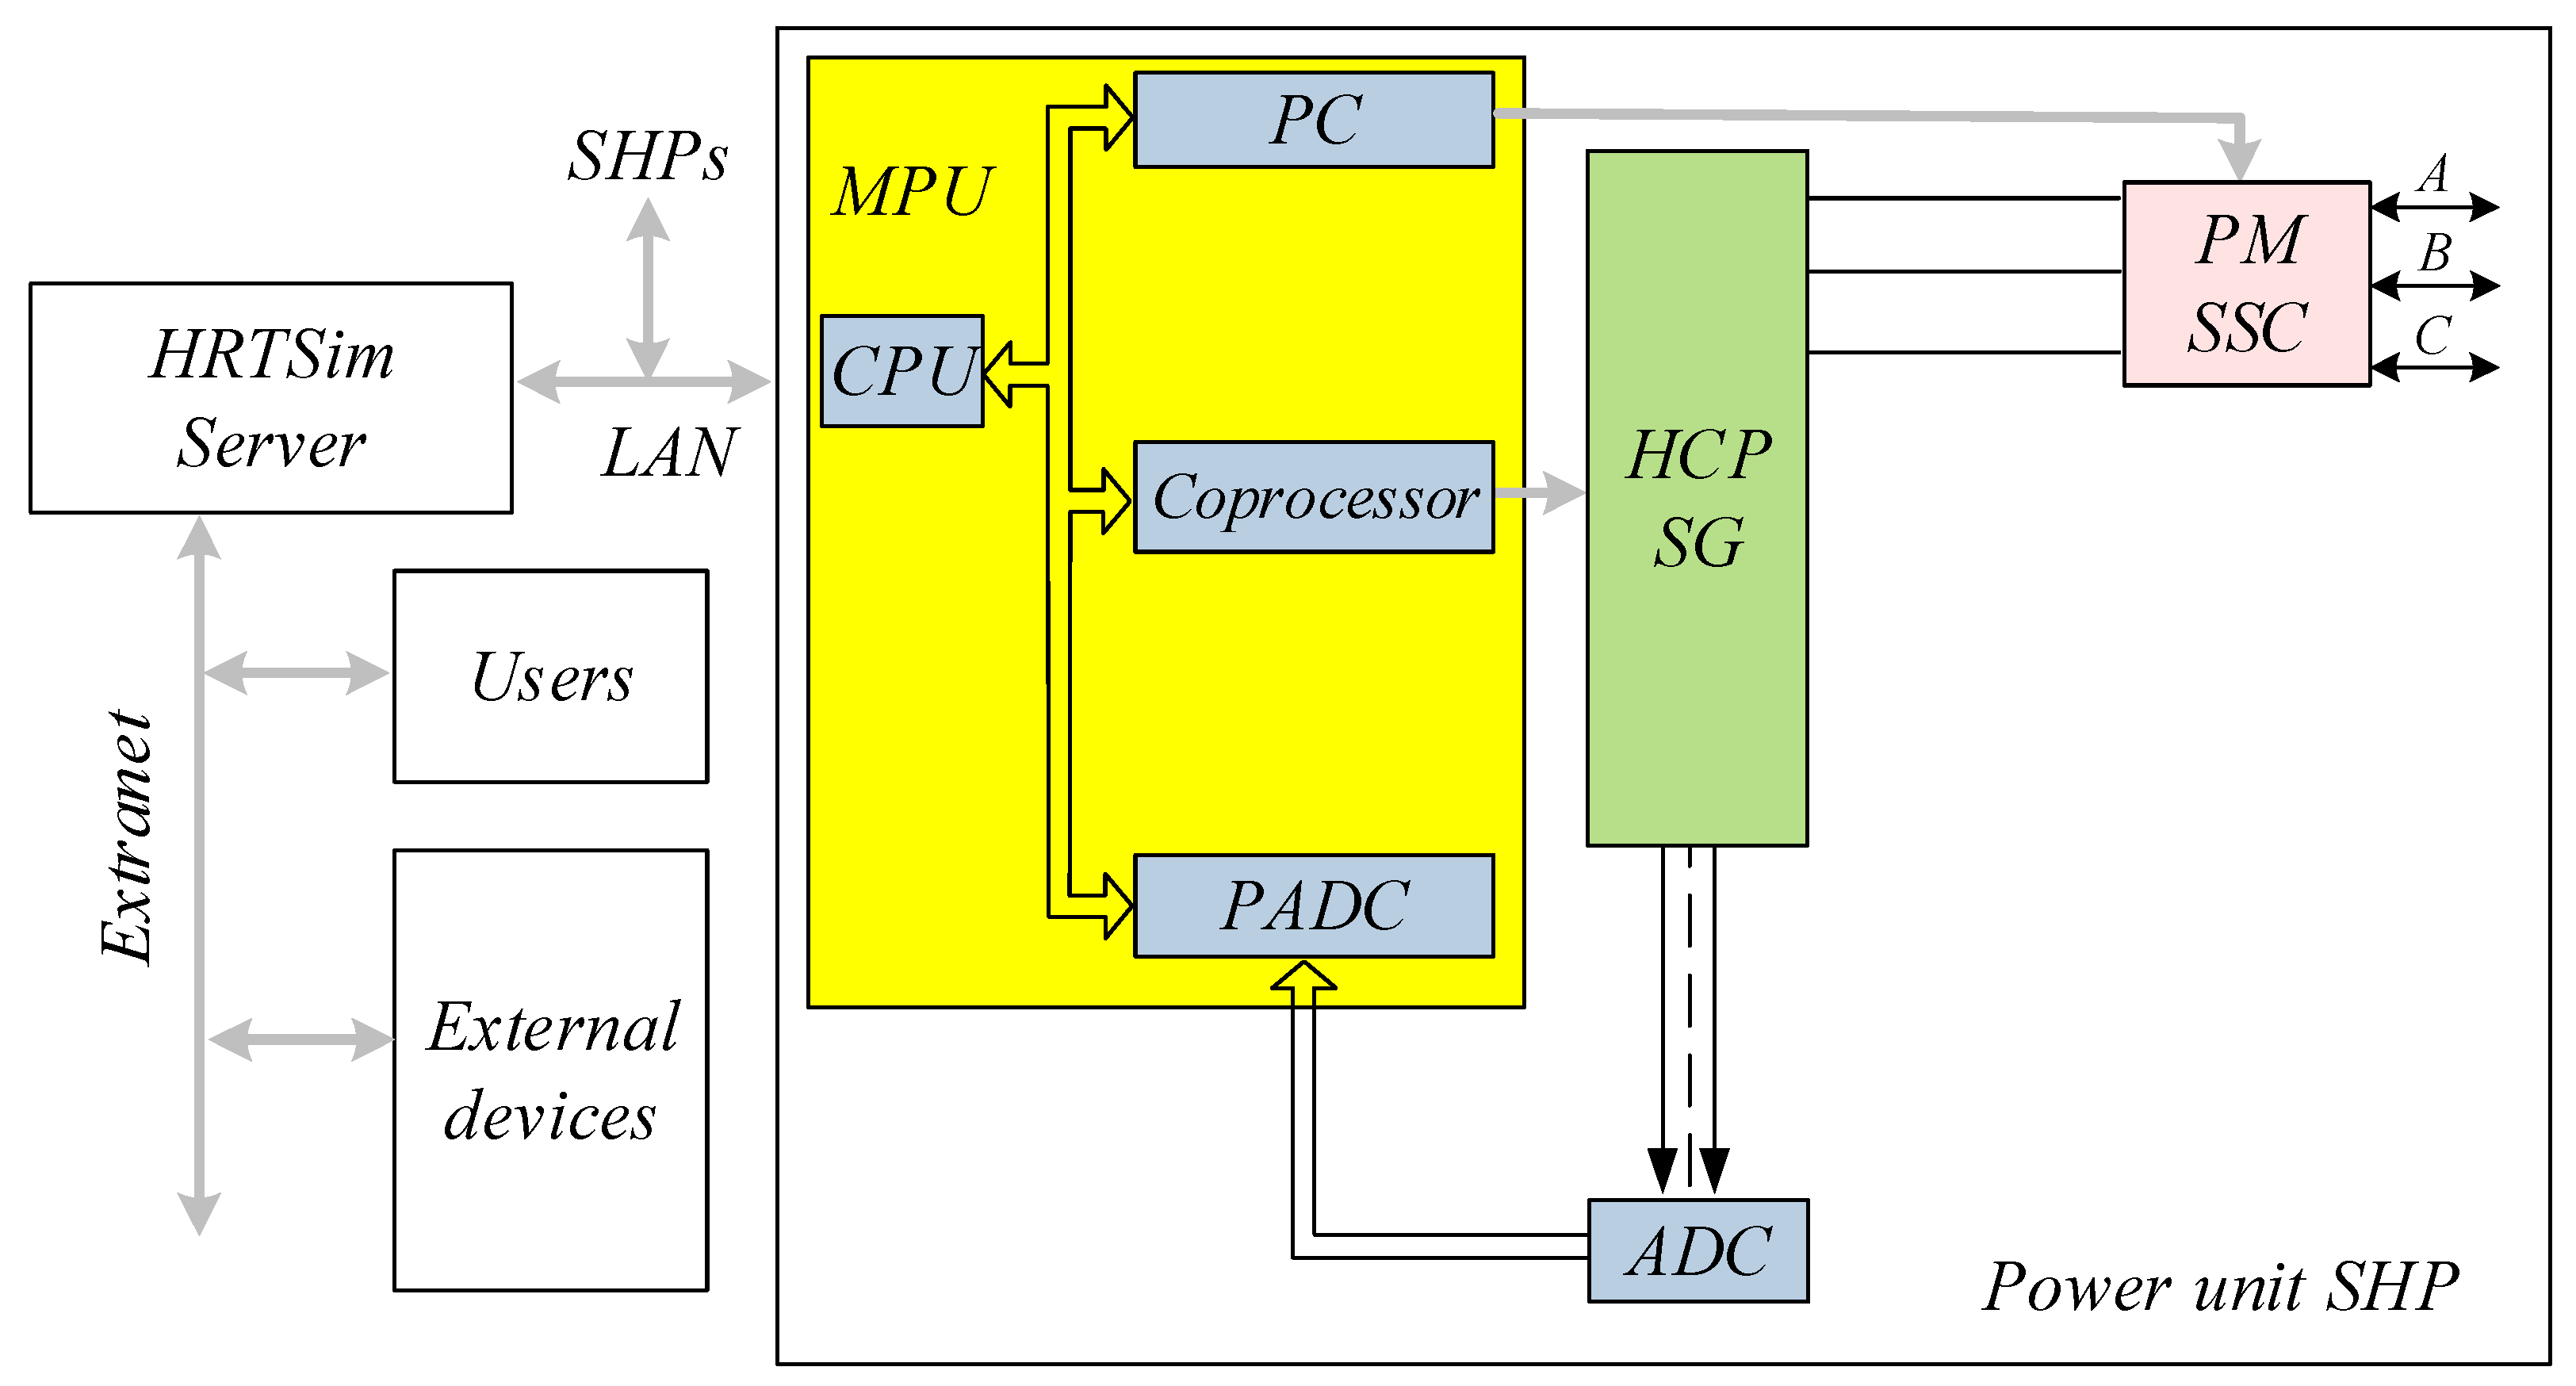
  • The microprocessor unit (MPU) provides all the information and control functions of the power unit. SHP: communication with the HRTSim server, reception and processing of the simulation data, the implementation of automatic control systems, and the control of simulated equipment parameters, including the status of DCAS used to simulate the operation of circuit breakers and short circuits by the physical model of series and shunt commutation (PM SSC).
  • The central processing unit (CPU) is designed to provide an interaction via the local area network (LAN) between the HRTSim server and the processor of analog-to-digital conversion (PADC), the coprocessor, and the processor of commutation (PC), and performs functions of receiving mode data from the HRTSim server and assigning them to the corresponding hybrid coprocessors (HCP), transferring simulation data to the HRTSim server, synchronizing the operation of all SHPs in the HRTSim.
  • After the analog-to-digital conversion (ADC), the PADC provides the reading and processing of the HCP simulation data, as well as the functional control, including the dynamic control, of the parameters of the simulated equipment, particularly of the electrical machine, set in the corresponding HCP, as well as transferring the necessary mode data and parameters to the coprocessor.
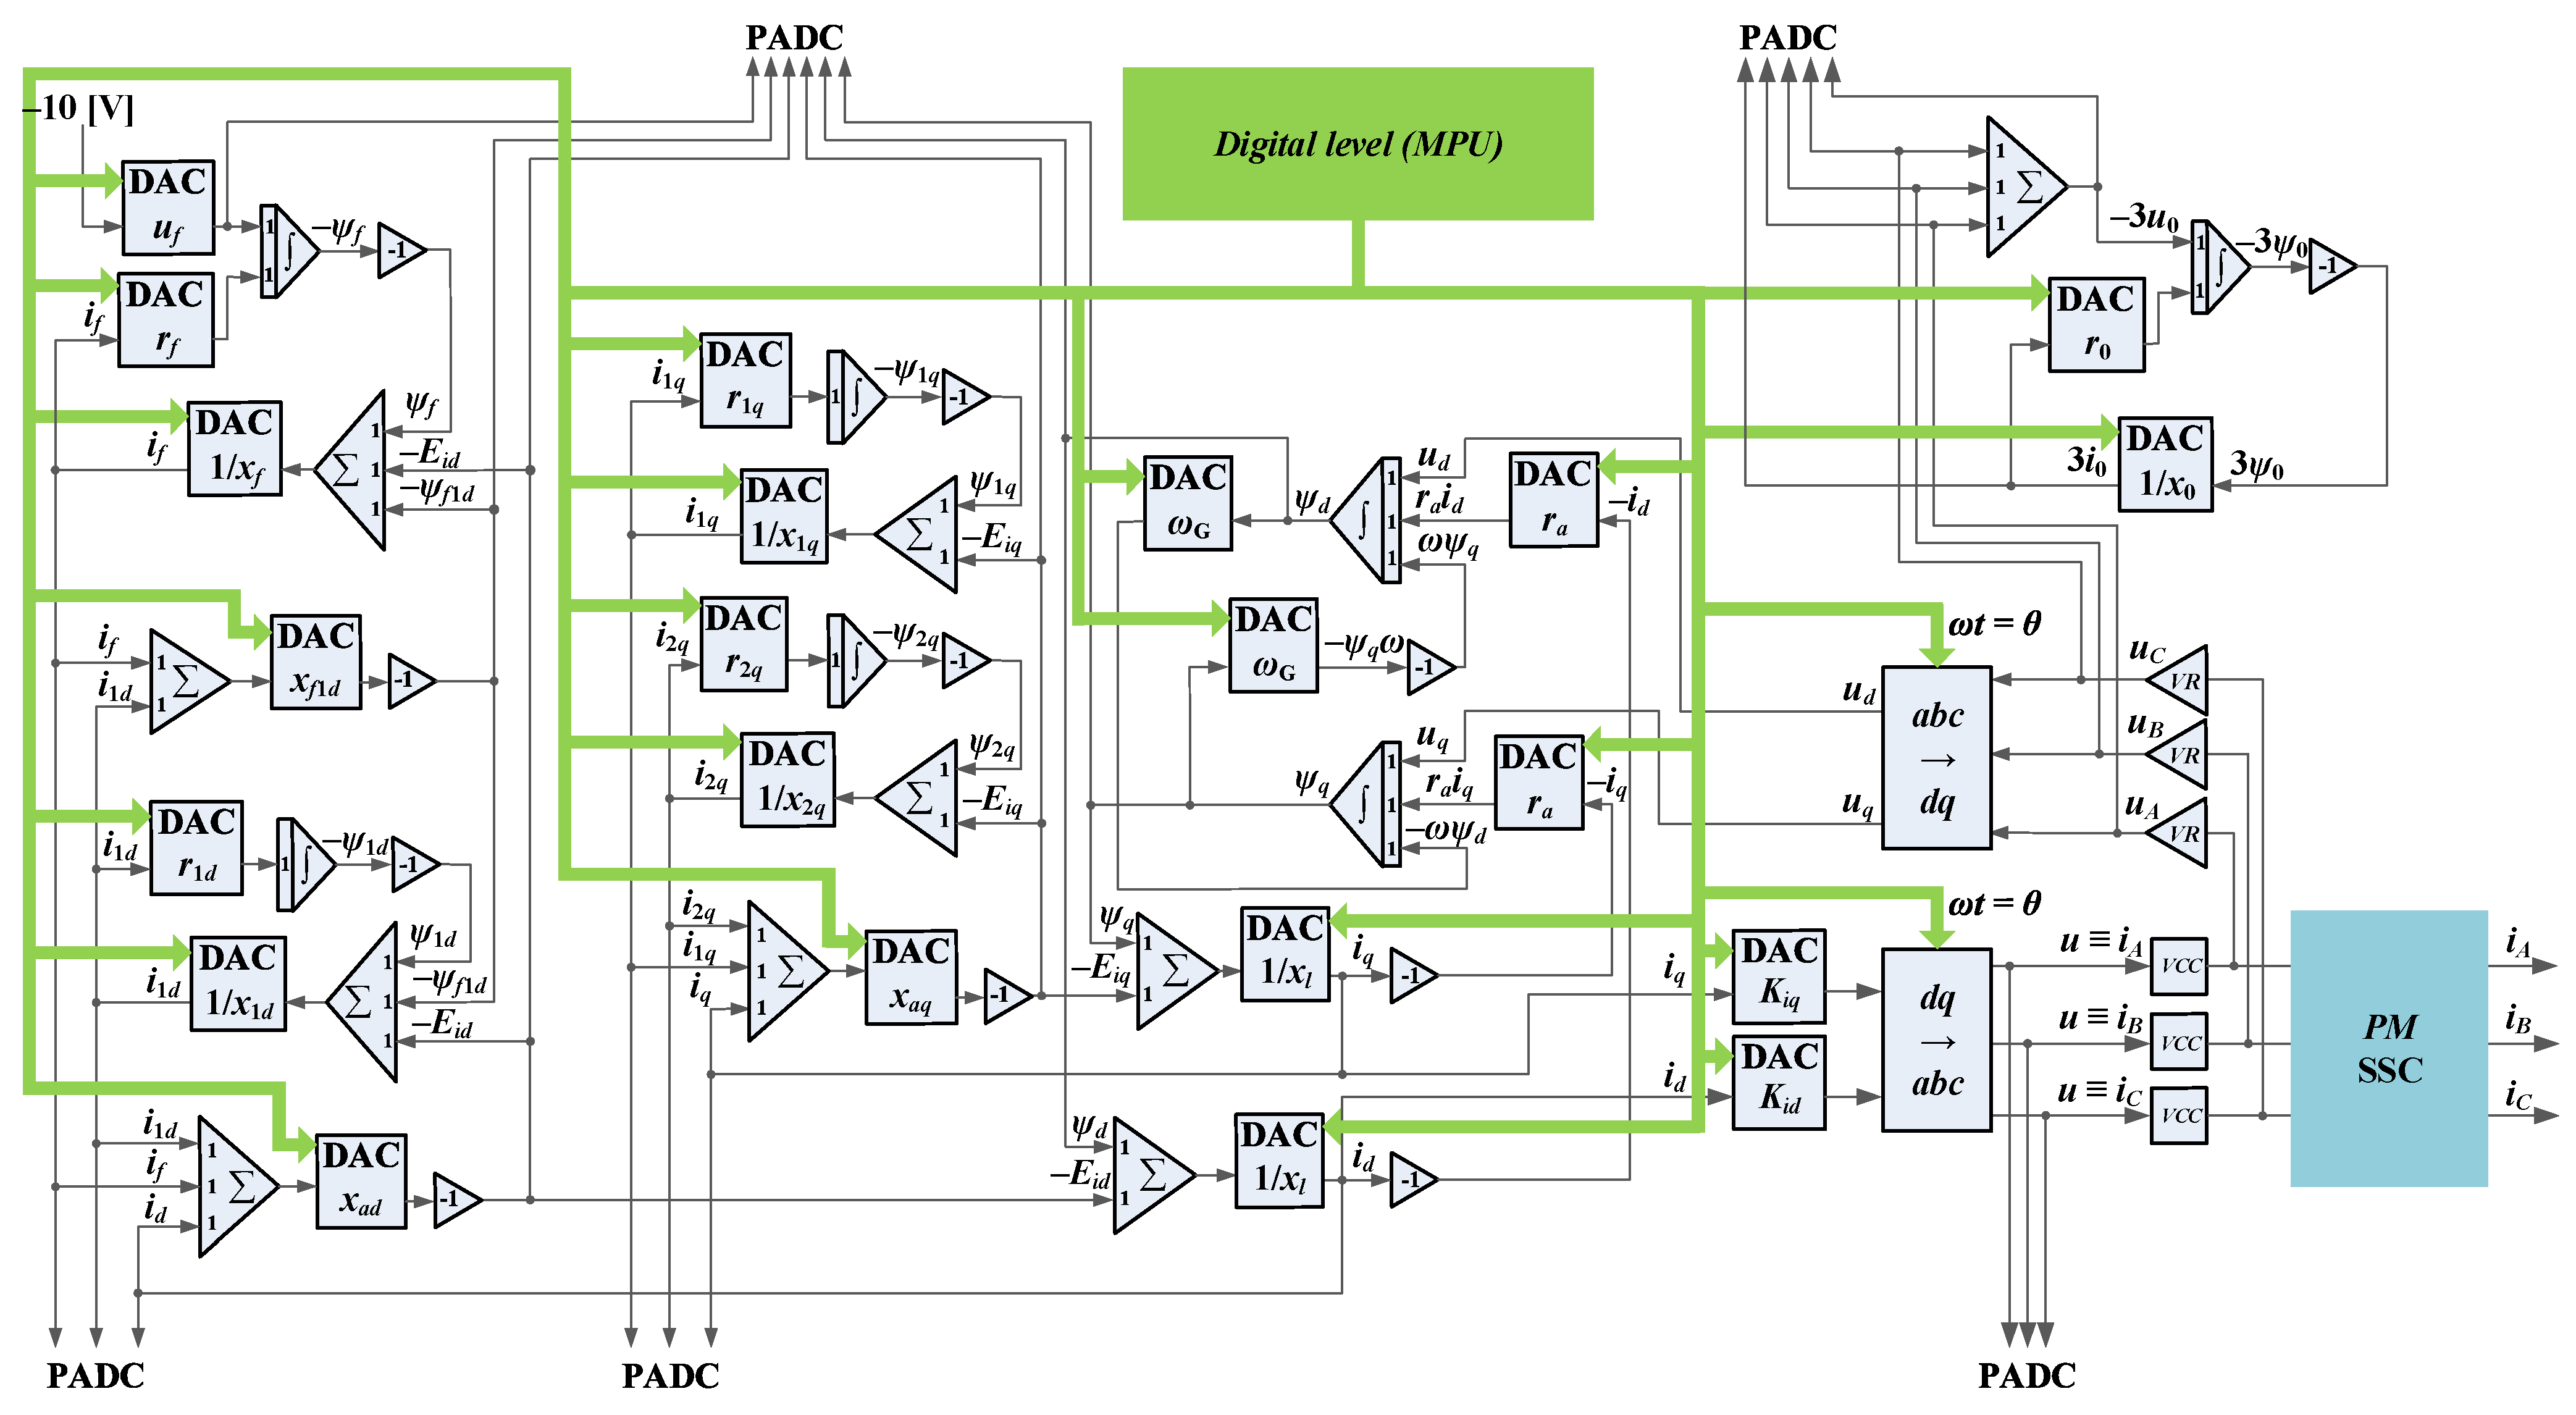
  • The coprocessor receives data from the CPU and PADC to solve prime mover and excitation system models and to implement the automatic control system, as well as to form and transmit parameters into the hybrid coprocessor of the synchronous generator (HCP SG). Inside the HCP SG, the analog real-time solution of the stiff nonlinear system of the differential equations of the complete and reliable mathematical model of the synchronous generator is performed. The mathematical variables of the phase currents, formed continuously as a result of solution, represented by voltages, are transformed by means of voltage–current converters (VCC) into the corresponding model physical currents. Continuously formed in the nodes of stator circuits phase voltages, dependent mathematical variables are introduced into the HCP SG by means of voltage repeaters (VR), which exclude the physical influence of these feedbacks.
  • Each HCP is a specialized parallel digital-to-analog structure of the methodically accurate continuous implicit integration in real time and over an unlimited interval of systems of differential equations of mathematical models of simulated equipment. The control of the parameters of these mathematical models is performed by means of digital-to-analog converters (DACs). The continuous mathematical variables of input–output currents represented by instantaneous voltage values are converted into their corresponding model physical currents.
  • The PC generates the control actions for the DCAS of PM SSC.
The developed functional scheme of the GSP SG is shown in Figure 4.
The HCP SG was developed, according to the SG mathematical model in dq axes [34]. The versatility of HCP SG necessary for modeling various types of synchronous machines is provided by the presence of digital-to-analog converters in the above scheme, through which the MPU of the power unit SHP and the server of the HRTSim can set any constant or functionally controlled, including non-linear coefficients of these equations, which are the parameters of the simulated machines.
According to the previously provided methodology, it is possible to carry out an optimal setting of the parameters of the FV only with the use of a detailed model of the PM. This is connected with the fact that the process of the change in the steam turbine torque at the regulation of the position of the corresponding valves is determined by the amount of steam, at a certain pressure, enclosed between regulating the valves of the corresponding turbine stages and in the path of intermediate superheating. In this connection on the basis of the parameters of the real PM, consisting of a boiler unit (Figure 5), a steam turbine (Figure 6), and their control systems, its mathematical model has been synthesized.
The developed mathematical model of the PM, shown in Figure 5 and Figure 6, consists of several parts: the mathematical model of the steam turbine (MMST), the mathematical model of the boiler unit (MMBU), the turbine power regulator with its various control loops and channels, and the turbine control mechanism (TCM). In addition, the values of the generator frequency and active power entered in the MMST and MMBU are the solution by means of the HCP SG of the system of equations of the mathematical model of the synchronous generator (MMSG). In Figure 6, the interconnected set of links, which form the channels of control actions of MFV and SFV, is highlighted in bold. All the coefficients of the developed PM model are described in Nomenclature.

3.3. Testing for the Ascent of the Link of Delay in the Form of a Padé Function of the Second Order

The dynamics of the process of changing the torque of a steam turbine when adjusting the position of the corresponding valves is mainly determined by the parameters of the intermediate steam volumes enclosed between the control valves of the corresponding turbine stages and in the reheat path. Along with the operation of the automatic control system in a steam turbine, the development of long-term transient processes is significantly influenced by the operation of the boiler units of thermal power plants and their control systems, which maintain steam pressure in front of the turbine. In this regard, the mathematical model of the prime mover was supplemented with a corresponding detailed model of the boiler. The impact on the change in the performance of the boiler in the implemented mathematical model is generated by the fact of pressure deviation from the set value and frequency change.
The synthesized mathematical model consists of a set of elementary blocks: integrating links with restrictions, aperiodic links, differentiating links, and a delay link in the form of a Padé function of the second order:
W ( p ) = x ɞ b l x ( p ) x ɞ x ( p ) = e τ T p K T 1 + T T p
The assessment of the correctness of the operation of the delay link in the form of a Padé function was carried out when a changing signal was applied to the input at a given delay time T = 0.03 s (Figure 7). From the obtained values of Δt, it can be seen that the delay of the signal coincides with the specified value.

4. EPS Model Development

In order to further investigate the functioning of the FV and its optimal setting, a model of the surplus power district located in the Siberian EPS, Russia (Figure 8) was developed. In the given scheme, the generator G2 contains a detailed mathematical model of the PM, focused on the implementation of the setting of the FV parameters.
The choice of this EPS is due to the availability of a sufficiently complete database with the necessary information about the parameters and characteristics of the equipment (synchronous generators, transformers, power lines, etc.), including the algorithms and parameters of the setting devices of the operating automatics and reactive power compensation devices and the models of automatic control systems (automatic speed controllers—AFC, automatic excitation controllers—AEC), which are equipped with synchronous generators, as well as the availability of the verified data of tele-signals and telemetering of the operational–informational complex of the simulated EPS.
The model of EPS reproduces 500 kV, 220 kV, and 110 kV power grids with transformers and autotransformers of various capacities, main power plants with the reproduction of each power unit and/or generating unit, dynamic loads, and reactive power compensators. The composition of the elements of the modeled EPS is presented in Table 1.
The largest consumers of electric power of the developed model are mainly represented by metallurgical, mining, and ore enterprises and logging, oil, and chemical industries.

4.1. Verification of Simulation Results in Steady-State Mode

To perform a verification, this HRTSim model of EPS is compared with the field data. Moreover, the mathematical models of the auxiliary equipment (control systems, governors, etc.) and their settings implemented in both the real devices and the HRTSim are exactly identical.
Table 2 and Table 3 show the comparison results for the substations and transmission lines. For each resulting value, the relative error δ is calculated:
δ x = x F x H R T S i m x F 100 % ,
where:
x is the value of the mode parameter (voltage, current, and active power).
The results of the reproduction of the initial schematic-mode state of the modeled EPS showed an error of less than 2%, which is acceptable because the field data have the assumption of a 5% error determined by the telemetry devices of SCADA.

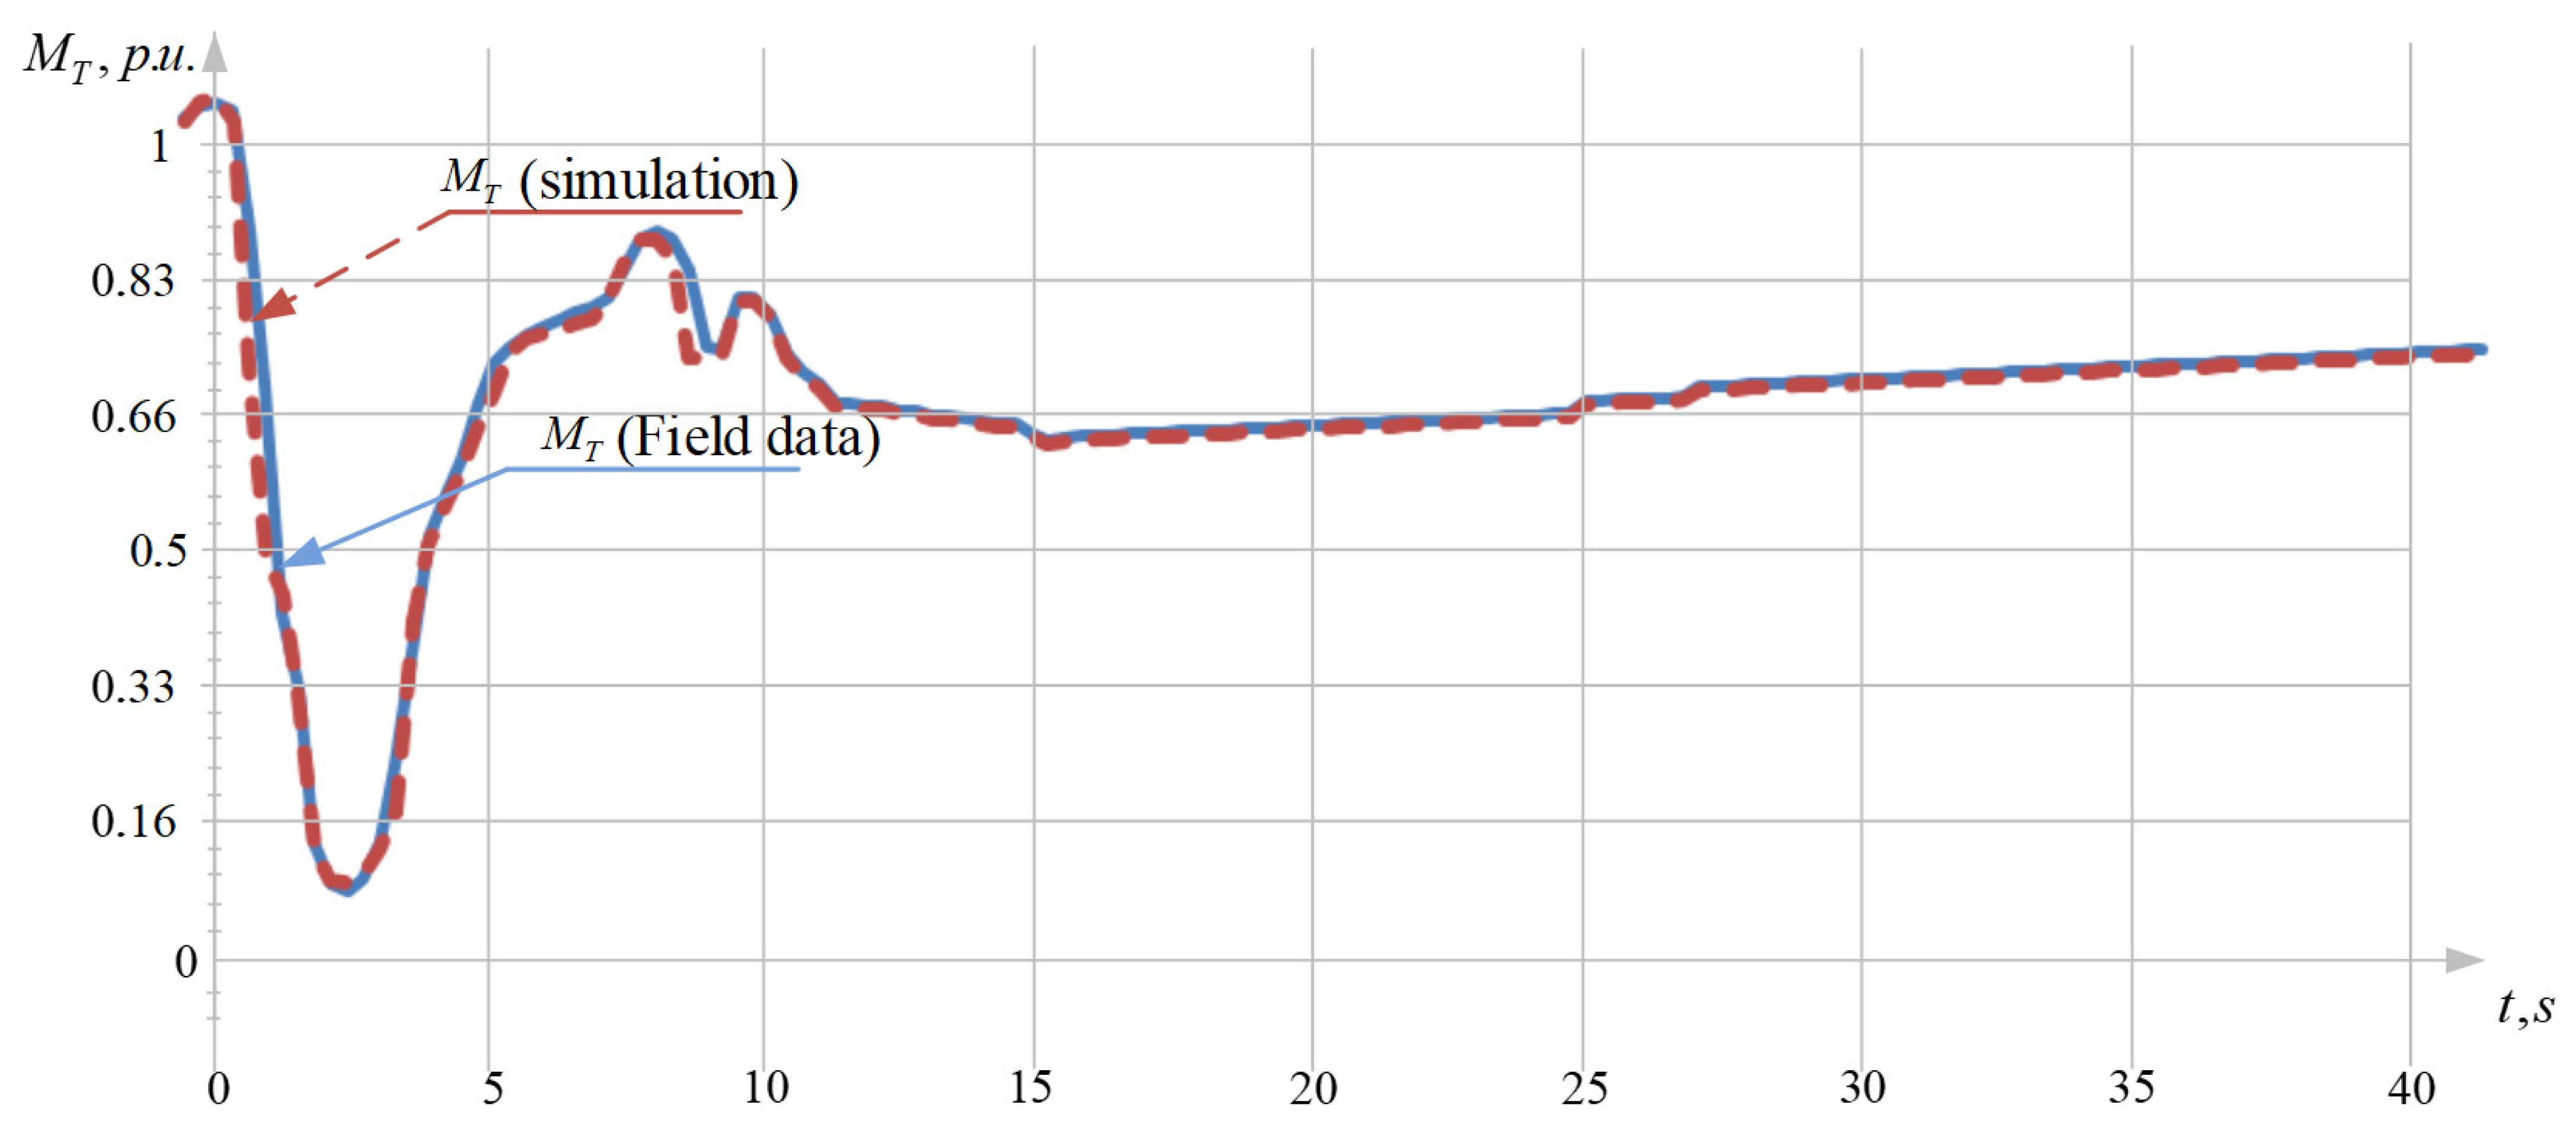
4.2. Verification of the Developed Power Unit Model
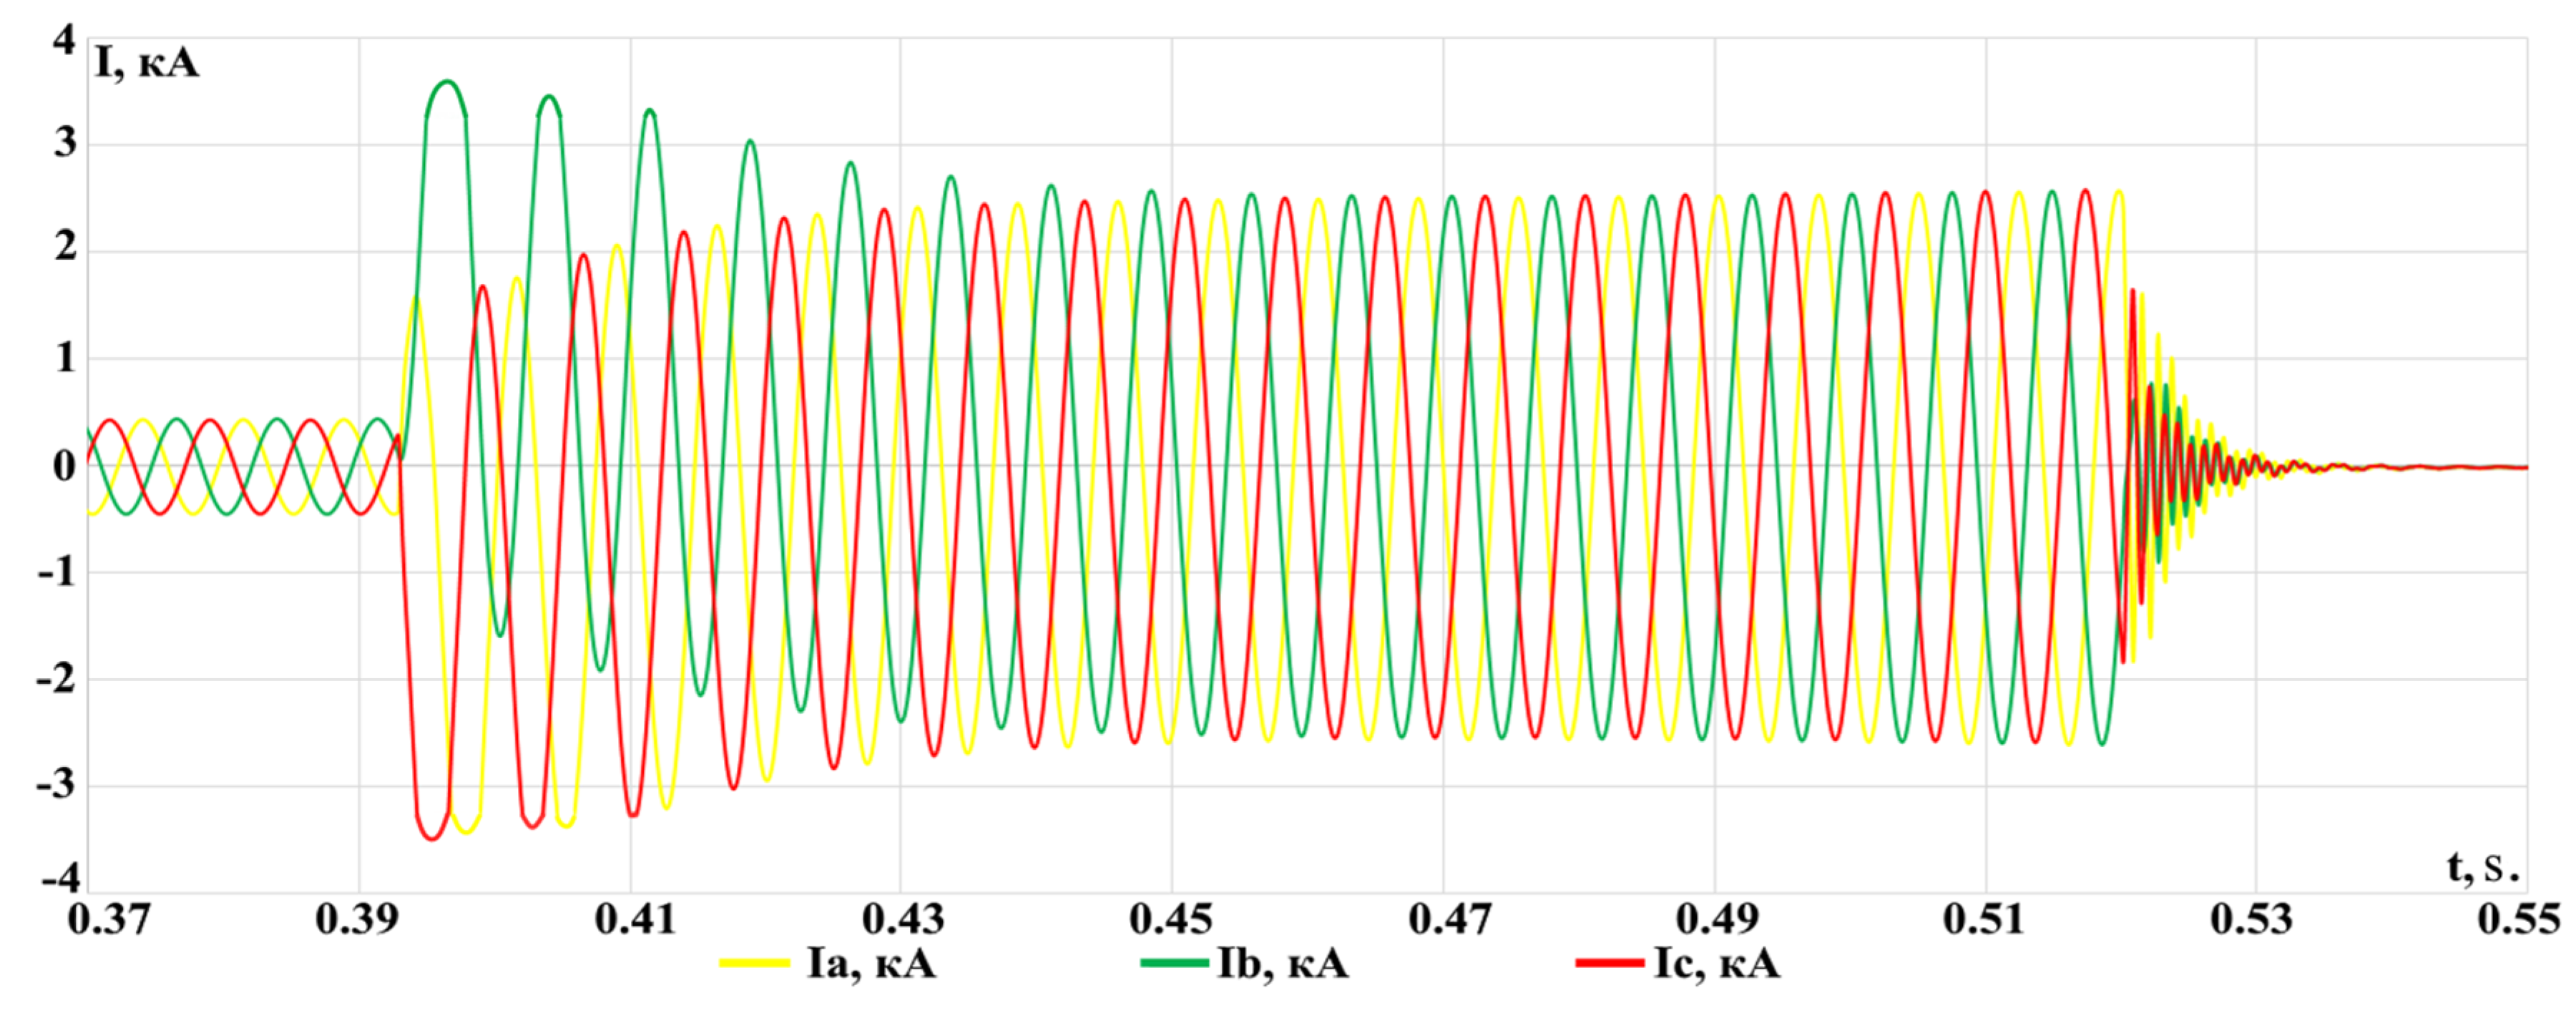
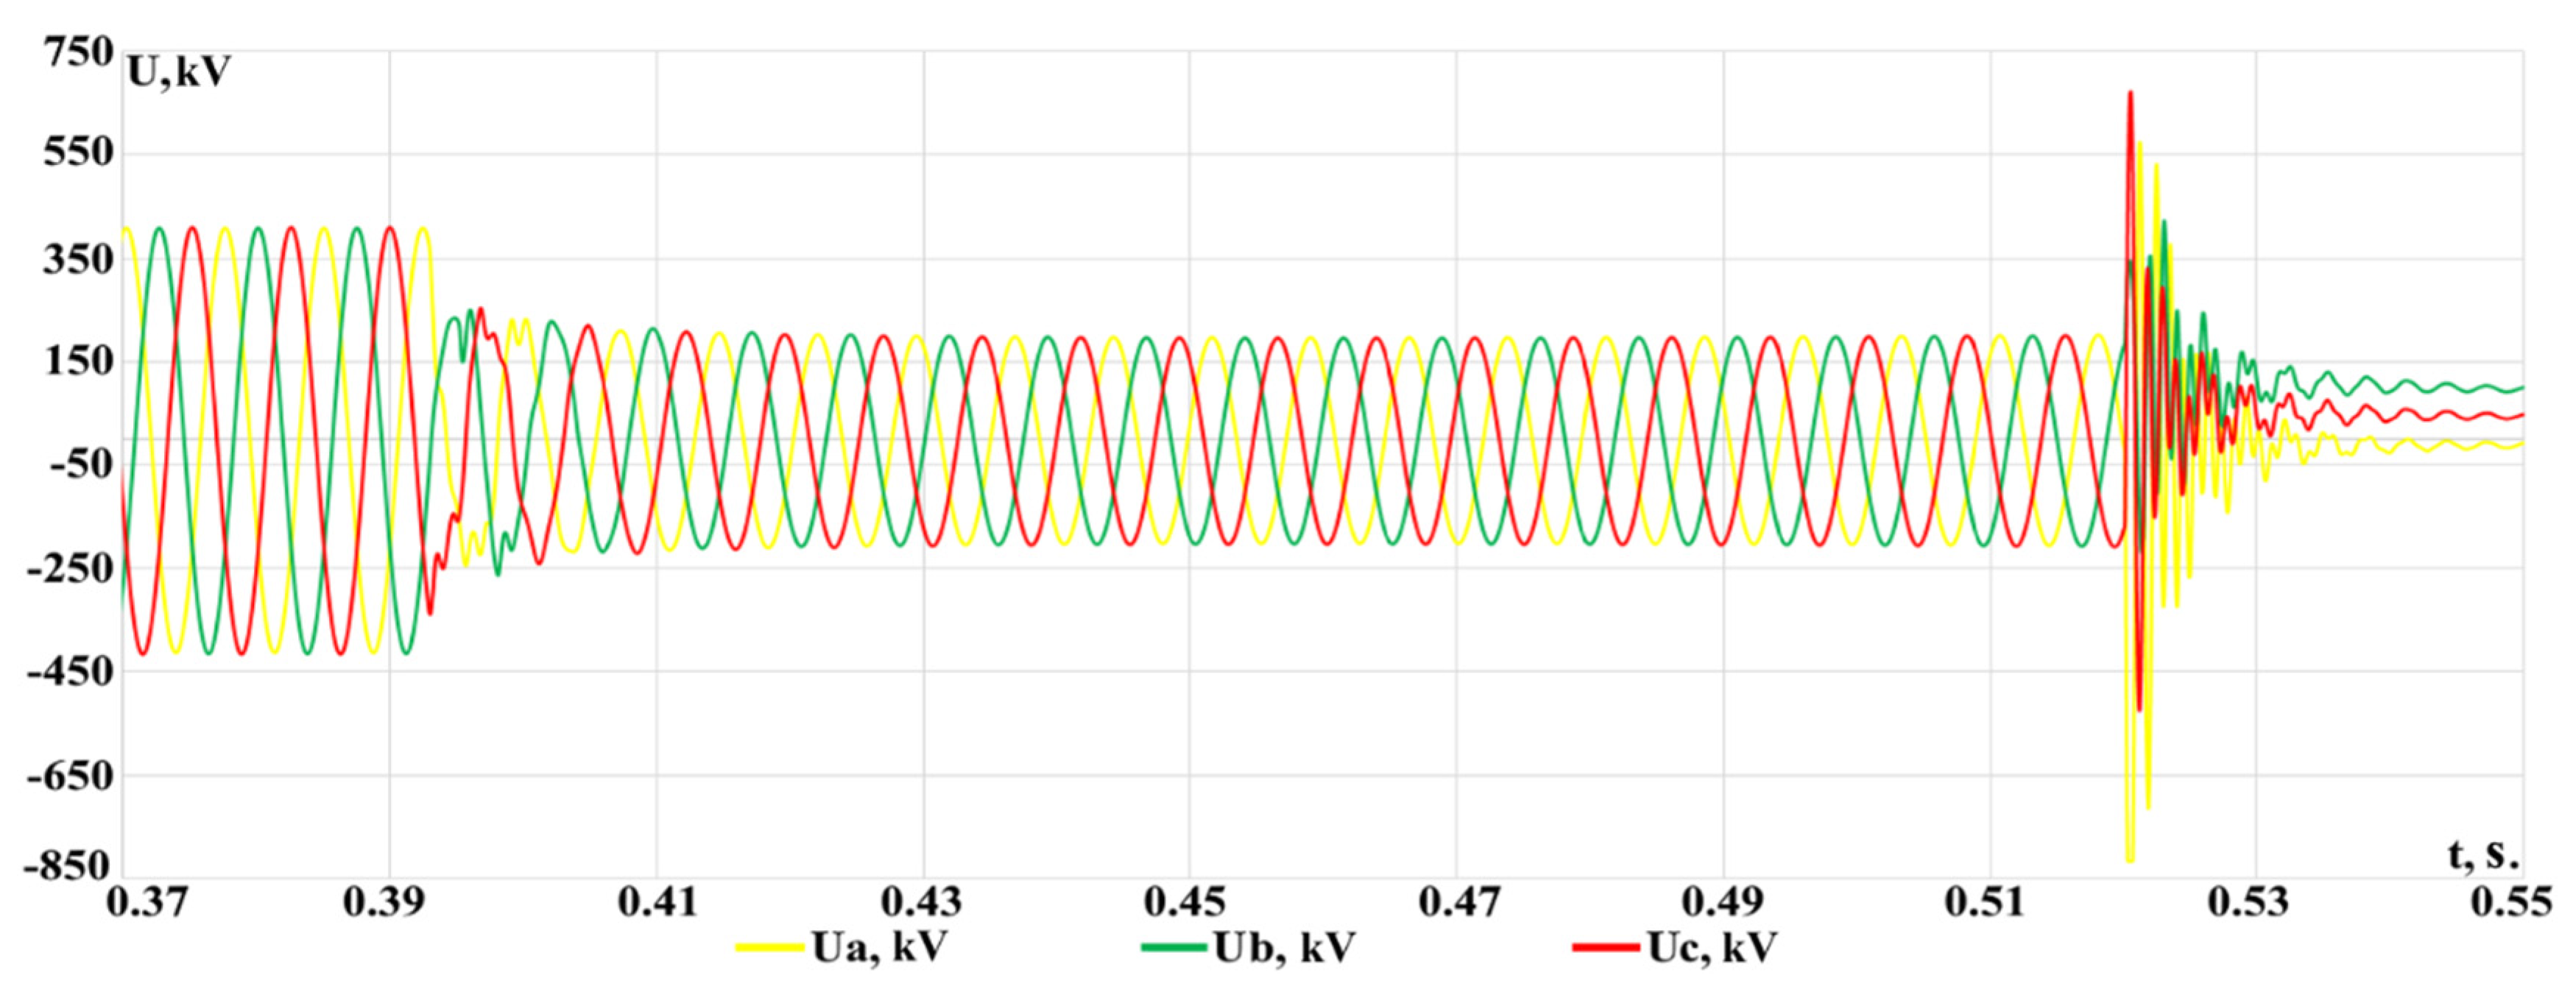
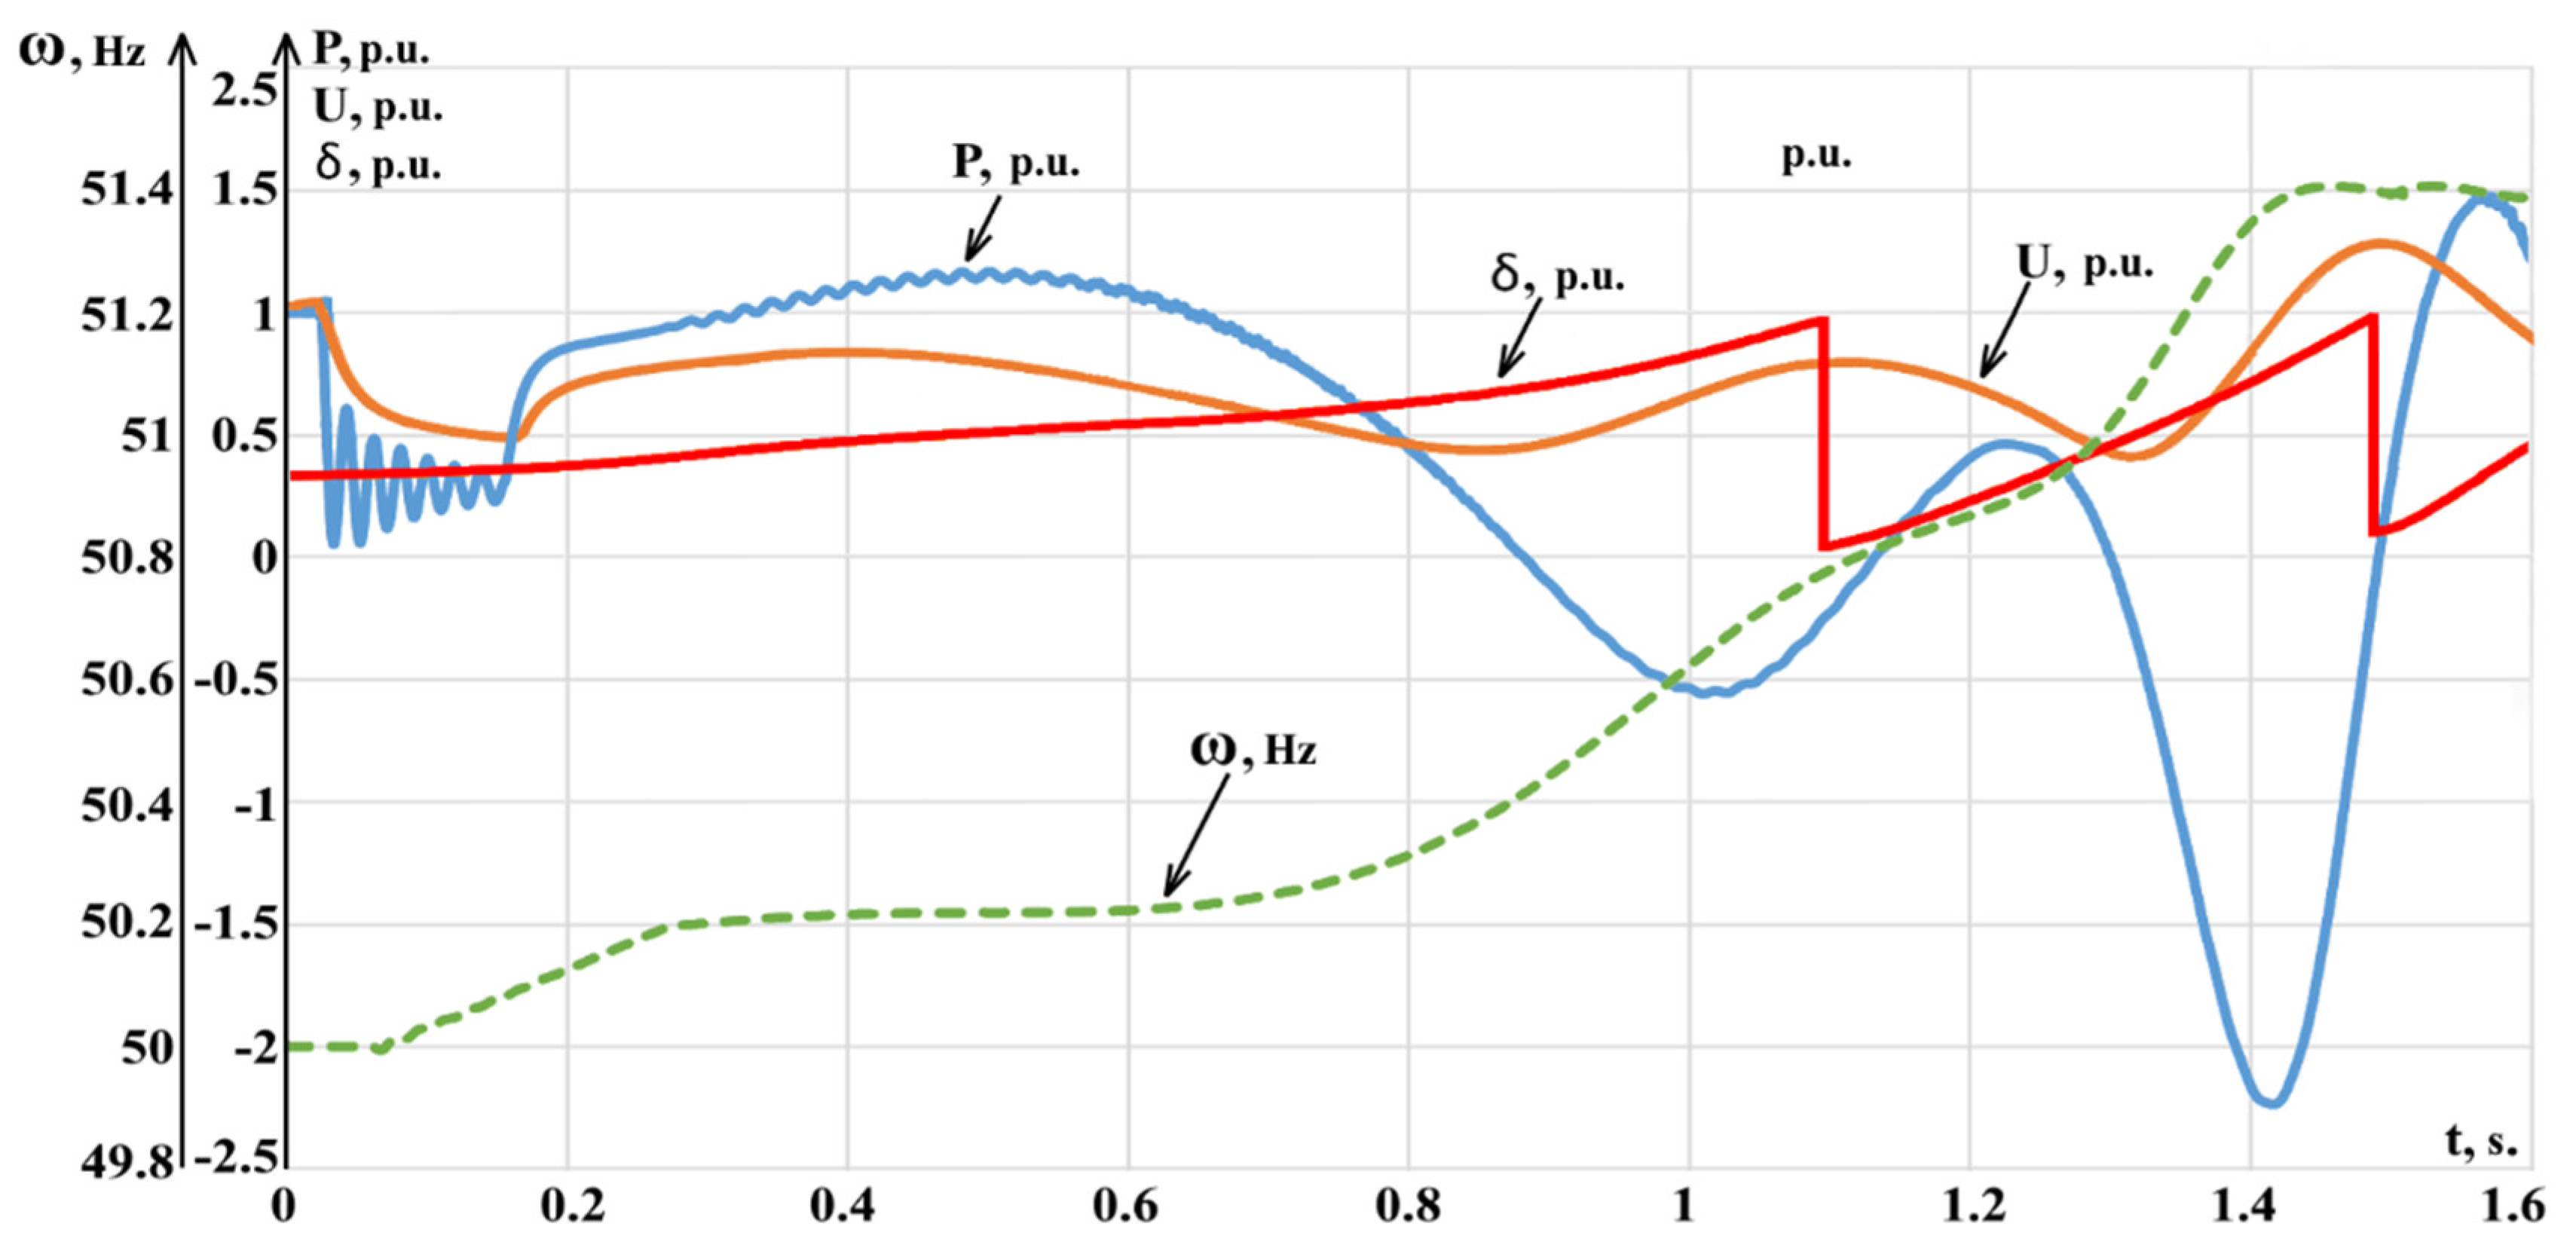
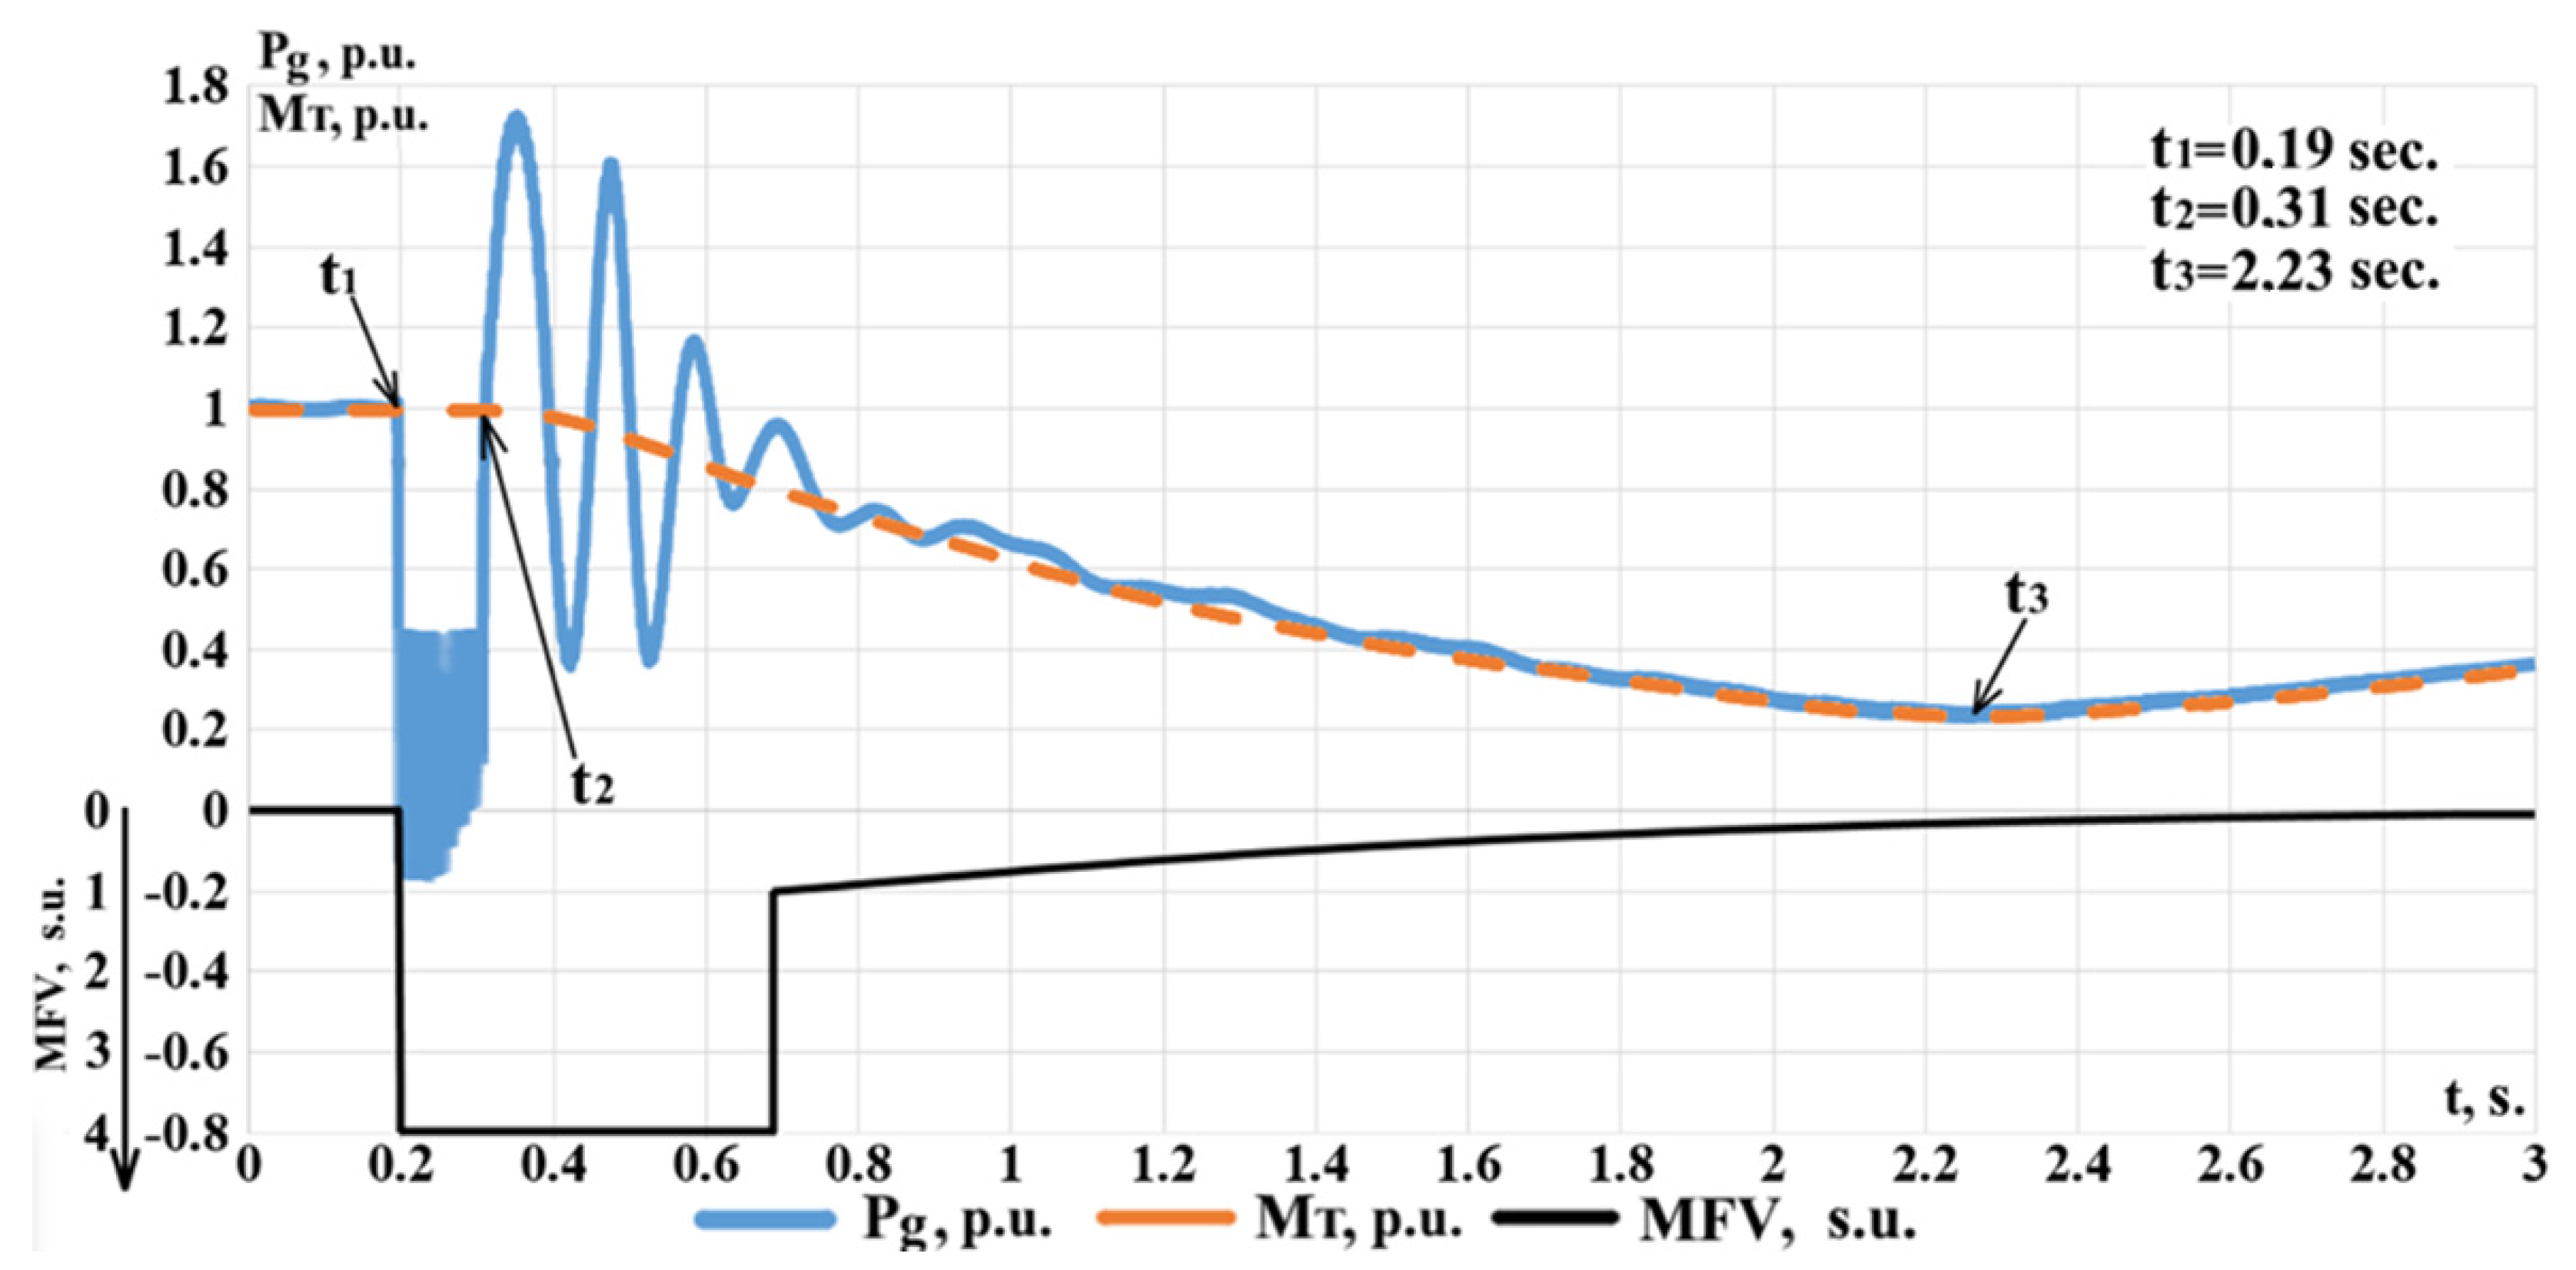
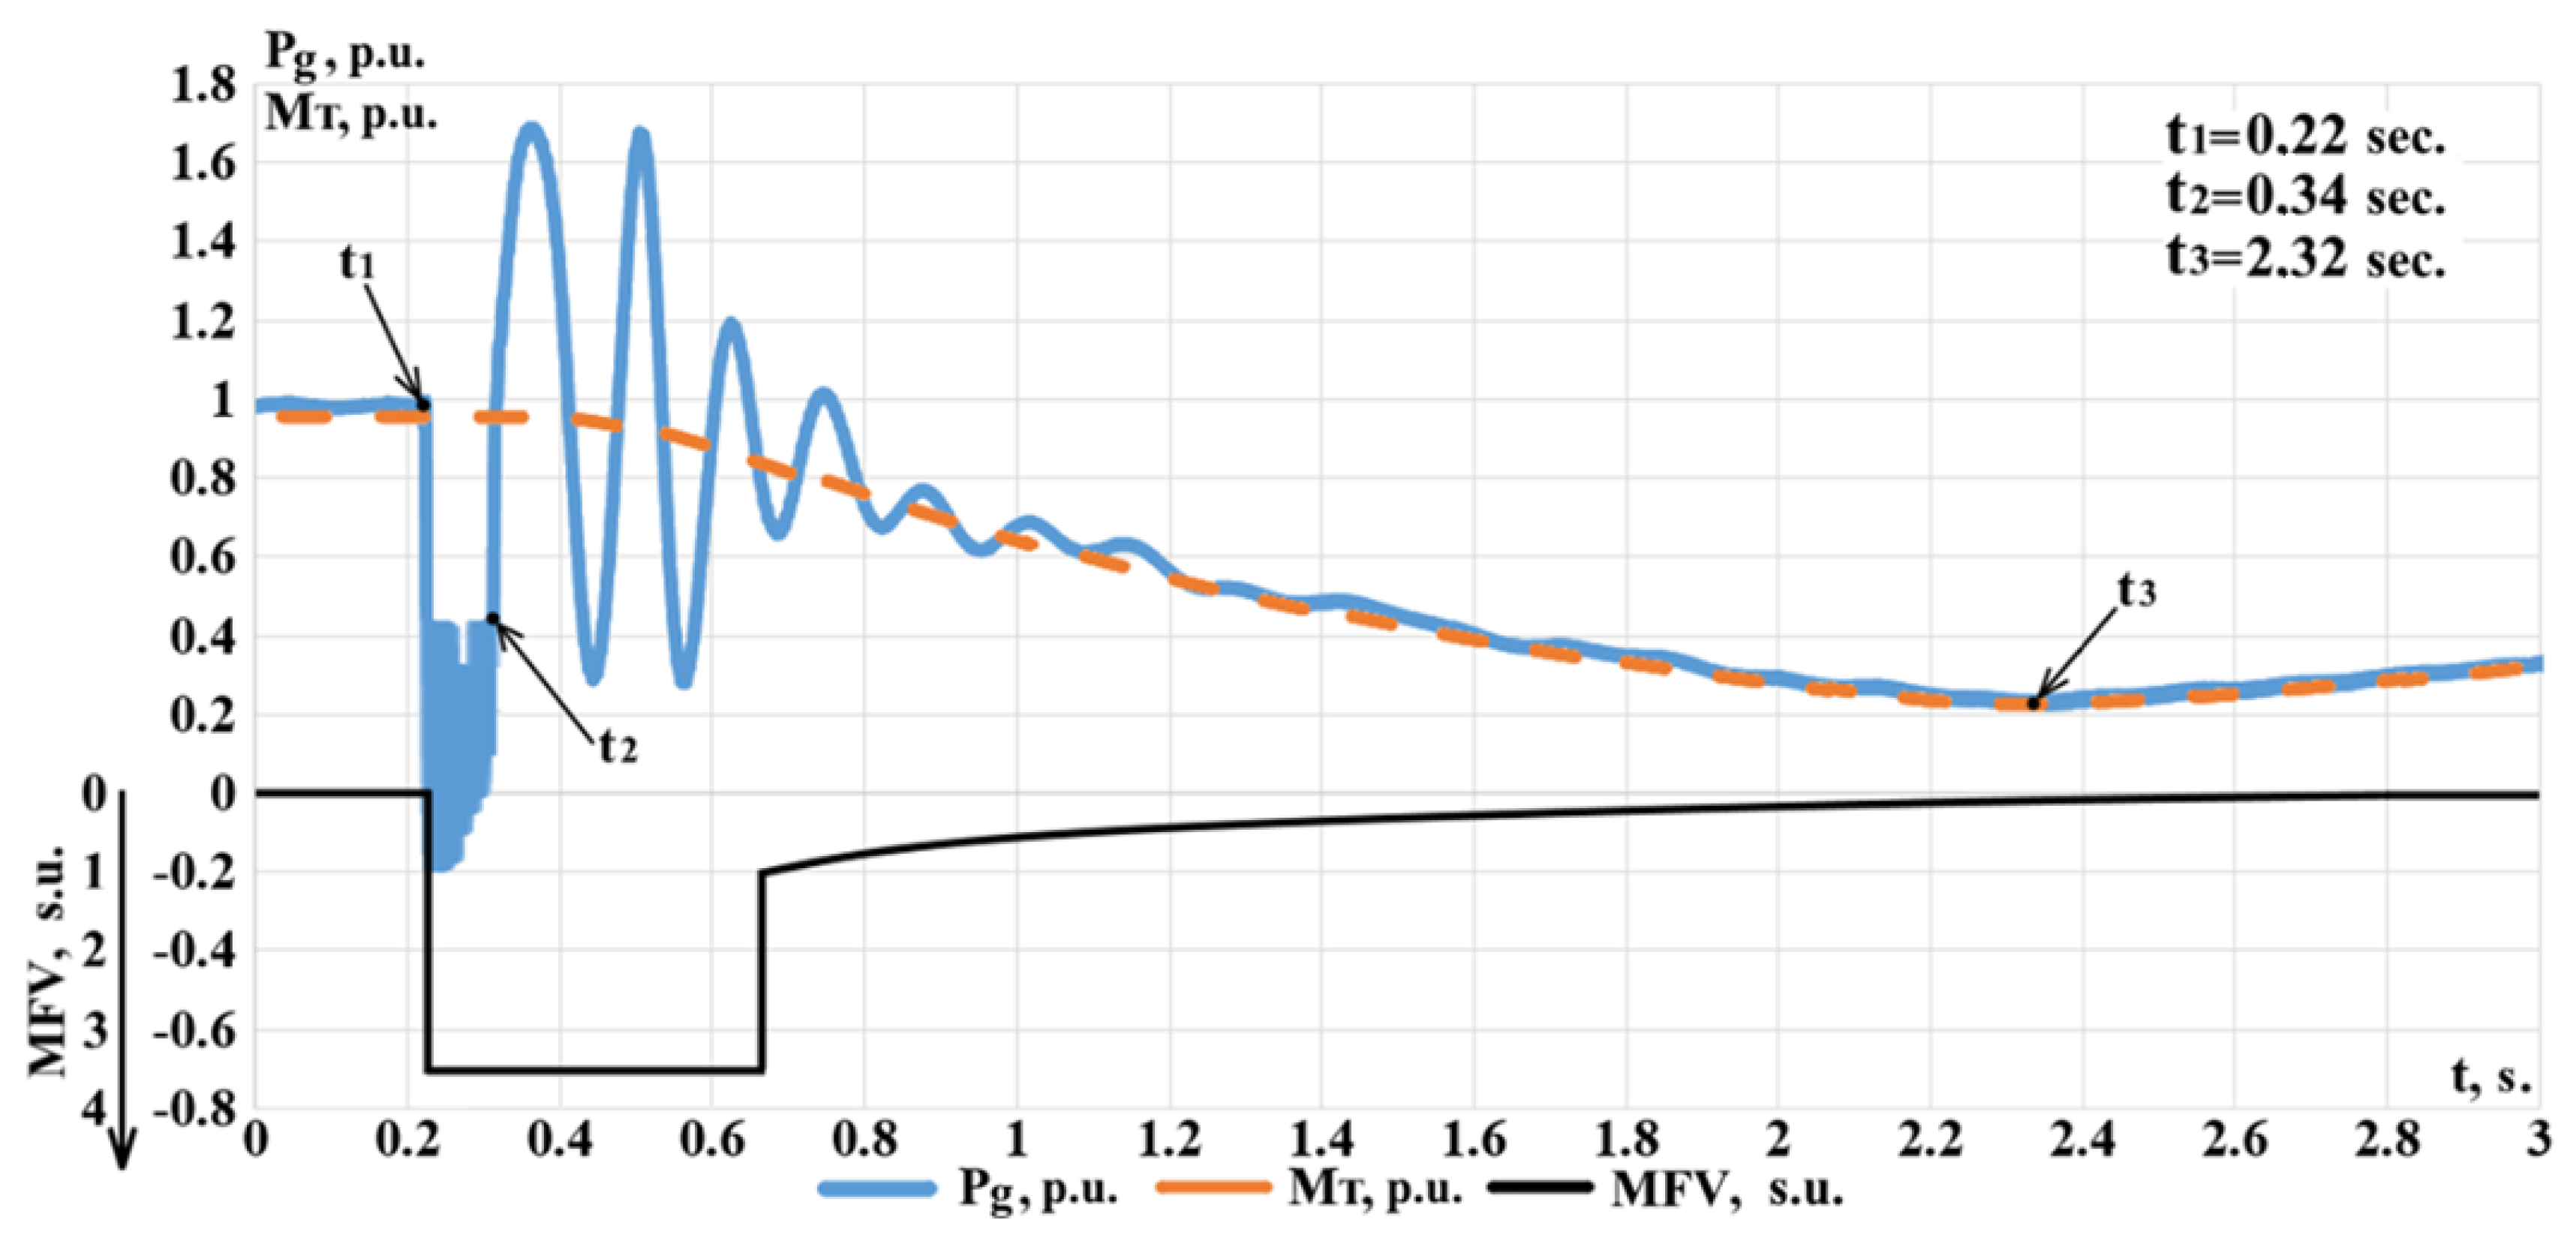
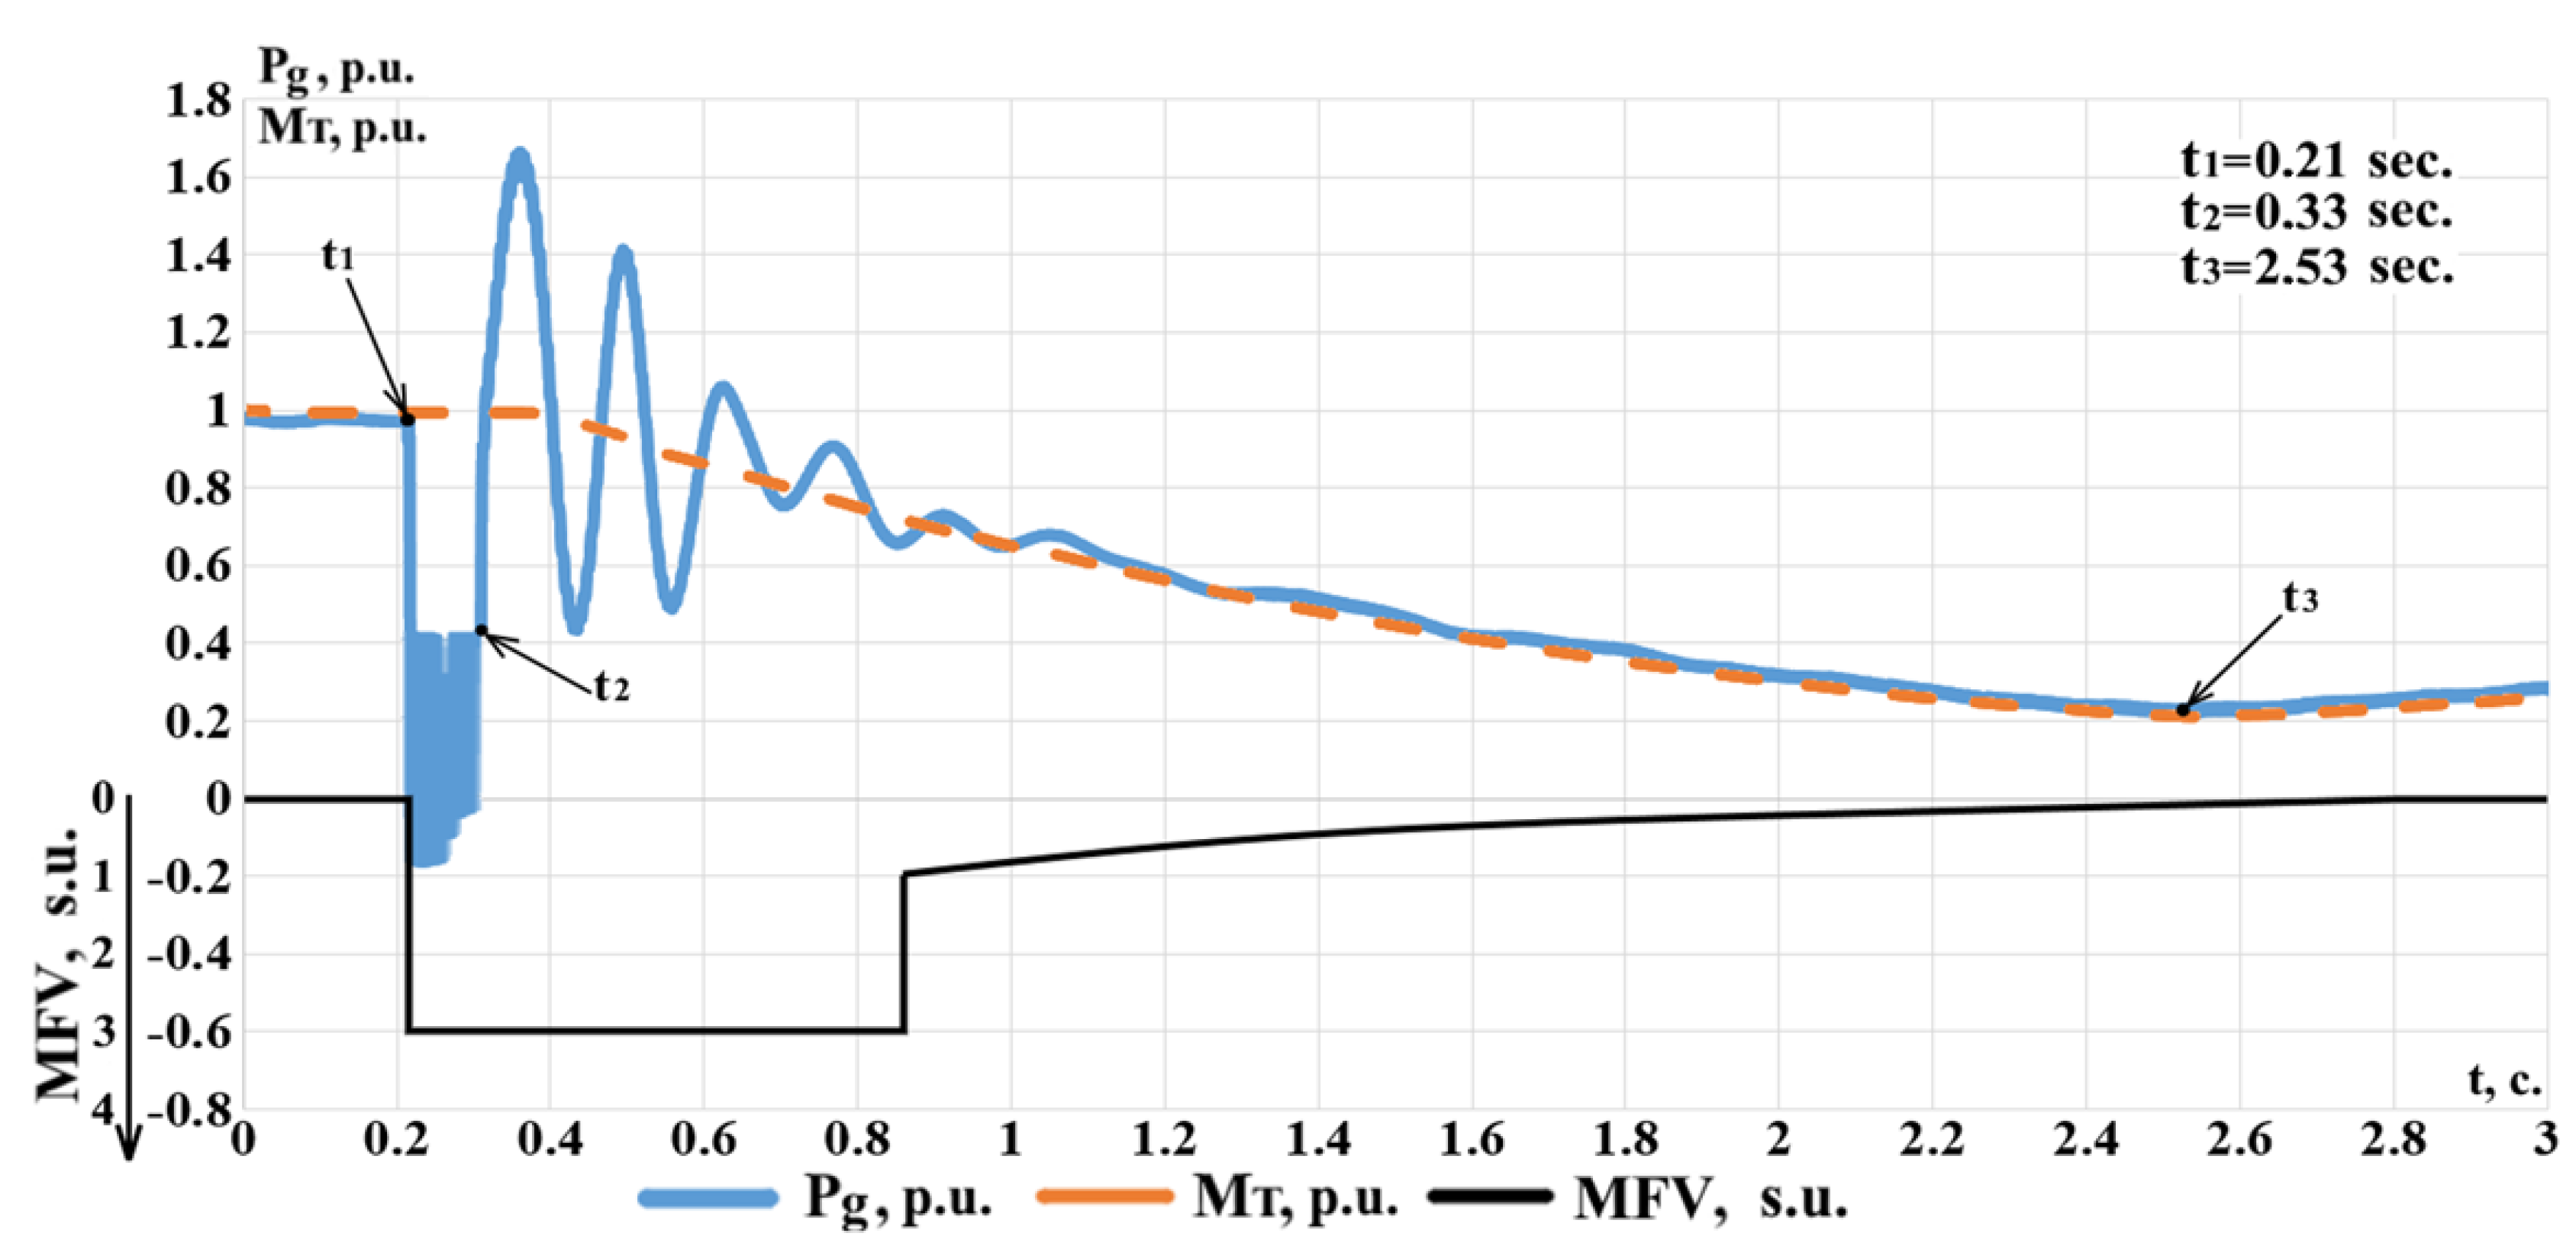
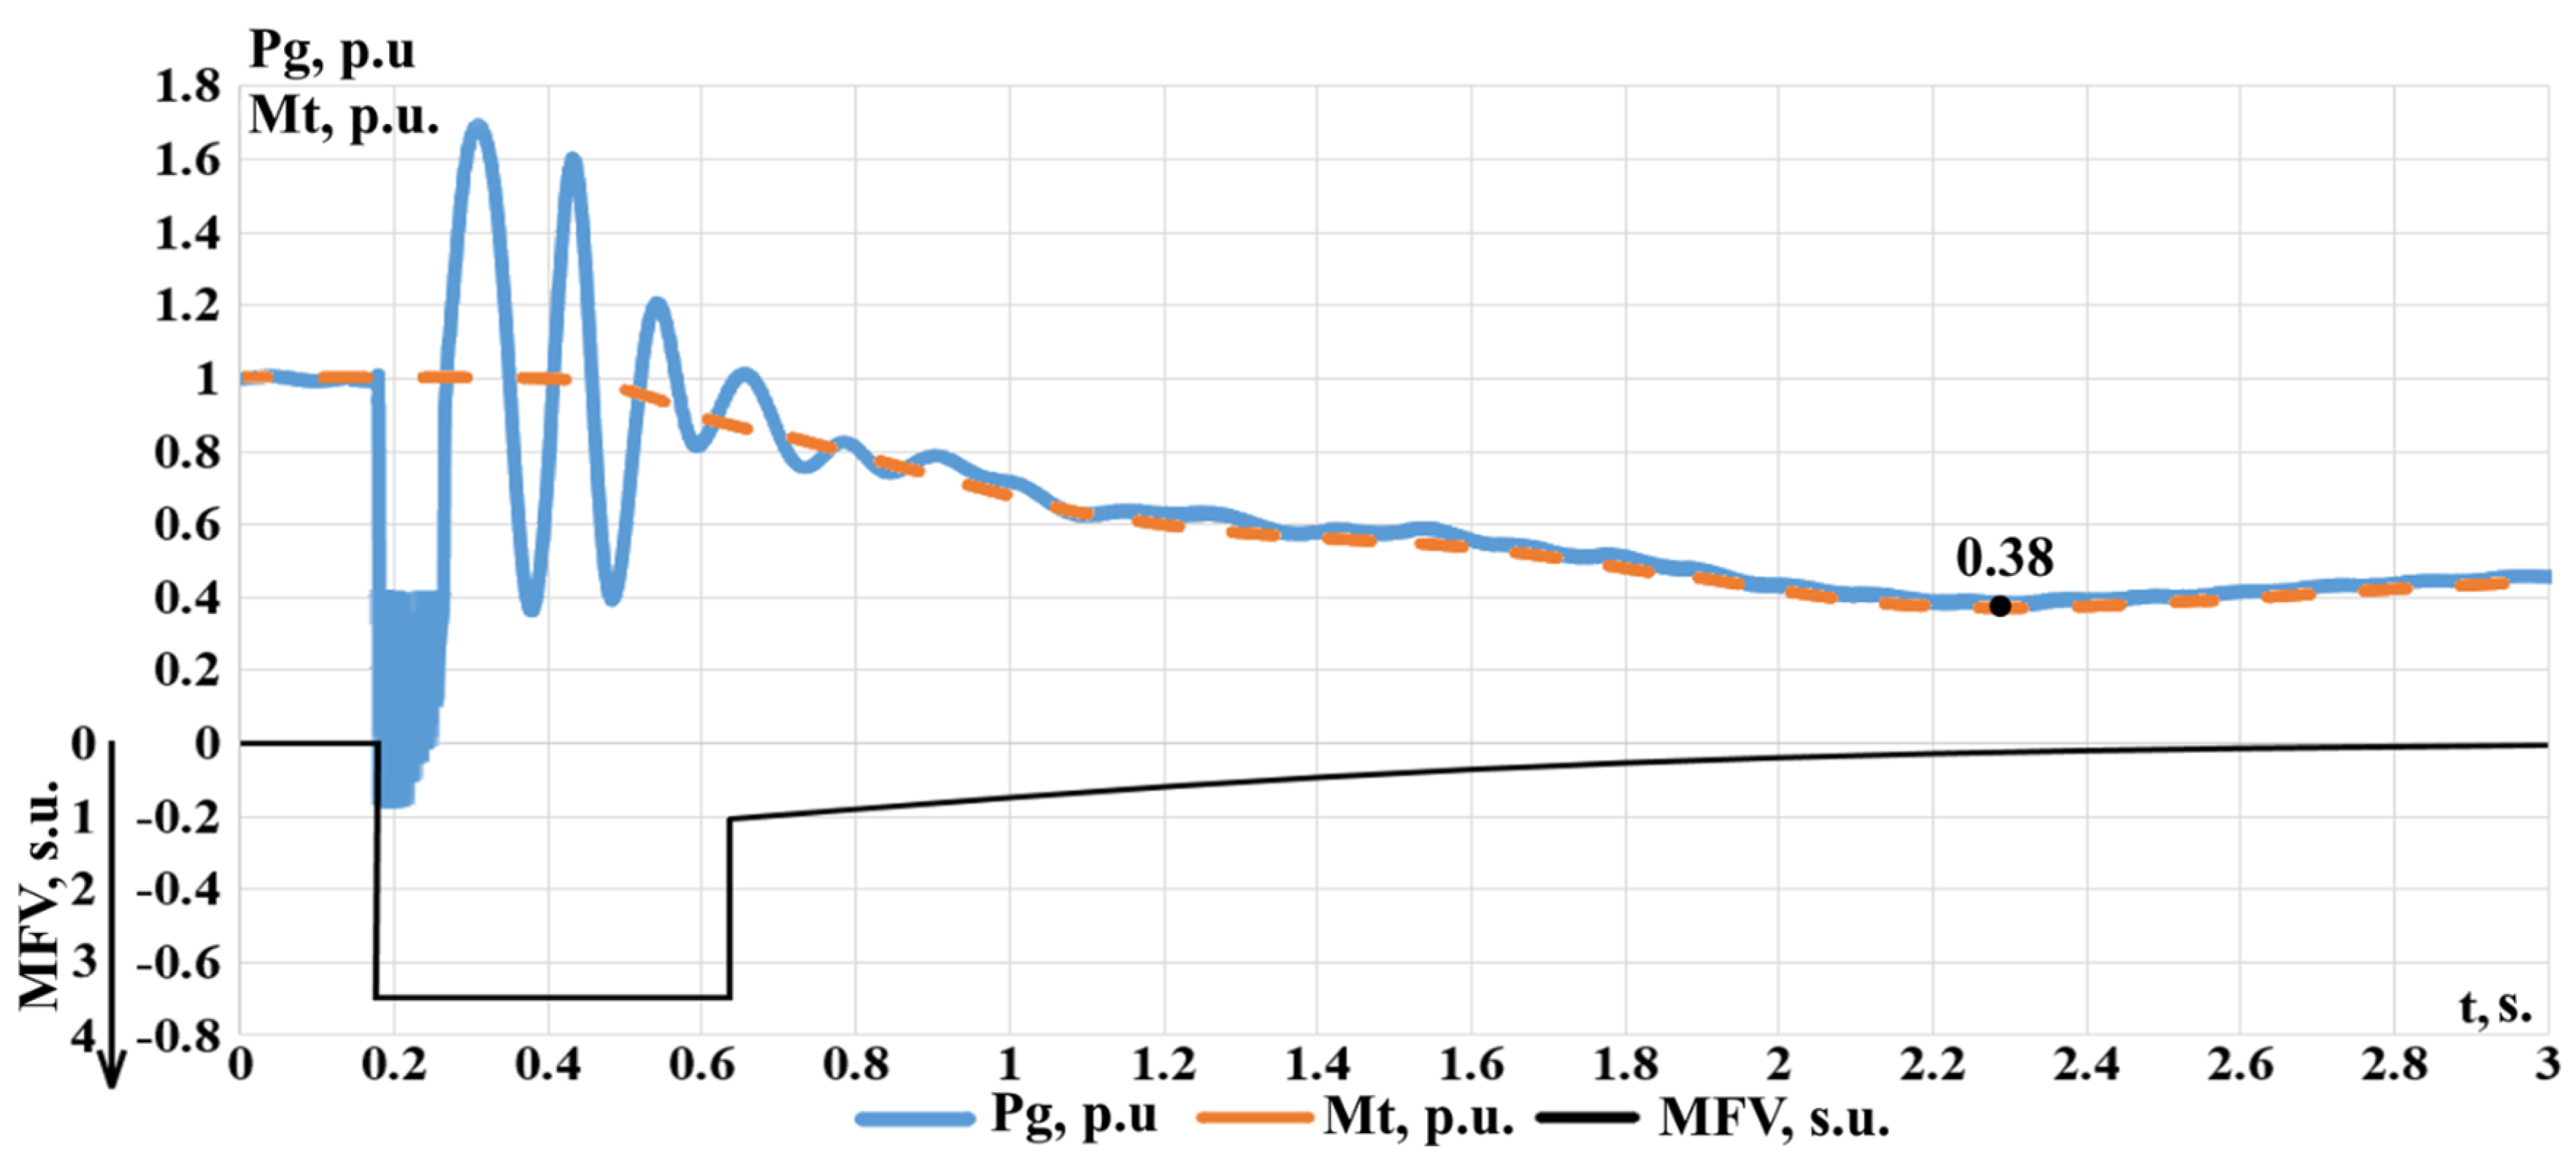
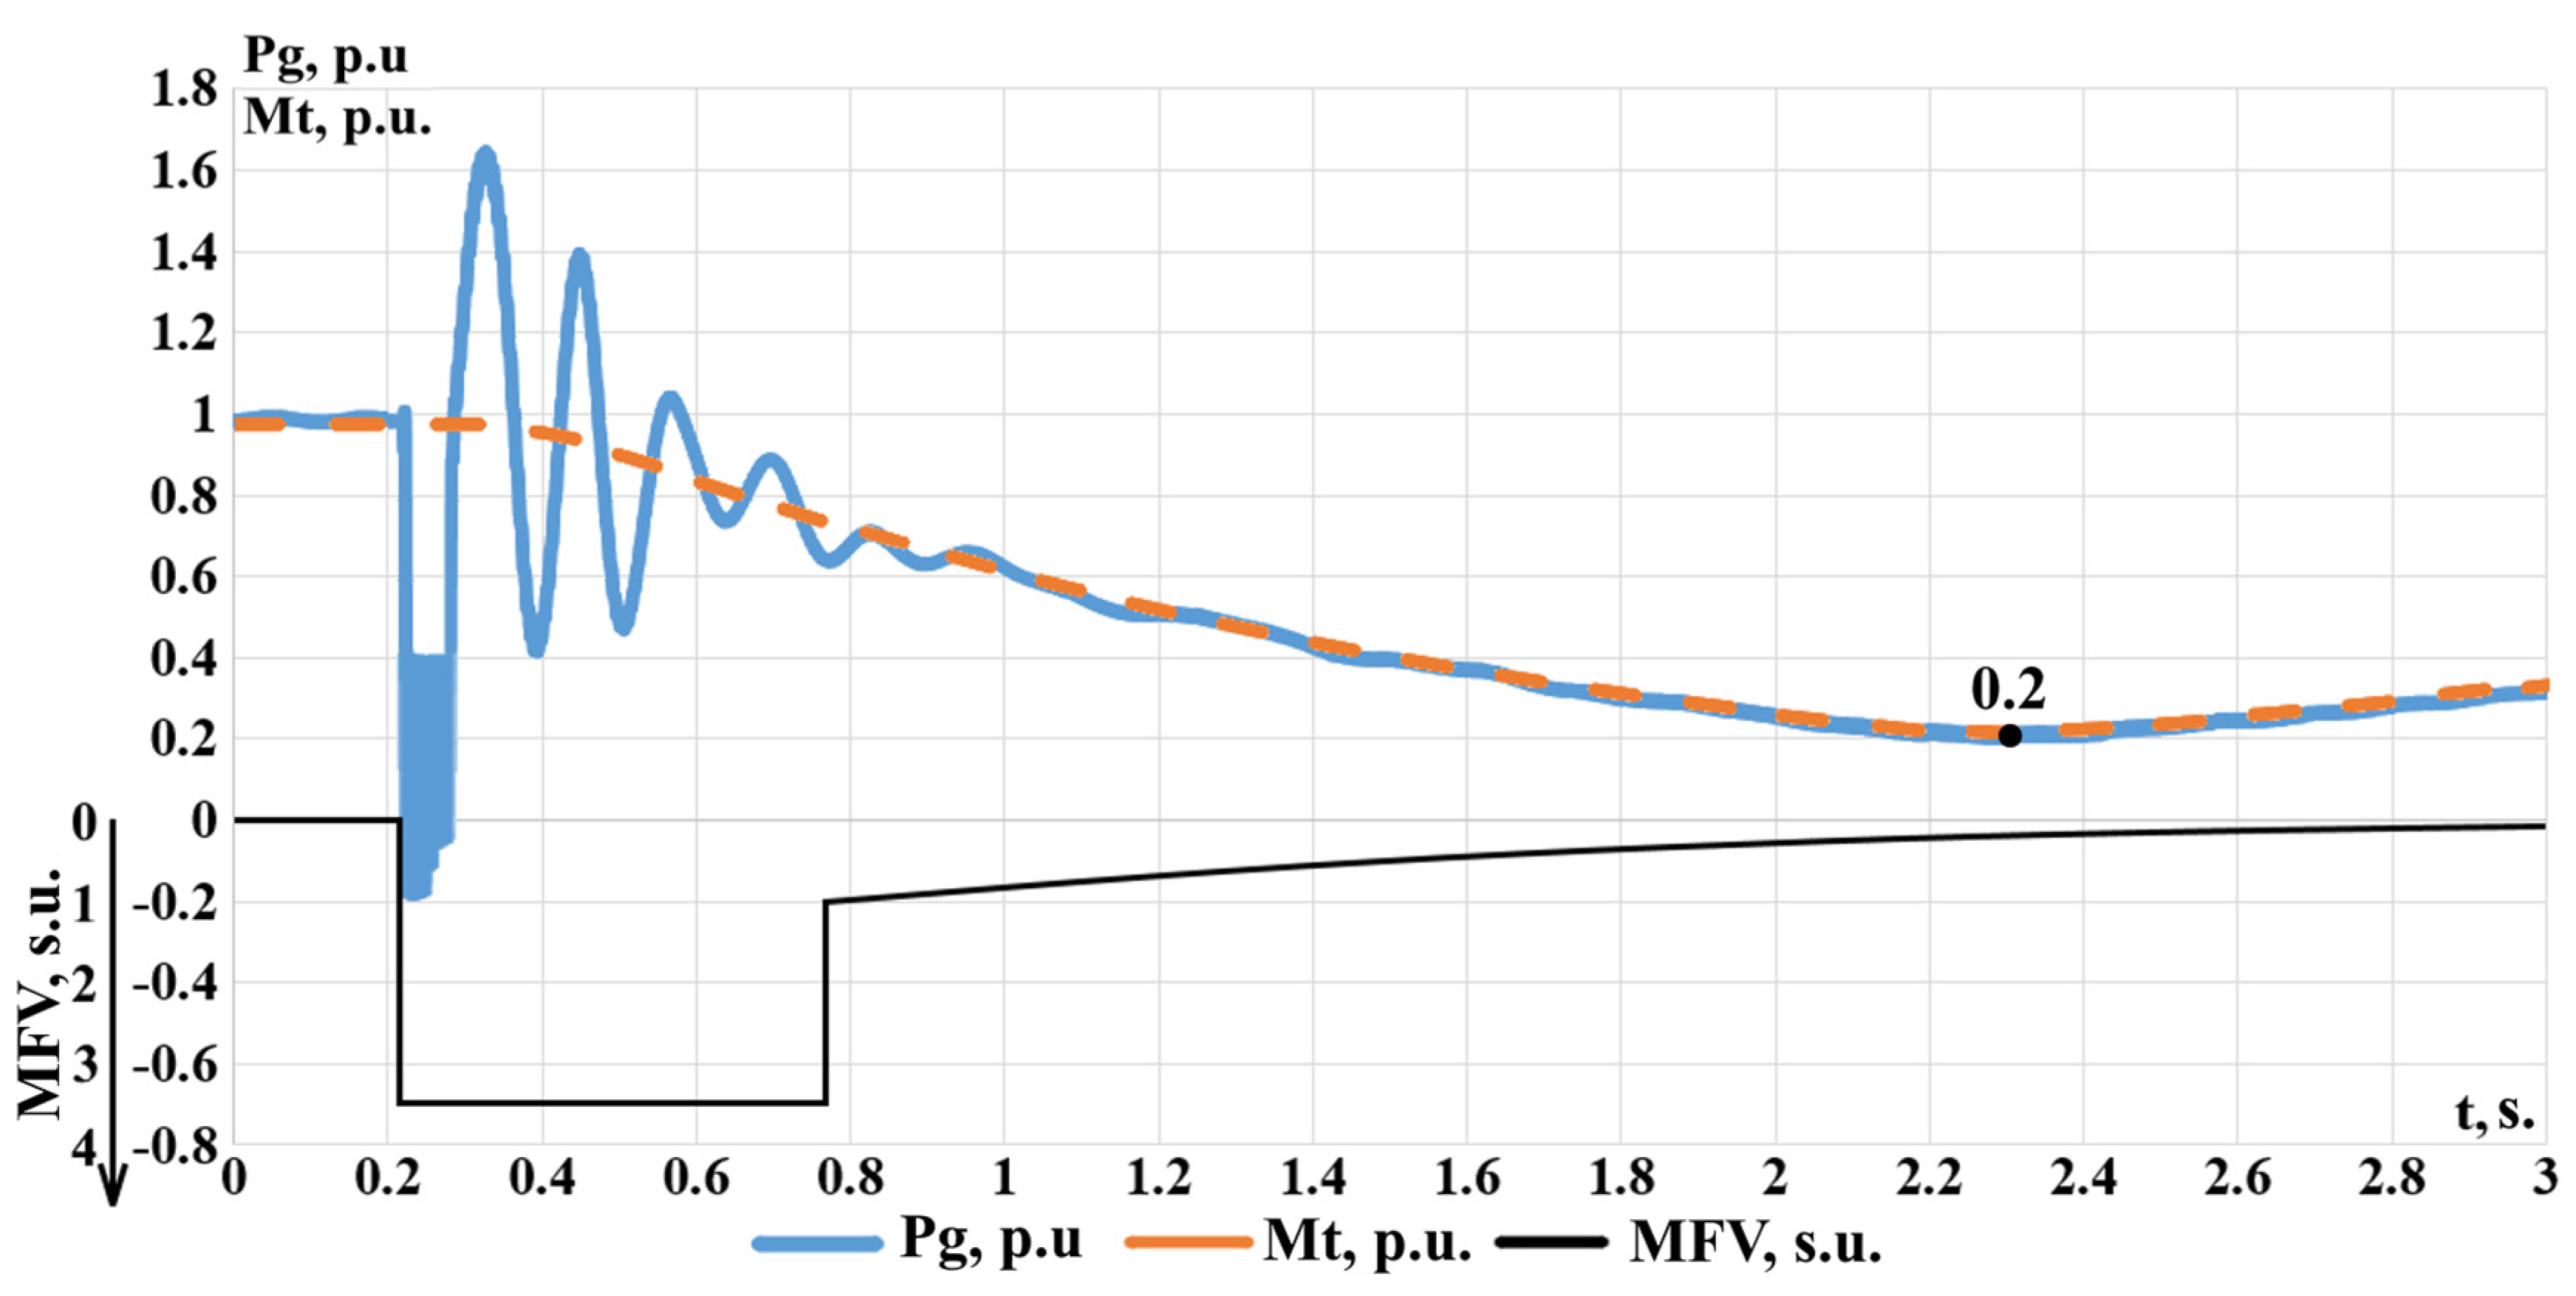
The verification of the developed model of the power unit as a part of the model of the power plant was carried out using the available field data of the real power unit G2 FV. Figure 9 shows the graphs of the turbine torque changes (obtained by means of registration of field data and modeling) during the FV of power unit G2 due to the emergency shutdown due to the short circuit of the 500 kV line L3.
Comparison of the obtained graphs confirms the adequacy of the reproduction of the detailed model of the power unit, including the models of the boiler, turbine, and synchronous generator as part of the model of EPS. The maximum deviation of the simulation results from the field data did not exceed 5%.

5. Results

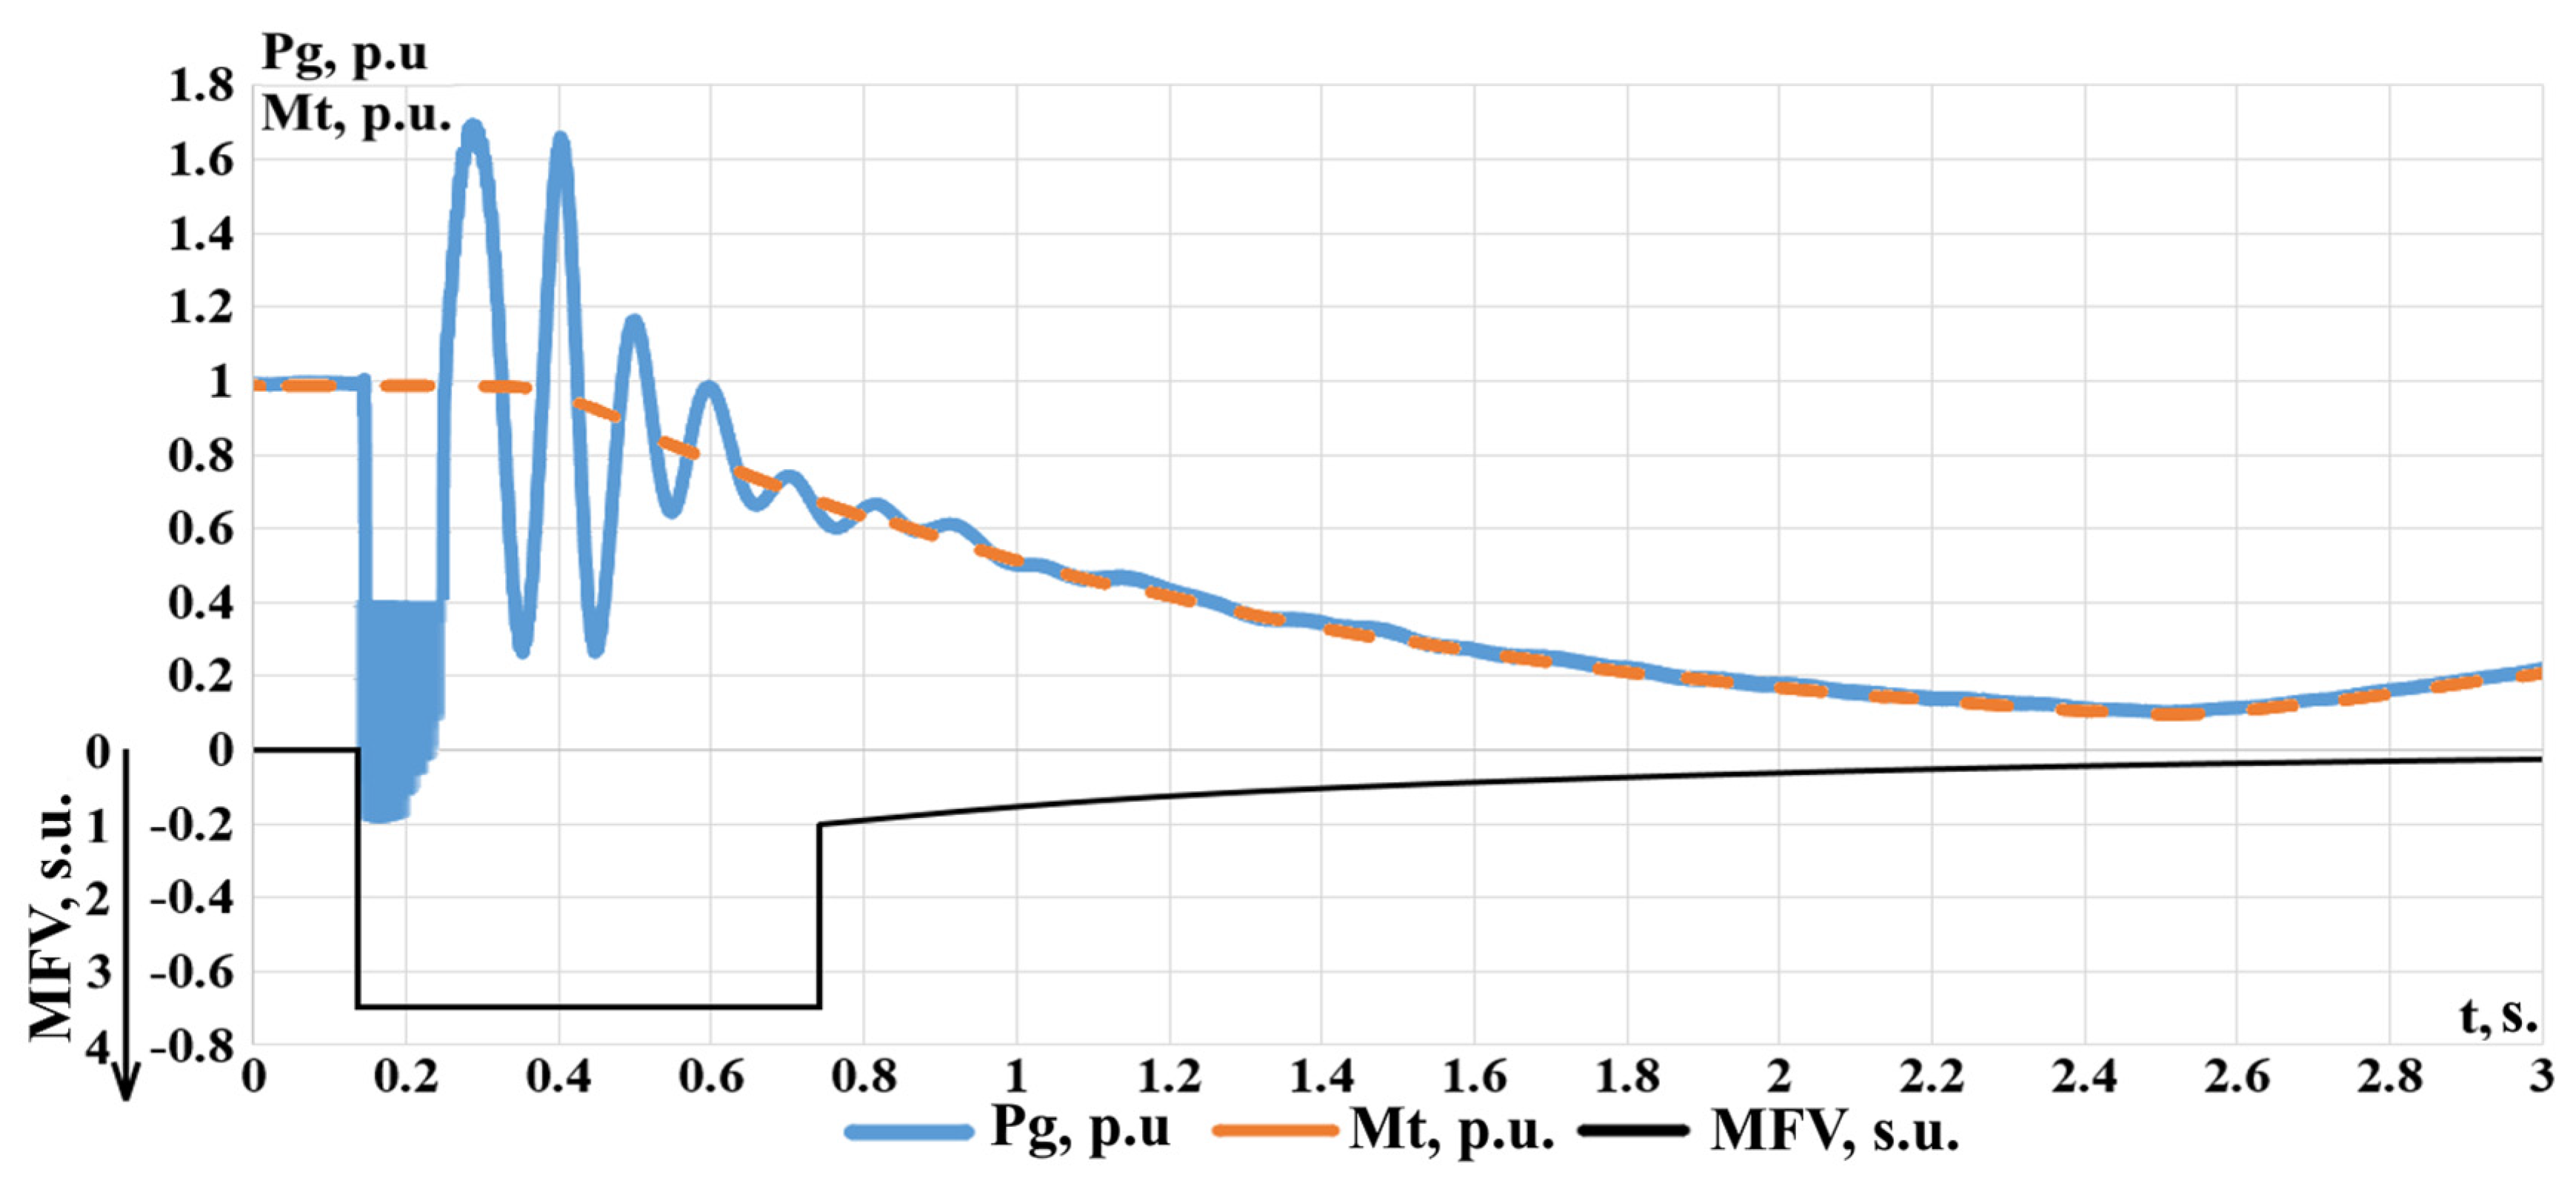
5.1. Simulation of the Emergency Power Surplus

As shown in Figure 7, on the realized scheme of the electric power station, a set of experimental investigations was made, according to which the places of emergency excess of the generated active power were determined. The smallest surplus of the generated active power at which the out-of-step mode occurs is formed at the three-phase short circuit, duration 0.12 s, on the line L3 on the side of the buses of generator G2 (Figure 10, Figure 11 and Figure 12).
Such an accident results in an excess of active power equal to 330 MW, which corresponds to the overcurrent on the L3 line.

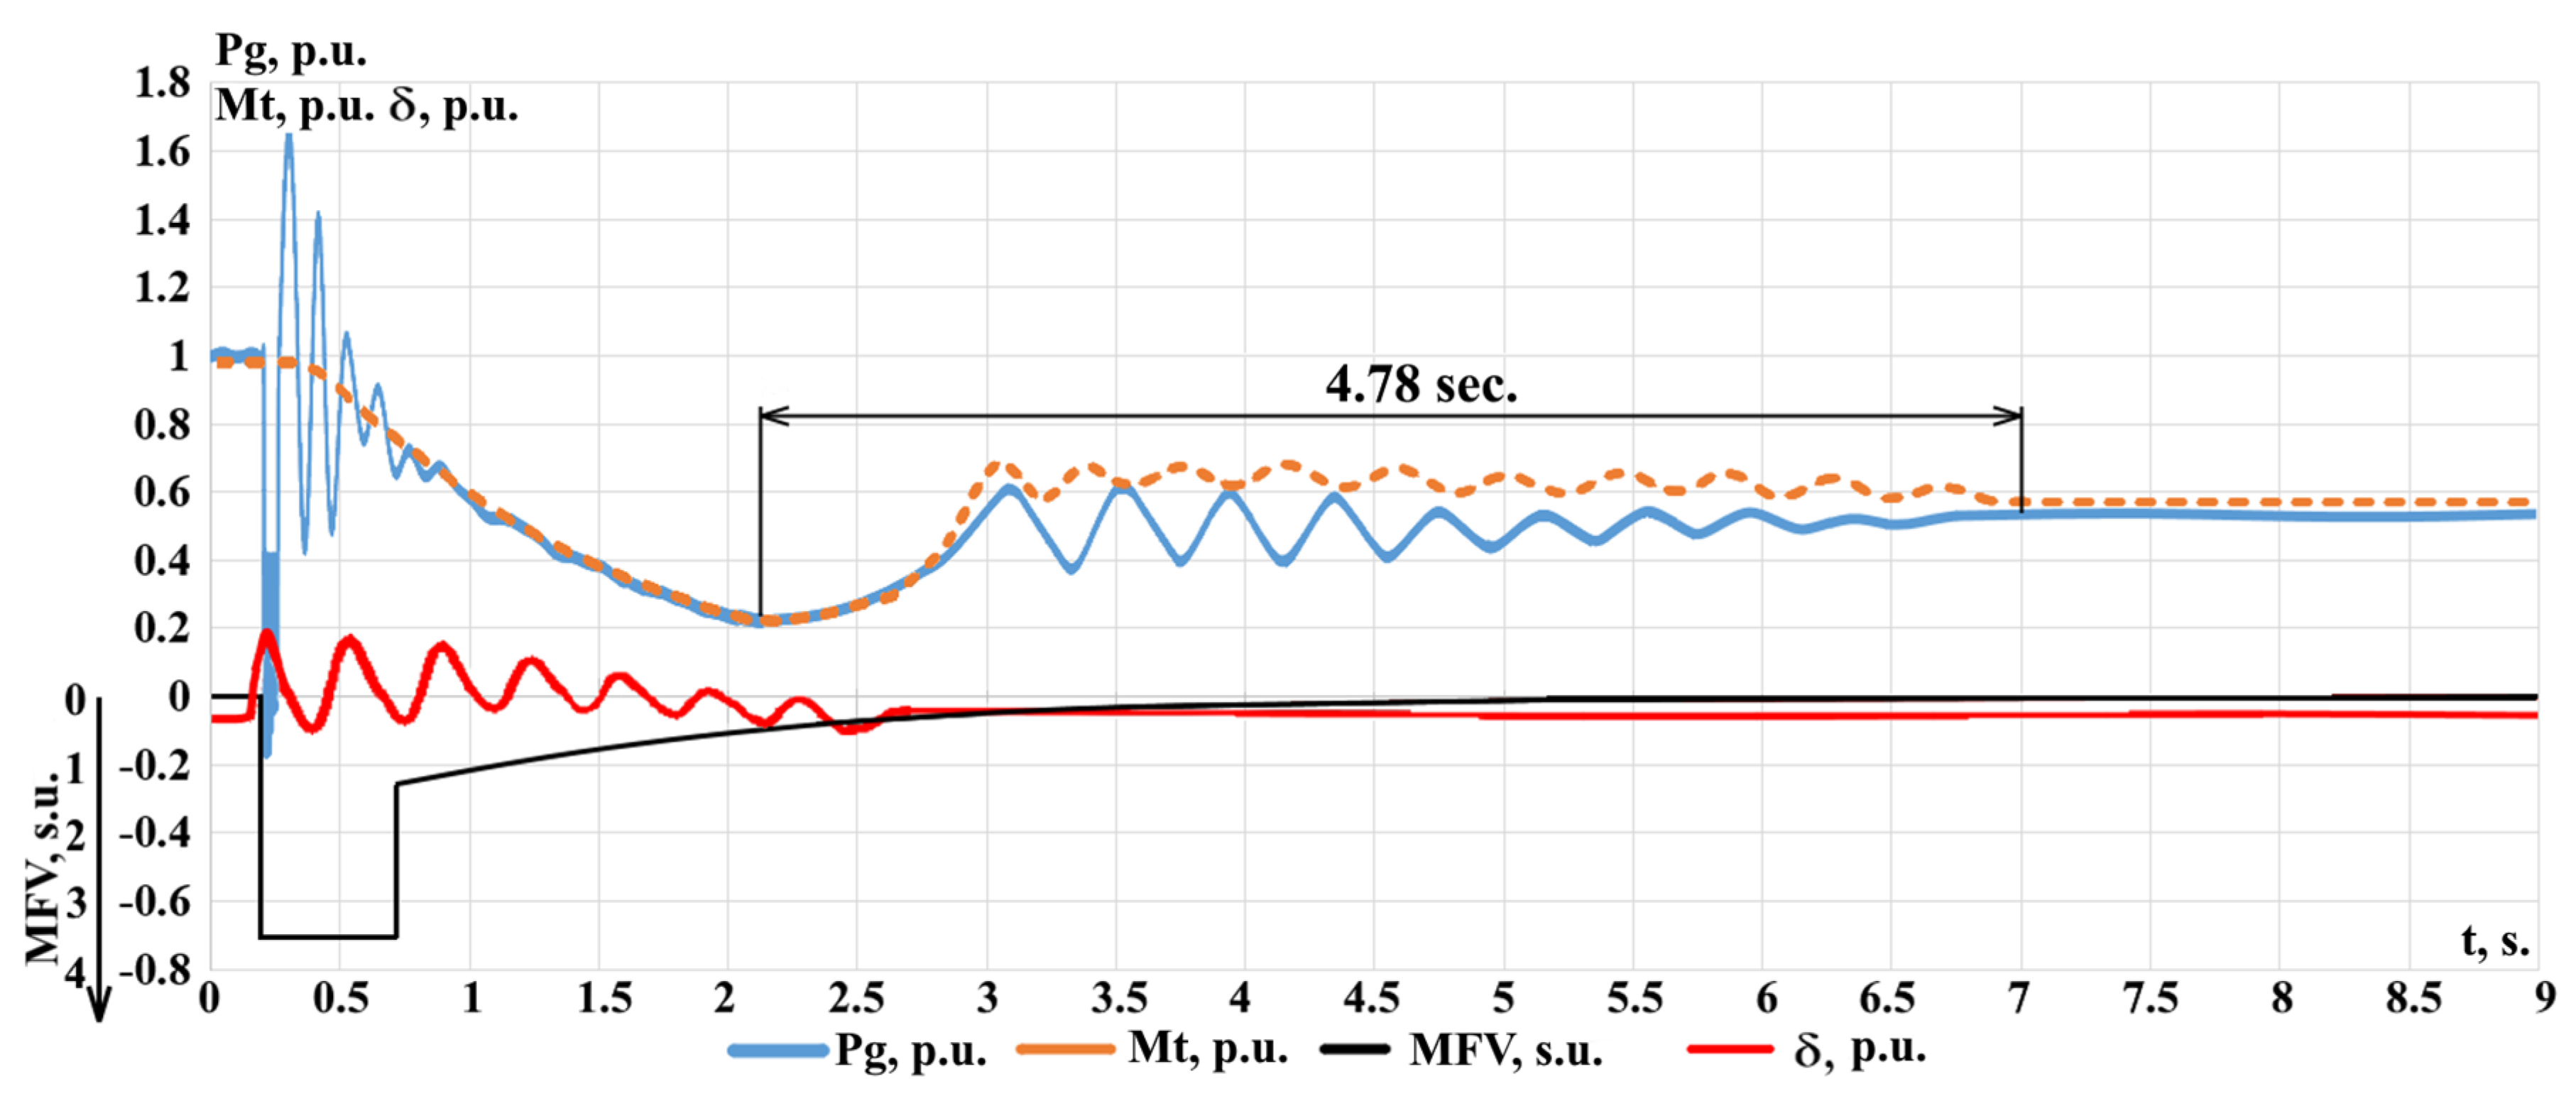
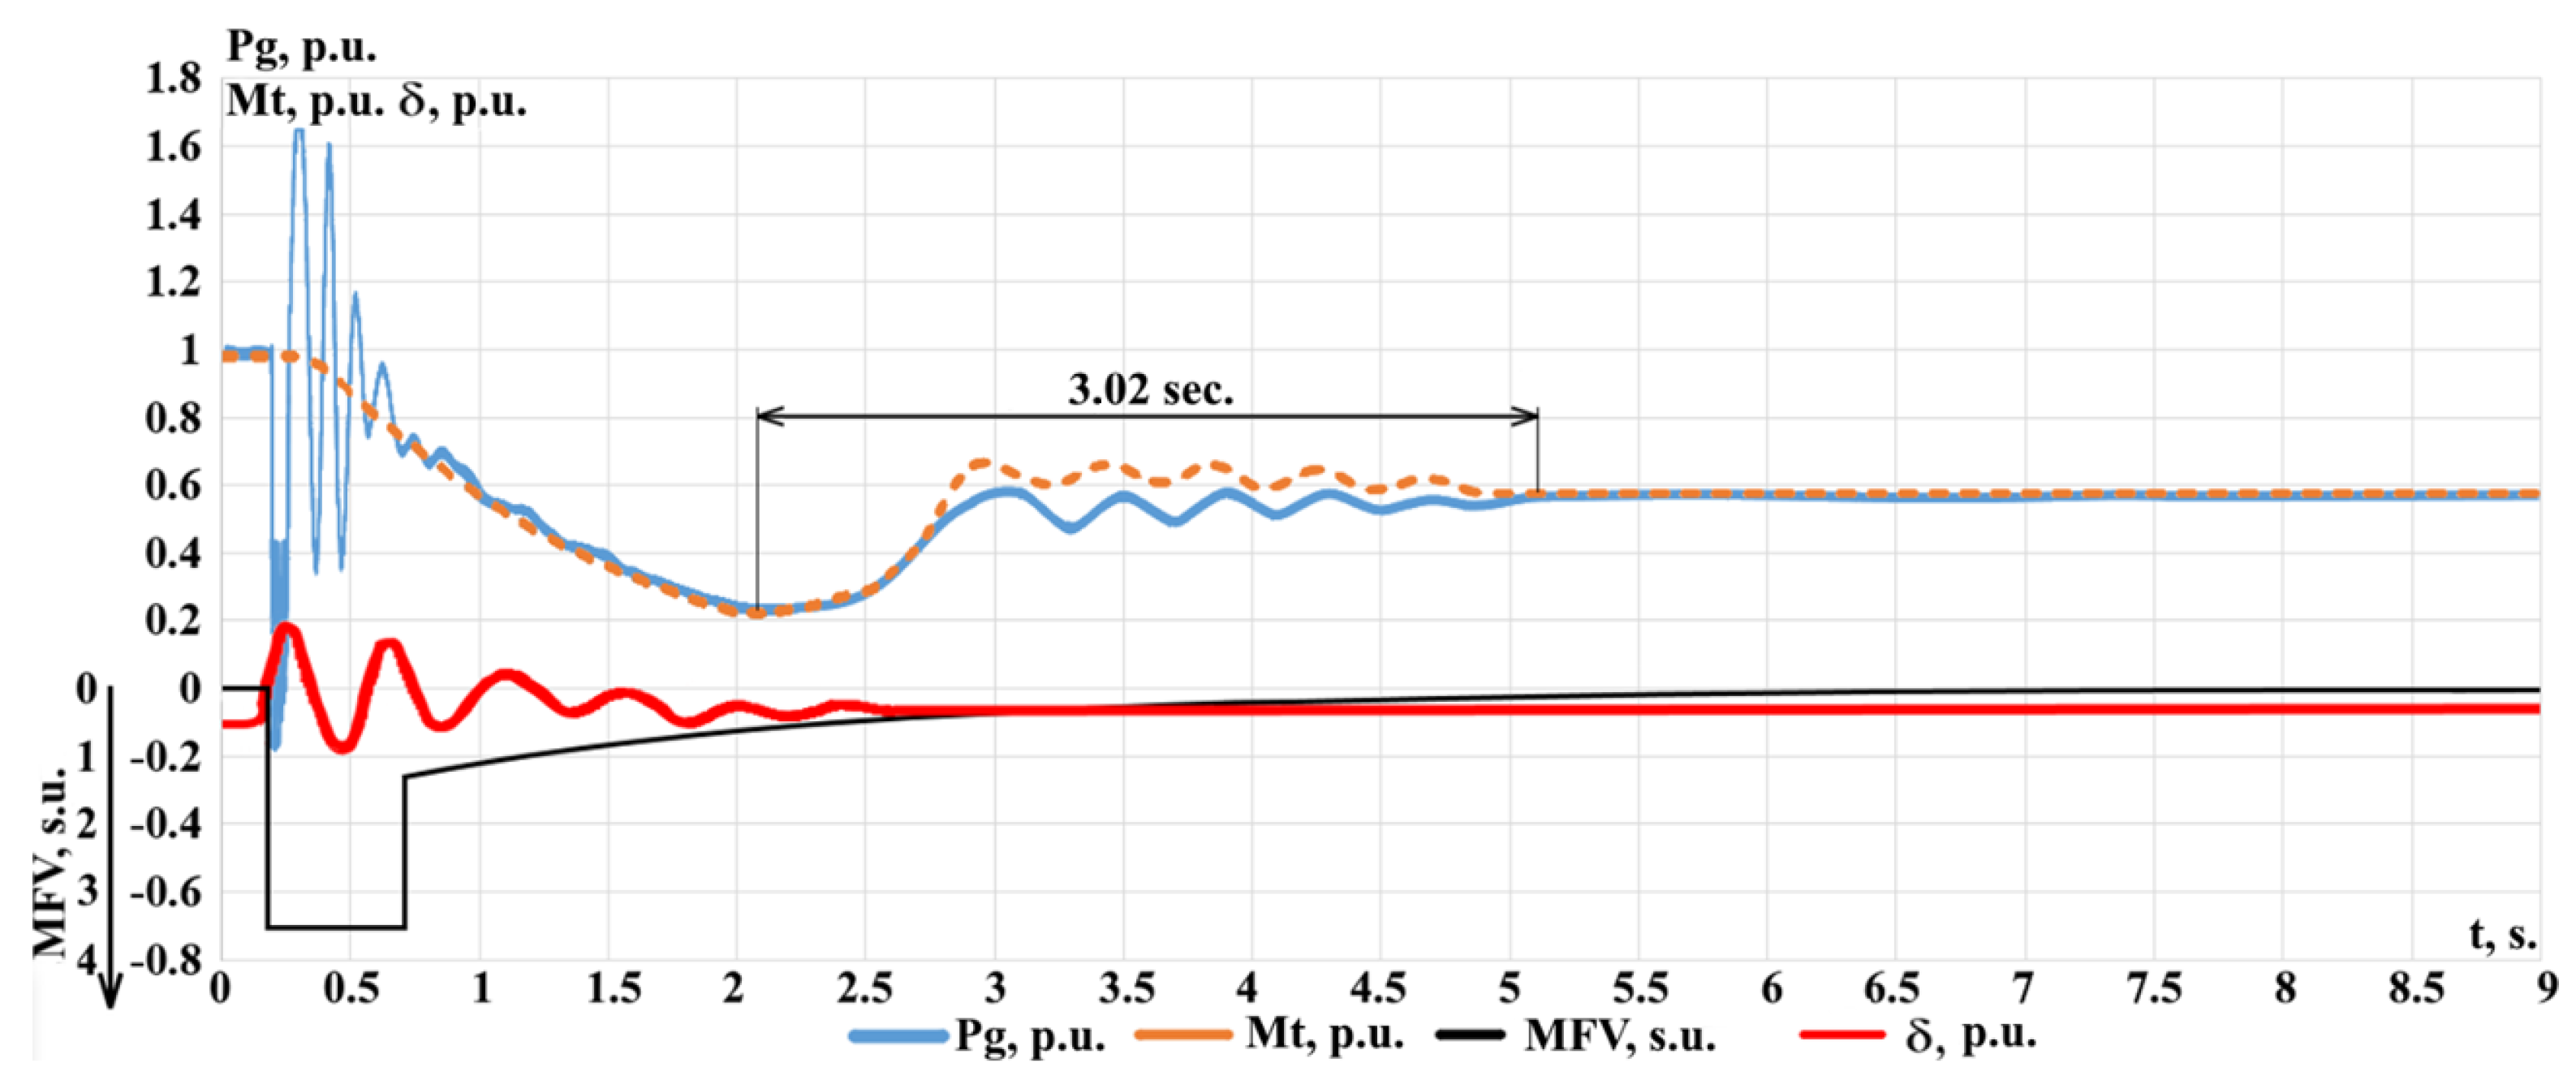
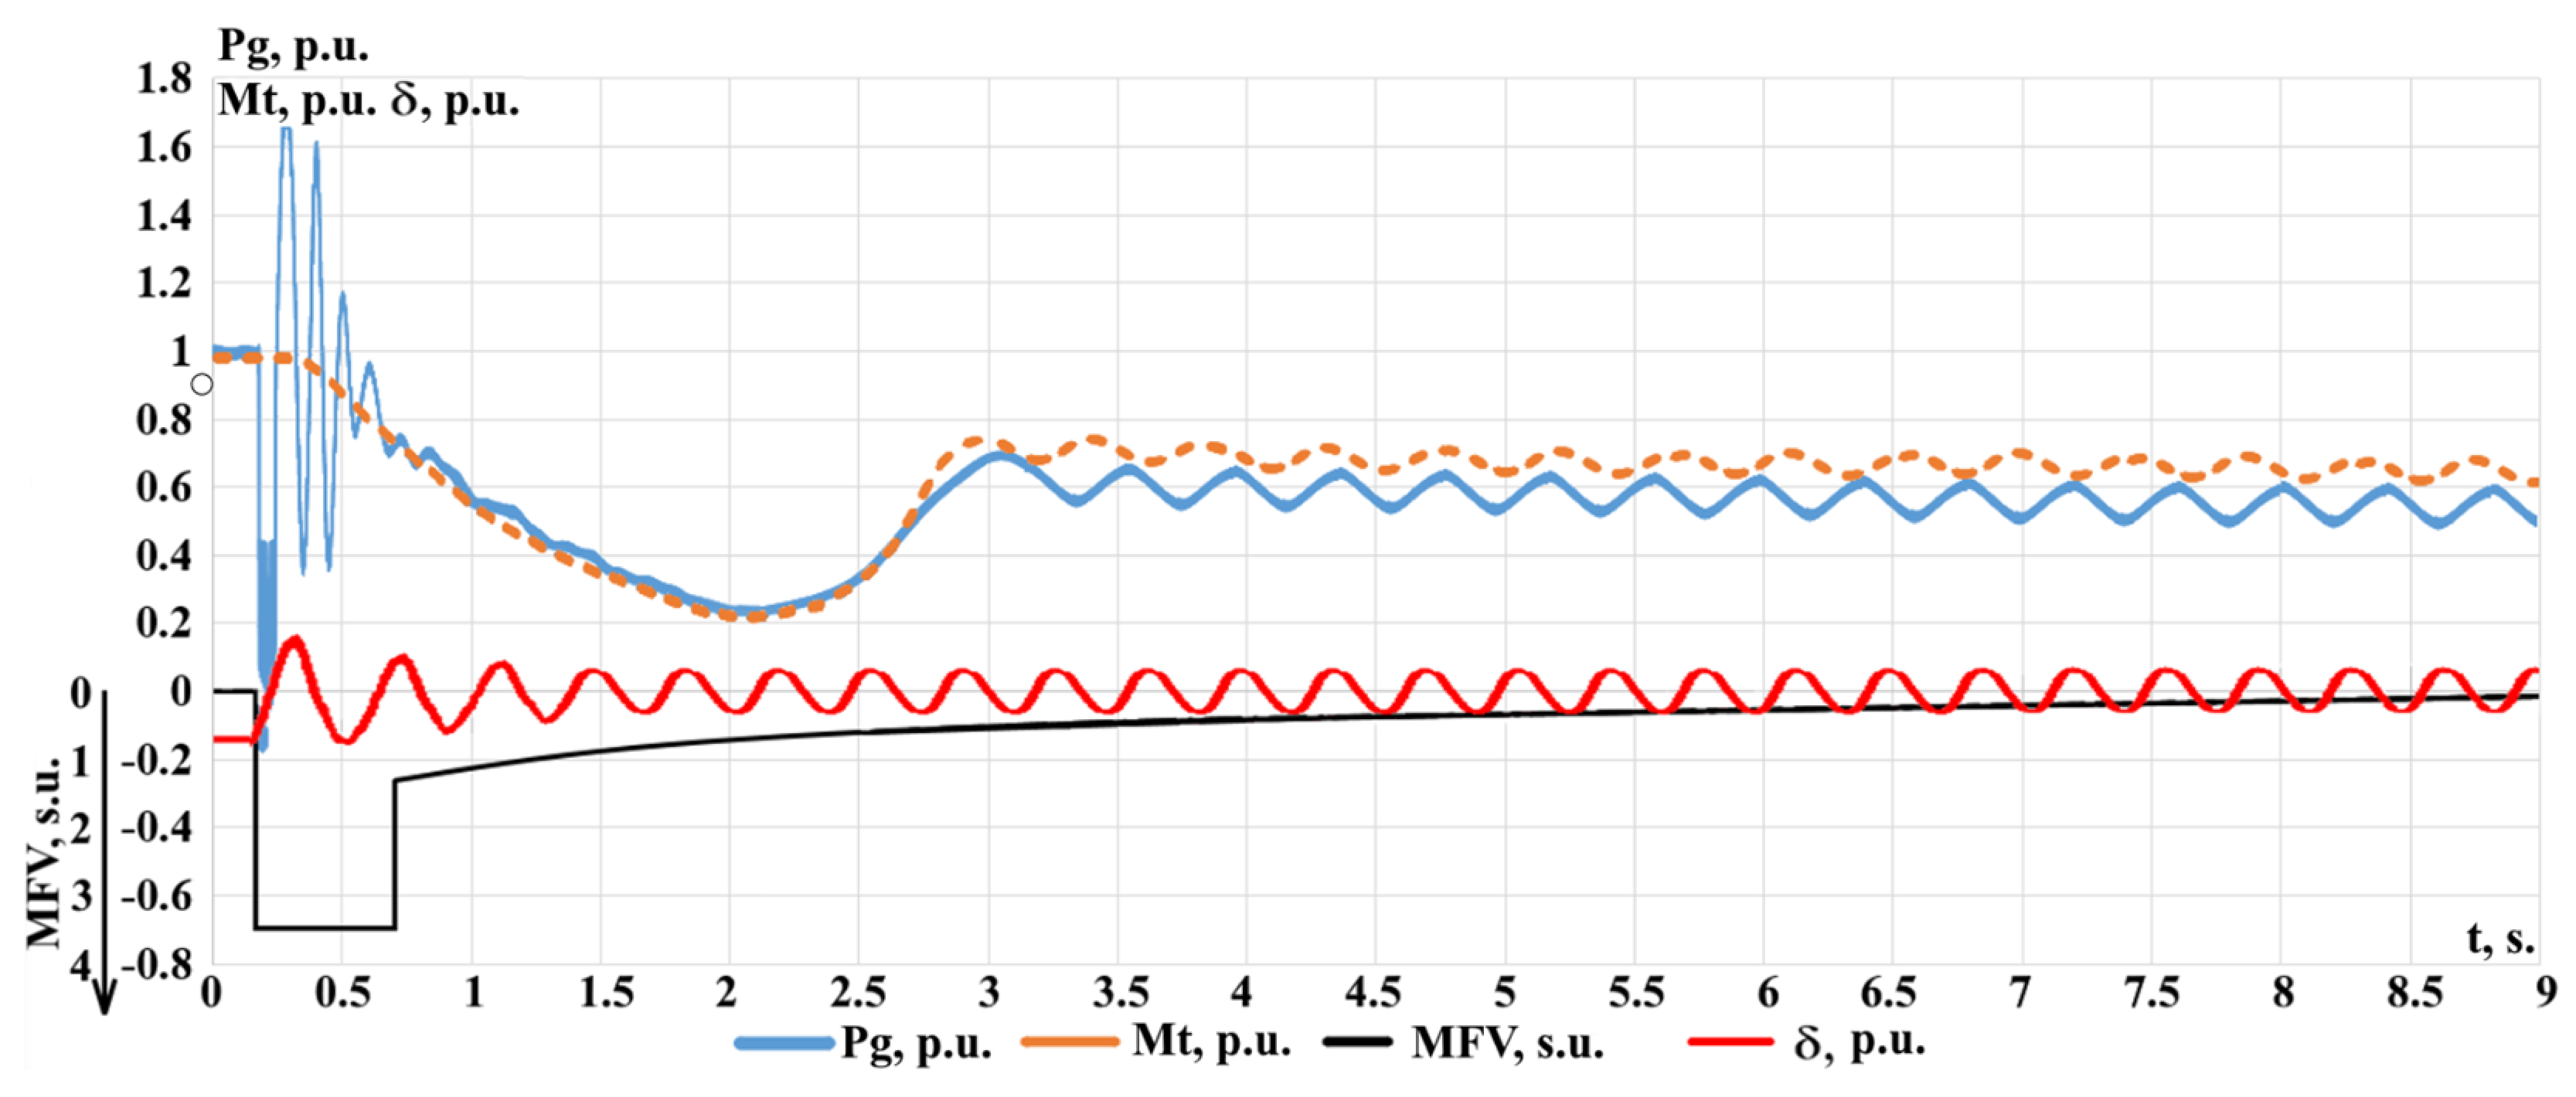
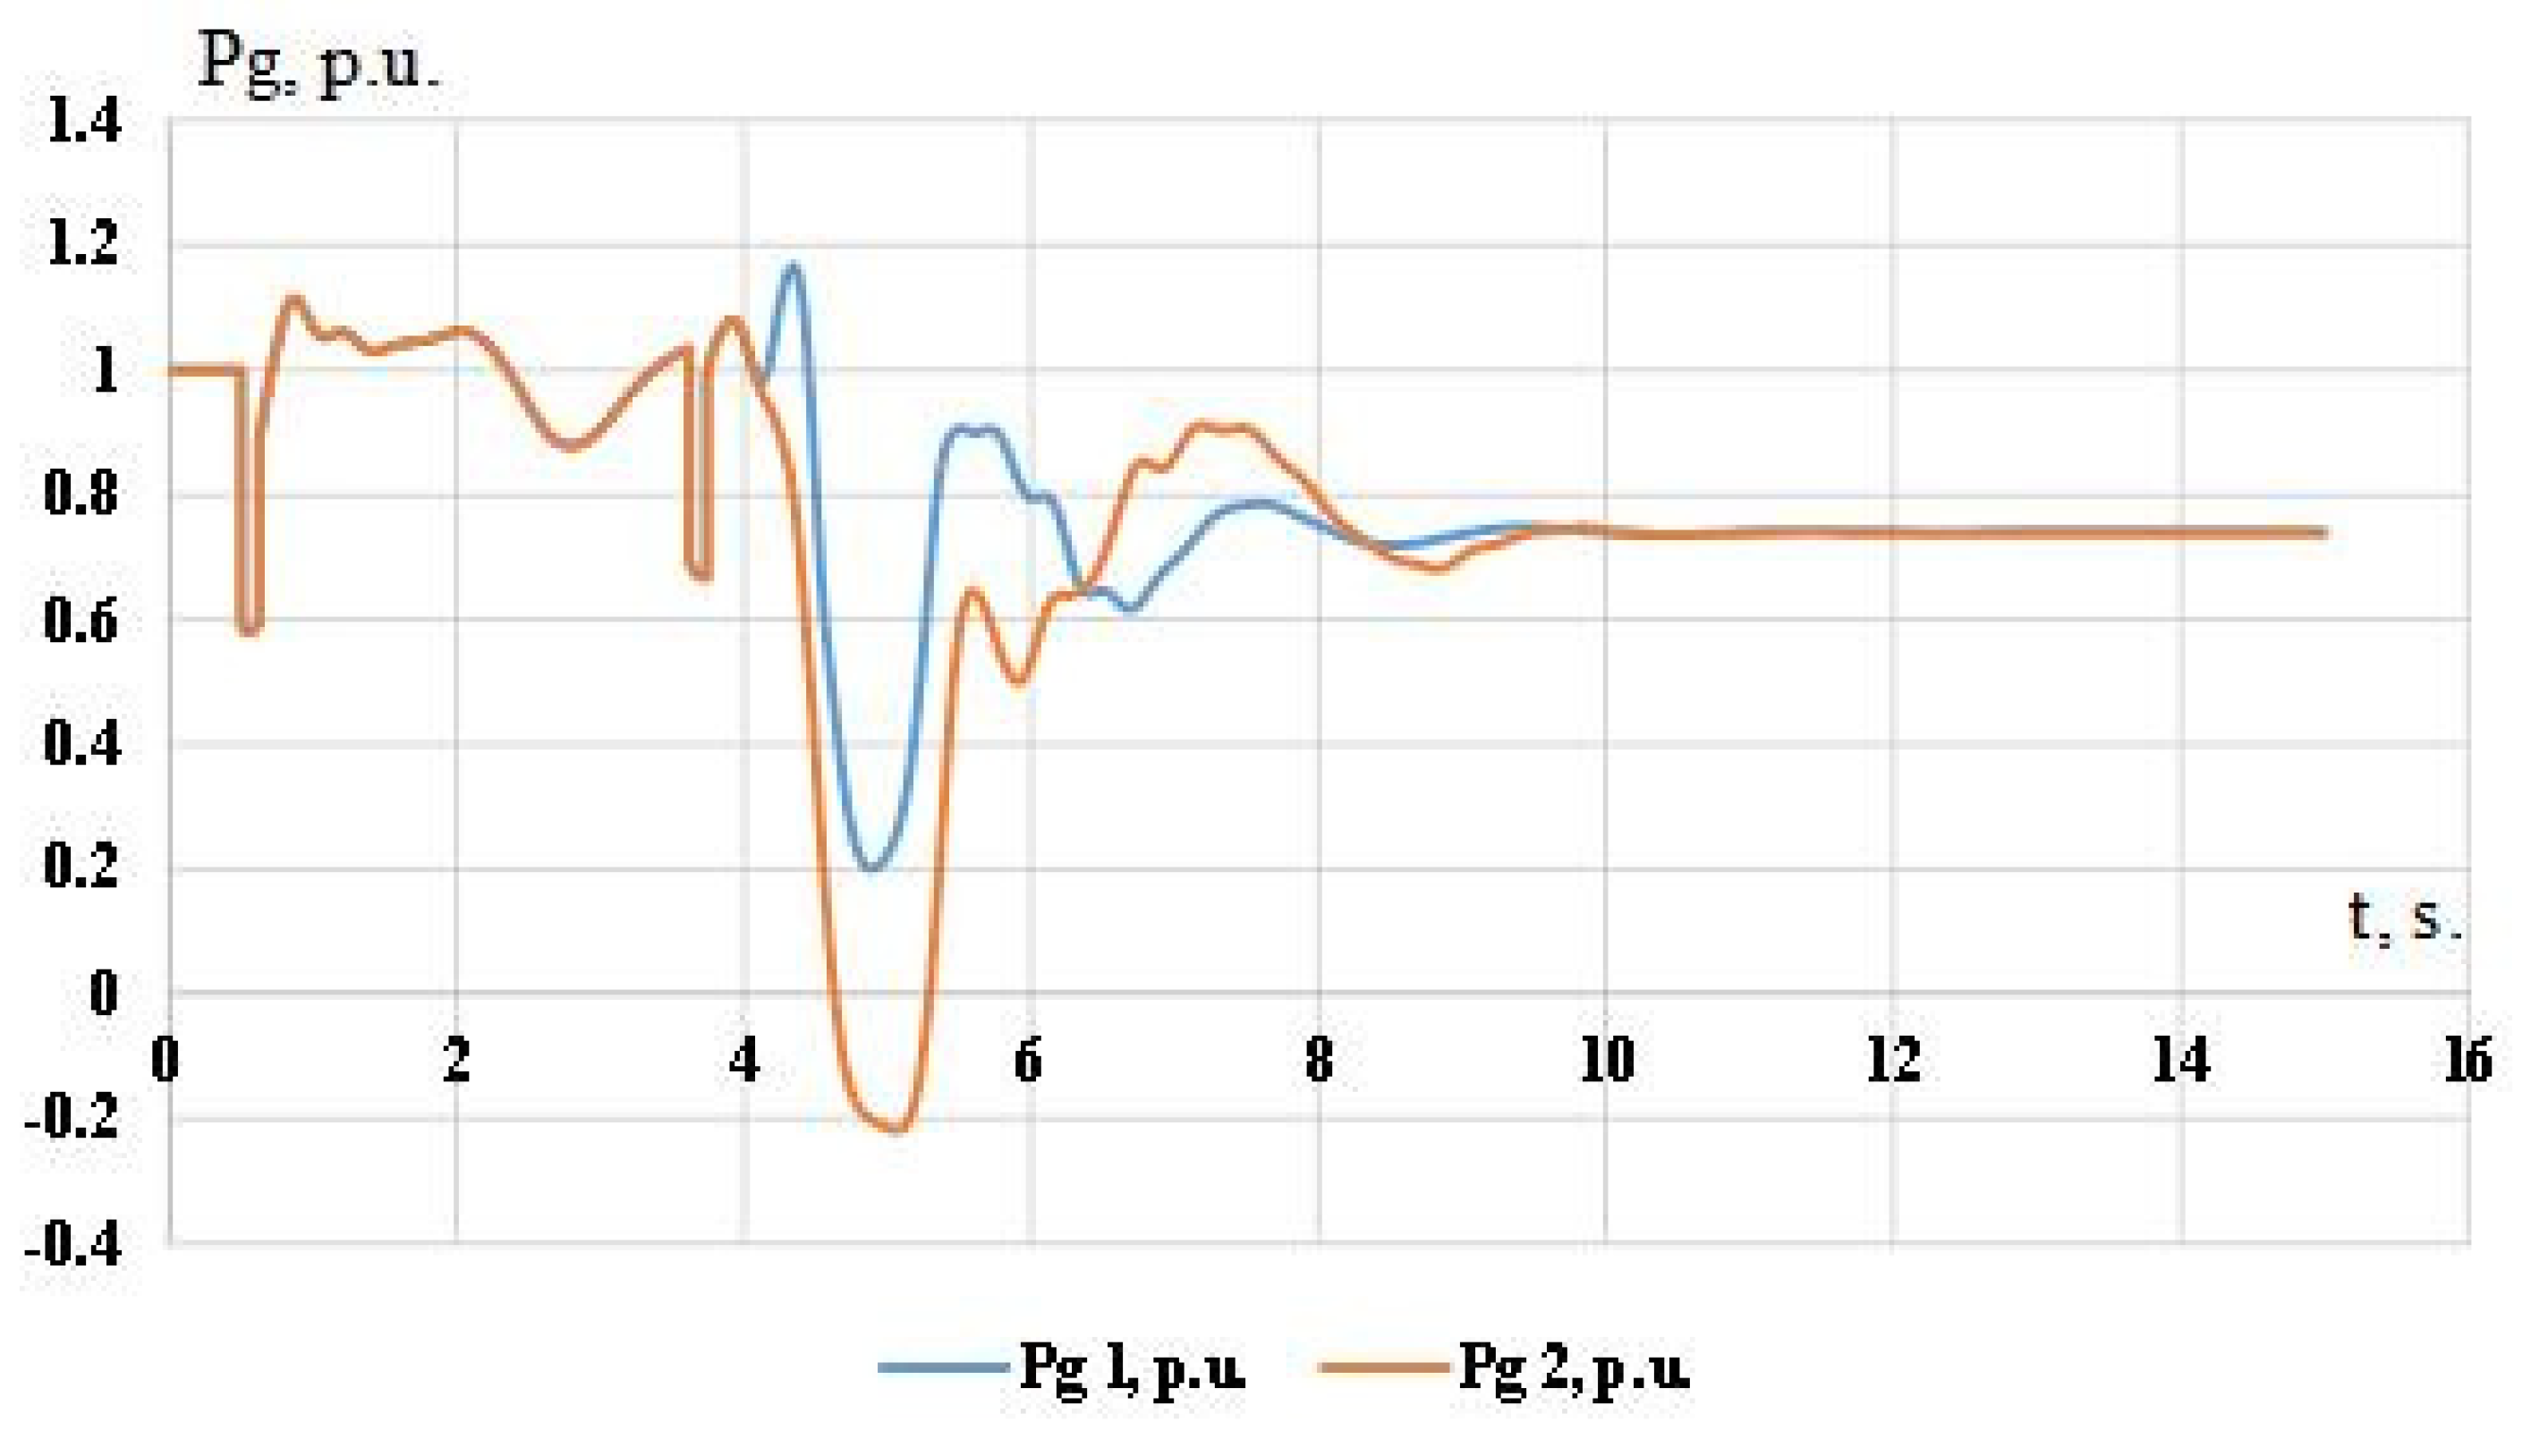
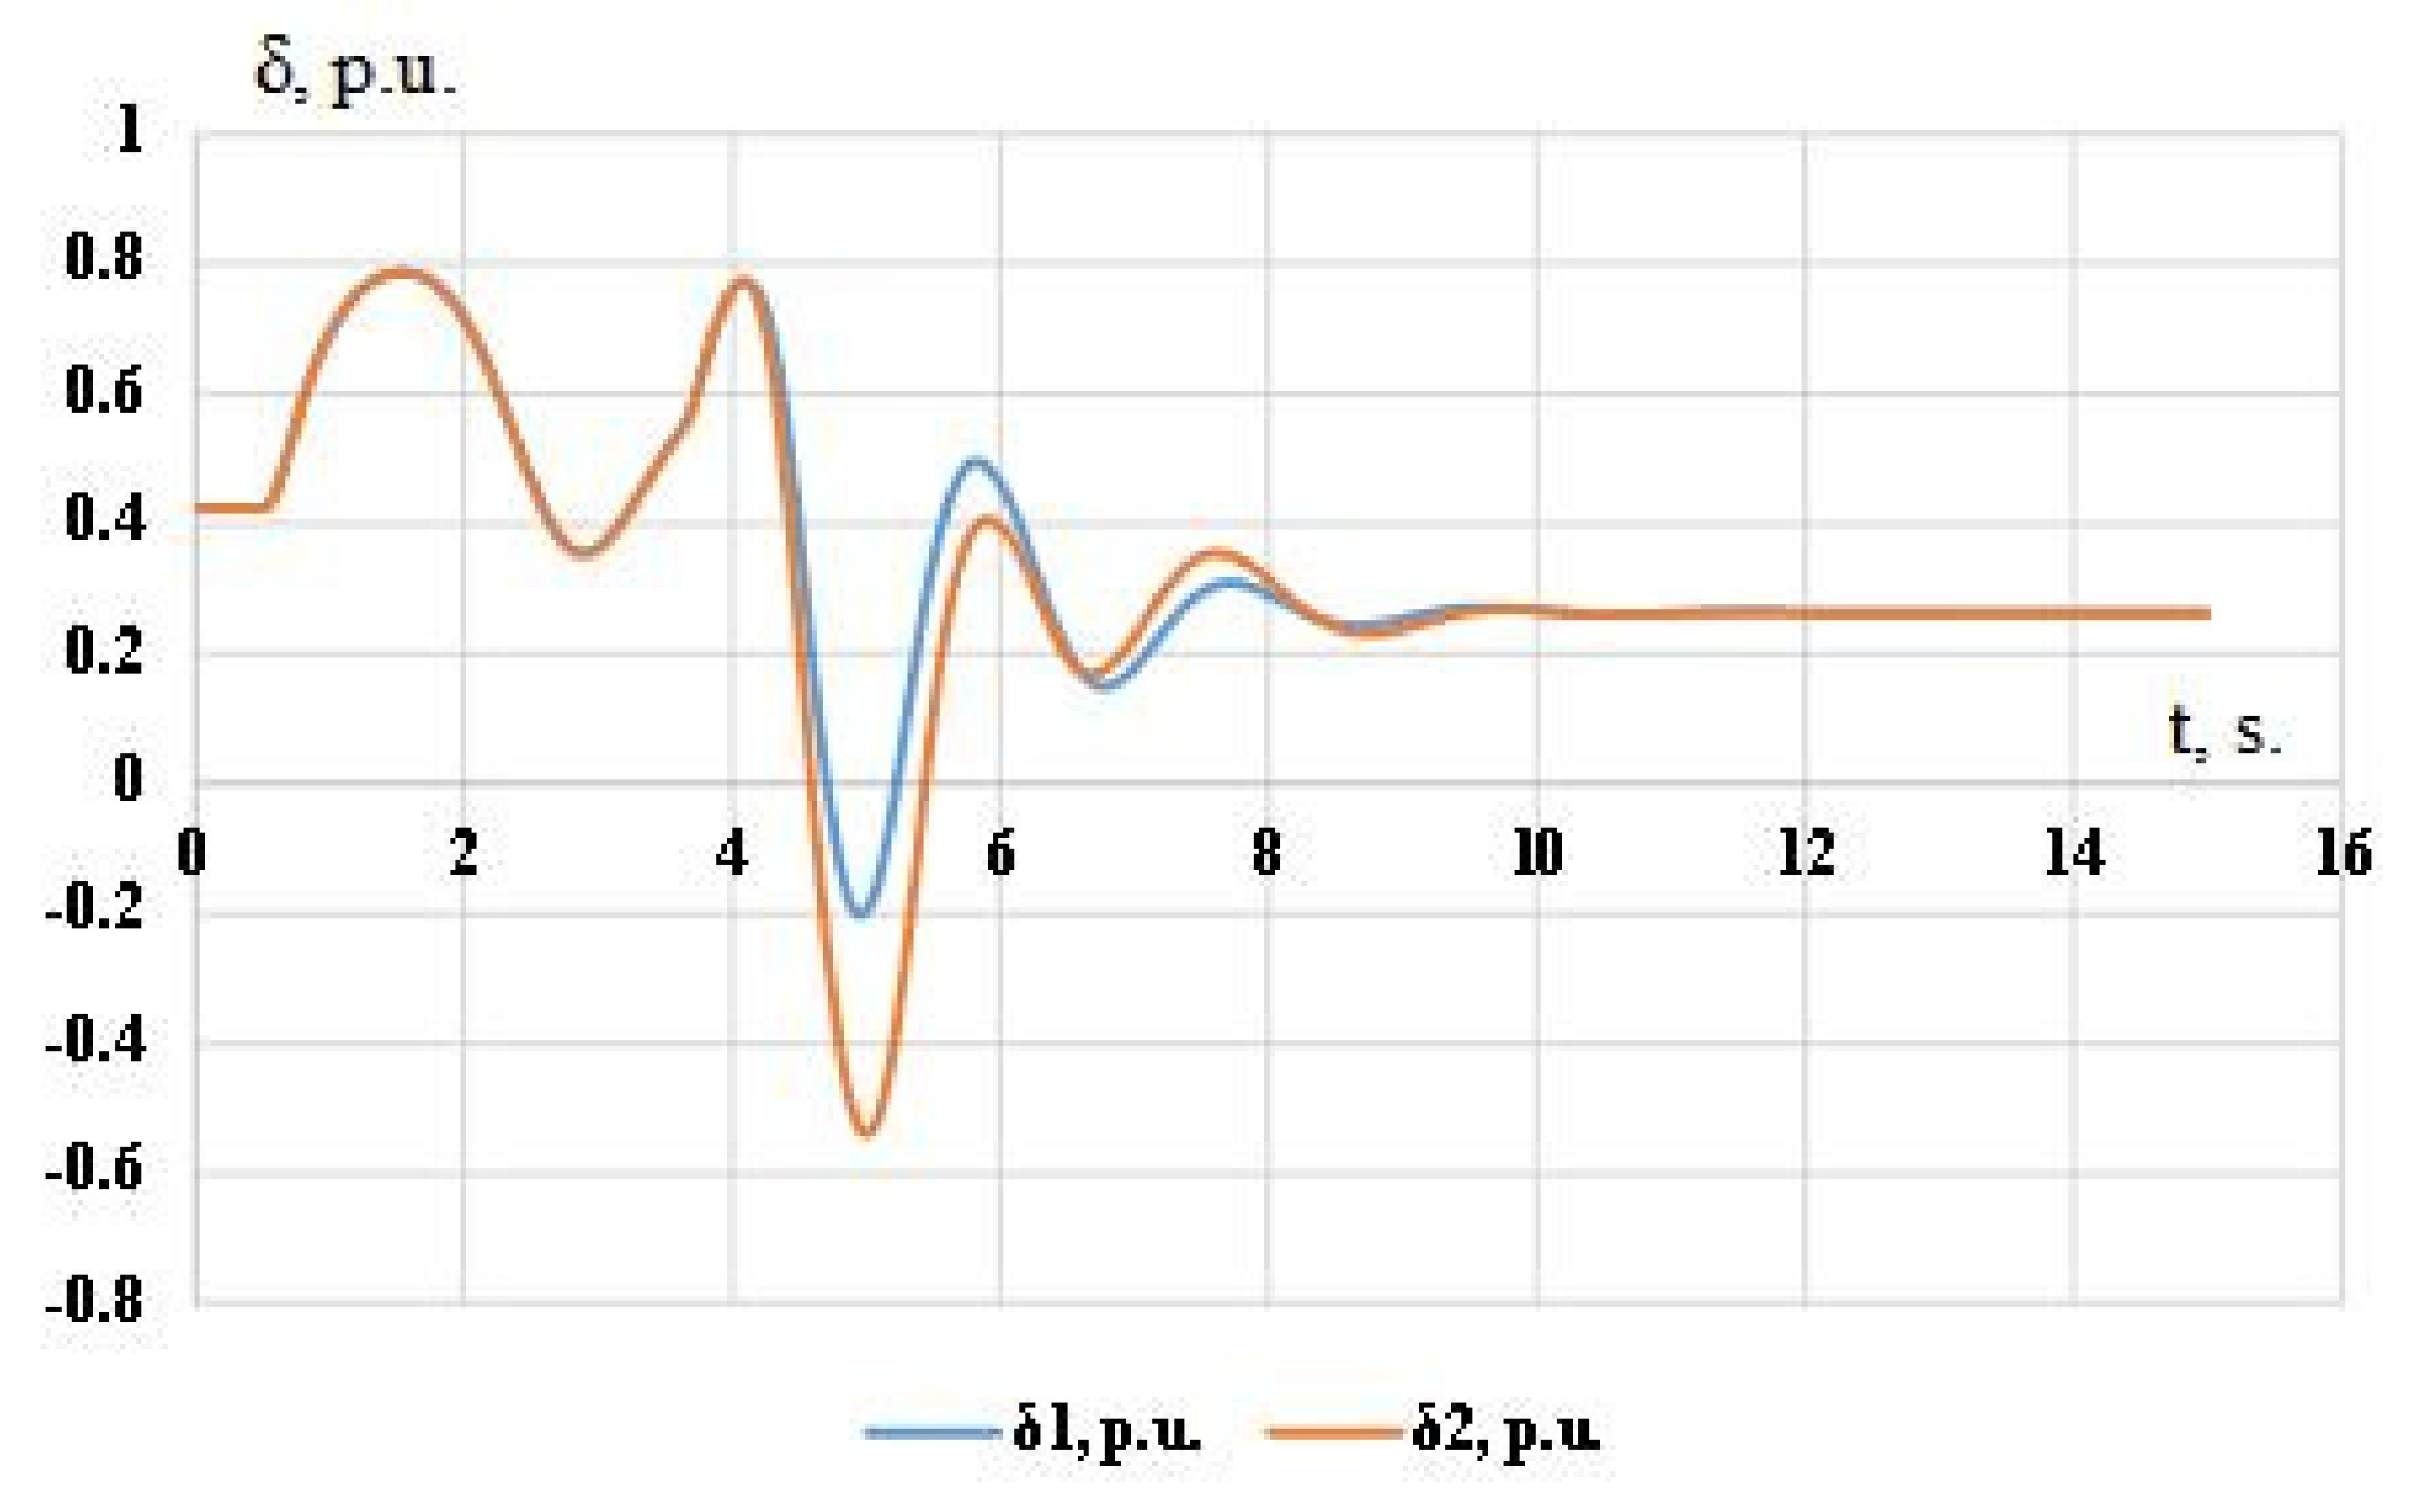
5.2. Experimental Studies of the Developed Methodology

Based on the FV setting methodology, having complete and reliable information about the time constants of the FV control signal path equipment, it is necessary to determine the value of the parameter Ai.
It is necessary to select the value at which the maximum closing speed of the control valves is achieved (Figure 13, Figure 14 and Figure 15), while avoiding excessive pressure on the control valves of the turbine cylinders. In Figure 13, Figure 14 and Figure 15, t1 is the moment of short-circuit occurrence, t2 is the moment of L3 line tripping, and t3 is the moment of maximum unloading.
The value of Ai = 3.5 pu. allows for a realization of the process of FV at 10.5% faster than at Ai = 3 pu. and only at 2.8% slower than at Ai = 4 pu. The increase in the FV speed for a case of Ai = 4 pu. is not expedient considering the increased influence on the control valves.
In order to provide the necessary unloading depth that guarantees the dynamic stability saving (Figure 16, Figure 17 and Figure 18), it is necessary to select the TMFV parameter.
At TMFV = 0.6 s., the reduction in the active power generation is high for the given accident, and at TMFV = 0.45, it is not enough. Thus, the optimal value is the value at which the dynamic stability is saved, TMFV = 0.55 s.
The values of A0 and τMFV should provide a minimum level of overshoot, as well as the minimization of the duration and amplitude of the synchronous swings when the FV control signal is zeroed (Figure 19, Figure 20 and Figure 21):
  • Case 1: Ai = 3.5 pu.; TKPT = 0.55 s.; A0 = 1.25 pu.; τMFV = 2 s.
  • Case 2: Ai = 3.5 pu TKPT = 0.55 s.; A0 = 1.25 pu.; τMFV = 1.5 s.
  • Case 3: Ai = 3.5 pu.; TKPT = 0.55 s.; A0 = 1.25 pu; τMFV = 3 s.
At τMFV = 2 s, unloading occurs with significant overshooting and swings stop after 4.78 s. At τMFV = 3 s, steady-state synchronous swings are observed.
As a result of the experiments, the optimal values of the FV parameters for G2 at the switching off of L3 were determined: Ai = 3.5 pu; TKRT = 0.55 s.; A0 = 1.25 pu; τMFV = 1.5 s.
The FV parameters were also adjusted for a difficult to simulate single-phase short-circuit (Figure 21). The optimal parameters for this case were obtained according to the developed methodology of the FV setting: Ai = 3.2 pu; TKRT = 0.55 s.; A0 = 1.25 pu; τMFV = 1.3 s.

5.3. Comparison with Existing Approach

Unlike the conventional approach [8,34] applied to the type of turbine bin under consideration, the proposed methodology is more flexible. It allows you to use an unlimited number of simulations to determine the most optimal flow of the turbine FV process. This approach makes it possible to most accurately find the main parameters that determine the form of the transient process in case of emergency excess power. According to the conventional approach, to adjust the turbine FV, one of the three characteristics provided by the manufacturer and most closely corresponding to the amount of excess that has arisen is used. Further, in Figure 22 and Figure 23, graphs of the comparison of the powers and angles of the generator G2 using the conventional approach (Pg2, δ2) and the developed methodology (Pg1, δ1) of the turbine FV settings are shown. The amount of excess power generated after a short circuit and an unsuccessful automatic reclosing on the damaged line was 330 MW. The turbine FV parameters according to the conventional setting approach: Ai = 4 pu; TKRT = 0.6 s.; A0 = 1.25 pu; τMFV = 2 s. The turbine FV parameters according to the setting methodology presented in Section 2 and Section 5.2: Ai = 3.5 pu; TKRT = 0.55 s.; A0 = 1.25 pu; τMFV = 1.5 s.
As a result of applying the optimal turbine FV settings, the deviation of the active power and the angle decreased by more than 30%, thus remaining within the allowable power reduction for the turbine type under study. In addition, the value of the electromagnetic power of the generator remains positive for the duration of the time of the transient process, which contributes to the correct operation of the internal protection of the generator and will not trigger the reverse power protection, keeping the generator in operation.

6. Conclusions

The article presents developed and tested methodology in the real electric power system of the optimal setting of the FV parameters, which provides technologically the most effective control of the FV process and takes into account the influence of the external network on these parameters. The experimental studies have confirmed the high efficiency of the developed method of the FV setting and prove that the value of each FV parameter influences the character of the transient process. Thus, it becomes possible to perform the optimal setting of the FV parameters for any emergency unbalance of active power, in order to ensure not only the stable operation of the EPS, but also an acceptable transient process with a minimum amplitude and duration of synchronous swings when eliminating the emergency surplus of active power. To carry out the above experiments, a comprehensive and reliable mathematical model was developed based on the data of a real prime mover, consisting of a steam turbine, boiler unit, and their control systems, allowing for the dynamic change in its setting parameters to form a complex shape FV control signal, necessary for optimal transient control in case of a surplus of emergency power. The proposed approach differs from the currently used one in that the optimal characteristic of the electrical signal is selected by multiple simulations, rather than one of three to five initial settings determined at the turbine manufacturer, without taking into account the response of the power system to the turbine unloading process. Thus, with detailed modeling, it is possible to achieve optimal results for a turbine of any type and installed at any point in the power system. A comparison was made between the conventional approach and the developed methodology. The application of a new technique to obtain optimal turbine FV settings made it possible to reduce the deviation of the active power and angle by more than 30% relative to the conventional approach. Thus, it was possible to retain these parameters within the permissible power reduction for the type of turbines under study. In addition, it was possible to keep the value of the electromagnetic power of the generator positive during the transient, which eliminates the operation of the reverse power protection of the generator.

Author Contributions

Conceptualization, N.R. and A.K.; methodology, A.K.; software, M.A.; validation, N.R. and A.S.; formal analysis, M.A.; investigation, A.K.; resources, N.R.; data curation, A.K.; writing—original draft preparation, A.K.; writing—review and editing, A.S.; visualization, A.K.; supervision, N.R.; project administration, N.R.; funding acquisition, N.R. All authors have read and agreed to the published version of the manuscript.

Funding

This research received no external funding.

Data Availability Statement

Not applicable.

Conflicts of Interest

The authors declare no conflict of interest.

Nomenclature

KDRTthe coefficient of the post-fault power setting value (PDRT).
KMFVMFV control command.
KSFVSFV control command.
TEHS, KEHStime constant (TC) and gain ratio (GR) of electrohydraulic system (EHS).
TMRM, KMRMTC and GR of the slow-acting power control system.
TMUT, KMUTTC and GR of turbine control gear.
TPZTC of intermediate valve of turbine governor.
KnV, KnSGR of HPC and MPC with LPC steam turbine control valves.
TOZSTC opening of the spool valves of the MPC and LPC servomotors.
TZZSTC closing of the spool valves of the MPC and LPC servomotors.
TOSSTC time constant of the servomotor piston movement of the spool valves of the MPC and LPC for opening.
TZSSTC time constant of the servomotor piston movement of the spool valves of the MPC and LPC for closing.
TOZVTC opening of the spool valves of the HPC servomotors.
TZZVTC opening of the spool valves of the HPC servomotors.
TOSVTC time constant of the servomotor piston movement of the spool valves of the HPC for opening.
TZSVTC time constant of the servomotor piston movement of the spool valves of the HPC for closing.
TCVTC of the steam volume behind the control valves of the HPC.
TCSTC of the steam volume behind the control valves of the MPC.
TCNTC of the steam volume behind the control valves of the LPC.
TSHAFTTC of turbine rotor.
TPPTC of reheater.
TGOTC of elastic feedback control of MPC control values.
TDMTC of dynamic correction of the slow-acting power control loop.
TCHK, KCHKTC and GR of frequency correction of the fast-acting power control loop
TDKTC of dynamic correction of the fast-acting power control loop.
TIM, KIMTC and GR of power meter.
TIDP, KIDPTC and GR of boiler pressure integral controller.
TDP, KDPTC and GR of changes in steam consumption from the collector.
TKT, KKTTC and GR steam pipeline between boiler and turbine.
TDTTC of dynamic correction of the boiler heat control circuit by pressure.
TKTC of steam-generating unit.
TT, KTTC and GR of fuel supply line.
TIR, KIRTC and GR of integrated fuel regulator of a boiler unit.
TSN, KSNTC and GR of boiler capacity due to changes in the operation mode of auxiliary equipment.
TFM, KFMTC and GR of frequency meter.
KM0turbine torque perturbation modeling coefficient.
KCV, KCS, KCNcoefficients determining the share of the turbine torque due to the HPC, MPC and LPC.
Kp0fresh steam pressure coefficient (p0) in the CVD.
KVZD, KSZDcoefficients determining the initial positions of control valves of HPC, MPC and LPC.
KPPGR of reheater.
KOZV, KOZScoefficients of negative rigid feedback of the control system of control valves of HPC, MPC with LPC.
KRDV, KRDScontrol coefficients of control valves of HPC and MPC with LPC of the steam turbine with industrial and heat extraction of steam.
KRScoefficient of speed controller.
K∆pTcoefficient of power change due to fresh steam pressure (∆pT).
KDPKcoefficient of the power control for condensing turbines.
KARCHMpower control coefficient by the signal from the LFC (∆p ARCHM).
KGNset point value coefficient of the power unit (PGN).
KPAdynamic correction coefficient of the fast-acting power regulator.
KKOLGR of collector.
KPDPcoefficient of the proportional pressure regulator of the boiler.
KPCcoefficient for determining the initial value of steam pressure in the collector (p0c).
KPTRtransfer coefficient between the pressure change in the collector (∆pPTR) and the corresponding deviation of steam flow rate (∆D).
KCHN, KCHV, KD0, KD, KDVcoefficients specifying the type and mode of operation of the simulated primary motor.

References

  1. Arakelyan, E.K.; Kosoy, A.A.; Mezin, S.V. Improvement in the Participation of PGU-450 in the Regulation of Energy System Frequency and Power. In Proceedings of the 2020 International Multi-Conference on Industrial Engineering and Modern Technologies (FarEastCon), Vladivostok, Russia, 06–09 October 2020; pp. 1–4. [Google Scholar] [CrossRef]
  2. Jose, A.V.; Sunitha, R.; Deepak, M. Analysis of Variation in Steam Turbine Time Constant on Dynamic Frequency Regulation of a Deregulated Power System. In Proceedings of the 2019 IEEE 2nd International Conference on Power and Energy Applications (ICPEA), Singapore, 27–30 April 2019; pp. 17–21. [Google Scholar] [CrossRef]
  3. Saleh, B.; Yousef, A.M.; Ebeed, M.; Abo-Elyousr, F.K.; Elnozahy, A.; Mohamed, M.; Abdelwahab, S.A.M. Design of PID Controller with Grid Connected Hybrid Renewable Energy System Using Optimization Algorithms. J. Electr. Eng. Technol. 2021, 16, 3219–3233. [Google Scholar] [CrossRef]
  4. Yao, Y.; Gong, X.; Xin, H.; Zhao, L.; Song, S. Optimized Design of Steam Turbine Control System. In Proceedings of the 2020 Chinese Automation Congress (CAC), Shanghai, China, 06–08 November 2020; pp. 7063–7067. [Google Scholar] [CrossRef]
  5. Prioste, F.B.; Mendes, P.P.C.; Ferreira, C. Power system transient stability enhancement by fast valving. In Proceedings of the 2004 IEEE/PES Transmision and Distribution Conference and Exposition: Latin America (IEEE Cat. No. 04EX956), Sao Paulo, Brazil, 08–11 November 2004; pp. 639–644. [Google Scholar] [CrossRef]
  6. Dong, C.; Wang, B.; Sun, Y.; Wang, X. On effective rapid startup of 300 MW steam turbine unit. In Proceedings of the 2020 Chinese Control and Decision Conference (CCDC), Hefei, China, 22–24 August 2020; pp. 803–808. [Google Scholar] [CrossRef]
  7. Pertl, M.; Weckesser, T.; Rezkalla, M.; Marinelli, M. Transient stability improvement: A review and comparison of conventional and renewable-based techniques for preventive and emergency control. Electr. Eng. 2018, 100, 1701–1718. [Google Scholar] [CrossRef]
  8. Patel, R.; Bhatti, T.S.; Kothari, D.P. Improvement of Power System Transient Stability Using Fast Valving: A Review. Electr. Power Compon. Syst. 2001, 29, 927–938. [Google Scholar] [CrossRef]
  9. Cai, Y.; Li, W.; Zhang, B.; Wu, W.; Sheng, D.; Chen, J. Reliable Analysis on Fast Valving of Ultra-Supercritical Unit under Transient Fault Conditions. Am. Soc. Mech.Eng. Power Div. 2017, 2. [Google Scholar] [CrossRef]
  10. Kielian, M.; Lis, R. Turbine Fast Valving Study by the Use of a Steam Turbine Real-Time Simulator. In Proceedings of the 22nd International Conference Electronics, Palanga, Lithuania, 18–20 June 2018; pp. 1–5. [Google Scholar] [CrossRef]
  11. Kim, J.; Kim, S.; Cho, J. Power system transient stability enhancement by coordinated operation of EVA and SPS. In Proceedings of the Transmission & Distribution Conference & Exposition: Asia and Pacific, Seoul, Republic of Korea, 26–30 October 2009; pp. 1–4. [Google Scholar] [CrossRef]
  12. Moiseichenkov, A.N.; Senyuk, M.D.; Kovalenko, P.Y.; Dmitrieva, A.A. The Technique of Calculating a Steam Turbine Power For Characterization of The Turbine Fast Valving. In Proceedings of the International Conference on Electrotechnical Complexes and Systems (ICOECS), Ufa, Russia, 16–18 November 2021; pp. 79–82. [Google Scholar] [CrossRef]
  13. Patel, R.; Bhatti, T.S.; Kothari, D.P. Improvement of power system transient stability by coordinated operation of fast valving and braking resistor. Proc. Inst. Elect. Eng. Gen. Transm. Distrib. 2003, 150, 311–316. [Google Scholar] [CrossRef]
  14. Karady, G.G.; Daoud, A.A.; Mohamed, M.A. On-line transient stability enhancement using multi-agent technique. In Proceedings of the IEEE Power Engineering Society Winter Meeting (Cat. No. 02CH37309), New York, NY, USA, 27–31 January 2002; pp. 893–899. [Google Scholar] [CrossRef]
  15. Karady, G.G.; Mohamed, M.A. Improving transient stability using fast valving based on tracking rotor-angle and active power. In Proceedings of the IEEE Power Engineering Society Summer Meeting, Chicago, IL, USA, 21–25 July 2002; pp. 1576–1581. [Google Scholar] [CrossRef]
  16. Robak, S.; Machowski, J.; Skwarski, M. Enhancement of power system stability by real-time prediction of instability and early activation of steam turbine fast valving. Energy Rep. 2022, 8, 7704–7711. [Google Scholar] [CrossRef]
  17. Machowski, J.; Lubosny, Z.; Bialek, J.W.; Bumby, J.R. Power System Dynamics: Stability and Control; John Wiley & Sons: Hoboken, NJ, USA, 2020. [Google Scholar]
  18. Senyuk, M.D.; Moiseichenkov, A.; Kovalenko, P.; Dmitrieva, A.A. Adap-tive Algorithm for Steam Turbine Fast Valving Based on the Equal Area Criterion and Synchrophasor Measurements. In Proceedings of the 2021 International Conference on Electrotechnical Complexes and Systems (ICOECS), Ufa, Russia, 26–29 October 2021; pp. 68–73. [Google Scholar] [CrossRef]
  19. Molina-Cabrera, A.; Ríos, M.A.; Besanger, Y.; Hadjsaid, N.; Montoya, O.D. Latencies in power systems: A database-based time-delay compensation for memory controllers. Electronics 2021, 10, 208. [Google Scholar] [CrossRef]
  20. McLaren, P.G.; Kuffel, R.; Wierckx, R.; Giesbrecht, J.; Arendt, L. A real time digital simulator for testing relays. IEEE Trans. Power Deliv. 1992, 7, 207–213. [Google Scholar] [CrossRef]
  21. Andreev, M.V.; Gusev, A.S.; Ruban, N.Y.; Suvorov, A.A.; Ufa, R.A.; Askarov, A.B.; Bemš, J.; Králík, T. Hybrid Real-Time Simulator of Large-Scale Power Systems. IEEE Trans. Power Syst. 2019, 34, 1404–1415. [Google Scholar] [CrossRef]
  22. Muljadi, E.; Zhang, Y.C.; Gevorgian, V.; Kosterev, D. Understanding dynamic model validation of a wind turbine generator and a wind power plant. In Proceedings of the IEEE Energy Conversion Congress and Exposition (ECCE), Milwaukee, WI, USA, 18–22 September 2016; pp. 1–5. [Google Scholar] [CrossRef]
  23. Carreras, B.A.; Newman, D.E.; Dobson, I. Does size matter? Chaos Interdiscip. J. Nonlinear Sci. 2014, 24, 1–7. [Google Scholar] [CrossRef] [PubMed]
  24. Watson, N.; Arrillage, J. Power Systems Electromagnetic Transients Simulation; The Institution of Engineering and Technology: London, UK, 2003; pp. 351–358. [Google Scholar]
  25. Butcher, J.C. Numerical Methods for Ordinary Differential Equations: Early Days in the Birth of Numerical Analysis, 2nd ed.; John Wiley & Sons: Hoboken, NJ, USA, 2008; pp. 31–40. [Google Scholar]
  26. Hall, G.; Watt, J.M. Modern numerical methods for ordinary differential equations. Math. Comput. 1978, 32, 1322–1323. [Google Scholar] [CrossRef]
  27. Kosterev, D.; Taylor, C.; Mittelstadt, W. Model Validation for the August 10, 1996 WSCC System Outage. IEEE Trans. Power Syst. 1999, 14, 967–979. [Google Scholar] [CrossRef] [PubMed]
  28. Chen, Y.; Dinavahi, V. Multi-FPGA digital hardware design for detailed large-scale real-time electromagnetic transient simulation of power systems. IET Gener. Transm. Distrib. 2013, 7, 451–463. [Google Scholar] [CrossRef]
  29. Suvorov, A.; Gusev, A.; Ruban, N.; Andreev, M.; Askarov, A.; Ufa, R.; Razzhivin, I.; Kievets, A.; Bay, J. Potential Application of HRTSim for Comprehensive Simulation of Large-Scale Power Systems with Distributed Generation. Int. J. Emerg. Electr. Power Syst. 2019, 20, 20190075. [Google Scholar] [CrossRef]
  30. Lin, X.; Gole, A.M.; Yu, M. A wide-band multi-port system equivalent for real-time digital power system simulators. IEEE Trans. Power Syst. 2009, 24, 237–249. [Google Scholar] [CrossRef]
  31. Liang, Y.; Lin, X.; Gole, A.M.; Yu, M. Improved coherency-based wide-band equivalents for real-time digital simulators. IEEE Trans. Power Syst. 2011, 26, 1410–1417. [Google Scholar] [CrossRef]
  32. Shu, D.; Xie, X.; Jiang, Q.; Huang, Q.; Zhang, C. A novel interfacing technique for distributed hybrid simulations combining EMT and transient stability models. IEEE Trans. Power Deliv. 2018, 33, 130–140. [Google Scholar] [CrossRef]
  33. Andreev, M.V.; Sulaymanov, A.O. Platform based on Hybrid Real-Time Power System Simulator for development and research of Intelligent Power Systems with active-adaptive networks. In Proceedings of the IEEE Eindhoven PowerTech, Eindhoven, The Netherlands, 29 June–2 July 2015; pp. 1–6. [Google Scholar] [CrossRef]
  34. Kundur, P. Power System Stability and Control; McGraw-Hill: New York, NY, USA, 1995. [Google Scholar]
Figure 1. Electrical signal forming the MFV.
Energies 16 01745 g001
Figure 2. Block diagram of HRTSim configuration.
Energies 16 01745 g002
Figure 3. The block diagram of the power unit SHP.
Energies 16 01745 g003
Figure 4. The functional scheme of the HCP SG.
Energies 16 01745 g004
Figure 5. Mathematical model of a boiler unit.
Energies 16 01745 g005
Figure 6. Mathematical model of a steam turbine.
Energies 16 01745 g006
Figure 7. Oscillograms of signals obtained when testing the second-order Padé function.
Energies 16 01745 g007
Figure 8. Single-line scheme of the simulated EPS.
Energies 16 01745 g008
Figure 9. Graphs of turbine torque changes during FV.
Energies 16 01745 g009
Figure 10. Line L3 currents for a case of short-circuit on the buses B2.
Energies 16 01745 g010
Figure 11. Voltages for a case of three-phase short circuit on the B2 buses.
Energies 16 01745 g011
Figure 12. Generator G2 voltage, active power, and frequency for a case of three-phase short circuit on the B2 buses.
Energies 16 01745 g012
Figure 13. Generator G2 active power and turbine torque for a case of FV (Ai = 4 pu).
Energies 16 01745 g013
Figure 14. Generator G2 active power and turbine torque for a case of FV (Ai = 3.5 pu).
Energies 16 01745 g014
Figure 15. Generator G2 active power and turbine torque for a case of FV (Ai = 3 pu).
Energies 16 01745 g015
Figure 16. Generator G2 active power and turbine torque for a case of FV (Ai = 3.5 pu., TMFV = 0.45 s).
Energies 16 01745 g016
Figure 17. Generator G2 active power and turbine torque for a case of FV (Ai = 3.5 pu, TMFV = 0.55 s).
Energies 16 01745 g017
Figure 18. Generator G2 active power and turbine torque for a case of FV (Ai = 3.5 pu, TMFV = 0.6 s).
Energies 16 01745 g018
Figure 19. Generator G2 active power, turbine torque, and angle for the Case 1.
Energies 16 01745 g019
Figure 20. Generator G2 active power, turbine torque, and angle for the Case 2.
Energies 16 01745 g020
Figure 21. Generator G2 active power, turbine torque, and angle for the Case 3.
Energies 16 01745 g021
Figure 22. Generator G2 active power.
Energies 16 01745 g022
Figure 23. Generator G2 angle.
Energies 16 01745 g024
Table 1. Composition of elements of the modeled EPS.
NameNumber
Generator51
Transformers and autotransformers60
Power lines114
Loads75
Controlled shunt reactor11
Shunt reactor16
Capacitor battery15
Table 2. Voltages in the Nodes of the EPS and Transmission Line Currents.
Name of the BusesVoltage, kVName of the LineCurrent, kA
Field DataHRTSim|δ|, %Field DataHRTSim|δ|, %
B1515.91517.230.25L10.6470.6510.61
B2521.26520.150.21L20.2610.2571.55
B3514.41515.860.28L30.6220.6240.32
B4235.92236.050.05L40.6730.6750.29
B5236.41234.980.6L50.1490.1471.36
B6117.29118.010.61L60.3650.3660.27
B7121.48122.300.67
Table 3. Transmission Line Active Power.
Name of Power LineActive Power, MW
Field DataHRTSim|δ|, %
L1548.24548.110.024
L2261.32260.750.22
L3332.02331.210.24
L4597.75598.530.13
L561.5361.550.03
L664.2164.110.16
Disclaimer/Publisher’s Note: The statements, opinions and data contained in all publications are solely those of the individual author(s) and contributor(s) and not of MDPI and/or the editor(s). MDPI and/or the editor(s) disclaim responsibility for any injury to people or property resulting from any ideas, methods, instructions or products referred to in the content.

