
Drying Characteristics, Kinetic Modeling, Energy and Exergy Analyses of Water Yam (Dioscorea alata) in a Hot Air Dryer

 ,
,  ,
,  ,
,
Abstract
:1. Introduction
2. Materials and Methods
2.1. Sample Preparation
2.2. Drying Experimentation
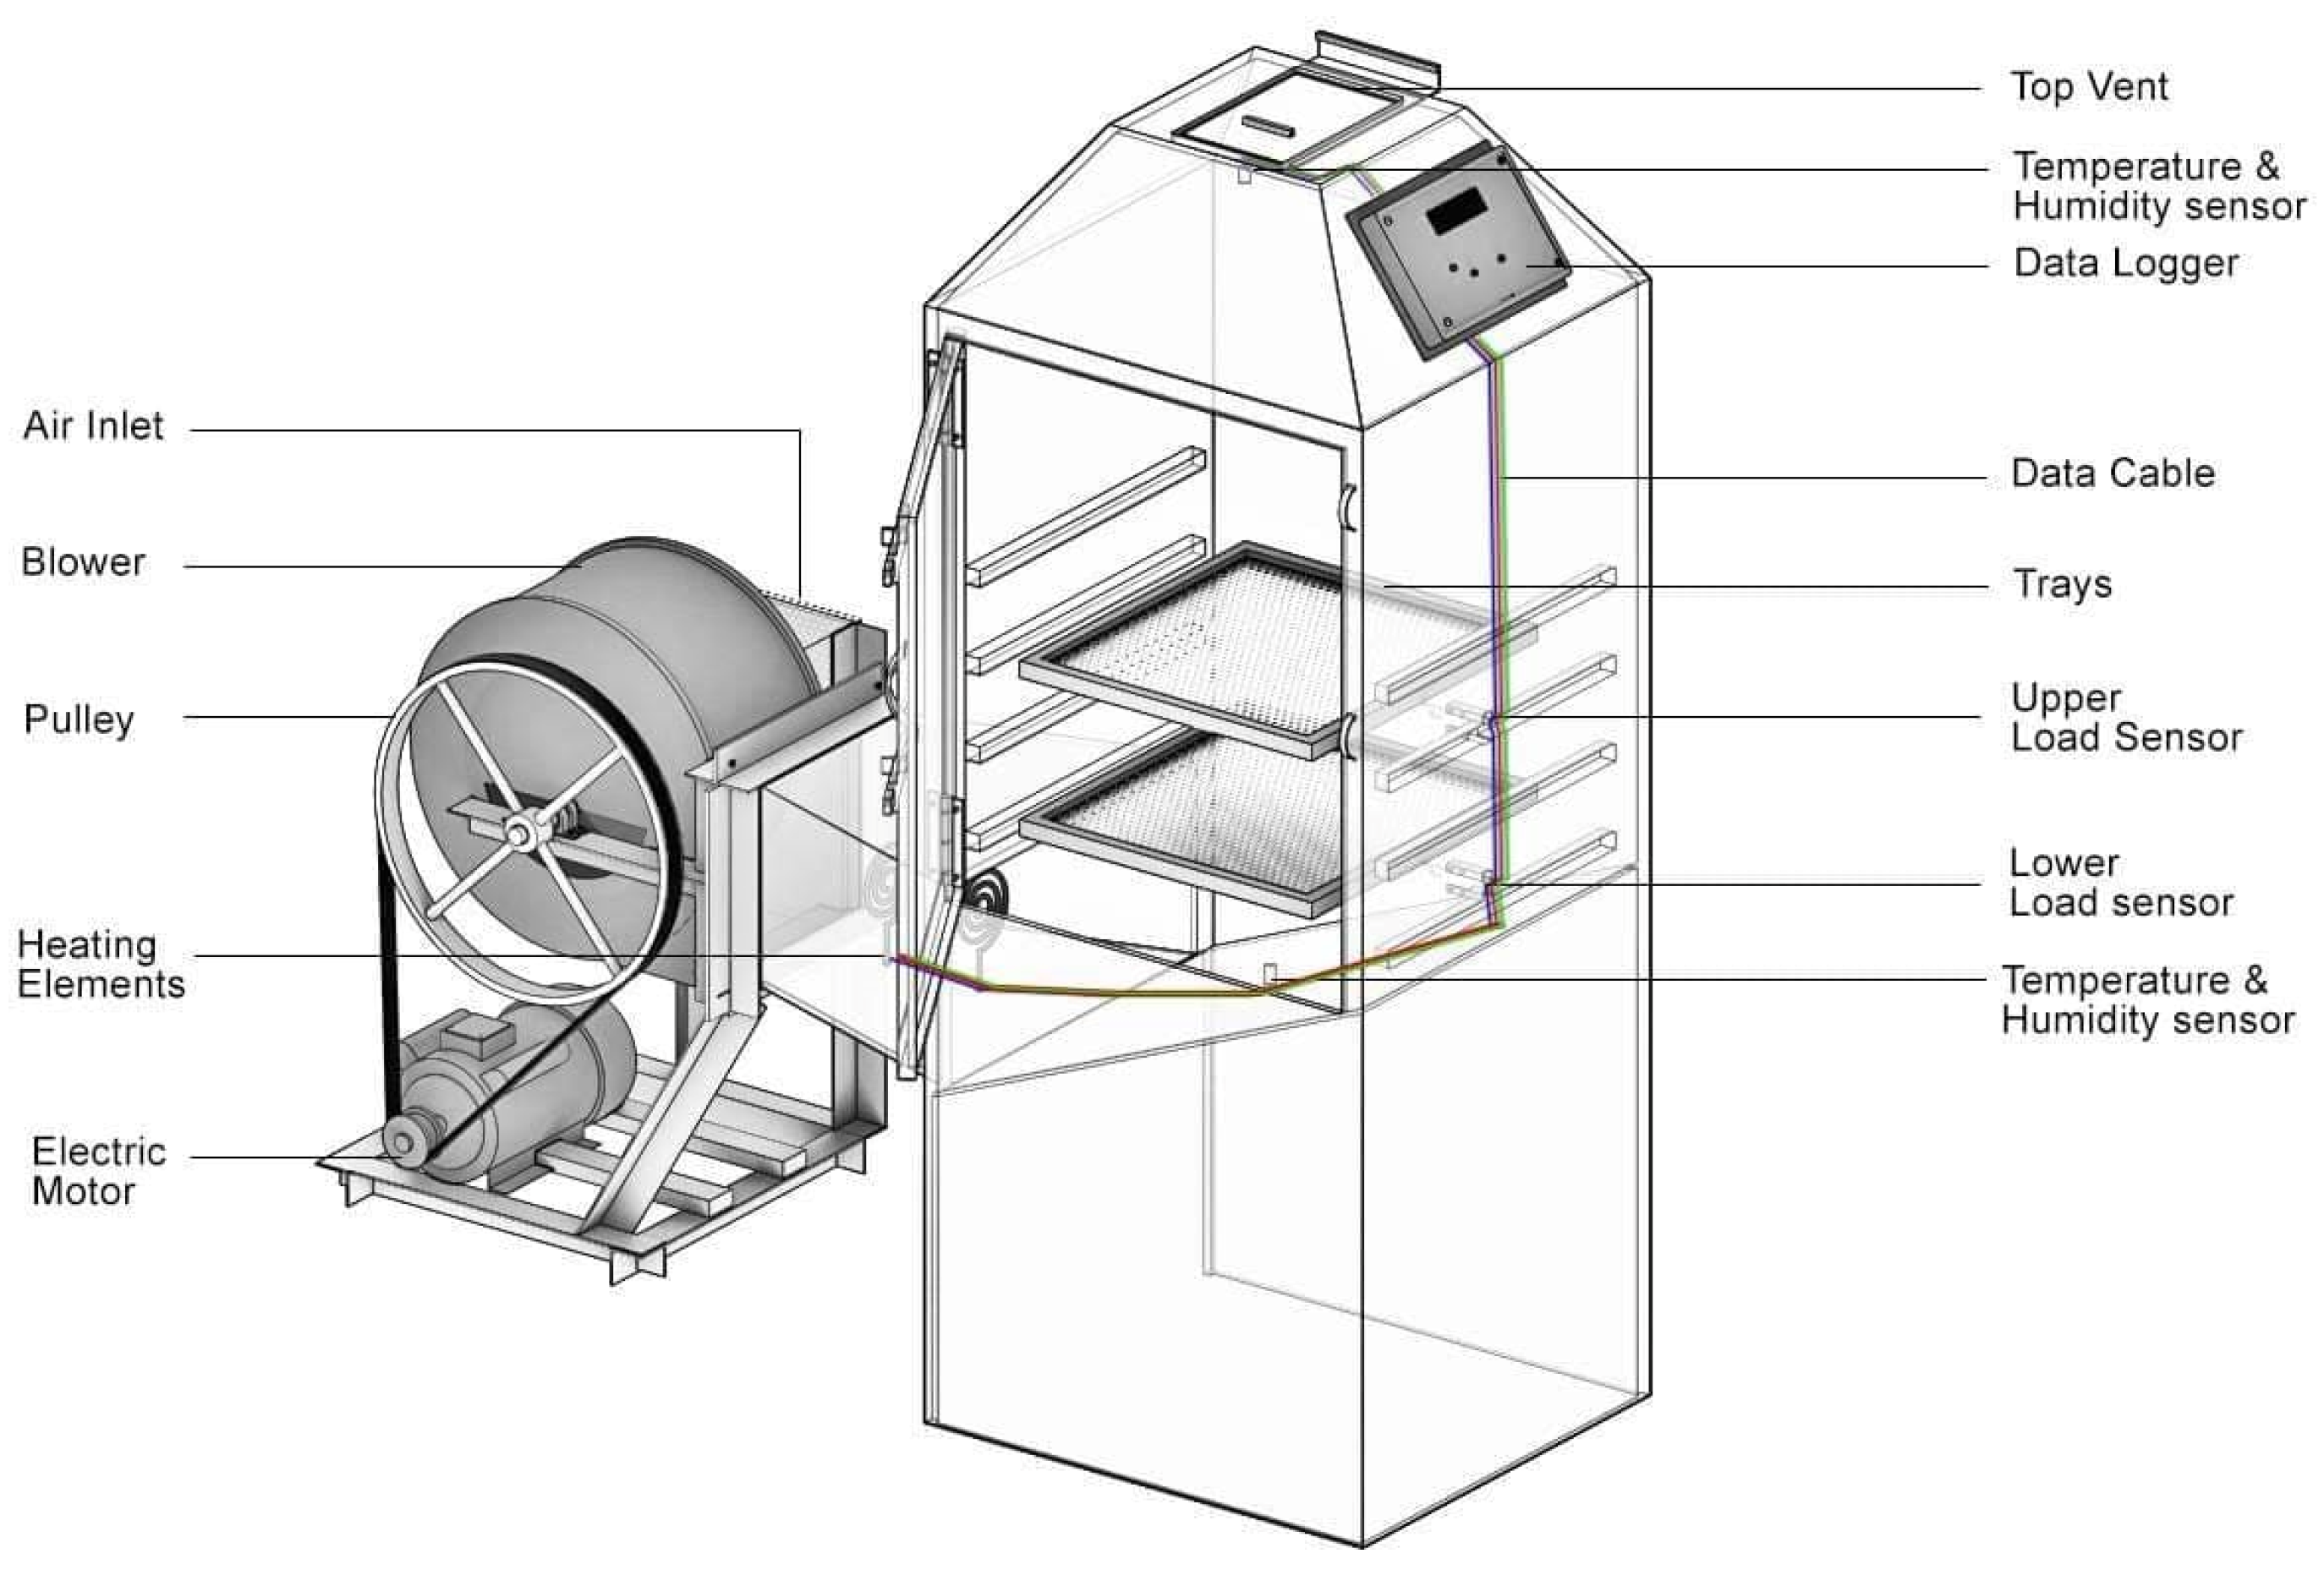
2.2.1. Dryer Description and Operation
2.2.2. Drying Procedure
2.3. Drying Kinetic
2.3.1. Moisture Content
2.3.2. Moisture Ratio
2.3.3. Drying Rate
2.4. Mathematical Model
2.5. Moisture Diffusivity
2.6. Activation Energy
2.7. Energy Analyses
2.7.1. Energy Utilization
2.7.2. Energy Utilization Ratio
2.8. Exergy Analyses
2.8.1. Exergy Inflow, Exergy Outflow and Exergy Loss
2.8.2. Exergy Efficiency
2.8.3. Improvement Potential
2.8.4. Exergetic Sustainability Index
2.9. Statistical Analyses
2.10. Uncertainty Analyses
3. Results
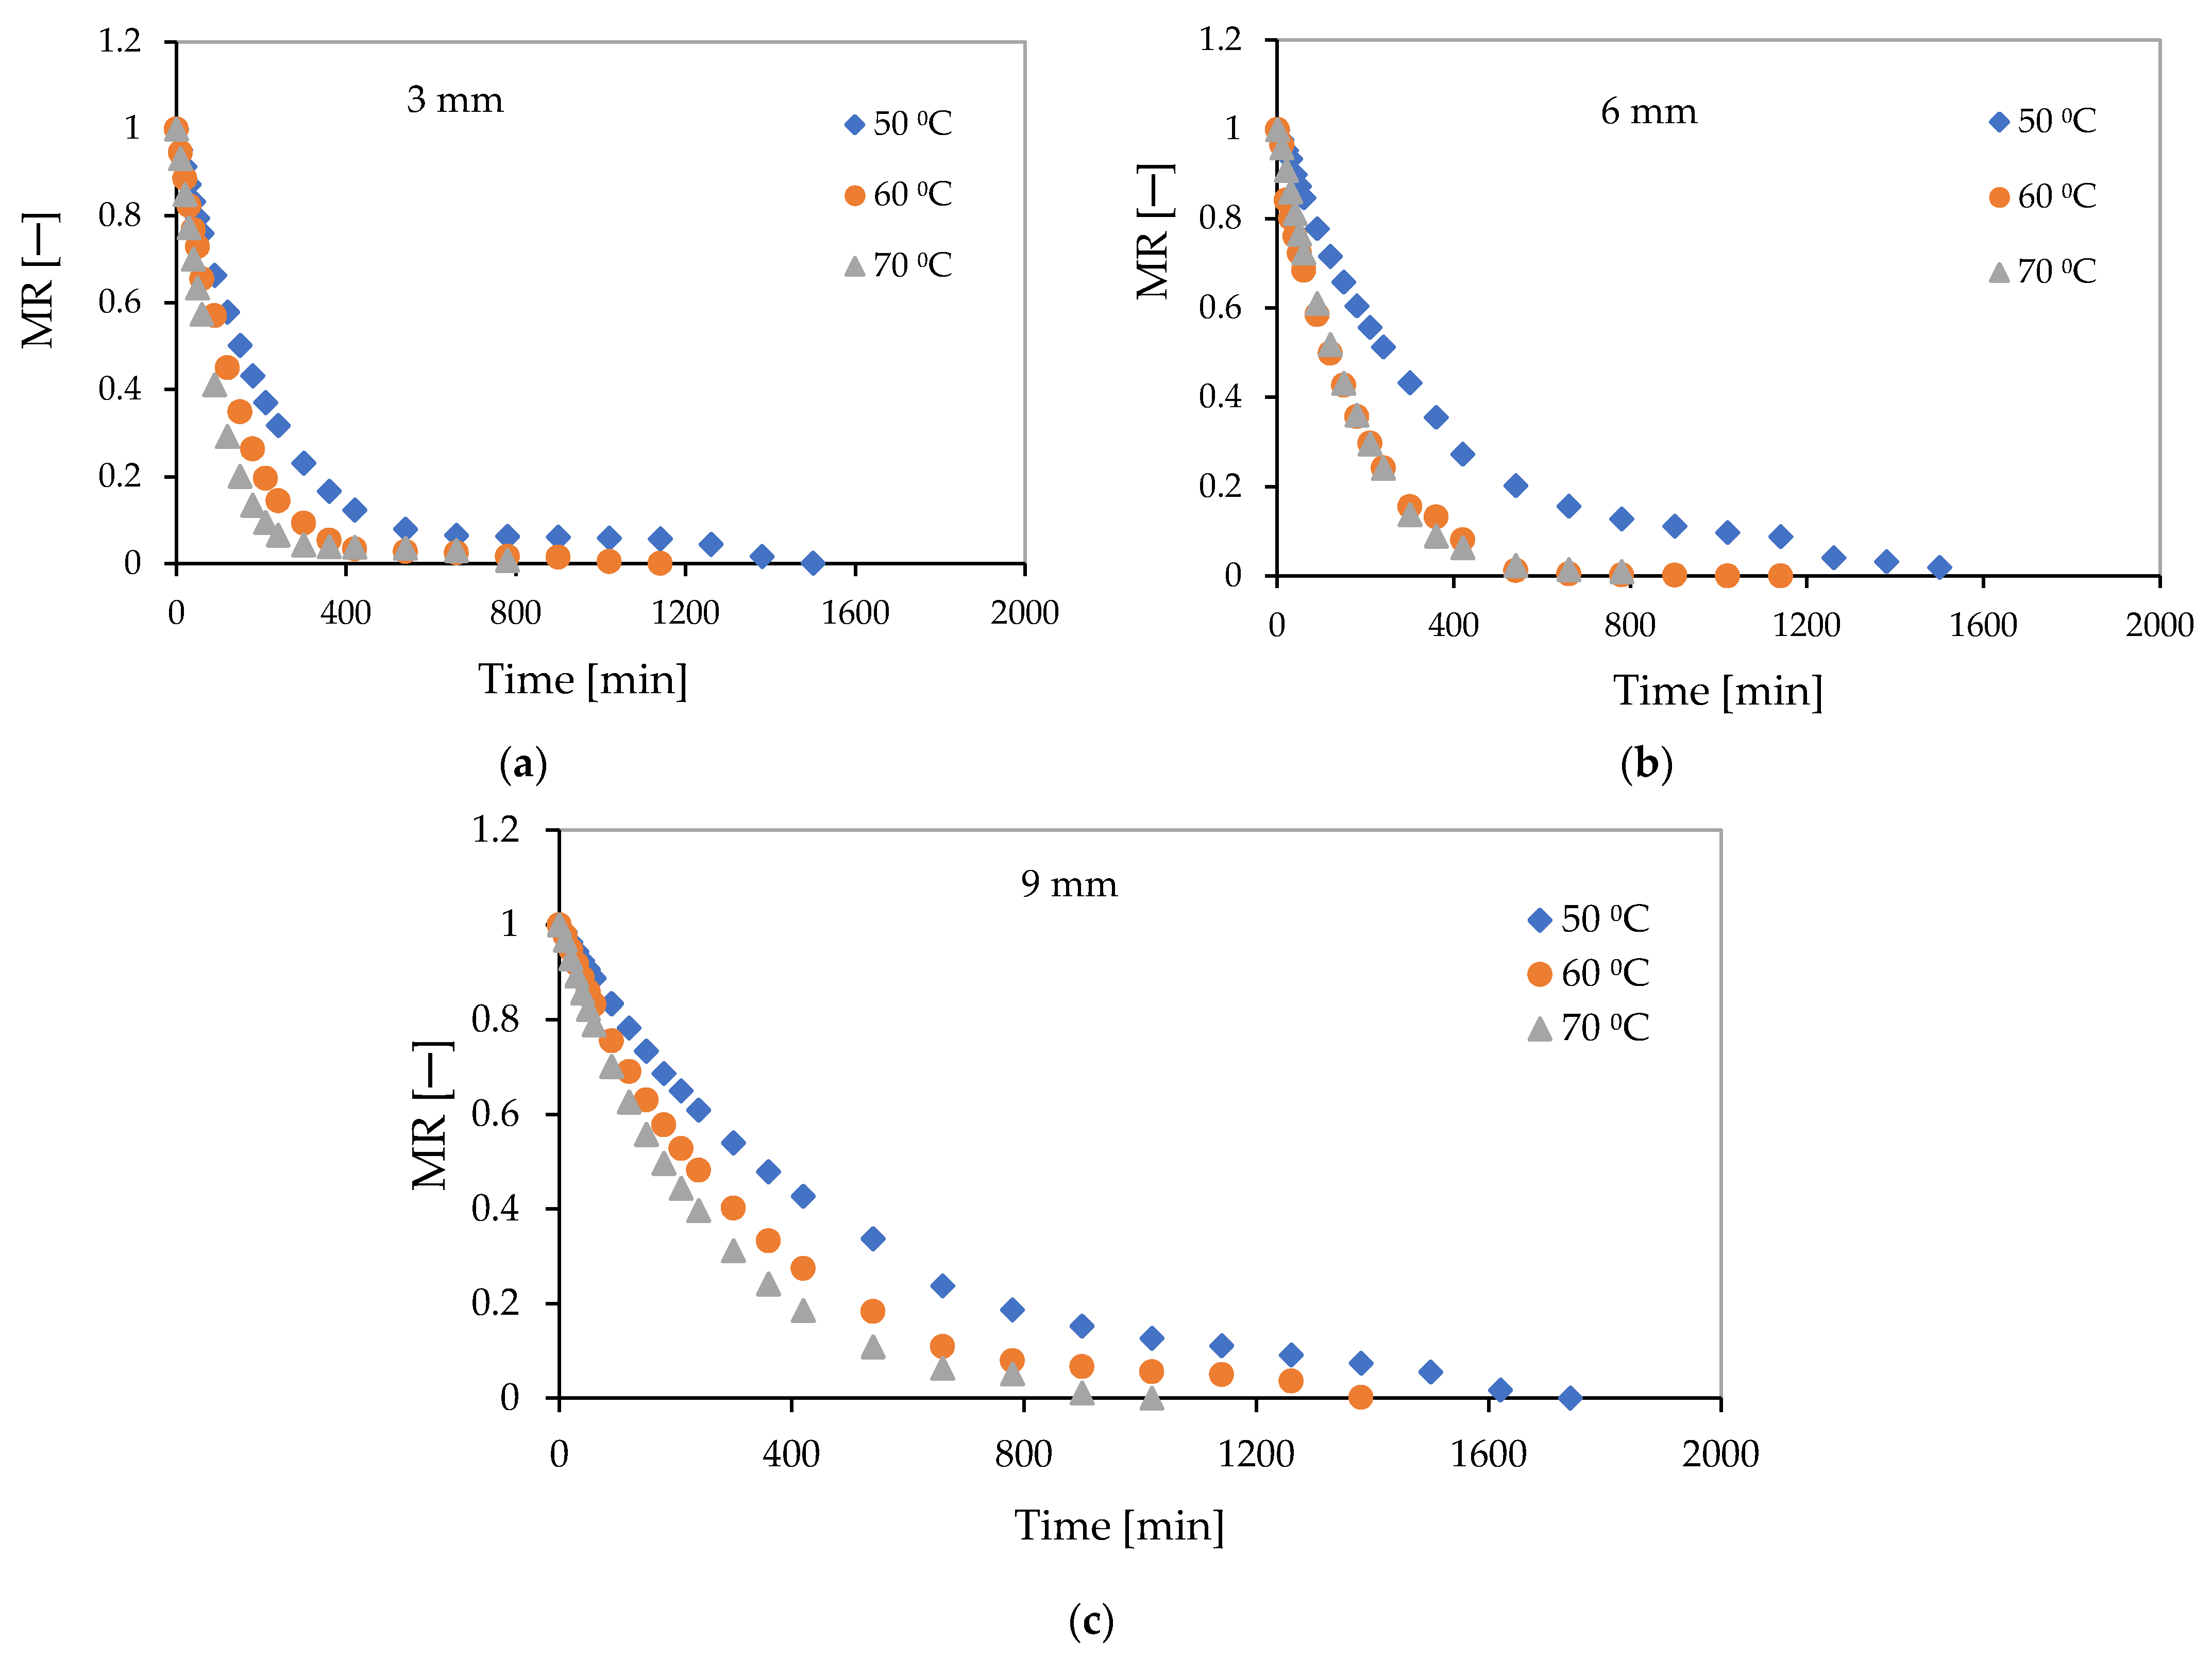
3.1. Drying Kinetic
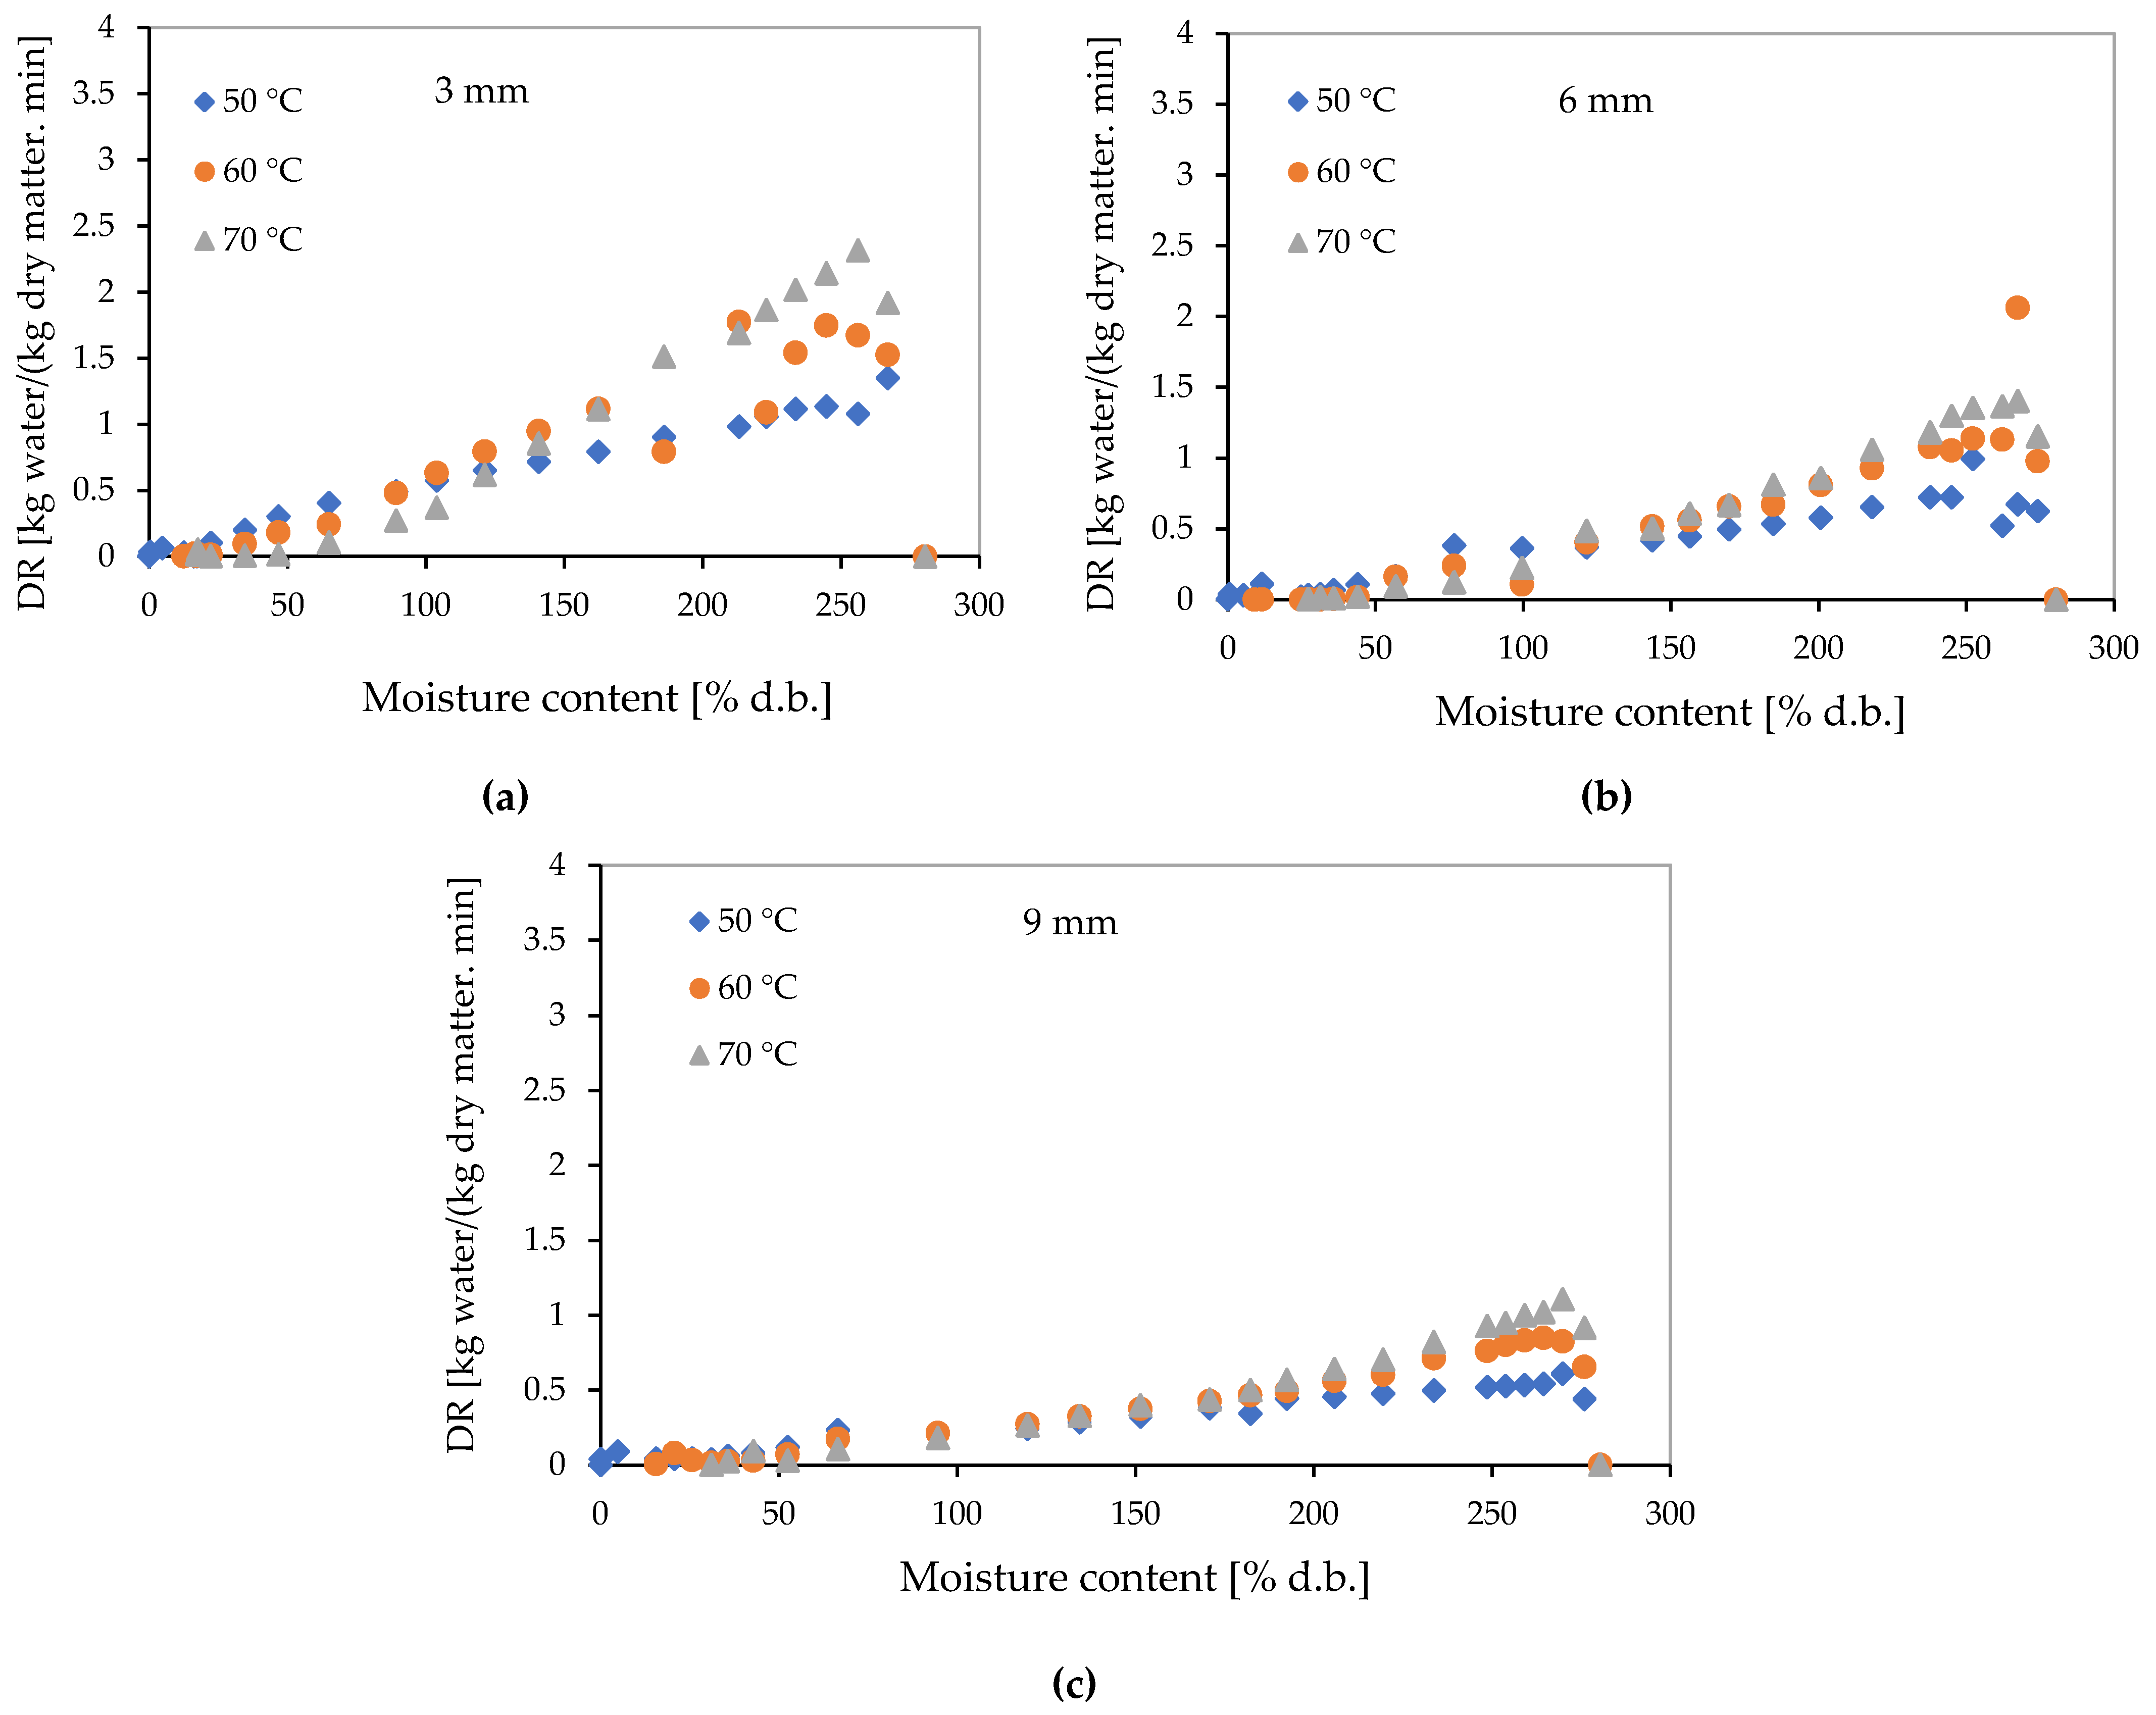
3.2. Drying Rate
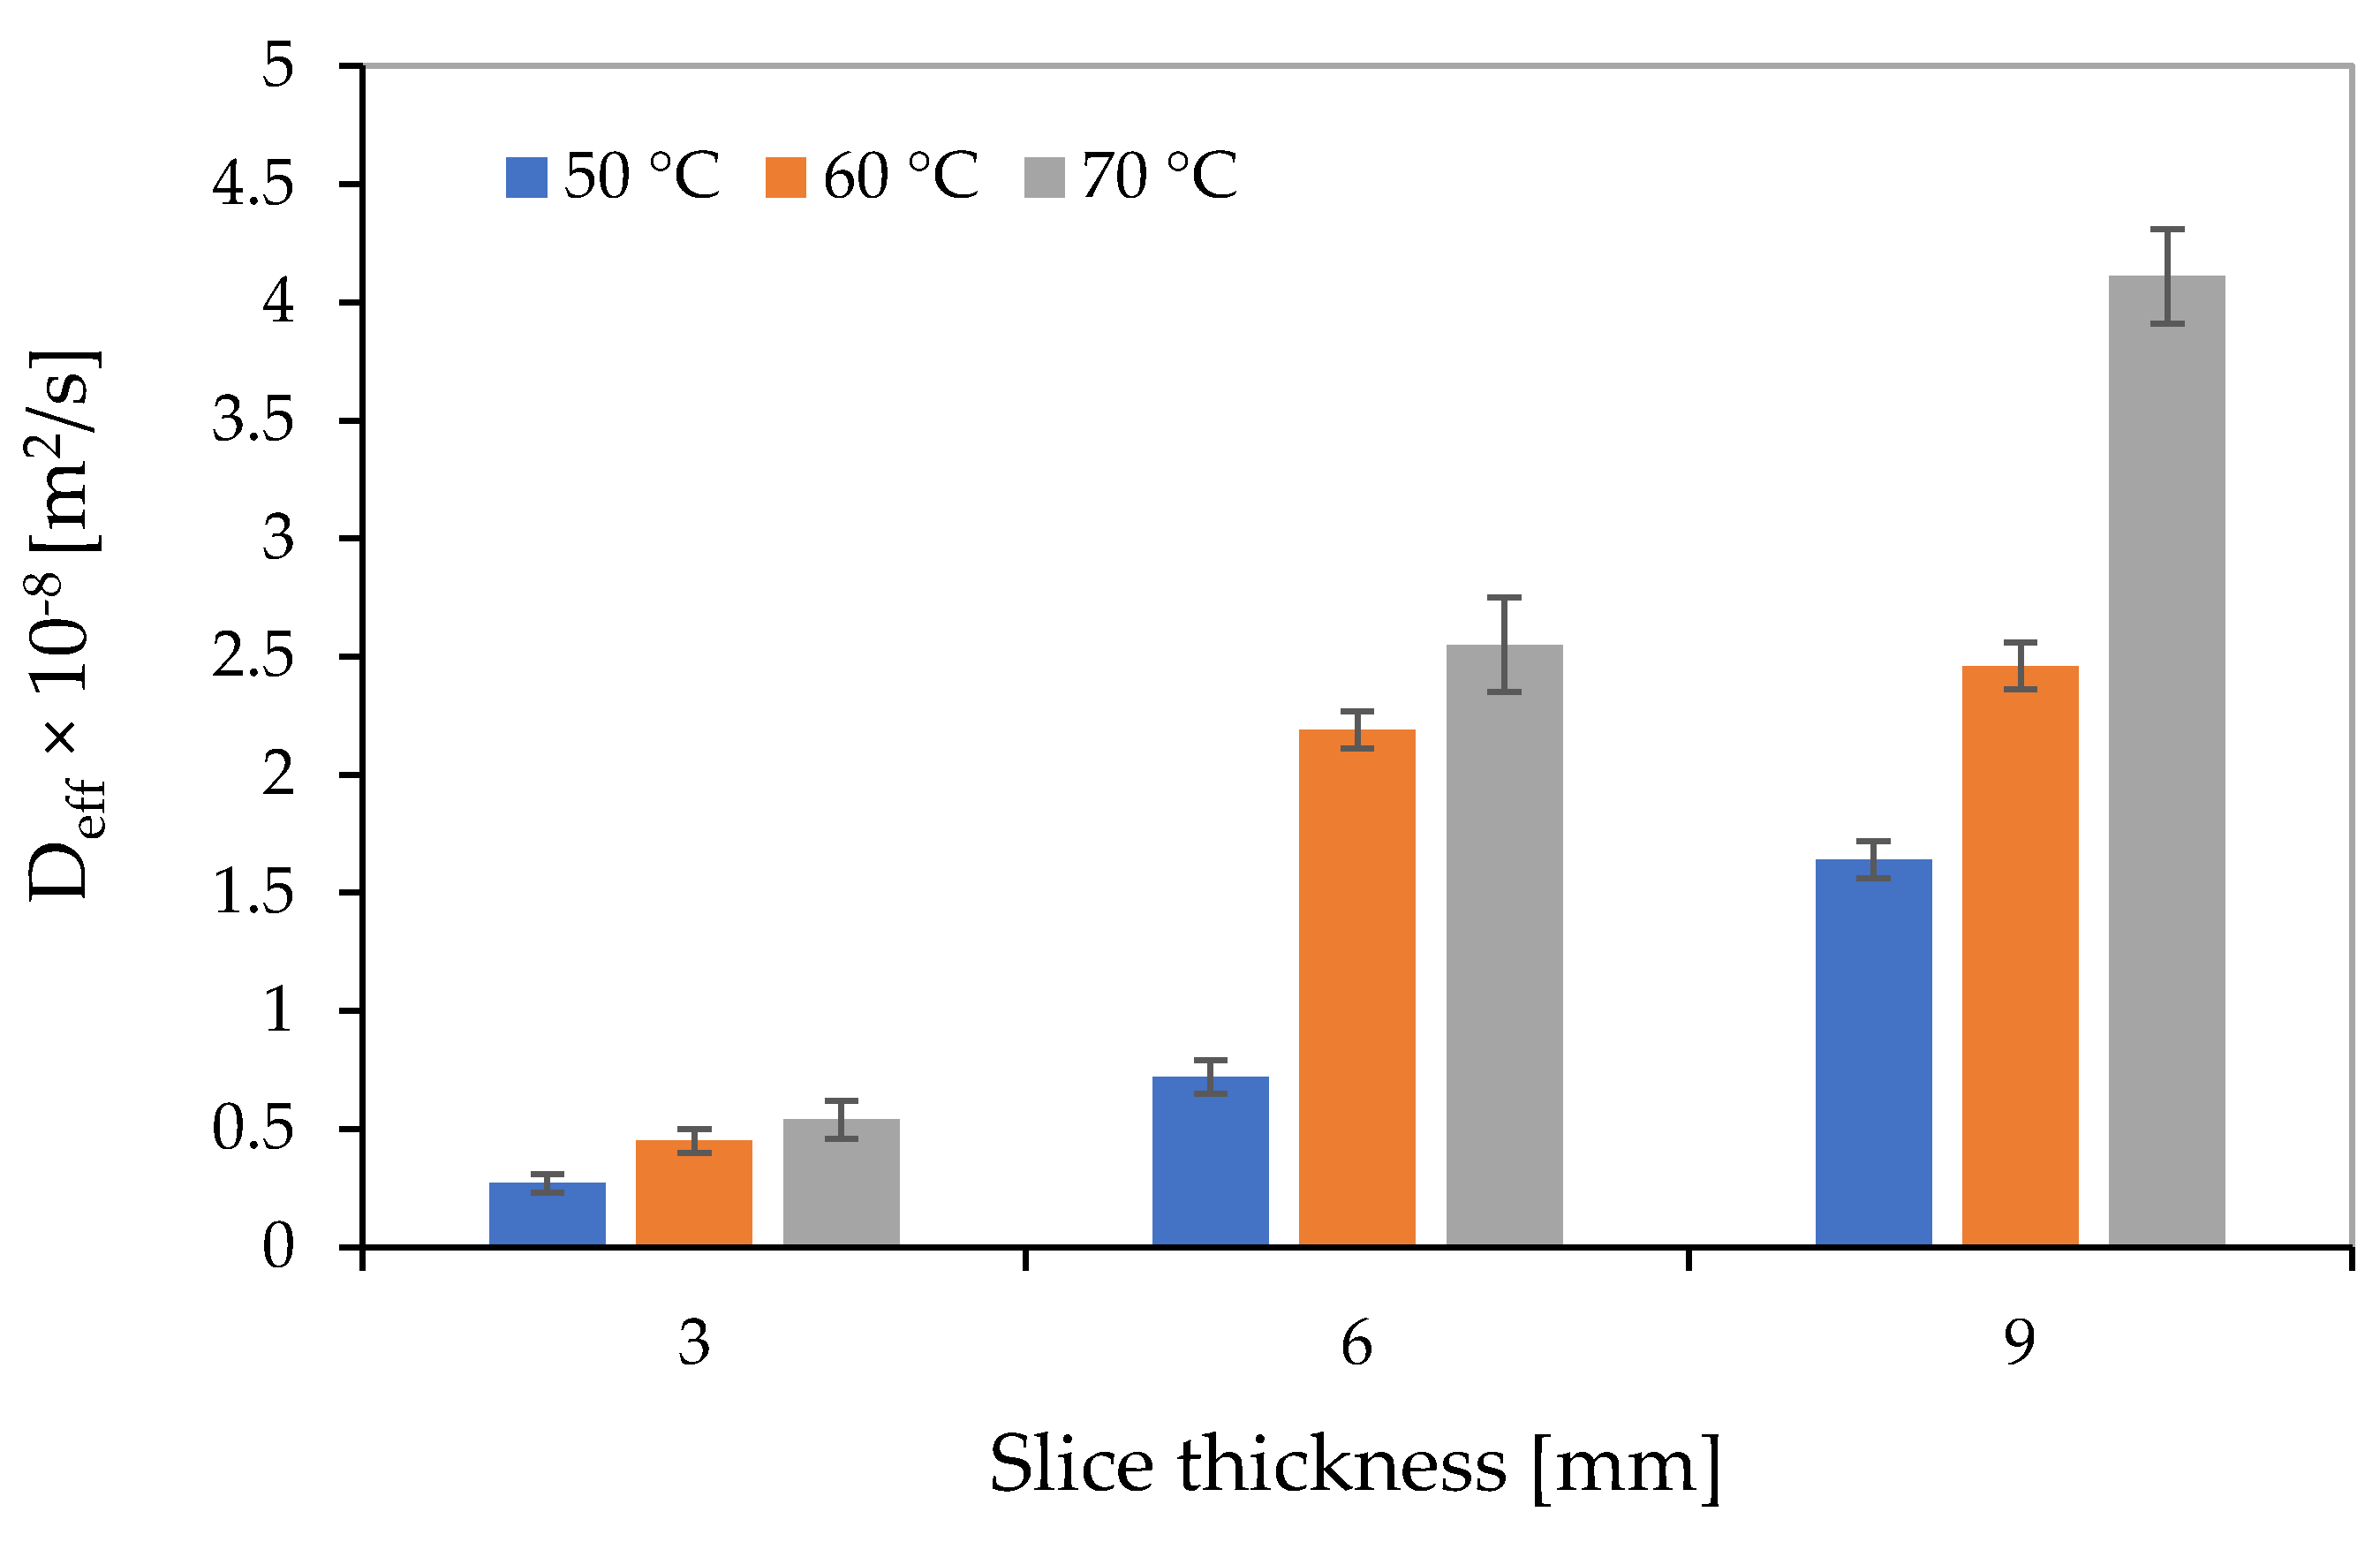
3.3. Moisture Diffusivity
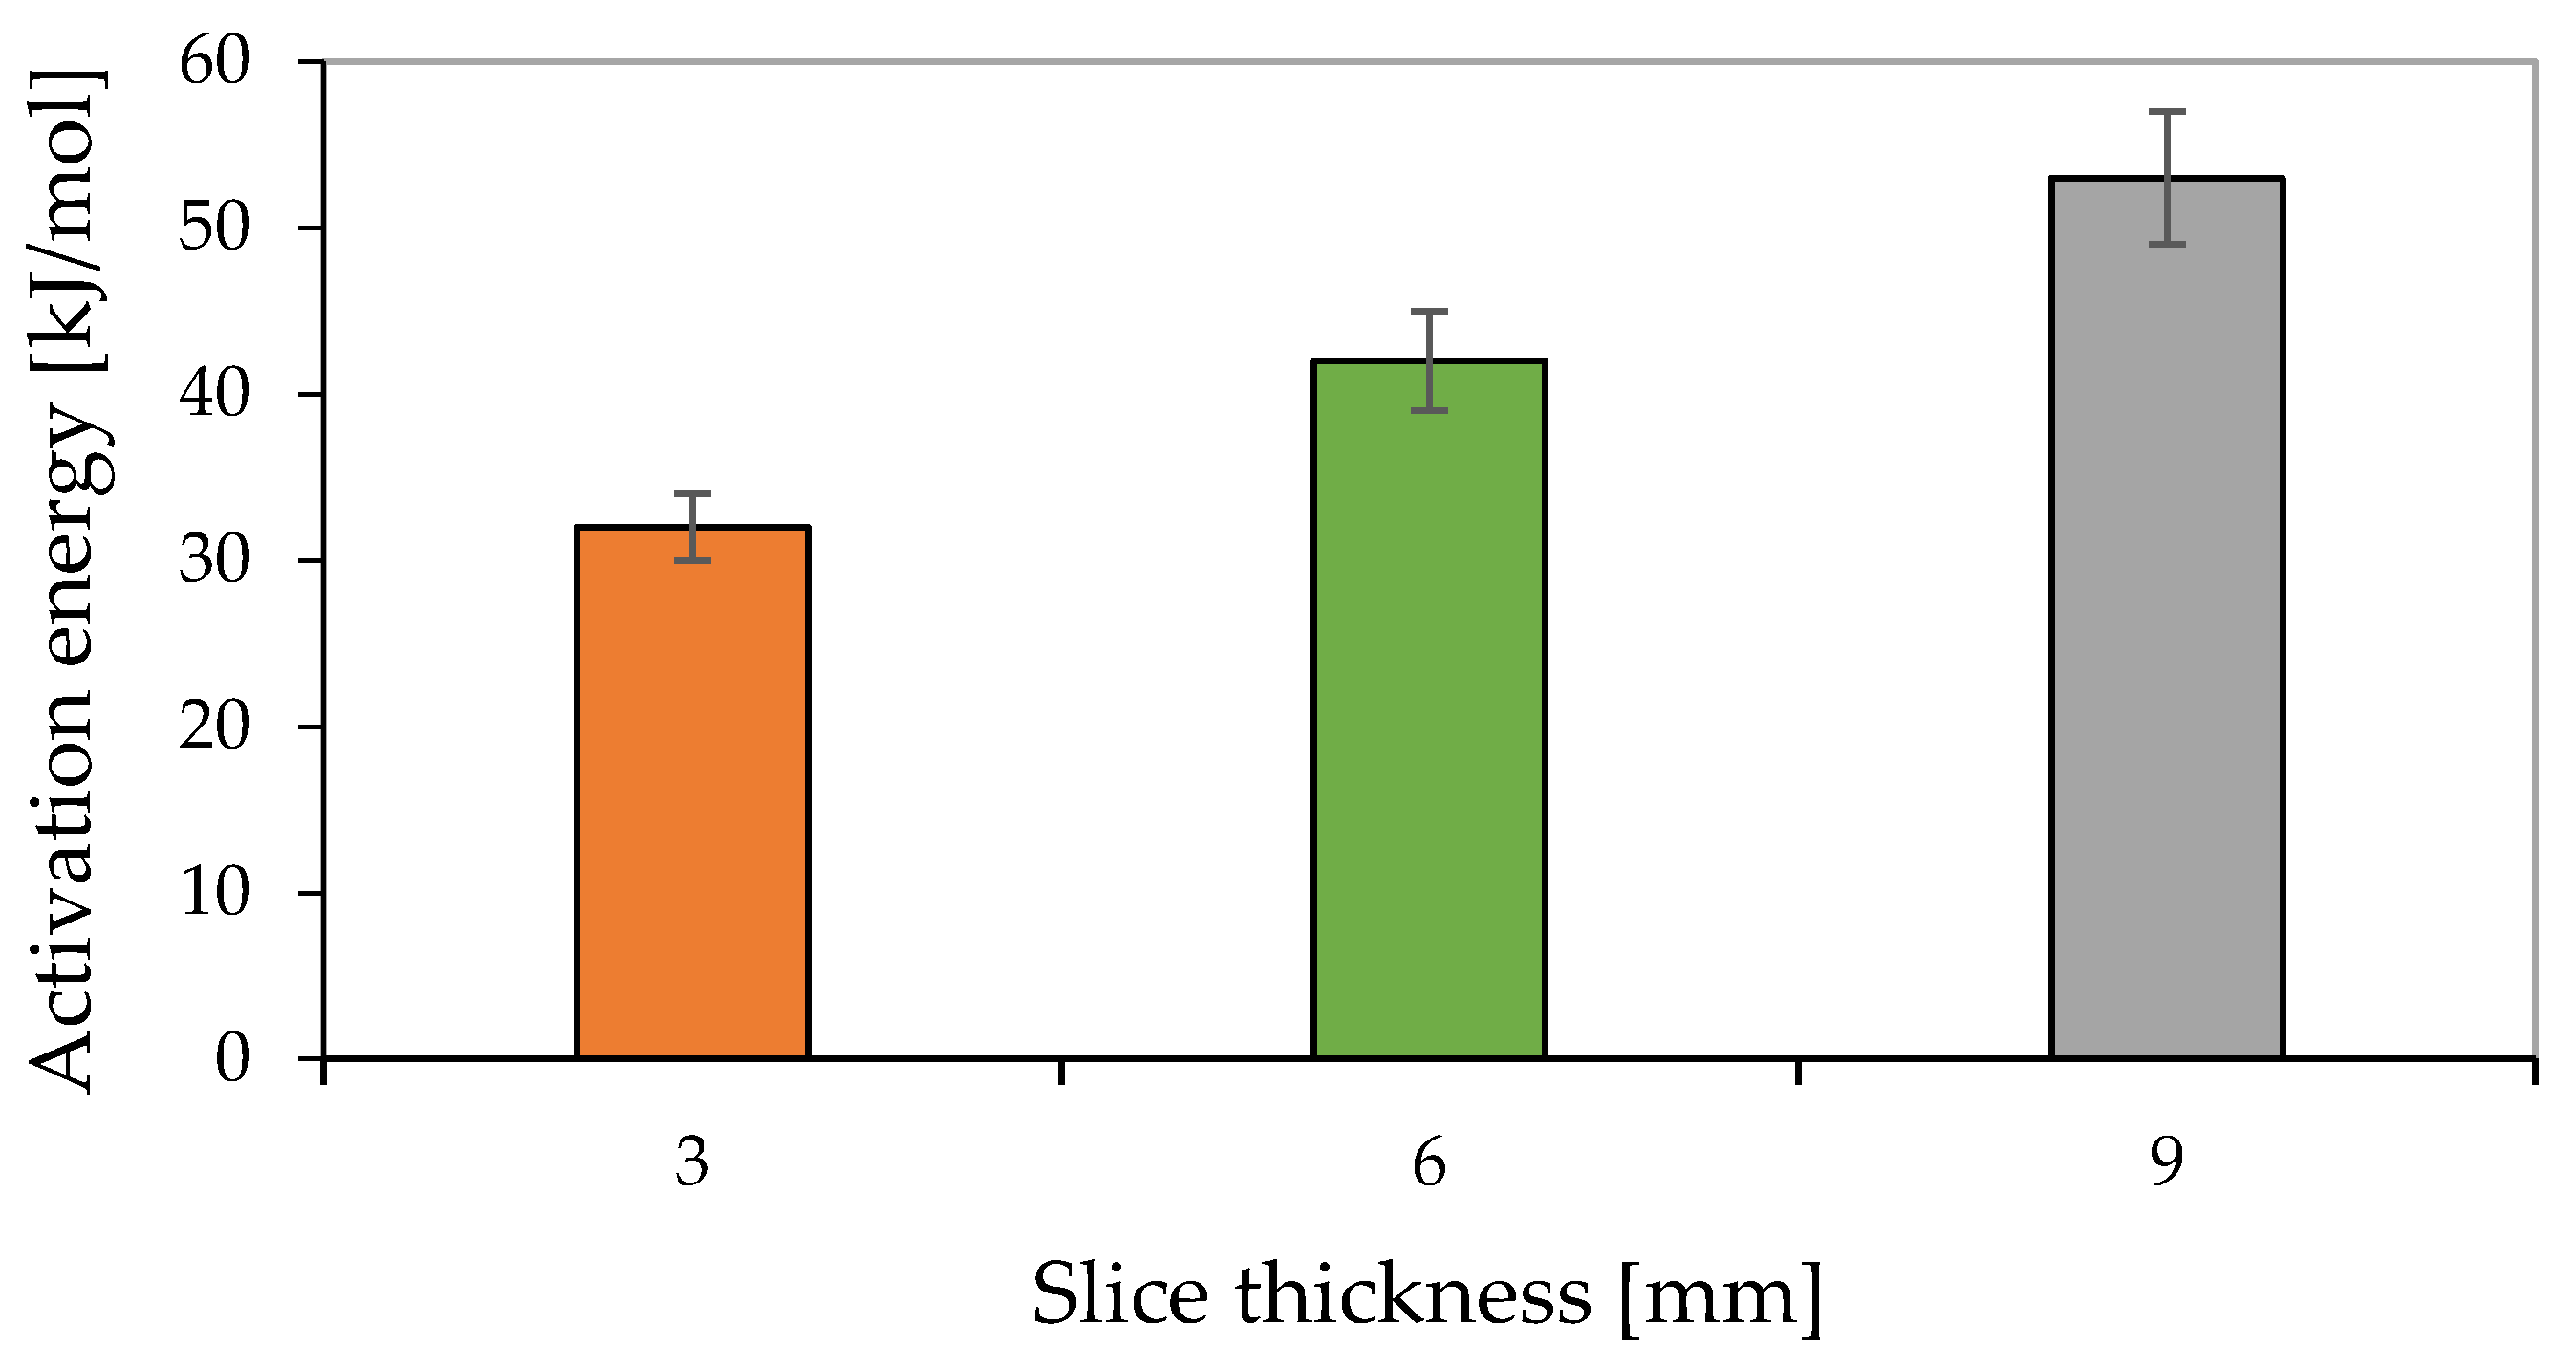
3.4. Activation Energy
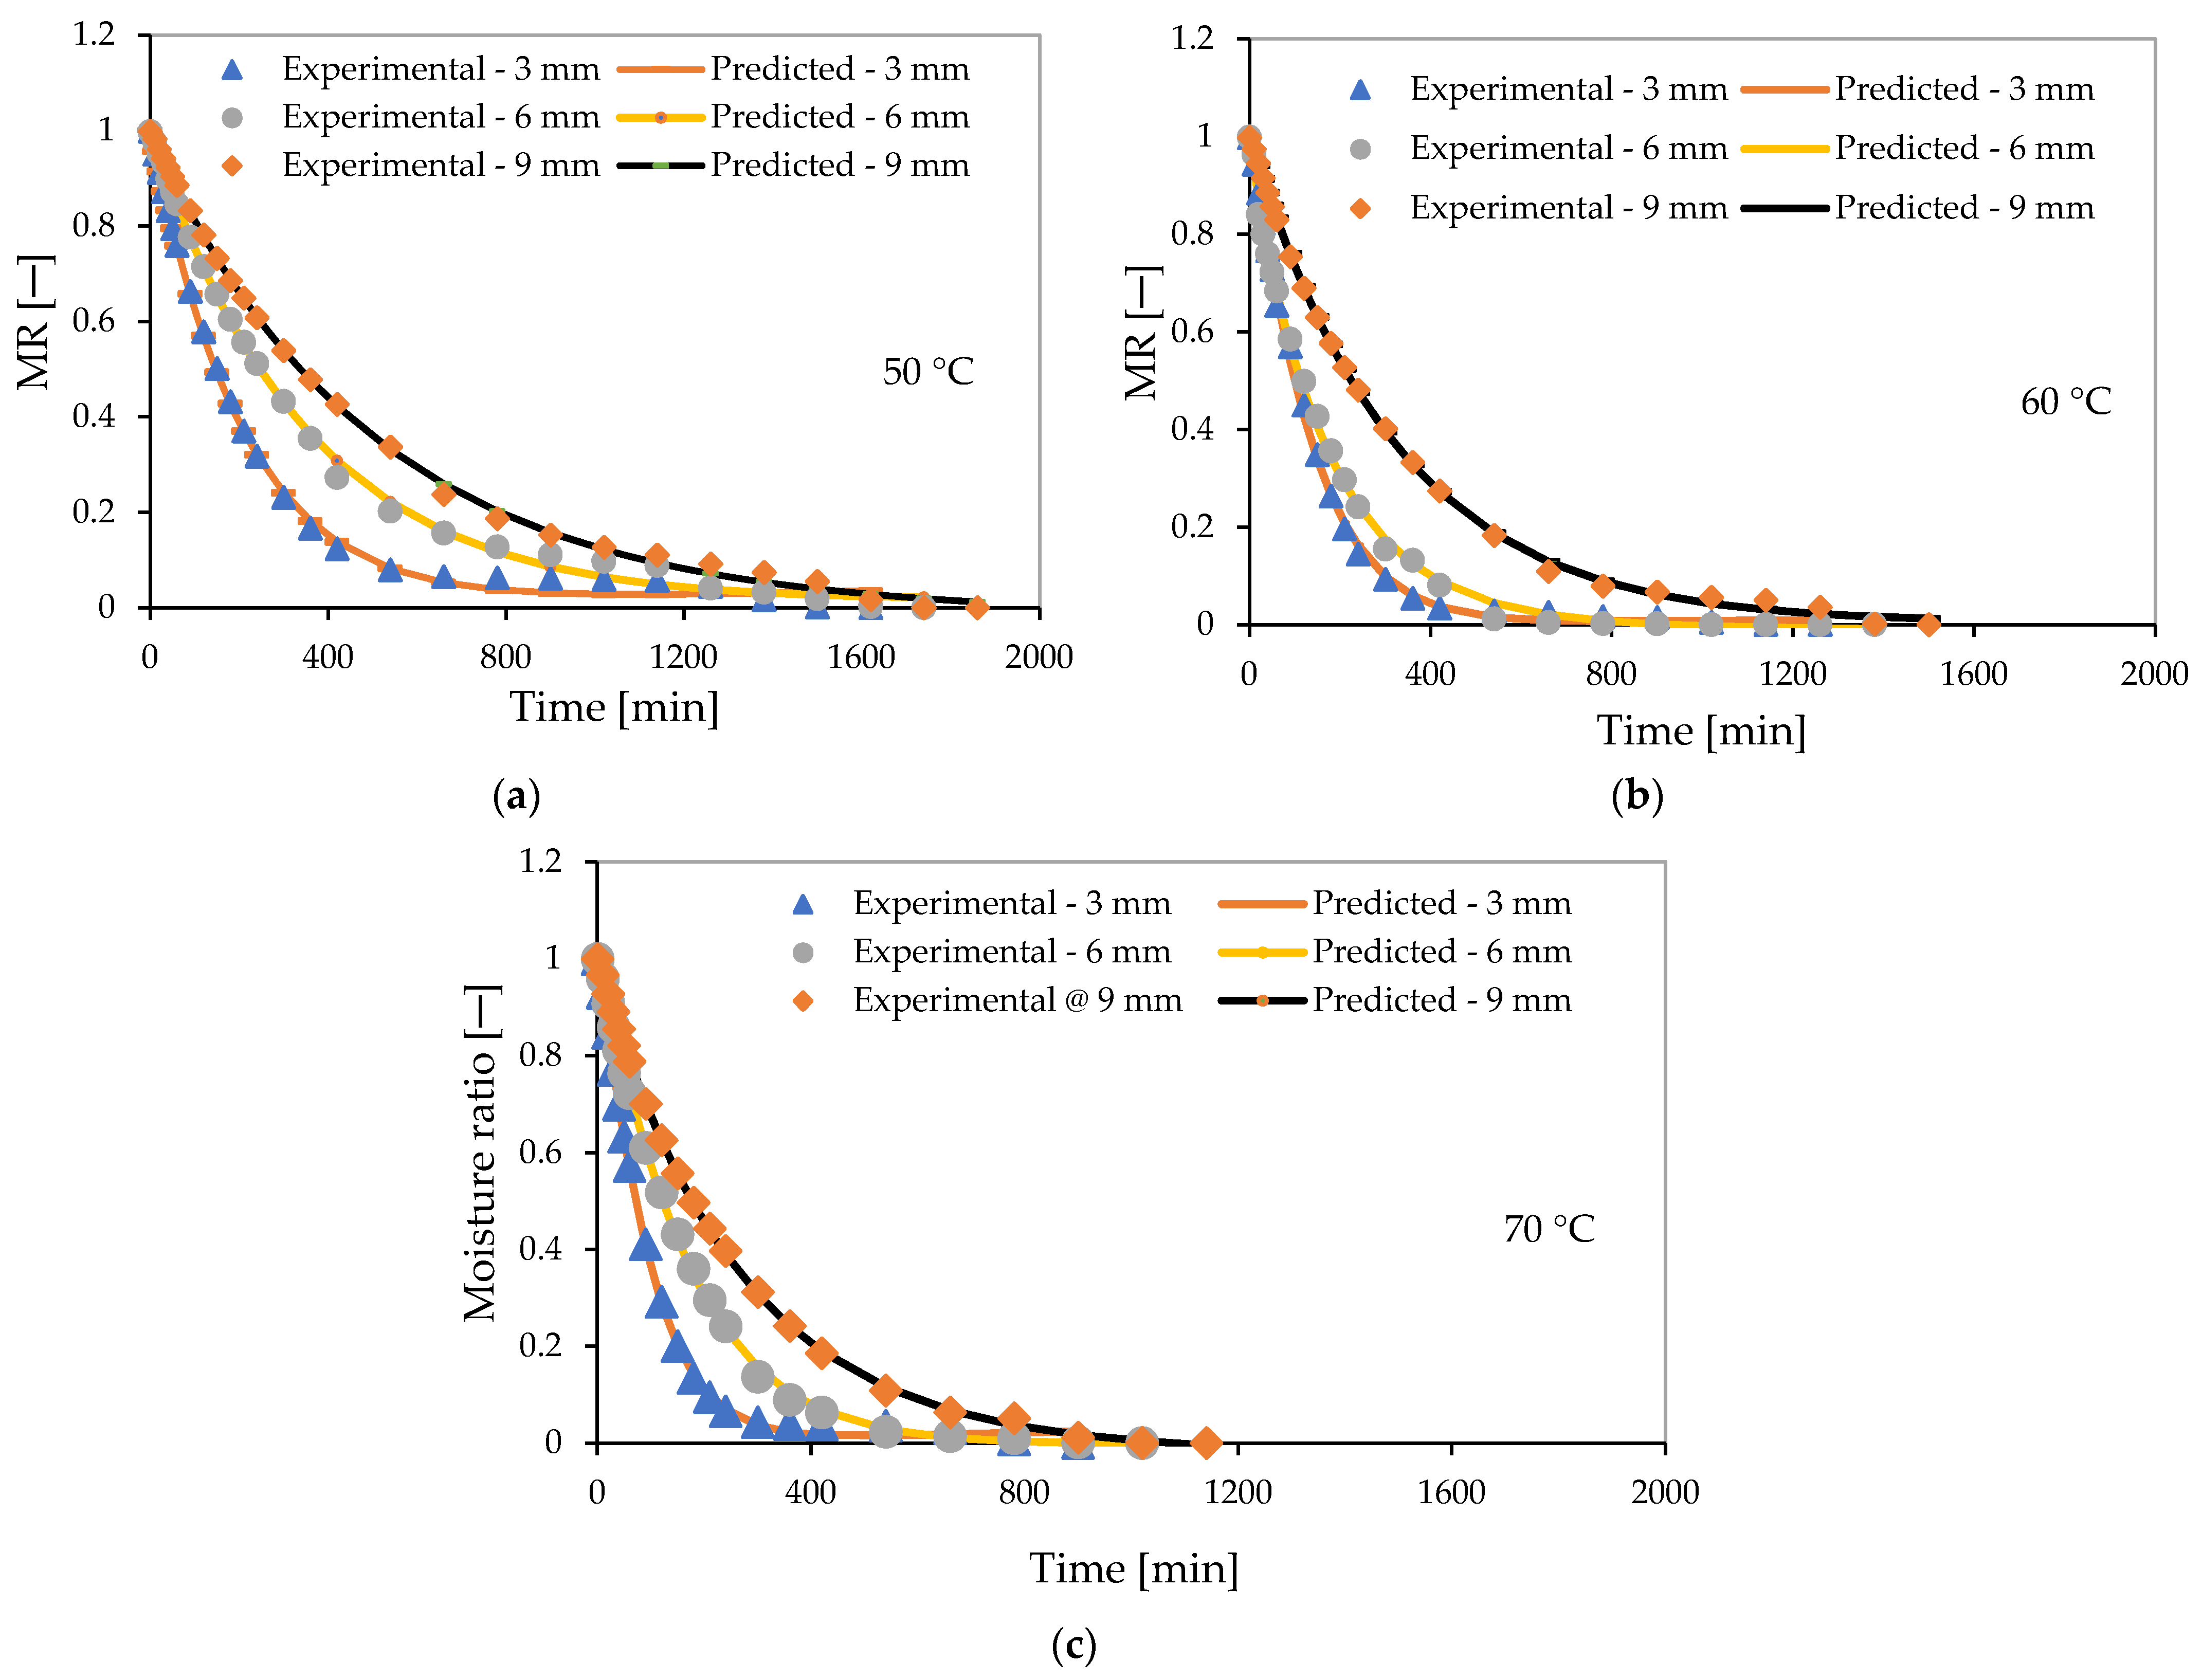
3.5. Mathematical Modelling of Drying Kinetic
3.6. Uncertainty Analyses
3.7. Energy Evaluation
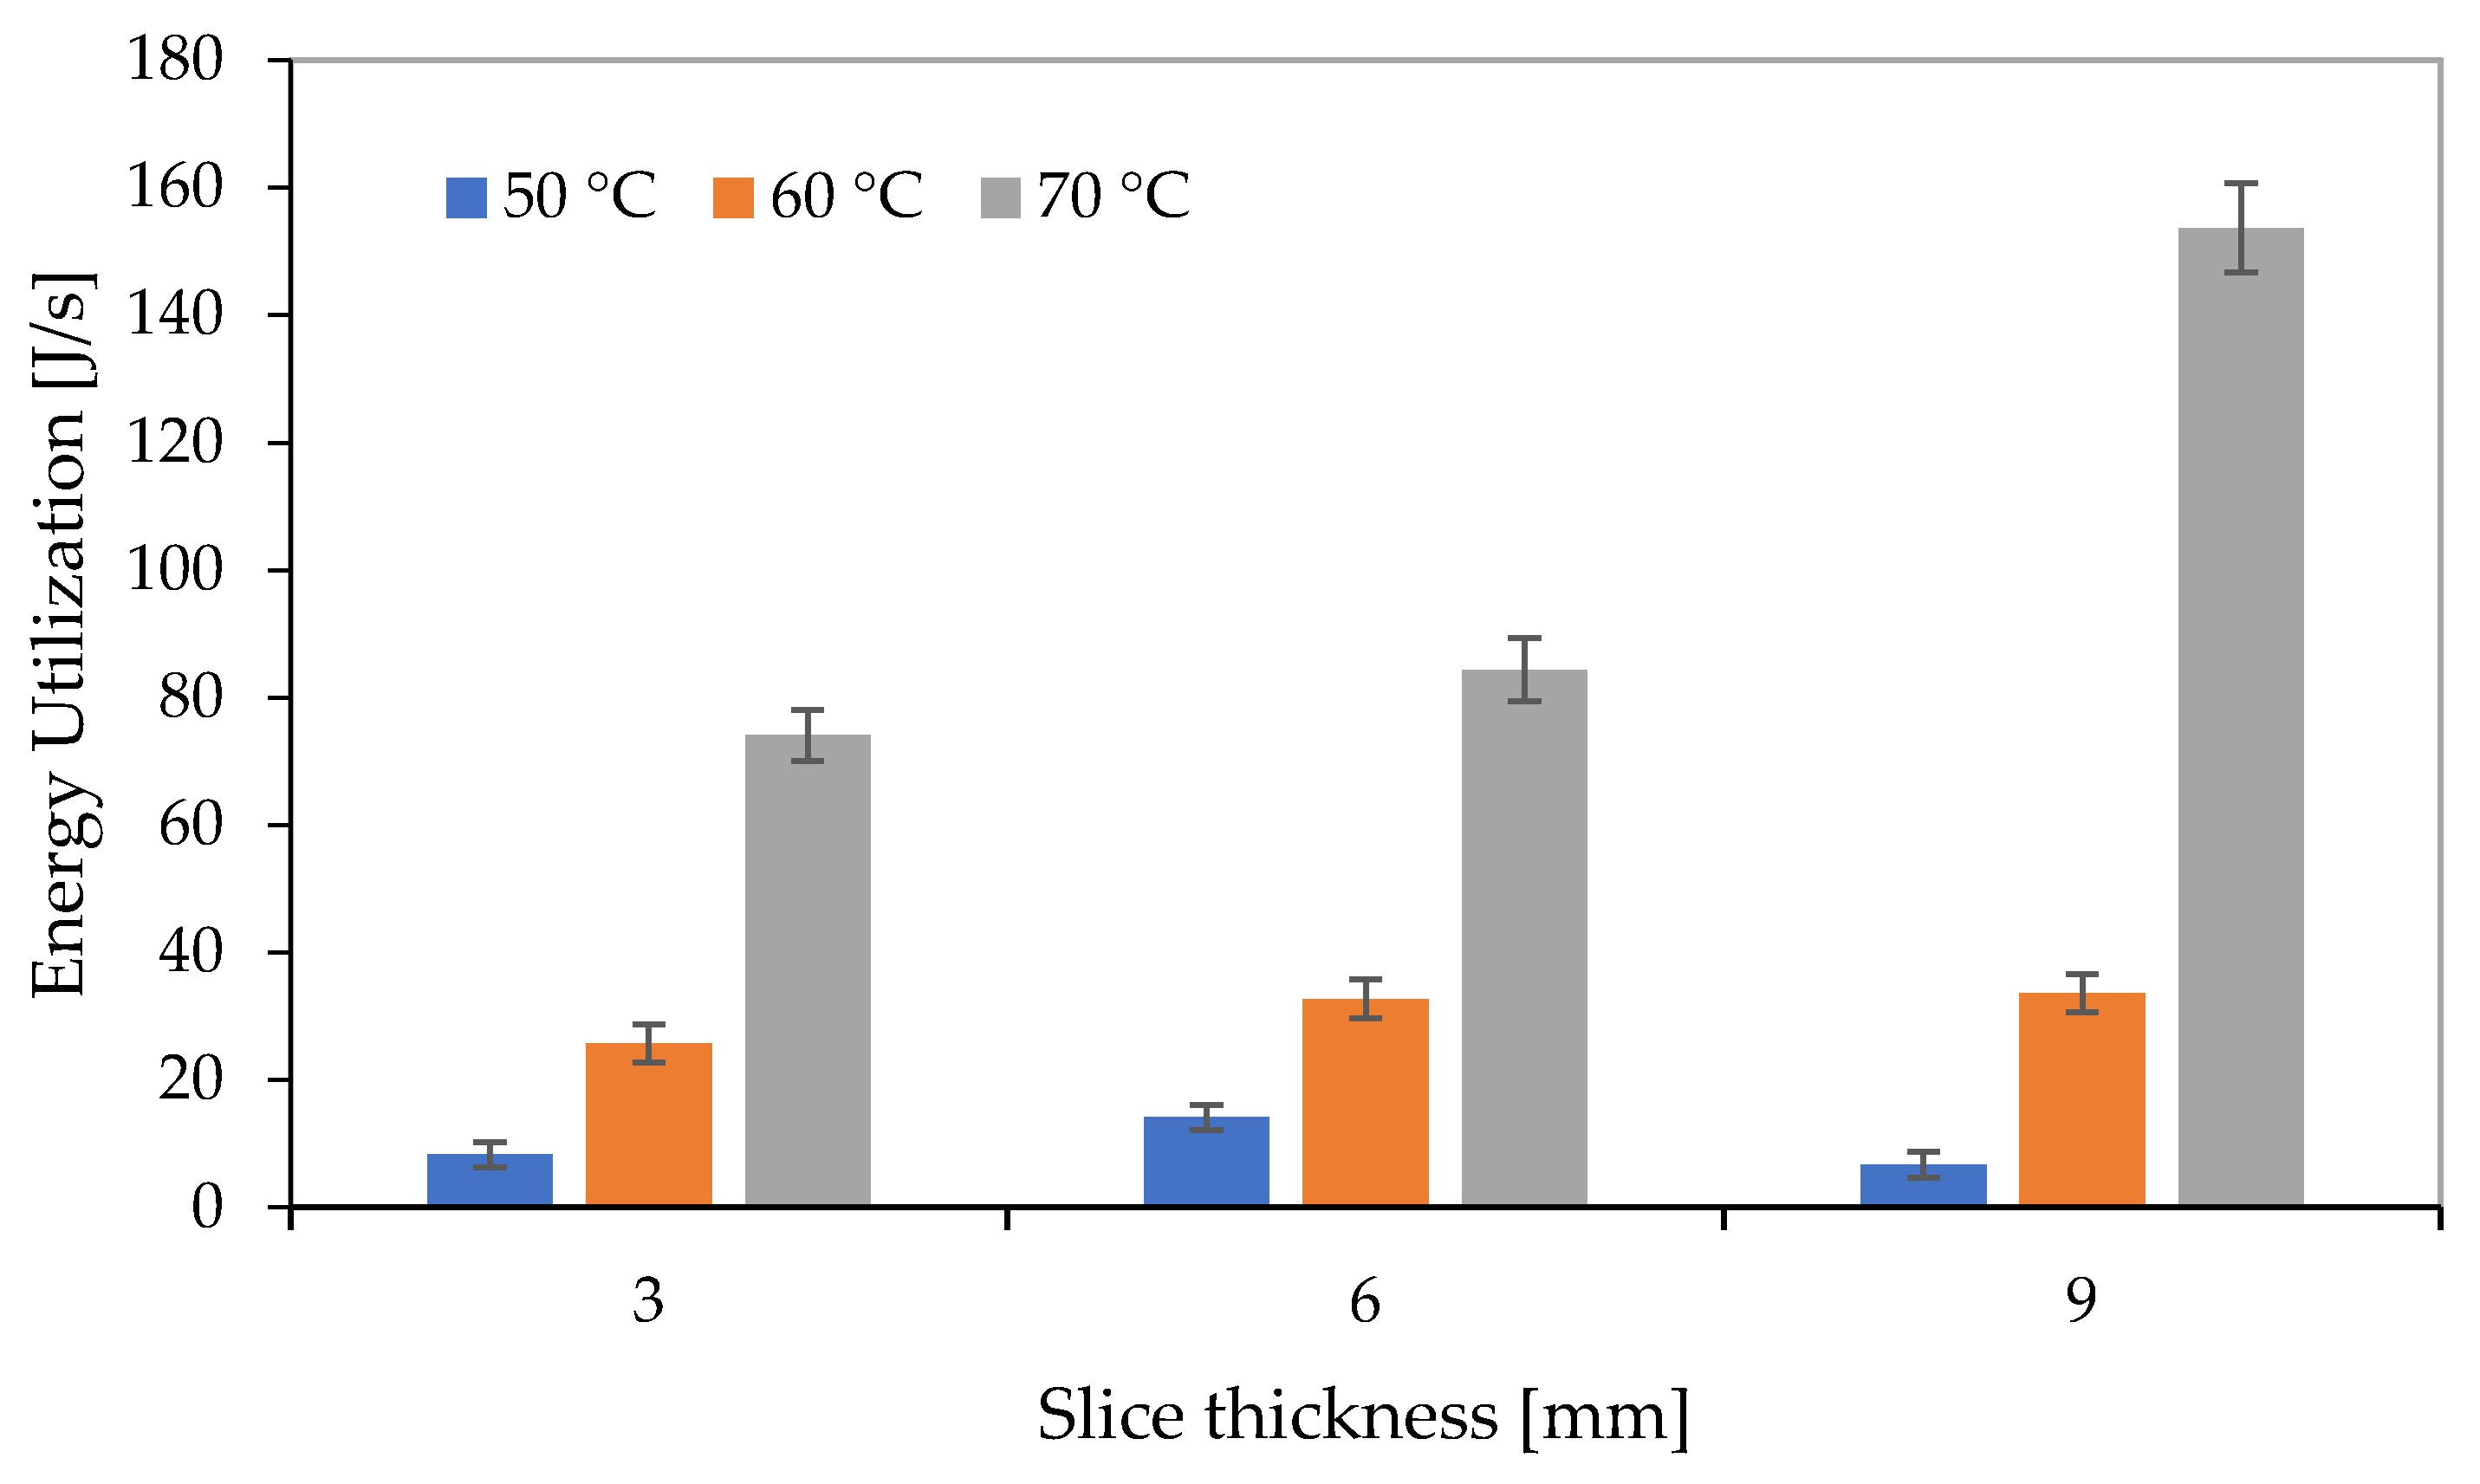
3.7.1. Energy Utilization
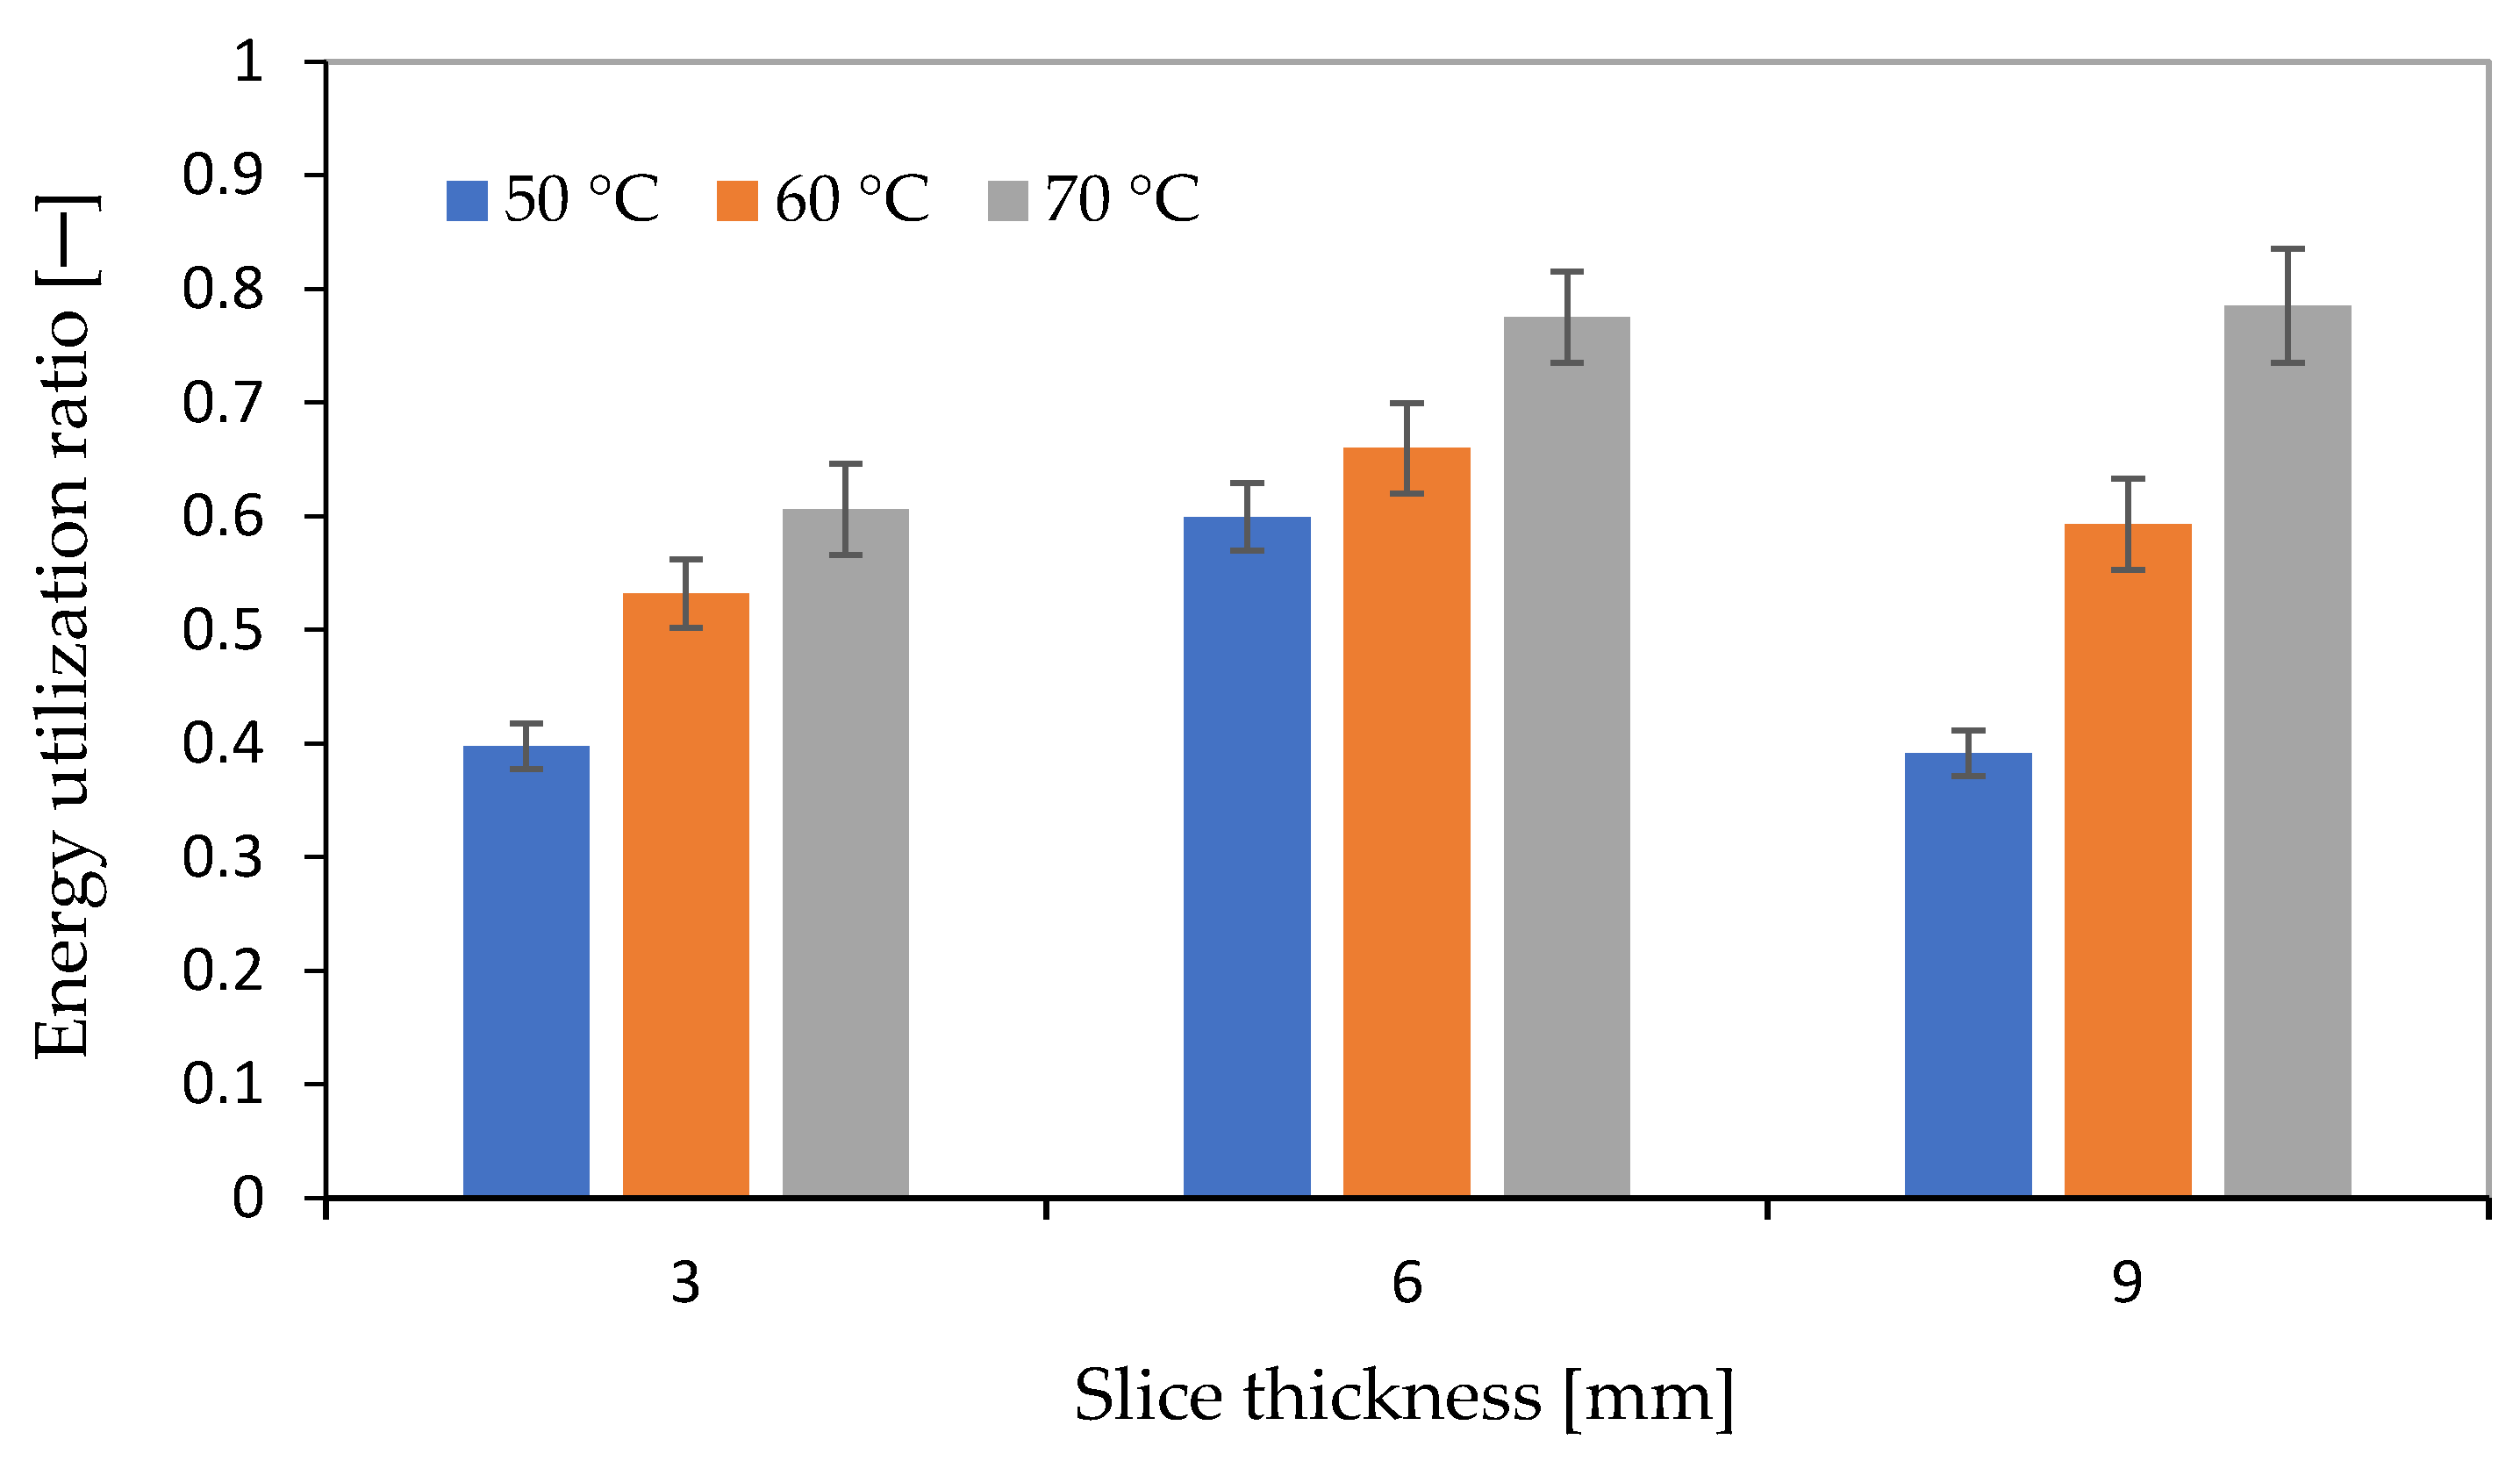
3.7.2. Energy Utilization Ratio
3.8. Energy Evaluation
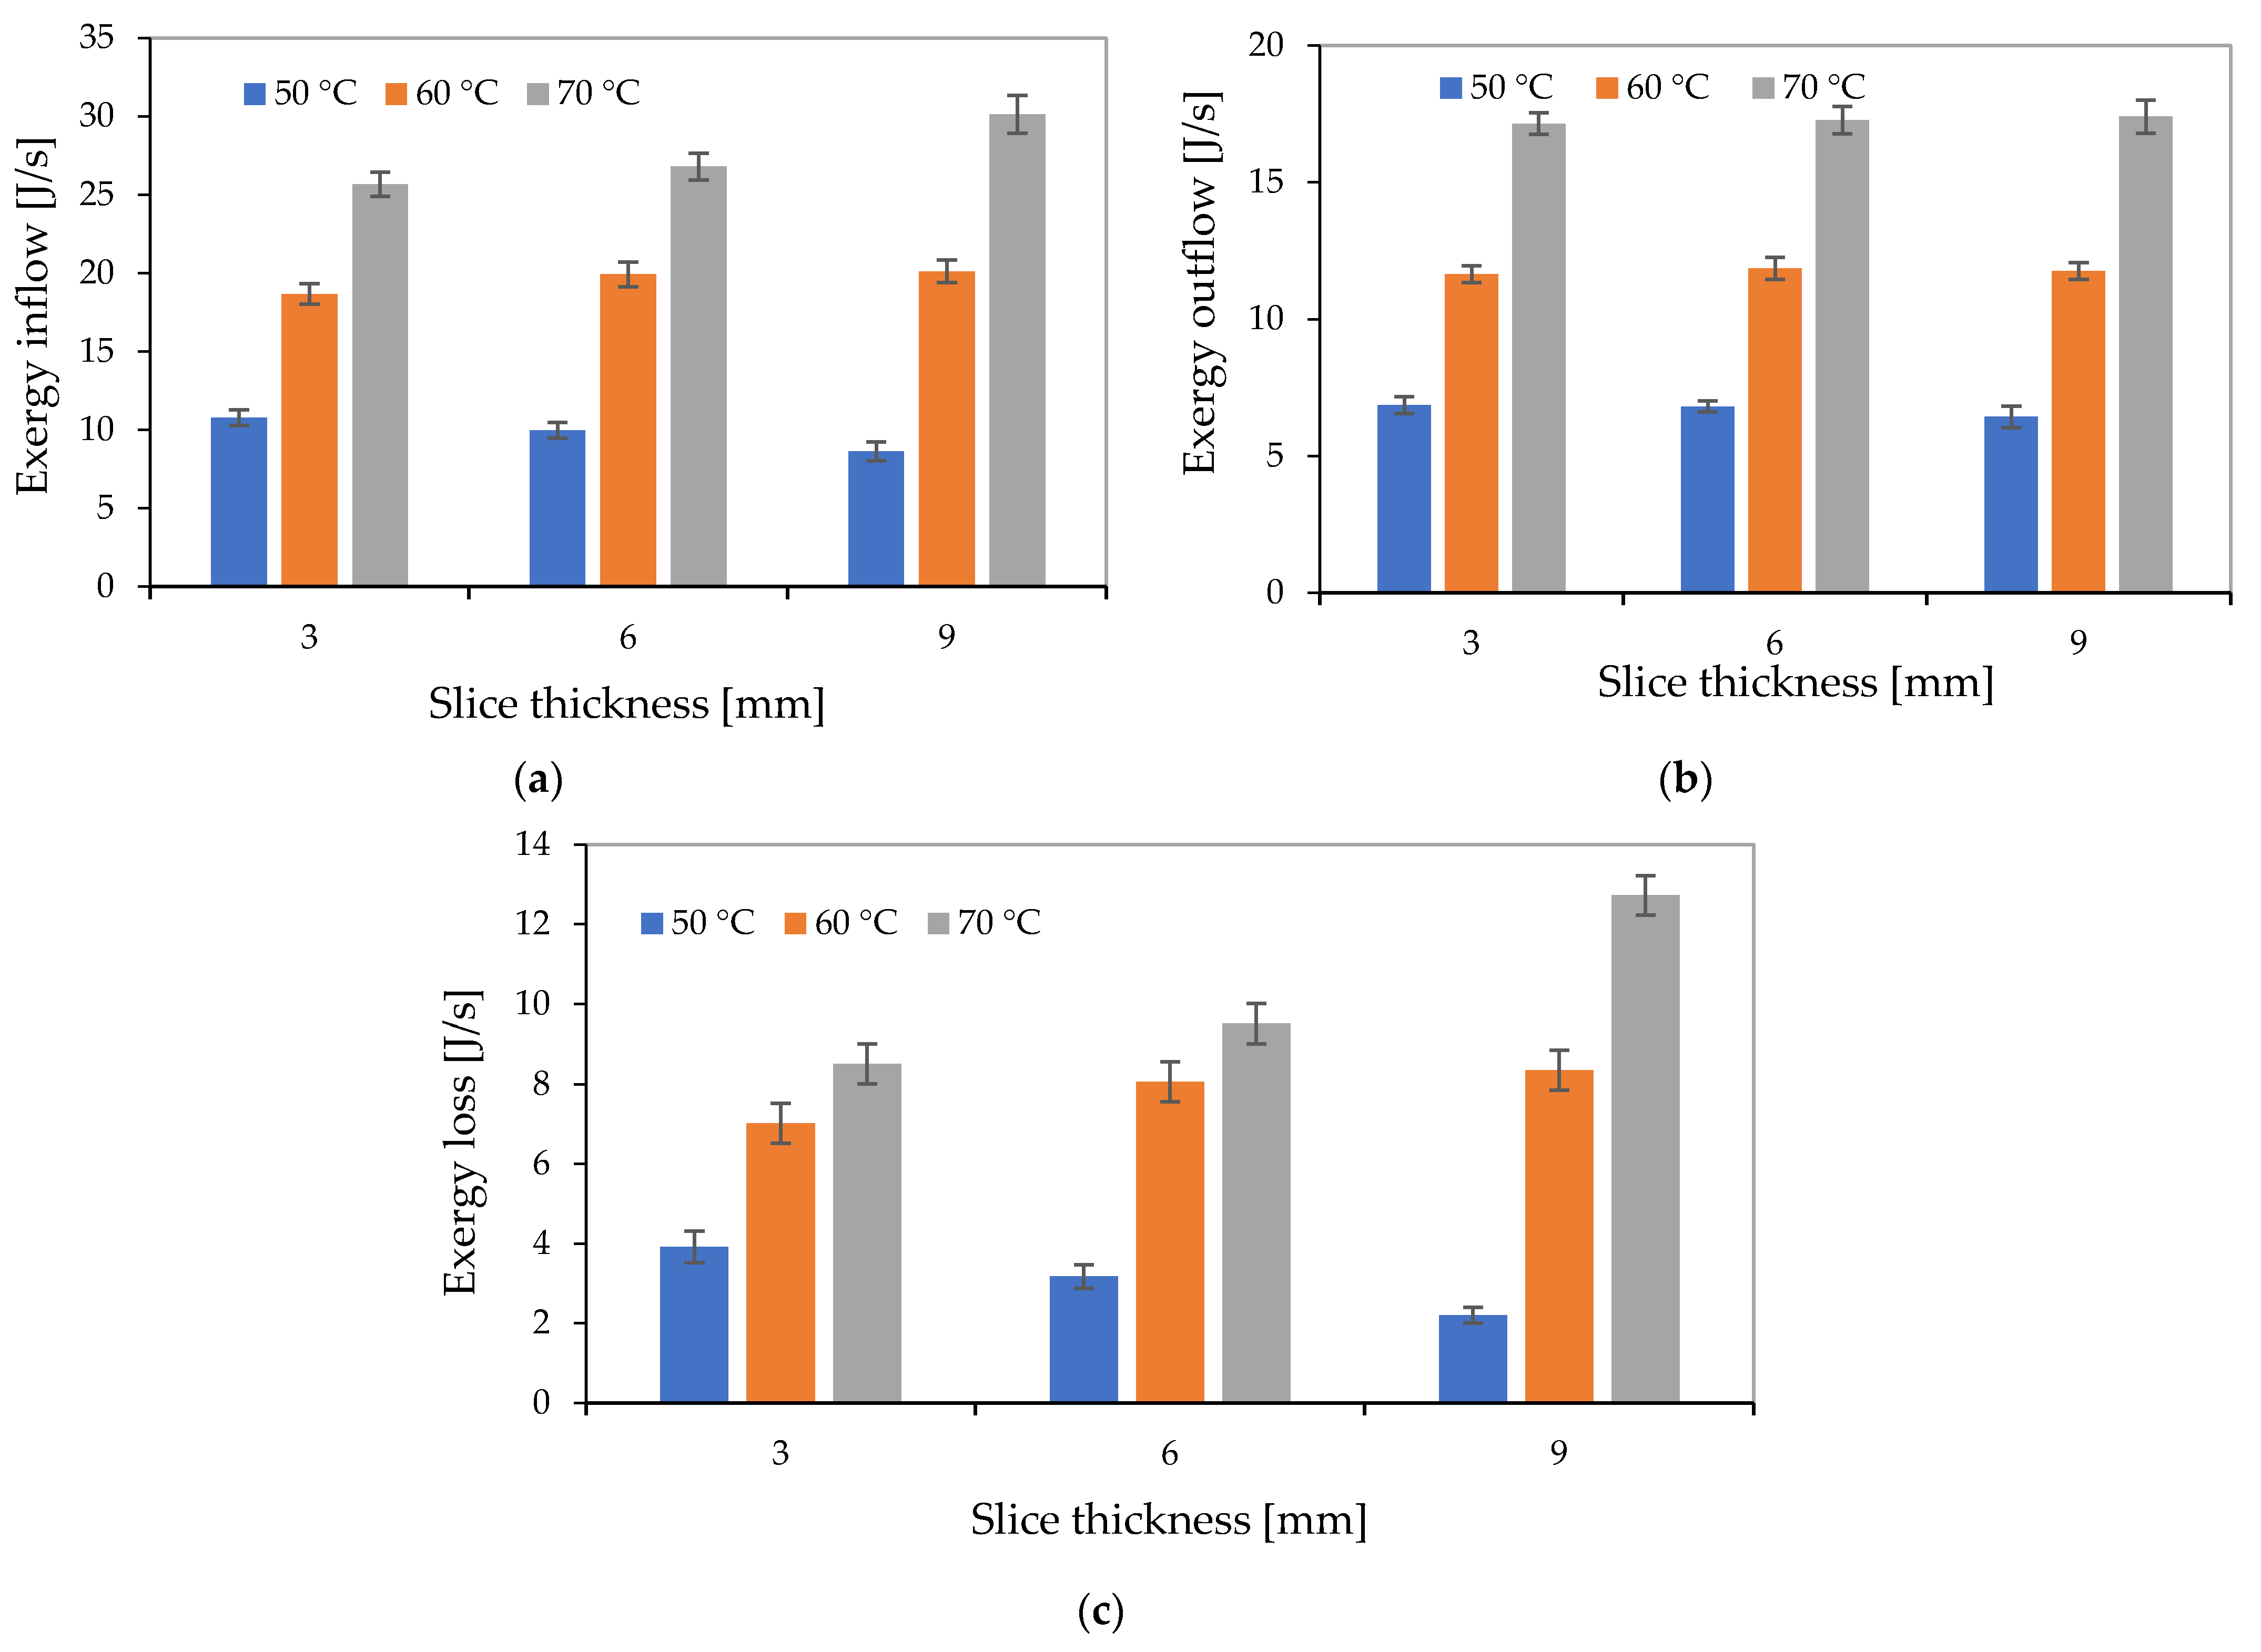
3.8.1. Exergy Inflow, Exergy Outflow and Exergy Loss
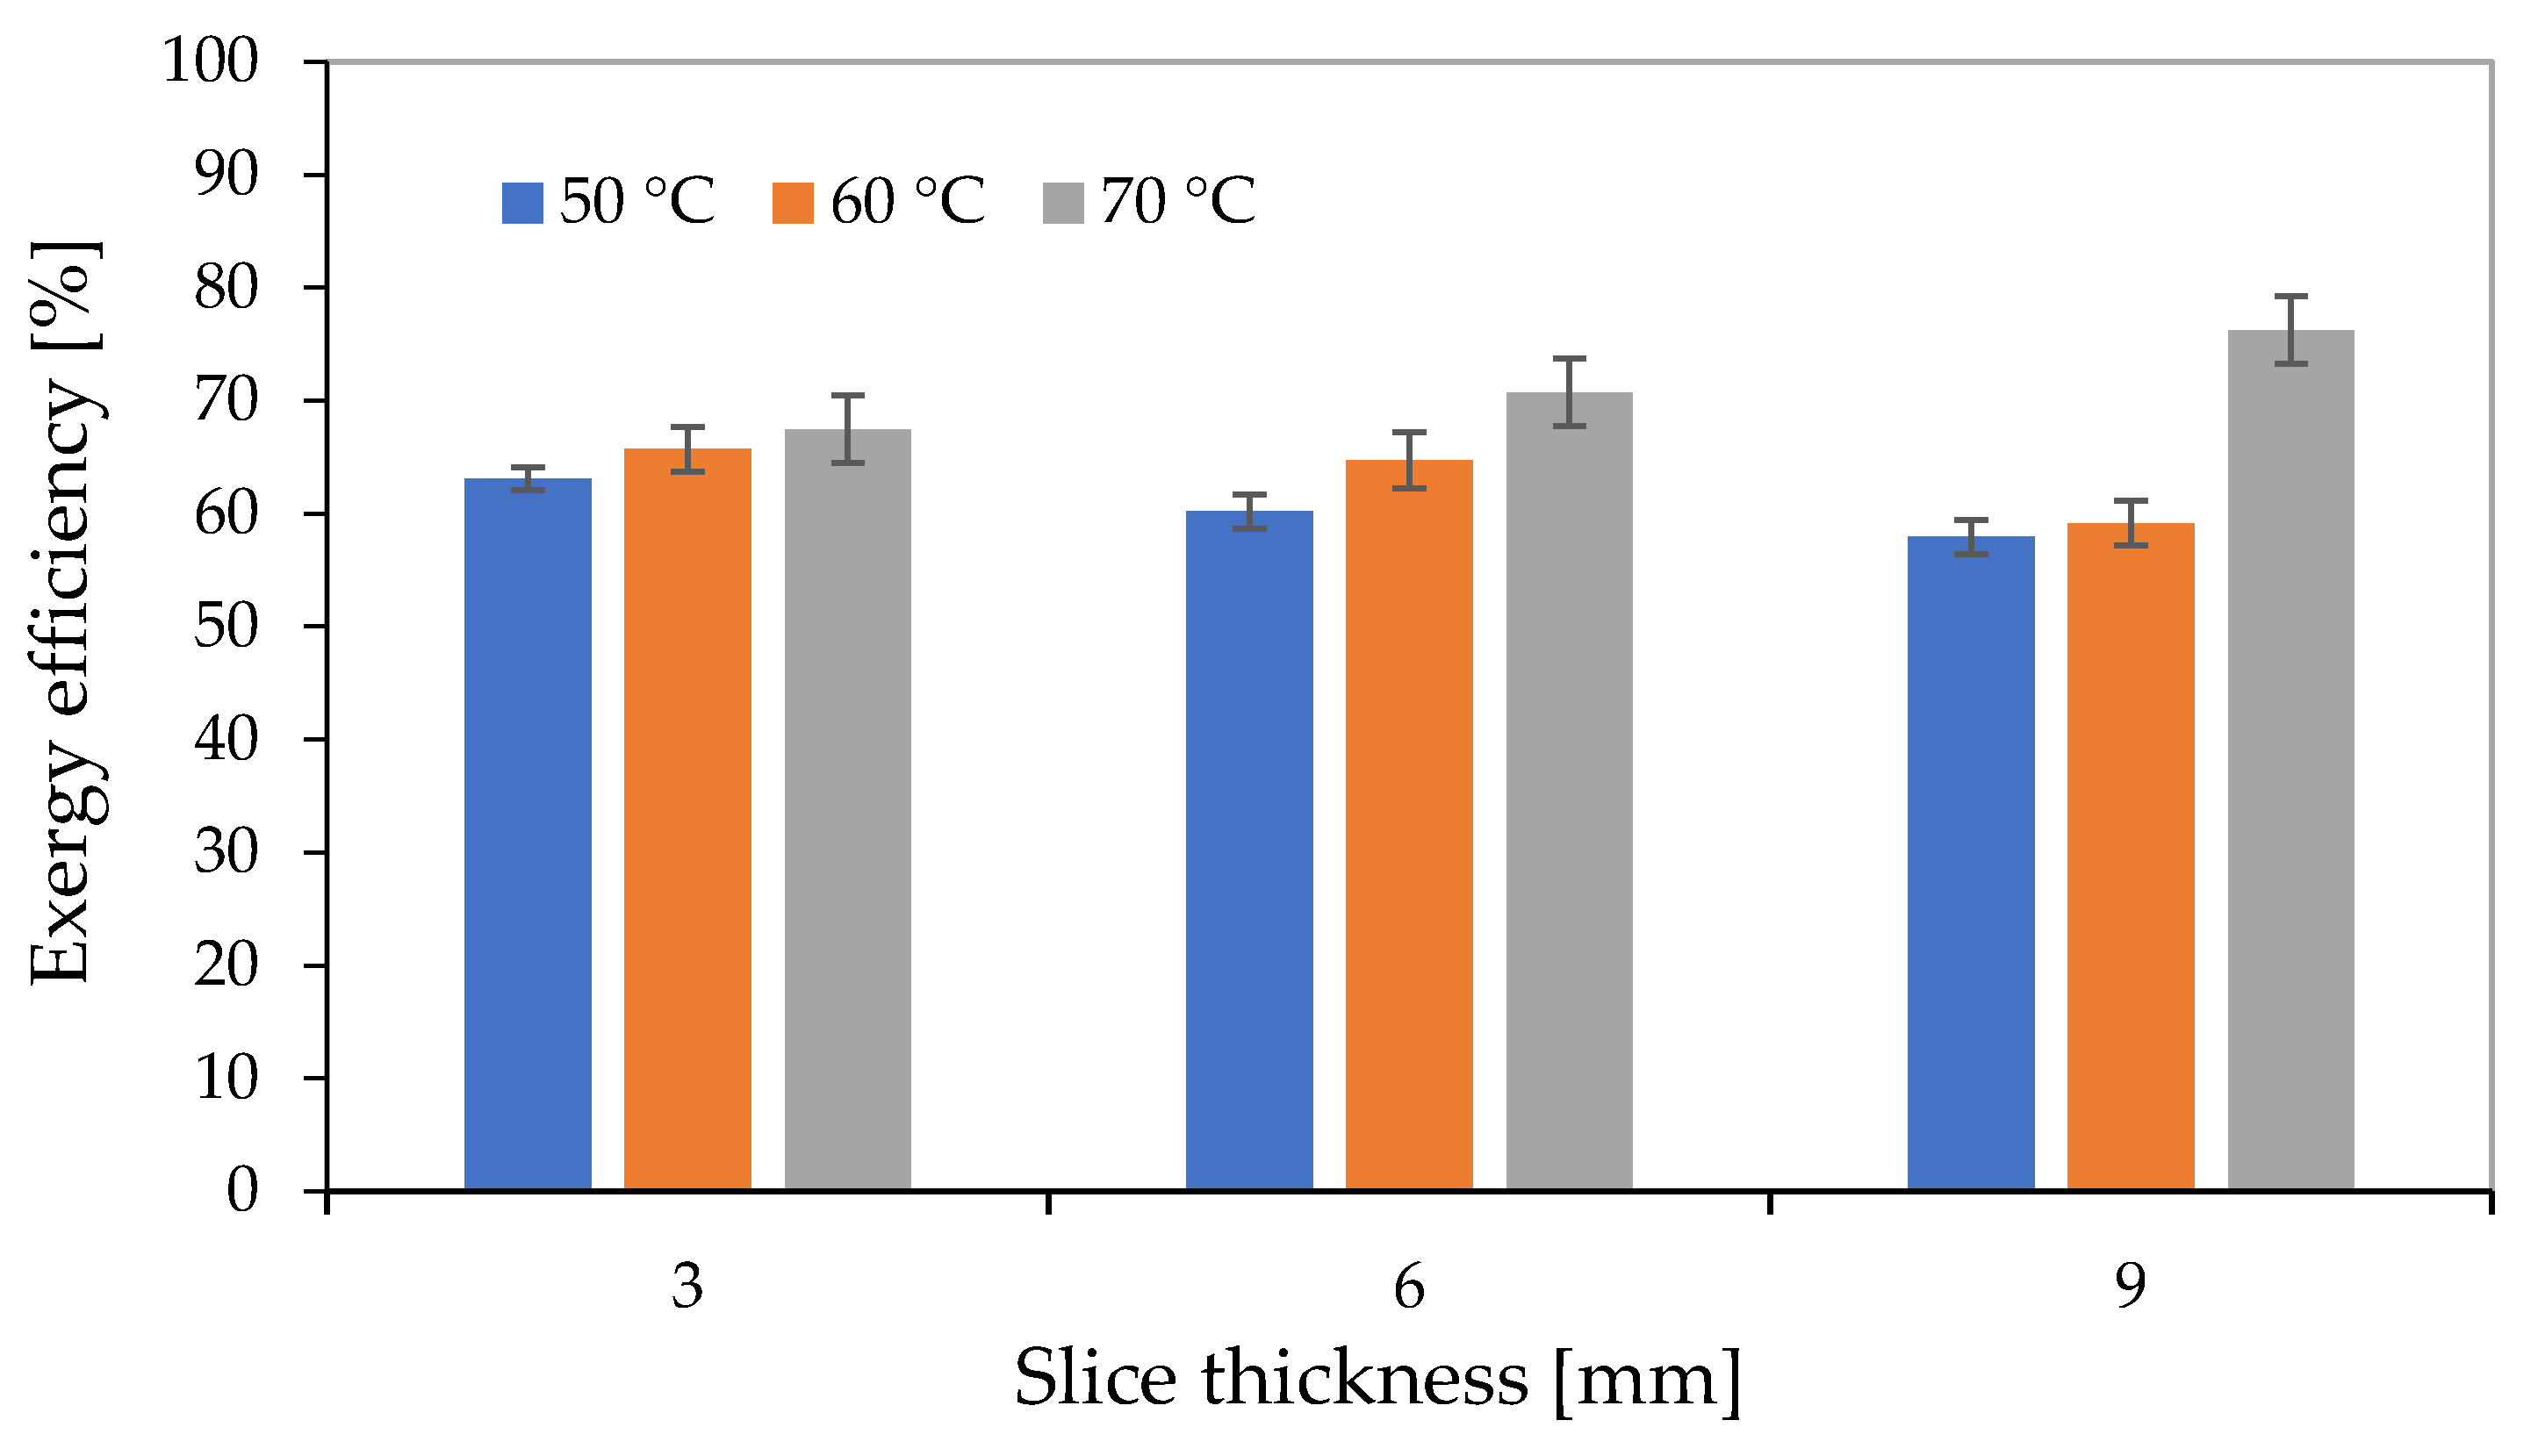
3.8.2. Exergy Efficiency
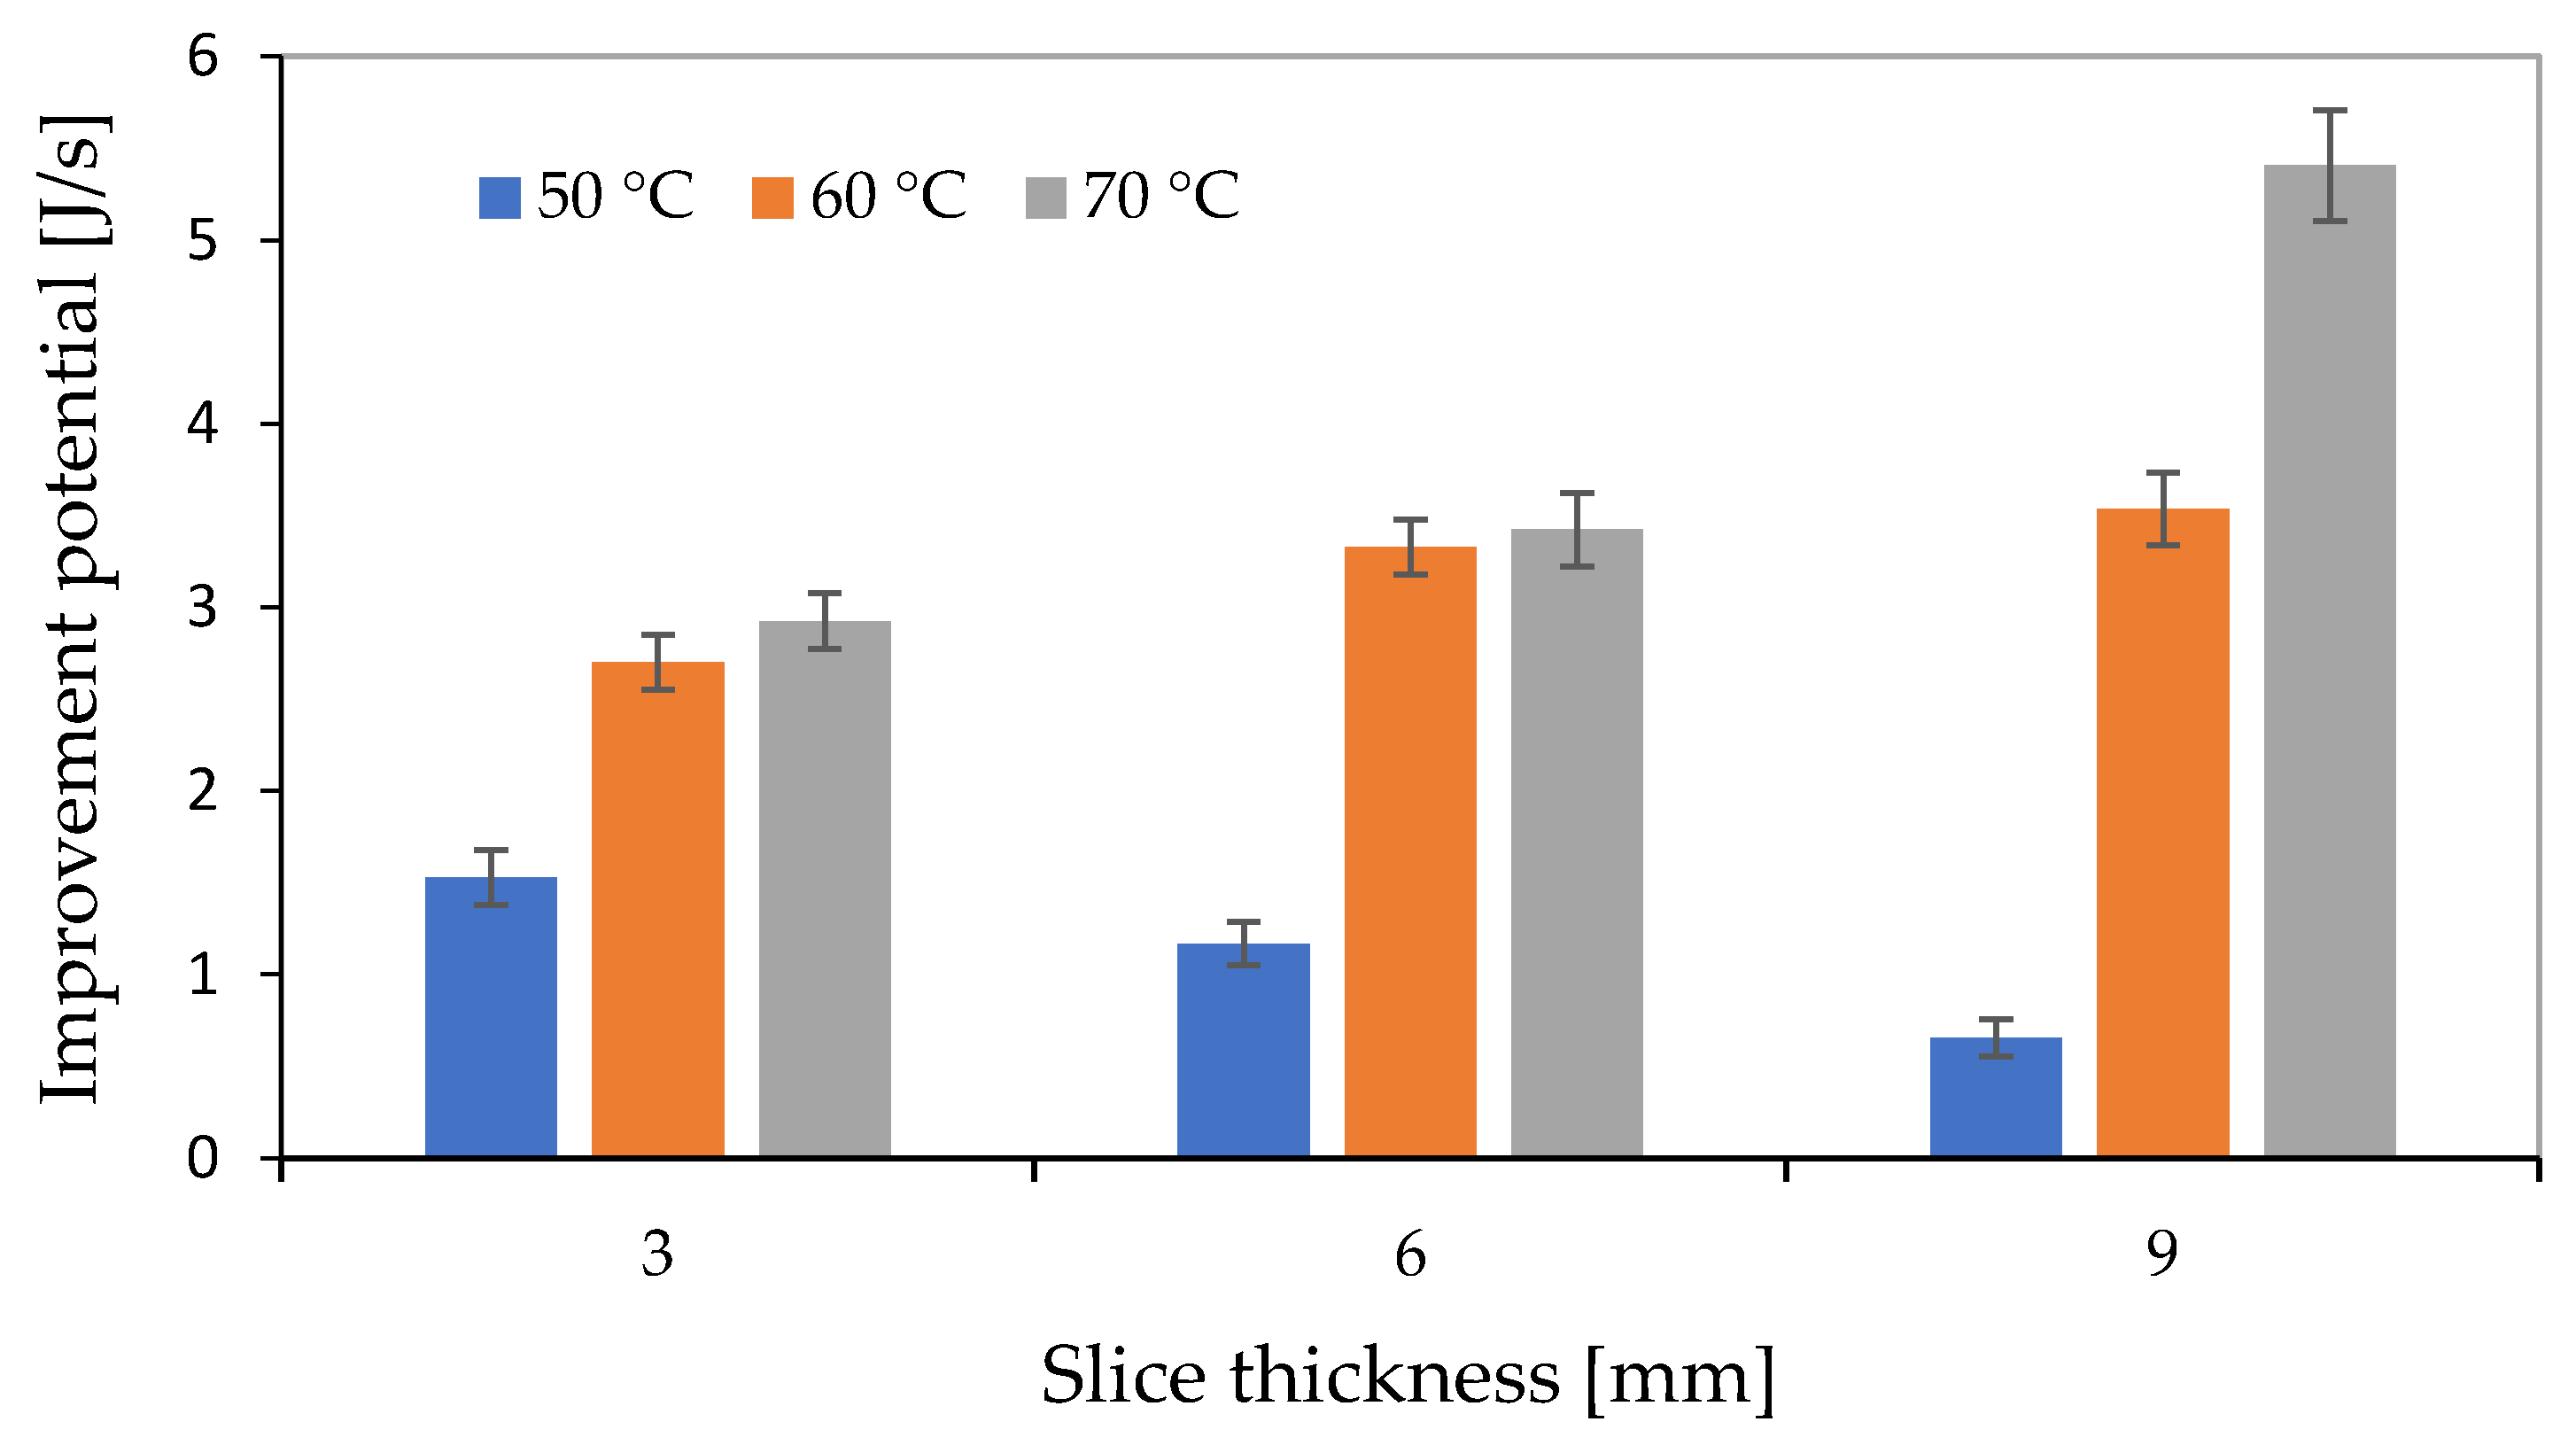
3.8.3. Improvement Potential
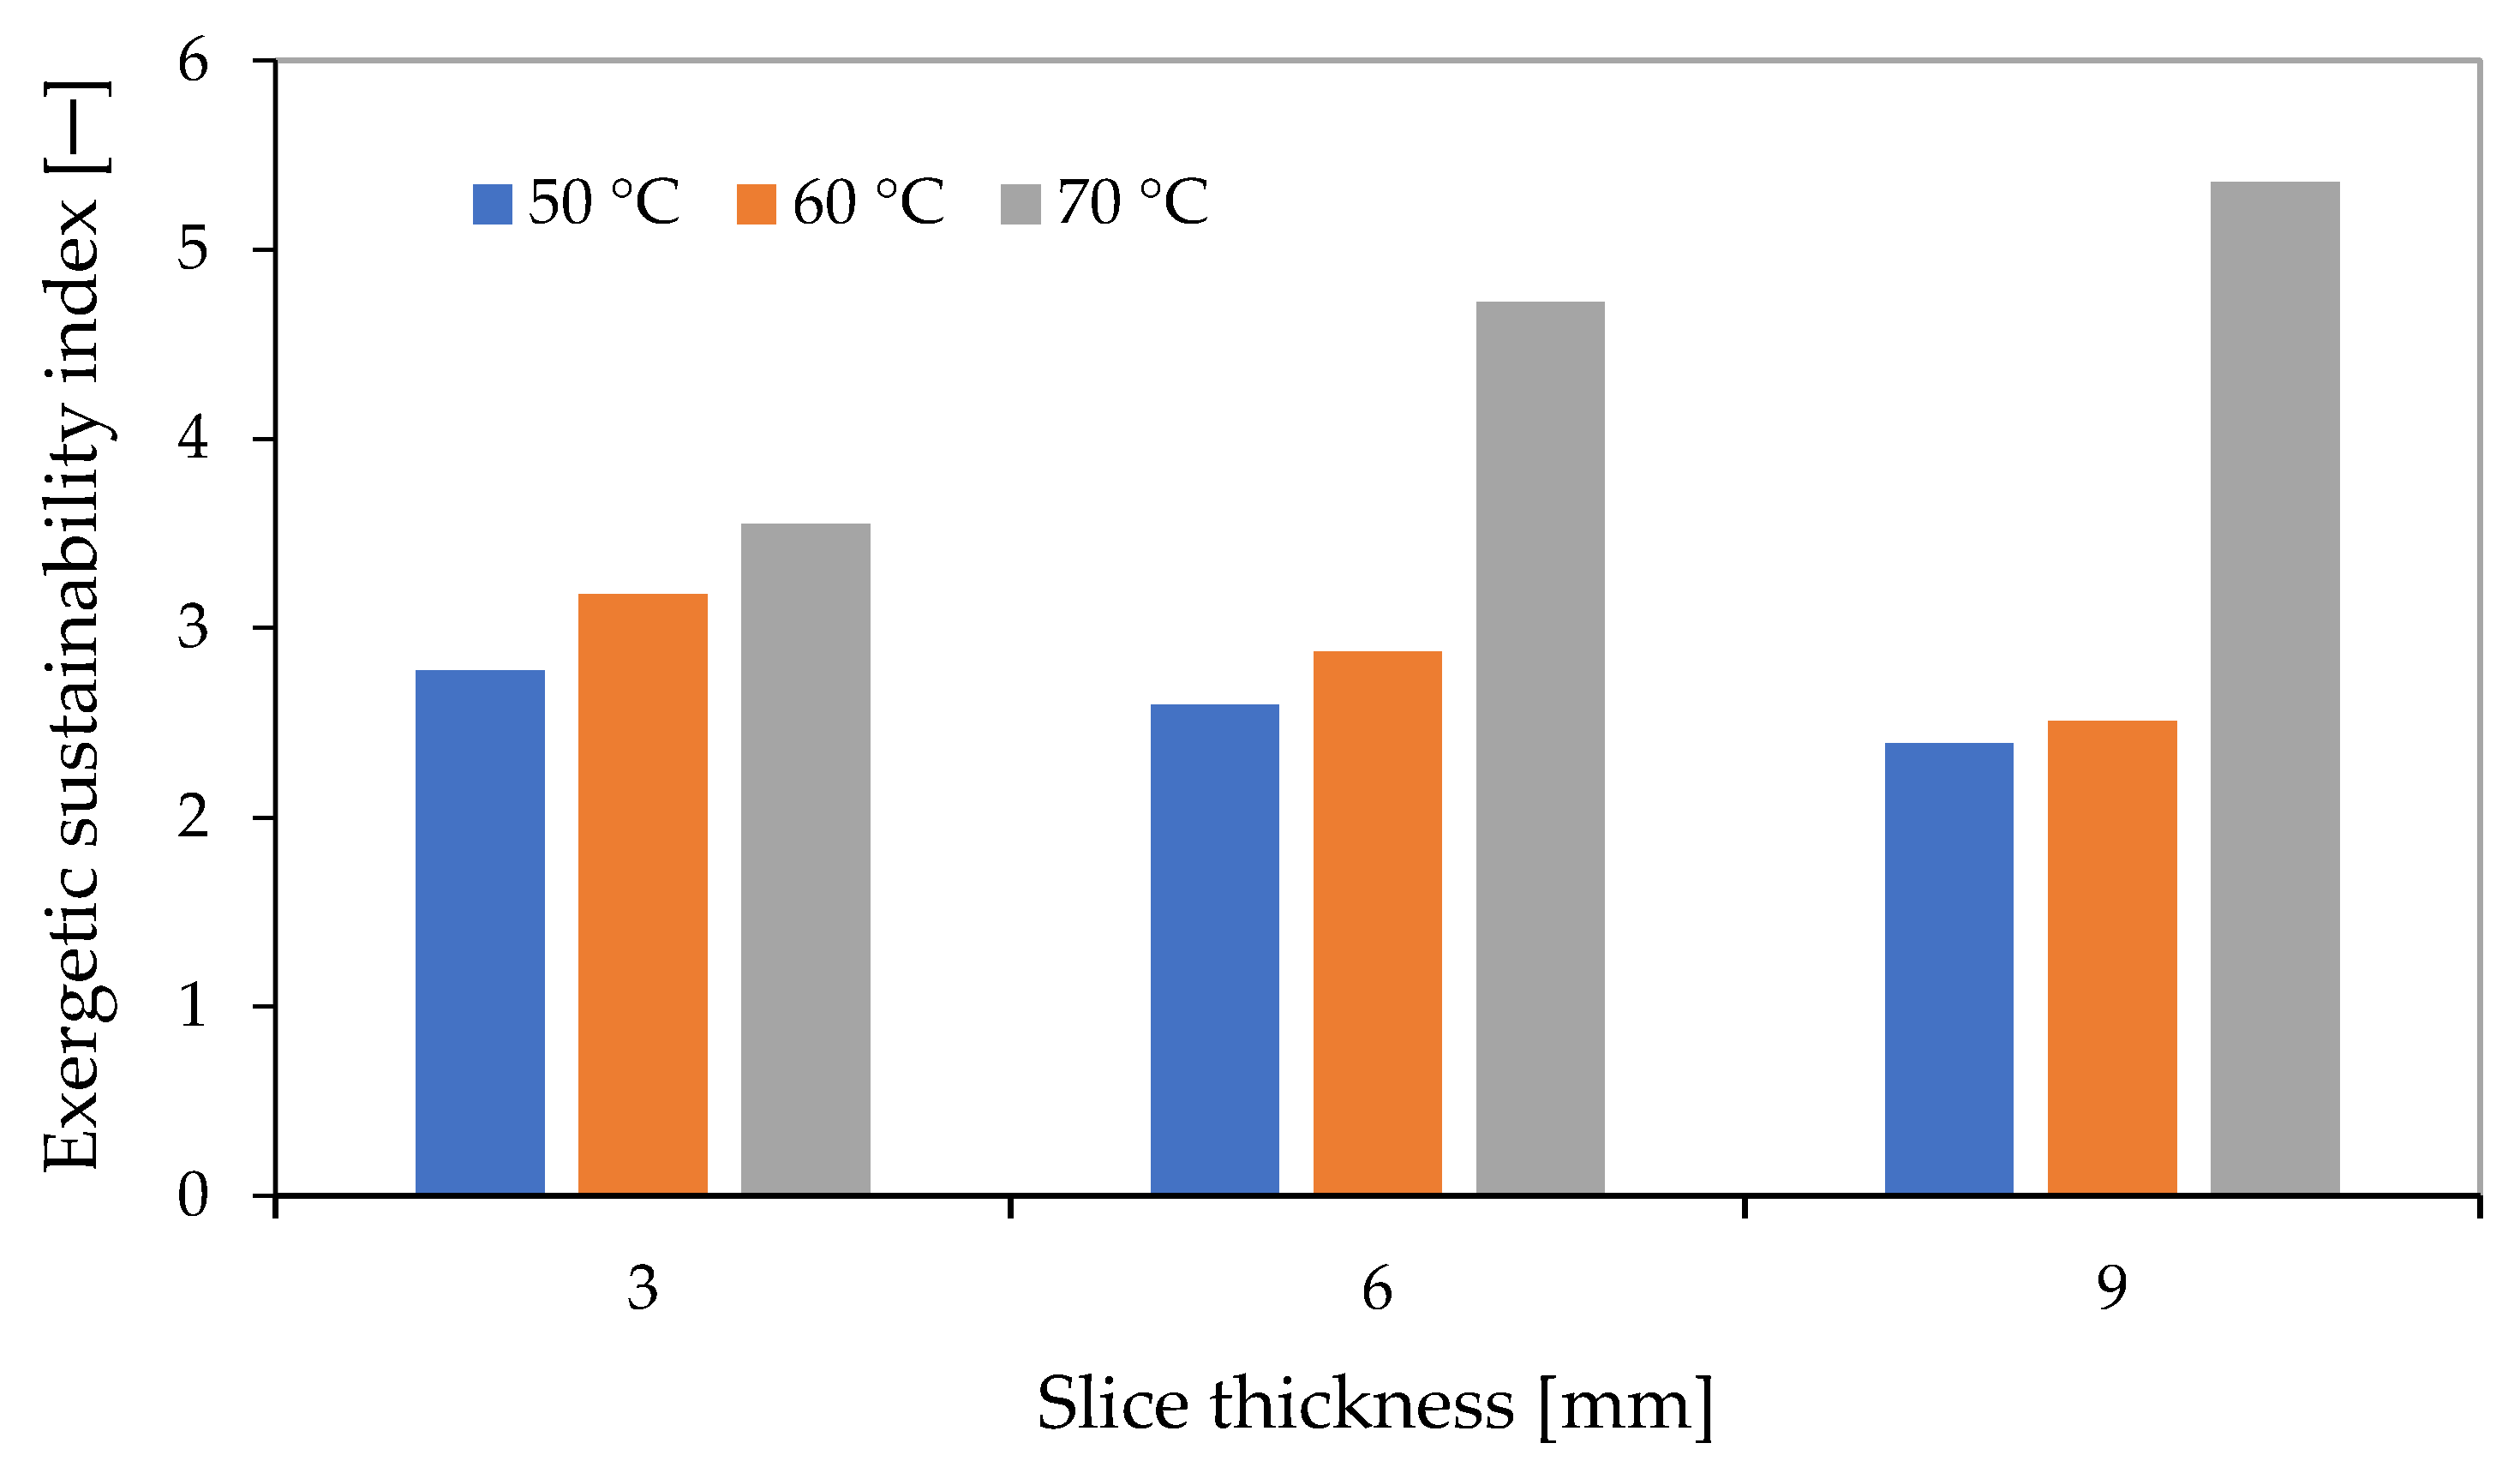
3.8.4. Exergetic Sustainability Index
4. Conclusions
Author Contributions
Funding
Data Availability Statement
Conflicts of Interest
Nomenclature
| CpA2 | Specific heat of the outlet air [J/kg] |
| E1 | Energy input (J/s) |
| E2 | Energy output (J/s) |
| CpA1 | Specific heat of the inlet air [J/kg] |
| CpA | Specific heat [J/kg] |
| DR | Drying rate [kg water/(kg dry matter*min] |
| Deff | Moisture diffusivity [m2/s] |
| Do | Arrhenius equation pre-exponential factor, [m2/s], |
| Ea | Activation energy [kJ/mol] |
| EU | Energy utilization [J/s] |
| EX | Exergy [J/s] |
| EX1 | Exergy inflow [J/s] |
| EXL | Exergy loss [J/s] |
| EXeff | Exergy efficiency [%] |
| EX2 | Exergy outflow [J/s] |
| Gravity [J/kg] | |
| h | Enthalpy [J/kg] |
| H | Humidity ratio |
| hsat | Saturated vapor enthalpy [J/kg] |
| h1 and h2 | Enthalpy of the air at dryer inlet temperature and outlet dryer temperature [J/kg], respectively. |
| Ambient air enthalpy [J/kg] | |
| Ip | Improvement potential [J/s] |
| k, k1, k2, g, h, a, b, c, | Drying rate constant |
| L | Half slab thickness [m] |
| Moisture content dry basis at any time t [%] | |
| Mo | Initial moisture content [% dry basis] |
| MR | Moisture ratio [-] |
| Moisture content at t+t | |
| MRpre | Predicted moisture ratio |
| MRexp | Experimental moisture ratio |
| MRAVper | Average predicted moisture ratio |
| , and | Mass flow rate of air at inlet and outlet points [kg/s], respectively |
| Mass flow rate [kg/s] | |
| N | Number of data points |
| Work [J/kg] | |
| Q | Heat energy gained by the system [J/s] |
| R | Universal gas constant, [8.3143 kJ/mol K] |
| RMSE | Root mean square error |
| R2 | Coefficient of determination |
| Entropy [J/kg] | |
| SSE | Sum of squared errors |
| TdA | Temperature (°C) |
| TdA2 | Temperature of drying air at the outlet [°C] |
| TdA1 | Temperature of drying air at inlet [°C] |
| Ambient temperature (°C) | |
| t | Time [min] |
| Internal energy [J/kg] | |
| U | Stands for uncertainty level of the result. |
| u1, u2, u3,…… un | Uncertainties in the independent variables |
| Momentum | |
| v1 and v2 | Velocities of the air at inlet and outlet [m/s], respectively. |
| Volumetric flow rate [m3/s] | |
| W | Mechanical work done per time [J/s] |
| Weight of sample at time, t [g] | |
| Weight of sample at dynamic equilibrium [g] | |
| x1, x2, x3, …… xn | Independent variables |
| y | function of independent variables |
| Internal energy [J/s] | |
| Change in time [min] | |
| density [kg/m3] |
References
- Otegbayo, B.O.; Oguniyan, D.J.; Olunlade, B.A.; Oroniran, O.O.; Atobatele, O.E. Characterizing genotypic variation in biochemical composition, anti-nutritional and mineral bioavailability of some Nigerian yam (Dioscorea spp.) land races. J. Food Sci. Technol. 2017, 55, 205–216. [Google Scholar] [CrossRef] [PubMed]
- Srikanth, K.S.; Sharanagat, V.S.; Kumar, Y.; Bhadra, R.; Singh, L.; Nema, P.K.; Kumar, V. Convective drying and quality attributes of elephant foot yam (Amorphophallus paeoniifolius). LWT 2019, 99, 8–16. [Google Scholar] [CrossRef]
- Nwafor, J.O.; Kanu, A.N.; Kelechukwu, E.C.; Nwohu, N.O.; Ezebuiro, V.N. Physico-chemical properties of water yam and cowpea flour blends for production of snacks. South Asian J. Res. Microbiol. 2020, 1–8. [Google Scholar] [CrossRef]
- Otunola, G.A.; Afolayan, A.J. Evaluation of the physicochemical, proximate, and sensory properties of moinmoin from blends of cowpea and water yam flour. Food Sci. Nut. 2018, 6, 991–997. [Google Scholar] [CrossRef] [PubMed]
- Chen, X.; Lu, J.; Li, X.; Wang, Y.; Miao, J.; Mao, X.; Zhao, C.; Gao, W. Effect of blanching and drying temperatures on starch-related physicochemical properties, bioactive components and antioxidant activities of yam flours. LWT 2017, 82, 303–310. [Google Scholar] [CrossRef]
- Huang, Y.; Min, Z.; Mujumdar, A.S.; Luo, Z.; Fang, Z. Dehydrated fruits and vegetables using low temperature drying technologies and their application in functional beverages: A review. Drying Technol. 2022. [Google Scholar] [CrossRef]
- Wang, D.; Zhang, M.; Ju, R.; Mujumdar, A.S.; Yu, D. Novel drying techniques for controlling microbial contamination in fresh food: A review. Drying Technol. 2022. [Google Scholar] [CrossRef]
- Ojediran, J.O.; Okonkwo, C.E.; Adeyi, A.J.; Adeyi, O.; Olaniran, A.F.; George, N.E.; Olayanju, A.T. Drying characteristics of yam slices (Dioscorearotundata) in a convective hot air dryer: Application of ANFIS in the prediction of drying kinetics. Heliyon 2020, 6, e03555. [Google Scholar] [CrossRef] [PubMed]
- Çetin, N.; Ciftci, B.; Kara, K.; Kaplan, M. Effects of gradually increasing drying temperatures on energy aspects, fatty acids, chemical composition, and in vitro ruminal fermentation of acorn. Environ. Sci. Pollution. Res. 2022, 1–17. [Google Scholar] [CrossRef] [PubMed]
- Golpour, I.; Kaveh, M. Blanco-Marigorta, A.M.; Marcos, J.D.; Guiné, R.P.F.; Chayjan, R.A.; Khalife, E.; Karami, H. Multi-response design optimisation of a combined fluidized bed-infrared dryer for terebinth (Pistacia atlantica L.) fruit drying process based on energy and exergy assessments by applying RSM-CCD modelling. Sustainability 2022, 14, 15220. [Google Scholar]
- Kamal, M.M.; Ali, M.R.; Shishir, M.R.; Mondal, S.C. Thin-layer drying kinetics of yam slices, physicochemical, and functional attributes of yam flour. J. Food Process. Eng. 2020, 43, e13448. [Google Scholar] [CrossRef]
- Kumar, A.; Ramakumar, P.; Patel, A.A.; Gupta, V.K.; Singh, A.K. Influence of drying temperature on physico-chemical and techno-functional attributes of elephant foot yam (Amorphophallus paeoniifolius) var. Gajendra. Food Biosci. 2016, 16, 11–16. [Google Scholar] [CrossRef]
- Ren, F.; Perussello, C.A.; Zhang, Z.; Gaffney, M.T.; Kerry, J.P.; Tiwari, B.K. Enhancement of phytochemical content and drying efficiency of onions (Allium cepa L.) through blanching. J. Sci. Food Agri. 2017, 98, 1300–1309. [Google Scholar] [CrossRef]
- Ju, H.Y.; Zhang, Q.; Mujumdar, A.S.; Fang, X.M.; Xiao, H.W.; Gao, Z.J. Hot-air drying kinetics of yam slices under step change in relative humidity. Int. J. Food Eng. 2016, 12, 783–792. [Google Scholar] [CrossRef]
- Aviara, N.A.; Onuoha, L.N.; Falola, O.E.; Igbeka, J.C. Energy and exergy analyses of native cassava starch drying in a tray dryer. Energy 2014, 73, 809–817. [Google Scholar] [CrossRef]
- Akpinar, E.K. Energy and exergy analyses of drying of red pepper slices in a convective type dryer. Int. Commun. Heat Mass Transfer. 2004, 31, 1165–1176. [Google Scholar] [CrossRef]
- Beigi, M.; Tohidi, M.; Torki-Harchegani, M. Exergetic analysis of deep-bed drying of rough rice in a convective dryer. Energy 2017, 140, 374–382. [Google Scholar] [CrossRef]
- Chowdhury, M.M.I.; Bala, B.K.; Haque, M.A. Energy and exergy analysis of the solar drying of jackfruit leather. Biosys. Eng. 2011, 110, 222–229. [Google Scholar] [CrossRef]
- Aghbashlo, M.; Kianmehr, M.H.; Arabhosseini, A. Energy and Exergy Analyses of Thin-Layer Drying of Potato Slices in a Semi-Industrial Continuous Band Dryer. Drying Technol. 2008, 26, 1501–1508. [Google Scholar] [CrossRef]
- Aghbashlo, M.; Mobli, H.; Rafiee, S.; Madadlou, A. Energy and exergy analyses of the spray drying process of fish oil microencapsulation. Biosys. Eng. 2012, 111, 229–241. [Google Scholar] [CrossRef]
- Sami, S.; Etesami, N.; Rahimi, A. Energy and exergy analysis of an indirect solar cabinet dryer based on mathematical modeling results. Energy 2011, 36, 2847–2855. [Google Scholar] [CrossRef]
- Liu, Z.-L.; Bai, J.-W.; Wang, S.-X.; Meng, J.S.; Wang, H.; Yu, X.L.; Gao, Z.J.; Xiao, H.W. Prediction of energy and exergy of mushroom slices drying in hot air impingement dryer by artificial neural network. Drying Technol. 2019, 1–12. [Google Scholar] [CrossRef]
- Corzo, O.; Bracho, N.; Vásquez, A.; Pereira, A. Energy and exergy analyses of thin layer drying of coroba slices. J. Food Eng. 2008, 86, 151–161. [Google Scholar] [CrossRef]
- Icier, F.; Colak, N.; Erbay, Z.; Kuzgunkaya, E.H.; Hepbasli, A. A comparative study on exergetic performance assessment for drying of broccoli florets in three different drying systems. Drying Technol. 2010, 28, 193–204. [Google Scholar] [CrossRef]
- Akbulut, A.; Durmuş, A. Energy and exergy analyses of thin layer drying of mulberry in a forced solar dryer. Energy 2010, 35, 1754–1763. [Google Scholar] [CrossRef]
- Darvishi, H.; Zarein, M.; Farhudi, Z. Energetic and exergetic performance analysis and modeling of drying kinetics of kiwi slices. J. Food Sci. Technol. 2016, 53, 2317–2333. [Google Scholar] [CrossRef] [PubMed]
- Surendhar, A.; Sivasubramanian, V.; Vidhyeswari, D.; Deepanraj, B. Energy and exergy analysis, drying kinetics, modeling and quality parameters of microwave-dried turmeric slices. J. Therm. Analysis Calorim. 2018, 136, 185–197. [Google Scholar] [CrossRef]
- Castro, M.; Román, C.; Echegaray, M.; Mazza, G.; Rodriguez, R. Exergy Analyses of Onion Drying by Convection: Influence of Dryer Parameters on Performance. Entropy 2018, 20, 310. [Google Scholar] [CrossRef] [PubMed]
- Argo, B.D.; Ubaidillah, U. Thin-layer drying of cassava chips in multipurpose convective tray dryer: Energy and exergy analyses. J. Mechanical. Sci. Technol. 2020, 34, 435–442. [Google Scholar] [CrossRef]
- Parhizi, Z.; Karami, H.; Golpour, I.; Kaveh, M.; Szymanek, M.; Blanco-Marigorta, A.M.; Marcos, J.D.; Khalife, E.; Skowron, S.; Othman, N.A.; et al. Modeling and Optimization of Energy and Exergy Parameters of a Hybrid-Solar Dryer for Basil Leaf Drying Using RSM. Sustainability 2022, 14, 8839. [Google Scholar] [CrossRef]
- Horwitz, W. Official Methods of Analysis; Association of Official Analytical Chemist: Washington, DC, USA, 1990; Volume 222, pp. 30–40. [Google Scholar]
- Ononogbo, C.; Nwakuba, N.R.; Nwaji, G.N.; Nwufo, O.C.; Nwosu, E.C.; Okoronkwo, C.A.; Igbokwe, J.O.; Anyanwu, E.E. Thermal efficiency and drying behaviour of yam slices in a dryer driven by the waste heat of exhaust gases. Sci. Afr. 2020, 17, e01310. [Google Scholar] [CrossRef]
- Fang, S.; Wang, L.-P.; Wu, T. Mathematical modeling and effect of blanching pretreatment on the drying kinetics of Chinese yam (Dioscoreaopposita). Chem. Ind. Chem. Eng. Q. 2015, 21, 511–518. [Google Scholar] [CrossRef]
- Omari, A.; Behroozi-Khazaei, N.; Sharifian, F. Drying kinetic and artificial neural network modeling of mushroom drying process in microwave-hot air dryer. J. Food Process. Eng. 2018, 41, e12849. [Google Scholar] [CrossRef]
- Zadhossein, S.; Abbaspour-Gilandeh, Y.; Kaveh, M.; Kalantari, D.; Khalife, E. Comparison of two artificial intelligence methods (ANNs and ANFIS) for estimating the energy and exergy of drying cantaloupe in a hybrid infrared-convective dryer. J. Food Process. Preserv. 2022, 46, e16836. [Google Scholar] [CrossRef]
- Sharifian, F.; Nikbakht, A.M.; Arefi, A.; Modarres Motlagh, A. Experimental assessment of energy and mass transfer in microwave drying of fig fruit. J. Agr. Sci. Tech. 2015, 17, 1695–1705. [Google Scholar]
- Sridhar, K.; Charles, A.L. Mathematical modeling and effect of drying temperature on physicochemical properties of new commercial grape “Kyoho” seeds. J. Food Process. Eng. 2019, 43, e13203. [Google Scholar] [CrossRef]
- Pandiselvam, R.; Aydar, A.Y.; Kutlu, N.; Aslam, R.; Sahni, P.; Mitharwal, S.; Gavahian, M.; Kumar, M.; Raposo, A.; Yoo, S.; et al. Individual and interactive effect of ultrasound pre-treatment on dryingkinetics and biochemical qualities of food: A critical review. Ultrason. Sonochem. 2023, 92, 106261. [Google Scholar] [CrossRef] [PubMed]
- Meng, Z.; Cui, X.; Zhang, H.; Liu, Y.; Wang, Z.; Zhang, F. Study on drying characteristics of yam slices under heat pump-electrohydrodynamics combined drying. Case Stud. Therm. Eng. 2023, 41, 102601. [Google Scholar] [CrossRef]
- Çetin, N. Comparative assessment of energy analysis, drying kinetics, and biochemical composition of tomato waste under different drying conditions. Sci. Hortic. 2022, 305, 111405. [Google Scholar] [CrossRef]
- Doymaz, I. Influence of infrared drying on some quality properties of nashi pear (Pyruspyrifolia) slices. Erwerbs-Obstbau 2022, 65, 47–54. [Google Scholar] [CrossRef]
- Pradechboon, T.; Dussadee, N.; Unpaprom, Y.; Chindaraksa, Y. Effect of rotary microwave drying on quality characteristics and physical properties of Kaffir lime leaf (Citrus hystrix D.C.). Biomass. Convers. Biorefin. 2022. [Google Scholar] [CrossRef]
- Kumar, A.; Kandasamy, P.; Chakraborty, I.; Hangshing, L. Analysis of energy consumption, heat and mass transfer, drying kinetics and effective moisturediffusivity during foam-mat drying of mango in aconvective hot-air dryer. Biosys. Eng. 2022, 219, 85–102. [Google Scholar] [CrossRef]
- EL-Mesery, H.S.; Tolba, N.M.; Kamel, R.M. Mathematical modelling and performance analysis of airflow distribution systems inside convection hot-air dryers. Alex. Eng. J. 2023, 62, 237–256. [Google Scholar] [CrossRef]
- Doymaz, İ. Infrared drying of sweet potato (Ipomoea batatas L.) slices. J. Food Sci. Technol. 2011, 49, 760–766. [Google Scholar] [CrossRef] [PubMed]
- Doymaz, İ. Infrared drying of kiwifruit slices. Int. J. Green Energy. 2018, 15, 622–628. [Google Scholar] [CrossRef]
- Zia, S.; Khan, M.R.; Aadil, R.M. Kinetic modeling of different drying techniques and their influence on color, bioactive compounds, antioxidant indices and phenolicprofile of watermelon rind. J. Food Meas Charact. 2023, 17, 1068–1081. [Google Scholar] [CrossRef]
- Hazervazifeh, A.; Nikbakht, A.M.; Moghaddam, P.A.; Sharifian, F. Energy economy and kinetic investigation of sugar cube dehydration using microwave supplemented with thermal imaging. J. Food Process. Preserv. 2018, 42, e13504. [Google Scholar] [CrossRef]
- Ozgener, L.; Ozgener, O. Exergy analysis of industrial pasta drying process. Int. J. Energy Res. 2006, 30, 1323–1335. [Google Scholar] [CrossRef]
- Zalazar-Garcia, D.; Roman, M.C.; Fernandez, A.; Asensio, D.; Zhang, X.; Fabani, M.P.; Rodriguez, R.; Mazza, G. Exergy, energy, and sustainability assessments applied to RSM optimization of integrated convective air-drying with pretreatments to improve the nutritional quality of pumpkin seeds. Sustain. Energy Technol. Assess. 2022, 49, 101763. [Google Scholar] [CrossRef]
- Zohrabi, S.; Seiiedlou, S.S.; Aghbashlo, M.; Scaar, H.; Mellmann, J. Enhancing the exergetic performance of a pilot-scale convective dryer by exhaust air recirculation. Drying Technol. 2019, 38, 518–533. [Google Scholar] [CrossRef]
- Onwude, D.I.; Hashim, N.; Abdan, K.; Janius, R.; Chen, G. Investigating the influence of novel drying methods on sweet potato (Ipomoea batatas L.): Kinetics, energy consumption, color, and microstructure. J. Food Process. Eng. 2018, 41, e12686. [Google Scholar] [CrossRef]
- Rostami Gharkhloo, Z.; Sharifian, F.; Rahimi, A.; AkhoundzadehYamchi, A. Influence of high wave sound pretreatment on drying quality parameters of Echinacea root with infrared drying. J. Sci. Food Agr. 2022, 102, 2153–2164. [Google Scholar] [CrossRef] [PubMed]
- Harish, A.; Rashmi, M.; Krishna Murthy, T.P.; Blessy, B.M.; Ananda, S. Mathematical modeling of thin layer microwave drying kinetics of elephant foot yam (Amorphophallus paeoniifolius). Int. Food Res. J. 2014, 21, 1081–1087. [Google Scholar]
- Bassey, E.J.; Cheng, J.-H.; Sun, D.-W. Thermoultrasound and microwave-assisted freeze-thaw pretreatments for improving infrared drying and quality characteristics of red dragon fruit slices. Ultrasonics Sonochem. 2022, 91, 106225. [Google Scholar] [CrossRef]
- Geng, Z.; Torki, M.; Kaveh, M.; Beigi, M.; Yang, X. Characteristics and multi-objective optimization of carrot dehydration in a hybrid infrared /hot air dryer. LWT 2022, 172, 114229. [Google Scholar] [CrossRef]
- Chikpah, S.K.; Korese, J.K.; Sturm, B.; Hensel, O. Colour change kinetics of pumpkin (Cucurbita moschata) slices during convective air drying and bioactive compounds of the dried products. J. Agr. Food Res. 2022, 10, 100409. [Google Scholar] [CrossRef]
- Hadjout-Krimat, L.; Belbahi, A.; Dahmoune, F.; Hentabli, M.; Boudria, A.; Achat, S.; Remini, H.; Oukhmanou-Bensidhoum, S.; Spigno, G.; Madani, K. Study of microwave and convective drying kinetics of pea pods (Pisum sativum L.): A new modeling approach using support vector regression methods optimized by dragonfly algorithm techniques. J. Food Process. Eng. 2022, 46, e14232. [Google Scholar] [CrossRef]
- Çetin, N. Prediction of moisture ratio and drying rate of orange slicesusing machine learning approaches. J. Food Process. Preserv. 2022, 46, e17011. [Google Scholar] [CrossRef]
- Beigi, M.; Torki, M.; Khoshnam, F.; Tohidi, M. Thermodynamic and environmental analyses for paddy drying in a semi-industrial dryer. J. Therm. Anal. Calorim. 2021, 146, 393–401. [Google Scholar] [CrossRef]
- Okunola, A.; Adekanye, T.; Idahosa, E. Energy and exergy analyses of okra drying process in a forced convection cabinet dryer. Res.Agr. Eng. 2021, 67, 8–16. [Google Scholar] [CrossRef]
- Beigi, M.; Harchegani, H.B.; Torki, M.; Kaveh, M.; Szymanek, M.; Khalife, E.; Dziwulska-Hunek, A. Experimental and numerical analysis of thermodynamic performance of microwave dryer of onion. J. Food Process. Eng. 2022, 45, e14116. [Google Scholar] [CrossRef]
- Colak, N.; Hepbasli, A. Performance analysis of drying of green olive in a tray dryer. J. Food Eng. 2007, 80, 1188–1193. [Google Scholar] [CrossRef]


| S/N | Model Name | References | |
|---|---|---|---|
| 1 | Page | [38] | |
| 2 | Henderson and Pabis | [39] | |
| 3 | Newton | [40] | |
| 4 | Aghbashlo et al. | [41] | |
| 5 | Logarithmic | [42] | |
| 6 | Approximation of diffusion | [43] | |
| 7 | Two-term | [44] | |
| 8 | Wang and Singh | [45] | |
| 9 | Parabolic | [46] | |
| 10 | Midilli et al. | [47] |
| Drying Conditions | Model | ||||||||||
|---|---|---|---|---|---|---|---|---|---|---|---|
| 1 | 2 | 3 | 4 | 5 | 6 | 7 | 8 | 9 | 10 | ||
| 50 °C + 3 mm | SSE | 0.0122 | 0.0123 | 0.0123 | 0.0103 | 0.0074 | 0.0123 | 0.0122 | 0.7625 | 0.4036 | 0.0089 |
| R2 | 0.9964 | 0.9964 | 0.9964 | 0.997 | 0.9978 | 0.9964 | 0.9964 | 0.7775 | 0.8822 | 0.9974 | |
| RMSE | 0.0217 | 0.0217 | 0.0213 | 0.0199 | 0.0172 | 0.0221 | 0.0226 | 0.1713 | 0.1271 | 0.0189 | |
| 50 °C + 6 mm | SSE | 0.0070 | 0.0073 | 0.0073 | 0.0059 | 0.0058 | 0.0056 | 0.0051 | 0.1945 | 0.1255 | 0.0064 |
| R2 | 0.998 | 0.9979 | 0.9979 | 0.9983 | 0.9983 | 0.9984 | 0.9985 | 0.9436 | 0.9636 | 0.9981 | |
| RMSE | 0.0167 | 0.0171 | 0.0168 | 0.0153 | 0.0156 | 0.0153 | 0.0150 | 0.0882 | 0.0723 | 0.0163 | |
| 50 °C + 9 mm | SSE | 0.0032 | 0.0032 | 0.0032 | 0.0032 | 0.0030 | 0.0021 | 0.0032 | 0.0868 | 0.0561 | 0.0028 |
| R2 | 0.9991 | 0.9991 | 0.9991 | 0.9991 | 0.9992 | 0.9994 | 0.9991 | 0.9757 | 0.9843 | 0.9992 | |
| RMSE | 0.0110 | 0.0110 | 0.0108 | 0.0110 | 0.0110 | 0.0093 | 0.0115 | 0.0578 | 0.0474 | 0.0107 | |
| 60 °C + 3 mm | SSE | 0.0038 | 0.0068 | 0.0084 | 0.0037 | 0.0068 | 0.0065 | 0.0068 | 0.6086 | 0.3402 | 0.0035 |
| R2 | 0.9987 | 0.9976 | 0.9971 | 0.9987 | 0.9976 | 0.9977 | 0.9976 | 0.7878 | 0.8814 | 0.9988 | |
| RMSE | 0.0135 | 0.0180 | 0.0196 | 0.0133 | 0.0184 | 0.018 | 0.0189 | 0.1702 | 0.1304 | 0.0132 | |
| 60 °C + 6 mm | SSE | 0.0063 | 0.0062 | 0.0076 | 0.0075 | 0.0059 | 0.0050 | 0.0062 | 0.516 | 0.2368 | 0.0060 |
| R2 | 0.9978 | 0.9979 | 0.9974 | 0.9974 | 0.998 | 0.9983 | 0.9979 | 0.8207 | 0.9177 | 0.9979 | |
| RMSE | 0.0170 | 0.0168 | 0.0181 | 0.0184 | 0.0168 | 0.0155 | 0.0176 | 0.1531 | 0.1062 | 0.0169 | |
| 60°C + 9 mm | SSE | 0.0018 | 0.0018 | 0.0019 | 0.0019 | 0.0018 | 0.0019 | 0.0018 | 0.1275 | 0.0785 | 0.0018 |
| R2 | 0.9994 | 0.9994 | 0.9994 | 0.9994 | 0.9994 | 0.9994 | 0.9994 | 0.9594 | 0.975 | 0.9994 | |
| RMSE | 0.0090 | 0.0090 | 0.0088 | 0.0090 | 0.0091 | 0.0092 | 0.0093 | 0.0745 | 0.0597 | 0.0091 | |
| 70 °C + 3 mm | SSE | 0.0041 | 0.0071 | 0.0099 | 0.0059 | 0.0066 | 0.0088 | 0.0037 | 0.5434 | 0.3082 | 0.0023 |
| R2 | 0.9983 | 0.997 | 0.9958 | 0.9975 | 0.9972 | 0.9963 | 0.9984 | 0.7717 | 0.8706 | 0.999 | |
| RMSE | 0.0150 | 0.0198 | 0.0228 | 0.0181 | 0.0197 | 0.0227 | 0.0153 | 0.1738 | 0.1346 | 0.0115 | |
| 70 °C + 6 mm | SSE | 0.0013 | 0.0043 | 0.0064 | 0.0008 | 0.0034 | 0.0009 | 0.0010 | 0.1725 | 0.1108 | 0.0013 |
| R2 | 0.9995 | 0.9984 | 0.9976 | 0.9997 | 0.9987 | 0.9996 | 0.9996 | 0.9355 | 0.9586 | 0.9995 | |
| RMSE | 0.0082 | 0.0150 | 0.0179 | 0.0066 | 0.0137 | 0.0072 | 0.0075 | 0.0953 | 0.0785 | 0.0084 | |
| 70 °C + 9 mm | SSE | 0.0010 | 0.0012 | 0.0012 | 0.0007 | 0.0005 | 0.0012 | 0.0012 | 0.0898 | 0.0533 | 0.0005 |
| R2 | 0.9996 | 0.9996 | 0.9995 | 0.9997 | 0.9998 | 0.9995 | 0.9996 | 0.9662 | 0.98 | 0.9998 | |
| RMSE | 0.0070 | 0.0077 | 0.0076 | 0.0059 | 0.0049 | 0.0080 | 0.0080 | 0.067 | 0.0529 | 0.0049 | |
| Parameters | Unit | Uncertainty (%) |
|---|---|---|
| Experimental measurements | ||
| Drying air temperature | °C | ±0.5 |
| Drying air relative humidity | % | ±1.0 |
| Product weight loss | g | ±0.0001 |
| Process time | s | ±3.0 |
| Drying air velocity | m/s | ±0.52 |
| Predicted drying kinetic responses | ||
| Moisture ratio | Dimensionless | ±1.46 |
| Effective diffusivity | m2/s | ±2.66 |
| Activation energy | kJ/mol | ±2.89 |
| Predicted energetic responses | ||
| Mass flow rate | kg/s | ±0.63 |
| Energy utilization | J/s | ±1.43 |
| Energy utilization ratio | Dimensionless | ±3.84 |
| Energy efficiency | % | ±2.21 |
| Predicted exergetic responses | ||
| Exergy inflow | J/s | ±1.35 |
| Exergy outflow | J/s | ±1.68 |
| Exergy loss | J/s | ±2.65 |
| Exergy efficiency | % | ±2.33 |
| Improvement potential | J/s | ±2.77 |
| Exergetic sustainability index | Dimensionless | ±2.98 |
Disclaimer/Publisher’s Note: The statements, opinions and data contained in all publications are solely those of the individual author(s) and contributor(s) and not of MDPI and/or the editor(s). MDPI and/or the editor(s) disclaim responsibility for any injury to people or property resulting from any ideas, methods, instructions or products referred to in the content. |
© 2023 by the authors. Licensee MDPI, Basel, Switzerland. This article is an open access article distributed under the terms and conditions of the Creative Commons Attribution (CC BY) license (https://creativecommons.org/licenses/by/4.0/).
Share and Cite
Okunola, A.A.; Adekanye, T.A.; Okonkwo, C.E.; Kaveh, M.; Szymanek, M.; Idahosa, E.O.; Olayanju, A.T.; Wojciechowska, K. Drying Characteristics, Kinetic Modeling, Energy and Exergy Analyses of Water Yam (Dioscorea alata) in a Hot Air Dryer. Energies 2023, 16, 1569. https://doi.org/10.3390/en16041569
Okunola AA, Adekanye TA, Okonkwo CE, Kaveh M, Szymanek M, Idahosa EO, Olayanju AT, Wojciechowska K. Drying Characteristics, Kinetic Modeling, Energy and Exergy Analyses of Water Yam (Dioscorea alata) in a Hot Air Dryer. Energies. 2023; 16(4):1569. https://doi.org/10.3390/en16041569
Chicago/Turabian StyleOkunola, Abiodun A., Timothy A. Adekanye, Clinton E. Okonkwo, Mohammad Kaveh, Mariusz Szymanek, Endurance O. Idahosa, Adeniyi T. Olayanju, and Krystyna Wojciechowska. 2023. "Drying Characteristics, Kinetic Modeling, Energy and Exergy Analyses of Water Yam (Dioscorea alata) in a Hot Air Dryer" Energies 16, no. 4: 1569. https://doi.org/10.3390/en16041569