
A Comparative-Analysis-Based Multi-Criteria Assessment of On/Off-Grid-Connected Renewable Energy Systems: A Case Study

 ,
,  , ,
, ,  ,
,
Abstract
:1. Introduction
2. Presentation of the Study Systems and Site
2.1. System Configurations and Study Site
- Grid-PV/Wind/Battery;
- Grid-PV/Battery;
- Grid-Wind/Battery;
- Grid-Wind;
- PV/Wind/Battery;
- PV/Battery;
- Wind/Battery;
- Stand-alone Wind.
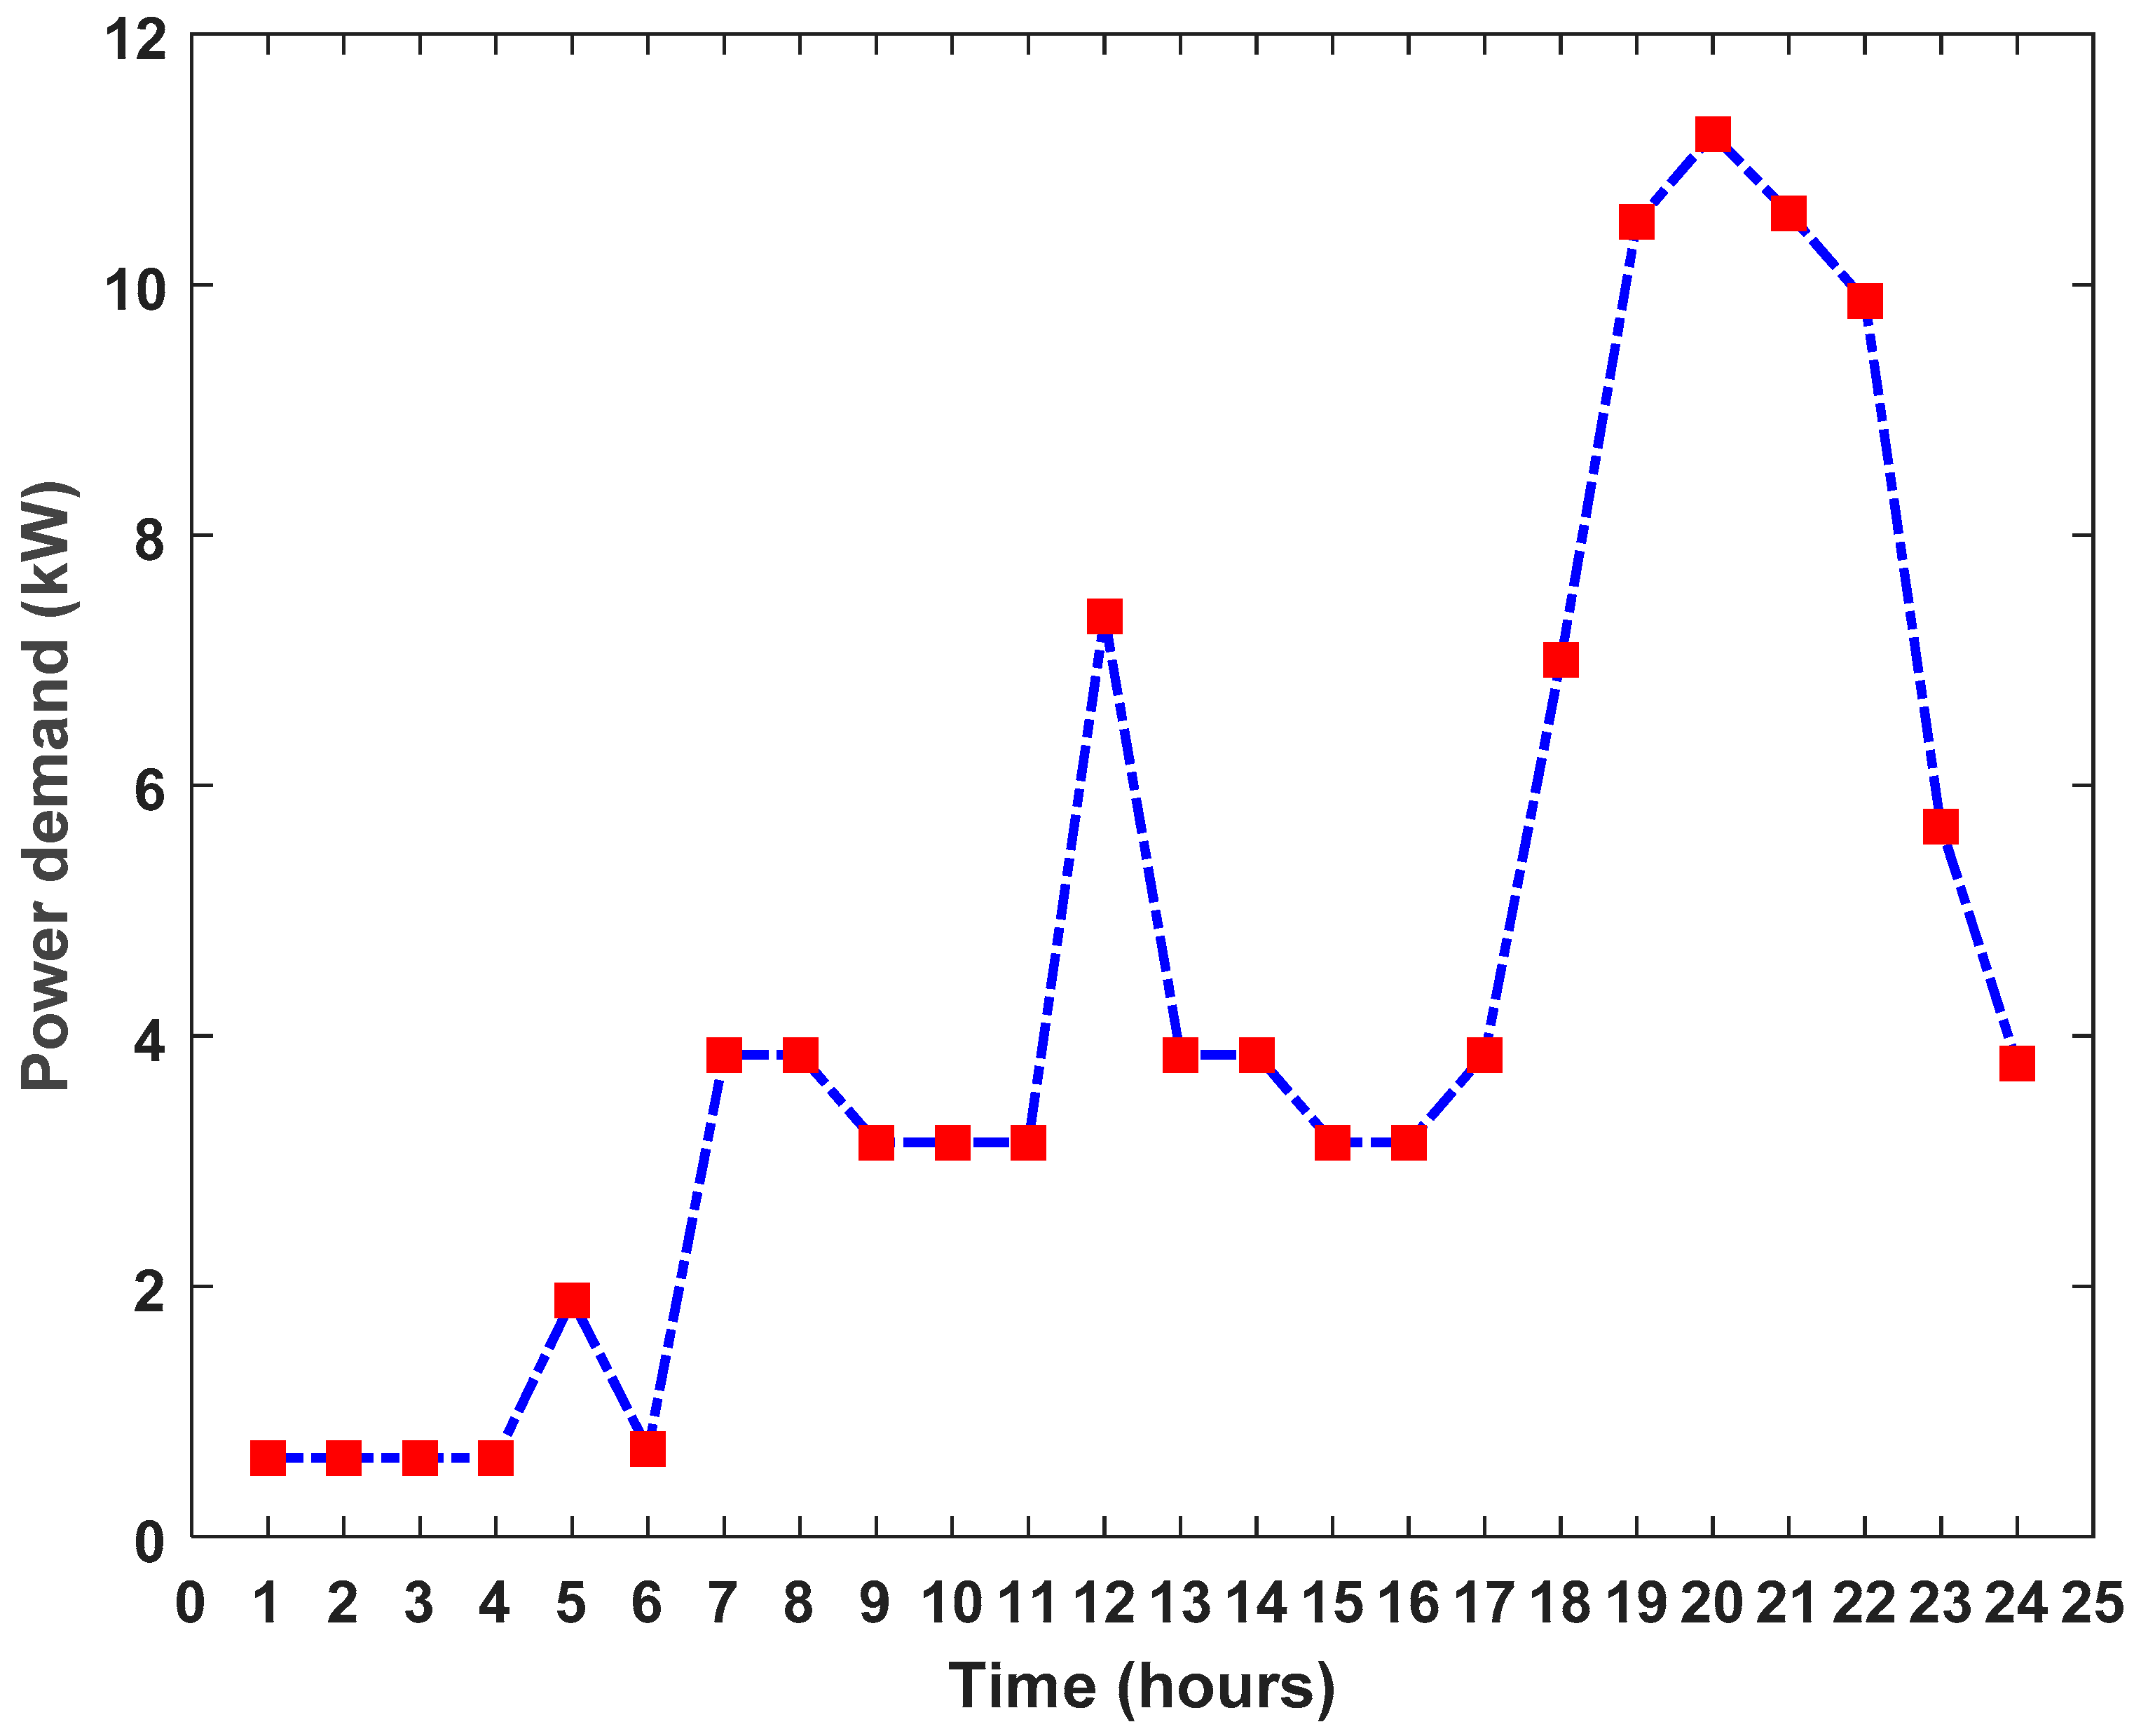
2.2. Load Profile
3. Optimization model
3.1. Presentation of the Optimization Algorithm
3.2. Grid Modeling
3.3. The PV Modeling
3.4. Wind Turbine Modeling
3.5. Battery Storage Modeling
3.6. Inverter Modeling
3.7. Economic Modeling
3.8. Design of the System
3.8.1. Assessment Functions
3.8.2. Optimization Constraints and Operational Strategy
4. Results and Discussion
5. Conclusions
- Grid-connected PV/Wind/Battery was identified as the most cost-effective system for energy supply in this locality;
- The least polluting energy system was the stand-alone Wind-only system;
- Grid-connected HRESs were more economically advantageous than the non-grid-connected HRES;
- Grid-connected RESs could even be economically more profitable than the grid-only system in some cases;
- The renewable energy penetration rate highly influenced the system’s electricity cost and the CO2 emissions. Its increase could either increase or reduce the electricity cost, depending on the used renewable energy resources;
- The CO2 emissions significantly decreased in the presence of HRES, especially when Wind was the main energy source.
- The parameters that could lead to the improvement of the studied systems costs were: the increase in the project lifetime, the decrease in the discount rate, and the decrease in the battery cost.
Author Contributions
Funding
Data Availability Statement
Acknowledgments
Conflicts of Interest
Nomenclature
| Abbreviations | |
| PV | Photovoltaic |
| WT | Wind turbine |
| W | Wind |
| B | Battery |
| Batt | Battery |
| NOCT | Nominal operating cells temperature (°C) |
| LCOE | Levelized cost of energy |
| PSDP | Power Supply Deficit Probability |
| Repl | Replacement cost |
| Inv | Investment cost |
| Salv | Salvage value |
| CRF | Capital Recovery Cost |
| O$M | Operation and maintenance |
| invert | Inverter |
| MPP | Maximum power point |
| STC | Standard test conditions |
| ES | Energy system |
| RE | Renewable energy |
| min | Minimum |
| max | Maximum |
| Symbols | |
| EG | Annual grid energy supply (kWh) |
| Ta | Ambient temperature (°C) |
| G | Solar radiation (kWh/m2) |
| Gref | Irradiance at reference condition (kW/m2) |
| GNOCT | Solar radiation at NOCT (kWh/m2) |
| Tc | Cell temperature (°C or K) |
| Tc,ref | Cell temperature at reference condition (25 °C or 298 K) |
| Es | Total yearly energy supply (kWh) |
| Es_cons | Energy supply consumed (kWh) |
| PWT | Wind turbine output power (kW) |
| Esurplus | Surplus total energy supply (kWh) |
| EWT_s | Wind energy supply (kWh) |
| Vr | Rated wind speed (m/s) |
| Vin | Cut-in wind speed (m/s) |
| Voff | Cut-off wind speed (m/s) |
| Psupply | Power supply (kW) |
| Pdemand | Power demand (kW) |
| Eexcess | Annual excess energy supply (kWh) |
| EB | Annual energy consumed from Battery (kWh) |
| x | year variation |
| Greek symbols | |
| α | Temperature coefficient (%/°C) |
| εG | Grid availability factor |
| ηinverter | Inverter efficiency (%) |
| $ | US dollar |
Appendix A

| Define the objective functions y1(χ), y2(χ) where the vector χ = (μ1, …, μk), k is the number of variables |
| Initialize a population of Nt fireflies χa (a = 1, 2, …, Nt) |
| While iter ≤ Niter_max (Niter_max is the maximum number of iterations) |
| fora = 1:Nt |
| for b = 1:Nt (a ≠ b) |
| Evaluate the objectives functions based on the operational strategy and satisfying all the constraints |
| if Pareto-dominates |
| generate new solution |
| if Pareto-dominates |
| is the new solution in the Firefly population |
| else |
| is the new solution in the Firefly population |
| end |
| end |
| end |
| end |
| Sort and find the current best approximation to the Pareto front |
| Update iter←iter+1 |
| end |
| Results |
References
- Population without Access to Electricity in Sub-Saharan Africa from 2000 to 2021. Available online: https://www.statista.com/statistics/1221698/population-without-access-to-electricity-in-africa/ (accessed on 17 August 2022).
- Vendoti, S.; Muralidhar, M.; Kiranmayi, R. Techno-economic analysis of off-grid solar/wind/biogas/biomass/fuel cell/battery system for electrification in a cluster of villages by HOMER software. Environ. Dev. Sustain. 2021, 23, 351–372. [Google Scholar] [CrossRef]
- Kumar, P.P.; Saini, R.P. Optimization of an off-grid integrated hybrid renewable energy system with different battery technologies for rural electrification in India. J. Energy Storage 2020, 32, 101912. [Google Scholar] [CrossRef]
- Ramesh, M.; Saini, R.P. Dispatch strategies based performance analysis of a hybrid renewable energy system for a remote rural area in India. J. Clean. Prod. 2020, 259, 120697. [Google Scholar] [CrossRef]
- Singh, S.; Chauhan, P.; Singh, N. Capacity optimization of grid connected solar/fuel cell energy system using hybrid ABC-PSO algorithm. Int. J. Hydrogen Energy 2020, 45, 10070–10088. [Google Scholar] [CrossRef]
- Mahmoudi, S.M.; Maleki, A.; Ochbelagh, D.R. Optimization of a hybrid energy system with/without considering back-up system by a new technique based on fuzzy logic controller. Energy Convers. Manag. 2021, 229, 113723. [Google Scholar] [CrossRef]
- Jahangir, M.H.; Fakourihan, S.; Rad, M.A.V.; Dehghan, H. Feasibility study of on/off grid large-scale PV/WT/WEC hybrid energy system in coastal cities: A case-based research. Renew. Energy 2020, 162, 2075–2095. [Google Scholar] [CrossRef]
- Falama, R.Z.; Ngangoum Welaji, F.; Dadjé, A.; Dumbrava, V.; Djongyang, N.; Salah, C.B.; Doka, S.Y. A Solution to the Problem of Electrical Load Shedding Using Hybrid PV/Battery/Grid-Connected System: The Case of Households’ Energy Supply of the Northern Part of Cameroon. Energies 2021, 14, 2836. [Google Scholar]
- Ashtiani, M.N.; Toopshekan, A.; Astaraei, F.R.; Yousefi, H.; Maleki, A. Techno-economic analysis of a grid-connected PV/battery system using the teaching-learning-based optimization algorithm. Sol. Energy 2020, 203, 69–82. [Google Scholar] [CrossRef]
- Cai, W.; Li, X.; Maleki, A.; Pourfayaz, F.; Rosen, M.A.; Nazari, M.A.; Bui, D.T. Optimal sizing and location based on economic parameters for an off-grid application of a hybrid system with photovoltaic, battery and diesel technology. Energy 2020, 201, 117480. [Google Scholar] [CrossRef]
- Teo, Y.L.; Go, Y.I. Techno-economic-environmental analysis of solar/hybrid/storage for vertical farming system: A case study, Malaysian. Renew. Energy Focus 2021, 37, 50–67. [Google Scholar] [CrossRef]
- Zhang, X.; Wei, Q.S.; Soo Oh, B. Cost analysis of off-grid renewable hybrid power generation system on Ui Island, South Korea. Int. J. Hydrogen Energy 2022, 47, 13199–13212. [Google Scholar] [CrossRef]
- Jain, S.; Sawle, Y. Optimization and Comparative Economic Analysis of Standalone and Grid-Connected Hybrid Renewable Energy System for Remote Location. Front. Energy Res. 2021, 9, 724162. [Google Scholar] [CrossRef]
- Thirunavukkarasu, M.; Sawle, Y. A Comparative Study of the Optimal Sizing and Management of Off-Grid Solar/Wind/Diesel and Battery Energy Systems for Remote Areas. Front. Energy Res. 2021, 9, 752043. [Google Scholar] [CrossRef]
- Castillo-Calzadilla, T.; Macarulla, A.M.; Borges, C.E.; Kamara-Estebana, O. A case study comparison between photovoltaic and fossil generation based on direct current hybrid microgrids to power a service building. J. Clean. Prod. 2020, 244, 118870. [Google Scholar] [CrossRef]
- Castillo-Calzadilla, T.; Cuesta, M.A.; Olivares-Rodriguez, C.; Macarulla, A.M.; Legarda, J.; Borges, C.E. Is it feasible a massive deployment of low voltage direct current microgrids renewable-based? A technical and social sight. Renew. Sustain. Energy Rev. 2022, 161, 112198. [Google Scholar] [CrossRef]
- Asamoah, S.S.; Gyamfi, S.; Uba, F.; Mensah, G.S. Comparative assessment of a stand-alone and a grid-connected hybrid system for a community water supply system: A case study of Nankese community in the eastern region of Ghana. Sci. Afr. 2022, 17, e01331. [Google Scholar]
- Muh, E.; Tabet, F. Comparative analysis of hybrid renewable energy systems for off-grid applications in Southern Cameroons. Renew. Energy 2019, 135, 41–54. [Google Scholar] [CrossRef]
- Medina-Santana, A.A.; Cárdenas-Barrón, L.E. Optimal Design of Hybrid Renewable Energy Systems Considering Weather Forecasting Using Recurrent Neural Networks. Energies 2022, 15, 9045. [Google Scholar] [CrossRef]
- Zieba, F.R.; Ngangoum, W.F.; Soulouknga, H.M.; Mbakop, K.F.; Dadjé, A. Optimal Decision-Making on Hybrid Off-Grid Energy Systems for Rural and Remote Areas Electrification in the Northern Cameroon. J. Electr. Comput. Eng. 2022. [Google Scholar] [CrossRef]
- Alshammari, N.; Asumadu, J. Optimum unit sizing of hybrid renewable energy system utilizing harmony search, Jaya and particle swarm optimization algorithms. Sustain. Cities Soc. 2020, 60, 02255. [Google Scholar] [CrossRef]
- Sambhi, S.; Sharma, H.; Bhadoria, V.; Kumar, P.; Chaurasia, R.; Chaurasia, G.S.; Fotis, G.; Vita, V.; Ekonomou, L.; Pavlatos, C. Economic Feasibility of a Renewable Integrated Hybrid Power Generation System for a Rural Village of Ladakh. Energies 2022, 15, 9126. [Google Scholar] [CrossRef]
- Agua, O.F.B.; Basilio, R.J.A.; Pabillan, M.E.D.; Castro, M.T.; Blechinger, P.; Ocon, J.D. Decentralized versus Clustered Microgrids: An Energy Systems Study for Reliable Off-Grid Electrification of Small Islands. Energies 2020, 13, 4454. [Google Scholar] [CrossRef]
- Falama, R.Z.; Bakari, H.; Dumbrava, V. Double-objective optimization based firefly algorithm of a stand-alone photovolta-ic/water pumping system for water supply in rural and remote areas: A case study. J. Electr. Syst. Inf. Technol. 2021, 8, 1–25. [Google Scholar]
- Samy, M.M.; Mosaad, M.I.; Barakat, S. Optimal economic study of hybrid PV-wind-fuel cell system integrated to unreliable electric utility using hybrid search optimization technique. Int. J. Hydrogen Energy 2021, 46, 11217–11231. [Google Scholar] [CrossRef]
- Falama, R.Z.; Saidi, A.S.; Soulouknga, M.H.; Salah, C.B. A techno-economic comparative study of renewable energy systems based different storage devices. Energy 2023, 266, 126411. [Google Scholar] [CrossRef]
- Javed, M.S. Performance comparison of heuristic algorithms for optimization of hybrid off-grid renewable energy systems. Energy 2020, 210, 118599. [Google Scholar] [CrossRef]
- Hossain, M.A.; Ahmed, A.; Tito, S.R.; Ahshan, R.; Sakib, T.H.; Nengroo, S.H. Multi-Objective Hybrid Optimization for Optimal Sizing of a Hybrid Renewable Power System for Home Applications. Energies 2023, 16, 96. [Google Scholar] [CrossRef]
- Falama, R.Z.; Menga, F.D.; Hamda Soulouknga, M.; Kwefeu Mbakop, F.; Ben Salah, C. A case study of an optimal detailed analysis of a standalone Photovoltaic/Battery system for electricity supply in rural and remote areas. Int. Trans. Electr. Energy Syst. 2022, 12, 7132589. [Google Scholar]
- Islam, Q.N.U.; Ahmed, A. Optimized controller design for islanded microgrid employing nondominated sorting firefly algorithm. In Nature-Inspired Computation and Swarm Intelligence; Academic Press: Cambridge, MA, USA, 2020; pp. 247–272. [Google Scholar]
- Chaves-González, J.M.; Vega-Rodríguez, M.A. A multiobjective approach based on the behavior of fireflies to generate reliable DNA sequences for molecular computing. Appl. Math. Comput. 2014, 227, 291–308. [Google Scholar] [CrossRef]
- Where Is Ngaoundere, Cameroon? Available online: https://www.worldatlas.com/af/cm/ad/where-is-ngaoundere.html (accessed on 17 August 2022).
- European Commission. Photovoltaic Geographical Information System. Available online: https://re.jrc.ec.europa.eu/pvg_tools/fr/#PVP (accessed on 7 February 2021).
- National Renewable Energy Laboratory (NREL). The Hybrid Optimization Model for Electric Renewables (HOMER); National Renewable Energy Laboratory (NREL): Golden, CO, USA, 2022. [Google Scholar]
- Yang, X.S. Firefly Algorithms for Multimodal Optimization. In International Symposium on Stochastic Algorithms; Springer: Berlin/Heidelberg, Germany, 2009; pp. 169–178. [Google Scholar]
- Yang, X.S. Multiobjective firely algorithm for continuous optimization. Eng. Comput. 2013, 29, 175–184. [Google Scholar] [CrossRef]
- Soulouknga, M.H.; Doka, S.Y.; Revanna, N.; Djongyang, N.; Kofane, T.C. Analysis of wind speed data and wind energy potential in Faya-Largeau, Chad, using Weibull distribution. Renew. Energy 2018, 121, 1–8. [Google Scholar] [CrossRef]
- Rezaei, M.; Khalilpour, K.R.; Mohamed, A.M. Co-production of electricity and hydrogen from wind: A comprehensive scenario-based technoeconomic analysis. Int. J. Hydrogen Energy 2021, 46, 18242–18256. [Google Scholar]
- Shaban, A.H.; Resen, A.K.; Bassil, N. Weibull parameters evaluation by different methods for windmills. Energy Rep. 2020, 6, 188–199. [Google Scholar] [CrossRef]
- Ali, S.A.; Mohammad, F.N.T.; Mohd, R.A.; Mohd, F.M.; Makbul, A.M.R. Feasibility analysis of grid-connected and islanded operation of a solar PV microgrid system: A case study of Iraq. Energy 2020, 191, 116591. [Google Scholar]
- Poly-Crystalline Solar Module/120 Cells/Premium HC Series SEP 290W/295W/300W HC. Available online: https://sunceco.com/sep-290-300w-hc/ (accessed on 16 August 2022).
- Falama, R.Z.; Kaoutoing, M.D.; Mbakop, F.K.; Dumbrava, V.; Makloufi, S.; Djongyang, N.; Salah, C.B.; Doka, S.Y. A comparative study based on a techno-environmental-economic analysis of some hybrid grid-connected systems operating under electricity blackouts: A case study in Cameroon. Energy Convers. Manag. 2022, 251, 114935. [Google Scholar] [CrossRef]
- Ismail, M.S.; Moghavvemi, M.; Mahli, T.M.I. Design of an optimized photovoltaic and microturbine hybrid power system for a remote small community: Case study of Palestine. Energy Convers. Manag. 2013, 75, 271–281. [Google Scholar] [CrossRef]
- NREL. Life Cycle Greenhouse Gas Emissions from Solar Photovoltaics. 2021. Available online: https://www.nrel.gov/docs/fy13osti/56487.pdf (accessed on 31 May 2021).
- Raum Energy 3.5. Available online: https://fr.wind-turbine-models.com/turbines/1071-raum-energy-3.5#datasheet (accessed on 16 August 2022).
- Kaabeche, A.; Diaf, S.; Ibtiouen, R. Firefly-inspired algorithm for optimal sizing of renewable hybrid system considering reliability criteria. Sol. Energy 2017, 155, 727–738. [Google Scholar] [CrossRef]
- Dufo-López, R.; Bernal-Agustín, J.L.; Yusta-Loyo, J.M.; Domínguez-Navarro, J.A.; Ramírez-Rosado, I.J.; Lujano, J.; Aso, I. Multi-objective optimization minimizing cost and life cycle emissions of stand-alone PV–wind–diesel systems with batteries storage. Appl. Energy 2011, 88, 4033–4041. [Google Scholar] [CrossRef]
- Jahangiri, M.; Soulouknga, M.H.; Bardei, F.K.; Shamsabadi, A.A.; Akinlabi, E.T.; Sichilalu, S.M.; Mostafaeipour, A. Techno-econo-environmental optimal operation of grid-wind-solar electricity generation with hydrogen storage system for domestic scale, case study in Chad. Int. J. Hydrogen Energy 2019, 44, 28613–28628. [Google Scholar] [CrossRef]
- Tamba, T.G.; Koffi, F.D.; Monkam, L.; Ngoh, S.K.; Biobiongono, S.N. Carbon dioxide emissions from thermal power plants in Cameroon: A case study in Dibamba Power Development Company. Low Carbon Econ. 2013, 4, 35. [Google Scholar] [CrossRef]
- Kasaeian, A.; Rahdan, P.; Rad, M.A.V.; Yan, W.M. Optimal design and technical analysis of a grid-connected hybrid photovoltaic/diesel/biogas under different economic conditions: A case study. Energy Convers. Manag. 2019, 198, 111810. [Google Scholar] [CrossRef]


| System Configuration | Components | |||||
|---|---|---|---|---|---|---|
| Grid-PV/Wind/Battery | Grid | PV generator | Wind turbine | Battery | Bidirectional inverter | Load |
| Grid-PV/Battery | Grid | PV generator | - | Battery | Bidirectional inverter | Load |
| Grid-Wind/Battery | Grid | - | Wind turbine | Battery | Bidirectional inverter | Load |
| Grid-Wind | Grid | - | Wind turbine | - | - | Load |
| PV/Wind/Battery | - | PV generator | Wind turbine | Battery | Bidirectional inverter | Load |
| PV/Battery | - | PV generator | - | Battery | Inverter | Load |
| Wind/Battery | - | - | Wind turbine | Battery | Bidirectional inverter | Load |
| Wind | - | - | Wind turbine | - | - | Load |
| Month | Wind Speed (m/s) | Irradiation (kWh/m2) | Ambient Temperature (°C) |
|---|---|---|---|
| Jan. | 4.32 | 7.53 | 23.4 |
| Feb. | 4.35 | 7.37 | 25.6 |
| Mar. | 4.72 | 5.83 | 26.2 |
| Apr. | 4.9 | 6.11 | 24.5 |
| May | 4.59 | 5.47 | 22.8 |
| Jun. | 3.97 | 5.06 | 21.6 |
| Jul. | 3.67 | 4.73 | 20.9 |
| Aug. | 3.56 | 5.11 | 20.8 |
| Sept. | 3.32 | 5.02 | 21.4 |
| Oct. | 3.58 | 5.83 | 22.7 |
| Nov. | 4.01 | 6.47 | 24.3 |
| Dec. | 4.45 | 6.31 | 23.4 |
| Designation | Value |
|---|---|
| PV specifications | |
| PV module | SEP 290W/295W/300W HC [41] |
| PV rated power | 300 W |
| Initial investment | 1500 USD/kW [42] |
| Replacement | 1500 USD/kW |
| O and M | 1% of investment/year [43] |
| Component lifetime (years) | 25 |
| CO2 emissions | 40 gCO2/kWh [44] |
| Wind turbine specifications | |
| Type | Raum Energy 3.5 [45] |
| Rated power | 3.5 kW |
| Hub height | 14.5 m |
| Rated wind speed | 16 m/s |
| Cut-in wind speed | 4 m/s |
| Cut-off wind speed | 25 m/s |
| Initial investment | 3000 USD/kW [46] |
| Replacement | 3000 USD/kW |
| O and M | 3% of investment/year [46] |
| Component lifetime (years) | 20 |
| CO2 emissions | 11 g/kWh [21] |
| Battery specifications | |
| Efficiencies of charge and discharge | 85% |
| DOD | 80% |
| Minimum SOC | 20% |
| Initial investment | 0.213 USD/Wh [46] |
| Replacement | 0.213 USD/Wh |
| O and M | 3% of investment/year [46] |
| Component lifetime (years) | 25 |
| CO2 emissions | 55.3 kgCO2/kWh [47] |
| Inverter (or Rectifier) specifications | |
| Efficiency | 95% [4] |
| Inverter utilization factor | 1 |
| Initial investment | 715 USD/kW [42,43] |
| Replacement | 715 USD/kW |
| O and M | 100 USD/year [48] |
| Component lifetime (year) | 15 |
| Grid specifications | |
| CO2 emissions | 660.63 g/kWh [7,49,50] |
| Financial specifications | |
| Nominal interest rate | 8% |
| Value of annual inflation rate | 4% |
| Project lifetime | 25 years |
| Scenario | PSDP (%) | XPV | XWT | Xbatt | PV Capacity (kW) | WT Capacity (kW) | Battery Capacity (kWh) | Inverter Power (kW) |
|---|---|---|---|---|---|---|---|---|
| Grid-PV/Wind/Battery | 0 | 80 | 1 | 0.85 | 24 | 3.5 | 118.6086 | 11.8 |
| Grid-PV/Battery | 0 | 75 | - | 1.09 | 22.5 | - | 195.0434 | 11.8 |
| Grid-Wind/Battery | 0 | - | 17 | 0.84 | - | 59.5 | 115.8342 | 11.8 |
| Grid-Wind | 0 | - | 56 | - | - | 196 | - | 11.8 |
| PV/Wind/Battery | 0 | 91 | 2 | 1 | 27.3 | 7 | 164.1641 | 11.8 |
| PV/Battery | 0 | 93 | - | 1.38 | 27.9 | - | 312.6341 | 11.8 |
| Wind/Battery | 0 | - | 21 | 1.075 | - | 73.5 | 189.7121 | 11.8 |
| Wind | 0 | - | 69 | - | - | 241.5 | - | 11.8 |
| Scenario | EPV (kWh) | EWT (kWh) | EG (kWh) | Es (kWh) | Es_cons (kWh) | Esurplus (kWh) | EB (kWh) | Eexcess (kWh) |
|---|---|---|---|---|---|---|---|---|
| Grid-PV/Wind/Battery | 50,850 | 2136.3 | 7741.7 | 60,728 | 21,324 | 39,404 | 17,384 | 22,019 |
| Grid-PV/Battery | 47,671.3 | - | 7741.7 | 55,413 | 19,948 | 35,465 | 18,760 | 16,705 |
| Grid-Wind/Battery | - | 36,318 | 7741.7 | 44,060 | 31,013 | 13,047 | 7695.3 | 5351.5 |
| Grid-Wind | - | 119,640 | 7741.7 | 127,381.7 | 38,708 | 88,670 | - | 88,670 |
| PV/Wind/Battery | 57,841.3 | 4272.7 | - | 62,114 | 17,779 | 44,335 | 20,929 | 23,406 |
| PV/Battery | 59,113 | - | - | 59,113 | 15,245 | 43,868 | 23,464 | 20,404 |
| Wind/Battery | - | 44,864 | - | 44,864 | 28,938 | 15,925.6 | 9770.3 | 6155.3 |
| Wind | - | 147,410 | - | 147,410 | 38,708 | 108,700 | - | 108,700 |
| Scenario | EPV/Es (%) | EWT/Es (%) | EG/Es (%) |
|---|---|---|---|
| Grid-PV/Wind/Battery | 83.73 | 3.52 | 12.75 |
| Grid-PV/Battery | 86.03 | - | 13.97 |
| Grid-Wind/Battery | - | 82.43 | 17.57 |
| Grid-Wind | - | 93.92 | 6.08 |
| PV/Wind/Battery | 93.12 | 6.88 | - |
| PV/Battery | 100 | - | - |
| Wind/Battery | - | 100 | - |
| Wind | - | 100 | - |
| Scenario | Es_cons/Es (%) | EB/Es (%) | Eexcess/Es (%) |
|---|---|---|---|
| Grid-PV/Wind/Battery | 35.11 | 28.63 | 36.26 |
| Grid-PV/Battery | 36 | 33.85 | 30.15 |
| Grid-Wind/Battery | 70.38 | 17.47 | 12.15 |
| Grid-Wind | 30.39 | - | 69.61 |
| PV/Wind/Battery | 28.63 | 33.69 | 37.68 |
| PV/Battery | 25.79 | 39.69 | 34.52 |
| Wind/Battery | 64.50 | 21.78 | 13.72 |
| Wind | 26.26 | - | 73.74 |
| Scenario | ED (kWh) | Es_cons/ED (%) | EB/ED (%) |
|---|---|---|---|
| Grid-PV/Wind/Battery | 38,708 | 55.09 | 44.91 |
| Grid-PV/Battery | 38,708 | 51.54 | 48.46 |
| Grid-Wind/Battery | 38,708 | 80.12 | 19.88 |
| Grid-Wind | 38,708 | 100 | - |
| PV/Wind/Battery | 38,708 | 45.93 | 54.07 |
| PV/Battery | 38,708 | 39.38 | 60.62 |
| Wind/Battery | 38,708 | 74.76 | 25.24 |
| Wind | 38,708 | 100 | - |
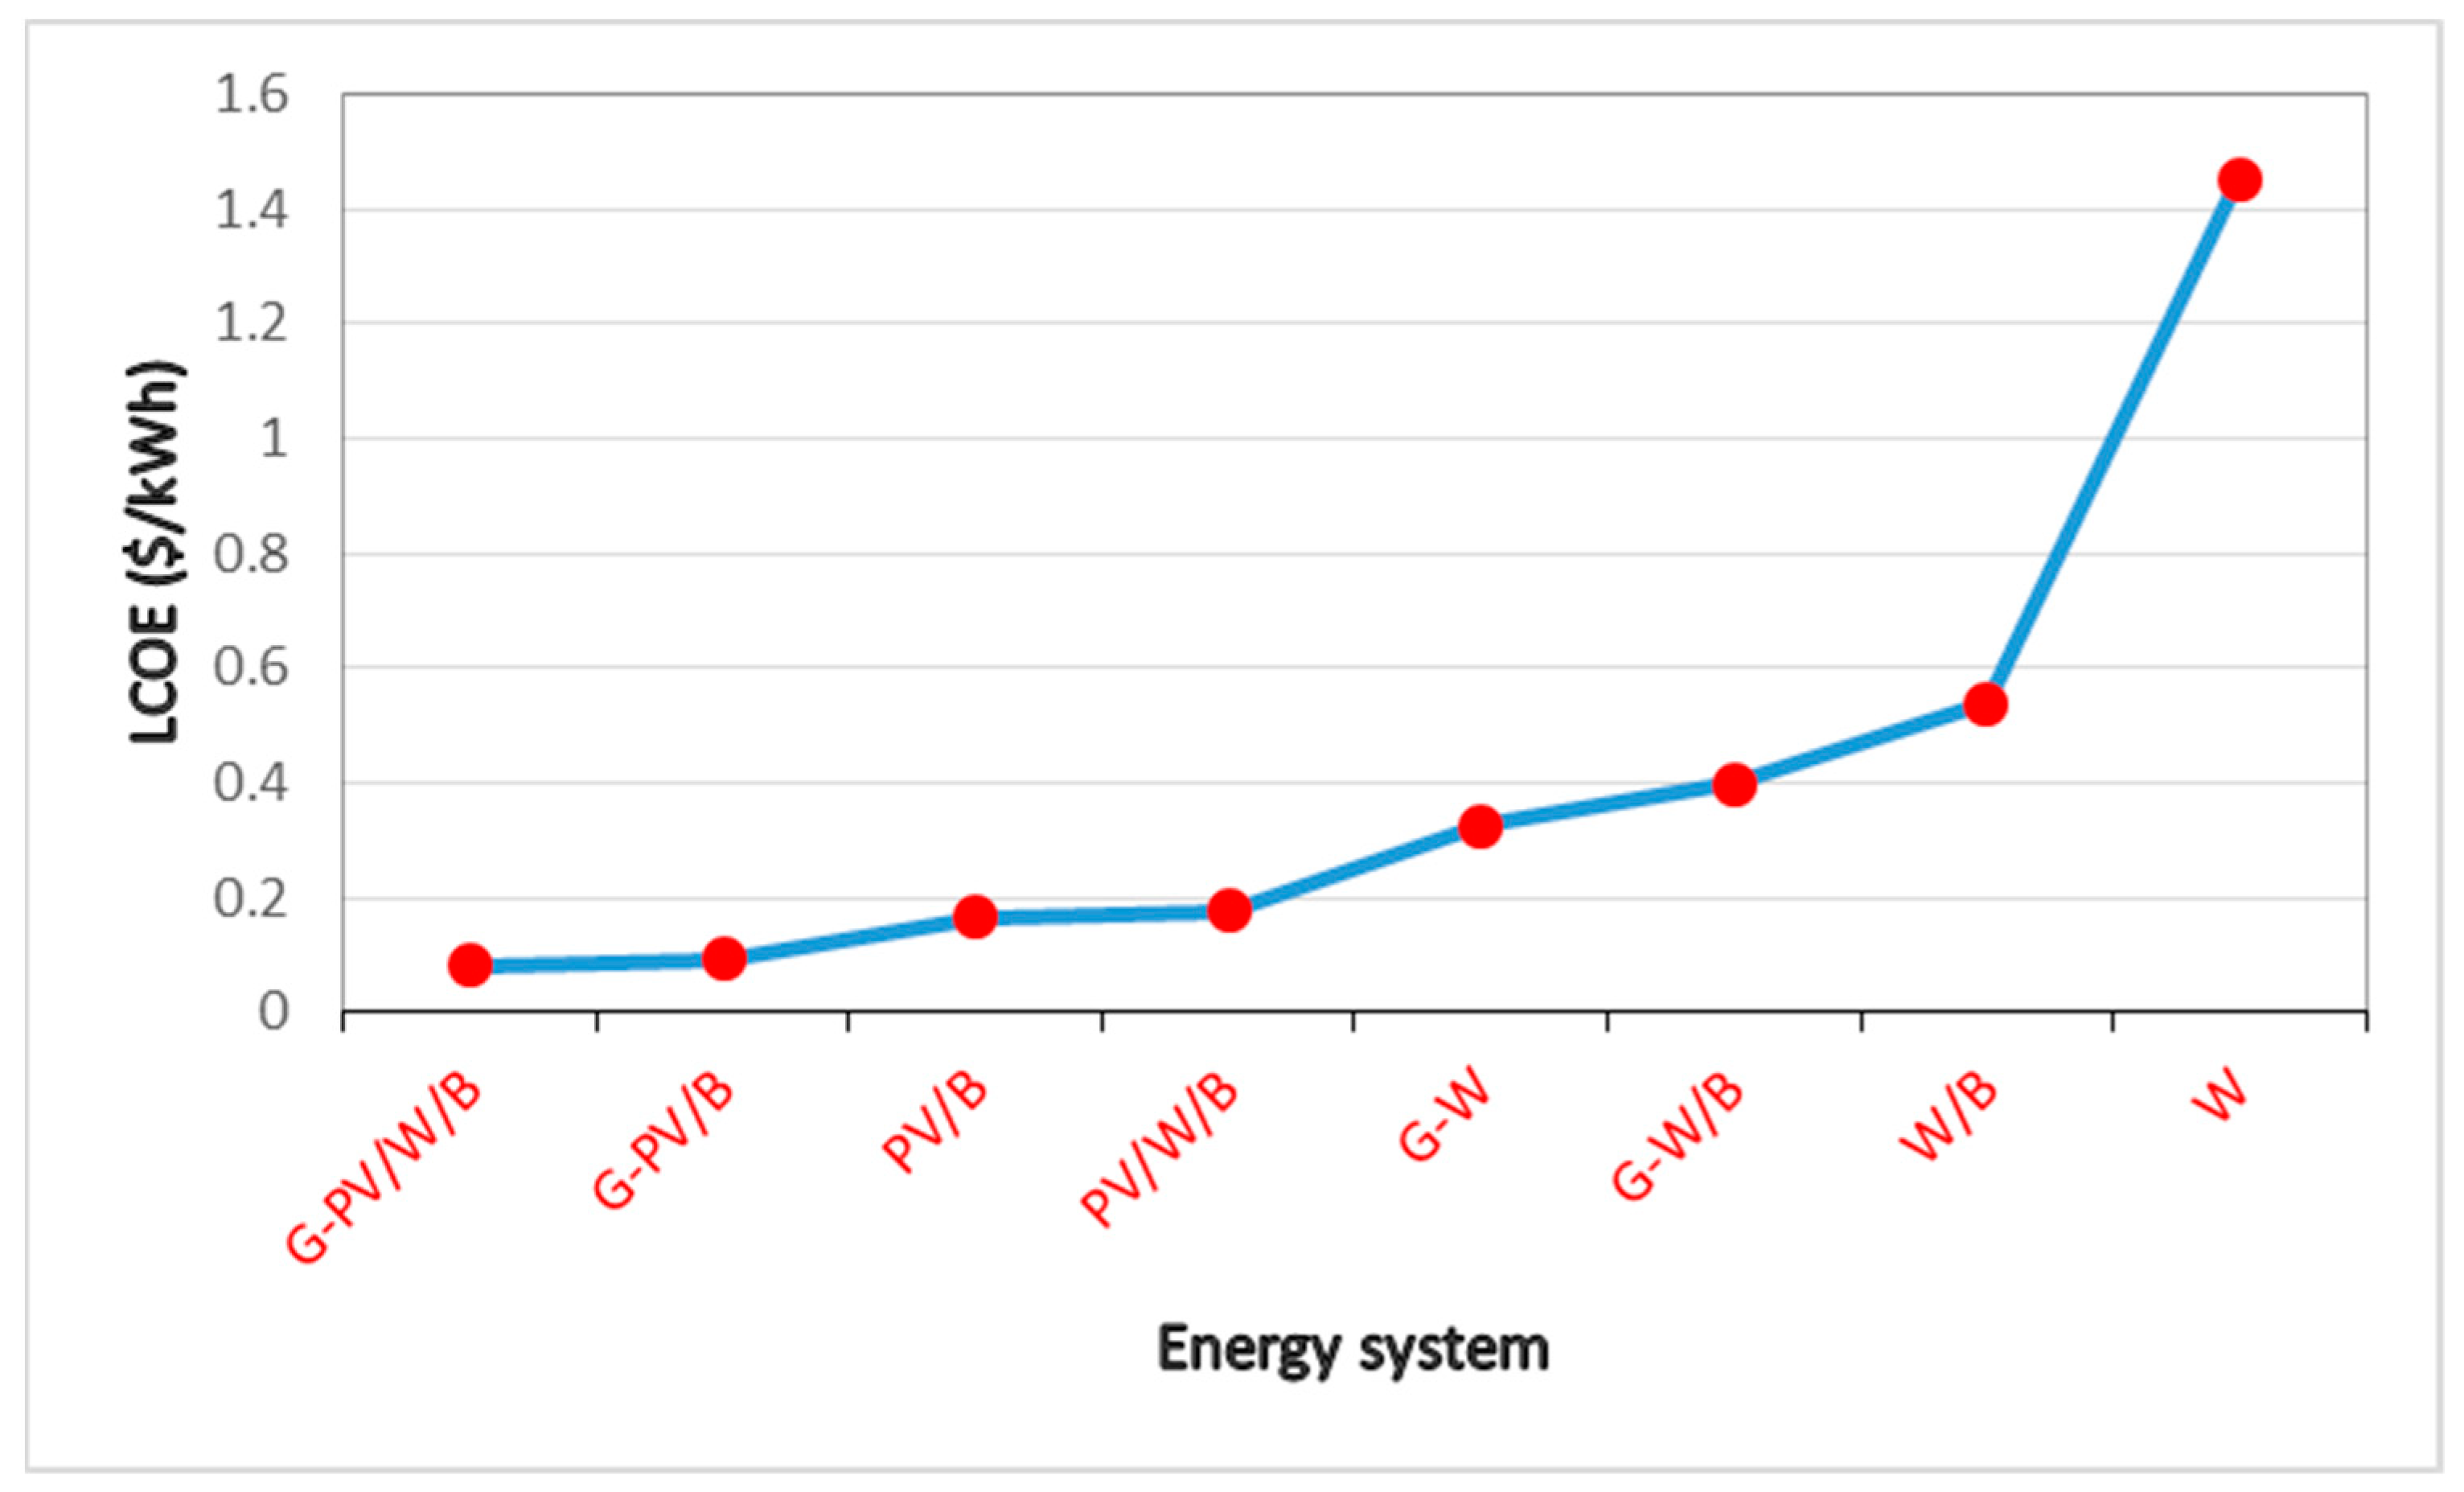
| Scenario | CostPV (USD) | CostWT (USD) | CostBatt (USD) | CostInverter (USD) | Renew NPC (USD) | Total LCOE (USD/kWh) |
|---|---|---|---|---|---|---|
| Grid-PV/Wind/Battery | 19,950 | 12,755 | 40,395 | 12,064 | 85,164 | 0.0819 |
| Grid-PV/Battery | 18,703 | - | 51,801 | 12,064 | 82,568 | 0.0925 |
| Grid-Wind/Battery | - | 216,840 | 39,920 | 12,064 | 268,824 | 0.3979 |
| Grid-Wind | - | 714,300 | - | 12,064 | 726,364 | 0.3251 |
| PV/Wind/Battery | 22,693 | 25,511 | 47,523 | 12,064 | 107,791 | 0.1754 |
| PV/Battery | 23,192 | - | 65,582 | 12,064 | 100,838 | 0.1641 |
| Wind/Battery | - | 267,860 | 51,088 | 12,064 | 331,012 | 0.5385 |
| Wind | - | 880,120 | - | 12,064 | 885,670 | 1.4515 |
| Scenario | CostPV/NPC (%) | CostWT/NPC (%) | CostBatt/NPC (%) | CostInverter/NPC (%) |
|---|---|---|---|---|
| Grid-PV/Wind/Battery | 23.43 | 14.98 | 47.43 | 14.17 |
| Grid-PV/Battery | 22.65 | - | 62.74 | 14.61 |
| Grid-Wind/Battery | - | 80.66 | 14.85 | 4.79 |
| Grid-Wind | - | 98.34 | - | 1.66 |
| PV/Wind/Battery | 21.05 | 23.67 | 44.09 | 11.19 |
| PV/Battery | 23 | - | 65.04 | 11.96 |
| Wind/Battery | - | 80.92 | 15.43 | 3.64 |
| Wind | - | 98.65 | - | 1.35 |
| Scenario | PV (kgCO2/y) | WT (kgCO2/y) | Battery (kgCO2/y) | Grid (kgCO2/y) | Total (kgCO2/y) |
|---|---|---|---|---|---|
| Grid-PV/Wind/Battery | 2034 | 23.5 | 7716.5 | 5114.4 | 14,888.4 |
| Grid-PV/Battery | 1906.9 | - | 9895.3 | 5114.4 | 16,916.6 |
| Grid-Wind/Battery | - | 399.5 | 7625.8 | 5114.4 | 13,139.7 |
| Grid-Wind | - | 1316 | - | 5114.4 | 6430.4 |
| PV/Wind/Battery | 2313.7 | 47 | 9078.3 | - | 11,439 |
| PV/Battery | 2364.5 | - | 12,528 | - | 14,892.5 |
| Wind/Battery | - | 493.5 | 9759.1 | - | 10,252.6 |
| Wind | - | 1621.5 | - | - | 1621.5 |
| Scenario | Grid Factor | LCOE | XPV | XWT | Xbatt | PV Capacity (kW) | WT Capacity (kW) | Battery Capacity (kWh) | Inverter Power (kW) |
|---|---|---|---|---|---|---|---|---|---|
| Grid-PV/Wind/Battery | 0.2 | 0.0819 | 80 | 1 | 0.85 | 24 | 3.5 | 118.6086 | 11.8 |
| 0.4 | 0.1081 | 53 | 1 | 0.69 | 15.9 | 3.5 | 113.2732 | 11.8 | |
| 0.6 | 0.1262 | 33 | 1 | 0.49 | 9.9 | 3.5 | 80.4404 | 11.8 | |
| 0.8 | 0.1241 | 18 | 1 | 0.12 | 5.4 | 3.5 | 19.6997 | 11.8 | |
| 1 | 0.1185 | - | - | - | - | - | - | - | |
| Grid-PV/Battery | 0.2 | 0.0925 | 75 | - | 1.09 | 22.5 | - | 195.0434 | 11.8 |
| 0.4 | 0.0996 | 57 | - | 0.812 | 17.1 | - | 108.2406 | 11.8 | |
| 0.6 | 0.1106 | 38 | - | 0.55 | 11.4 | - | 49.6596 | 11.8 | |
| 0.8 | 0.1188 | 21 | - | 0.28 | 6.3 | - | 12.8705 | 11.8 | |
| 1 | 0.1185 | - | - | - | - | - | - | - | |
| Grid-Wind/Battery | 0.2 | 0.3979 | - | 17 | 0.84 | - | 59.5 | 115.8342 | 11.8 |
| 0.4 | 0.3367 | - | 13 | 0.6 | - | 45.5 | 59.0991 | 11.8 | |
| 0.6 | 0.3035 | - | 8 | 0.8 | - | 28 | 105.0650 | 11.8 | |
| 0.8 | 0.2058 | - | 5 | 0.1 | - | 17.5 | 1.6416 | 11.8 | |
| 1 | 0.1185 | - | - | - | - | - | - | - | |
| Grid-Wind | 0.2 | 0.3251 | - | 56 | - | - | 196 | - | 11.8 |
| 0.4 | 0.3079 | - | 42 | - | - | 147 | - | 11.8 | |
| 0.6 | 0.2815 | - | 28 | - | - | 98 | - | 11.8 | |
| 0.8 | 0.2359 | - | 14 | - | - | 49 | - | 11.8 | |
| 1 | 0.1185 | - | - | - | - | - | - | - |
| Scenario | Grid Factor | Renewable Energy Penetration (%) | CO2 Emissions (kgCO2/Year) |
|---|---|---|---|
| Grid-PV/Wind/Battery | 0.2 | 80 | 14,888.4 |
| 0.4 | 60 | 17,864 | |
| 0.6 | 40 | 20,654 | |
| 0.8 | 20 | 22,028 | |
| 1 | 0 | 25,572 | |
| Grid-PV/Battery | 0.2 | 80 | 16,916.6 |
| 0.4 | 60 | 19,050 | |
| 0.6 | 40 | 21,302 | |
| 0.8 | 20 | 23,533 | |
| 1 | 0 | 25,572 | |
| Grid-Wind/Battery | 0.2 | 80 | 13,139.7 |
| 0.4 | 60 | 15,981 | |
| 0.6 | 40 | 22,794 | |
| 0.8 | 20 | 21,483 | |
| 1 | 0 | 25,572 | |
| Grid-Wind | 0.2 | 80 | 6430.4 |
| 0.4 | 60 | 11,216 | |
| 0.6 | 40 | 16,001 | |
| 0.8 | 20 | 20,786 | |
| 1 | 0 | 25,572 |
| Scenario | Reliability (%) | Energy Cost (USD/kWh) | CO2 Emissions (kg/Year) | Grid CO2 Emissions Reduction (%) | Grid Energy Cost Reduction (%) | Energy Losses (%) | Main Renewable Energy Source | Energy Storage Capacity Requested |
|---|---|---|---|---|---|---|---|---|
| Grid-PV/WB | 100 | 0.0819 | 14,888.4 | 41.78 | 30.89 | 0 | PV | Higher |
| Grid-PV/B | 100 | 0.0925 | 16,916.6 | 33.85 | 21.94 | 0 | PV | Higher |
| Grid-W/B | 100 | 0.3979 | 13,139.7 | 48.62 | 0 | 0 | Wind | Lower |
| Grid-W | 100 | 0.3251 | 6430.4 | 74.85 | 0 | 0 | Wind | Lower |
| PV/W/B | 100 | 0.1754 | 11,439 | 55.27 | 0 | 37.68 | PV | Higher |
| PV/B | 100 | 0.1641 | 14,892.5 | 41.76 | 0 | 34.52 | PV | Higher |
| W/B | 100 | 0.5385 | 10,252.6 | 59.91 | 0 | 13.72 | Wind | Lower |
| W | 100 | 1.4515 | 1621.5 | 93.66 | 0 | 73.74 | Wind | Lower |
| Only grid (εG = 1) | 100 | 0.11858 | 25,572 | - | - | - | - | - |
Disclaimer/Publisher’s Note: The statements, opinions and data contained in all publications are solely those of the individual author(s) and contributor(s) and not of MDPI and/or the editor(s). MDPI and/or the editor(s) disclaim responsibility for any injury to people or property resulting from any ideas, methods, instructions or products referred to in the content. |
© 2023 by the authors. Licensee MDPI, Basel, Switzerland. This article is an open access article distributed under the terms and conditions of the Creative Commons Attribution (CC BY) license (https://creativecommons.org/licenses/by/4.0/).
Share and Cite
Falama, R.Z.; Dumbrava, V.; Saidi, A.S.; Houdji, E.T.; Salah, C.B.; Doka, S.Y. A Comparative-Analysis-Based Multi-Criteria Assessment of On/Off-Grid-Connected Renewable Energy Systems: A Case Study. Energies 2023, 16, 1540. https://doi.org/10.3390/en16031540
Falama RZ, Dumbrava V, Saidi AS, Houdji ET, Salah CB, Doka SY. A Comparative-Analysis-Based Multi-Criteria Assessment of On/Off-Grid-Connected Renewable Energy Systems: A Case Study. Energies. 2023; 16(3):1540. https://doi.org/10.3390/en16031540
Chicago/Turabian StyleFalama, Ruben Zieba, Virgil Dumbrava, Abdelaziz Salah Saidi, Etienne Tchoffo Houdji, Chokri Ben Salah, and Serge Yamigno Doka. 2023. "A Comparative-Analysis-Based Multi-Criteria Assessment of On/Off-Grid-Connected Renewable Energy Systems: A Case Study" Energies 16, no. 3: 1540. https://doi.org/10.3390/en16031540