Article

Utilizing Thermal Energy for Crosslinking Gels: A Novel Rapid Approach

by
Ahmed Awadallah-F
and
Shaheen A. Al-Muhtaseb
*
Department of Chemical Engineering, Qatar University, Doha P.O. Box 2713, Qatar
*
Author to whom correspondence should be addressed.
Current Address: Radiation Research of Polymer Department, National Centre for Radiation Research and Technology, Egyptian Atomic Energy Authority, Cairo 11787, Egypt.
Energies 2023, 16(3), 1447; https://doi.org/10.3390/en16031447
Submission received: 10 January 2023 / Revised: 25 January 2023 / Accepted: 27 January 2023 / Published: 1 February 2023

Abstract

:
A novel route was invented for utilizing thermal energy (at an elevated temperature of 110 ± 2 °C) to synthesize and crosslink gels from resorcinol and formaldehyde without using catalysts or buffers. The outcome gels are identified by various techniques such as Fourier transform infrared, Raman spectroscopy, thermal gravimetric analysis, X-ray diffraction, nano-scanning electron microscopy, energy-dispersive X-ray spectroscopy and surface area and porosity analyses. Resorcinol–formaldehyde gels prepared by this approach are also carbonized and activated to study their subsequent activated carbons. The gels and their corresponding activated carbons expose hierarchical pore structures with micro-, meso- and macroporous features. The average pore sizes of gels and activated carbons ranged from 3.5 to 62.9 nm and from 0.9 to 2.0 nm, respectively. The total surface areas of gels and activated carbons ranged from 0.01 to 176.15 and from 160.93 to 511.46 m2/g, respectively. Moreover, the total pore volumes of gels and activated carbons ranged from 0 to 0.546 and from 0.086 to 0.366 cm3/g, respectively. The results refer to how this novel approach could be used in the synthesis of resorcinol–formaldehyde gels in particular, and might be used in the synthesis of other gels in general. Due to the absence of added catalysts or buffers, this approach yields clean products that can be valuable in various sensitive applications such as biomaterials and pharmaceuticals, which require no impurities from extra reacting species.

1. Introduction

Organic and carbon gels (i.e., xerogels, aerogels and cryogels) were introduced by Pekala and his coworkers about three decades ago [1,2]. These gels feature nanoporous structures, which make them convenient for diversified applications. The method of drying these gels has a strong effect on the outcome pore structures, pore size formations and their geometry a well. There are three fundamental techniques of gel drying; supercritical, freezing and evaporative. After carbonizing the resultant gels by these drying methods, the emerging products are named after their precursors as carbon aerogel, carbon cryogel or carbon xerogel, accordingly [3].
Resorcinol and formaldehyde are common reactants for gel formation and their subsequent carbon gels [4]. Resorcinol–formaldehyde (RF) gels are synthesized conventionally by using water as an aqueous medium with buffers (to adjust the pH level of the starting solution) and sodium carbonate (Na2CO3) as a catalyst to initiate the reaction and increase the reaction rate [5]. Other catalysts were also used to prepare RF gels such as NaOH [6], HClO4 [7], Li2CO3 [7], K2CO3 [8], PdCl2 [8], Pt[(NH3)4]Cl2 [8] and AgOOC-CH3 [8]. Nonetheless, Na2CO3 is the most commonly utilized alkaline catalyst for initiating the polymerization reaction of R with F. This catalyst activates a small portion of R to promote the growth of the monomer molecules [9]. Nonetheless, when the desire is to insert certain transition metals (e.g., Pt, Pd or Ag) in the structure of the produced RF gels or carbon gels, different salts of these metals (e.g., [Pt(NH3)4]Cl2dCl2 or AgOOC-CH3) are utilized as catalysts [10,11]. These metals enhance the meso- and macropore volumes; the highest possible total pore volumes were obtained when using small concentrations of Pt [10]. Furthermore, dilute acidic solutions of catalyst (e.g., HClO4 or HNO3) could be utilized. In the case of low concentrations of RF, this leads to small, smooth, fractal clusters of gel particles with broad pore size distributions (PSDs) [7,12]. On the contrary, when utilizing an acidic solution of catalyst with high concentrations of RF, the fractal clusters are no longer seen and very narrow PSDs (6 ± 7 nm) are attained [7].
The amazing properties of RF gels (such as high porosity, high surface area, low density and chemical resistance) make these materials promising for different applications because of the likelihood of controlling their features via controlling their synthesis conditions [13]. Moreover, their high specific surface areas and electric conductivity make these materials good candidates to produce electrodes for super-capacitors, batteries or fuel cells [14], gas filters [15], thermal insulators [16], adsorbents [17], catalysts [18], photo-catalysts [19], hydrogen storage devices [20], column packing materials for high-performance liquid chromatography [21], biomaterials [22], drug delivery systems [23], molds for casting [24], aero-capacitors [25], heat storage devices for automobiles, etc. [26].
Because of the tedious measures of supercritical and freeze-drying steps applied in the conventional synthesis of aerogels and cryogels, the markets of these gels and their subsequent activated carbons are very limited [27]. Therefore, there is a big challenge to downsize their manufacturing costs either by reducing reactants or by replacing the supercritical and freeze-drying methods by a solvent exchange process at ambient pressure. Although the solvent exchange and ambient pressure drying technique is cheap and easy, serious defects in the resulting gels’ structures occur during the evaporation process. This leads to shrink the pore sizes, which appear as pseudo pore sizes when identified with convenient techniques. The traditional method of producing xerogels, aerogels or cryogels and their activated carbons that is reported in the literature includes specific steps. These steps include the (i) synthesis process, in which the gelation and curing reactions occur to produce wet gels; (ii) drying process, in which the excess solvent is eliminated from wet gel to attain a dry gel; (iii) carbonization process to prepare carbon gels; and (iv) activation process to produce activated carbon gels [28,29]. The conventional polymerization reaction between resorcinol and formaldehyde precursors necessitates the regulation of the acidity of the starting solution (by adding buffers) and the addition of a catalyst. In order to augment the reaction rate, it is indispensable to heat up the precursor medium. The most widely utilized process involves heating to a high temperature, not exceeding 100 °C (to prevent the precursor aqueous medium from boiling). This traditional process requires several days for the synthesis step to be complete. Further, several solvent exchange steps are needed in the conventional drying techniques. These parameters are deemed among the main obstacles for the implementation of this process on the production scale. As a result, research in this area is conducted to develop easier, faster and cheaper approaches of gel synthesis for the purpose of making them more attractive and competitive than other commercial materials [30].
This work is based on a novel approach that utilizes thermal energy to reach the melting temperature of the reactants involved into the reaction media [31]. This novel approach aims to produce resorcinol–formaldehyde gels at a fast rate of production, without including any extra chemical species or additives to accomplish the reaction. This is for the purpose of reducing the cost of production and making the products friendlier to the environment. This novel thermal approach can ease the production process on mass scale, save time and effort, reduce cost and increase the production rate. Further, this work will widen the gate of applications of the corresponding gels. RF gels are prepared in different compositions of the main reactants (resorcinol and formaldehyde). Moreover, the produced RF gels and their subsequent activated carbons are characterized by different techniques to confirm their structures and compositions. Further, the pore structures of these gels and their subsequent activated carbons are investigated.

2. Materials and Methods

2.1. Materials

Resorcinol (purity 99%) and formaldehyde (37 wt.% in H2O) are purchased from Sigma-Aldrich (Taufkirchen, Germany). Nitrogen and carbon dioxide gases (grade 5, purity 99.999%) are supplied from National Industrial Gas Plants (NIGP; Doha, Qatar). All materials are used as received without further purification.

2.2. Methods

The overall method of synthesis consists mainly of preparing the initial solution of reactants, polymerization reaction to produce the gels at elevated temperature, cooling and drying of the gels, and carbonization and activation to produce activated carbon gels. The overall synthesis route is presented in Figure 1, and the steps are detailed in Section 2.3 and Section 2.4.

2.3. Synthesis of Gels

Gels are prepared from resorcinol (R) and formaldehyde (F) [2,5,31,32]. The outcome RF gel (denoted as RFGn) samples and the subsequent activated carbon (denoted as RFGn-AC) samples were suffixed with numbers (n) indicating the recipe of R and F reactant quantities and molar ratios of R-to-F and resorcinol-to-water (R-to-W) as listed in Table 1. Note that water is involved here as the coherent co-ingredient of the received formaldehyde solution. In other words, no additional water was added to the main ingredients (solid resorcinol and formaldehyde solution). Resorcinol (12.44 g) is added to the prescribed volume of formaldehyde solution (Table 1), and dissolved totally by means of magnetic stirring at atmospheric pressure and room temperature. The mixed solution of R and F is then poured into a stainless-steel container and placed into a pressure reactor (Parr Instrument Company-Moline, IL 61265, Model 4561, mini bench top reactor, USA), then closed thoroughly. The mixture is stirred inside the pressure reactor while purging with N2 gas (flow rate of 150 cm3/min at 0.3 bar) for 15 min. Then, the reactor was evacuated at room temperature and sustained for 5 min under a vacuum (0.06 bar). The temperature of the pressure reactor (which contains the mixture) is then elevated to 110 ± 2 °C and is maintained at that temperature for 30 min. The reactor is then allowed to cool down to room temperature, then heated up again to 110 ± 2 °C under evacuation (0.06 bar) for 24 h. This last step is for the purpose of complete drying the formed gels. Vacuum is then released to retrieve the formed dry gels. The formed gel is named hereafter as resorcinol–formaldehyde gel and abbreviated as RFGn, where the numeric suffix (n) refers to the sample number as presented in Table 1. The proposed reaction mechanism is shown in Figure 2. It can be observed that initiation step was carried out to form 2,4-bis(hydroxymethyl)benzene-1,3-diol. The second step is condensation by polymerization of [2,4-bis(hydroxymethyl)benzene-1,3-diol] molecules to form RF gels.

2.4. Carbonization and Activation Processes

The RFG samples synthesized as described in the previous section are placed in a ceramic boat inside a programmable electric-heated tube furnace (Nabertherm GmbH, Lilienthal, Germany), while flowing N2 gas with a continuous flow of 100 cm3/min at 0.3 bar at ambient temperature. The tube furnace is first kept at room temperature for 40 min to guarantee that surrounding air is totally replaced with the flowing N2 gas. Then, the furnace was heated up to a temperature of 500 °C with a heating rate of 10 °C/min. The furnace was maintained at 500 ° C for 3 h, and is then allowed to cool down spontaneously to room temperature while still passing N2 gas. The emerging carbon gels are activated in the same tube furnace (after cleaning it carefully from carbonization process residues) by flowing CO2 gas (with a flow rate of 150 cm3/min at 0.3 bar) instead of N2 gas, heating the sample again with a heating rate of 10 °C/min up to 700 °C, keeping the sample at this temperature for 1 h, and then allowing the sample to cool down spontaneously to room temperature while still flowing CO2 gas [32]. After the carbonization and activation processes of RFG sample, the outcome products will be named as RFGn activated carbon and is denoted hereafter as RFGn-AC, where n indicates the code number of the corresponding RFGn precursor (Table 1).

2.5. Characterization

FT-Raman spectra are examined by using a Bruker FT-Raman spectrometer of type RFS 100/S that is attached to a Bruker-IFS 66/S spectrometer. Fourier transform infrared (FTIR) spectroscopy (NICOLET, iS10, Thermo-Scientific, Waltham, MA, USA) is used to investigate the structure of the prepared samples. X-ray diffraction (XRD) measurements are conducted by a Miniflex II Benchtop XRD apparatus, manufactured by Rigaku Corporation, Tokyo, Japan. The corresponding 2θ scan data are collected at the range of 5 to 80° at a scan rate of 2.5°/min. The morphologies of RFGn and RFGn-AC samples are scanned by nano-scanning electron microscopy (nano-SEM) using FEI Nova NanoSEM™ 450. The chemical compositions of RFGn and RFGn-AC samples are investigated by Energy-dispersive X-ray spectroscopy (EDX) that is connected to the Nova NanoSEM. Thermogravimetric analyses (TGA) were conducted by a PerkinElmer Pyris6 TGA analyzer under N2 gas in the range of 30 to 800 °C with a heating rate of 10 °C/min. A Micromeritics ASAP2420® Accelerated Surface Area and Porosimetry Analyzer System, with an enhanced micropore capability (utilizing 1-Torr pressure transducer), is used to study the pore structures of the RFGn and RFGn-AC samples utilizing measurements of adsorption/desorption isotherms of N2 gas at 77 K (−196 °C) with built-in calculations depending on the density functional theory (DFT). Prior to the adsorption tests, RFGn and RFGn-AC samples are degassed in situ for 24 h under vacuum (1 × 10⁻⁴ Pa) at 150 and 200 °C, correspondingly.

3. Results and Discussion

3.1. FTIR Spectroscopy

The FTIR spectra of RFGn samples prepared at different molar ratios and their subsequent activated carbons (RFGn-AC) are depicted in Figure 3. It is observed from Figure 3a that FTIR spectra of all RFGn samples show a wide peak at 3315 cm−1, which is assigned to the –OH stretching vibration group of the resorcinol as the main reactant. The two bands at 2833 and 2951 cm−1 indicate the CH2− and CH3− stretching vibrations of functional groups, respectively; the band at 1478 cm−1 refers to CH2-scissor vibration and CH3-flexural vibration. The band at 1618 cm−1 is attributed to the stretching vibration of aromatic rings. The bands of the methylene–ether-bridge bond (-CH2-O-CH2-) generated between an aromatic ring and formaldehyde by polycondensation are seen at 1094 and 1220 cm−1 [33]. In addition, the variation of R:F ratio resulted in similar functional groups becoming visible around the same sites for all RFGn samples. Thus, it could be deduced that the outcome RFGn samples from all recipes expose similar chemical features of the traditional RF gels. Figure 3b shows the FTIR spectra of RFGn-AC samples, in which the band depicted at 3414 cm−1 is assigned to the elongation vibrations of O–H. The carbonyl band is shown at 1740 cm−1. The bands at 2982 and 2860 cm−1 refer to the elongation vibrations of C–H in CH2 group inside chains, and the band at 885 cm−1 refers to the deformation vibrations of C–H of aromatic rings [34]. The effect of R:F ratios (of the various RFGn precursors of RFGn-AC samples) on FTIR spectra are approximately similar, where the bands are observed at around the same sites.

3.2. Elemental Analyses

The elemental analyses of carbon and oxygen in RFGn and RFGn-AC samples measured by EDX are listed in Table 2. The percentages of carbon in RFGn samples ranged from 83.72% (for RFG5) to 87.97% (for RFG8 and RFG9), whereas the percentages of oxygen in RFGn samples ranged from 12.03% (for RFG8 and RFG9) to 16.28% (for RFG5). Further, the percentages of carbon in RFGn-AC samples ranged from 97.93% (for RFG6-AC) to 99.2% (for RFG3-AC and RFG7-AC), whereas the percentages of oxygen ranged from 0.80% (RFG3-AC and RFG7-AC) to 2.07% (RFG6-AC). Consequently, the results indicate to that the percentage values of carbon or oxygen in either RFGn or RFGn-AC samples are not affected considerably by the R:F ratios utilized in their recipes.

3.3. Raman Spectroscopy

Figure 4a,b exposes the Raman spectra of the RFGn and RFGn-AC samples, respectively. It is noted that characteristic peaks are at 1358 and 1595 cm−1, which indicate the disorder peak (referred to as D-band) and the graphitic peak (indicated to as G-band), respectively. The intensity ratio of the D-band to the G-band (i.e., the ID/IG ratio) helps to estimate the extent of defects/disorders into the structure of RFG and RFG-AC samples, where a higher ID/IG ratio indicates a higher extent of defects/disorders. The values of ID/IG ratio of RFGn and RFGn-AC samples are listed on the corresponding curves in Figure 4a,b, respectively, and are summarized in Figure 4c. Overall, it is seen that the ID/IG ratio values of RFGn samples range from 0.550 to 0.644, whereas those of RFGn-AC samples range from 0.795 to 0.886. The results of ID/IG ratios indicate that the defects or disorder in the structures of RFGn are lower than those of the corresponding RFGn-AC [35]. The dependence of the ID/IG ratio values of RFGn and RFGn-AC samples on the R:F ratios of precursor ingredients are displayed in Figure 4c. Throughout the ID/IG ratio results presented in Figure 4c, it observed that the ID/IG ratio values of RFGn and RFGn-AC samples have a small but positive dependence on the R:F ratio of the precursor solution used to synthesize the RFGn.

3.4. XRD Patterns

Figure 5 exposes the XRD patterns of RFGn and RFGn-AC samples. The corresponding peak locations (2θ) and the corresponding intensities at the full width at half maximum (FWHM, IFWHM) are listed in Table 3. It was noticed from Figure 5a and Table 3 that the XRD patterns for RFGn samples exhibit broad peaks at 2θ values ranging from 18.70° (for RFG1) to 21.94° (for RFG9), with peak intensities at the FWHM ranging from 1360 cps (for RFG3) to 20,164 cps (for RFG9). The difference in either 2θ or IFWHM is due to the variations in the used preparation recipe of key reactants (i.e., molar ratios of resorcinol and formaldehyde). The 2θ values follow the order RFG1 < RFG2 < RFG5 = RFG6 < RFG4 < RFG7 < RFG8 < RFG3 < RFG9. Furthermore, the IFWHM values are in the order of RFG3 < RFG5 = RFG6 < RFG2 < RFG4 < RFG7 < RFG8 < RFG1 < RFG9.
On the other hand, throughout Figure 5b, it can be seen that the RFGn-AC spectra exhibit two main peaks. The first peak occurs at 2θ values ranging from 21.28° (for RFG1-AC, RFG2-AC, RFG3-AC and RFG8-AC) to 22.83° (for RFG5-AC) as shown in Table 3, whereas the second peak occurs at 2θ of ~43° for all samples [36]. As shown in Table 3, the IFWHM values of the first peak ranges from 1033 cps (for RFG5-AC) to 2561 cps (for RFG1-AC). The 2θ values of the first peak follow the order RFG1-AC = RFG2-AC = RFG3-AC = RFG8-AC < RFG7-AC < RFG4-AC < RFG6-AC < RFG9-AC < RFG5-AC. The order of the IFWHM for the first peak is RFG5-AC < RFG8-AC < RFG3-AC < RFG9-AC < RFG7-AC < RFG4-AC < RFG6-AC < RFG2-AC < RFG1-AC. On the other hand, the IFWHM values of the second peak (at 2θ = ~43° [37]) range from 423 cps (for RFG5-AC) to 804 cps (for RFG1-AC and RFG2-AC). The intensities of the second peak follow the order RFG5-AC < RFG3-AC < RFG8-AC < RFG9-AC < RFG7-AC < RFG4-AC < RFG6-AC < RFG2-AC = RFG1-AC.

3.5. N2 Gas Adsorption

Figure 6a,b illustrates the N2 gas adsorption/desorption isotherms at 77 K onto RFGn and RFGn-AC samples, respectively. It is observed that the adsorption is mostly of Type-IV isotherm; this refers to the adsorption process on mesoporous solids, which involves multilayer adsorption followed by capillary condensation. A characteristic of the Type IV isotherm is its hysteresis loop, which is related to the capillary condensation occurring into mesopores, and restricting the uptake over a range of high P/P0 [38]. The initial part of Type IV isotherm (before the hysteresis loop) is attributed to monolayer–multilayer adsorption. The straight line over a range of low P/P0, which indicates the beginning of the almost linear middle section of the isotherm, often refers the stage at which monolayer coverage is complete and multilayer adsorption about to start. The hysteresis loops of the adsorption of N2 onto RFGn and RFGn-AC samples are of the type H2 (refers to the steepness of isotherm), which indicates narrow pore mouths (may be ink-bottle shaped pores) or relatively uniform channel-like pores and pore network (connectivity) effects [39].
The maximum adsorption capacities of N2 gas adsorption at 77 K on RFGn and RFGn-AC samples are listed in Table 4. Overall, it can be noted that the adsorption capacities of N2 gas at 77 K on RFGn ranges from 0.01 mmol/g (on RFG9) to 17.7 mmol/g (on RFG6). The order of N2 adsorption capacities is RFG9 < RFG1 < RFG2 < RFG8 < RFG5 < RFG3 < RFG4 < RFG7 < RFG6. It is to be noted that the very high adsorption capacities (e.g., on RFG6 and RFG7) are mainly due to capillary condensation. On the other hand, the adsorption capacities of N2 gas at 77 K on RFGn-AC ranges from 2.64 mmol/g (on RFG2-AC) to 11.97 mmol/g on (RFG3-AC). The order of N2 adsorption capacities on RFGn-AC samples follows the order RFG2-AC < RFG1-AC < RFG8-AC < RFG9-AC < RFG5-AC < RFG4-AC < RFG6-AC < RFG7-AC RFG3-AC.

3.6. Pore Structure Analyses

Figure 7 shows the relationship between the incremental pore areas and pore widths of RFGn and RFGn-AC samples. It is worth noting that these results are in view point of the low-to-high scale of pore sizes for all samples. A summary of the pore structure characteristics of RFGn and RFGn-AC samples is given in Table 5.
It can be observed from Figure 7a that each of the samples RFG3 through RFG7 exhibit two main peaks, whereas the samples RFG1, RFG2, RFG8 and RFG9 are relatively nonporous. RFG3 and RFG4 exhibit two key peaks at 1.3 and 1.5 nm. The corresponding incremental pore areas of these two peaks were, respectively, 27.01 and 12.70 m2/g (for RFG3) and 44.42 and 8.77 m2/g (for RFG4). RG5, RFG6 and RFG7 expose two key peaks at 1.4 and 1.7 nm. The corresponding incremental pore areas of RG5, RFG6 and RFG7 at 1.4 nm are 18.16, 17.86 and 21.40 m2/g, respectively; whereas, those at 1.7 nm are 3.77, 4.66 and 5.13 m2/g, respectively. The samples of RFG1, RFG2, RFG8 and RFG9 exhibited nil incremental pore areas of less than 1 m2/g. Overall, RFG4 denotes the highest incremental pore area; whereas RFG1, RFG2, RFG8 and RFG9 exhibited the lowest incremental pore areas < 1 m2/g, which can be considered relatively nonporous. Moreover, the highest incremental pore area for each RFGn is localized in the microporous scale.
It can be noticed from Figure 7b that RFG3-AC shows four key peaks at 0.8, 0.9, 1.1 and 1.3 nm with the corresponding incremental pore areas of 225.09, 39.61, 56.47 and 22.55 m2/g, respectively. RFG9-AC exhibits two key peaks at 0.8 and 1.0 nm with the corresponding incremental pore areas of 167.25 and 139.16 m2/g, respectively. RFG4-AC, RFG5-AC, RFG7-AC and RFG8-AC illustrate two key peaks at 0.7 and 1.1 nm. The corresponding incremental pore areas of RFG4-AC, RFG5-AC, RFG7-AC and RFG8-AC at 0.7 nm are 114.31, 20.0, 17.46 and 99.66 m2/g, respectively. Furthermore, the corresponding incremental pore areas of RFG4-AC, RFG5-AC, RFG7-AC and RFG8-AC at 1.1 nm are 93.73, 114, 156.05 and 109.65 m2/g, respectively. RFG2-AC displays two key peaks at 0.8 and 1.1 nm with the corresponding incremental pore areas of 13.02 and 76.20 m2/g, respectively. RFG6-AC exposes three key peaks at 0.8, 1.0 and 1.2 nm with the corresponding incremental pore areas of 42.59, 106.68 and 72.56 m2/g, respectively. RFG1-AC shows two key peaks at 1.1 and 1.2 nm with the corresponding incremental pore areas of 98.41 and 67.47 m2/g, respectively.
A summary of various pore structure characteristics of RFGn and RFGn-AC samples is presented in Table 5. The average pore sizes of RFGn samples range from 3.5 nm (for RFG3 and RFG4) to 62.9 nm (for RFG8). Other related details of average pore sizes are registered in Table 5. The percentage of micropores ranges from 0.0 to 1.2%, which corresponds to the samples RFG2 and RFG1, respectively. The mesopores of RFGn samples range from 9.0 to 48.5% for the samples of RFG2 and RFG1, respectively. Accordingly, the percentage of macropores in RFG samples ranges from 50.3 to 91.0% for RFG1 and RFG2, respectively. Overall, the order of mesopore percentage was RFG2 < RFG9 < RFG4 < RFG 5 < RFG6 < RFG7 < RFG8 < RFG3 < RFG1; whereas, the order of macropore percentage was RFG1 < RFG3 < RFG8 < RFG5 < RFG6 < RFG7 < RFG4 < RFG9 < RFG2. The average pore widths of RFG-AC samples range from 0.9 nm (for RFG8-AC and RFG9-AC) to 2.0 nm (for RFG7-AC). Furthermore, the percentage of micropores of RFGn-AC samples ranges from 0.3% (for RFG1-AC, RFG2-AC, RFG3-AC, RFG5-AC and RFG8-AC) to 0.6% (for RFG4-AC and RFG9-AC). The percentage of mesopores of RFGn-AC ranges from 11.2% (for RFG1-AC, RFG2-AC, RFG3-AC, RFG5-AC and RFG6-AC) to 19.0% (for RFG9-AC), and the percentage of macropores ranges from 80.4% (for RFG9-AC) to 88.5% (for RFG1-AC, RFG2-AC, RFG3-AC and RFG5-AC). The percentages of micropores, mesopores and macropores follow the orders of RFG1-AC = RFG2-AC = RFG3-AC = RFG5-AC = RFG8-AC < RFG6-AC = RFG7-AC < RFG4-AC = RFG9-AC, RFG1-AC = RFG2-AC = RFG3-AC = RFG5-AC = RFG6-AC < RFG8-AC < RFG7-AC < RFG4-AC < RFG9-AC and RFG9-AC < RFG4-AC < RFG7-AC < RFG8-AC < RFG6-AC = RFG1-AC = RFG2-AC = RFG3-AC = RFG5-AC, respectively.
Figure 8 displays the relationship between the cumulative pore area and pore width of RFGn and RFGn-AC samples. The maximum cumulative surface areas of RFGn and RFGn-AC samples are also listed in Table 5. It is observed that the cumulative pore area of RFG1 is 0.01 m2/g, which denotes the lowest cumulative pore area; that of RFG4 is 176.15 m2/g, which denotes the highest cumulative pore area. Further, the sequence order of cumulative surface areas of RFG samples are RFG4 > RFG6 > RFG3 > RFG7 > RFG5 > RFG8 > RFG9 > RFG2 > RFG1. The increment trend between the cumulative pore area and pore width is noticeable in the cases of RFG3, RFG4, RFG5, RFG6, RFG7 and RFG8 whereas a weak trend of the cumulative pore areas is found in the cases of RFG1, RFG2, RFG8 and RFG9. The cumulative pore areas increase by the augmenting of pore width of RFG3, RFG4 and RFG5 up to 12.7 nm then level off at the corresponding cumulative areas of 145.40, 176.15 and 67.48 m2/g, respectively. The cumulative surface area of RFG6 increases up to a pore width of 25.3 nm, then levels off with the corresponding cumulative pore area of 147.66 m2/g. Moreover, the cumulative surface area of RFG7 increases up to the pore width of 34.3 nm, then levels off at the corresponding cumulative pore area of 118.26 m2/g. More details of surface area of these RFG samples are recorded in Table 5.
It can be noticed from Figure 8b that cumulative pore areas of RFGn-AC samples range from 160.93 to 511.46 m2/g for RFG2-AC and RFG3-AC respectively. The sequence of cumulative areas’ order is RFG3-AC > RFG6-AC > RFG4-AC > RFG9-AC > RFG7-AC > RFG5-AC > RFG8-AC > RFG1-AC > RFG2-AC. Overall, the cumulative pore area of RFGn-AC samples increase by augmenting the pore width. The cumulative pore area increments up to 8.6 nm then levels off for the samples of RFG3-AC and RFG6-AC at 511.46 and 370.81 m2/g, respectively. The cumulative pore areas of RFG1-AC, RFG2-AC, RFG4-AC, RFG5-AC, RFG7-AC, RFG8-AC and RFG9-AC increase up to 1.2 nm then level off at the corresponding cumulative pore areas of 165.92, 160.93, 368.89, 333.31, 356.26, 308.49 and 368.51 m2/g, respectively. Other related details are recorded in Table 5.
Figure 9 displays the incremental pore volume distributions (as a function of pore widths) of RFGn and RFGn-AC samples. RFGn samples contain RFG1, RFG2, RFG3, RFG4, RFG5, RFG6, RFG7, RFG8 and RFG9. Furthermore, RFGn-AC samples comprise RFG1-AC, RFG2-AC, RFG3-AC, RFG4-AC, RFG5-AC, RFG6-AC, RFG7-AC, RFG8-AC and RFG9-AC-AC. The discussion of results right here begins from the low scale of pore width then goes up to the high scale in gradient, regardless of sample number either in RFGn or RFGn-AC samples. It can be observed from Figure 9a that both of RFG3 and RFG4 exhibit three key peaks at 1.3, 6.8 and 8.6 nm. The corresponding incremental pore volumes of RFG3 are 0.016, 0.013 and 0.014 cm3/g, respectively; those of RFG4 are 0.028, 0.015 and 0.015 cm3/g, respectively. RFG7 displays five key peaks at 1.4, 27.3, 34.3, 54.4 and 117.2 nm with the corresponding incremental pore volumes of 0.014, 0.024, 0.025, 0.010 and 0.003 cm3/g, respectively. RFG6 exposes two key peaks at 1.4 and 17.2 nm with the corresponding incremental pore volumes of 0.012 and 0.031 cm3/g, respectively. RFG5 shows two key peaks at 1.4 and 6.8 nm with the corresponding incremental pore volumes of 0.012 and 0.008 cm3/g, respectively. On the other hand, the trends in RFG1, RFG2, RFG8 and RFG9 are weak and can be ignored; this agrees with the results induced from the incremental surface area distributions (Figure 7a). The differences in incremental surface areas or incremental pore volumes of various RFGn samples are due to the differences in the molar ratios of resorcinol-to-formaldehyde utilized in the preparation process as outlined in Table 1.
In the course of the results in Figure 9b, it can be concluded that RFG3-AC exposes four key peaks at 0.8, 1.1, 6.3 and 8.6 nm with the corresponding incremental pore volumes of 0.103, 0.031, 0.011 and 0.010 cm3/g, respectively. RFG9-AC displays two key peaks at 0.8 and 1.0 nm with the corresponding incremental pore volumes of 0.067 and 0.071 cm3/g, respectively. RFG4-AC, RFG5-AC and RFG8-AC exhibit two key peaks at 0.7 and 1.1 nm. The corresponding incremental pore volumes of RFG4-AC are 0.041 and 0.005 cm3/g; those of RFG5-AC are 0.008 and 0.006 cm3/g; and those of RFG8-AC are 0.037 and 0.058 cm3/g, respectively. RFG1-AC exposes only one key peak at 1.1 nm with an incremental pore volume of 0.054 cm3/g. RFG6-AC shows three key peaks at 0.8, 1.1 and 14.4 nm with the corresponding incremental pore volumes of 0.017, 0.055 and 0.012 cm3/g, respectively. RFG7-AC refers to three key peaks at 0.7, 1.1 and 14.8 nm with corresponding incremental pore volumes of 0.006, 0.082 and 0.009 cm3/g, respectively. Moreover, RFG2-AC displays two key peaks at 0.8 and 1.1 nm with the corresponding incremental pore volumes of 0.004 and 0.042 cm3/g, respectively. These differences in incremental pore volumes are due to the differences in the molar ratios of resorcinol-to-formaldehyde through the initial preparation process.
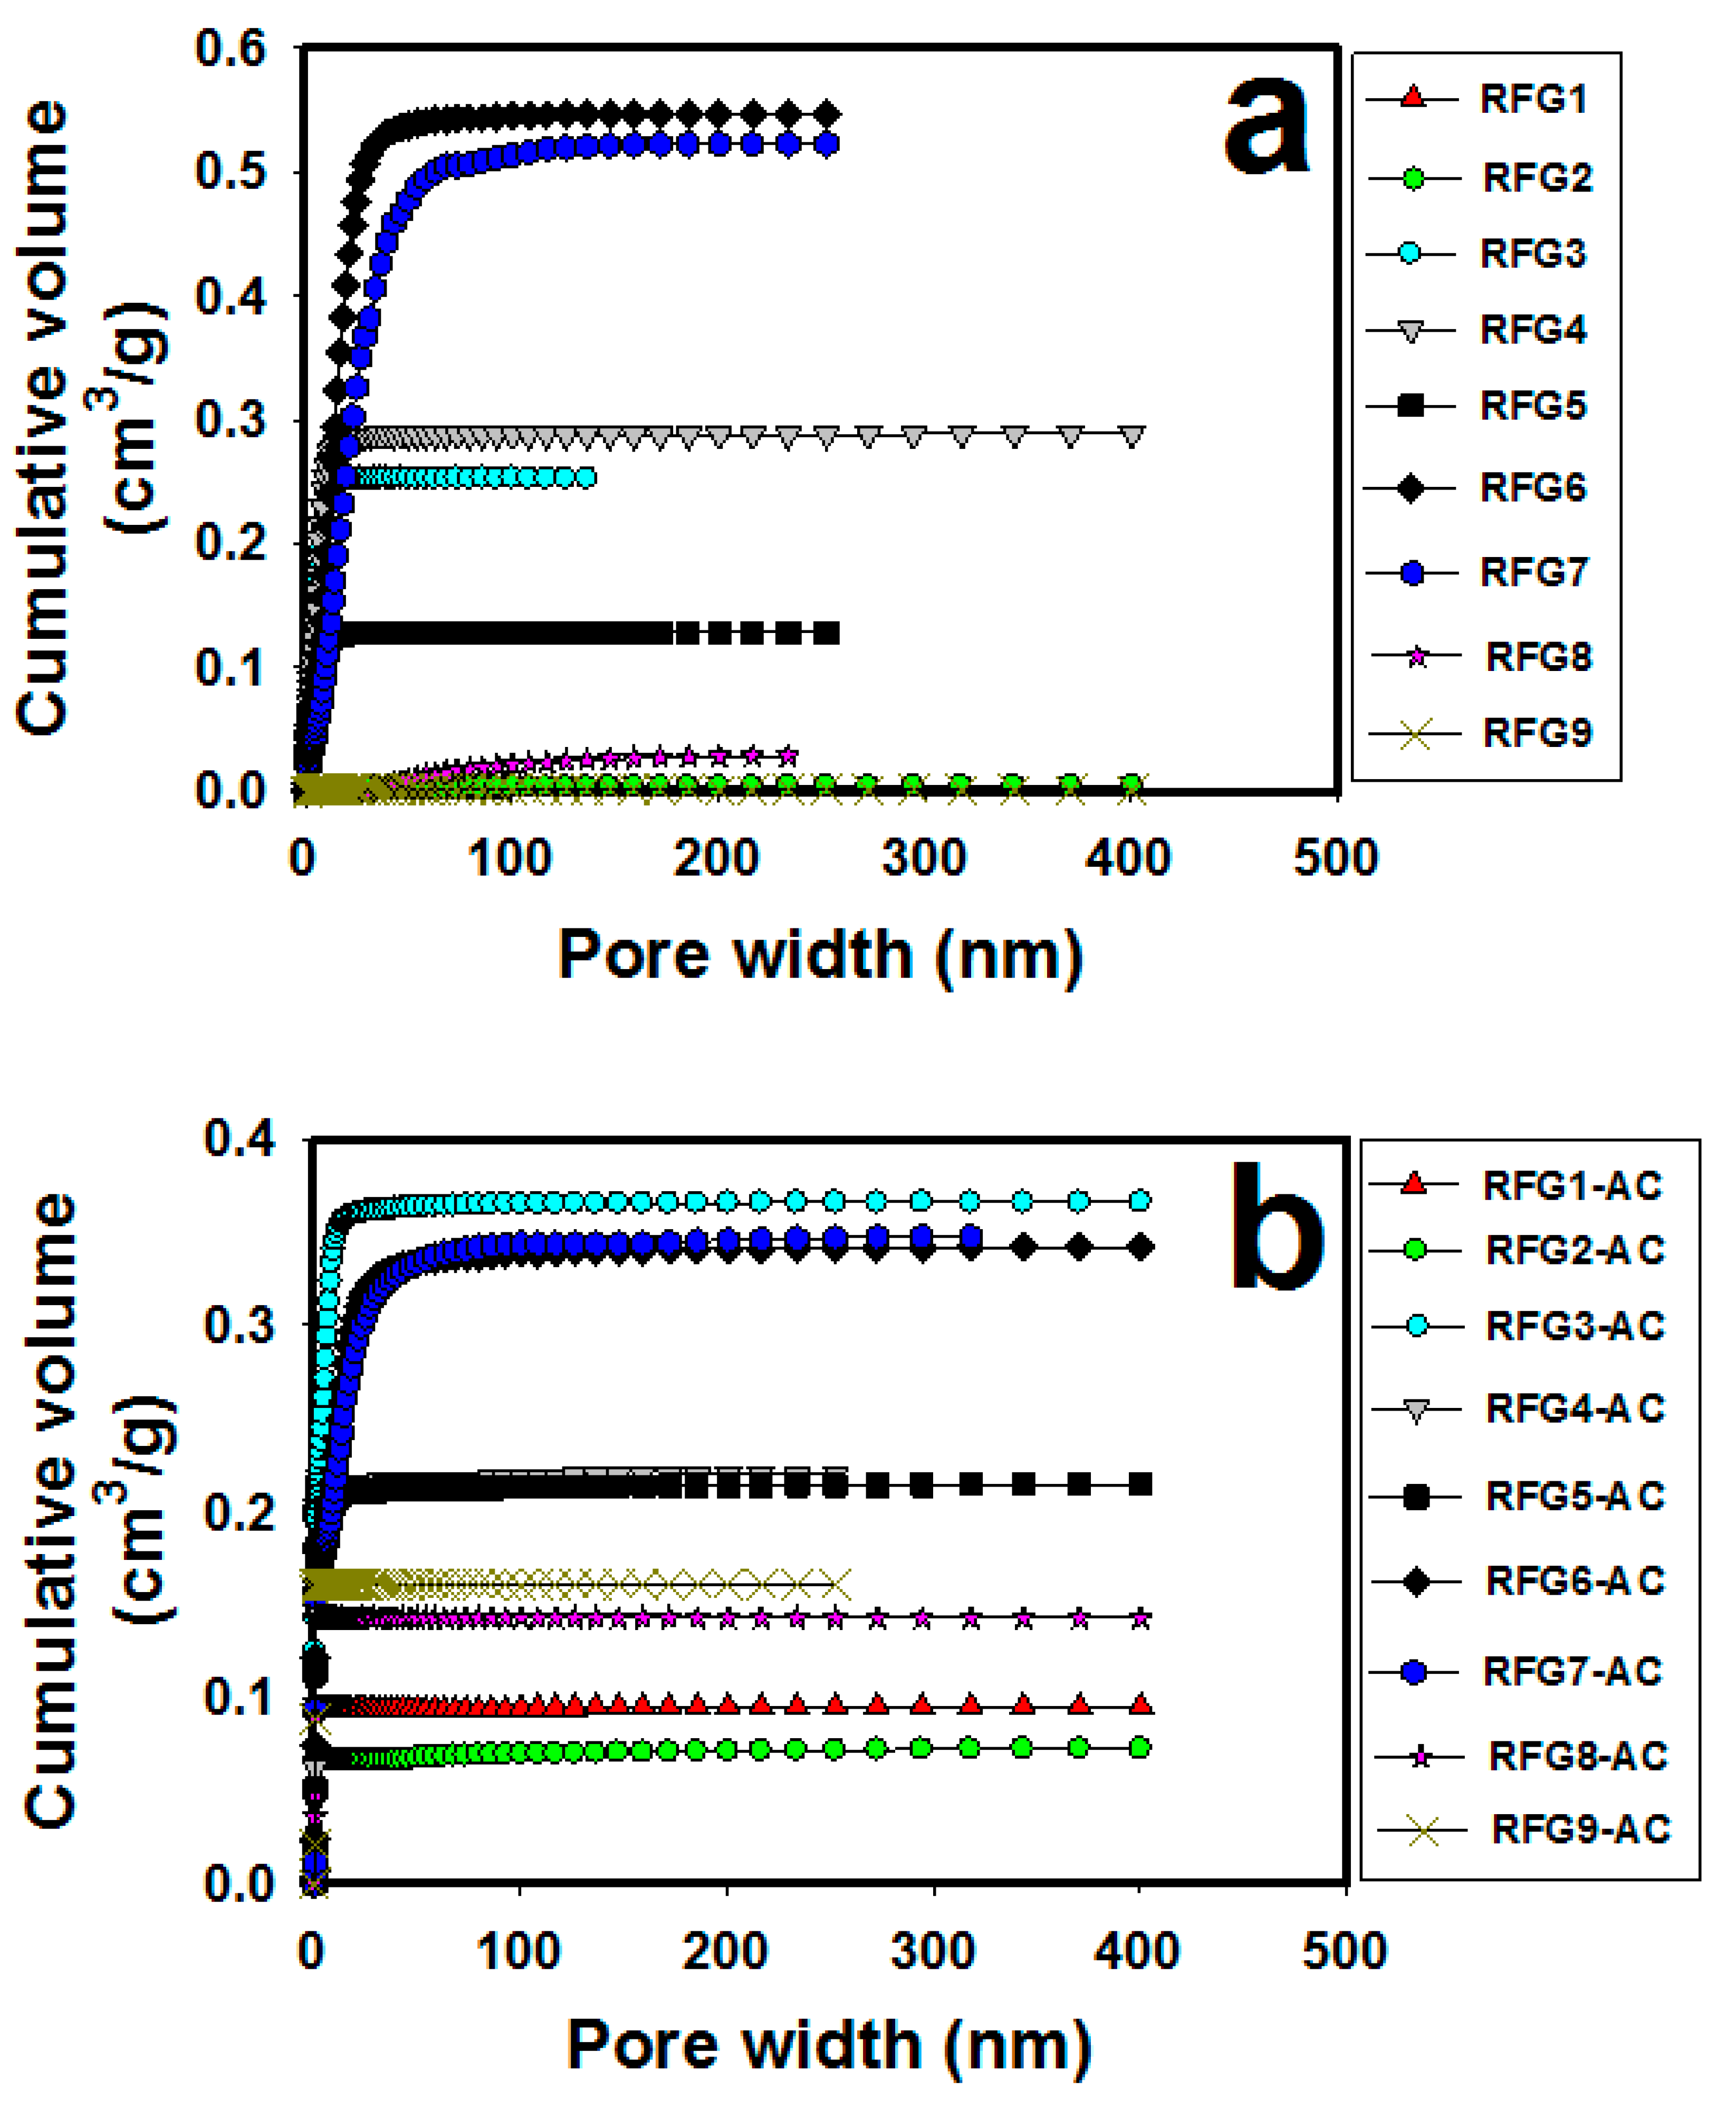
Figure 10 shows the relationship between the cumulative pore volume and pore width of RFGn and RFGn-AC samples. The maximum cumulative pore volumes of RFGn and RFGn-AC samples are also listed in Table 5. Overall, it can be noticed from Figure 10a that by augmenting the pore width, the cumulative pore volume augments. The lowest cumulative pore volume (of 0.00038 cm3/g) is for RFG1, and the highest cumulative pore volume (of 0.546 cm3/g) is for RFG6. The sequential order of RFGn samples are RFG6 > RFG7 > RFG4 > RFG3 > RFG5 > RFG8 > RFG2 > RFG9 > RFG1. The trend of cumulative versus pore widths of RFG6, RFG7, RFG4, RFG3, RFG5 and RFG8 ratchet up to 54.4, 108.6, 13.7, 12.7, 10.1 and 108.6 nm, respectively; and the total pore volumes of these samples are 0.546, 0.522, 0.292, 0.253, 0.127 and 0.028 cm3/g, respectively. The cumulative pore volumes of RFG1, RFG2 and RFG9 are practically insignificant. Furthermore, the results in Figure 10b expose that by augmenting pore widths, the cumulative pore volumes of RFGn-AC samples augment. The sequential order of these RFGn-AC samples are RFG3-AC > RFG7-AC > RFG6-AC > RFG4-AC > RFG5-AC > RFG9-AC> RFG8-AC > RFG1-AC > RFG2-AC. Further, RFG2-AC and RFG3-AC denote the lowest and the highest cumulative pore volumes among samples, which are equal to 0.086 and 0.366 cm3/g, respectively. The cumulative pore volumes of RFG3-AC, RFG6-AC RFG7-AC, RFG4-AC, RFG5-AC, RFG9-AC-AC, RFG8-AC, RFG1-AC and RFG2-AC augment with augmenting pore widths up to 17.2, 40.0, 73.7, 13.7, 10.1, 0.5, 0.5, 0.5 and 0.5 nm, respectively, then level off with the corresponding total pore volumes of 0.366, 0.342, 0.348, 0.220, 0.215, 0.162, 0.150, 0.095 and 0.086 cm3/g, respectively, as registered in Table 5.

3.7. Nano-Scanning Electron Microscopy (NanoSEM)

Figure 11a–i illustrate the nanoSEM photomicrographs of RFG1, RFG2, RFG3, RFG4, RFG5, RFG6, RFG7, RFG8 and RFG9, respectively. Overall, the morphological shapes of RFGn samples are all similar to a big extent; they exhibit a particulate feature with particle sizes ranging from 32.8 to 42.5 nm. The overall trend of particle sizes is almost decreasing with decreasing the R:F ratios in the initial reacting mixture (ref. Table 1). Figure 12a–i exhibits the nanoSEM photomicrographs of RFG1-AC, RFG2-AC, RFG3-AC, RFG4-AC, RFG5-AC, RFG6-AC, RFG7-AC, RFG8-AC and RFG9-AC samples, respectively. Generally, it can be observed that the morphological features of all RFGn-AC samples are similar to each other; where all RFGn-AC samples display a particulate feature with particle sizes ranging from 35.5 to 48.5 nm. The overall trend of particle sizes is almost decreasing with decreasing R:F ratios of the initial reactants (ref. Table 1).

3.8. Thermal Stability

Figure 13 a,b exposes the TGA thermograms of RFGn and RFGn-AC samples, respectively; from room temperature up to 800 °C. The corresponding decomposition (%weight loss) values of RFGn and RFGn-AC samples at different temperatures are also listed in Table 6. Overall, it is observed that the thermal stability of RFGn-AC samples is higher than that of RFGn samples at the same temperature. It can be noticed from Table 6 that the lowest and the highest thermal decomposition percentages of RFGn samples at 150 °C are 0 and 4.94% for RFG3 and RFG5, respectively. The lowest and the highest weight losses among RFGn samples at 200 °C are 1.26 and 6.72% for RFG6 and RFG5, respectively. The lowest and the highest weight losses among RFGn samples at 300 °C are 3.69 and 11.59% for RFG5 and RFG1, respectively. The lowest and the highest weight losses among RFGn samples at 400 °C are 10.63 and 22.63% for RFG4 and RFG9, respectively. The lowest and the highest weight losses among RFGn samples at 500 °C are 19.34 and 36.15% for the RFG3 and RFG5, respectively. The lowest and the highest weight losses among RFGn samples at 600 °C are 31.83 and 55.22% for RFG3 and RFG5, respectively. The lowest and the highest weight losses among RFGn samples at 700 °C are 45.09 and 71.26% for RFG3 and RFG5, respectively; at 800 °C, they are 55.16 and 80.25% for RFG3 and RFG5, respectively. Overall, RFG3 and RFG4 exhibit the best thermal stabilities over almost the entire range of temperatures (as indicated in Table 6 by mostly green color-coded cells at different temperatures), whereas RFG5 exhibits the poorest overall thermal stability (as indicated in Table 6 by mostly red color-coded cells at different temperatures).
Moreover, it is observed from the data listed in Table 6 that the lowest and the highest weight losses of RFGn-AC samples at 150 °C are 0 and 4.46% for RFG6-AC and RFG9-AC, respectively. The lowest and the highest weight losses at 200 °C are 0 and 3.29% for RFG6-AC and RFG2-AC, respectively. The lowest and the highest weight losses at 300 °C are 0 and 5.00% for RFG6-AC and RFG2-AC, respectively. The lowest and the highest weight losses at 400 °C are 0.62 and 6.79% for RFG6-AC and RFG2-AC, respectively. The lowest and the highest weight losses at 500 °C are 1.95 and 8.46% for RFG6-AC and RFG2-AC, respectively. The lowest and the highest weight losses at 600 °C are 5.76 and 11.77% for RFG4-AC and RFG2-AC, respectively. The lowest and the highest weight losses at 700 °C are 11.52 and 22.21% for RFG4-AC and RFG6-AC, respectively. Furthermore, the lowest and the highest weight losses at 800 °C are 19.28 and 36.41% for RFG4-AC and RFG6-AC, respectively. Overall, the thermal stability of RFG4-AC exhibits the widest range of thermal stability (as indicated in Table 6 by mostly green color-coded cells at various temperatures), especially at (and beyond) ~600 °C. On the other hand, RFG6-AC exhibits the best thermal stability at temperatures below ~600 °C, but its stability degrades considerably starting from 700 °C. Indeed, the poorest thermal stability at high temperatures (of ~700 °C and beyond) was for RFG6-AC. In addition, the poorest thermal stability at intermediate temperatures (from ~200 to ~600 °C) was for RFG2-AC, whereas the poorest thermal stability at low temperatures (up to ~150 °C) was for RFG9-AC.

3.9. Yield of Activated Carbon

Figure 14 exposes the percentage yield of activated carbon production from various gels versus the R:F ratio involved in their synthesis (ref. Table 1). This yield is calculated from the following equation:
AC   % = W Carbon W Gel × 100 %
where W Carbon and W Gel refer to the weights of activated carbon and the precursor dry gel materials, respectively. It can be seen from Figure 14 that there is a significant relationship between the starting recipe of the RFGn sample and the percentage yield (AC%) of the corresponding activated carbon. The AC% of RFGn-AC samples ranges from 34 to 59%; this corresponds to RFG9-AC and RFG1-AC, respectively. Therefore, the RFG1-AC denotes the highest AC% and RFG9-AC denotes the lowest AC%. By referring to Table 1, it can be seen that as AC% increases when increasing the used R:F ratio. Consequently, this difference in AC% is due to the in situ molar ratio of resorcinol-to-formaldehyde utilized in the synthesis process.

4. Conclusions

This work introduces a novel rapid thermal approach of crosslinking to produce sol–gels (as demonstrated by resorcinol–formaldehyde gels) from only the key reactants without including catalysts, buffer solutions or other additives of any species. This novel approach was based fundamentally on utilizing the melting temperature of the key reactants used to drive their crosslinking reactions. The preparation process included gels formation with an in situ drying method (to produce the organic gels), followed by carbonization and activation processes of the outcome gel samples (to produce the corresponding activated carbons).
Resorcinol–formaldehyde gel (RFG) samples were prepared (with different proportions of resorcinol and formaldehyde) at the melting temperature of resorcinol by utilizing a pressure reactor. Carbonization and activation processes were conducted to produce the subsequent resorcinol–formaldehyde activated carbon gel (RFG-AC) samples. The RFG and RFG-AC samples were identified by FTIR, Raman spectra, TGA, XRD, NanoSEM, EDX and surface area and porosity analyzers. Further, the results confirmed the structural formations of RFG and RFG-AC samples as well. The RFG samples exhibited pore size peaks ranging from 1.3 to 1.7 nm in terms of incremental surface areas (or from 1.3 to 117.2 nm in terms of incremental pore volumes). On the other hand, RFG-AC samples exhibited pore size peaks ranging from 0.7 to 1.3 nm in terms of incremental surface areas (or from 0.7 to 14.8 nm in terms of incremental pore volumes). The cumulative surface areas and cumulative pore volumes of RFG samples ranged from nil to 176.15 m2/g and from nil to 0.546 cm3/g, respectively. Furthermore, the cumulative surface areas and cumulative pore volumes of RFG-AC samples ranged from 160.93 to 511.46 m2/g and from 0.086 to 0.366 cm3/g, respectively. Both RFG and RFG-AC samples exhibited particulate morphologies with average particle sizes ranging from 32.8 to 42.5 nm and from 35.5 to 48.5 nm, respectively. Both RFG and RFG-AC samples exhibited promising thermal stabilities with variable extents depending on the initial proportions of the key ingredients used in the initial crosslinking reaction of the RFG. Furthermore, the yield of producing RFG-AC from RFG samples showed a clear dependence on the proportions of the key ingredients used in the synthesis of the precursor RFG.
This novel approach may widen the scopes of preparation of other derivatives of resorcinol–formaldehyde gels or other monomers or polymers as well. Furthermore, this type of preparation may enlarge the applications of such gels and their derivative products in various vital fields (such as biomaterials, cosmetics and pharmaceutics) that need no impurities or bleaching species from starting reactants. Additionally, this approach reduces the required gelation time and includes an in situ drying step, which facilitates the potentials of mass production.

Author Contributions

Conceptualization, A.A.-F. and S.A.A.-M.; Methodology, A.A.-F. and S.A.A.-M.; Validation, A.A.-F. and S.A.A.-M.; Formal Analysis, A.A.-F.; Investigation, A.A.-F. and S.A.A.-M.; Resources, S.A.A.-M.; Data Curation, A.A.-F.; Writing—Original Draft Preparation, A.A.-F.; Writing—Review and Editing, S.A.A.-M.; Visualization, A.A.-F.; Supervision, S.A.A.-M.; Project Administration, S.A.A.-M.; Funding Acquisition, S.A.A.-M. All authors have read and agreed to the published version of the manuscript.

Funding

This publication was made possible by the NPRP award (NPRP 08-014-2-003) from the Qatar National Research Fund (a member of The Qatar Foundation).

Data Availability Statement

Not applicable.

Acknowledgments

This publication was made possible by the NPRP award (NPRP 08-014-2-003) from the Qatar National Research Fund (a member of The Qatar Foundation). The statements made herein are solely the responsibility of the authors. Technical support from the Department of Chemical Engineering, the Central Laboratory Unit (CLU) and the Gas Processing Centre (GPC) at Qatar University is also acknowledged.

Conflicts of Interest

The authors declare no conflict of interest.

References

  1. Pekala, R.W.; Alviso, C.T. Carbon Aerogels and Xerogels. Mater. Res. Soc. Sympos. Proc. 1992, 270, 3–14. [Google Scholar] [CrossRef]
  2. Pekala, R.W. Organic Aerogels from the Polycondensation of Resorcinol with Formaldehyde. J. Mater. Sci. 1989, 24, 3221–3227. [Google Scholar] [CrossRef]
  3. Fathy, N.A.; Rizk, M.S.; Awad, R.M.S. Pore Structure and Adsorption Properties of Carbon Xerogels Derived from Carbonization of Tannic Acid-Resorcinol-Formaldehyde Resin. J. Anal. Appl. Pyrolysis 2016, 119, 60–68. [Google Scholar] [CrossRef]
  4. Arenillas, A.; Bailón-Garcia, E.; Menéndez, J.A.; Reichenauer, G.; Celzard, A.; Fierro, V.; Hodar, F.J.M.; Job, N. Organic and Carbon Gels: From Laboratory Synthesis to Applications; Springer: Berlin/Heidelberg, Germany, 2019; pp. 1–195. [Google Scholar] [CrossRef]
  5. ElKhatat, A.M.; Al-Muhtaseb, S.A. Advances in Tailoring Resorcinol-Formaldehyde Organic and Carbon Gels. Adv. Mater. 2011, 23, 2887–2903. [Google Scholar] [CrossRef] [PubMed]
  6. Horikawa, T.; Hayashi, C.; Muroyama, K. Controllability of Pore Characteristics of Resorcinol–Formaldehyde Carbon Aerogel. Carbon 2004, 42, 1625–1633. [Google Scholar] [CrossRef]
  7. Barbieri, O.; Ehrburger-Dolle, F.; Rieker, T.P.; Pajonk, G.M.; Pinto, N.; Rao, A.V. Small-angle X-ray scattering of a new series of organic aerogels. J. Non-Cryst. Solids 2001, 285, 109–113. [Google Scholar] [CrossRef]
  8. Mayer, S.T.; Kaschmitter, J.L.; Pekala, R.W. Method of Low Pressure and/or Evaporative Drying of Aerogel. U.S. Patent 5 420 168, 30 May 1995. [Google Scholar]
  9. Carziella, A.; Pilato, L.A.; Knop, A. Phenolic Resins, 2nd ed.; Springer: New York, NY, USA, 2000. [Google Scholar]
  10. Cook, R.C.; Letts, S.A.; Overturf, G.E., III; Lambert, S.M.; Wilemski, G.; Schroen-Carey, D. Final Report UCRL-LR-105821-97-1; Lawrence Liver-more National Laboratory: Livermore, CA, USA, 1997. [Google Scholar]
  11. Maldonado-Hódar, F.J.; Ferro-García, M.A.; Rivera-Utrilla, J.; Moreno-Castilla, C. Metal-carbon Aerogels as Catalysts and Catalyst Supports. Carbon 1999, 37, 1199. [Google Scholar] [CrossRef]
  12. Merzbacher, C.I.; Meier, S.R.; Pierce, J.R.; Korwin, M.L. Carbon aerogels as broadband non-reflective materials. J. Non-Cryst. Solids 2001, 285, 210. [Google Scholar] [CrossRef]
  13. Moreno-Castilla, C.; Maldonado-Hódar, F.J. Carbon Aerogels for Catalysis Applications: An Overview. Carbon 2005, 43, 455–465. [Google Scholar] [CrossRef]
  14. Trefilov, A.M.I.; Tiliakos, A.; Serban, E.C.; Ceaus, C.; Iordache, S.M.; Voinea, S.; Balan, A. Carbon Xerogel as Gas Diffusion Layer in PEM Fuel Cells. Int. J. Hydrogen Energy 2017, 42, 10448–10454. [Google Scholar] [CrossRef]
  15. Carlson, G.; Lewis, D.; McKinley, K.; Richardson, J.; Tillotson, T. Aerogel Commercialization: Technology, Markets and Costs. J. Non-Cryst. Solids 1995, 186, 372–379. [Google Scholar] [CrossRef]
  16. Rey-Raap, N.; Calvo, E.G.; Menéndez, J.A.; Arenillas, A. Exploring the Potential of Resorcinol-Formaldehyde Xerogels as Thermal Insulators. Microporous Mesoporous Mater. 2017, 244, 50–54. [Google Scholar] [CrossRef]
  17. Osińska, M. Removal of Lead(II), Copper(II), Cobalt(II) and Nickel(II) Ions from Aqueous Solutions Using Carbon Gels. J. Sol-Gel Sci. Technol. 2017, 81, 678–692. [Google Scholar] [CrossRef]
  18. Pajonk, G.M. Aerogel Catalysts. Appl. Catal. 1991, 72, 217–266. [Google Scholar] [CrossRef]
  19. Shiraishi, Y.; Hagi, T.; Matsumoto, M.; Tanaka, S.; Ichikawa, S.; Hirai, T. Solar-to-Hydrogen Peroxide Energy Conversion on Resorcinol–Formaldehyde Resin Photocatalysts Prepared by Acid-Catalysed Polycondensation. Commun. Chem. 2020, 3, 169. [Google Scholar] [CrossRef]
  20. Li, F.; Xie, L.; Sun, G.; Kong, Q.; Su, F.; Cao, Y.; Wei, J.; Ahmad, A.; Guo, X.; Chen, C.-M. Resorcinol-formaldehyde based carbon aerogel: Preparation, structure and applications in energy storage devices. Microporous Mesoporous Mater. 2019, 279, 293–315. [Google Scholar] [CrossRef]
  21. Tonanon, N.; Tanthapanichakoon, W.; Yamamoto, T.; Nishihara, H.; Mukai, S.R.; Tamon, H. Influence of Surfactants on Porous Properties of Carbon Cryogels Prepared by Sol–Gel Polycondensation of Resorcinol and Formaldehyde. Carbon 2003, 41, 2981–2990. [Google Scholar] [CrossRef]
  22. Glenske, K.; Wagner, A.-S.; Hanke, T.; Cavalcanti-Adam, E.A.; Wenisch, S. Bioactivity of Xerogels as Modulators of Osteoclastogenesis Mediated by Connexin 43. Biomaterials 2014, 35, 1487–1495. [Google Scholar] [CrossRef]
  23. Ulker, Z.; Erkey, C. An emerging Platform for Drug Delivery: Aerogel Based Systems. J. Control. Releas. 2014, 177, 51–63. [Google Scholar] [CrossRef]
  24. Alkemper, J.; Buchholz, T.; Murakami, K.; Ratke, L. Solidification of Aluminium Alloys in Aerogelmoulds. J. Non-Cryst. Solids 1995, 186, 395. [Google Scholar] [CrossRef]
  25. Pekala, R.W.; Mayer, S.T.; Kaschmitter, J.L.; Kong, F.M. Sol–Gel Processing and Applications; Attia, Y.A., Ed.; Plenum Press: New York, NY, USA, 1994; p. 369. [Google Scholar]
  26. Herrmann, G.; Iden, R.; Mielke, M.; Teich, F.; Ziegler, B. On the way to commercial production of silica aerogel. J. Non-Cryst. Solids 1995, 186, 380. [Google Scholar] [CrossRef]
  27. Scherdel, C.; Reichenauer, G. Carbon Xerogels Synthesized via Phenol–Formaldehyde Gels. Microporous Mesoporous Mater. 2009, 126, 133–142. [Google Scholar] [CrossRef]
  28. Al-Muhtaseb, S.A.; Ritter, J.A. Preparation and Properties of Resorcinol-Formaldehyde Organic and Carbon Gels. Adv. Mater. 2003, 15, 101–114. [Google Scholar] [CrossRef]
  29. Job, N.; Théry, A.; Pirard, R.; Marien, J.; Kocon, L.; Rouzaud, J.N.; Béguin, F.; Pirard, J.-P. Carbon Aerogels, Cryogels and Xerogels: Influence of the Drying Method on the Textural Properties of Porous Carbon Materials. Carbon 2005, 43, 2481–2494. [Google Scholar] [CrossRef]
  30. Rey-Raap, N.; Arenillas, A.; Menéndez, J.A. Carbon Gels and Their Applications: A Review of Patents (Chapter2). In Submicron Porous Materials; Bettotti, P., Ed.; Springer: Berlin/Heidelberg, Germany, 2017; pp. 25–52. [Google Scholar] [CrossRef]
  31. Awadallah-F, A.; Al-Muhtaseb, S.A. Thermally Crosslinked Gels. U.S. Patent No. US2021/0323830 A1, 21 October 2021. [Google Scholar]
  32. Awadallah-F, A.; Al-Muhtaseb, S.A. Nanofeatures of Resorcinol–Formaldehyde Carbon Microspheres. Mater. Lett. 2012, 87, 31–34. [Google Scholar] [CrossRef]
  33. Mulik, S.; Sotiriou-Leventis, C.; Leventis, N. Time-Efficient Acid-Catalyzed Synthesis of Resorcinol-Formaldehyde Aerogels. Chem. Mater. 2007, 19, 6138–6144. [Google Scholar] [CrossRef]
  34. Elsayed, M.A.; Hall, P.J.; Heslop, M.J. Preparation and Structure Characterization of Carbons Prepared from Resorcinol-Formaldehyde Resin by CO2 Activation. Adsorption 2007, 13, 299–306. [Google Scholar] [CrossRef]
  35. Palaniselvam, T.; Aiyappa, H.B.; Kurungot, S. An Efficient Oxygen Reduction Electrocatalyst Fromgraphene by Simultaneously Generating Pores and Nitrogen Doped Active Sites. J. Mater. Chem. 2012, 22, 23799. [Google Scholar] [CrossRef]
  36. Lin, C.; Ritter, J.A. Effect of Syhthesis pH on the Structure of Carbon Xerogels. Carbon 1997, 35, 1271–1278. [Google Scholar] [CrossRef]
  37. Eblagona, K.M.; AnaArenillas, A.; Malaika, A.; Pereir, M.F.R.; Figueiredo, J.L. The influence of the surface chemistry of phosphorylated carbon xerogel catalysts on the production of HMF from fructose in water. Fuel 2023, 334, 126610. [Google Scholar] [CrossRef]
  38. Kruk, M.; Jaroniec, M. Gas Adsorption Characterization of Ordered Organic−Inorganic Nanocomposite Materials. Chem. Mater. 2001, 13, 3169–3183. [Google Scholar] [CrossRef]
  39. Sing, K.S.W.; Everett, D.H.; Haul, R.A.W.; Moscou, L.; Pierotti, R.A.; Rouquerol, J.; Siemieniewska, T. Reporting Physisorption Data for Gas/Solid Systems with Special Reference to the Determination of Surface Area and Porosity. Pure Appl. Chem. 1985, 57, 603–619. [Google Scholar] [CrossRef]
Figure 1. Graphical presentation of preparation methods for RF gels and activated carbons.
Energies 16 01447 g001
Figure 2. A proposed reaction mechanism of the novel thermal approach to crosslink resorcinol and formaldehyde to form RFG.
Energies 16 01447 g002
Figure 3. FTIR spectra of (a) RFGn samples synthesized at various molar ratios and (b) their corresponding activated carbons (RFGn-AC).
Energies 16 01447 g003
Figure 4. Raman spectra of RFGn and RFGn-AC samples (subfigures a and b, respectively); (c) the variation of Id/IG ratios of RFGn and RFGn-AC samples with the corresponding precursor R:F ratios.
Energies 16 01447 g004
Figure 5. XRD patterns of (a) RFGn and (b) RFGn-AC samples.
Energies 16 01447 g005
Figure 6. N2 gas adsorption/desorption isotherms at 77 K onto (a) RFGn and (b) RFGn-AC samples.
Energies 16 01447 g006
Figure 7. Incremental pore area versus pore width of (a) RFGn and (b) RFGn-AC samples.
Energies 16 01447 g007
Figure 8. Cumulative pore area versus pore width of (a) RFGn and (b) RFGn-AC samples.
Energies 16 01447 g008
Figure 9. Incremental pore volume area versus pore width of (a) RFGn and (b) RFGn-AC samples.
Energies 16 01447 g009
Figure 10. Cumulative pore volume area versus pore width of (a) RFGn and (b) RFGn-AC samples.
Energies 16 01447 g010
Figure 11. NanoSEM photo micrographs of (a) RFG1, (b) RFG2, (c) RFG3, (d) RFG4, (e) RFG5, (f) RFG6, (g) RFG7, (h) RFG8 and (i) RFG9 samples.
Energies 16 01447 g011
Figure 12. NanoSEM photo micrographs of (a) RFG1-AC, (b) RFG2-AC, (c) RFG3-AC, (d) RFG4-AC, (e) RFG5-AC, (f) RFG6-AC, (g) RFG7-AC, (h) RFG8-AC and (i) RFG9-AC samples.
Energies 16 01447 g012
Figure 13. TGA thermograms of (a) RFGn and (b) RFGn-AC samples.
Energies 16 01447 g013
Figure 14. The yield of RFGn-AC production relative to the starting RFGn in terms of R:F ratios of the starting main reactants.
Energies 16 01447 g014
Table 1. Recipes for RFGn and subsequent RFGn-AC sample *.
Suffix (n)F (mL) *R:F **, ***R:W **
110.190.900.40
211.460.800.35
313.100.700.31
415.280.600.26
517.400.500.24
621.740.400.19
728.990.300.14
845.840.200.09
991.680.100.04
* Amount of resorcinol in each sample was fixed at 12.44 g. ** R:F and R:W are molar ratios of resorcinol to formaldehyde (R-to-F) or resorcinol to water (R-to-W), respectively. *** The R:F ratio was pre-set according to the trend (R:F = 1 − 0.1 n)
Table 2. EDX atomic analyses of carbon (C) and oxygen (O) in (a) RFGn and (b) RFGn-AC samples.
RFGnRFGn-AC
nC (wt.%)O (wt.%)C (wt.%)O (wt.%)
187.0112.9999.050.95
286.0413.9698.211.79
385.7114.2999.200.80
486.8713.1398.851.15
583.7216.2899.130.87
686.9313.0797.932.07
786.5513.4599.200.80
887.9712.0398.981.02
987.9712.0398.071.93
Table 3. XRD peak locations and FWHM intensities of RFGn and RFGn-AC samples.
RFGnRFGn-AC
n2θ (°)IFWHM (cps)1st Peak 2θ (°)1st Peak IFWHM (cps)2nd Peak * IFWHM (cps)
118.7196421.282561804
218.72159921.282523804
321.8136021.281721482
419.67161122.062087639
519.65148222.831033423
619.65148222.522202742
720.49167821.61851543
821.47188121.281682487
921.94206422.661843492
* Second peaks for all samples are located at 2θ = ~43°.
Table 4. N2 gas adsorption capacity (mmol/g) at 77 K on RFGn and RFGn-AC samples.
Samplen = 1n = 2n = 3n = 4n = 5n = 6n = 7n = 8n = 9
RFGn0.050.168.218.984.2817.7016.850.840.01
RFGn-AC3.242.6411.977.597.3511.1611.965.355.69
Table 5. Pore structure characteristics of (a) RFGn and (b) RFGn-AC samples (estimated from surface area and porosity analyzer from adsorption/desorption isotherms of N2 gas at 77 K).
(a) RFGn Samples
n= 1n= 2n= 3n= 4n= 5n= 6n= 7n= 8n= 9
Average pore size (nm) *62.825.93.53.53.88.110.3162.93.9
Micropore (%) *1.20.01.00.40.60.60.60.50.3
Mesopore (%) *48.59.032.911.217.817.817.819.211.2
Macropore (%) *50.391.066.188.481.681.681.680.388.5
Total Surface Area (m2/g) 0.010.32145.40176.1567.49147.67118.270.910.61
Total Pore volume (cm3/g)0.0000.0040.2530.2920.1270.5460.5220.0280.001
(b) RFGn-AC Samples
n= 1n= 2n= 3n= 4n= 5n= 6n= 7n= 8n= 9
Average pore size (nm) *1.11.11.41.11.31.82.00.90.9
Micropore (%) *0.30.30.30.60.30.40.40.30.6
Mesopore (%) *11.211.211.217.811.211.215.112.019.0
Macropore (%) *88.588.588.581.688.588.484.587.780.4
Total Surface Area (m2/g) 165.92160.93511.46368.89333.32370.81356.26308.49368.51
Total Pore volume (cm3/g)0.0950.0860.3660.2200.2150.3420.3480.1510.162
* Calculated based on the incremental surface area distributions.
Table 6. TGA thermal decomposition (% weight losses) of RFGn and RFGn-AC samples *.
SampleTemperature (°C)
(a) RFGn Samples
150 °C200 °C300 °C400 °C500 °C600 °C700 °C800 °C
RFG11.953.0511.5915.2322.9236.6452.7363.46
RFG24.135.425.4917.5524.7936.0748.8557.3
RFG301.38.9311.1819.3431.8345.0955.16
RFG40.671.364.7610.6320.8336.0750.759.93
RFG54.946.723.6921.5936.1555.2271.2680.25
RFG60.841.265.414.6925.7337.4949.1256.3
RFG71.161.666.5915.2127.6345.8865.1678.39
RFG82.43.658.9620.732.7844.9756.6264.98
RFG92.053.129.6422.6333.344.6255.7363.59
(b) RFGn-AC Samples
150 °C200 °C300 °C400 °C500 °C600 °C700 °C800 °C
RFG1-AC1.351.321.522.092.947.119.8533.05
RFG2-AC2.613.295.006.798.4611.7720.1531.1
RFG3-AC2.122.63.684.986.019.0817.8827.57
RFG4-AC0.771.121.983.143.885.7611.5219.28
RFG5-AC1.962.23.014.245.869.0818.8532.69
RFG6-AC0000.621.957.7222.2136.41
RFG7-AC2.413.194.585.766.79.371828.63
RFG8-AC2.212.693.975.296.619.811829.27
RFG9-AC4.460.921.993.214.869.2117.2225.99
* Color gradient (red to green) for each colomn indicate an increasing thermal stability at the corresponding temperature.
Disclaimer/Publisher’s Note: The statements, opinions and data contained in all publications are solely those of the individual author(s) and contributor(s) and not of MDPI and/or the editor(s). MDPI and/or the editor(s) disclaim responsibility for any injury to people or property resulting from any ideas, methods, instructions or products referred to in the content.

