Article

Analysis of the Electric Vehicle Charging Stations Effects on the Electricity Network with Artificial Neural Network

1
Dumlupınar Vocational School, Kutahya Dumlupınar University, 43820 Kutahya, Turkey
2
Department of Electrical and Electronics Engineering, Konya Technical University, 42250 Konya, Turkey
*
Author to whom correspondence should be addressed.
Energies 2023, 16(3), 1282; https://doi.org/10.3390/en16031282
Submission received: 28 December 2022 / Revised: 13 January 2023 / Accepted: 16 January 2023 / Published: 25 January 2023
(This article belongs to the Topic Advanced Electric Vehicle Technology)

Abstract

:
In this study, the effects of electric vehicles, whose usage rate is increasing day by day in the world, on the existing electricity grid have been studied. EV charging stations and similar non-linear loads cause various harmful effects on power systems such as phase imbalances, the effect of harmonic formation, energy quality, voltage, and current imbalance. The study focuses on the harmonic effects of EV charging stations at the point where they are connected to the grid and at lower voltage levels by using IEEE 6-, 14-bus, and 30-bus test power systems. In addition to the existing loads in these grid systems, the effects on the grid as a result of drawing electrical energy from the grid for charging electric vehicles are investigated. These effects have shown how these charging stations on the grid have changed, considering the fact that the number of electric vehicles and the number of charging stations increased over the years when a single electric vehicle provided energy from the grid, and the grid was not renewed. The response of the network to the increase in the load that will occur in addition to the current loads, its harmonic effects, and the effects of the current grid on the increase in the electric vehicle growth rate over the years have been predicted and examined by using artificial neural networks. Solution suggestions are presented for power networks in similar situations.

1. Introduction

Electrical energy has become one of the basic needs of daily life. As a result of this situation, studies on electric vehicles and the spread of these vehicles are inevitable. Looking at the industry reports and the sales of electric vehicles in recent years, it is inevitable that electric vehicles (EV) will become more widespread day by day. Due to the known problems of fossil fuels, alternative fuels have also been sought in the automotive industry and electric vehicles have gained great importance in recent years. It is predicted that electric vehicles will eliminate the problems caused by fossil fuels in transportation. However, major problems arise such as providing electrical energy to these vehicles, creating battery charging points, and revising the grid and infrastructure systems [1]. With the increase in the production and use of EVs, greenhouse gas emissions from the transportation sector will also decrease [2]. According to the ACEA 2022 progress report, electric vehicle registration in Europe increased from 168,901 in 2017 to 1,744,520 in 2021. In addition, EVs accounted for 18% of newly registered vehicles in the European Union in 2021, which means that one in five of every new vehicle sold is EV [3]. This is a clear indication of how quickly EVs are becoming widespread and will be used in greater numbers in the near future. The rapid increase in the use of EV shows that the need and number of charging stations will also increase rapidly. As a result, the need for electrical energy will increase at the same rate. With the increase in the number of charging stations, these charging stations will primarily be fed from the existing electricity grid, and the infrastructure status of the regions will gain great importance. When the existing grids are used, the fixed loads currently fed from the grid and the quality of the electrical energy required by these loads will be affected by the addition of charging stations to the system. When looking at EV loads in more detail, the energy demand from EVs depends on the number of EVs charged, charging time, and battery initial charge capacities. Battery initial charge status and charging times vary randomly according to the vehicle usage habits of the users. These situations, which are of great importance for the future of technology and energy demand, have been examined from different perspectives by many researchers. In [4], the electrical potential energy demand of Plug-in Hybrid EVs and the prediction of CO2 emissions in the years 2020–2030 were studied. In [5], four sets of measurements were taken for an EV during charging, and harmonic analyses were made. With the studies on harmonic effects creating a driving force, a parallel power circuit was designed for an existing charger in [6], and thus a design was made to keep the harmonic distortions within the standards. In addition, studies were conducted on the effects of charging stations between low voltage (LV) and high voltage (HV), and the effects of ultra-fast EV charging stations in a medium voltage (MV) electricity network were analyzed [7]. Studies on different types of EV chargers were also conducted and the effects of general-use chargers on the LV side were investigated [8,9]. In addition to the formation of harmonics, the differences between the harmonics formed were also investigated, and low-order harmonics were analyzed on the charging station models created by considering the charging stations at different speeds in [10,11]. In a battery profile modeling study [
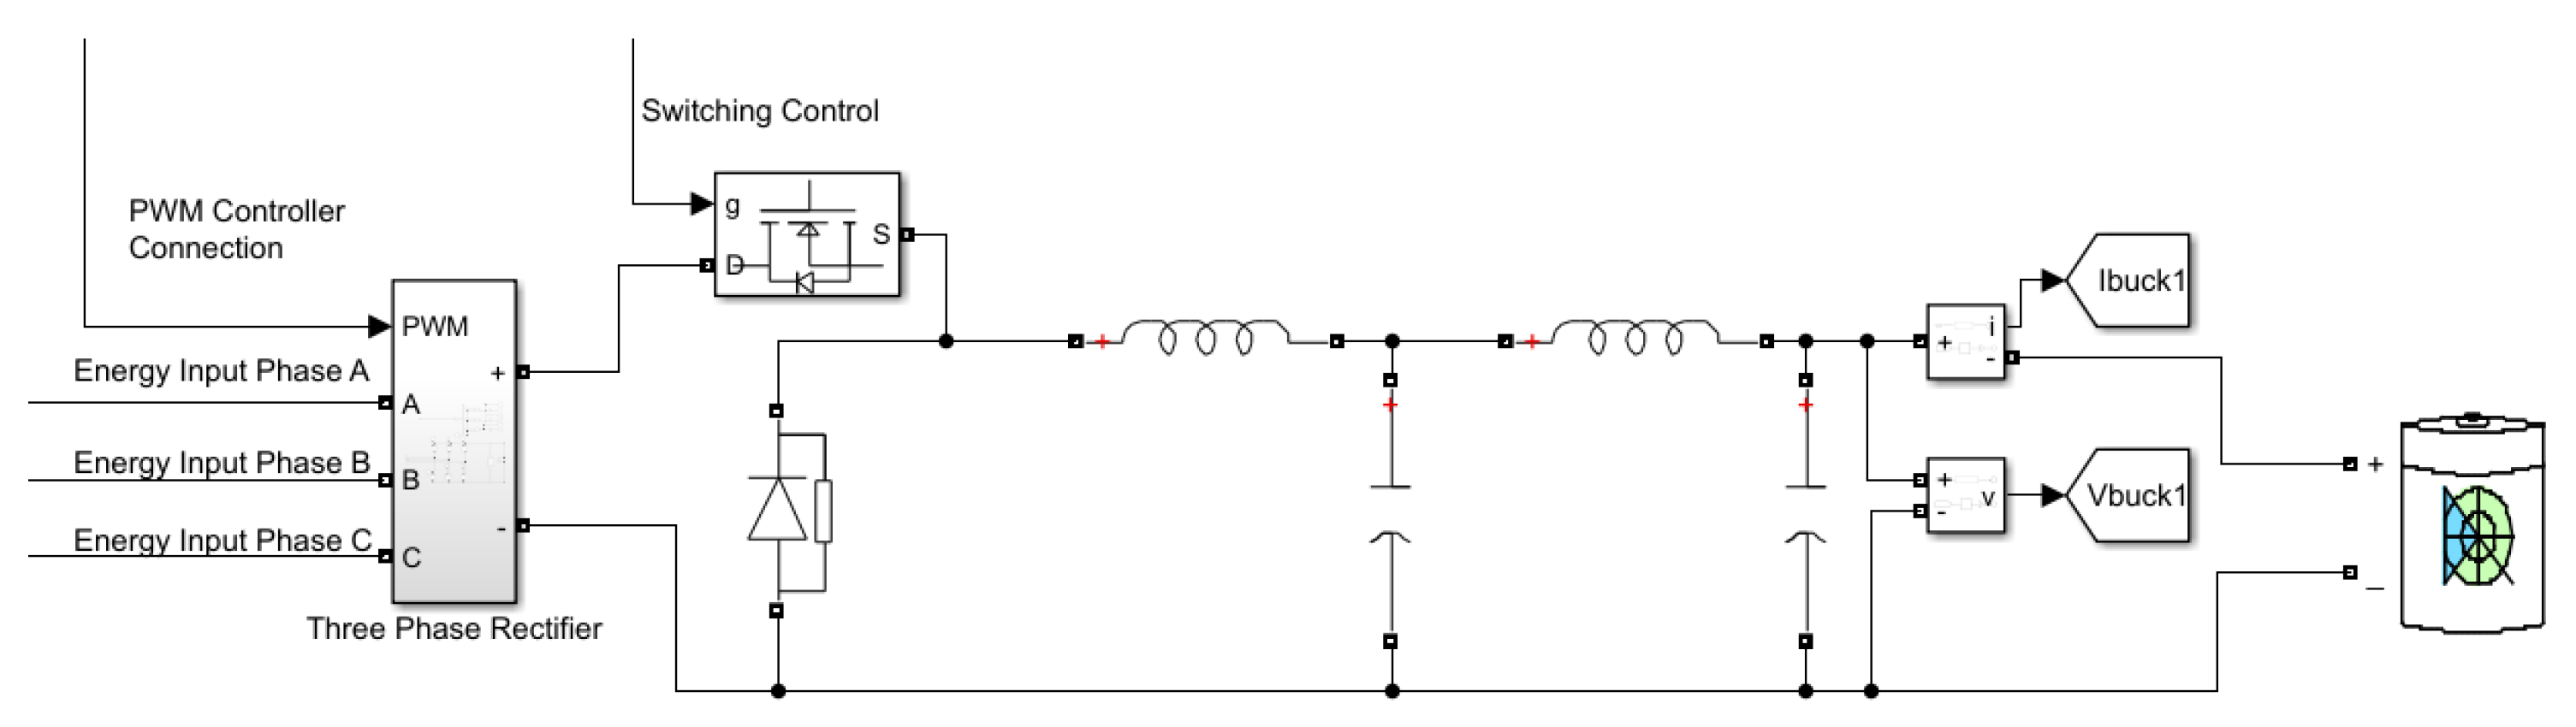
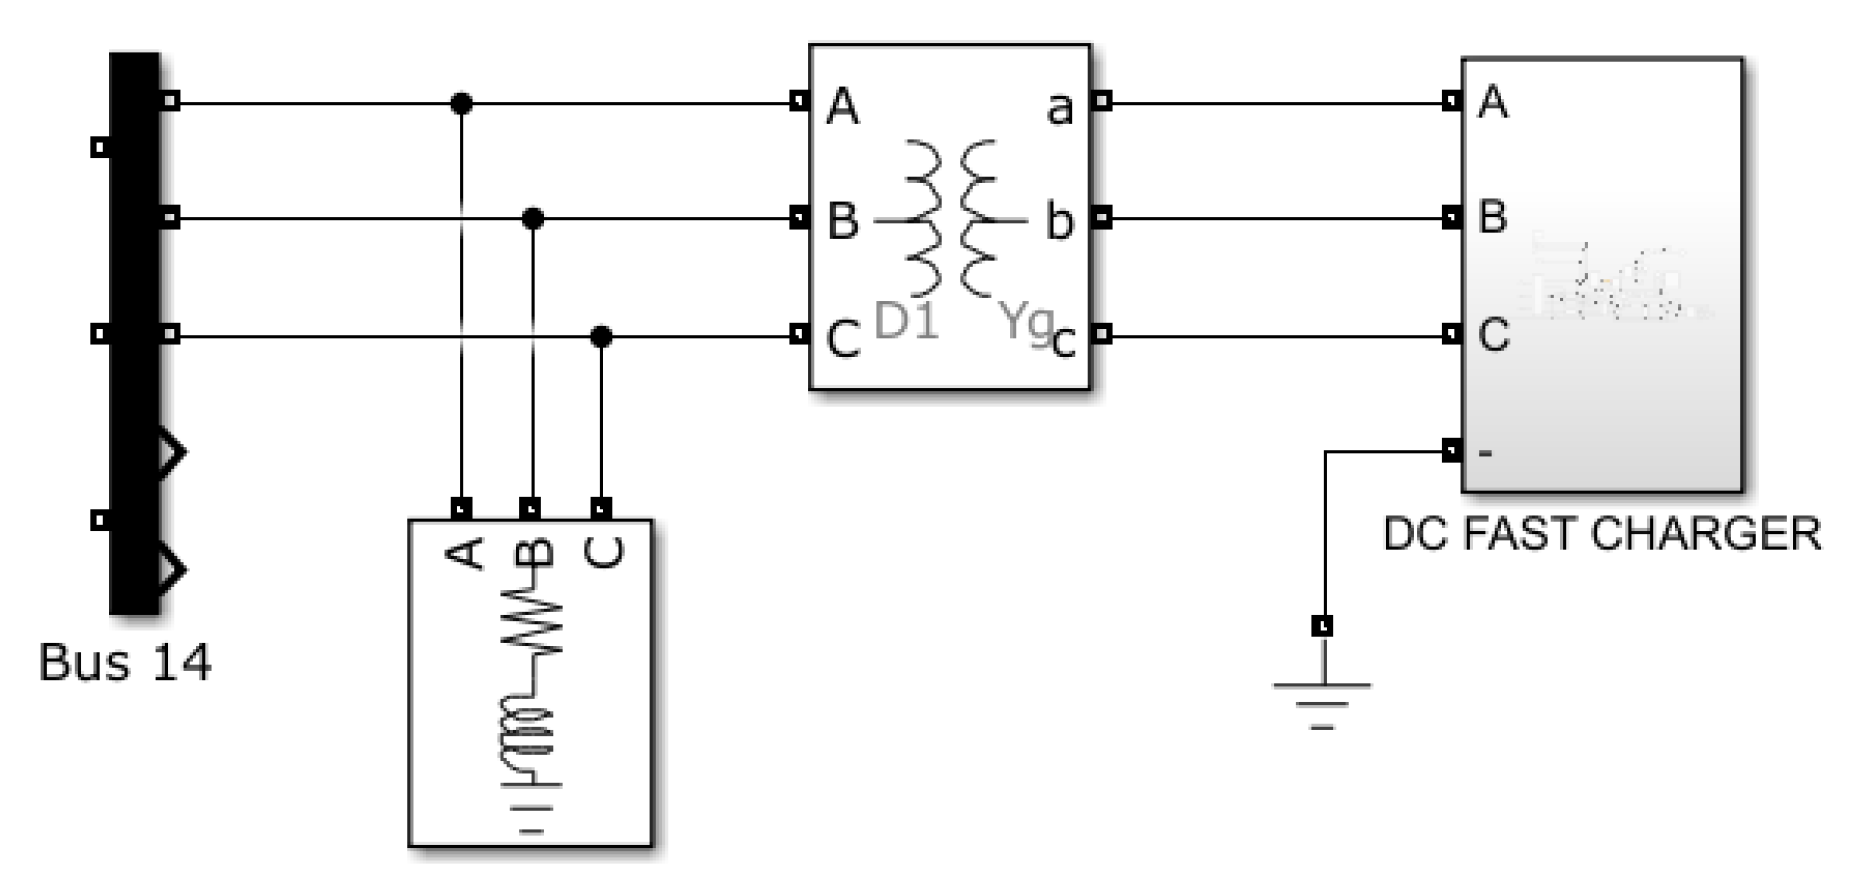
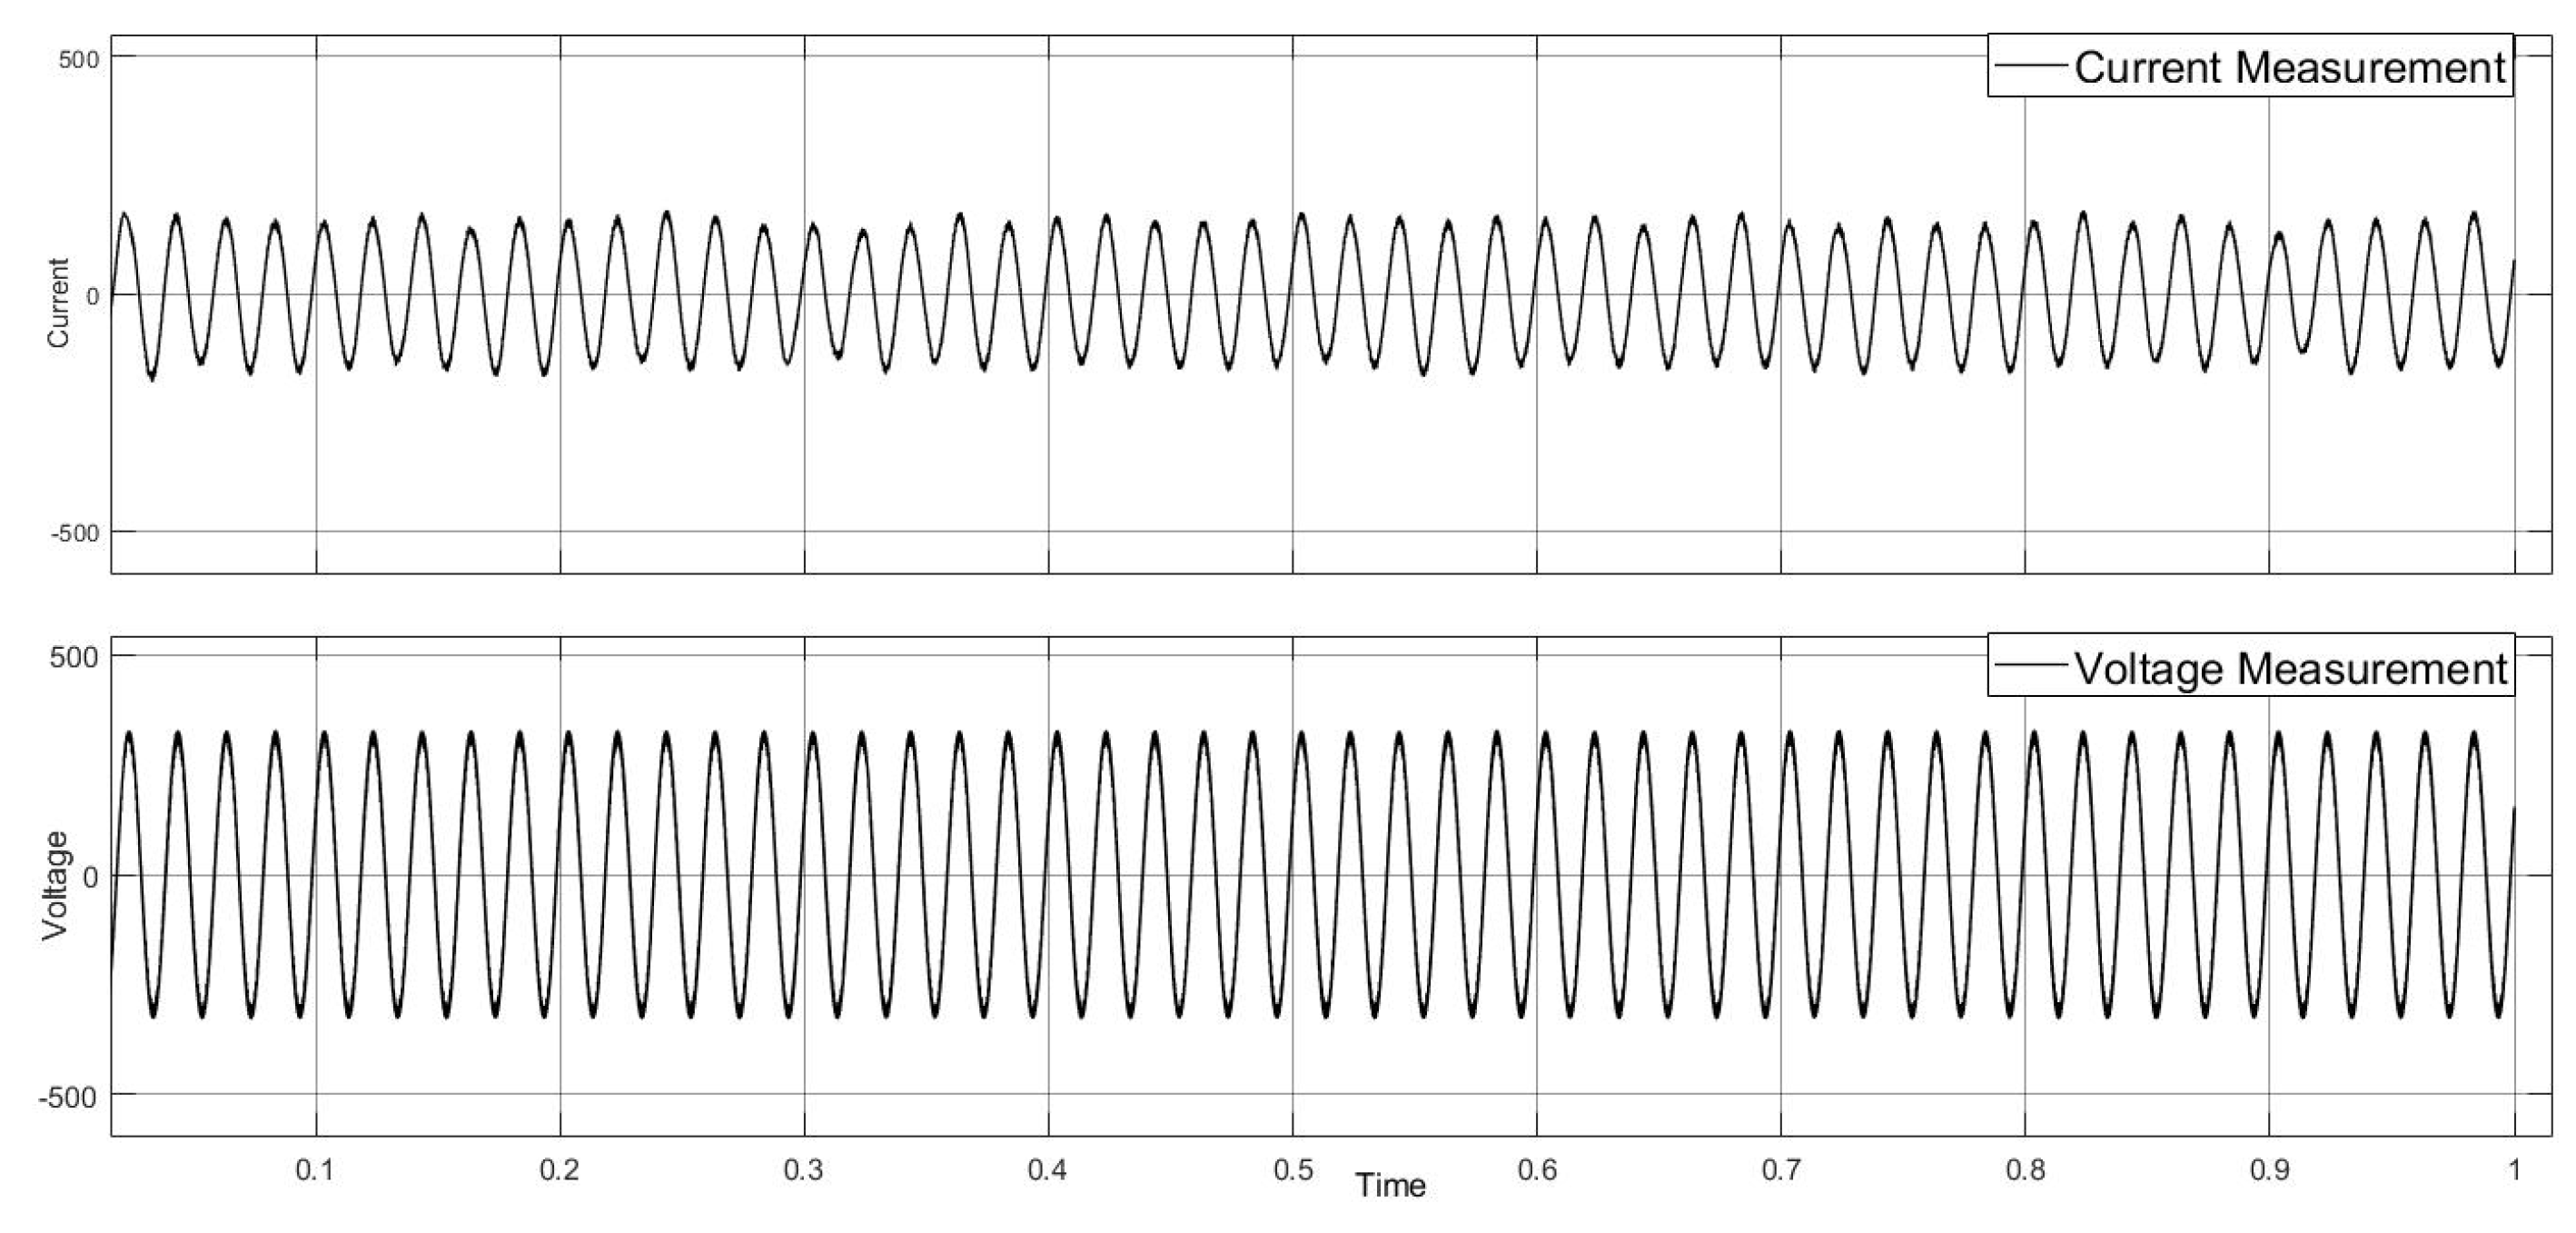
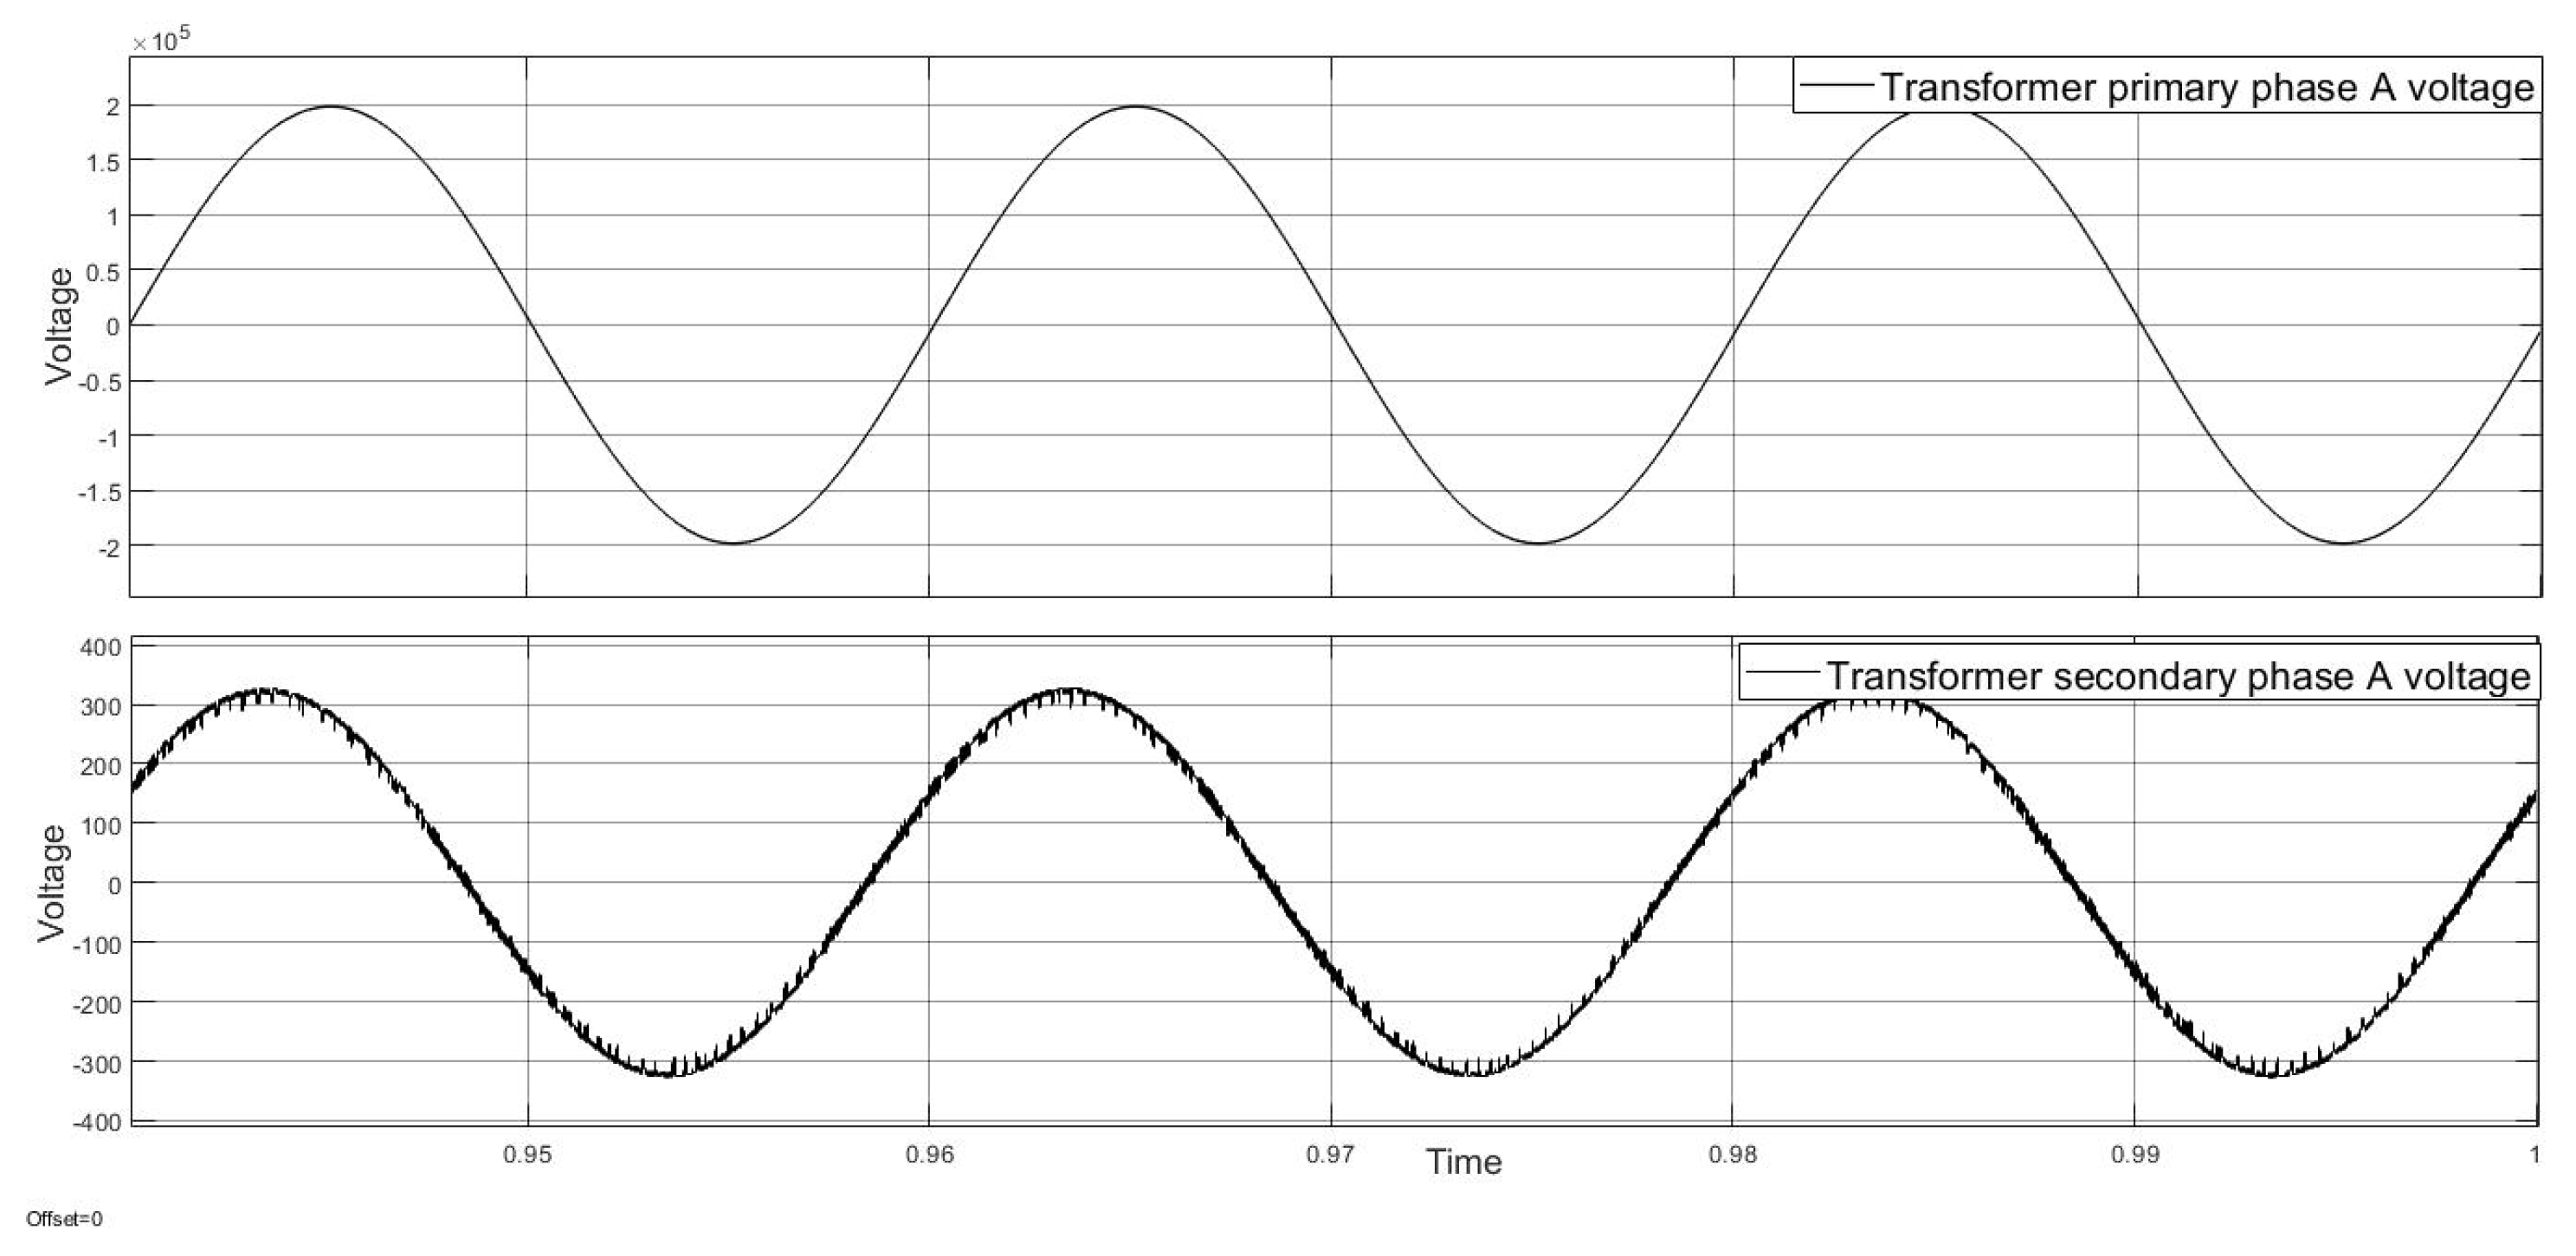
12], EV battery modeling, testing, and demand profile were studied. With the increase of non-linear loads with EV chargers, harmonic distortion increases will occur at the load inputs and energy connection points. The analysis of these increases will be beneficial in many aspects, such as determining the k factor, which indicates that the transformers specified in ANSI/IEEE C57.110 meet the non-linear loads without exceeding the temperature limits; the calculation and extension of the conductor life; selection of conductor cross-sections; selection of current and voltage transformers; and protection settings. In this study, the effects of total harmonic distortion (THD), which is one of the most important effects of charging stations on networks of different sizes with existing loads, and their effects on electrical energy quality, are investigated. IEEE 6-bus, 14-bus, and 30-bus power systems are modeled in Simulink. A 50 kW electric vehicle DC charger modeled in the Simulink environment is connected to these systems, which also include existing loads. In these network models, before the EV fast charger is connected, the current and voltage signal in the bus and the current and voltage signals in the secondary of the transformer, from which this charger is energized after the DC fast charger is connected, are activated. The harmonic distortions of these signals were calculated using FFT (Fast Fourier Transform) and the harmonic spectrum was extracted. In addition, growth rates of EVs to date and predicted future growth rates are looked at. Considering that EV charging stations will increase at the same rate, the rate of increase in charging stations and the current and voltage harmonic distortions found in the simulation results are used as inputs, and future total harmonic distortions are predicted by creating artificial neural networks. As a result of this situation, the problems that will occur in the electricity network if infrastructure works are not carried out on the network are shown and attention is drawn to the problems that are valid in countries with similar network systems, and solutions are offered.

2. IEEE 6-Bus, IEEE 14-Bus, and IEEE 30-Bus Power Test Systems Data and Simulink Models

The IEEE 6-bus, 14-bus, and IEEE 30-bus power test system used in this study represents a part of the American Electrical Power System in December 1961. These test systems were modeled using MATLAB Simulink (MatWorks Matrix Laboratory, Portola Valley, U.S.) [13].
There are three generators and three load buses in the IEEE 6-bus power system.
The IEEE 14-bus test system has five generators and 11 fixed loads.
The IEEE 30-bus test system has six generators and twenty-one load buses.
Three different test systems with 6 buses, 14 buses, and 30 buses were used in the study. The reason for this is to be able to see the effect of charging stations in networks of different sizes. Loads for 30-, 14-, and 6-bus systems are shown in Table 1, Table 2 and Table 3.
In the analysis of power systems, per-unit system values are used. This system is one created by proportioning real physical quantities to some values based on the load values. Thus, the values used in the analysis of power systems will be smaller and the analysis will be easier. In order to find the actual values of the system, the base values must be known. The actual values of the system can be found by using the base values. Base values can be found in Table 4.

3. Charging Stations Model

A vehicle charging station that will draw electrical energy from the power test systems used in the study was modeled using MATLAB Simulink and shown in Figure 1.
The modeled charging station is a 50 kW DC charging station. It is fed by the energy input from the secondary output of the transformer connected to the AC mains. A three-phase rectifier with pulse width modulation (PWM) control is used in the charging station model. A buck circuit is used with this rectifier. The charging station output is connected to a lithium-ion battery pack in the model. Thus, when the model is connected to the grid, the moment of charging the electric vehicle from the grid is simulated. In the model, the state of charge, charging station output voltage and current values, and the current and voltage values at the rectifier input are also monitored. When the state of charge of the battery, which symbolizes the electric vehicle, is below 80%, the DC output of the charging station is 125 A. This charging station will receive energy from IEEE 6-bus, 14-bus, and 30-bus power systems.

4. THD Calculation and Simulation Results

As a result of technological developments and the demands brought by them, the need for energy is increasing day by day and new loads are added to the electrical power systems. In this study, as described above, EV charging stations are focused on as new loads. Since these loads consist of power electronic circuits, they are non-linear loads and have great effects on energy quality in electrical power systems. Therefore, harmonic effects are limited in international standards [14,15,16]. The limits in the relevant standard are defined as the common connection point between the system operator and users. It is based on the point closest to the user in the power system. For commercial users, which are considered to be included in the system modeled in this study, the common connection point is usually on the low voltage side of the service transformers. Non-linear loads such as modeled EV charging stations will cause current harmonics in the power lines of the system operator. This situation will be reflected to other users in subsystems and buses as voltage harmonics [15]. In this study, harmonic distortions in current and voltage signals on the low voltage side of the service transformer, the charging station rectifier input, and the high voltage side of the transformer were investigated.
EV charging stations were connected to the modeled IEEE power test systems via a transformer. When examining the system, some research focused on three hypotheses.
a)
EV charging stations act on the grid as non-linear loads and have harmful effects on the low voltage side of the transformer.
b)
The current drawn while charging an electric vehicle creates a harmonic distortion and the total harmonic distortion changes as a function of time in the charging station cycle.
c)
Finally, when more than one charging station is fed from a common port, the total effects are greater than the effects of one charging station, and this will bring an upper limit for the number of charging stations that can be connected to the common port according to the relevant standards [15]. In addition, due to the increases over time, the limits in the standards will be exceeded and will cause problems in the electrical network.
In the IEEE 6-bus test system, first seen in Figure 2, a DC fast charger is connected to the 6th bus through a transformer.
Existing loads are also fed through the 6th bus, from which the EV fast charger receives energy. The same work was applied to 14-bus and 30-bus systems. In these systems, EV fast chargers are connected to bus 14 and bus 30. Connections are shown in Figure 3 and Figure 4.
When the model is run, the current signal at the A phase input in the primary of the transformer, the phase A current signal at the secondary output, the current signal at the A phase of the loads fed from the 6th bus, and the phase A current signals at the 6th bus input were examined. These signals are shown in Figure 5.
The charging station receives AC energy from the rectifier input. In addition to the current signals in Figure 5, the current and voltage signals at the rectifier input are shown in Figure 6. Transformer primary and secondary A phases voltage signals are shown in Figure 7.
As can be seen in Figure 5, Figure 6 and Figure 7, a distortion occurs in the current delivery signals in a power system where the EV fast charger is used in addition to the existing loads. It is necessary to calculate the level of deterioration for the collected data. For this, total harmonic distortions in current and voltage signals will be calculated. In these calculations, the total harmonic distortion for the voltage can be calculated as follows:
T H D U = h = 2 H U h 2 U 1 ,
The total harmonic distortion for the collected current data is calculated as follows:
T H D I = h = 2 H I h 2 I 1 ,
In Equations (1) and (2) above, h is the harmonic order number, I1, U1, are the current and voltage RMS (root mean square) values at the fundamental frequency (50 Hz), Ih, Uh are the root mean square mean (RMS) values of voltage, and current is h-th harmonic.
THD values were calculated for the current voltage signals in Figure 5, Figure 6 and Figure 7 and the results are shown in Figure 8, Figure 9, Figure 10 and Figure 11.
As can be seen, when an EV fast charger was connected as a non-linear load, a high current harmonic distortion occurred at the common connection point. This situation also caused a voltage harmonic distortion on the primary side of the transformer from the points it was in. These data were obtained by connecting an EV fast charger to six buses. Afterwards, three charging stations were connected to the same energy-receiving point and the data were taken again and THD was calculated using FFT. Calculated THDs are shown in Figure 12, Figure 13, Figure 14 and Figure 15.
As can be seen from the results, when the EV fast charger in the non-linear load class is connected to the common energy intake point in addition to the existing loads, the THD values increase as the number increases. The same procedures were performed in the IEEE 14-bus power test system and IEEE 30-bus power test system. The obtained values are shown in Table 5 by including the IEEE 6-bus system.

5. ANN Analysis

While examining a structure or application in the field of engineering, its modeling and how the results will be analyzed are done through this model. We can say that this analysis is best performed by the human brain. Artificial neural networks were created by being influenced by the analysis method of the human brain. Moreover, ANN does not require any acceptance from the beginning of the analysis. When compared to statistics-based methods, various assumptions must be made in all of these methods. However, in ANN, this is not needed. In addition, when the studies on power systems are examined, it is seen that ANN-based analyses are widely used [17,18,19]. As seen in Figure 16, an artificial neural network architecture has been created.
ANN (artificial neural network) consists of several layers: according to Figure 16, these are the input layer, the output layer, and the number of hidden layers to be determined in the ANN. The data in the input layer in the structure created here include bus numbers, EV DC charger numbers, and the years of this data. The output layer is taken as the transformer primary current THD, transformer secondary current THD, transformer primary voltage THD, and transformer secondary voltage THD. With the network structure created with neurons trained with this information, predictions can be made on the effect of EV chargers on the network for the following years. While training, 75% of the data was used for training and 25% of the data collection was used for validation. With the network structure created with neurons trained with this information, predictions can be made on the effect of EV chargers on the network for the following years. For IEEE 6, 14, and 30 bus systems, these points are the 6th bus in the 6-bus system, the 14th bus in the 14-bus system, and the 30th bus in the 30-bus power system; up to 50 charging stations have been connected, increasing over the years. By running the system in simulation, spectra were created by FFT analysis. Output spectra are transformer HV primary THDI, THDU transformer LV secondary THDI, and THDU values. Linear regression analysis of the artificial neural network is shown in Figure 17.
According to the analysis, it is seen that the correlation coefficient is 0.98208. This result is satisfactory for the network created. With the network created here, future charging station grid effect estimations can be made.

6. Results

In this study, the effects of electric vehicle charging stations on the electricity grid were investigated and three hypotheses were emphasized. According to these hypotheses, EV charging stations are considered as non-linear loads and it is said that they will have harmful effects on the transformer. Another hypothesis is that while the EV is charging, harmonic distortion occurs while drawing current due to the power electronic elements and switching in the structure of the charging station. Finally, when more than one charging station is connected to the common connection point where energy is taken from the electricity grid, the effects will increase on the grid and conductors. These hypotheses were analyzed and analysis methods in IEEE 519.2022 standards were applied. Different numbers of EV DC charging stations were connected to IEEE 6-, 14-, and 30-bus power systems with different physical sizes and their effects were investigated.
Time-dependent periodic changes of voltage and current signals are shown in Figure 5, Figure 6 and Figure 7. When we look at these figures, it is seen that there is a deterioration in the current signal, especially on the secondary side of the transformer, while the EV charging station is charging the electric vehicle. This distortion is also reflected on the primary side of the transformer. The harmonic distortions that occur on the current are also reflected on the lower buses and show themselves as voltage harmonics [20,21,22,23,24,25,26]. For the analysis of harmonic effects, harmonic spectra were created according to the fundamental frequency (50 Hz) component in Figure 8, Figure 9, Figure 10, Figure 11, Figure 12, Figure 13, Figure 14 and Figure 15 and spectral plots of the harmonic magnitudes corresponding to the frequency values are shown. In these analyses, it can be seen that the current and voltage distortion in the secondary side of the transformer is higher than the current and voltage distortion in the primary side. In addition, THDs generated as a result of connecting more than one charging station to the grid common port have increased and it can be understood that the damage to the grid energy quality and therefore to the grid and loads will increase. Looking at the spectral graphs in Figure 8, Figure 9, Figure 10, Figure 11, Figure 12, Figure 13, Figure 14 and Figure 15, the degrees of harmonic distortion occurring in the energy system are also seen. Harmonic distortions, which continue in the form of single multiples of the fundamental frequency, show themselves in different sizes as the number of charging stations connected to the grid increase in the study simulations. In the given graphs, 3rd harmonic and 5th harmonic components are dominant. Especially when there is no phase difference between the 3rd harmonic components, they can create more current load on the neutral conductors than the current on the phase conductors. This situation can cause great damage to both the devices fed from the system and the life of the conductors.
Considering the effects of EV charging stations on networks of different sizes, it is seen that as the grid size increases, the distortions in current and voltage signals also increase, relatively. While evaluating this situation, the nature of the current loads belonging to the networks is also important. It should not be forgotten that harmonic distortions in networks with loads different from the current loads in the modeled networks may be more or less according to the load characteristics. However, it has been seen that the effects on the common buses will be greater as a result of the sudden energy intake of the charging stations and the energy consumption of more than one large power. In addition, harmonic distortions that will occur with the effect of switching elements of power electronic semiconductors in the switching on and off of charging stations with different numbers and different powers at different times will also have great detrimental effects on the system.
Another point that draws attention in this study is the differences in the current signal drawn from the grid while charging electric vehicles with different occupancy rates. The EV far charger designed in this study also has a state of charge control. It is observed that the harmonic distortions occurring in the high current time in the EV charging cycle increase more in the low current time; that is, when the state of charge exceeds 80%, the distortions on the current signal increase. In the harmonic spectrum analysis shown in Figure 8, THD is 1.51%. While performing this analysis, the battery charge rate of the electric vehicle was set as 30%. In this case, it is charged with a 125 A current. On the other hand, with the FFT spectrum seen in Figure 18, the battery charge rate is set to 90%. In this case, the EV charging current decreased to 20 A. This is a method applied for battery health management.
As seen in Figure 18, harmonic distortions have increased. This situation should be prevented in practice, and in terms of improving both battery life and energy quality, it would be more appropriate not to charge electric vehicles above 80% under today’s conditions.
In the continuation of the study, it was assumed that the number of electric vehicles charging stations have increased over the years, and as a result of this increase, the effects on the energy quality in the electricity grid were estimated. In this direction, considering the electric vehicle increase rate specified in [3] in the estimation architecture created using artificial neural networks, and further, according to a McKinsey and Company analysis, which is working on the preparation of [3], 3.4 million charging station points will be needed in 2030, considering the increase rate of electric vehicles in Europe. It is also said that there are 375,000 electric vehicle charging station points in Europe in 2021. In this case, there will be an increase in the installation of charging stations by around 90% for the first time and this increase will decrease in the following years. However, in the next 10 years, a large number of charging points will be installed and the energy demand will increase at the same rate. Considering this situation, an artificial neural network was created for the effects on the network with the increase amount determined as 90%. In this way, the effects on the existing networks were estimated, providing benefits in terms of infrastructure planning and investment analysis.
Another issue that should be mentioned at this point for charging stations is the situation of ghost loads. Even if the charging station is not working, there is a power consumption for the power circuits and continuously operating circuit elements such as Liquid Crystal Display (LCD) screens and indicators for level 3 DC charging stations. This power consumption [27] is 0.3 kWh for every 15 min period and 1.2 kWh for one hour. This shows that even if the charging stations do not work, they draw energy from the grid and may have effects on the system.
Subsequently, when we evaluate within the framework of standards related to IEEE harmonics, it is seen that the harmonic analyses made according to the number of charging stations connected in the tested power systems are within the limits of the relevant standards shown in Table 6 [15].
However, as the number of charging stations fed from the common connection point increases, harmonic distortions in current and voltage signals increase, and as a result of the estimation study using artificial neural networks, it has been seen that the current network will not be able to respond to the increase rate of charging stations in 2030. As a result, the same approach can be applied in similar networks and networks of different sizes: estimations can be made and infrastructure planning can be done. As can be understood from the results, the electricity grid infrastructure should be developed in the next 10 years, and the necessary studies should be carried out for the increase in the number of charging stations and other technological developments and renewable technologies.

Author Contributions

Writing—review and editing, K.O.; supervision, N.Ç. All authors have read and agreed to the published version of the manuscript.

Funding

This research received no external funding.

Institutional Review Board Statement

Not applicable.

Informed Consent Statement

Not applicable.

Data Availability Statement

Not applicable.

Conflicts of Interest

The authors declare no conflict of interest.

References

  1. Olcay, K.; Cetinkaya, N. Solar Power Plant Suggestion for Charging Electric Vehicles and The Effects of The System on The Electric Network and CO2 Emission. In Proceedings of the 2021 IEEE 2nd KhPI Week on Advanced Technology (KhPIWeek), Kharkiv, Ukraine, 13–17 September 2021; pp. 249–254. [Google Scholar] [CrossRef]
  2. Qian, K.; Zhou, C.; Allan, M.; Yuan, Y. Modeling of Load Demand Due to EV Battery Charging in Distribution Systems. IEEE Trans. Power Syst. 2011, 26, 802–810. [Google Scholar] [CrossRef]
  3. ACEA (The European Automobile Manufacturers’ Association). Making The Transition to Zero-Emission Progress Report 2022. Available online: https://www.acea.auto/publication/2022-progress-report-making-the-transition-to-zero-emission-mobility/ (accessed on 7 June 2022).
  4. Hadley, S.W.; Tsvetkova, A.A. Potential Impacts of Plug-in Hybrid Electric Vehicles on Regional Power Generation. Electr. J. 2009, 20, 56–68. [Google Scholar] [CrossRef] [Green Version]
  5. Lucas, A.; Bonavitacola, F.; Kotsakis, E.; Fulli, G. Grid harmonic impact of multiple electric vehicle fast charging. Electr. Power Syst. Res. 2015, 127, 13–21. [Google Scholar] [CrossRef]
  6. Basu, M.; Gaughan, K.; Coyle, E. Harmonic distortion caused by EV battery chargers in the distribution systems network and its remedy. In Proceedings of the 39th International Universities Power Engineering Conference, UPEC 2004—Conference Proceedings, Bristol, UK, 6–8 September 2004; pp. 869–873. [Google Scholar]
  7. Sun, Y.; De Jong, E.; Cuk, V.; Cobben, J.F.G. Ultra-fast charging station harmonic resonance analysis in the Dutch MV grid: Application of power converter harmonic model. CIRED-Open Access Proc. J. 2017, 10, 879–882. [Google Scholar] [CrossRef] [Green Version]
  8. Richardson, P.; Flynn, D.; Keane, A. Impact assessment of varying penetrations of electric vehicles on low voltage distribution systems. In Proceedings of the IEEE PES General Meeting, Minneapolis, MN, USA, 25–29 July 2010; pp. 1–6. [Google Scholar] [CrossRef]
  9. Bass, R.; Harley, R.; Lambert, F.; Rajasekaran, V.; Pierce, J. Residential harmonic loads and EV charging. In Proceedings of the 2001 IEEE Power Engineering Society Winter Meeting. Conference Proceedings (Cat. No.01CH37194), Columbus, OH, USA, 28 January 2001–1 February 2001; pp. 803–808. [Google Scholar] [CrossRef]
  10. Fujun, T.; Ruiheng, X.; Dong, C.; Lijia, R.; Quanning, Y.; Yan, Z. Research on the harmonic characteristics of electric vehicle fast charging stations. In Proceedings of the 2017 2nd International Conference on Power and Renewable Energy (ICPRE), Chengdu, China, 20–23 September 2017; pp. 805–809. [Google Scholar] [CrossRef]
  11. Cheng, L.; Wu, B.; Chen, H.; Ma, W.; Zhang, G. Load Forecasting and Harmonic Analysis for EV Charging Station. In Proceedings of the 2018 IEEE Innovative Smart Grid Technologies—Asia (ISGT Asia), Singapore, 22–25 May 2018; pp. 139–144. [Google Scholar] [CrossRef]
  12. Marra, F.; Yang, G.Y.; Træholt, C.; Larsen, E.; Rasmussen, C.N.; You, S. Demand profile study of battery electric vehicle under different charging options. In Proceedings of the 2012 IEEE Power and Energy Society General Meeting, San Diego, CA, USA, 22–26 July 2012; pp. 1–7. [Google Scholar] [CrossRef]
  13. Al-Roomi, A.R. Power Flow Test Systems Repository; Electrical and Computer Engineering, Dalhousie University: Halifax, NS, Canada, 2015; Available online: https://al-roomi.org/power-flow (accessed on 1 December 2022).
  14. Hoevenaars, T.; LeDoux, K.; Colosino, M. Interpreting IEEE STD 519 and meeting its harmonic limits in VFD applications. In Proceedings of the IEEE Industry Applications Society 50th Annual Petroleum and Chemical Industry Conference, 2003. Record of Conference Papers, Houston, TX, USA, 15–17 September 2003; pp. 145–150. [Google Scholar] [CrossRef]
  15. IEEE Std 519-2022 (Revision of IEEE Std 519-2014); IEEE Standard for Harmonic Control in Electric Power Systems. IEEE Standards Association: Piscataway, NJ, USA, 2022; pp. 1–31. [CrossRef]
  16. Barr, R.A.; Gosbell, V.J. Power system harmonic voltage limits for the future. In Proceedings of the 2014 16th International Conference on Harmonics and Quality of Power (ICHQP), Bucharest, Romania, 25–28 May 2014; pp. 483–487. [Google Scholar] [CrossRef]
  17. Sharma, P.; Saini, D.; Saxena, A. Fault Detection and Classification in Transmission Line Using Wavelet Transform and ANN. Bull. Electr. Eng. Inform. 2016, 5, 284–295. [Google Scholar] [CrossRef] [Green Version]
  18. Jamil, M.; Sharma, S.K.; Singh, R. Fault detection and classification in electrical power transmission system using artificial neural network. Springer Plus 2015, 4, 334. [Google Scholar] [CrossRef] [PubMed] [Green Version]
  19. Singh, S.; Mamatha, K.R.; Mamatha, K.R. Intelligent Fault Identification System for Transmission Lines Using Artificial Neural Network. IOSR J. Comput. Eng. 2014, 16, 23–31. Available online: www.iosrjournals.org (accessed on 5 December 2022). [CrossRef]
  20. Mousavi Agah, S.M.; Abbasi, A. The impact of charging plug-in hybrid electric vehicles on residential distribution transformers. In Proceedings of the Iranian Conference on Smart Grids, Tehran, Iran, 24–25 May 2012; pp. 1–5. [Google Scholar]
  21. Pothinun, T.; Premrudeepreechacharn, S. Power Quality Impact of Charging Station on MV Distribution Networks: A Case Study in PEA Electrical Power System. In 2018 53rd International Universities Power Engineering Conference (UPEC); IEEE: Piscataway, NJ, USA, 2018; pp. 1–6. [Google Scholar] [CrossRef]
  22. Bosak, A.; Bosak, A.; Kulakovskyi, L.; Oboronov, T. Impact of EV Chargers on Total Harmonic Distortion in the Distribution System Network. In Proceedings of the 2019 IEEE 6th International Conference on Energy Smart Systems (ESS), Kyiv, Ukraine, 17–19 April 2019; pp. 329–333. [Google Scholar] [CrossRef]
  23. Kütt, L.; Saarijärvi, E.; Lehtonen, M.; Mõlder, H.; Niitsoo, J. Current harmonics of EV chargers and effects of diversity to charging load current distortions in distribution networks. In Proceedings of the 2013 International Conference on Connected Vehicles and Expo (ICCVE), Las Vegas, NV, USA, 2–6 December 2013; pp. 726–731. [Google Scholar] [CrossRef]
  24. Mazurek, P.; Chudy, A. An Analysis of Electromagnetic Disturbances from an Electric Vehicle Charging Station. Energies 2022, 15, 244. [Google Scholar] [CrossRef]
  25. Basta, B.; Morsi, W.G. Low and high order harmonic distortion in the presence of fast charging stations. Int. J. Electr. Power Energy Syst. 2021, 126, 106557. [Google Scholar] [CrossRef]
  26. Khan, W.; Ahmad, F.; Alam, M.S. Fast EV charging station integration with grid ensuring optimal and quality power exchange. Eng. Sci. Technol. Int. J. 2019, 22, 143–152. [Google Scholar] [CrossRef]
  27. Robert, B.B.; Zimmerman, N. Impacts of Electric Vehicle Charging on Electric Power Distribution Systems. In Electrical and Computer Engineering Faculty Publications and Presentations; OTREC-SS-731; Transportation Research and Education Center (TREC): Portland, OR, USA, 2013. [Google Scholar] [CrossRef]
Figure 1. Electric vehicle DC charging station.
Energies 16 01282 g001
Figure 2. A 6-bus system EV charging station connection.
Energies 16 01282 g002
Figure 3. A 14-bus system EV charging station connection.
Energies 16 01282 g003
Figure 4. A 30-bus system EV charging station connection.
Energies 16 01282 g004
Figure 5. The 6-bus system EV charging station current signals.
Energies 16 01282 g005
Figure 6. EV charging station rectifier input current and voltage signals.
Energies 16 01282 g006
Figure 7. Transformer primary and secondary A phases voltage signals.
Energies 16 01282 g007
Figure 8. Transformer primary current total harmonic distortion.
Energies 16 01282 g008
Figure 9. Transformer secondary/rectifier input current total harmonic distortion.
Energies 16 01282 g009
Figure 10. Transformer primary voltage total harmonic distortion.
Energies 16 01282 g010
Figure 11. Transformer secondary/rectifier input voltage total harmonic distortion.
Energies 16 01282 g011
Figure 12. Transformer primary current total harmonic distortion for three EV fast chargers.
Energies 16 01282 g012
Figure 13. Transformer secondary/rectifier input current total harmonic distortion for three EV fast chargers.
Energies 16 01282 g013
Figure 14. Transformer primary voltage total harmonic distortion for three EV fast chargers.
Energies 16 01282 g014
Figure 15. Transformer secondary/rectifier input voltage total harmonic distortion for three EV fast chargers.
Energies 16 01282 g015
Figure 16. Multi-layer and forward-flow ANN.
Energies 16 01282 g016
Figure 17. Multi-layer and forward-flow ANN.
Energies 16 01282 g017
Figure 18. A 6-bus system current harmonic spectrum when SOC (state of charge) is 90%.
Energies 16 01282 g018
Table 1. IEEE 30-bus test system load values.
BusPload (p.u.)Qload (p.u.)
100
20.2170.127
30.0240.012
40.0760.016
50.9420.19
600
70.2280.109
80.30.3
900
100.0580.02
1100
120.1120.075
1300
140.0620.016
150.0820.025
160.0350.018
170.090.058
180.0320.009
190.0950.034
200.0220.007
210.1750.112
2200
230.0320.016
240.0870.067
2500
260.0350.023
2700
2800
290.0240.009
300.1060.019
200.0220.007
210.1750.112
2200
230.0320.016
240.0870.067
2500
260.0350.023
2700
2800
290.0240.009
Table 2. IEEE 14-bus test system load values.
BusPload (p.u.)Qload (p.u.)
100
20.2170.217
30.9420.191
40.478−0.039
50.0760.016
60.1120.075
700
800
90.2950.166
100.090.058
110.0350.018
120.0610.016
130.1350.058
140.1490.050
Table 3. IEEE 6-bus test system load values.
BusPload (p.u.)Qload (p.u.)
100
200
300
410.15
510.15
610.15
Table 4. Base values used in power systems.
Base NameValues
Sload100 MVA
Vbase230 kV
Zbase529 Ω
Table 5. EV fast charger effect THD values in IEEE 6-bus, 14-bus, and 30-bus test systems.
IEEE 6-BusIEEE 14-BusIEEE 30-Bus
1 Fast Charger3 Fast Chargers5 Fast Chargers1 Fast Charger3 Fast Chargers5 Fast Chargers1 Fast Charger3 Fast Chargers5 Fast Chargers
Transformer primary current total harmonic distortion1.51%1.66%2.53%0.53%1.98%2.76%0.99%2.65%2.57%
Transformer secondary/rectifier input current total harmonic distortion2.15%2.86%3.02%1.58%3.04%3.20%1.62%3.12%3.02%
Transformer primary voltage total harmonic distortion0.01%0.01%0.01%0.07%0.07%0.03%0.16%0.05%0.05%
Transformer secondary/rectifier input voltage total harmonic distortion0.94%95%1.02%1.01%1.18%1.21%4.29%1.09%1.10%
Table 6. Voltage distortion limits [15].
Bus Voltage V at PCC (Point of Common Coupling)Individual Harmonic (%) h ≤ 50THD (Total Harmonic Distortion) (%)
V ≤ 1 KV58
1 KV ≤ 69 kV35
69 KV ≤ 161 kV1.52.5
69 KV <11.5
Disclaimer/Publisher’s Note: The statements, opinions and data contained in all publications are solely those of the individual author(s) and contributor(s) and not of MDPI and/or the editor(s). MDPI and/or the editor(s) disclaim responsibility for any injury to people or property resulting from any ideas, methods, instructions or products referred to in the content.

