
Improve Ship Propeller Efficiency via Optimum Design of Propeller Boss Cap Fins
 ,
,
Abstract
:1. Introduction
2. Methodology
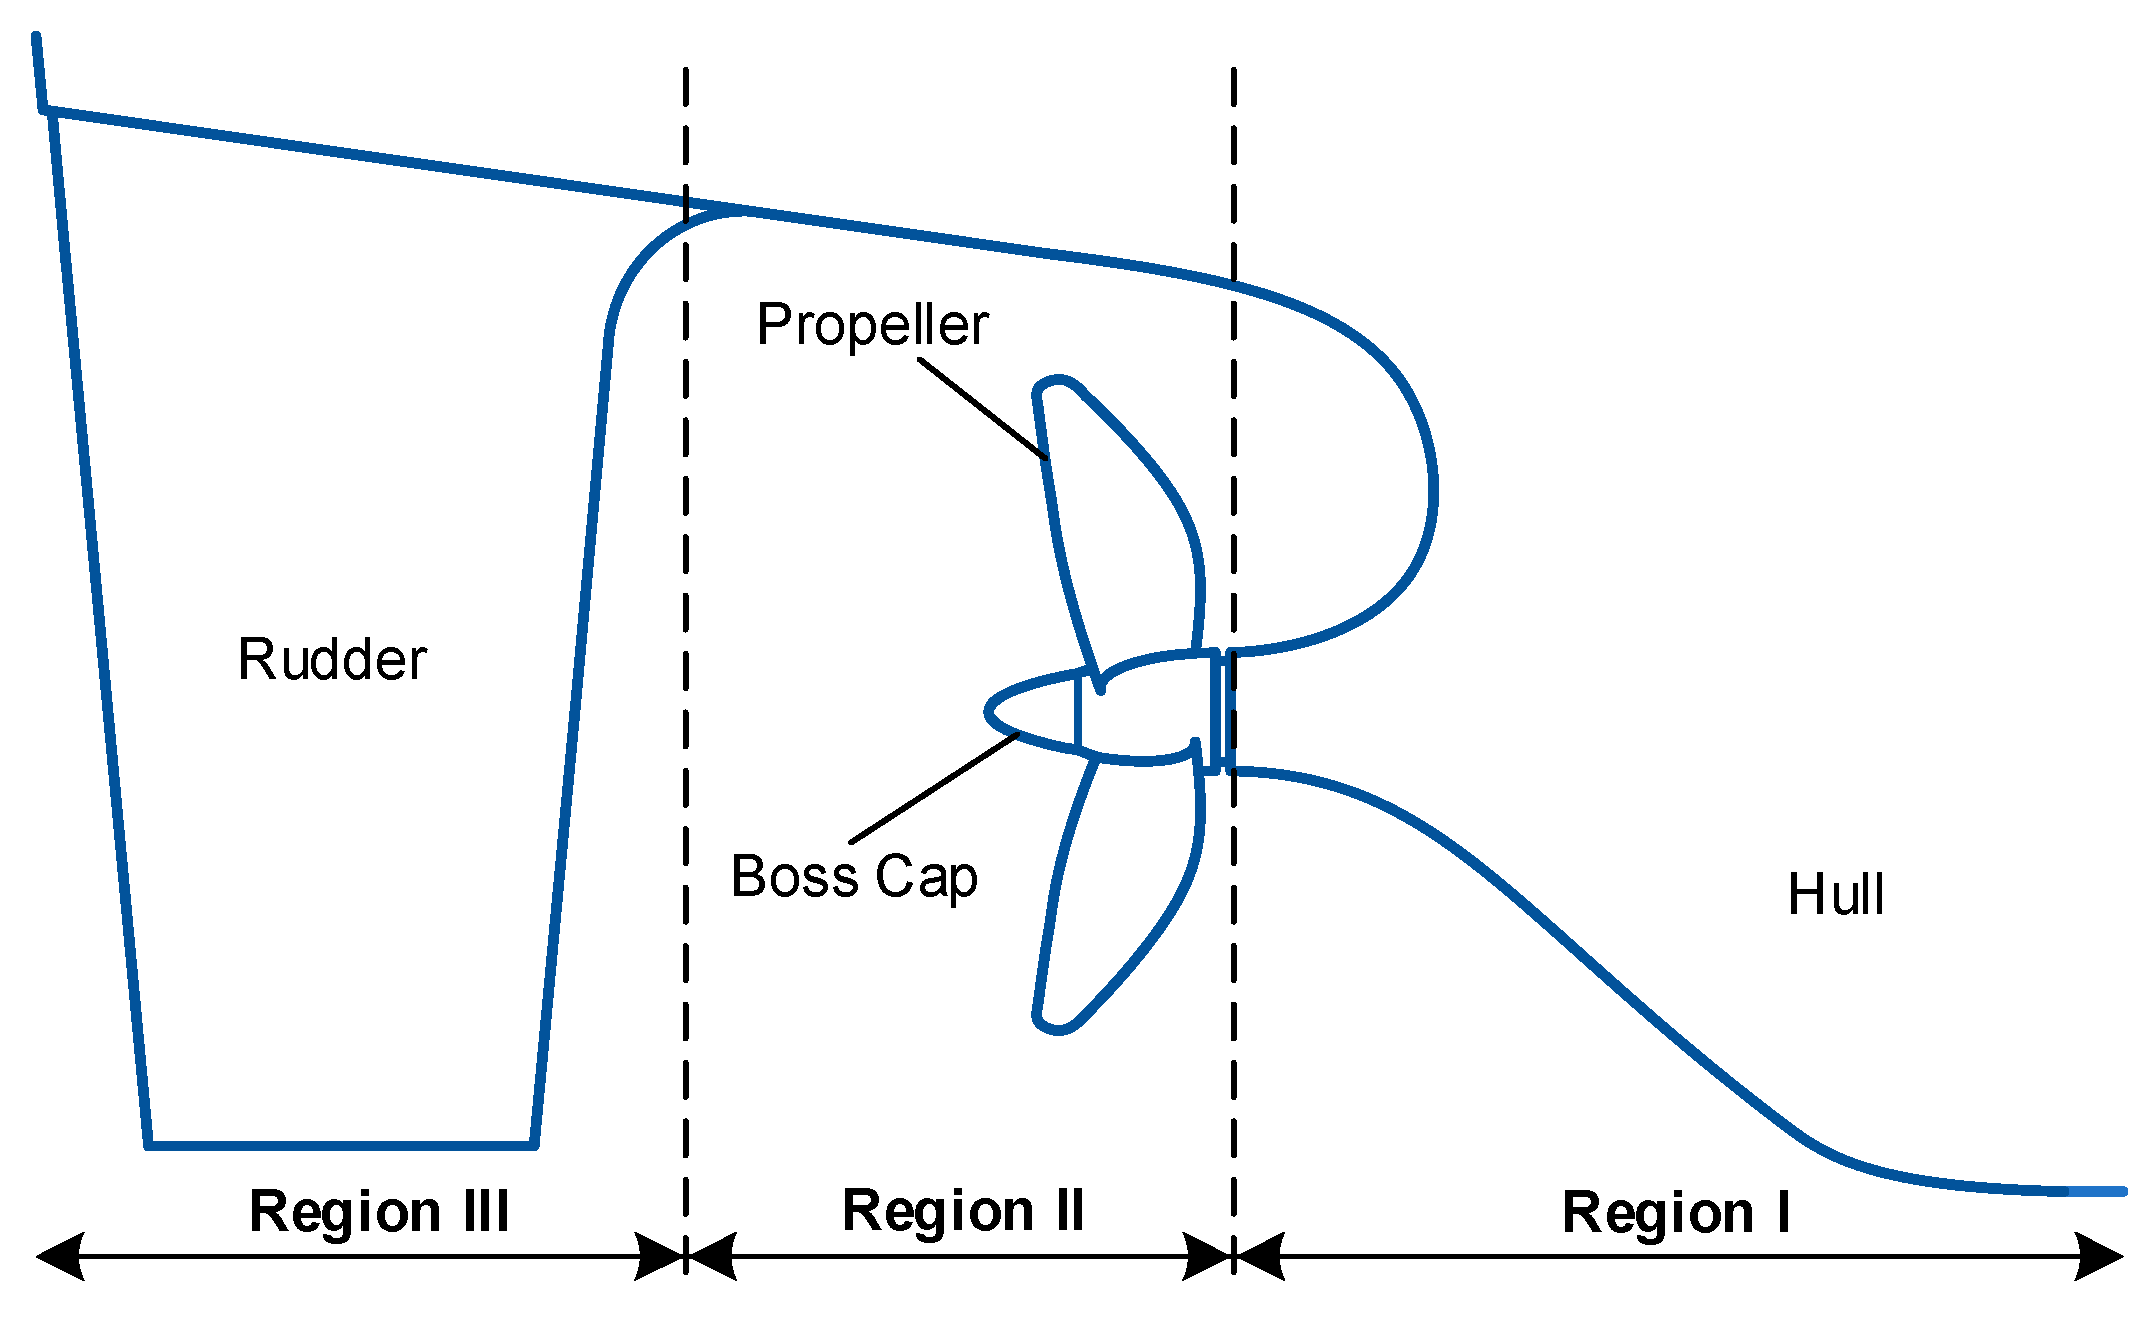
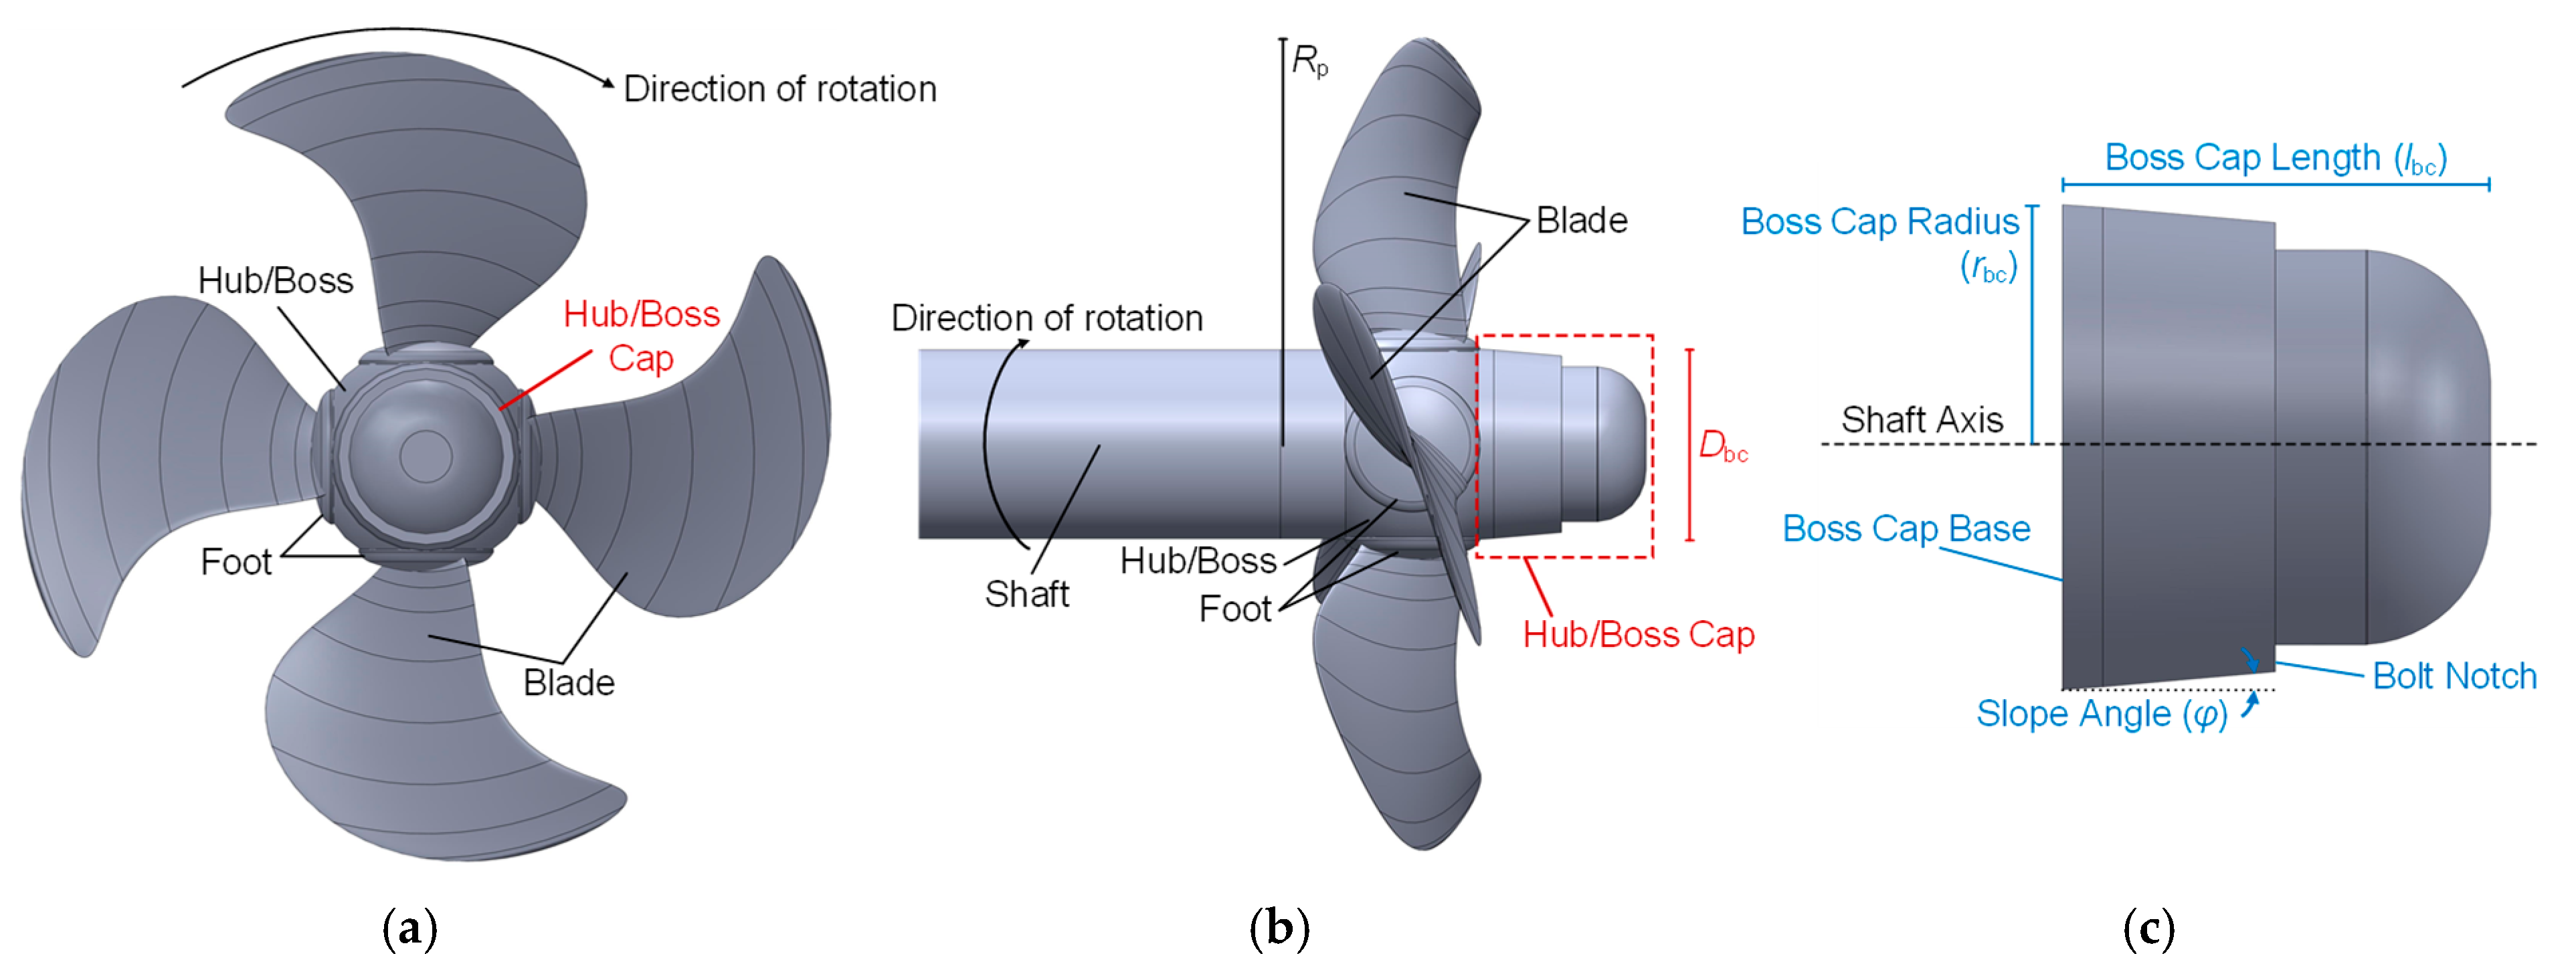
2.1. Experimental Tests on a Model-Scale Propeller/Rudder System
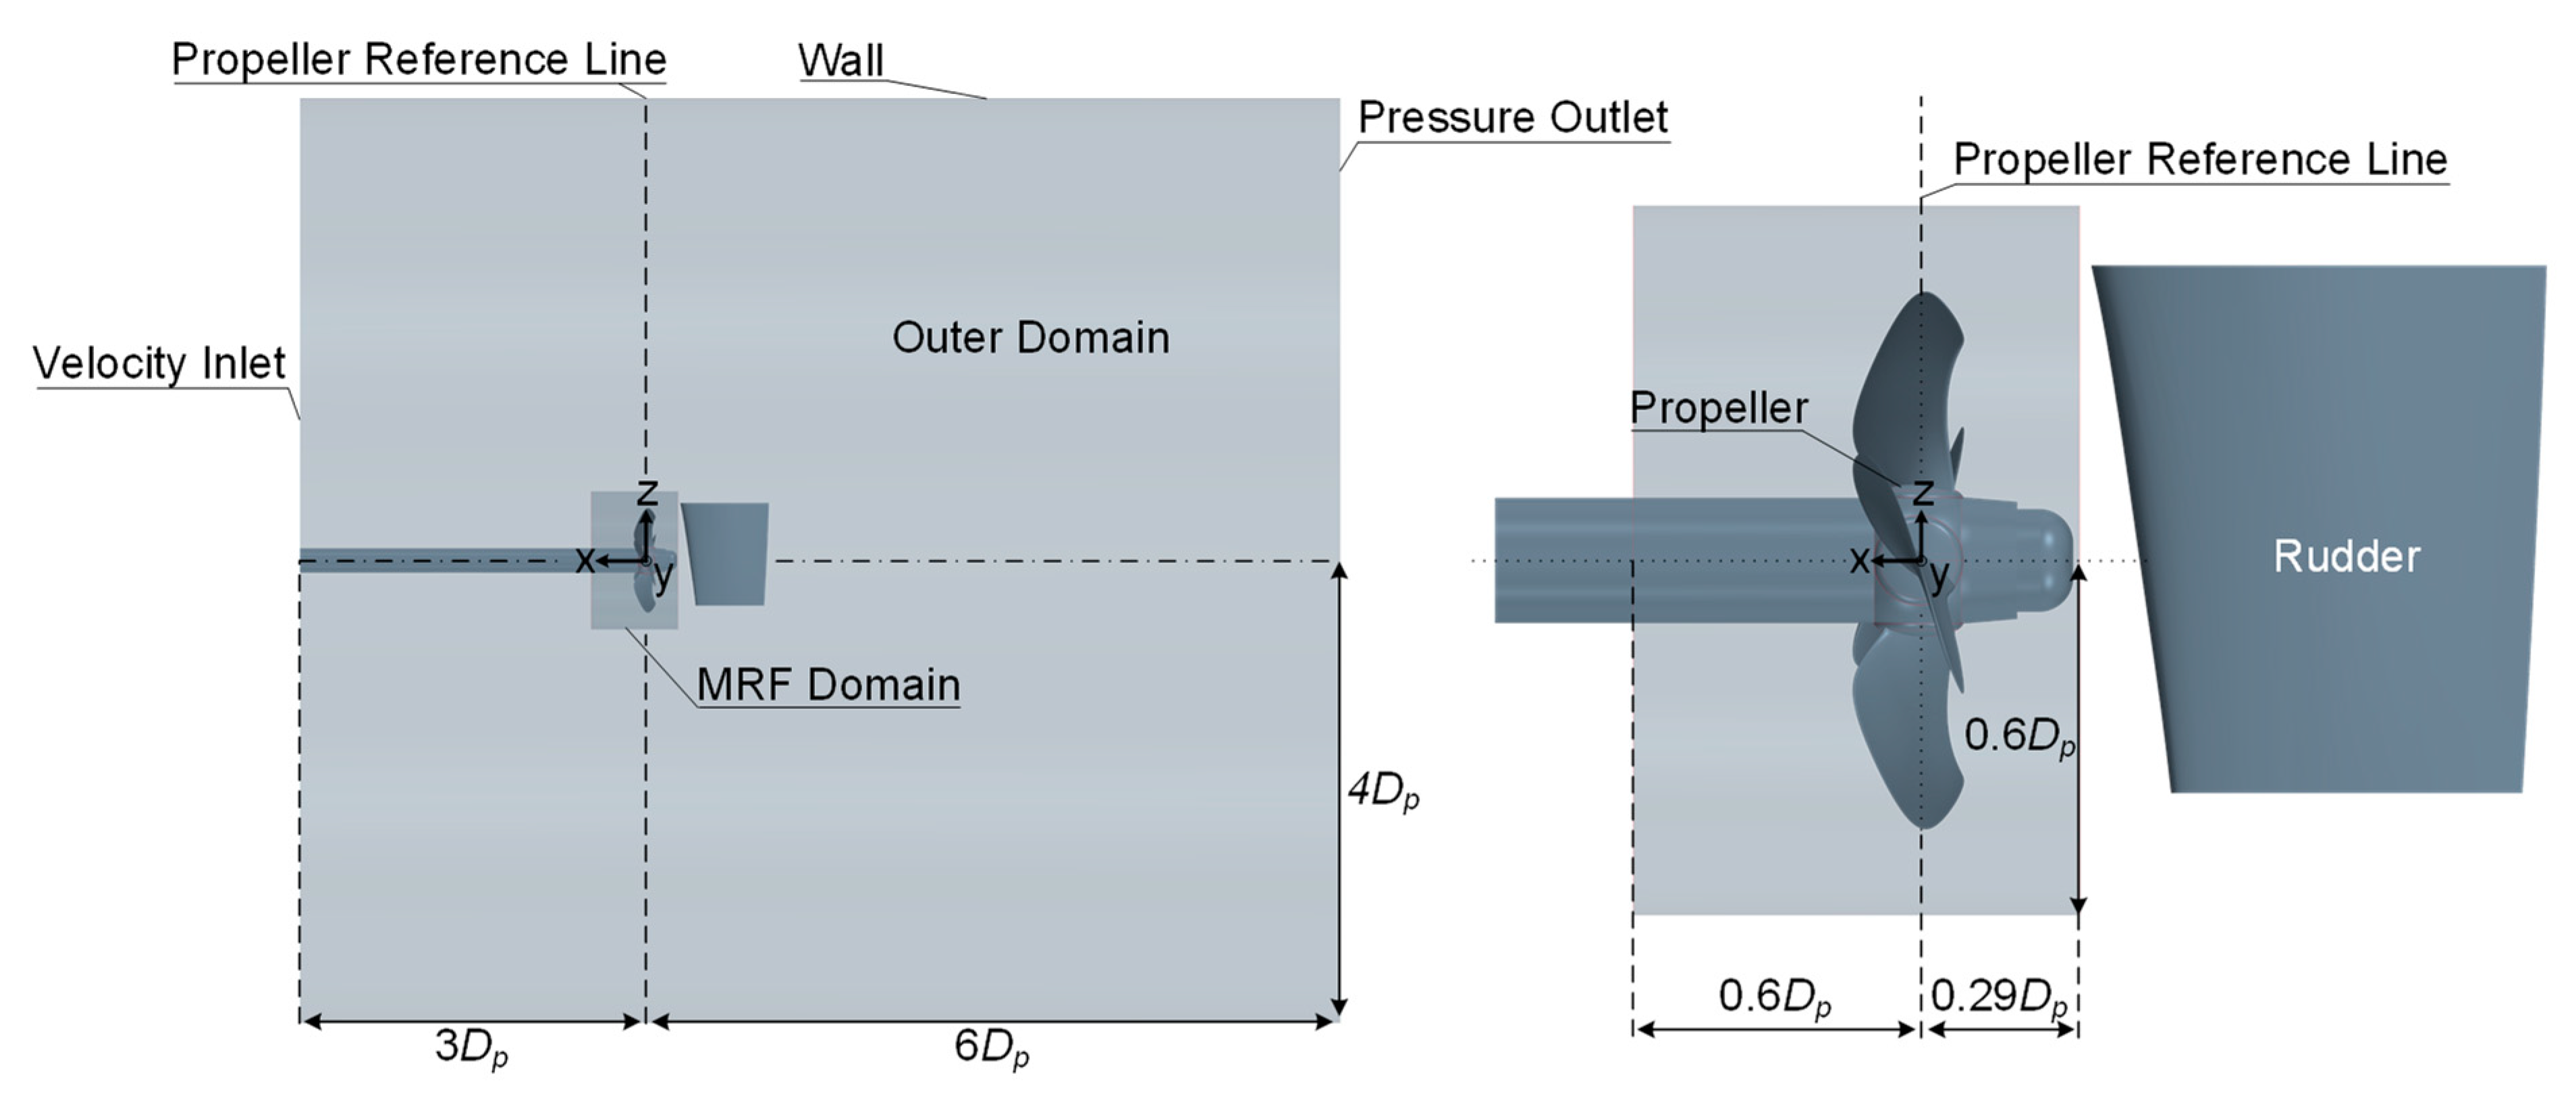
2.2. Development of a Digital Twin to Reproduce the Experiment
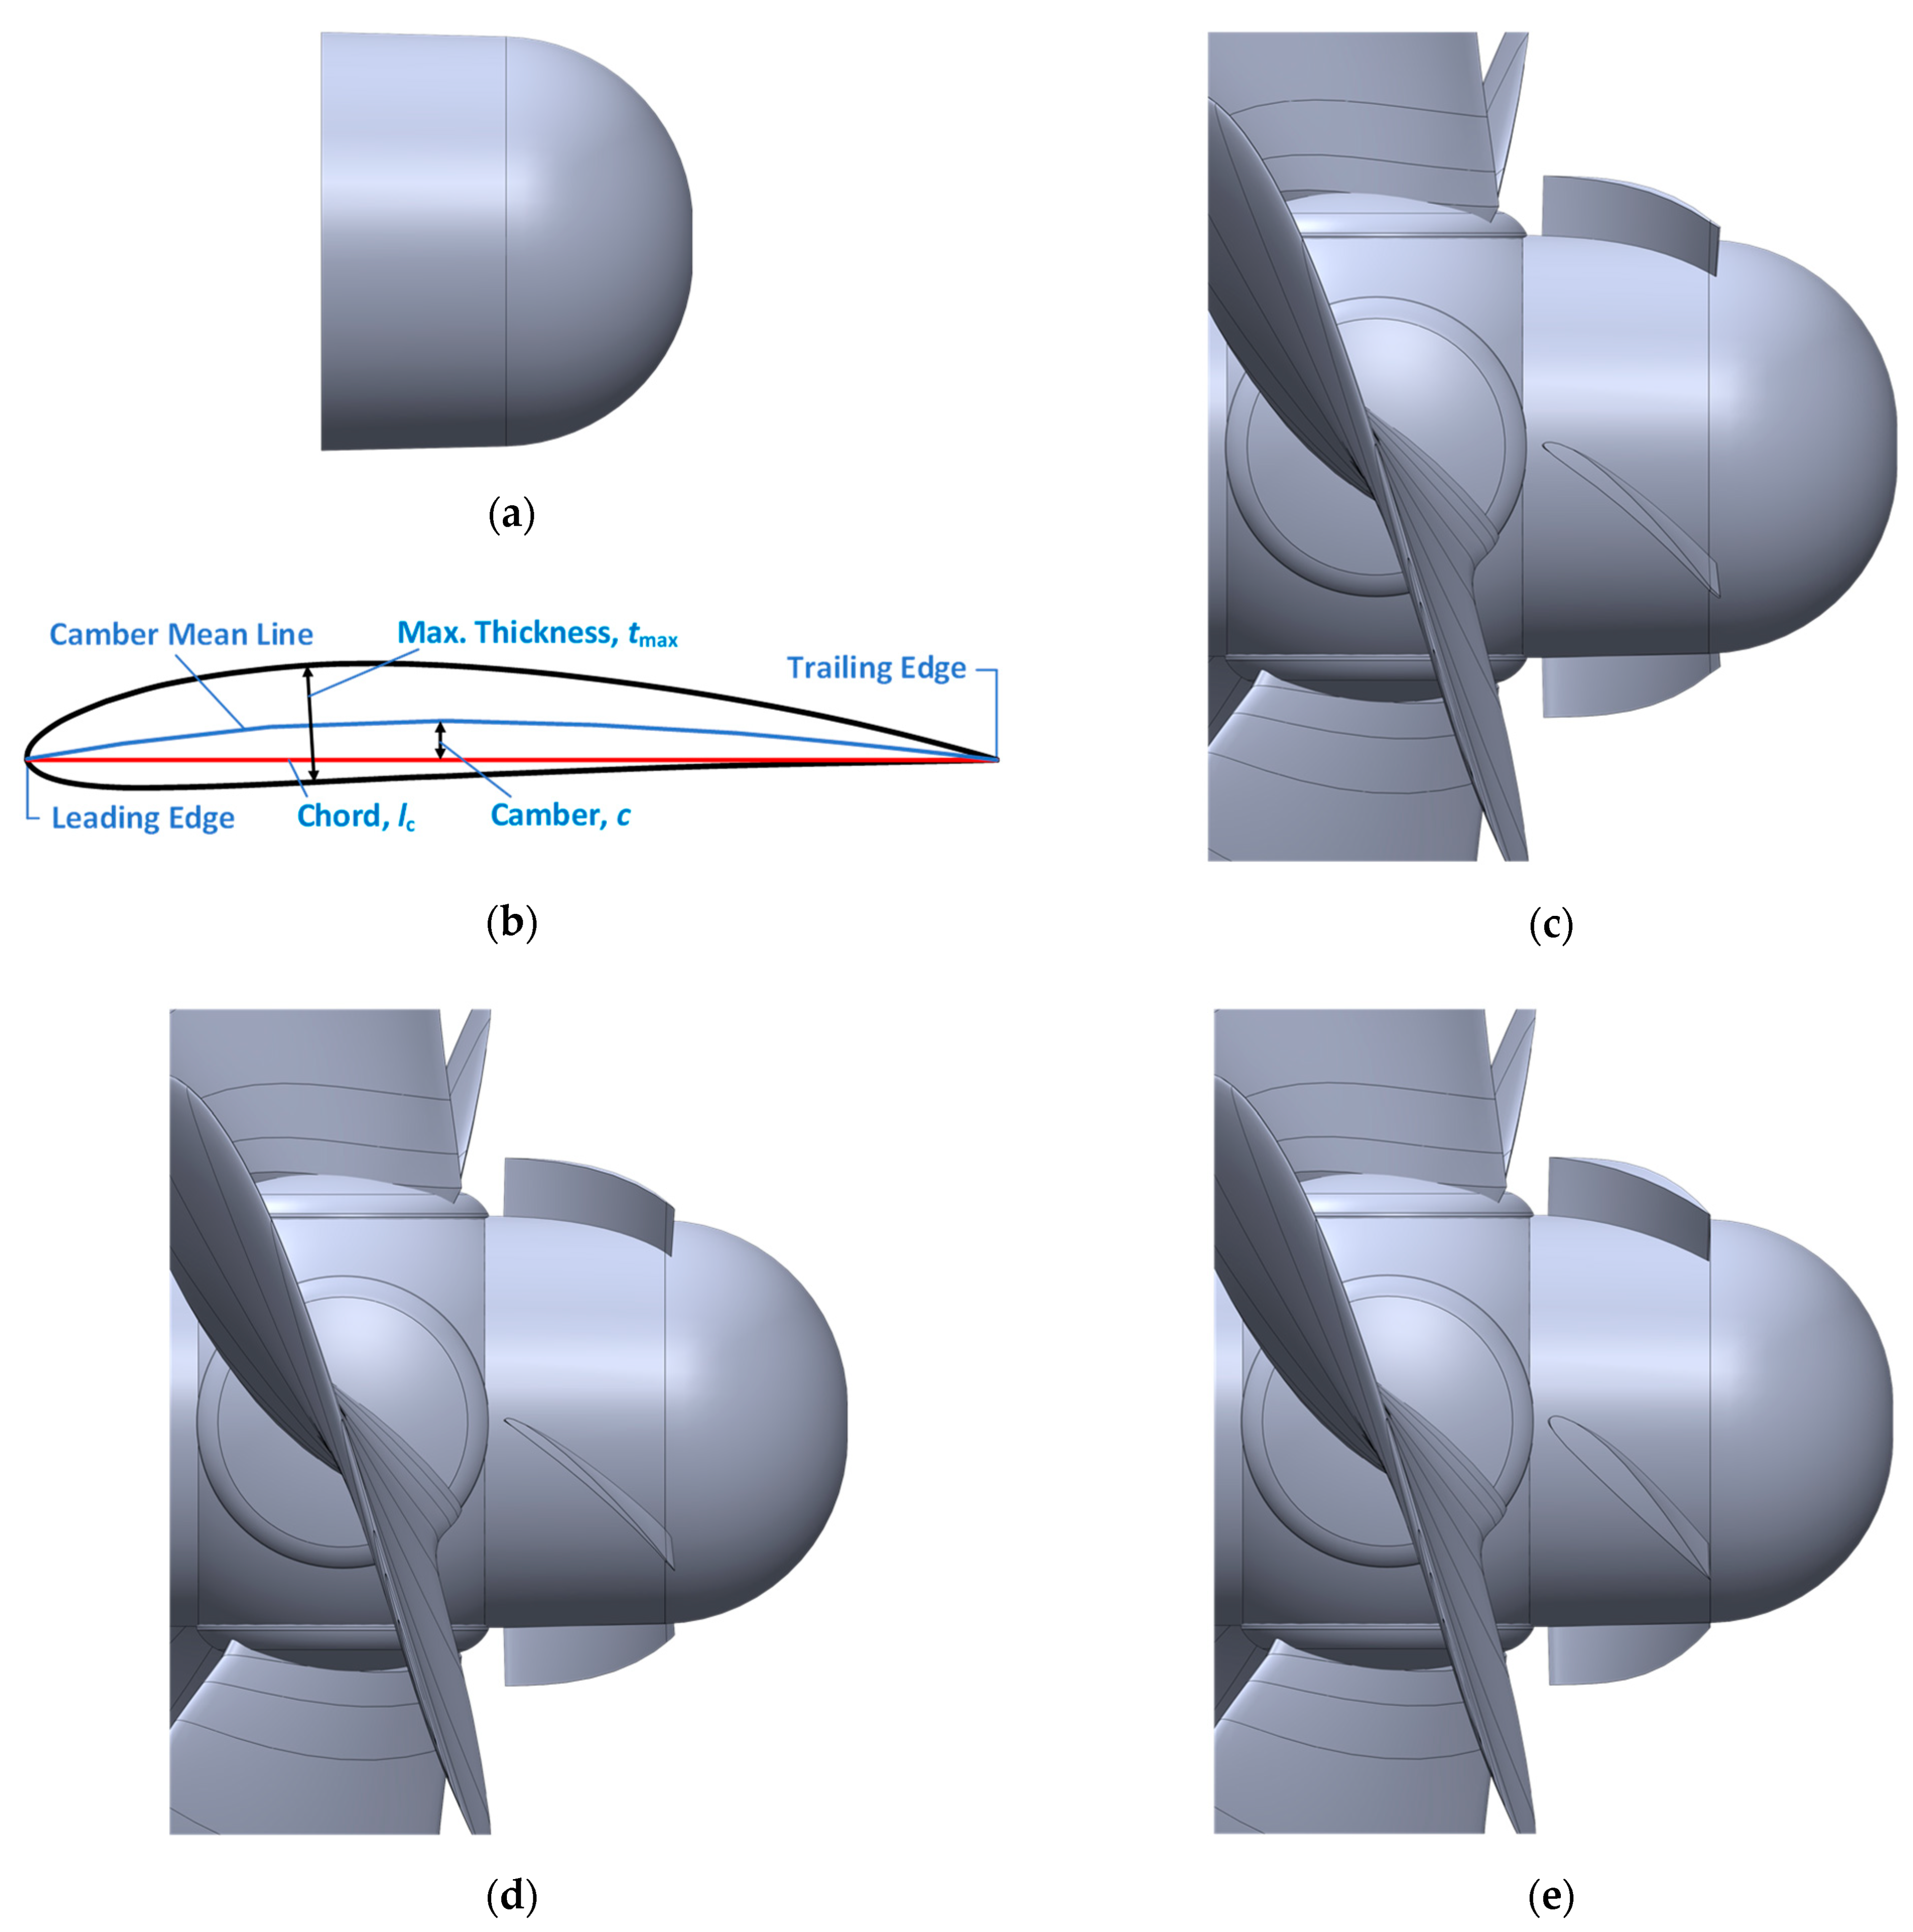
2.3. CFD-Based Screening of Appropriate Fin Profile for PBCFs Design
2.4. CFD-Based Optimization Design of the PBCFs Using the Best Performing Fin Profile
3. Results and Discussion
3.1. Experimental Validation of CFD for the Original Propeller/Rudder System without PBCFs
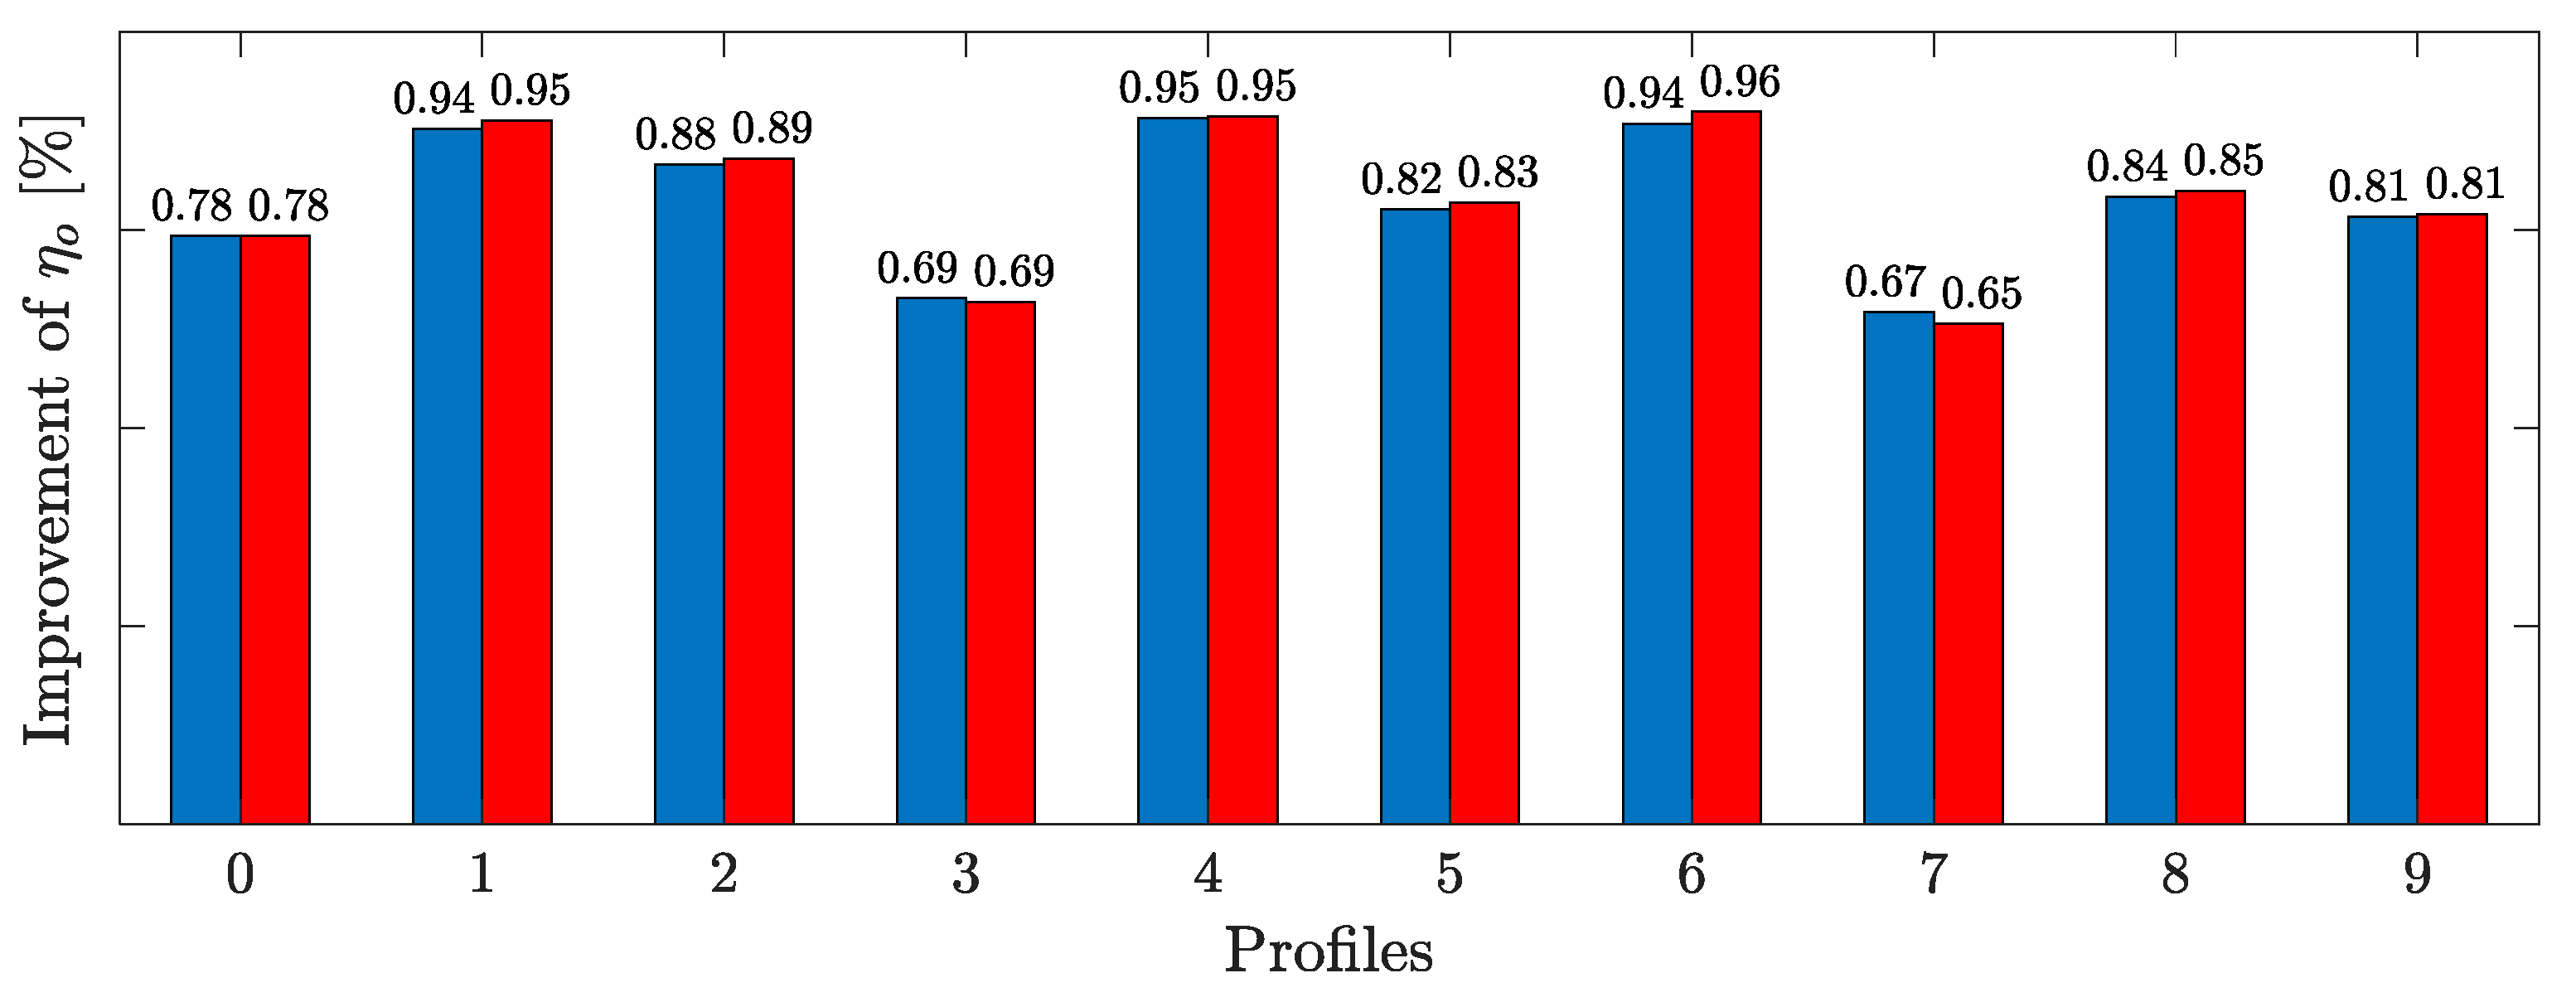
3.2. CFD-Based Screening of the Best Performing Fin Profile for PBCF Design
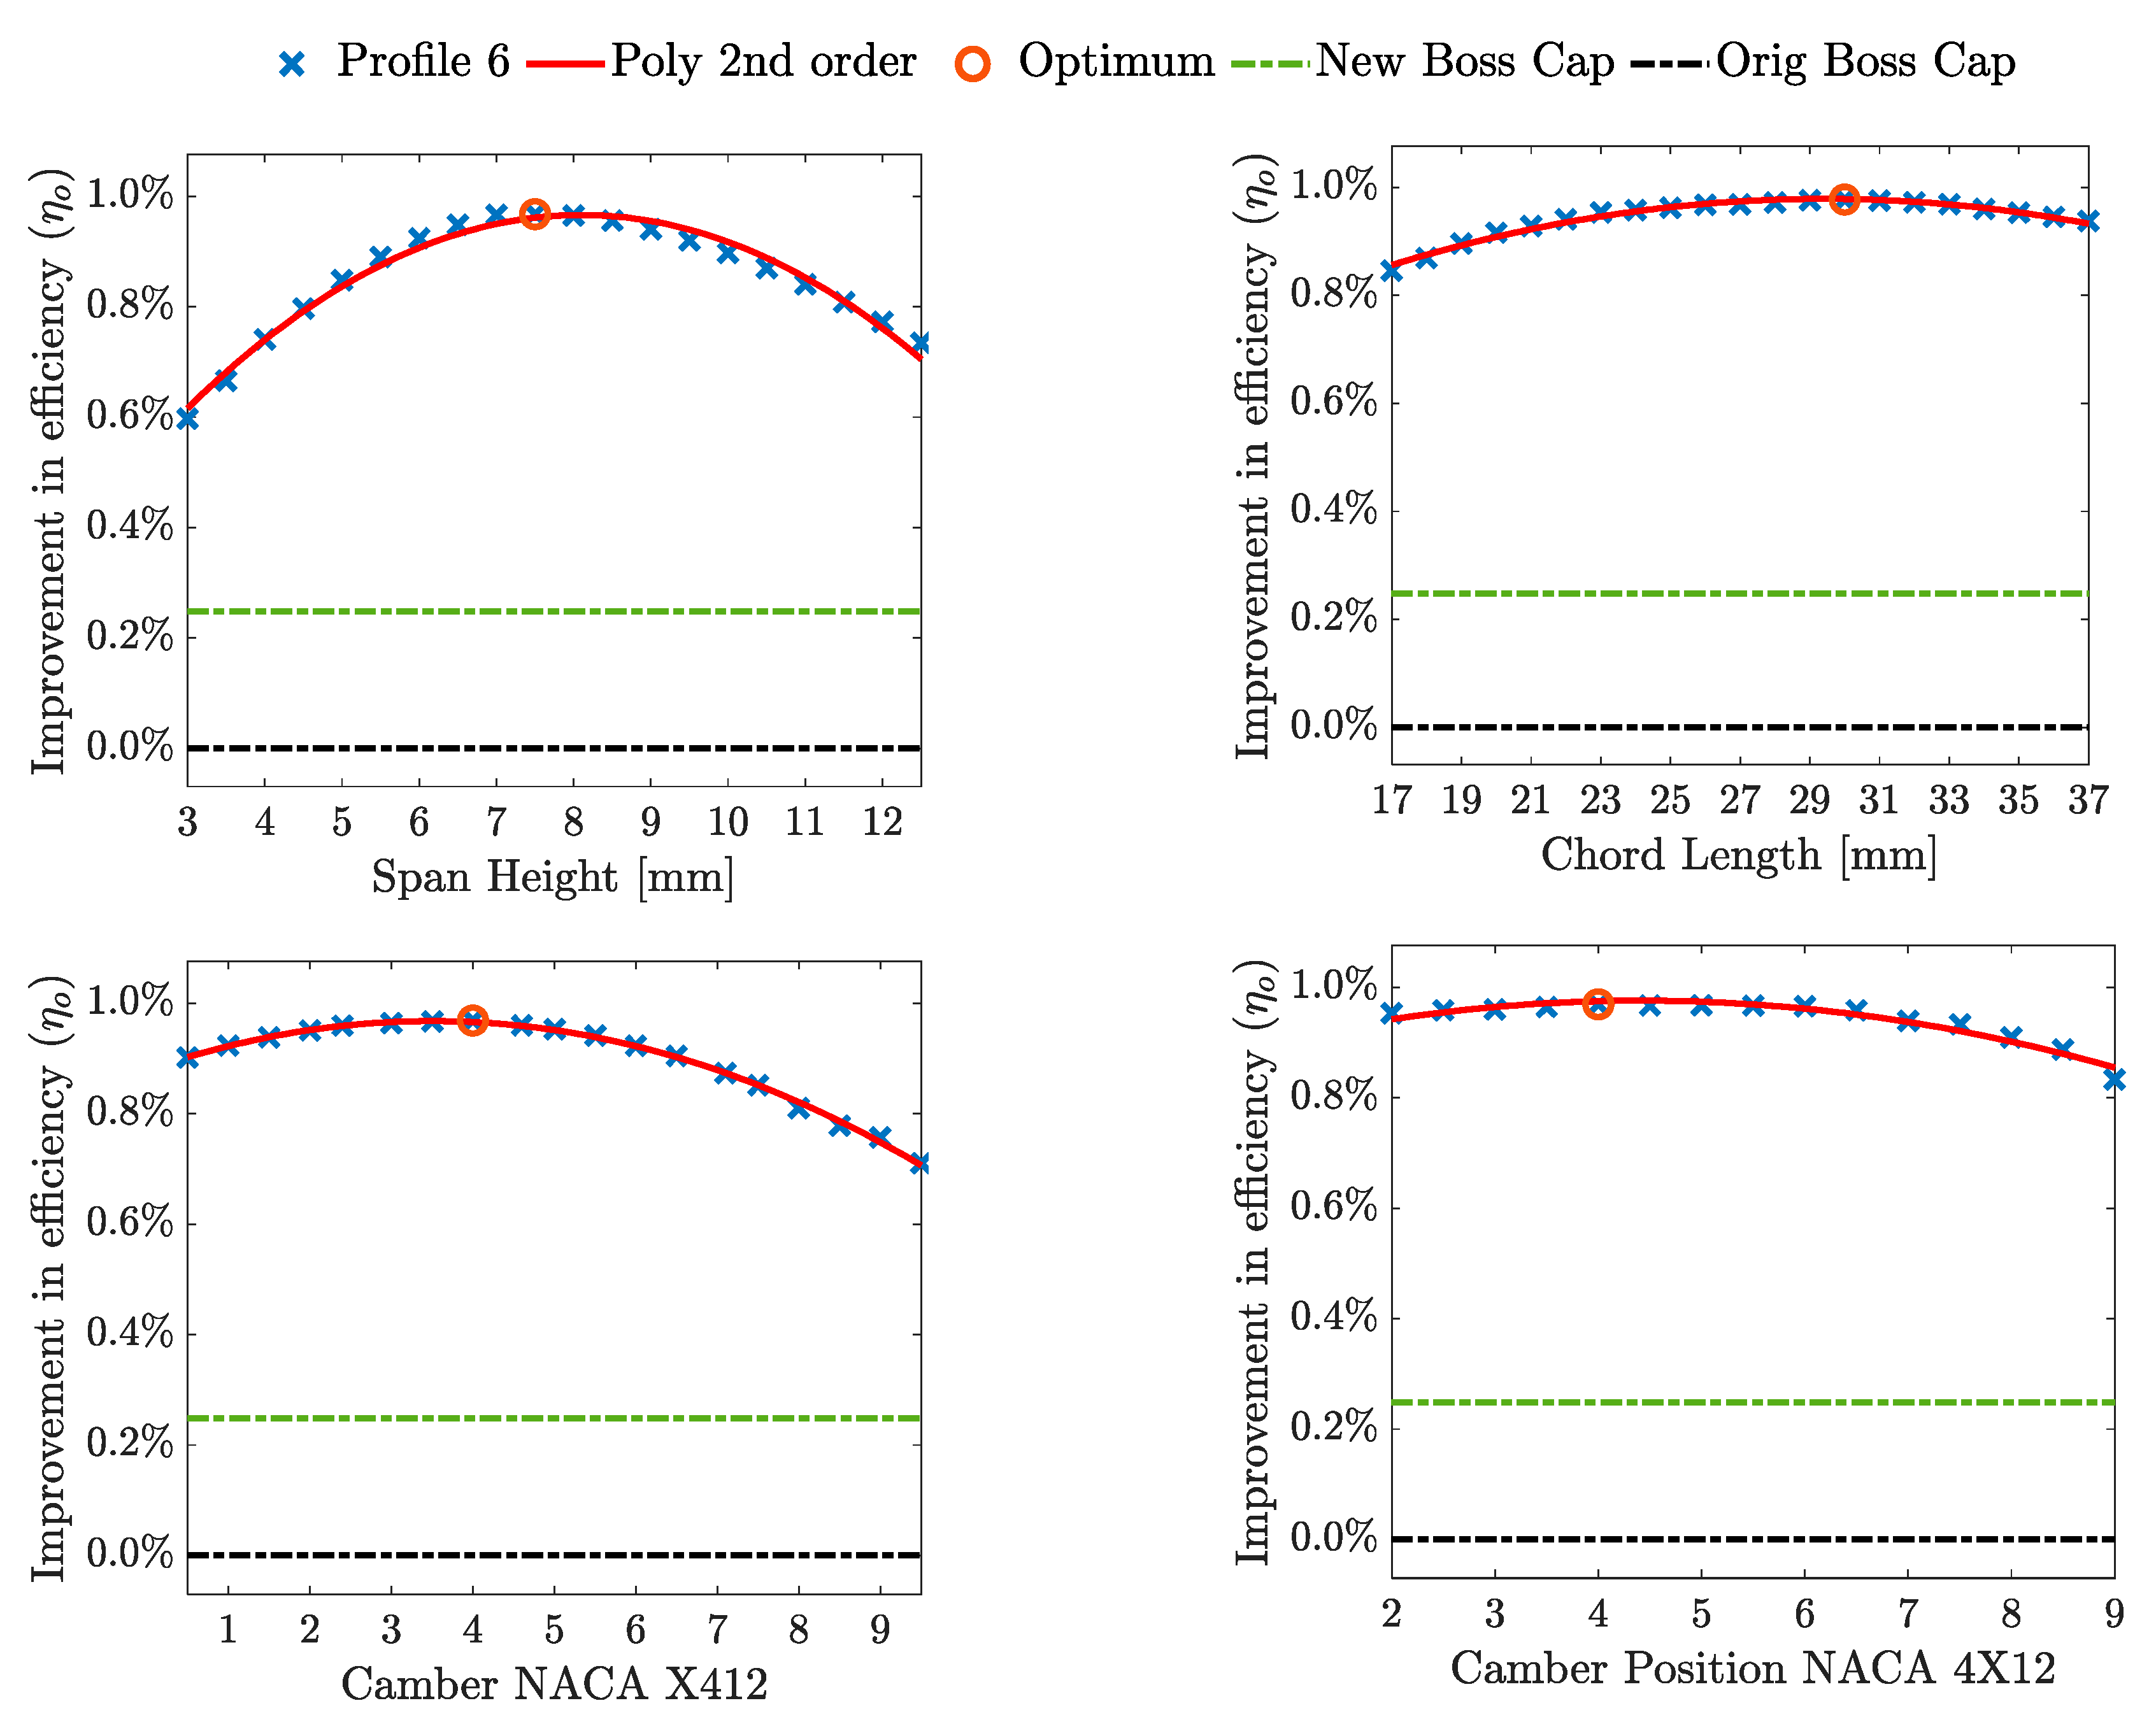
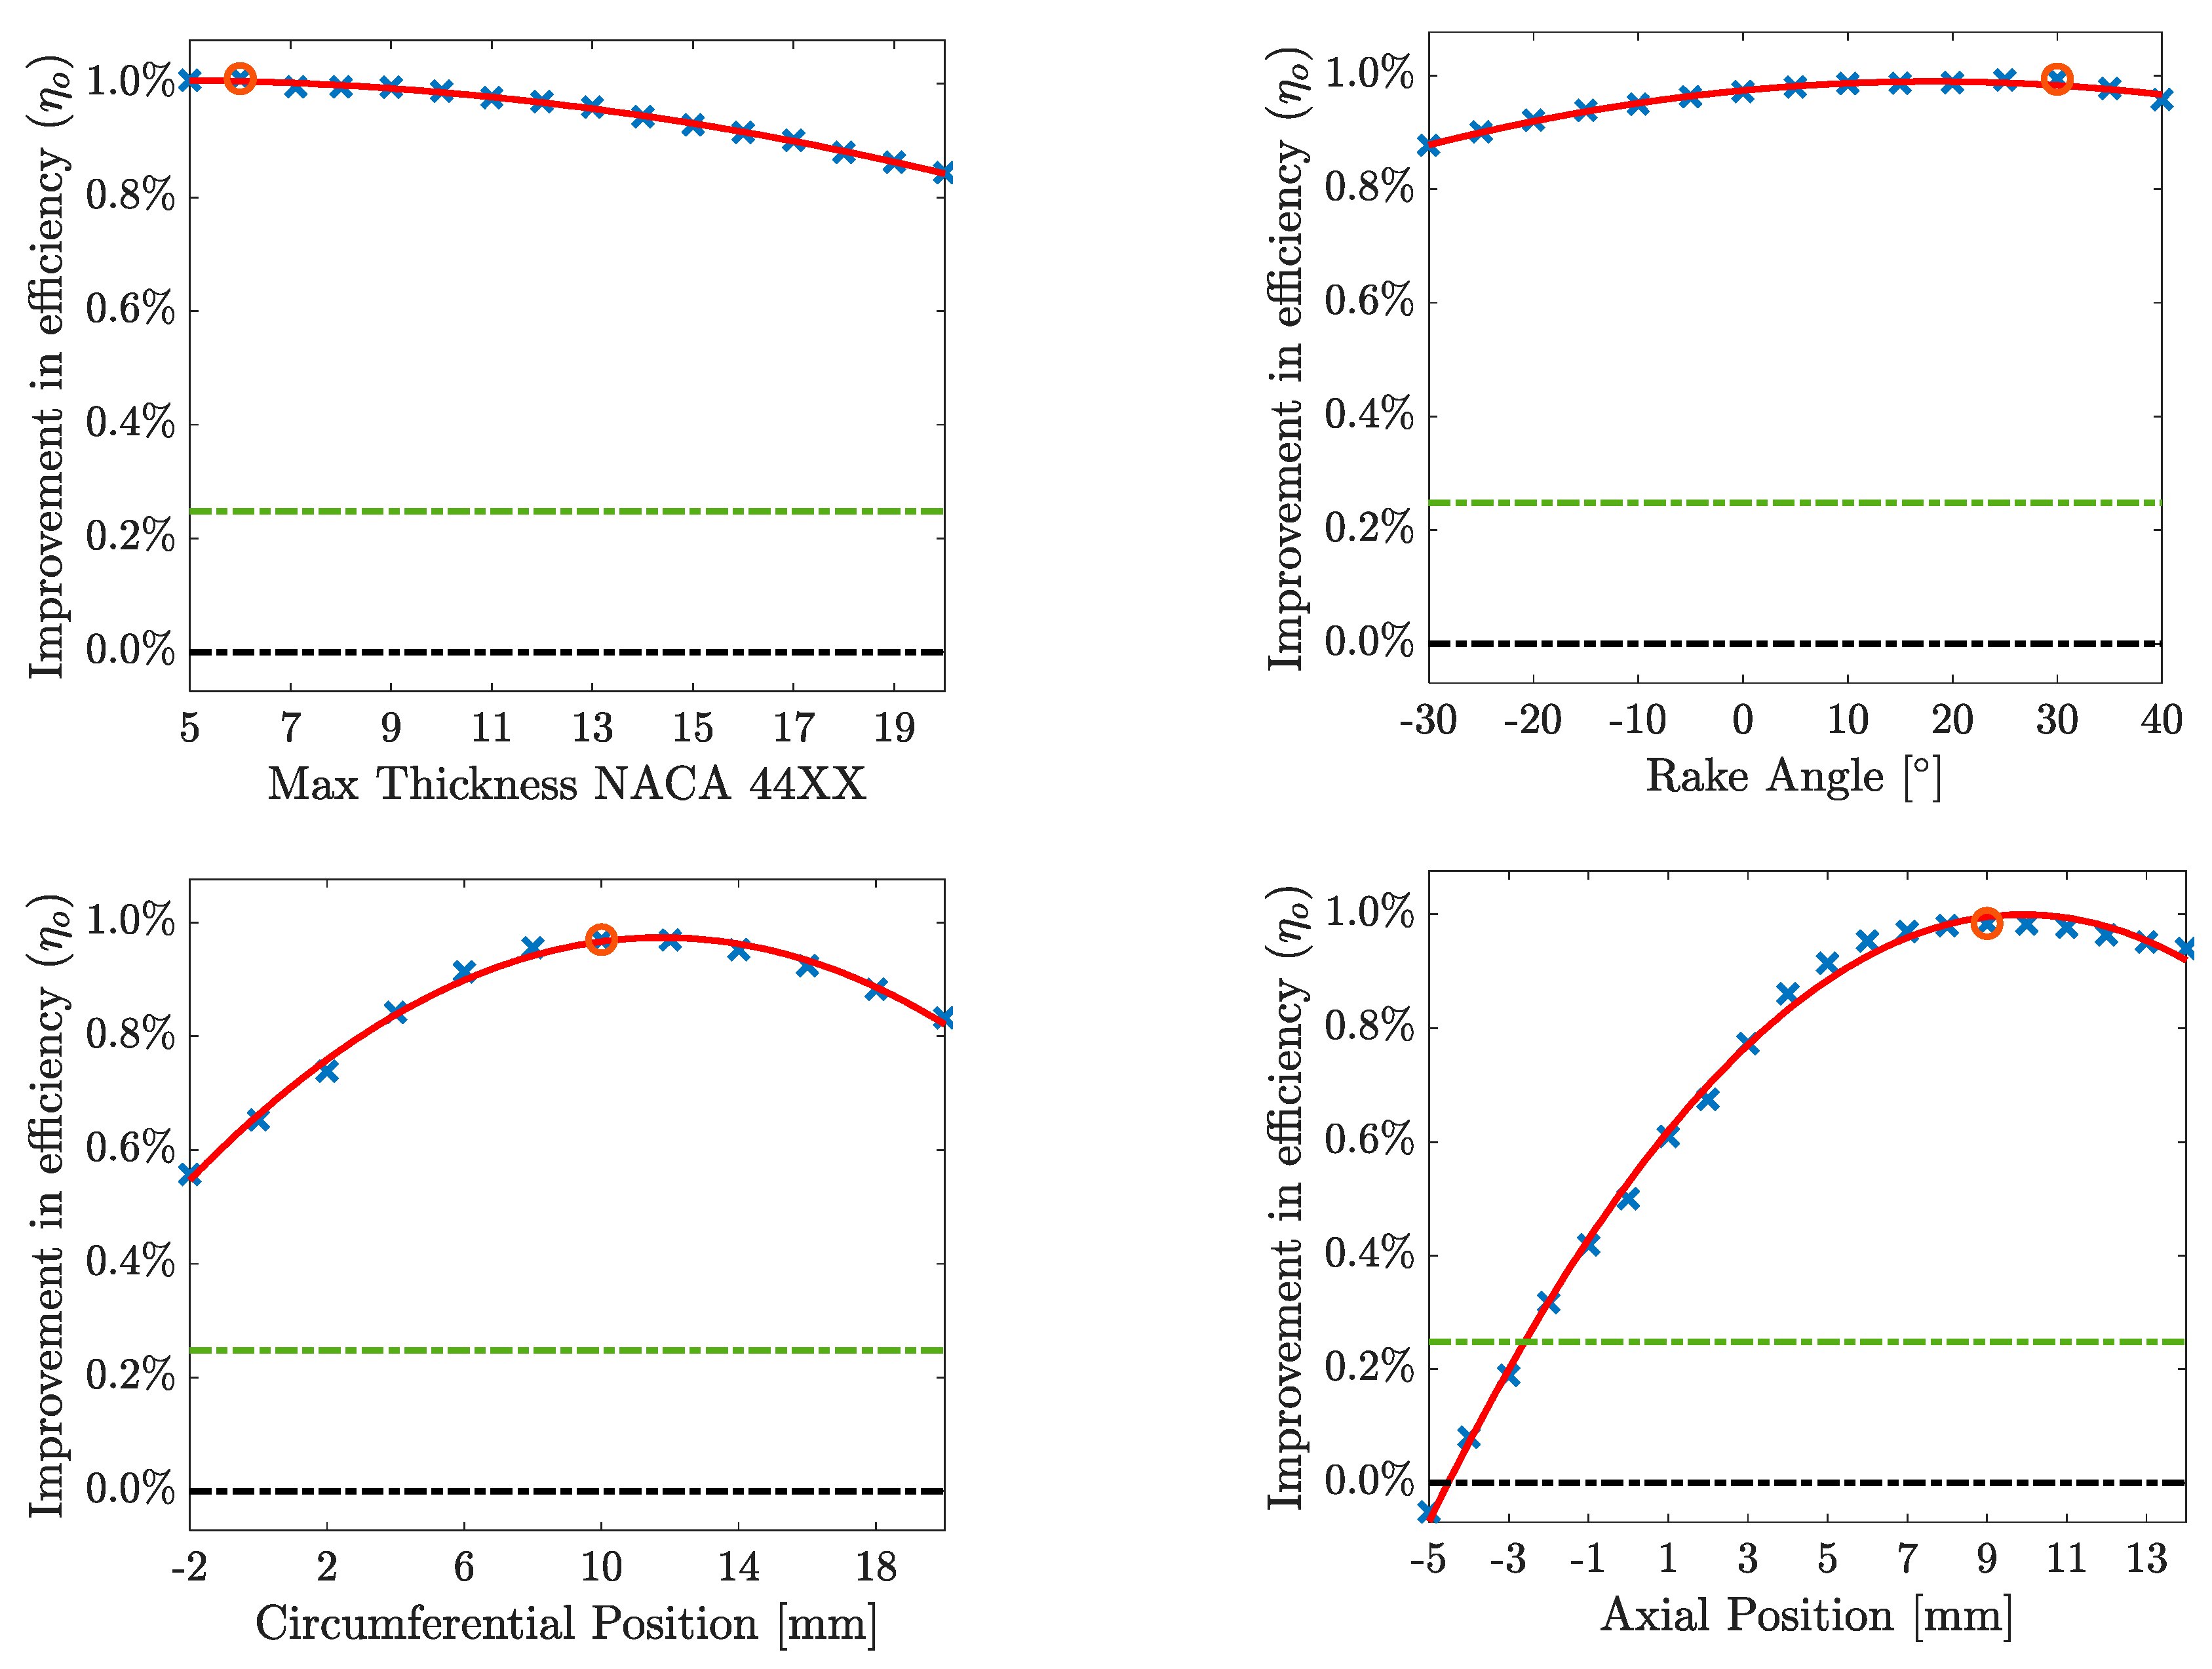
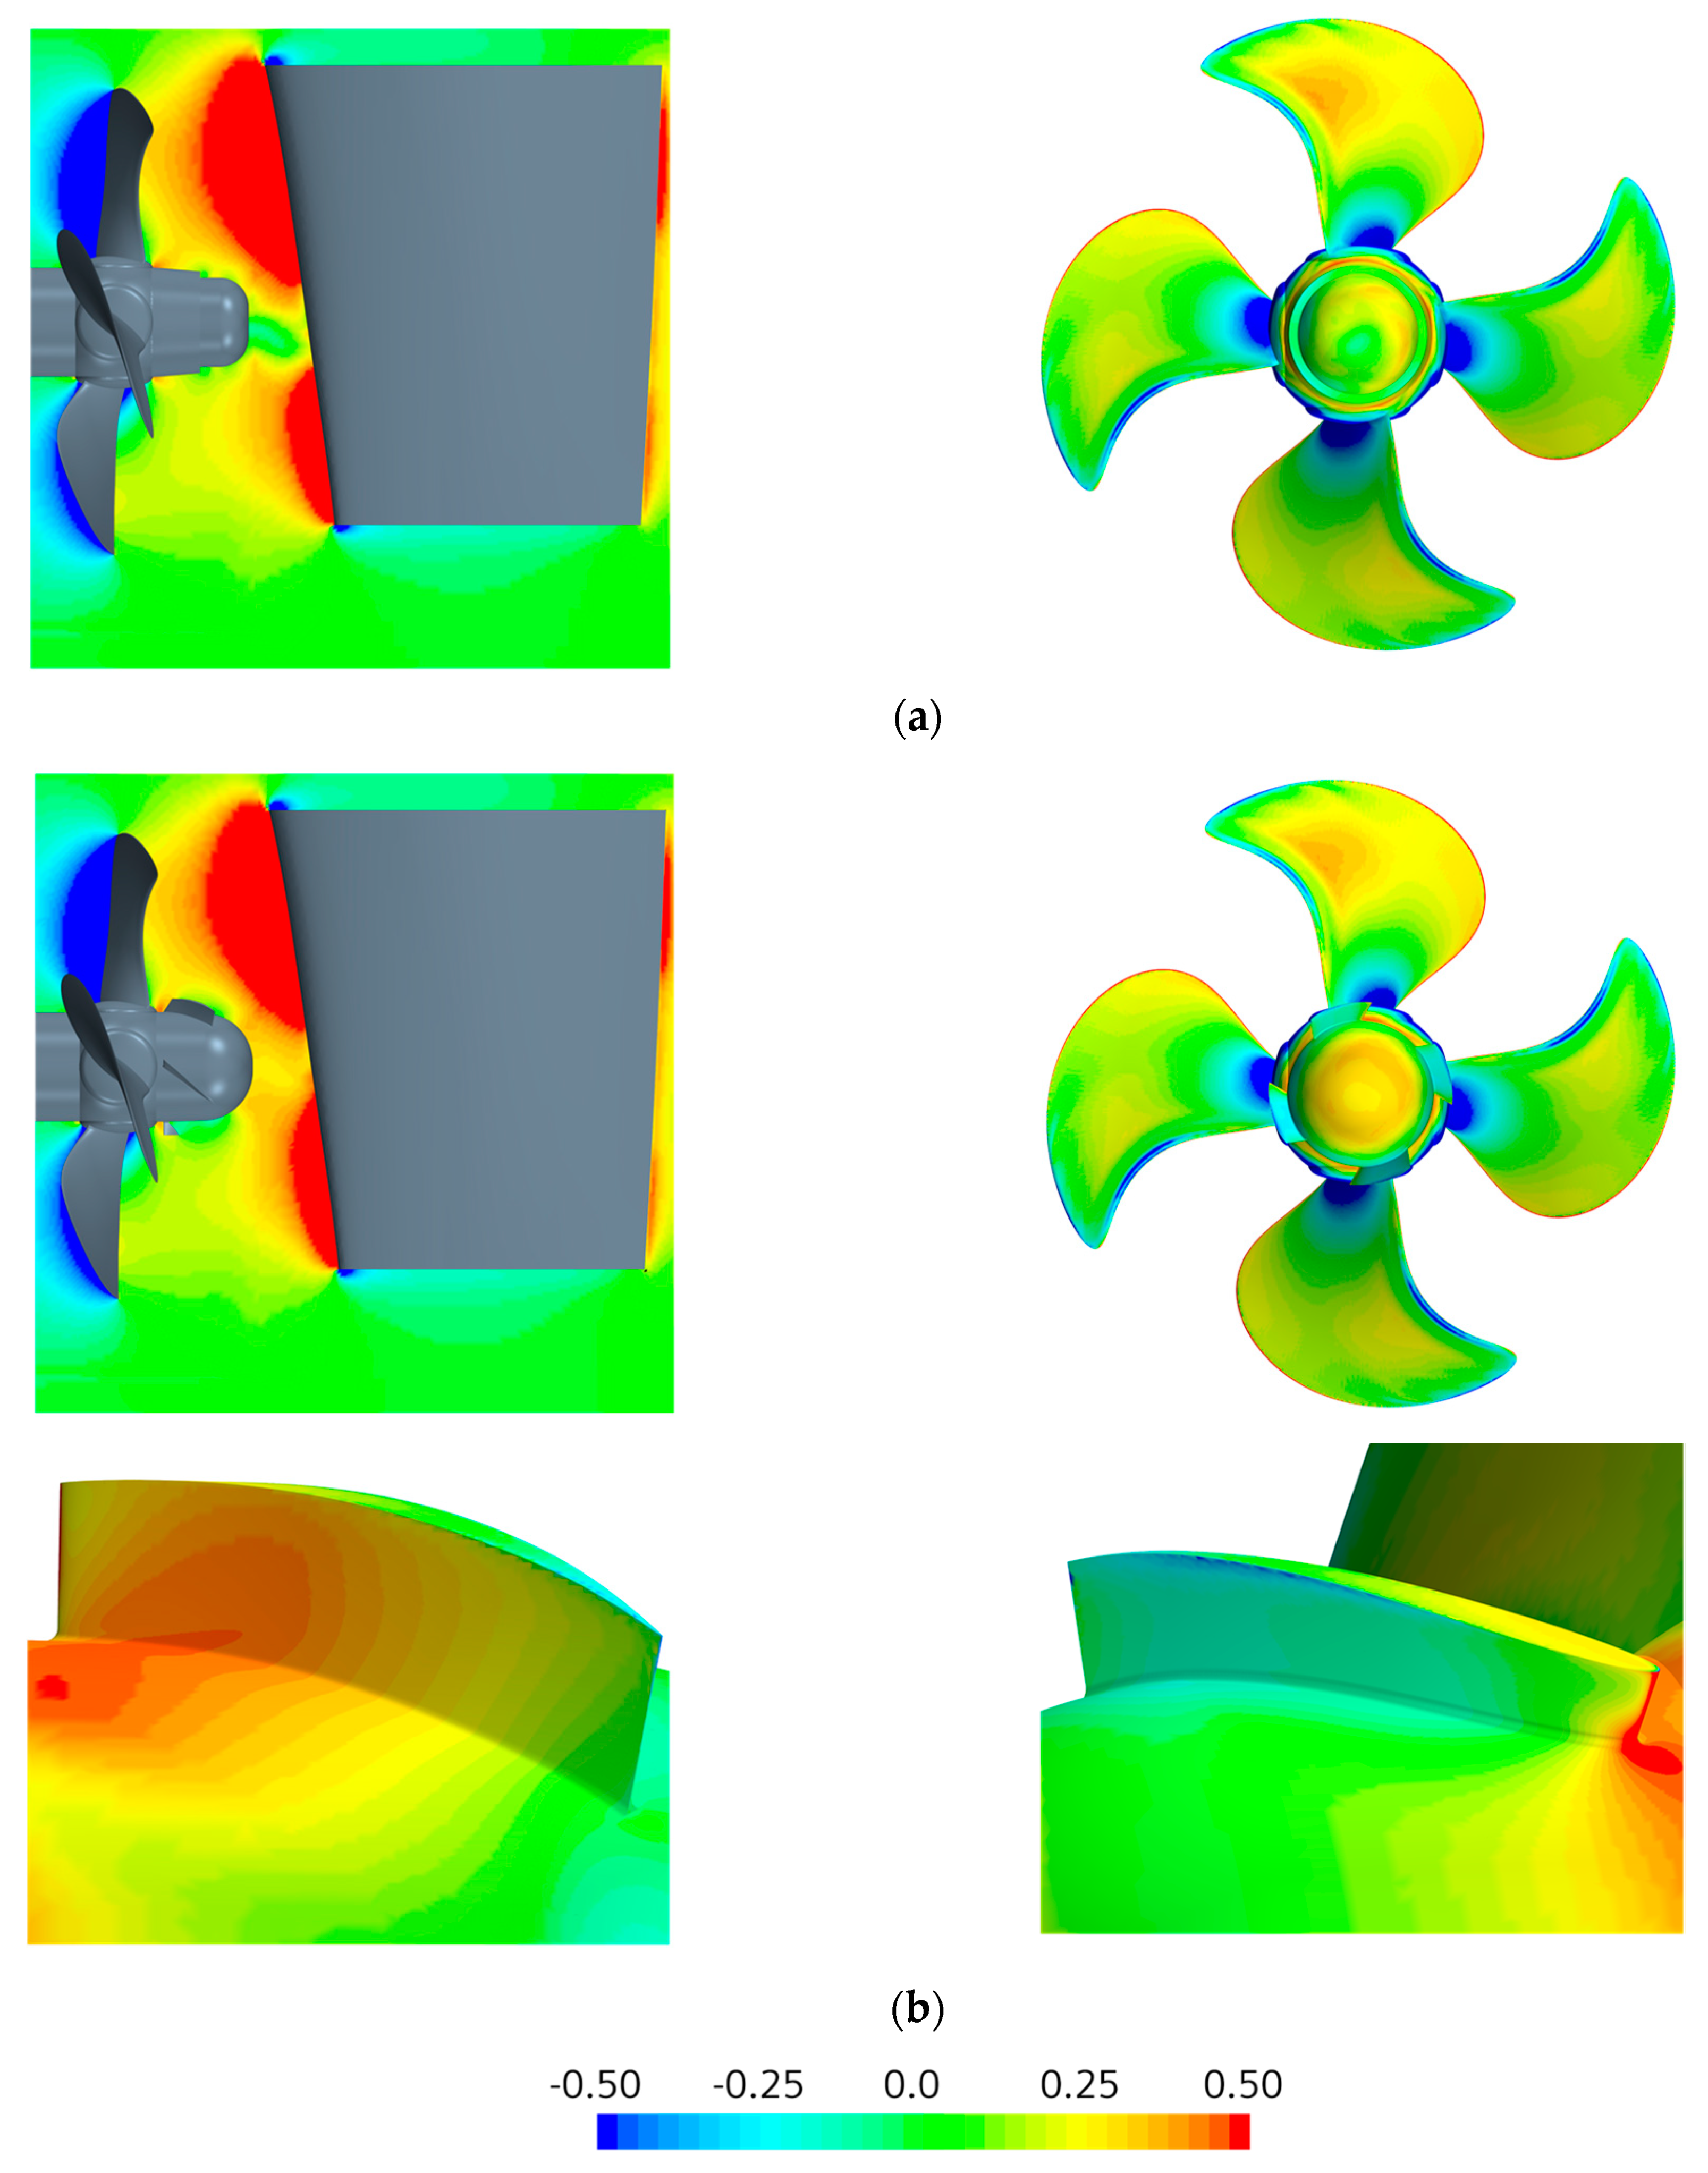
3.3. CFD-Based Optimum Design of the PBCFs
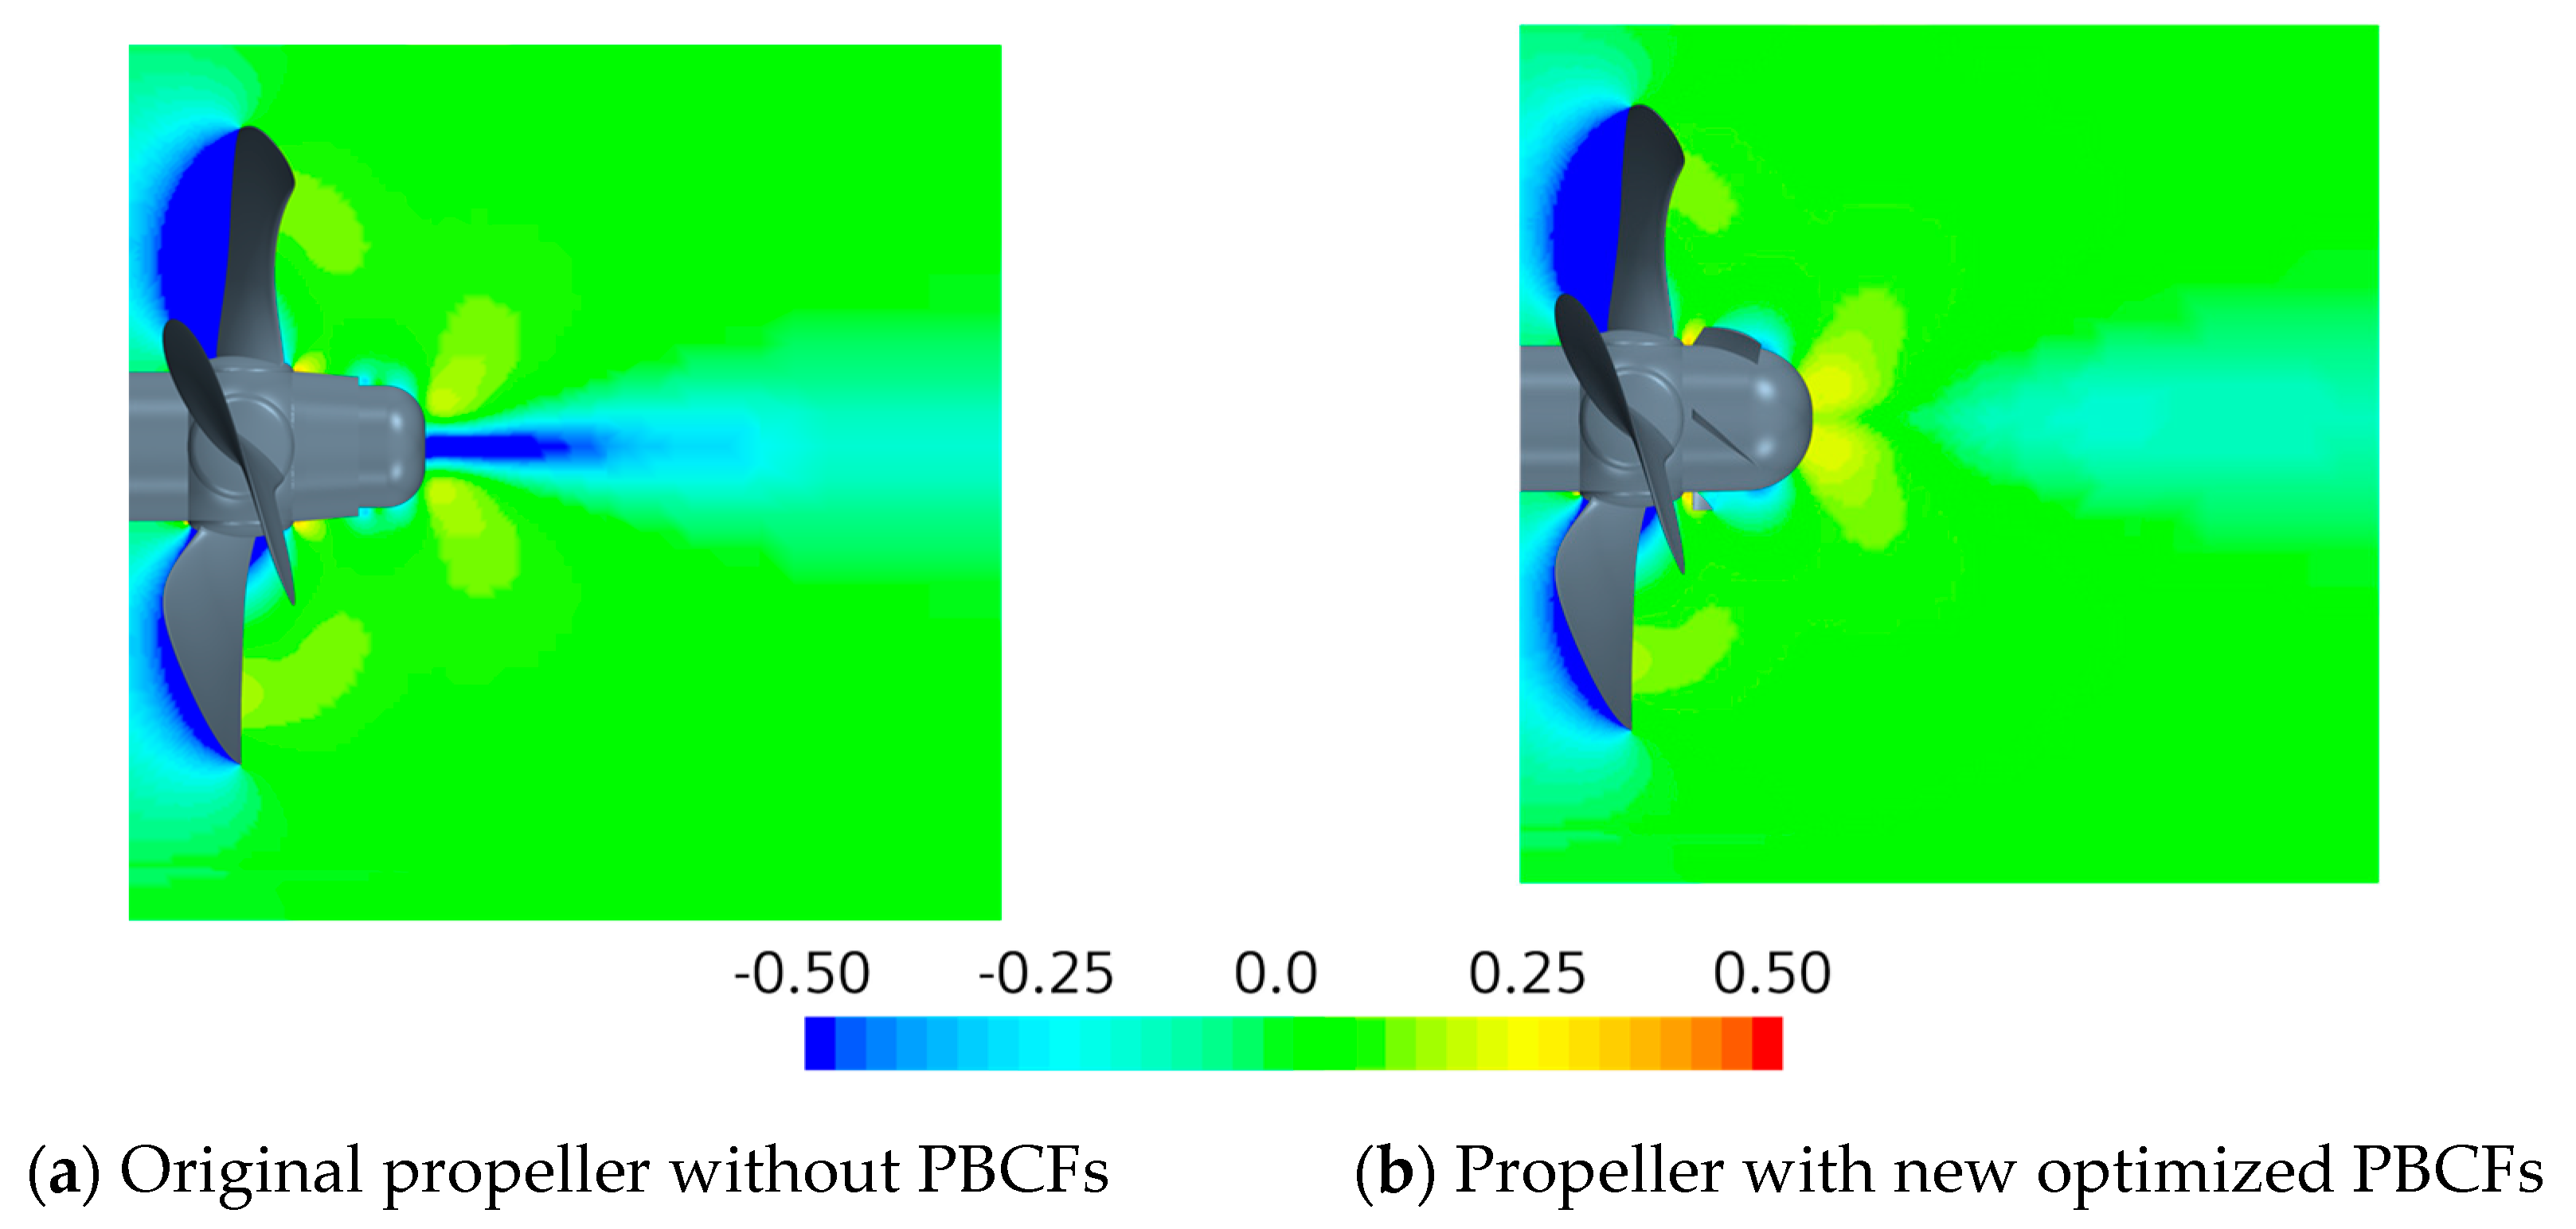
3.4. Performance of the Propeller/Rudder System with the New Optimized PBCFs
4. Conclusions
Author Contributions
Funding
Data Availability Statement
Conflicts of Interest
References
- Issa, M.; Ilinca, A.; Martini, F. Ship energy efficiency and maritime sector initiatives to reduce carbon emissions. Energies 2022, 15, 7910. [Google Scholar] [CrossRef]
- Szelangiewicz, T.; Abramowski, T.; Zelazny, K.; Sugalski, K. Reduction of resistance, fuel consumption and GHG emission of a small fishing vessel by adding a bulbous bow. Energies 2021, 14, 1837. [Google Scholar] [CrossRef]
- Artyszuk, J.; Zalewski, P. Energy saving by optimizing thrusters allocation during complex ship manoeuvres. Energies 2021, 14, 4959. [Google Scholar] [CrossRef]
- Krcum, M.; Zubcic, M.; Kastelan, N.; Gudelj, A. Reducing the dimensions of the ship’s main switchboard—A contribution to energy efficiency. Energies 2021, 14, 7567. [Google Scholar] [CrossRef]
- Wu, P.C.; Chang, C.W.; Huang, Y.C. Design of energy-saving duct for JBC to reduce ship resistance by CFD method. Energies 2022, 15, 6484. [Google Scholar] [CrossRef]
- Kim, K.I.; Lee, K.M. Dynamic programming-based vessel speed adjustment for energy saving and emission reduction. Energies 2018, 11, 1273. [Google Scholar] [CrossRef] [Green Version]
- Ouchi, K.; Ogura, M.; Kono, Y.; Orito, H.; Shiotsu, T.; Tamashima, M.; Koizuka, H. A research and development of PBCF (propeller boss cap fins). J. Soc. Nav. Archit. Jpn. 1988, 163, 66–78. [Google Scholar] [CrossRef]
- Hsin, C.Y.; Lin, B.H.; Lin, C.C. The optimum design of a propeller energy-saving device by computational fluid dynamics. Comput. Fluid Dyn. 2008, 1, 655–660. [Google Scholar]
- Ghassemi, H.; Mardan, A.; Ardeshir, A. Numerical analysis of hub effect on hydrodynamic performance of propellers with inclusion of PBCF to equalize the induced velocity. Pol. Marit. Res. 2012, 19, 17–24. [Google Scholar] [CrossRef]
- Lim, S.S.; Kim, T.W.; Lee, D.M.; Kang, C.G.; Kim, S.Y. Parametric study of propeller boss cap fins for container ships. Int. J. Nav. Archit. Ocean Eng. 2014, 6, 187–205. [Google Scholar] [CrossRef] [Green Version]
- Mizzi, K.; Demirel, Y.K.; Banks, C.; Turan, C.; Kaklis, P.; Atlar, M. Design optimization of propeller boss cap fins for enhanced propeller performance. Appl. Ocean Res. 2017, 62, 210–222. [Google Scholar] [CrossRef]
- Gaggero, S. Design of PBCF energy saving devices using optimization strategies: A step towards a complete viscous design approach. Ocean Eng. 2018, 159, 517–538. [Google Scholar] [CrossRef]
- Seo, J.; Lee, S.; Han, B.; Rhee, S.H. Influence of design parameter variations for propeller-boss-cap-fins on hub vortex reduction. J. Ship Res. 2016, 60, 203–218. [Google Scholar] [CrossRef]
- Shin, K.W.; Lundgren, E.; Nielsen, J.R. CFD-based optimization of rudder bulb systems. In Proceedings of the World Maritime Technology Conference, Saint-Petersburg, Russia, 29 May–1 June 2012. [Google Scholar]
- Shin, K.W.; Andersen, P. CFD analysis of scale effects on conventional and tip-modified propellers. In Proceedings of the 5th International Symposium on Marine Propulsors, Espoo, Finland, June 2017. [Google Scholar]
- Celik, I.B.; Ghia, U.; Roache, P.J.; Freitas, C.J.; Coleman, H.; Raad, P.E. Procedure for estimation and reporting of uncertainty due to discretization in CFD applications. J. Fluids Eng. 2008, 130, 078001. [Google Scholar]
- Ogura, M.; Koizuka, H.; Takeshita, T.; Kohno, Y.; Ouchi, K.; Shiotsu, T. A Screw Propeller Boss Cap with Fins. Patent. App. nr 87111052.4; Pub. nr: 0 255 136 A1, (accessed on 3 February 1988).
- Airfoil Tools. 2021. Available online: http://airfoiltools.com/index (accessed on 26 November 2021).
- Majumder, P.; Maity, S. Numerical analysis of aerofoil shape propeller boss cap fin (PBCF) to improve propeller efficiency. Int. J. Innov. Technol. Explor. Eng. 2020, 9, 231–238. [Google Scholar] [CrossRef]
- Gaggero, S.; Martinelli, M. Comparison of different propeller boss cap fins design for improved propeller performance. Appl. Ocean Res. 2021, 116, 102867. [Google Scholar] [CrossRef]
- Tadros, M.; Ventura, M.; Soares, C.G. Optimization procedures for a twin controllable pitch propeller of a ROPAX ship at minimum fuel consumption. J. Mar. Eng. Technol. 2022, 1–9. [Google Scholar] [CrossRef]


| Authors | Propeller Advance Ratio | PBCFs Dimension: Diameter , Chord Length , Camber | PBCFs Installation Circumferential Position , Axial Position , Installation Angle , Rake Angle , Phase Angle | Propeller Efficiency Gain | |
|---|---|---|---|---|---|
| Ouchi et al. [7] | 01.1 | | , , | ≤7% | |
| Hsin et al. [8] | 1.41.6% | ||||
| Ghassemi et al. [9] | 015˚ | Increase | |||
| Lim et al. [10] | 01.0 | –12˚–6˚ | , | 1.42% | |
| Seo et al. [13] | 0.10.9 | , | 1.6% | ||
| Mizzi et al. [11] | , | 1.3% | |||
| Gaggero [12] | 0.41.1 | | , | 0.9, 4.0% |
| Term | |||||
|---|---|---|---|---|---|
| Value | 226 mm | 53.02 mm | 46.74 mm | 31.75 mm |
| The Mesh Finally Used in Reproducing the Experimental Cases after a GCI Study: Terms vs. Values | |||
| Number of cells | ( in MRF domain) | ||
| on walls in the MRF domain | 0.39 in average (in range of ) | ||
| Skewness angle between vector connecting two cell-centers and face normal | in average (maximum of ) | ||
| Cell volume ratio—the ratio of the volume of a cell to its largest neighbor | 0.98 in average (minimum of ) | ||
| GCI Based on the Thrust Coefficient and Torque Coefficient for the Mesh Summarized above | |||
| Relative error, | 3.8% | 1.4% | |
| Extrapolated relative error, | 1.5% | 0.1% | |
| Grid convergence index, GCI | 1.9% | 0.2% | |
| Profile no. | 0 | 1 | 2 | 3 | 4 | 5 | 6 | 7 | 8 | 9 |
|---|---|---|---|---|---|---|---|---|---|---|
| Profile Name | Rectangle | AH-6-40-7 | Bergey BW-3 | CH10 | E63 | GOE79 | NACA4412 | Cp-100-050-gn | 20-32C | S1223 |
| Max | – | 46.9 | 46 | 12.4 | 51.1 | 42.7 | 36.1 | 23.9 | 40.8 | 42.3 |
| – | 4.8° | 5.0° | 3.5° | 5.3° | 5.5° | 8.5° | 11.0° | 3.8° | 3.3° | |
| Our base design: Installation angle | 51.5° | 53.4° | 53.1° | 54.6° | 52.9° | 52.6° | 49.6° | 47.1° | 54.4° | 54.9° |
| Term | Boss Cap | Number of Fins | Profile of Fins | ||||||
|---|---|---|---|---|---|---|---|---|---|
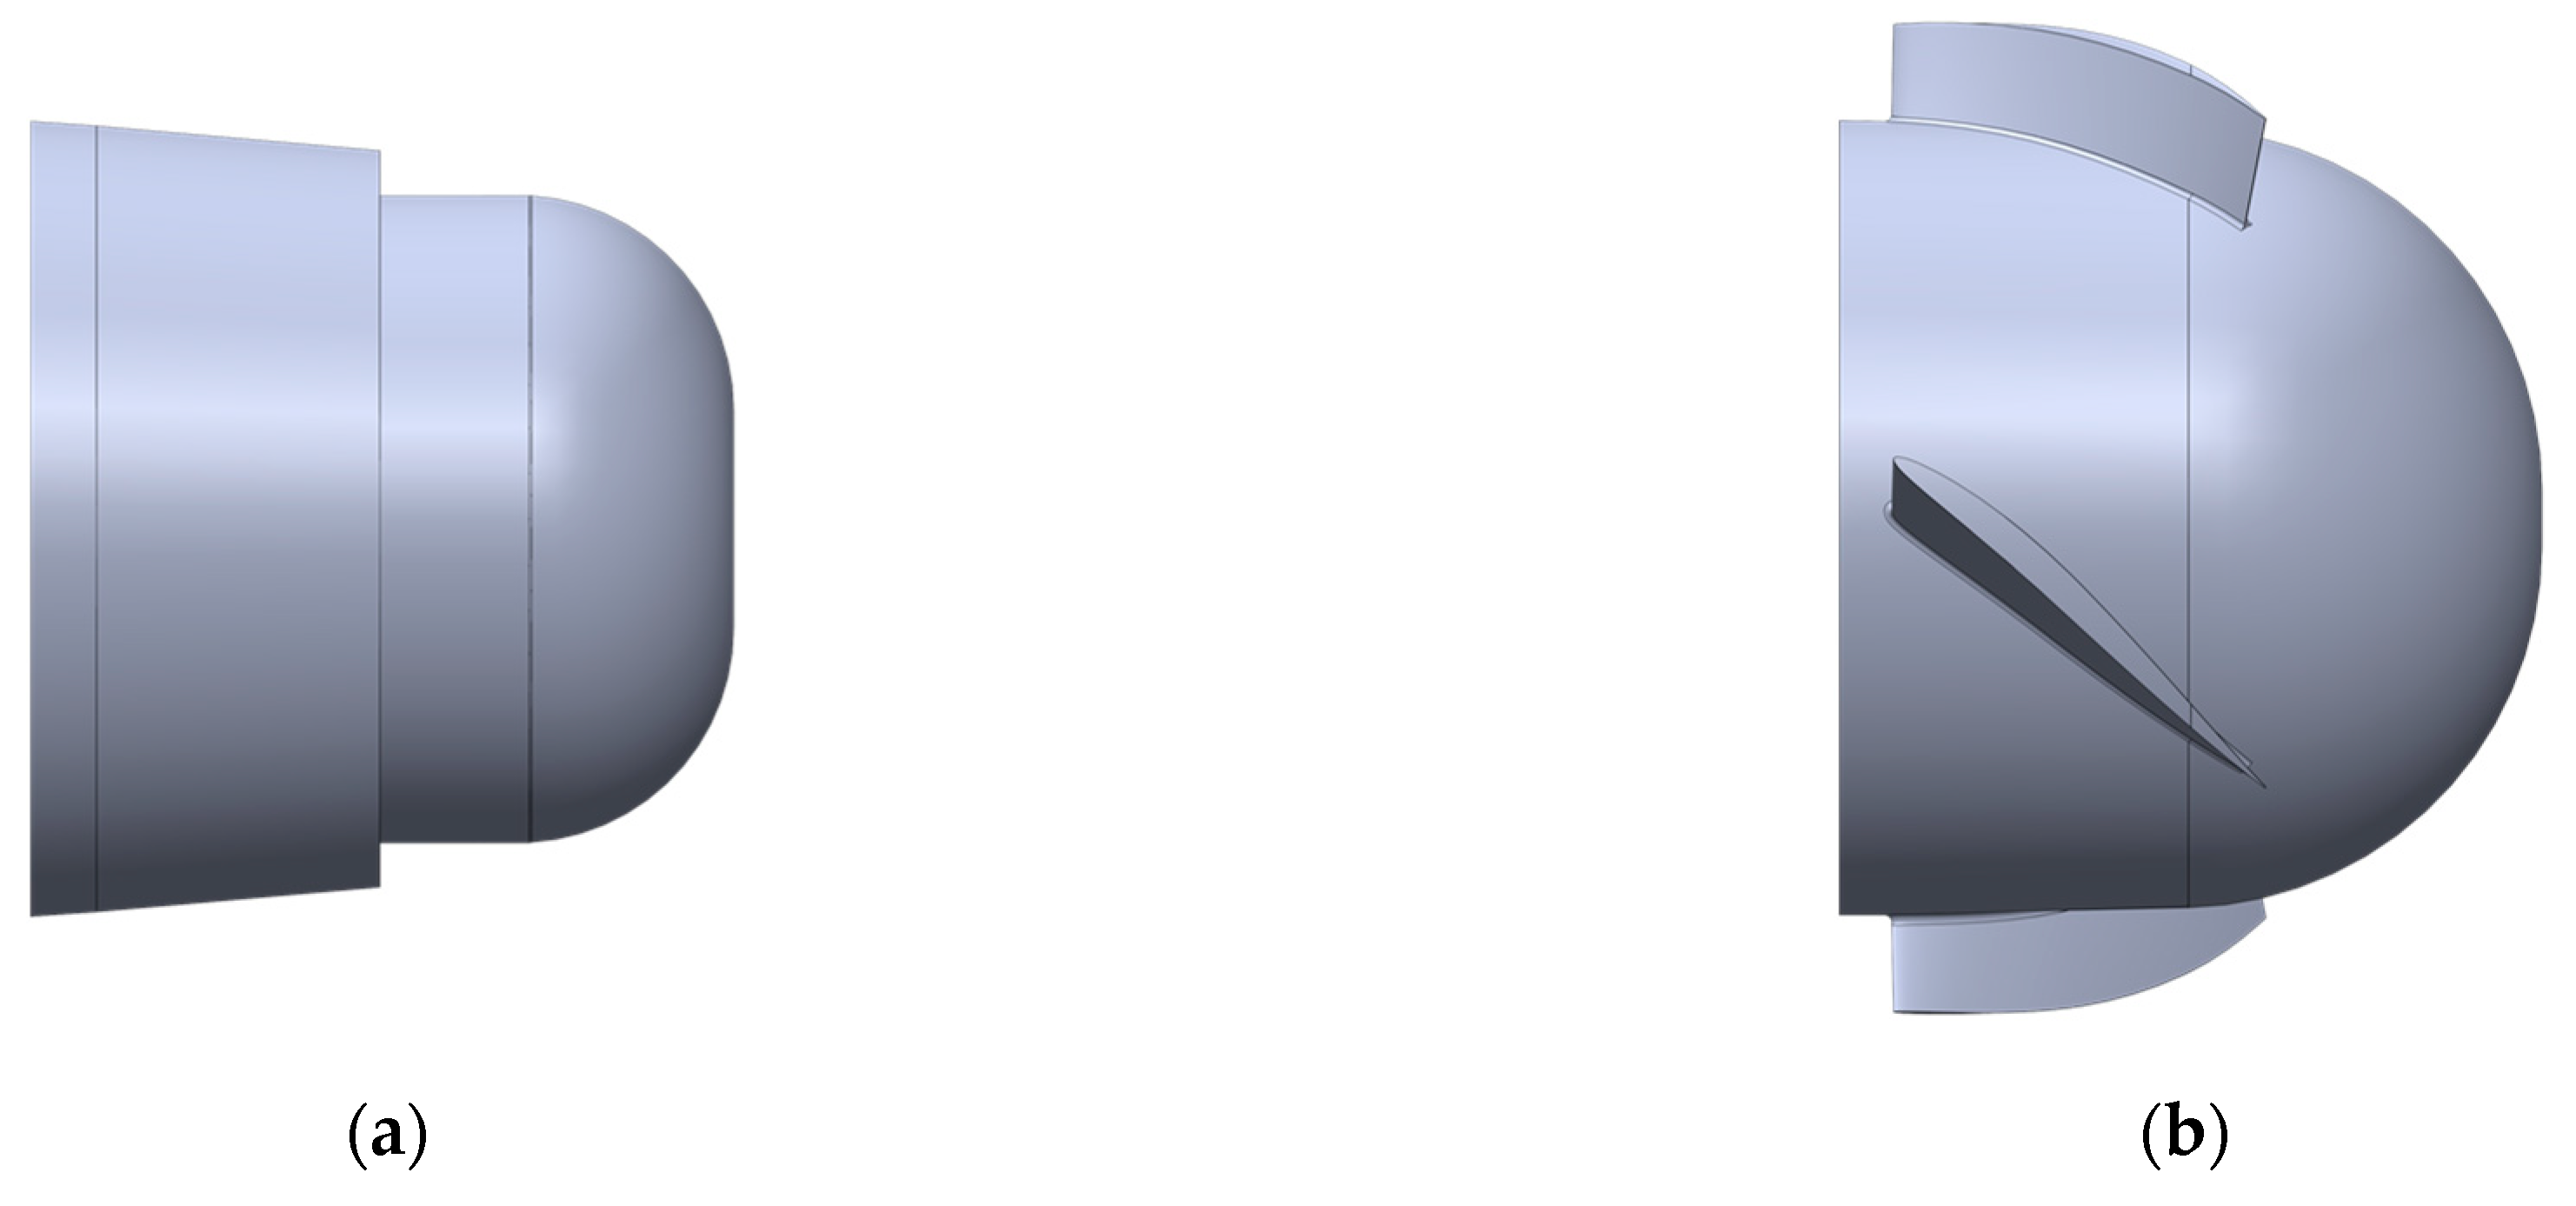
| Preferable design | Converging | Same as blades | Rectangle or airfoil | | |||||
| Our base design | Converging | 10 profiles | See Table 4 | |
| 2.02 | 2.08 | 2.13 | 2.19 | 2.25 | 2.30 | 2.36 | 2.42 | 2.47 | |
|---|---|---|---|---|---|---|---|---|---|
| Deviation in thrust coef., [%] | 0.6 | 0.7 | 1.0 | 1.4 | 1.3 | 1.5 | 1.8 | 1.7 | 1.9 |
| Deviation in torque coef., [%] | 1.1 | 1.2 | 1.5 | 1.8 | 1.8 | 1.9 | 2.1 | 2.1 | 2.3 |
| Deviation in propeller eff., [%] | −0.5 | −0.5 | −0.5 | −0.4 | −0.5 | −0.4 | −0.4 | −0.4 | −0.3 |
| Design Parameter | Optimum Design | Generalized Optimum Design |
|---|---|---|
| Dimension | ||
| Number of fins, n | 4 | number of blades |
| 7.5 | or | |
| 30 | ||
| NACA profile | ||
| 4 | – | |
| Max. camber position [%∙10 of chord from the leading edge] | 4 | – |
| Max. thickness [% of chord] | 6 | – |
| Installation | ||
| 52 | ||
| Rake angle, θ [°] | 30 | |
| Circumferential position, a [mm] | 10 | |
| Axial position, b [mm] | 8 | |
| Efficiency gain | ||
| Percentage point | 0.728 | – |
| Percentage [%] | 1.043 | – |
Disclaimer/Publisher’s Note: The statements, opinions and data contained in all publications are solely those of the individual author(s) and contributor(s) and not of MDPI and/or the editor(s). MDPI and/or the editor(s) disclaim responsibility for any injury to people or property resulting from any ideas, methods, instructions or products referred to in the content. |
© 2023 by the authors. Licensee MDPI, Basel, Switzerland. This article is an open access article distributed under the terms and conditions of the Creative Commons Attribution (CC BY) license (https://creativecommons.org/licenses/by/4.0/).
Share and Cite
Yin, C.; Rosenvinge, C.K.; Sandland, M.P.; Ehlers, A.; Shin, K.W. Improve Ship Propeller Efficiency via Optimum Design of Propeller Boss Cap Fins. Energies 2023, 16, 1247. https://doi.org/10.3390/en16031247
Yin C, Rosenvinge CK, Sandland MP, Ehlers A, Shin KW. Improve Ship Propeller Efficiency via Optimum Design of Propeller Boss Cap Fins. Energies. 2023; 16(3):1247. https://doi.org/10.3390/en16031247
Chicago/Turabian StyleYin, Chungen, Christian Kjaer Rosenvinge, Marcus Pless Sandland, Anders Ehlers, and Keun Woo Shin. 2023. "Improve Ship Propeller Efficiency via Optimum Design of Propeller Boss Cap Fins" Energies 16, no. 3: 1247. https://doi.org/10.3390/en16031247