

Adaptive-Energy-Sharing-Based Energy Management Strategy of Hybrid Sources in Electric Vehicles


Abstract
:1. Introduction
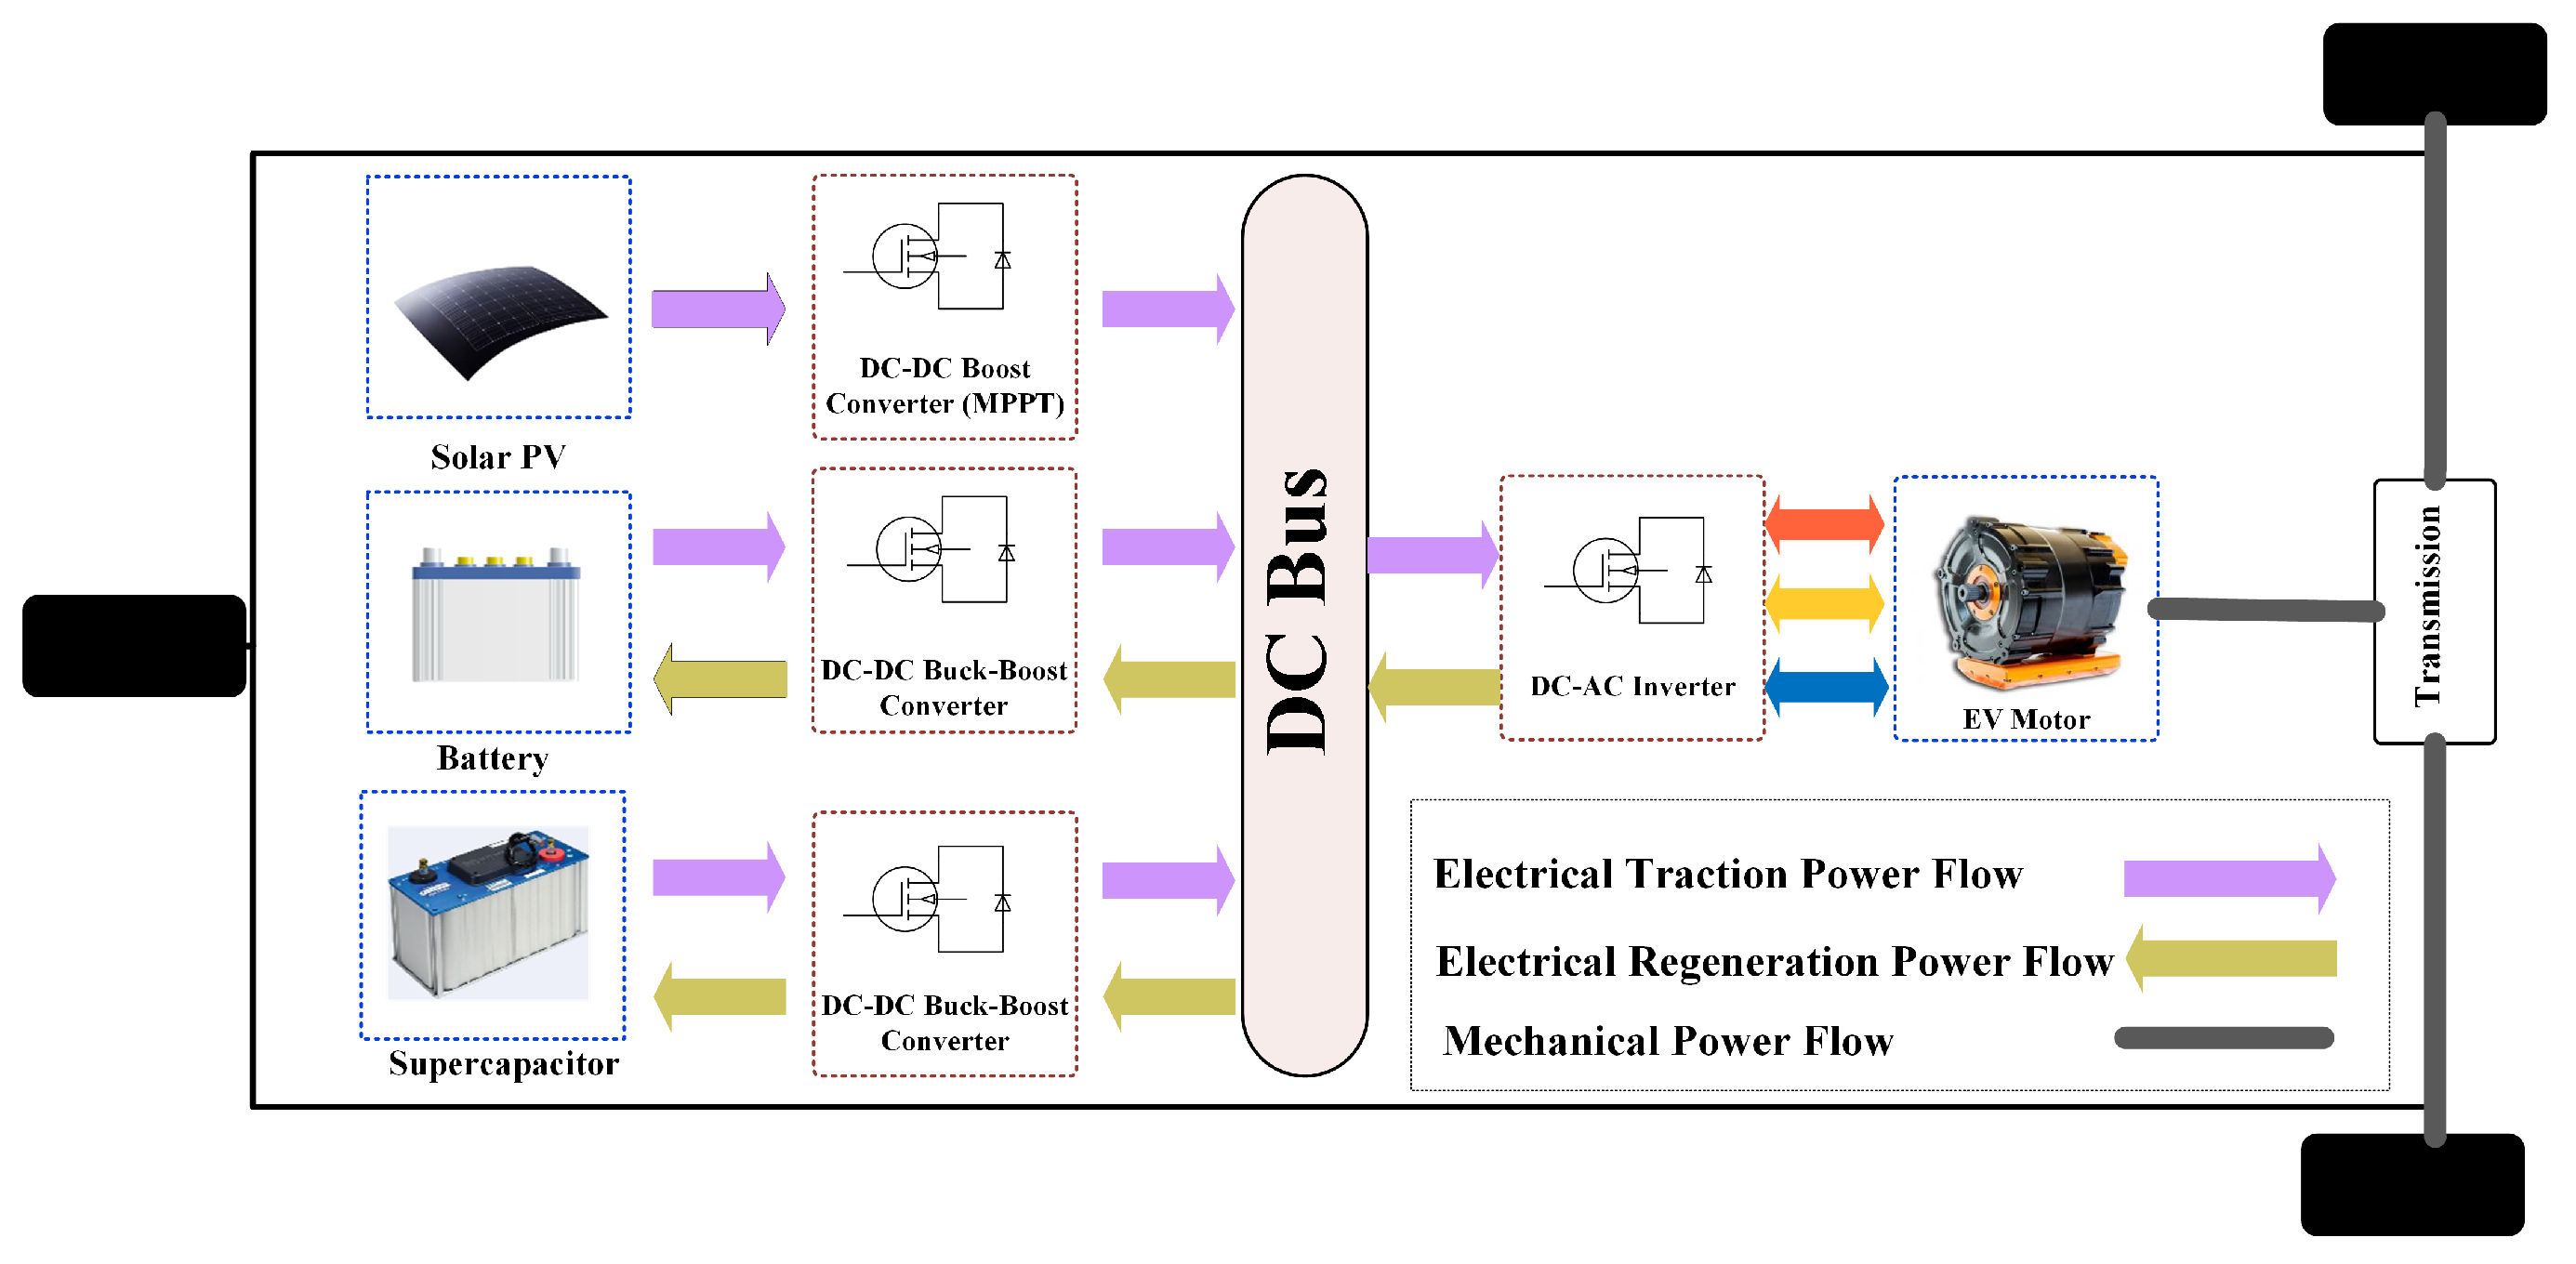
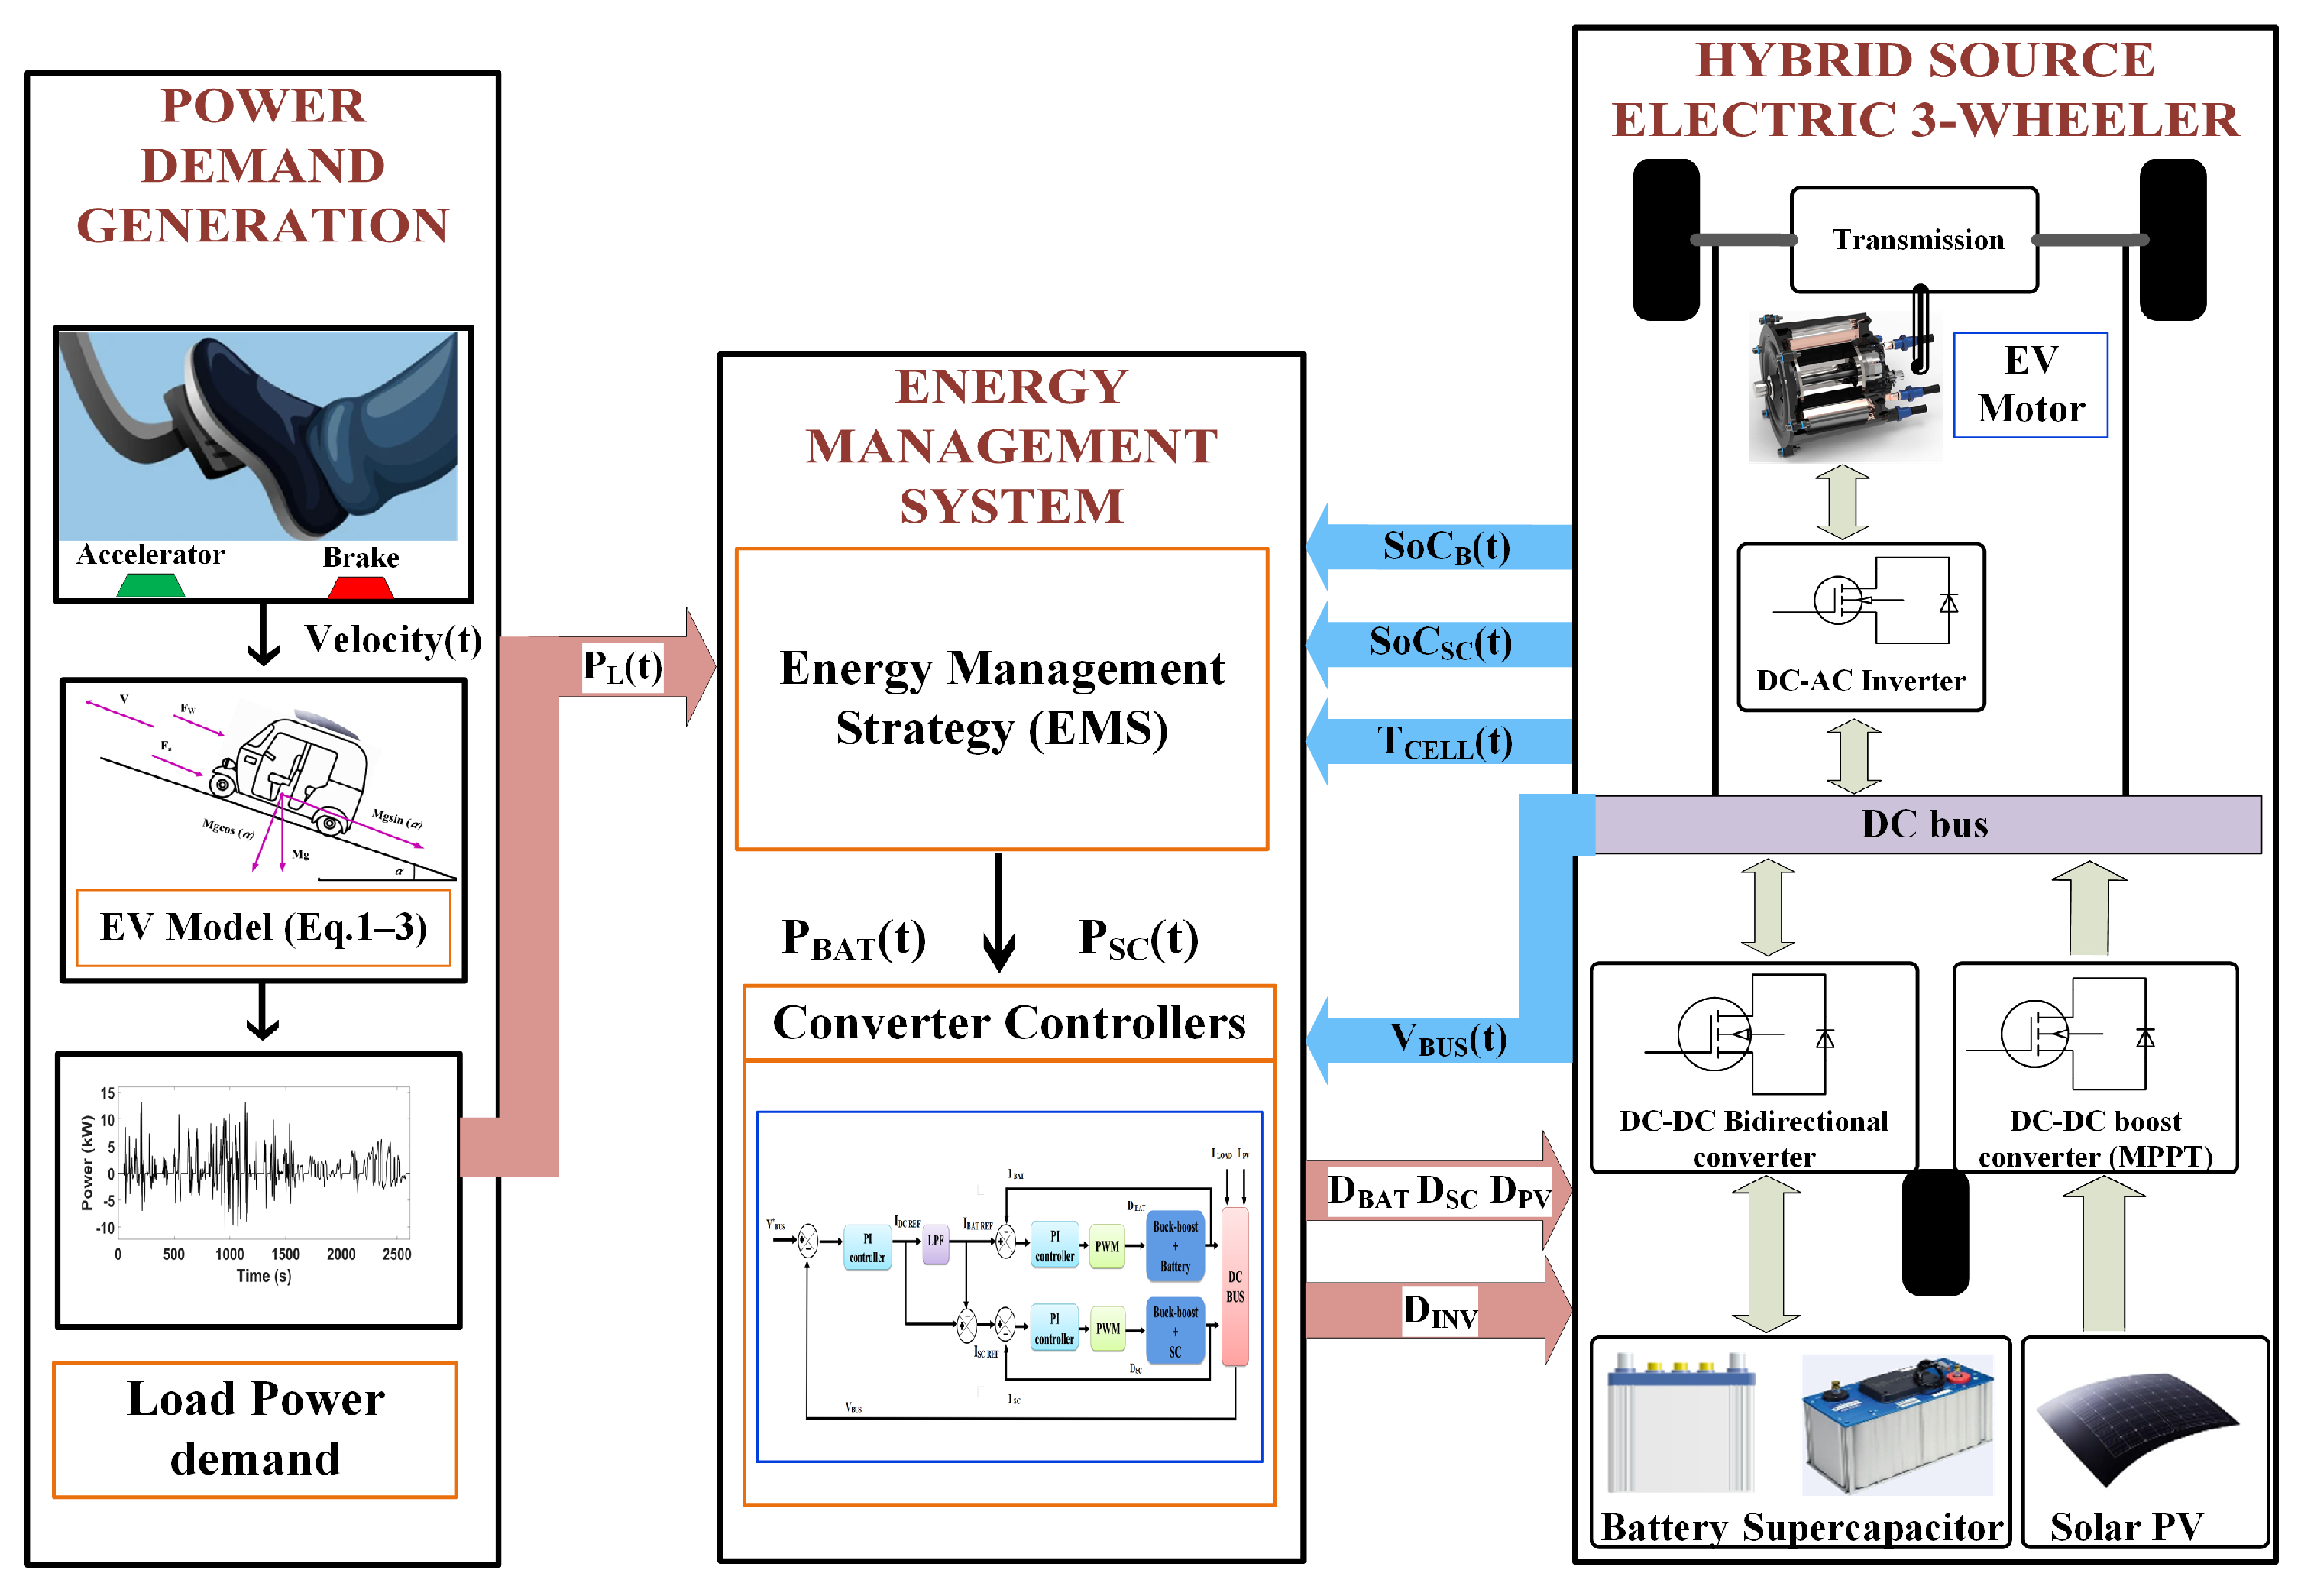
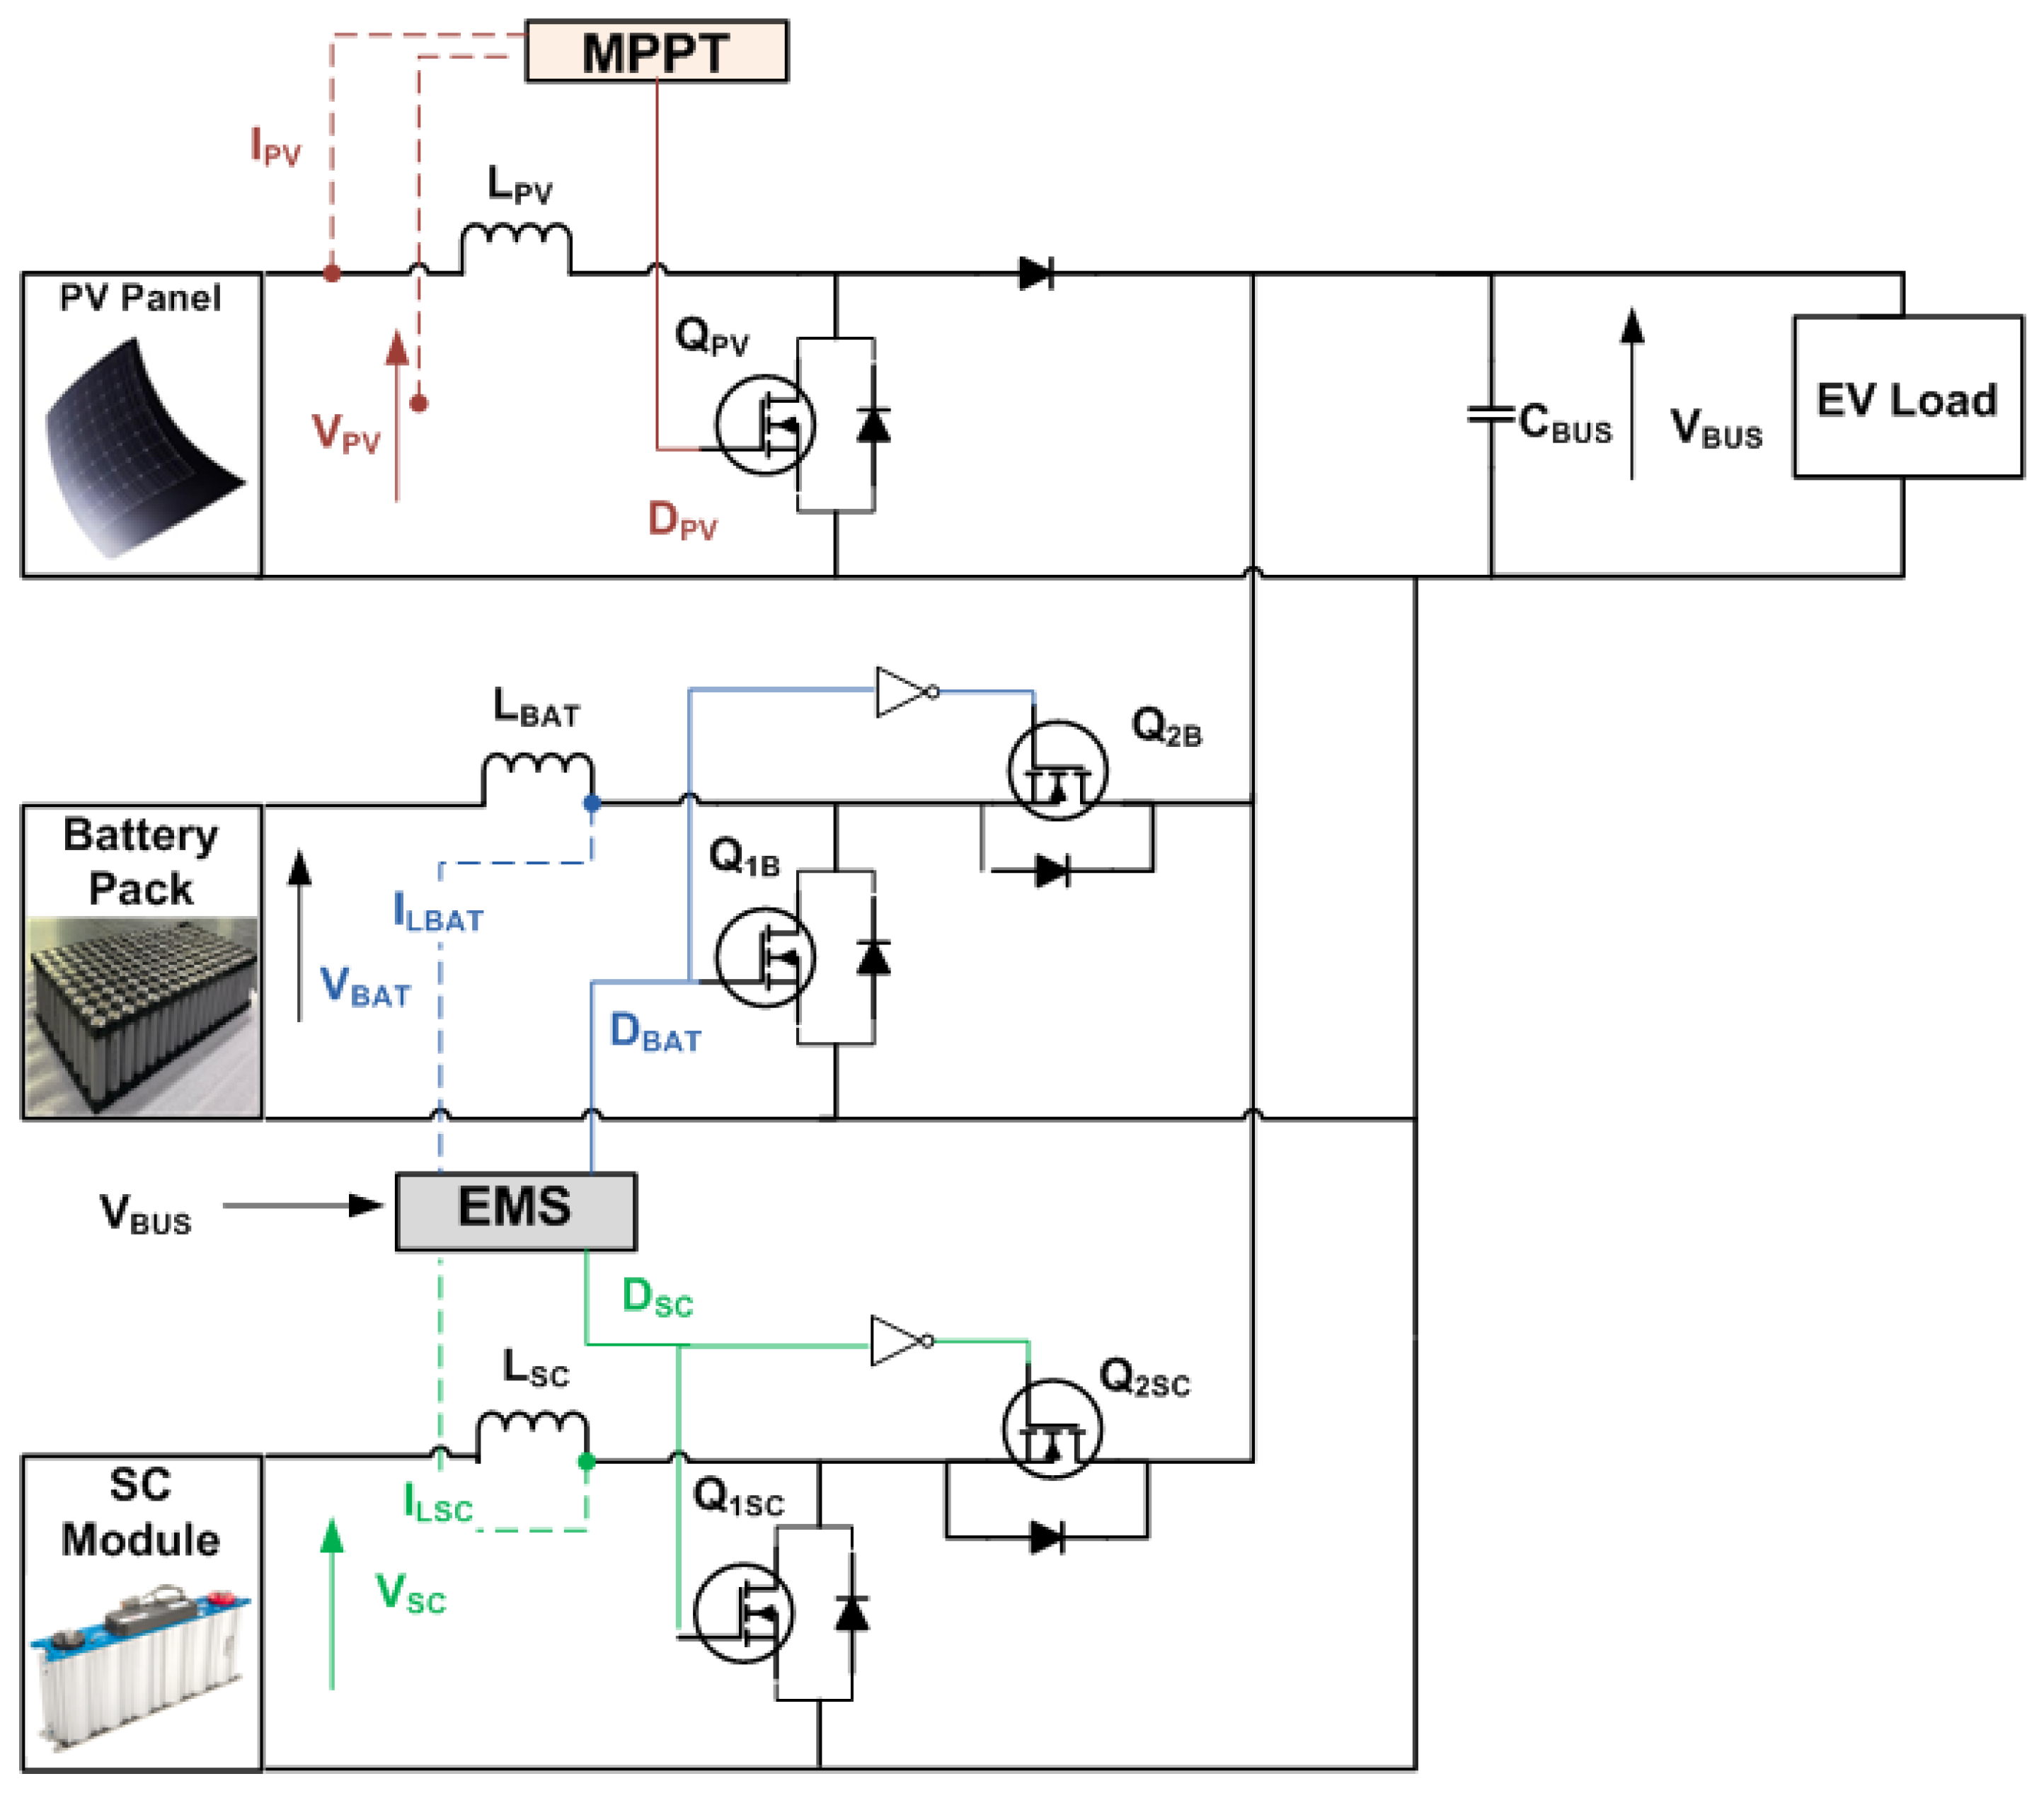
- Design and modelling of an Intelligent Hybrid-Source Energy Management Strategy (IHSEMS) for a Battery–SC–PV hybrid-source EV based on absolute energy sharing to ensure an effective and optimal power allocation without any complex modelling and data collection.
- Investigation of EV technical and economic parameters of proposed IHSEMS compared with BEVs and standard EMS.
- Stabilization of DC bus voltage and minimization of fluctuations during varying driving and environmental conditions.
- Contrary to the existing EMSs (SMC [41] and FDS [42]), the proposed work is highly adaptive and effective towards different driving and environmental conditions. It improves the SC utilization and reduces the RMS battery current with a downsized battery capacity, without compromising the vehicle range.
2. Energy Management System and Strategies
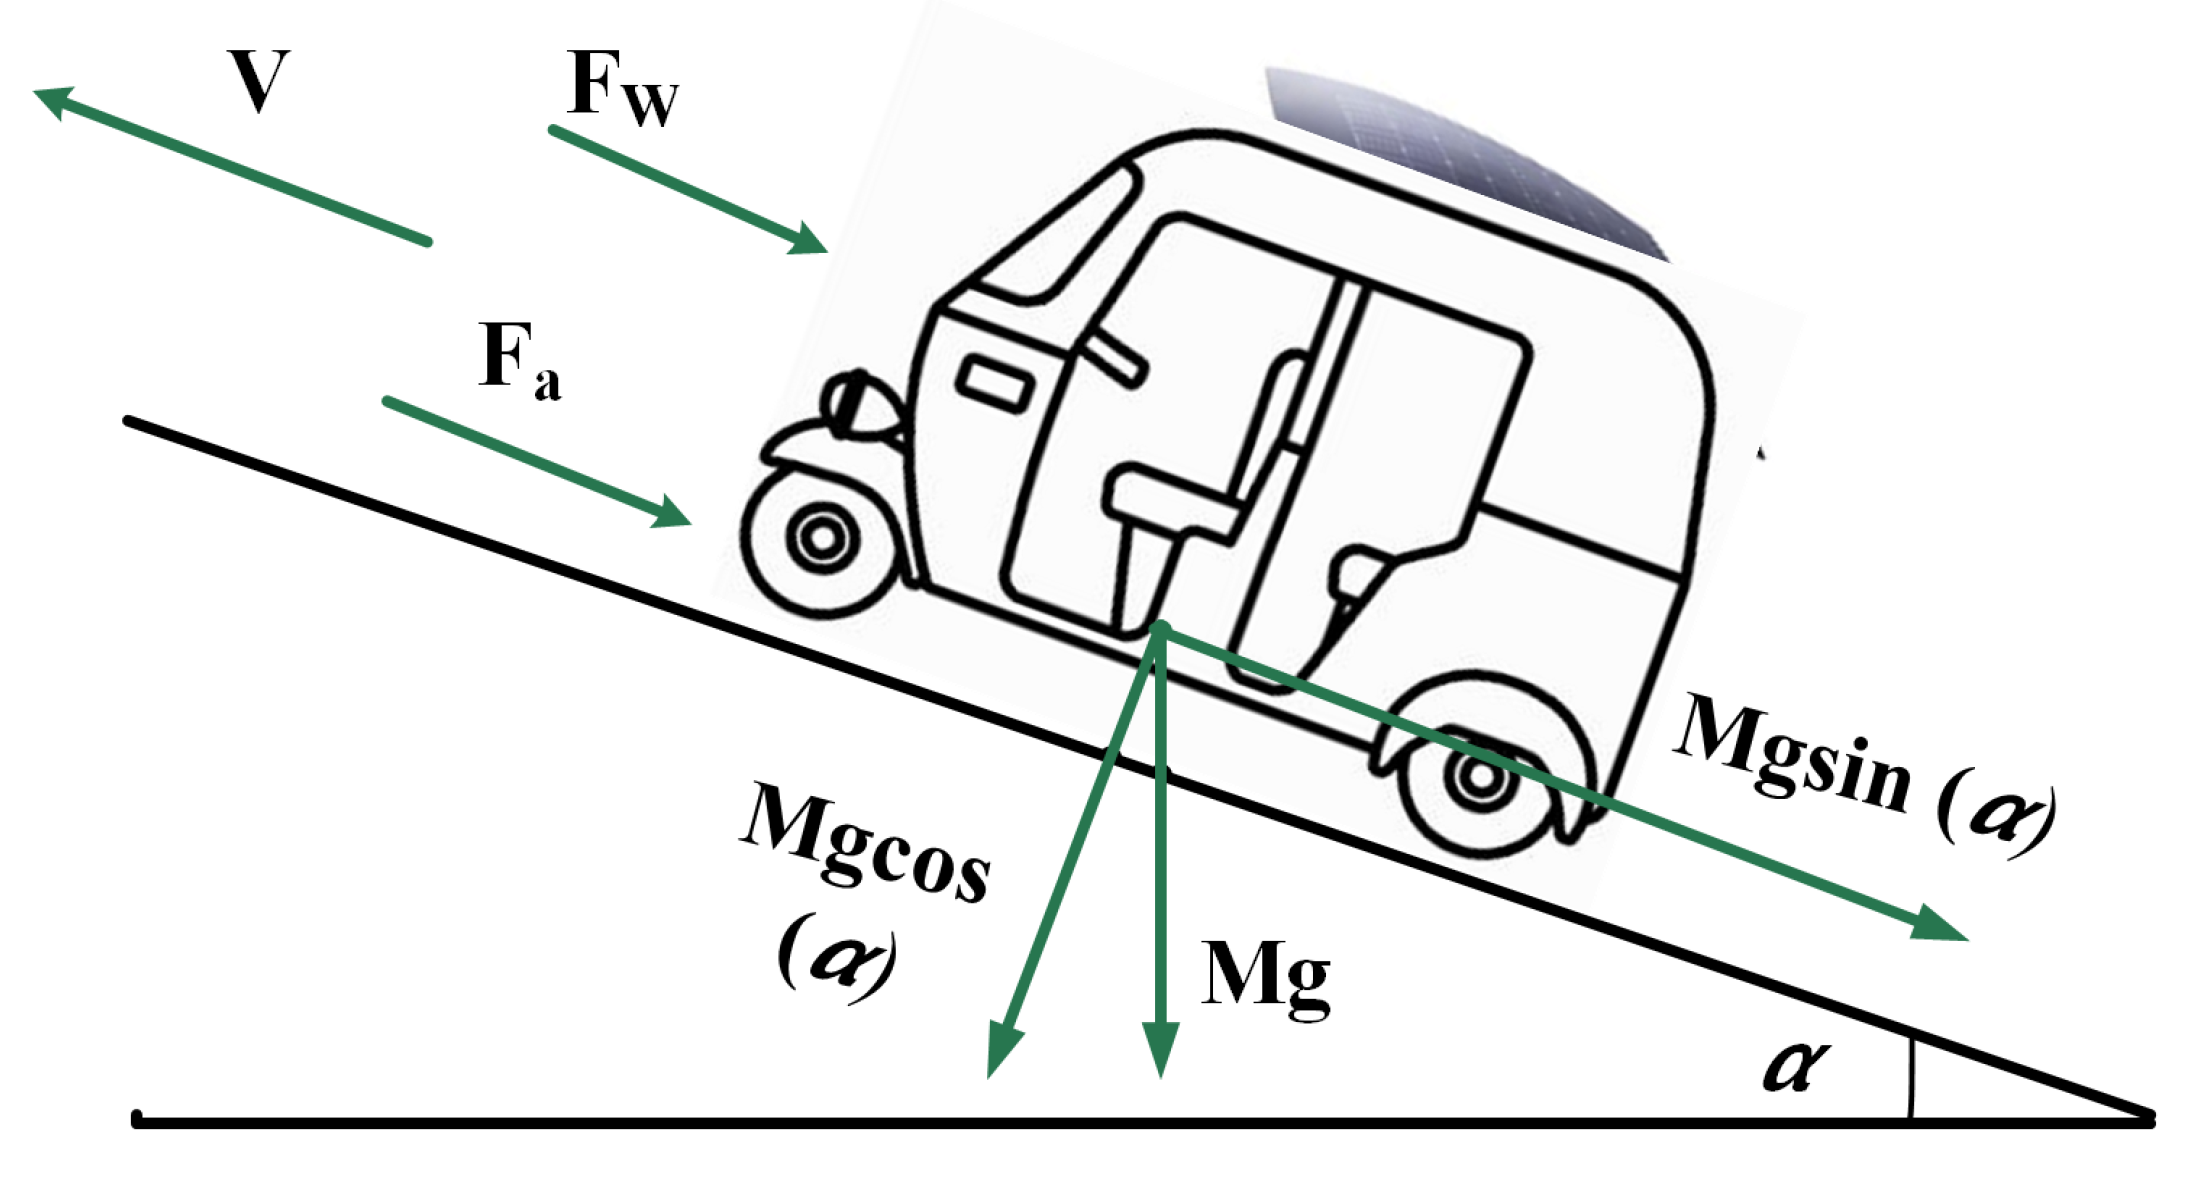
2.1. Dynamics of Electric Vehicle
2.2. Properties of Hybrid Sources
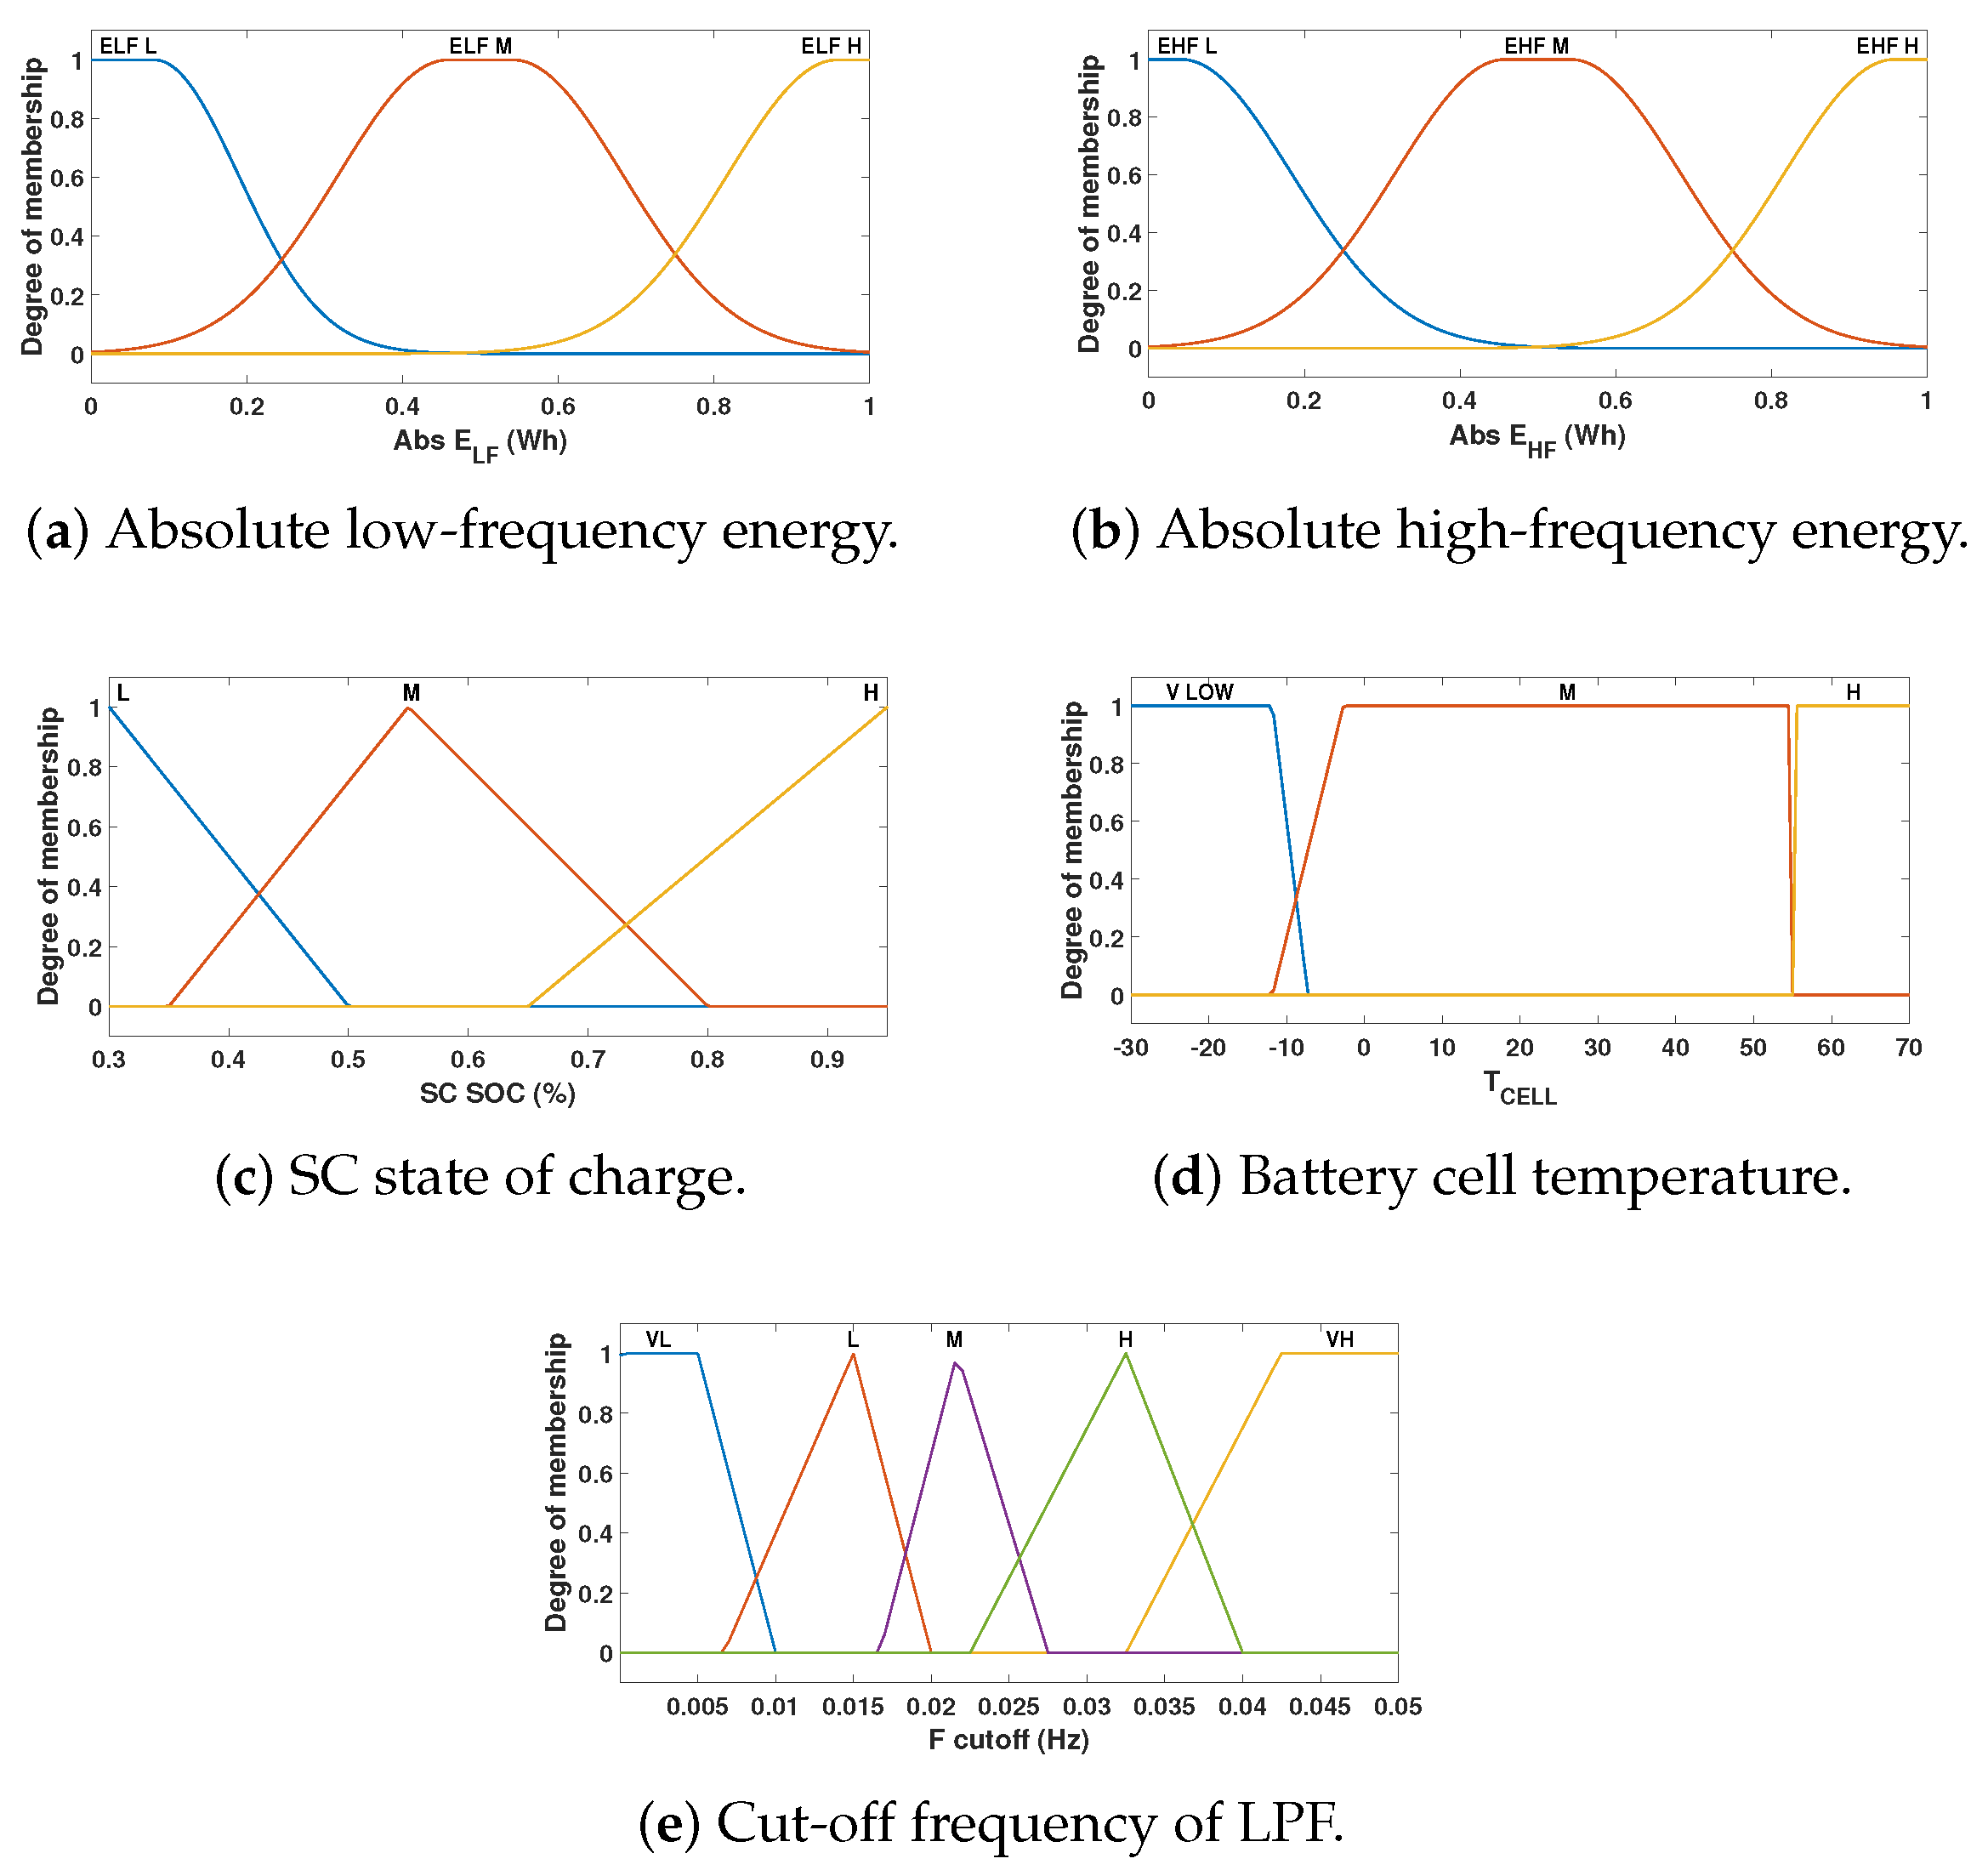
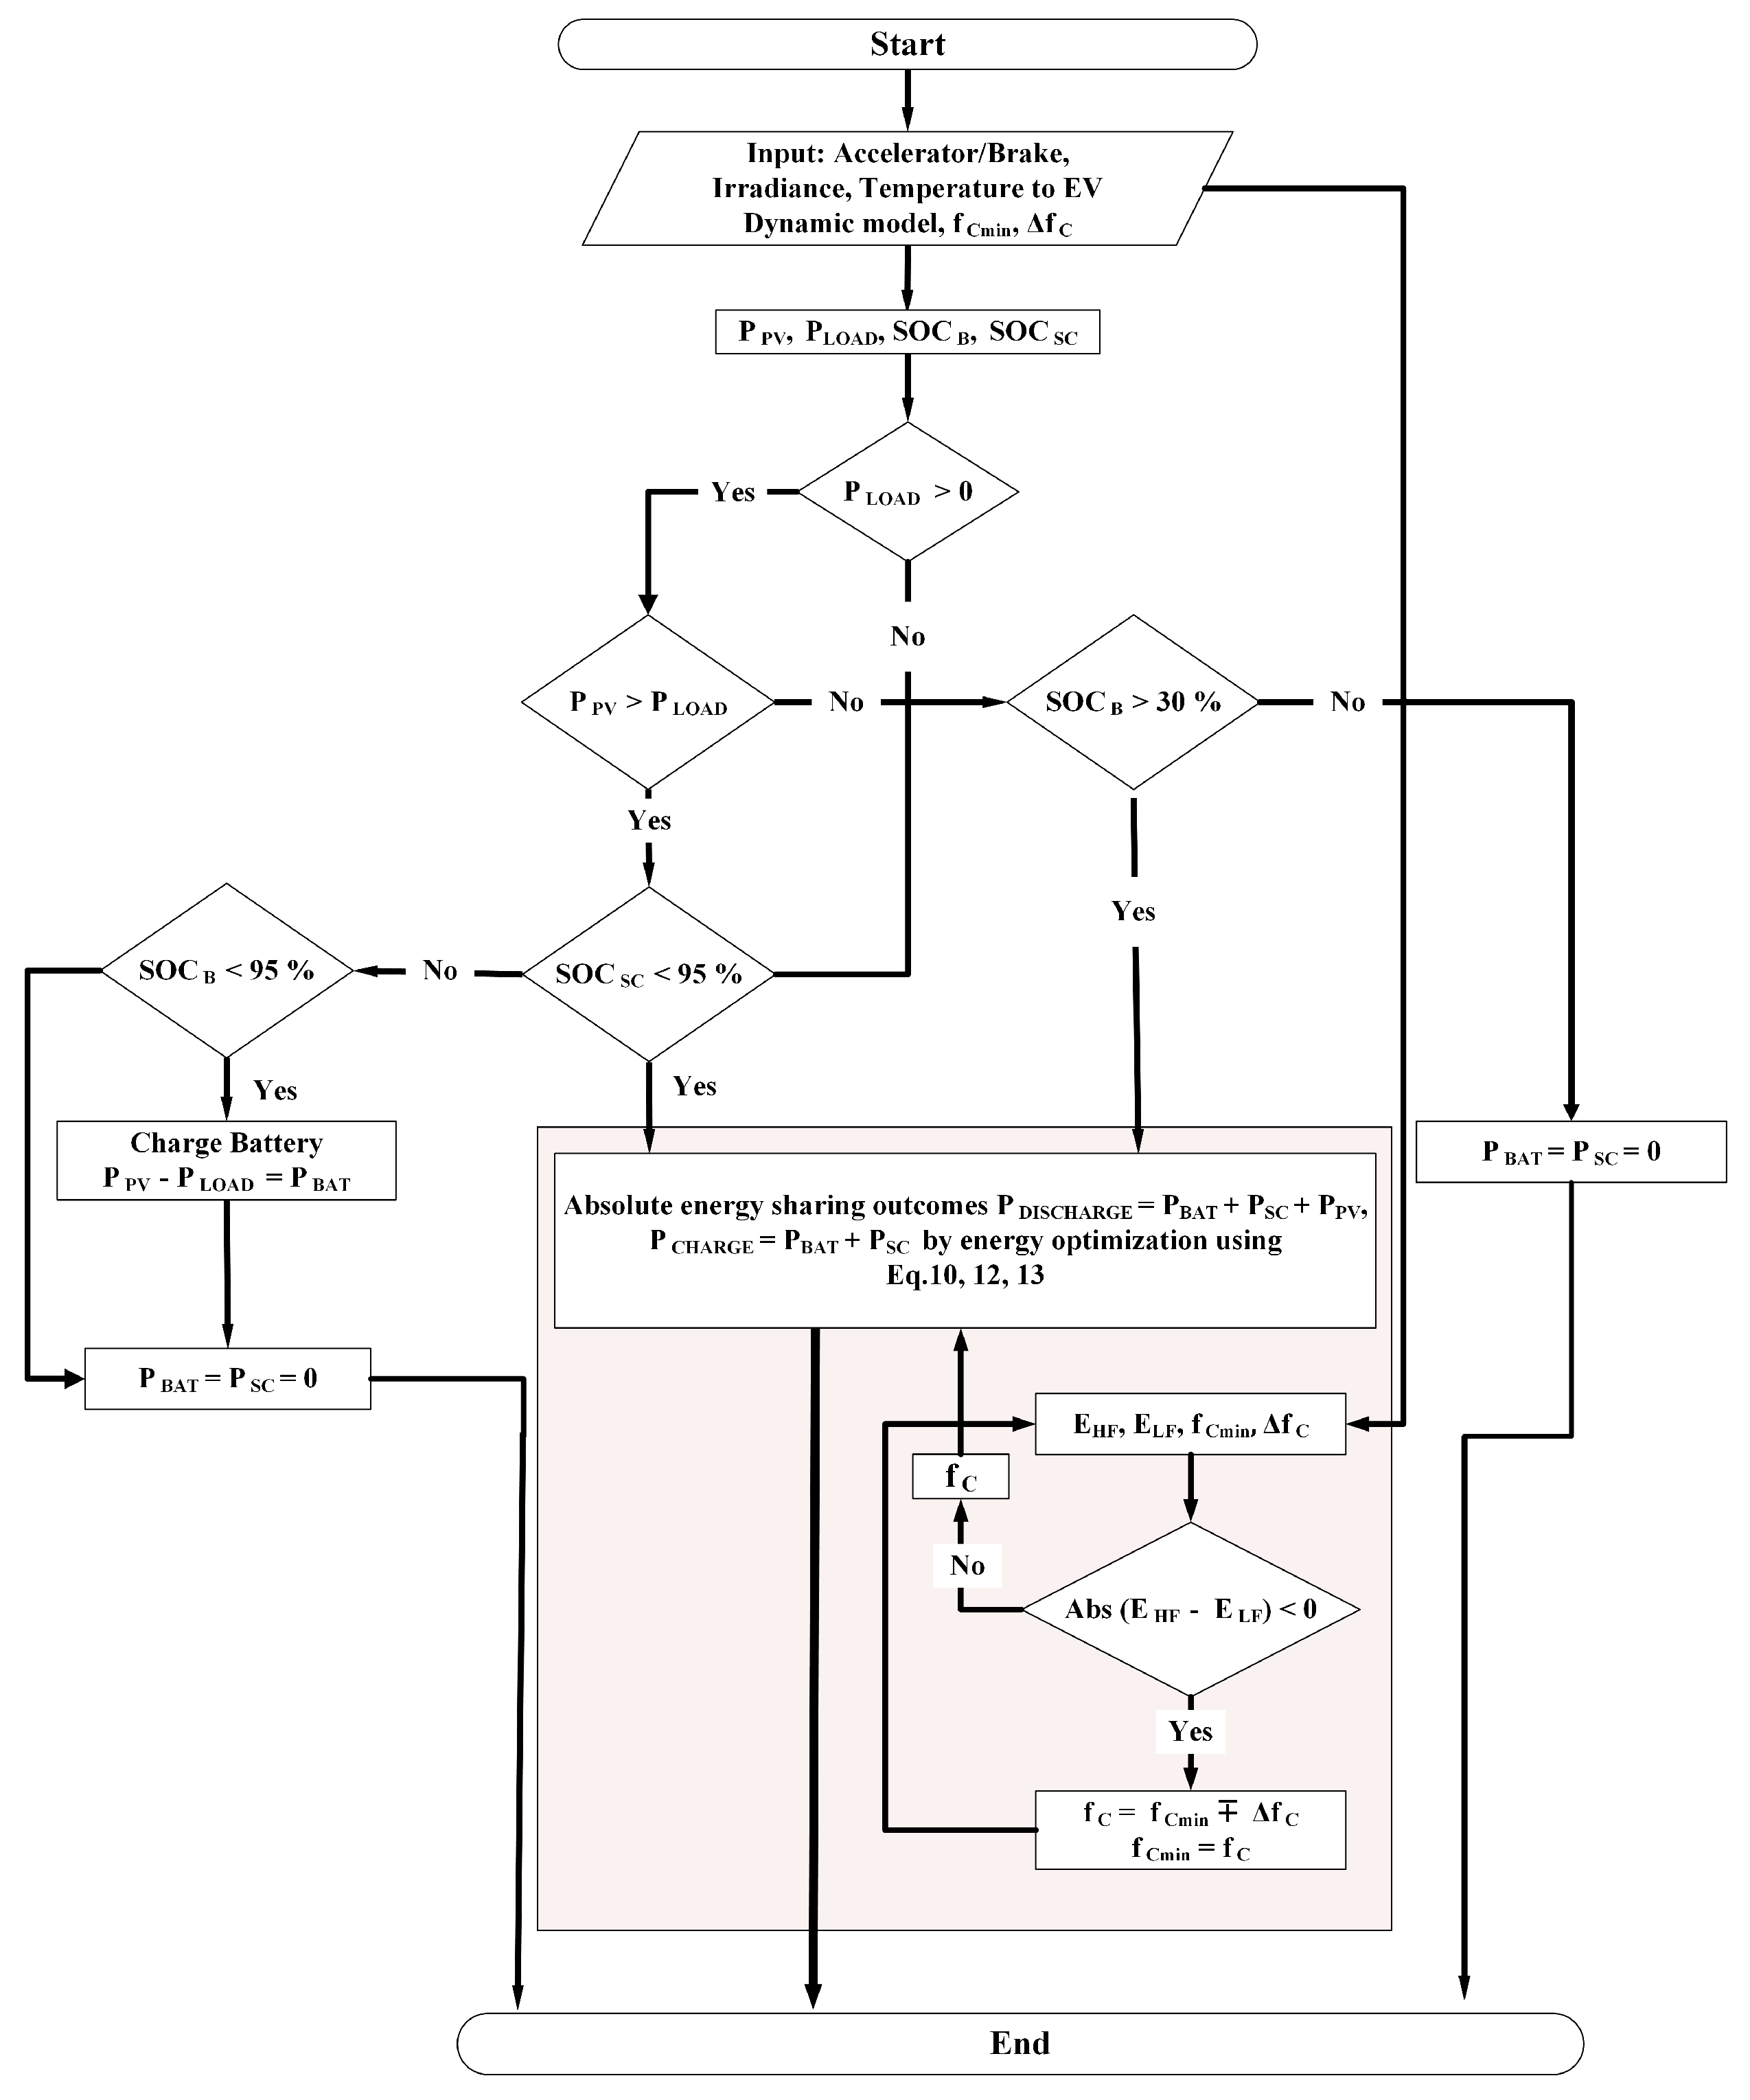
2.3. Proposed Energy Management Strategy
2.4. Technical Evaluation
- (a)
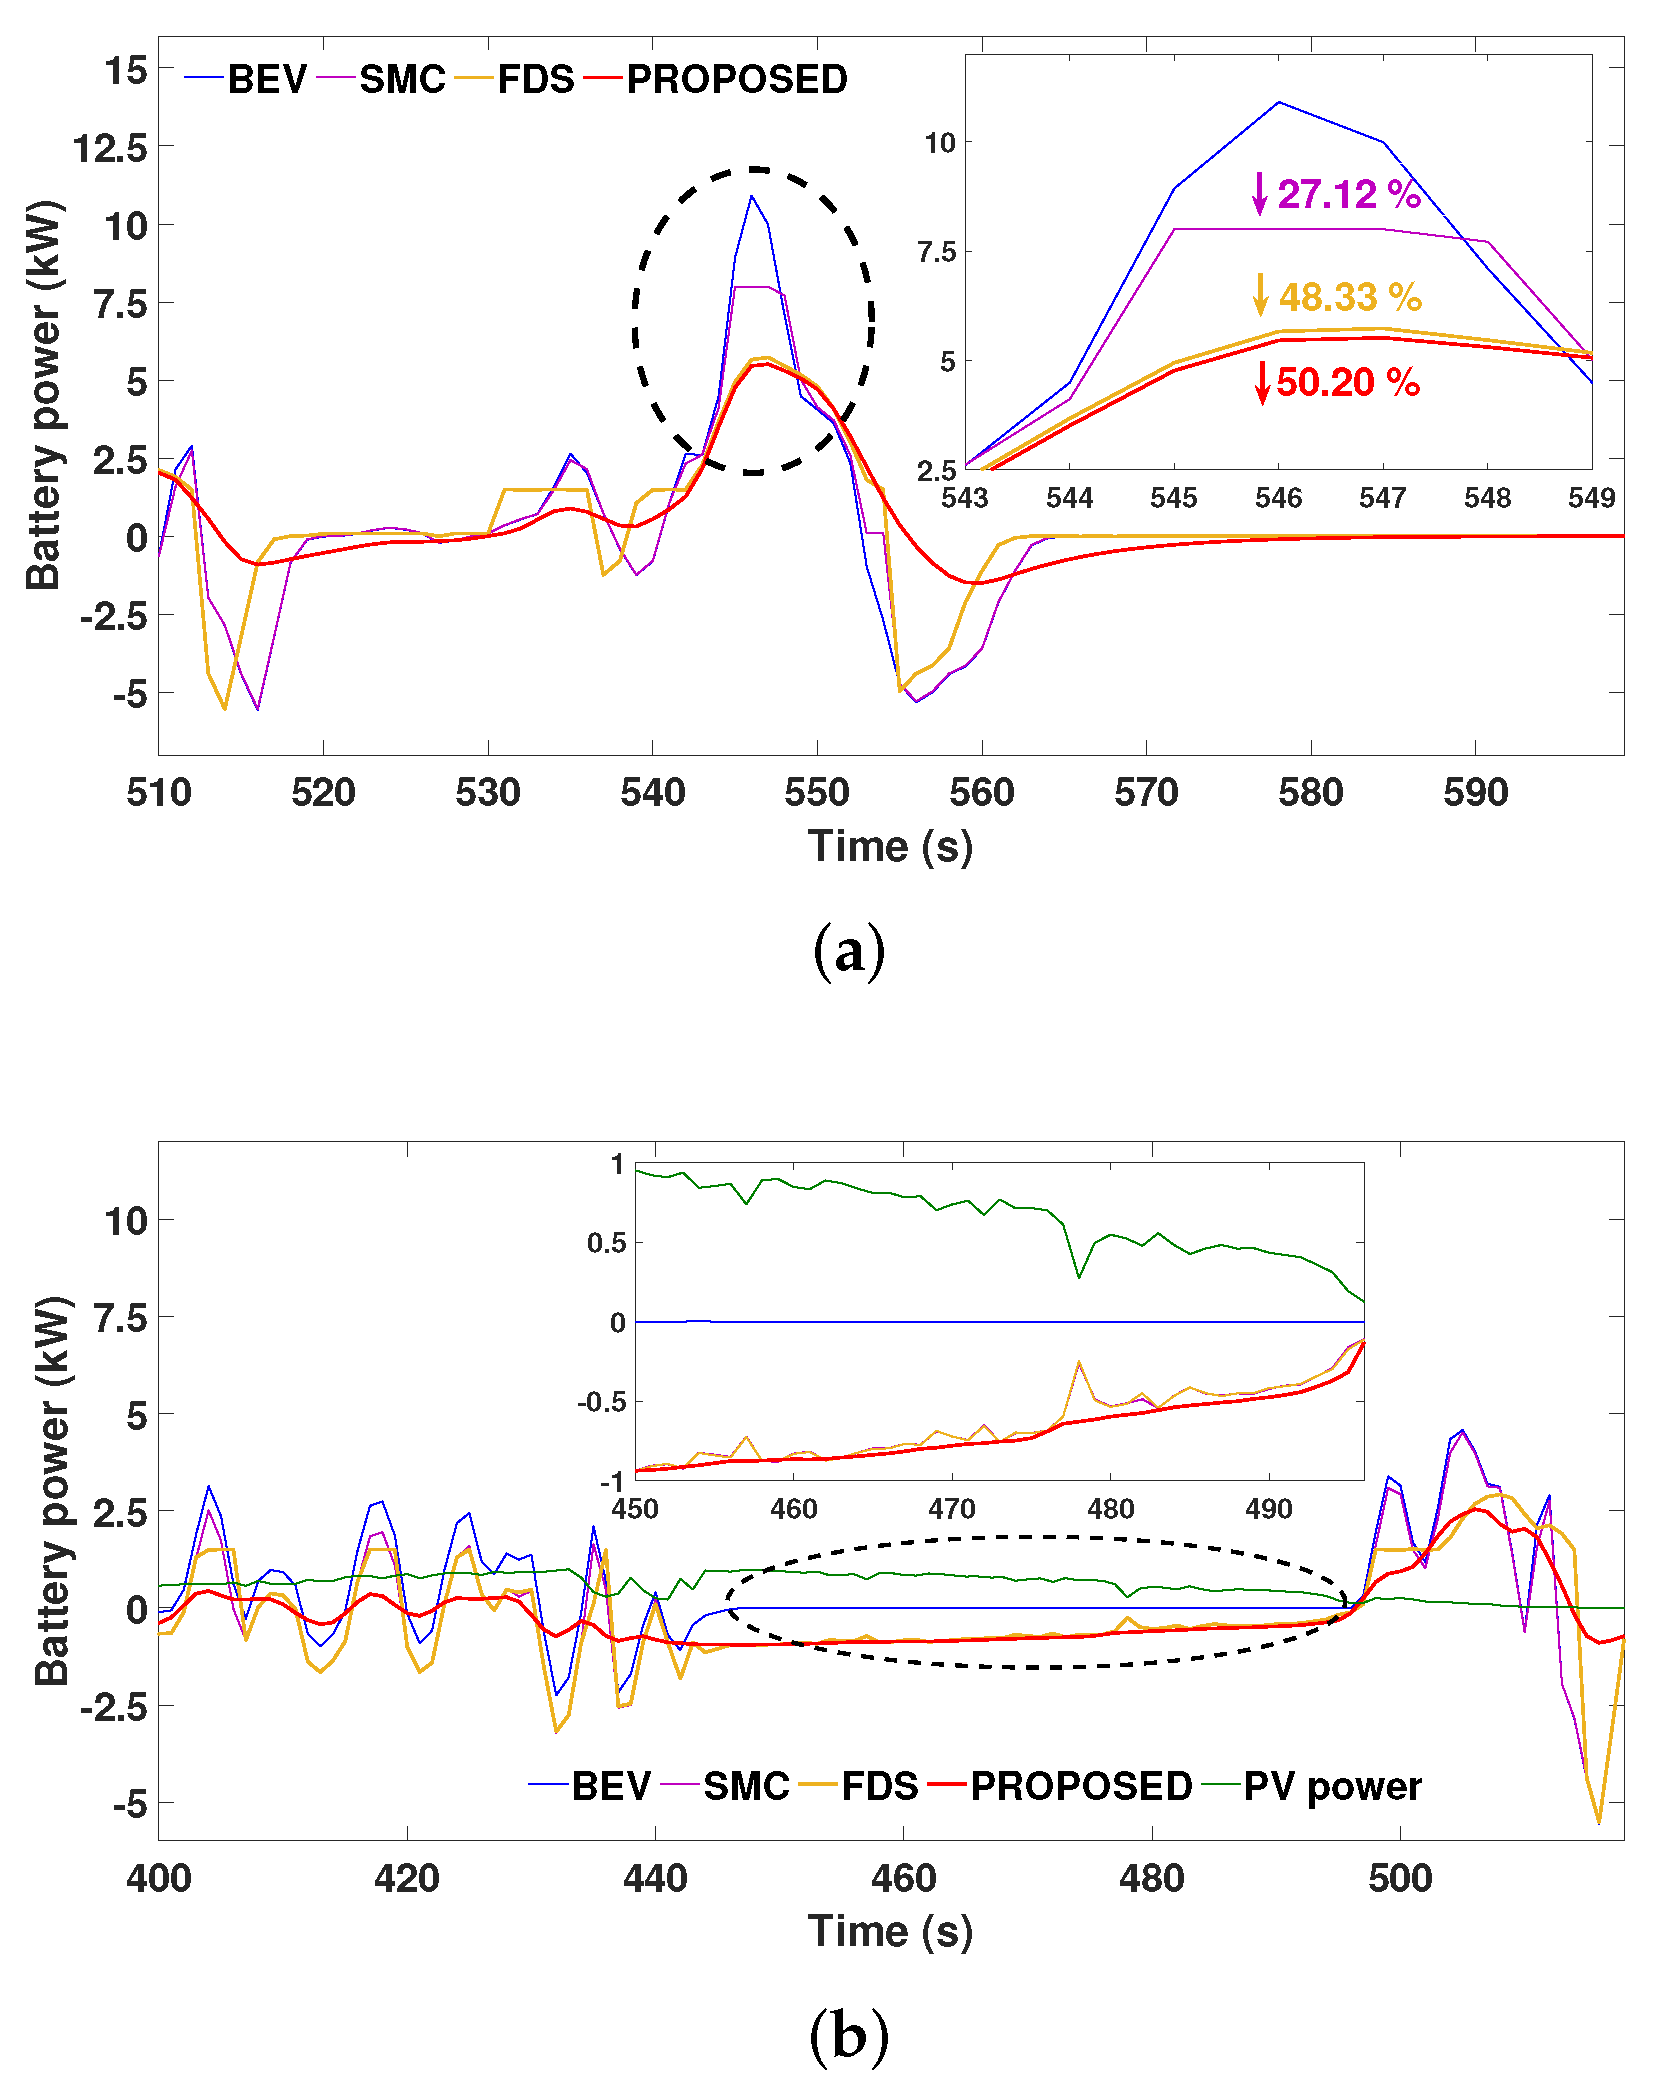
- Battery peak power reduction (): The peak battery power demand () increases the battery C-rates (/) and reduces the life (Equation (22)) [13,44]. The percentage reduction in battery peak power is expressed as follows:where is the peak battery power with hybrid EMS. The EMS ensures optimal battery operation to enhance the longevity of the battery cells. Battery downsizing (reduction in battery size) is possible by reducing the peak power demand by employing the suitable EMS [52].
- (b)
- Battery capacity reduction (): Describes the percentage reduction in battery capacity () [52].where is the battery capacity of Hybrid EMS. Reduction in battery capacity could be achieved by utilizing SC and PV as hybrid sources in HSEV to share the power demand.
- (c)
- Battery di/dt reduction (): Rate of change of battery current () and the percentage reduction are expressed in Equations (16) and (17), respectively, which determines the stress on the battery.where and are the maximum and minimum battery current. and are the respective time instants of maximum and minimum battery current. and are the di/dt ratio of BEVs and EMS, respectively. Battery internal stress directly depends on the C-rates and the battery’s current fluctuation rate [53]. Higher and sudden variations in battery current cause the development of concentration, and more non-uniform and steeper gradients in the film [54].
- (d)
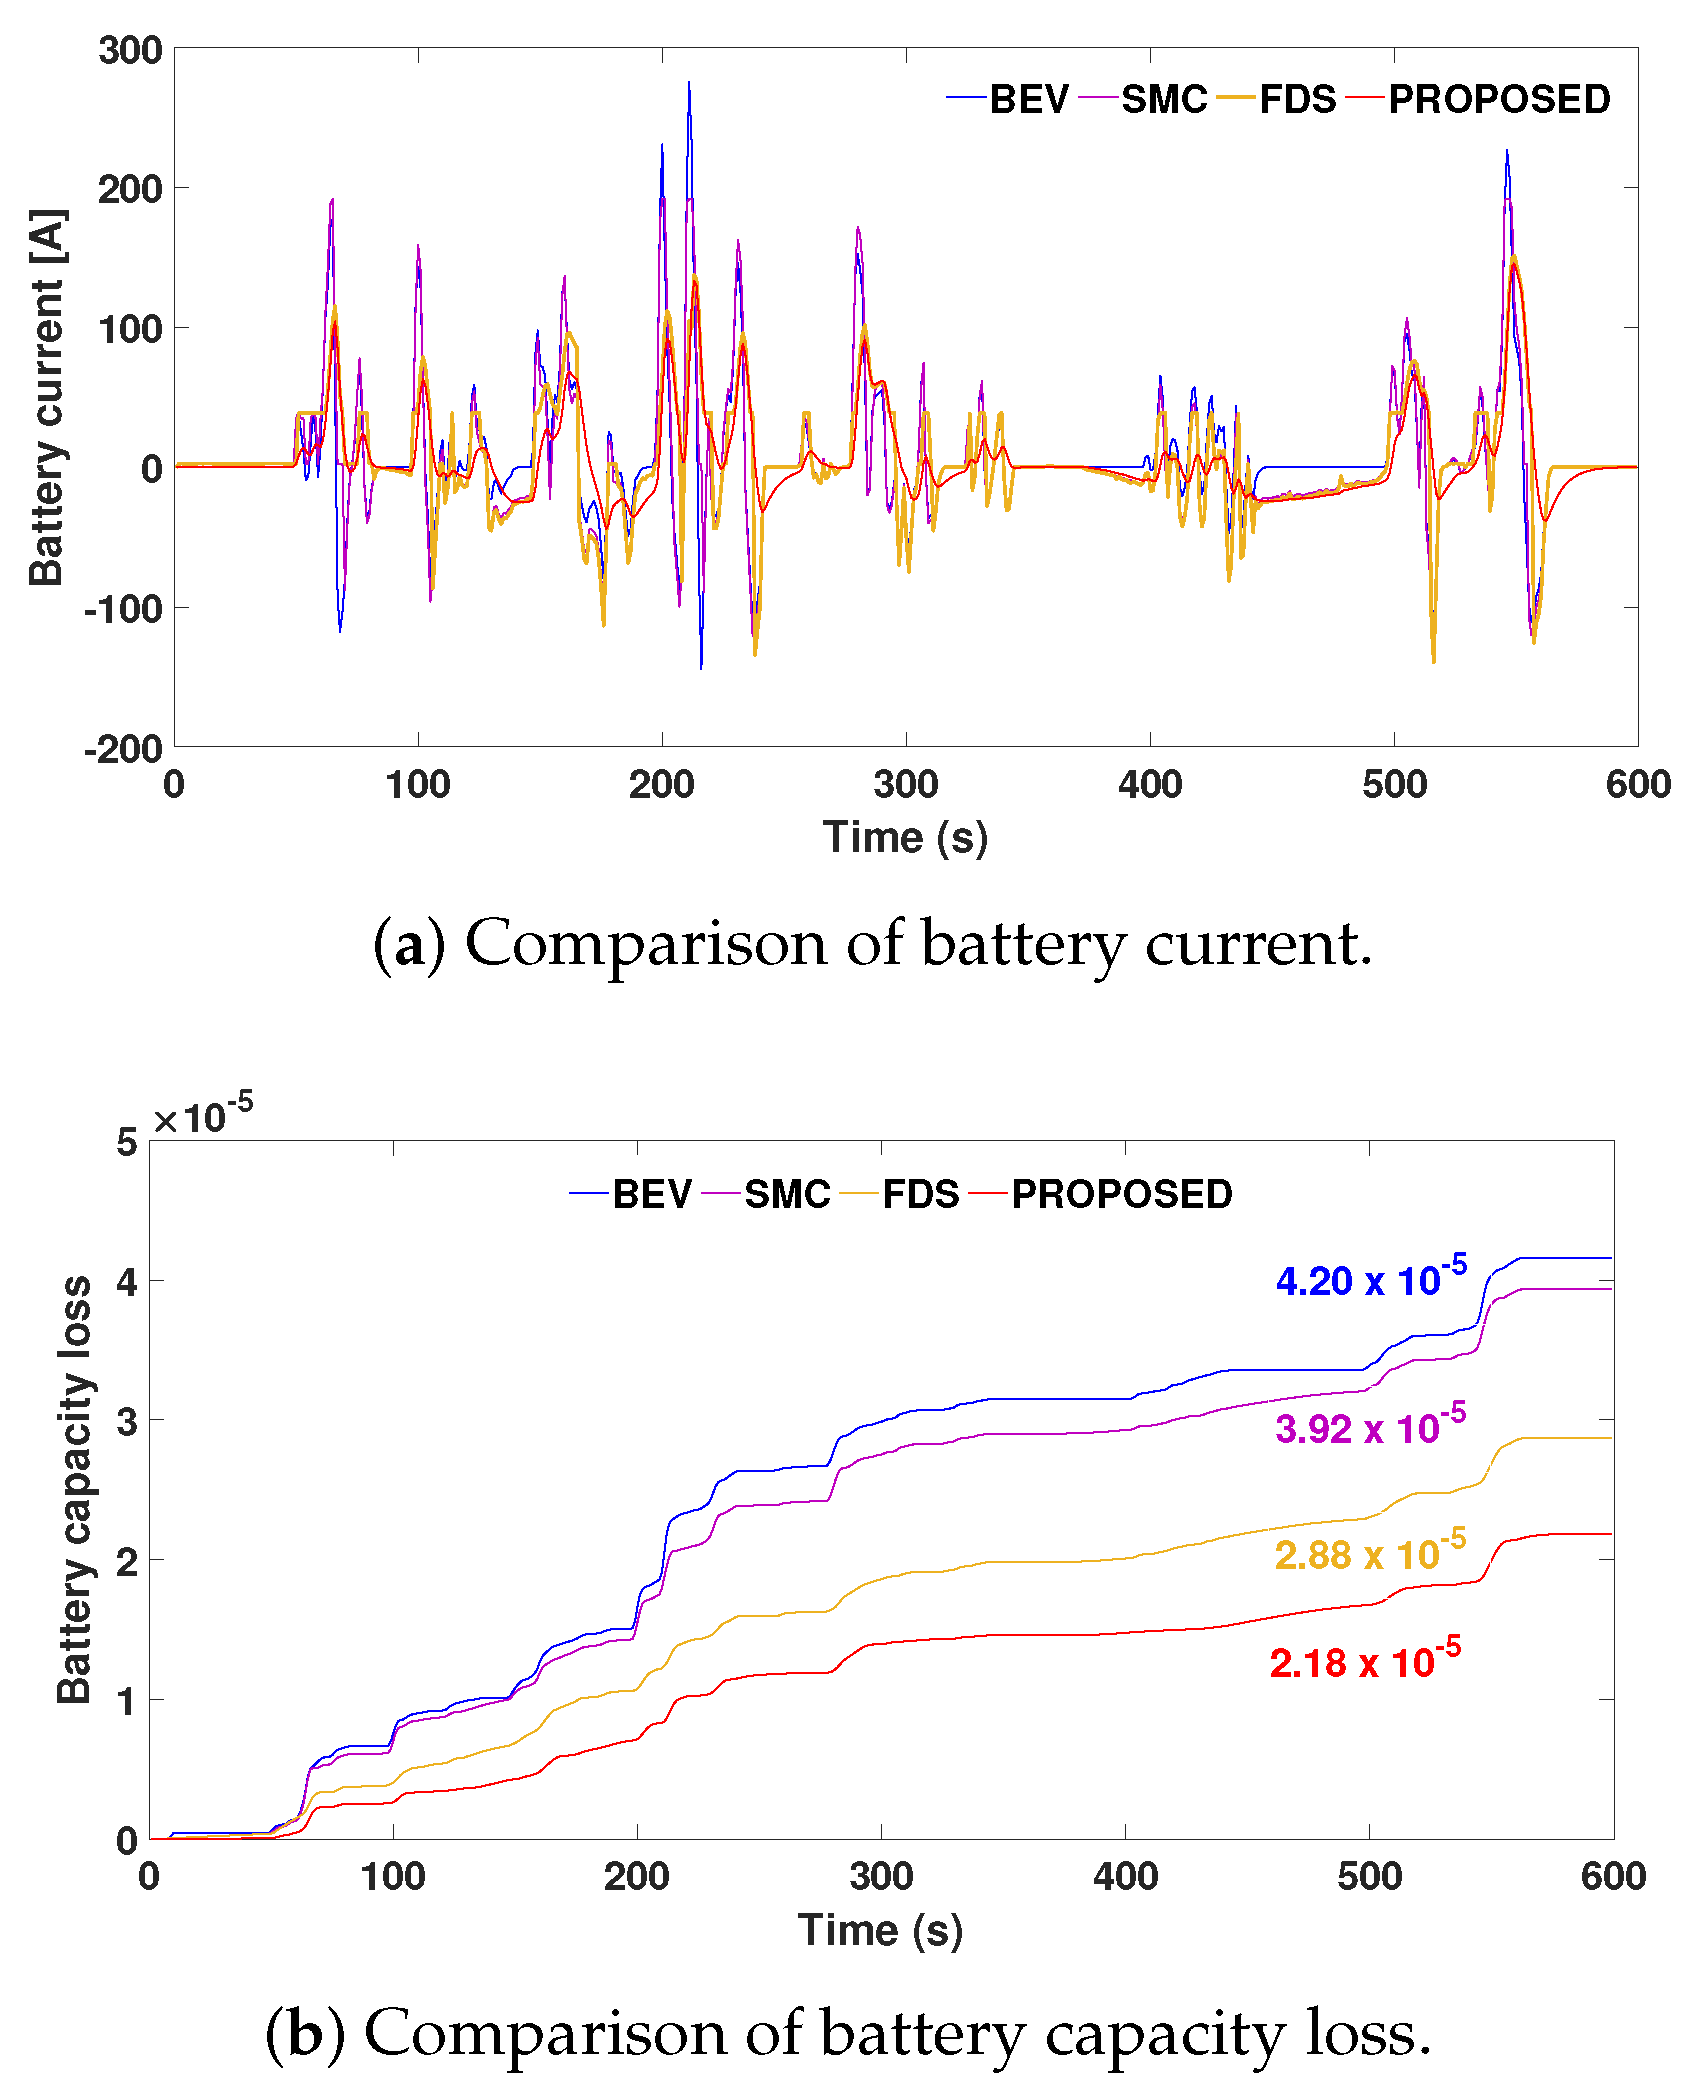
- Battery RMS current reduction (): Battery RMS current reduction % can be calculated using Equation (18), and its reduction extends the battery life [30]. RMS current is a vital factor that affects battery life and gives a rough estimation of the battery ohmic losses [55]. The system’s overall losses and efficiency highly depend on the RMS current. , by employing the suitable hybrid source in EVs, decelerates battery capacity degradation.where is the battery RMS current reduction percentage, is the battery RMS current and is the battery RMS current with EMS.
- (e)
- Battery capacity loss (): Instantaneous battery capacity loss, battery capacity loss, and total capacity losses are evaluated with Equations (19)–(21), respectively [44,56].where is the battery current, is the sampling interval, is the instantaneous battery capacity loss, is the battery capacity loss, R is the gas constant (J/mol K), T is the absolute temperature (K), Ah is the Ah-throughput, z is the power-law factor (0.828), is the battery charge/discharge rate, and DOD is the battery depth of discharge.The capacity loss of a lithium-ion battery determines the life of the battery. Reduction in capacity from the initial capacity (100%) must be less than 20% to achieve optimal battery operation for EV applications. The end of life (EOL) of a battery is defined as whenever the battery capacity reaches less than 80% of its initial capacity [57]. The Arrhenius degradation model [58] is used to depict the battery degradation, and the model explains how the battery temperature, depth of discharge (DOD), current rate , RMS current, and BIR () highly deteriorate the battery life and increase the BDC Equation (28) [13,30].
- (f)
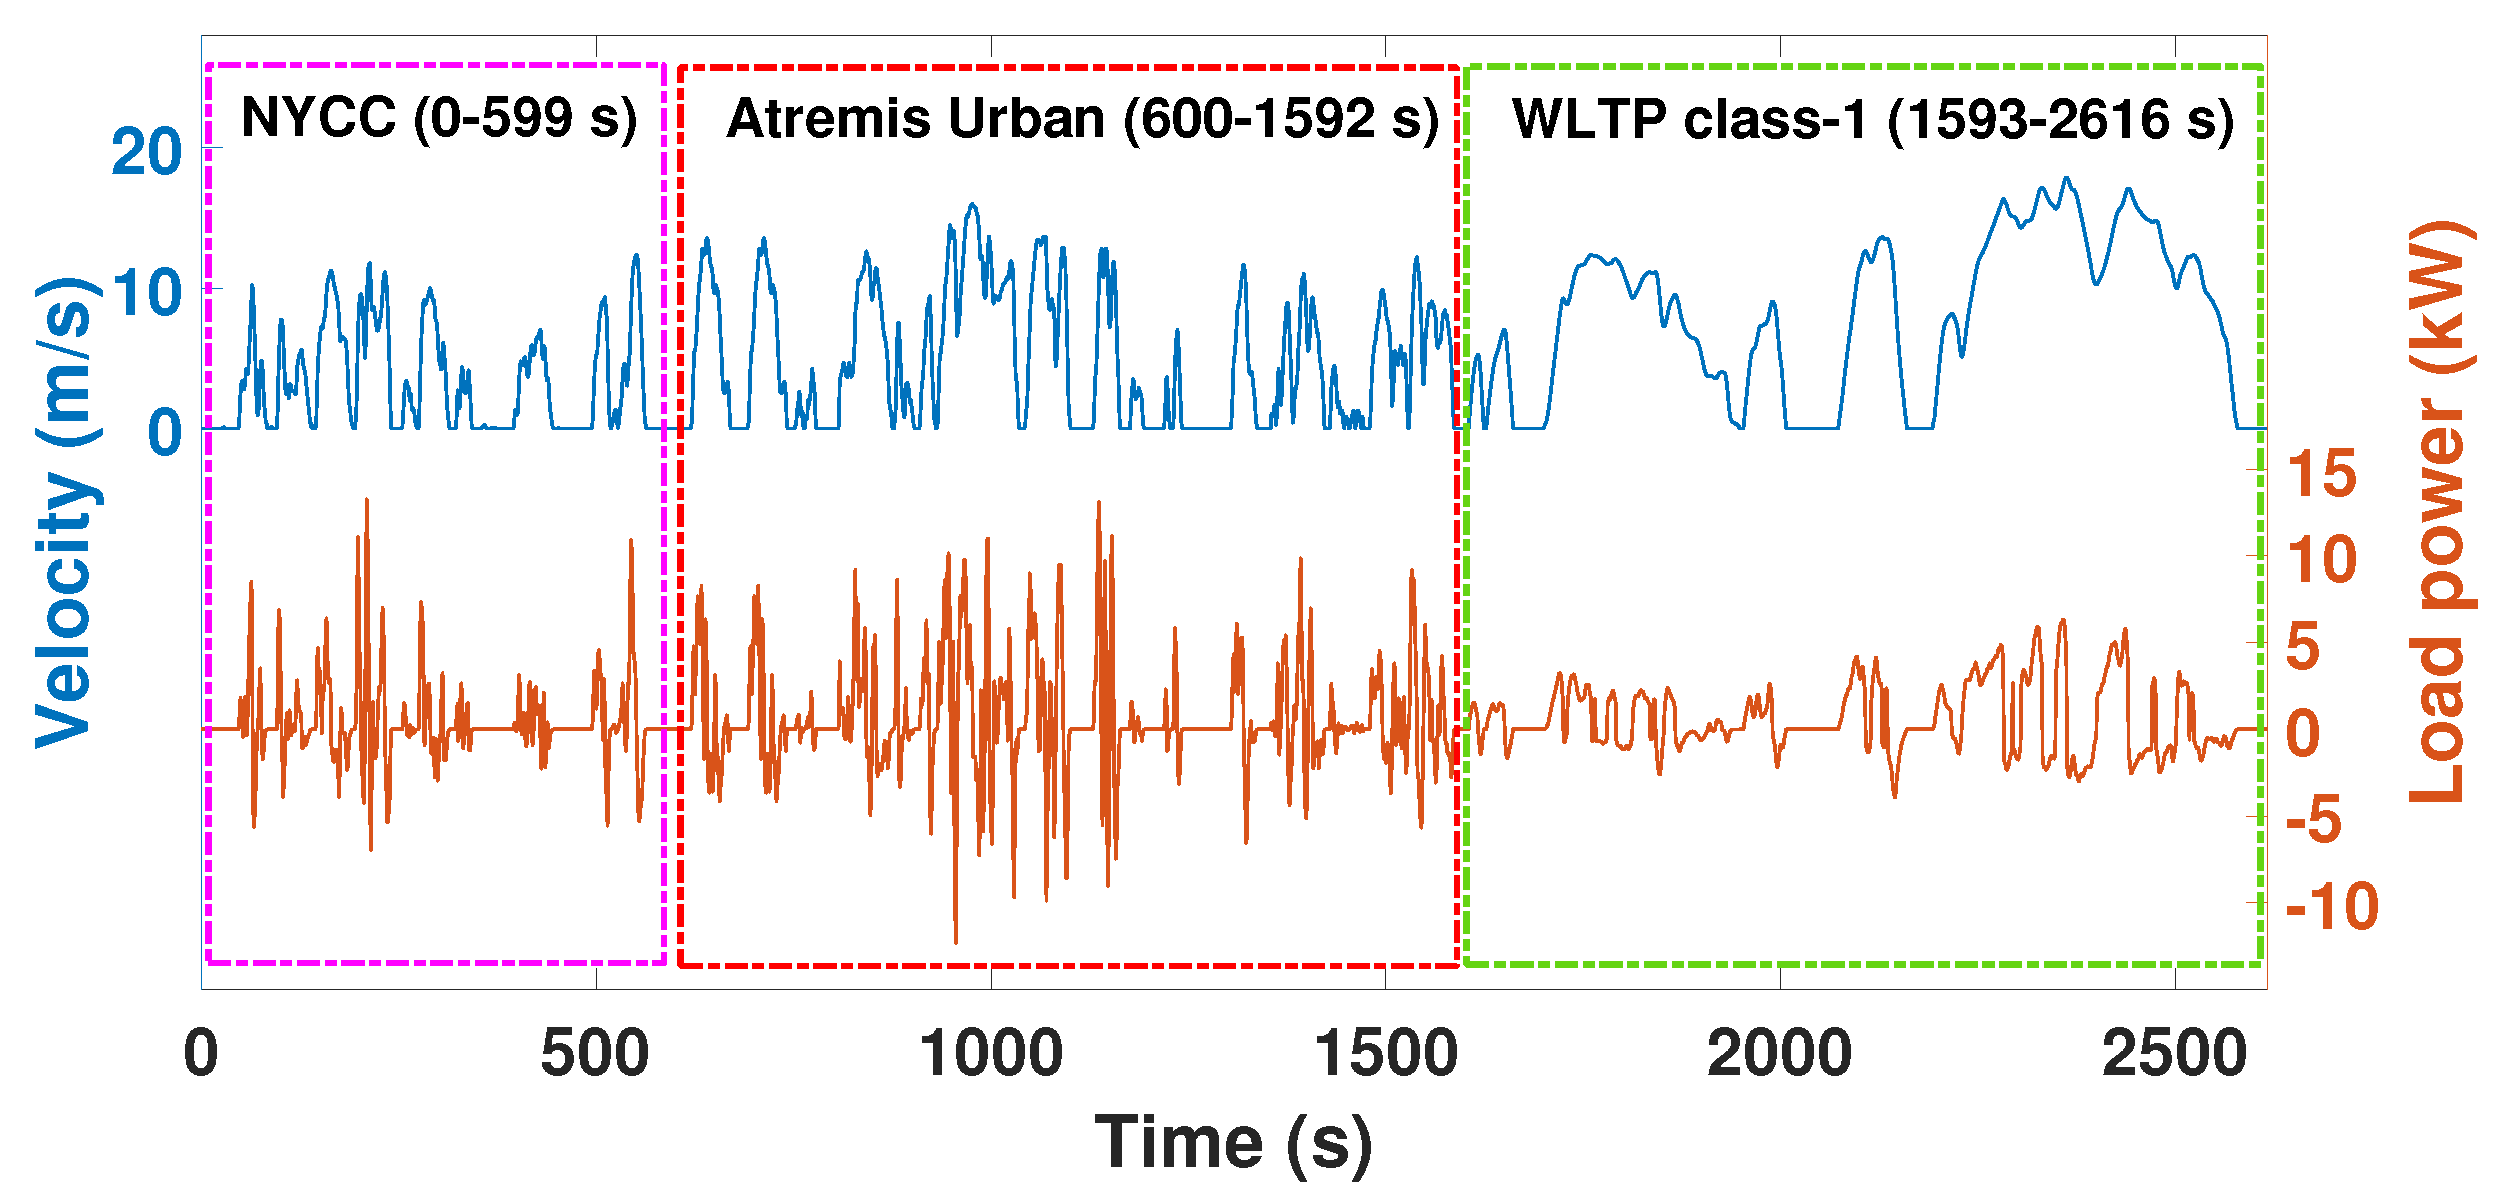
- Battery lifespan (): The significant impact on battery life is due to the battery capacity loss, as expressed in Equation (22) for a lithium-ion battery [44].where is the capacity loss at each distance and is the average traveled distance per day. The highly fluctuating NYCC cycle was selected to analyze extreme battery degradation and life. However, the present analysis thoroughly studied EV battery LS for different hybrid EMS versus BEVs under uniform environmental conditions. In a Li-ion battery, if the capacity loss exceeds 20%, or the capacity goes below 80% of the nominal capacity, it is unsuitable for EV application. Battery lifespan improvement (BLSI) derives the battery life extension for the hybrid EMS compared to BEVs.
- (g)
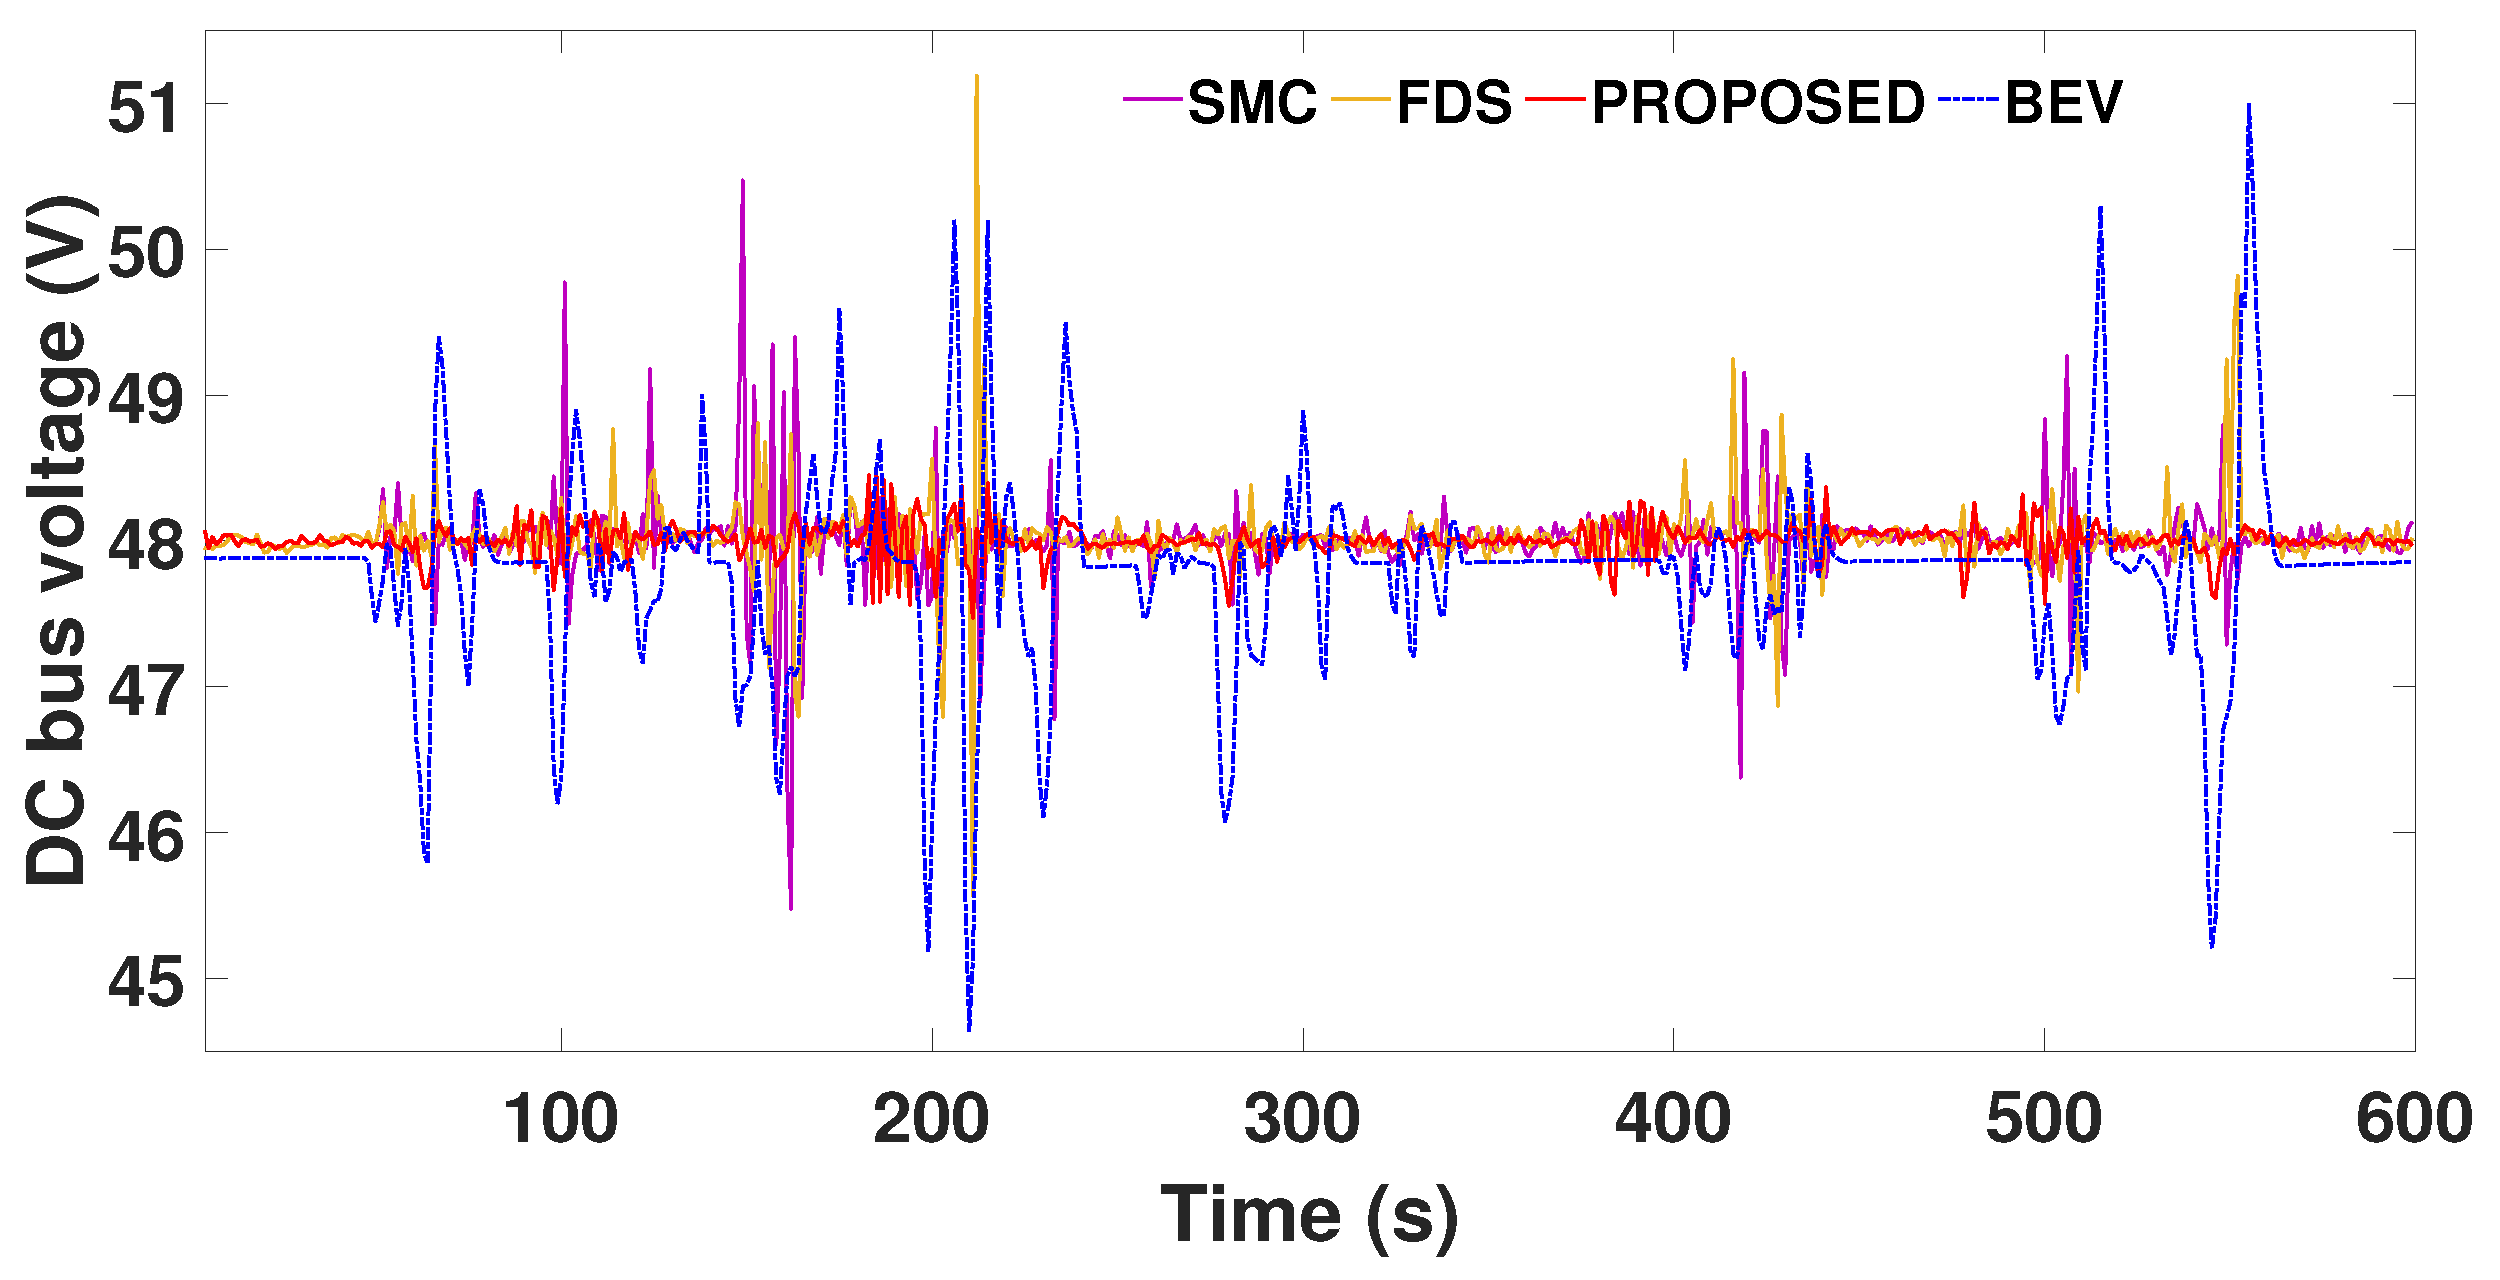
- DC bus voltage fluctuations(): Equation (23) expresses the percentage variation of the peak-to-peak DC bus voltage fluctuation [27] as follows:where is the DC bus voltage and and are the maximum and minimum DC bus voltage. The difference gives the peak-to-peak value of the bus voltage. DC bus voltage fluctuations have severe impacts on the EV motor performance [23]. The difference between the maximum and minimum DC bus voltage gives the peak-to-peak value of the bus voltage. DC–DC converter with optimal EMS ensures a stabilized DC bus voltage.
- (h)
- Optimum battery size (): The battery size provides a standard driving range to run a vehicle without PV irradiance for a day. The and are selected as 10 and 58, respectively, to meet the required average power demand and nominal voltage.where D is the minimum EV driving range in km and is the mass of the battery cell in kg.The battery size of HSEVs can be reduced by 26.72% compared to BEVs available in the market, as shown in Table 2. The derived battery size from Equation (1) and expressed in Equation (24) would provide the standard driving range even under adverse conditions. Additionally, the proposed vehicle can accommodate a PV panel. The output power ratings of PV are analyzed analytically in Section 3.1, considering different weather conditions.
- (i)
- Battery State of charge (): Charge levels in the battery are decided by the SOC. Improvement in energy economy is reflected in the battery SOC levels.where is the initial battery SOC and and are the battery current and capacity.
- (j)
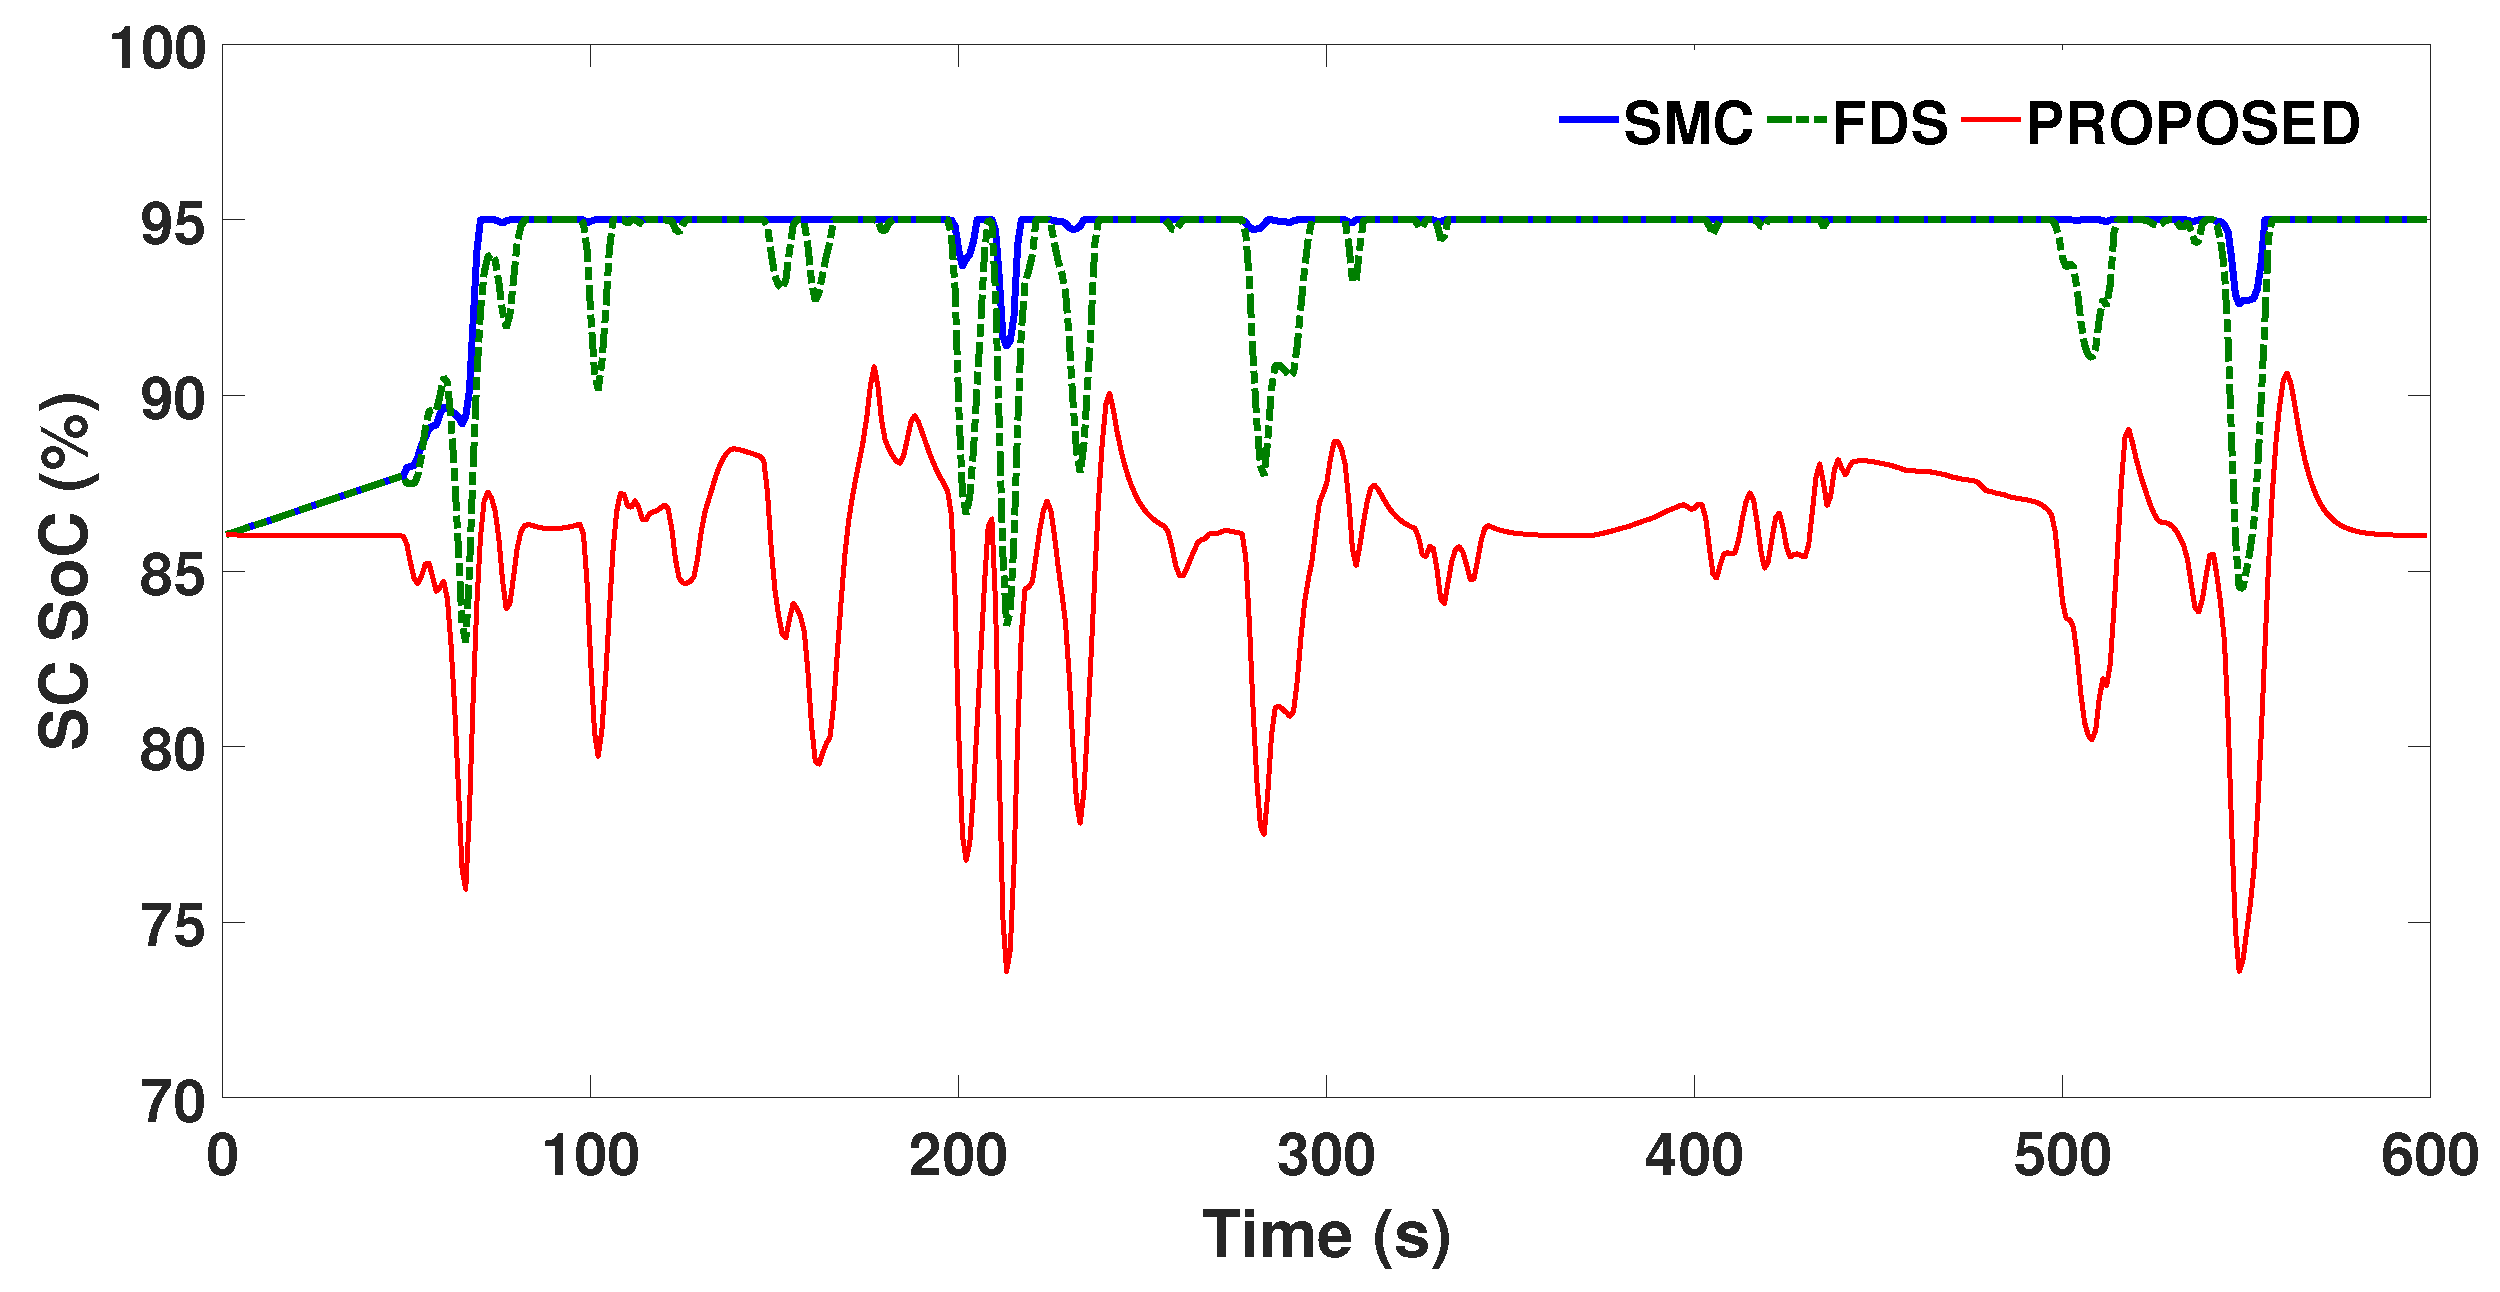
- SC State of charge (): SCs operate with higher efficiency at higher SOC. In order to achieve a better SC performance, SOC should not go below 40% and over 100%. The relationship between and voltage is shown in Equation (26) [14].where and are the working voltage and nominal voltage of the SC module, respectively.
- (k)
- PV range (PVR): As per the Indian electric 3W standard test case, the average driving range is 100 km per day [59]. PV energy per day directly impacts both the range and battery energy savings.where ECR is the energy consumption rate in Wh/km, is PV energy per day in Wh and PVR is the total PV range.
2.5. Economy Evaluation
- (a)
- (b)
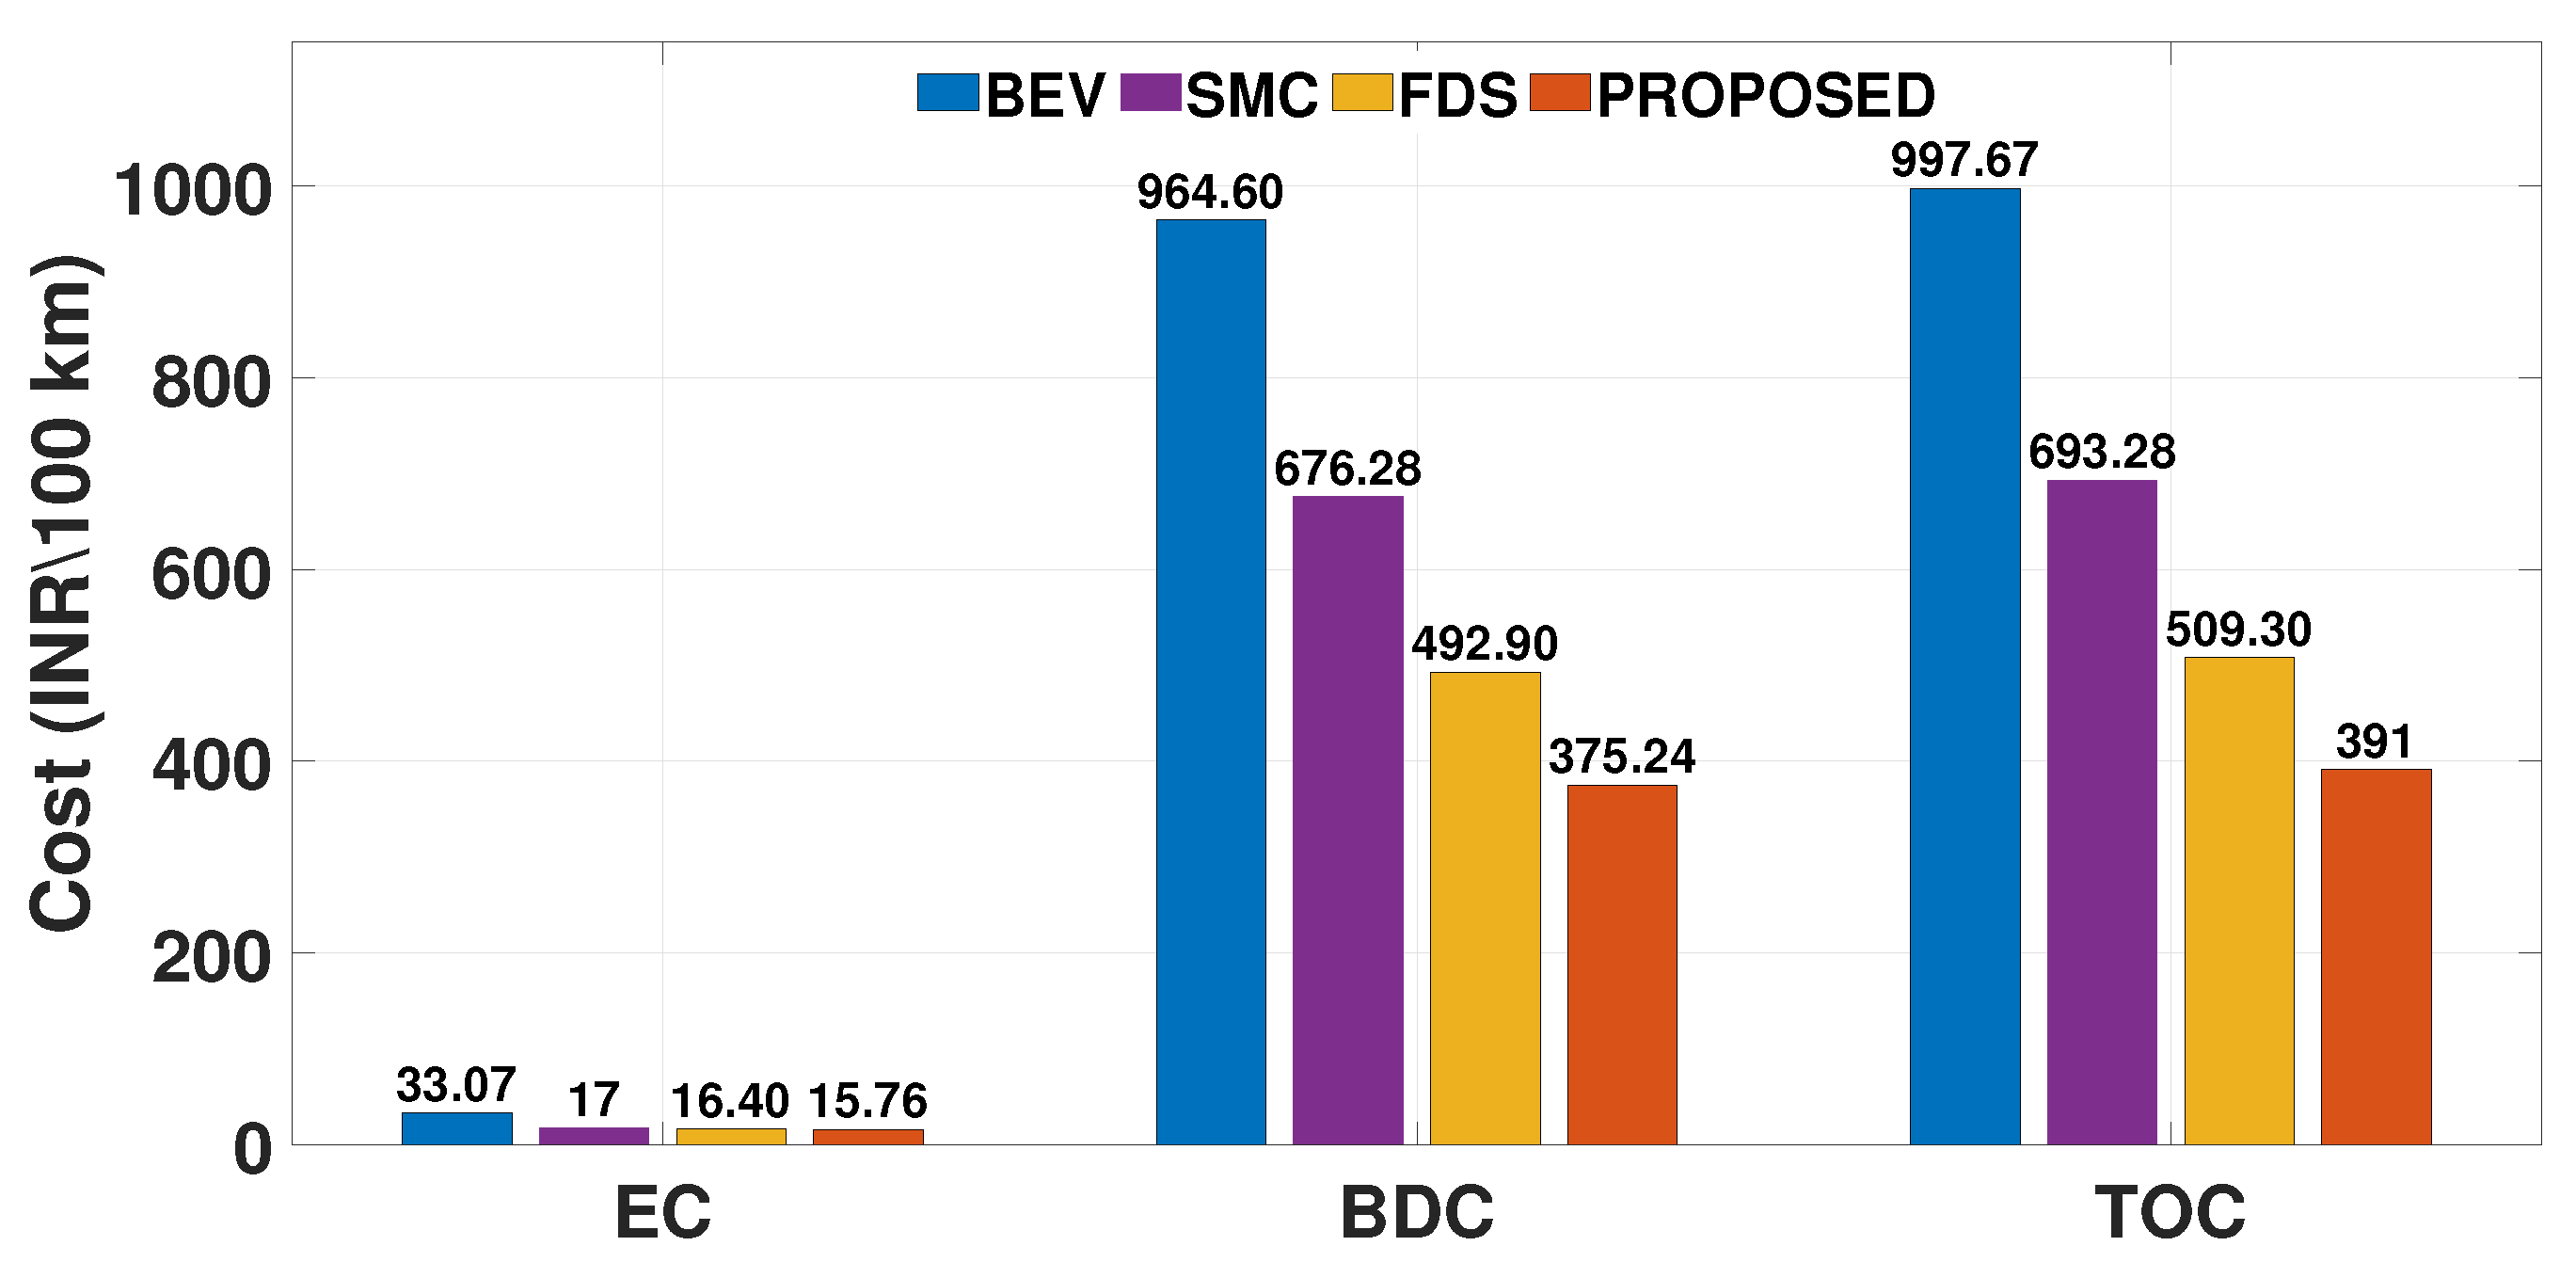
- EV Electricity cost (EC) is the cost associated with energy utilized () during the battery’s charging. EC depends on the per unit cost (kWh), the battery size (Ah), and SOC (%) as expressed below [61]:
- (c)
- EV Total operation cost (TOC) describes the cost associated with battery degradation with time and energy usage. The battery degradation cost (BDC) and electricity cost (EC) of EVs determine the total operation cost of the vehicle.where is the per-kWh battery price in India, is the average price of electricity cost per kWh, is the battery capacity, and is the battery voltage. is evaluated with Equation (19).
3. Results and Discussions of EMS
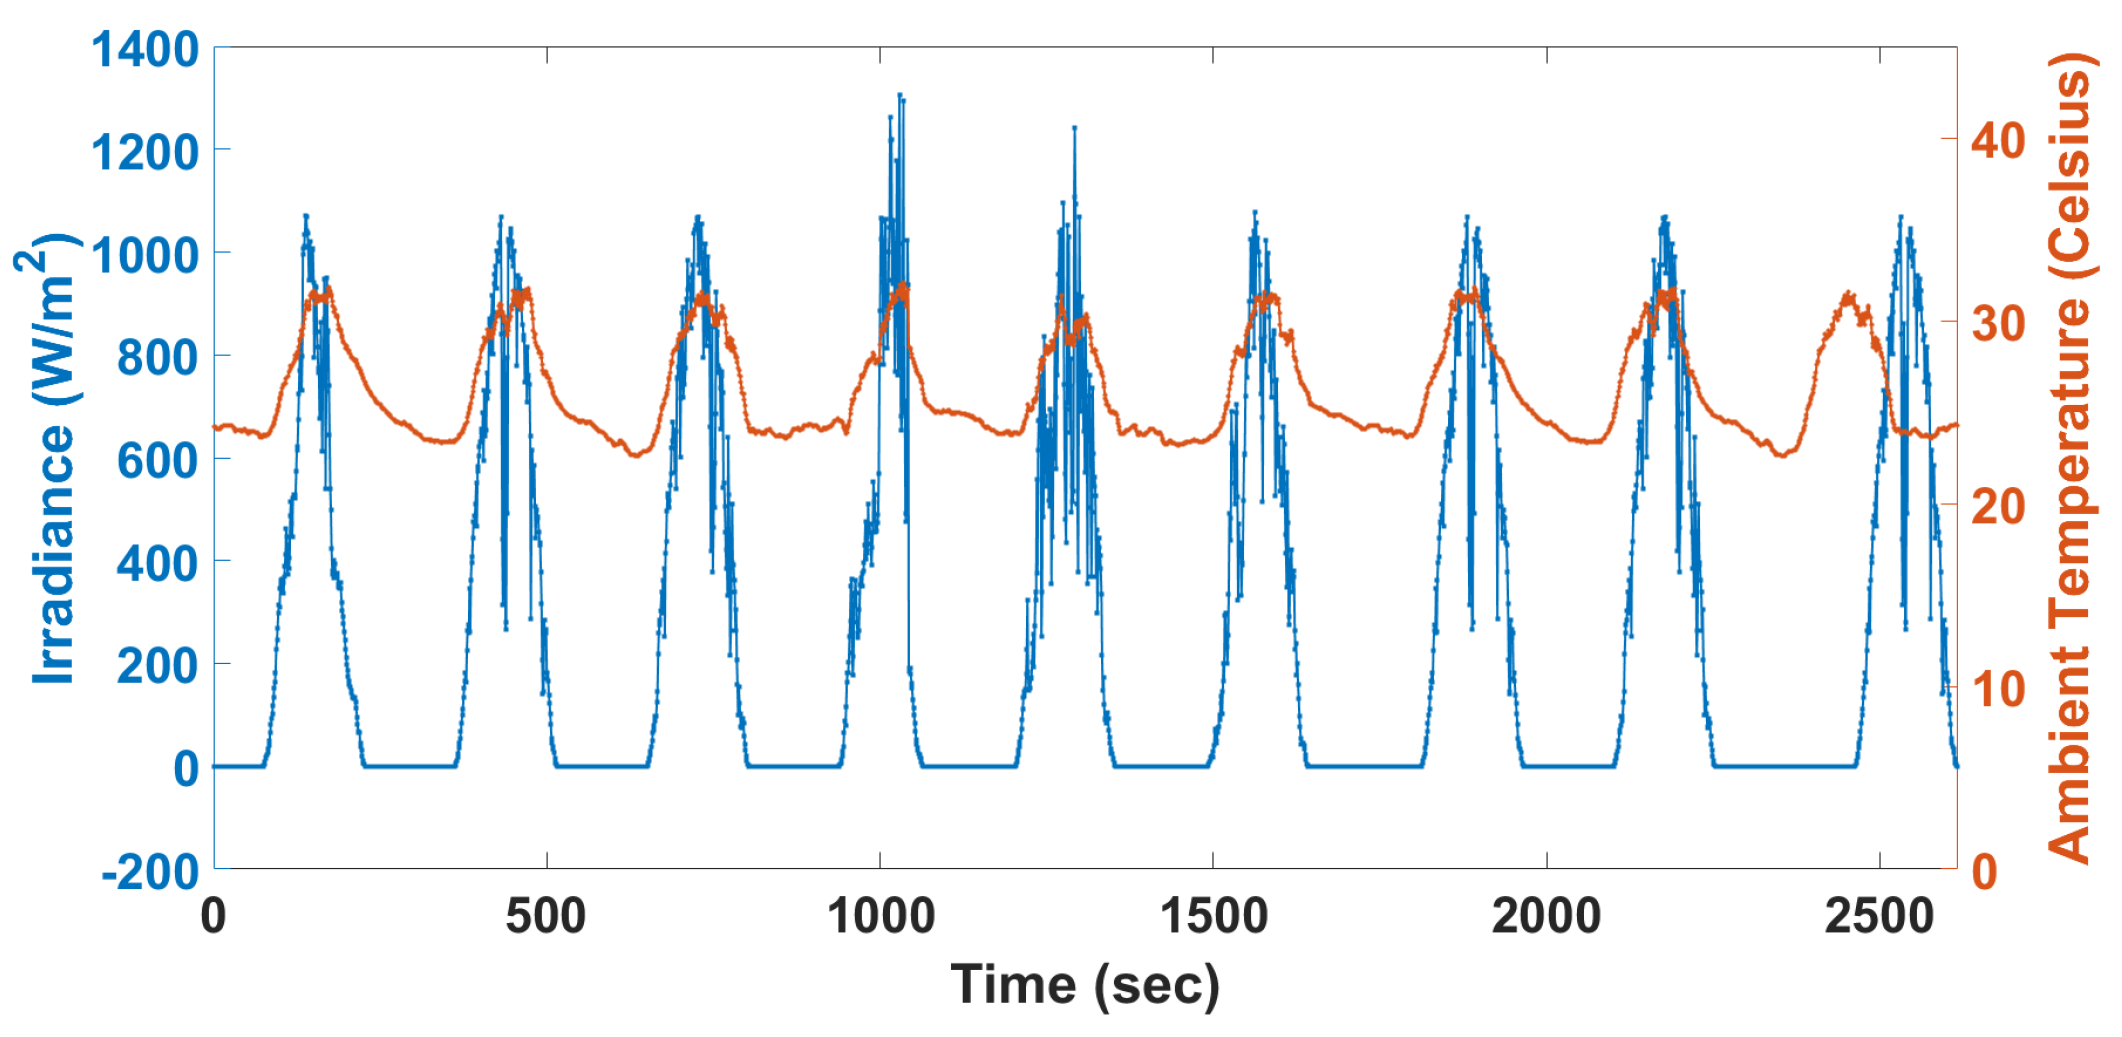
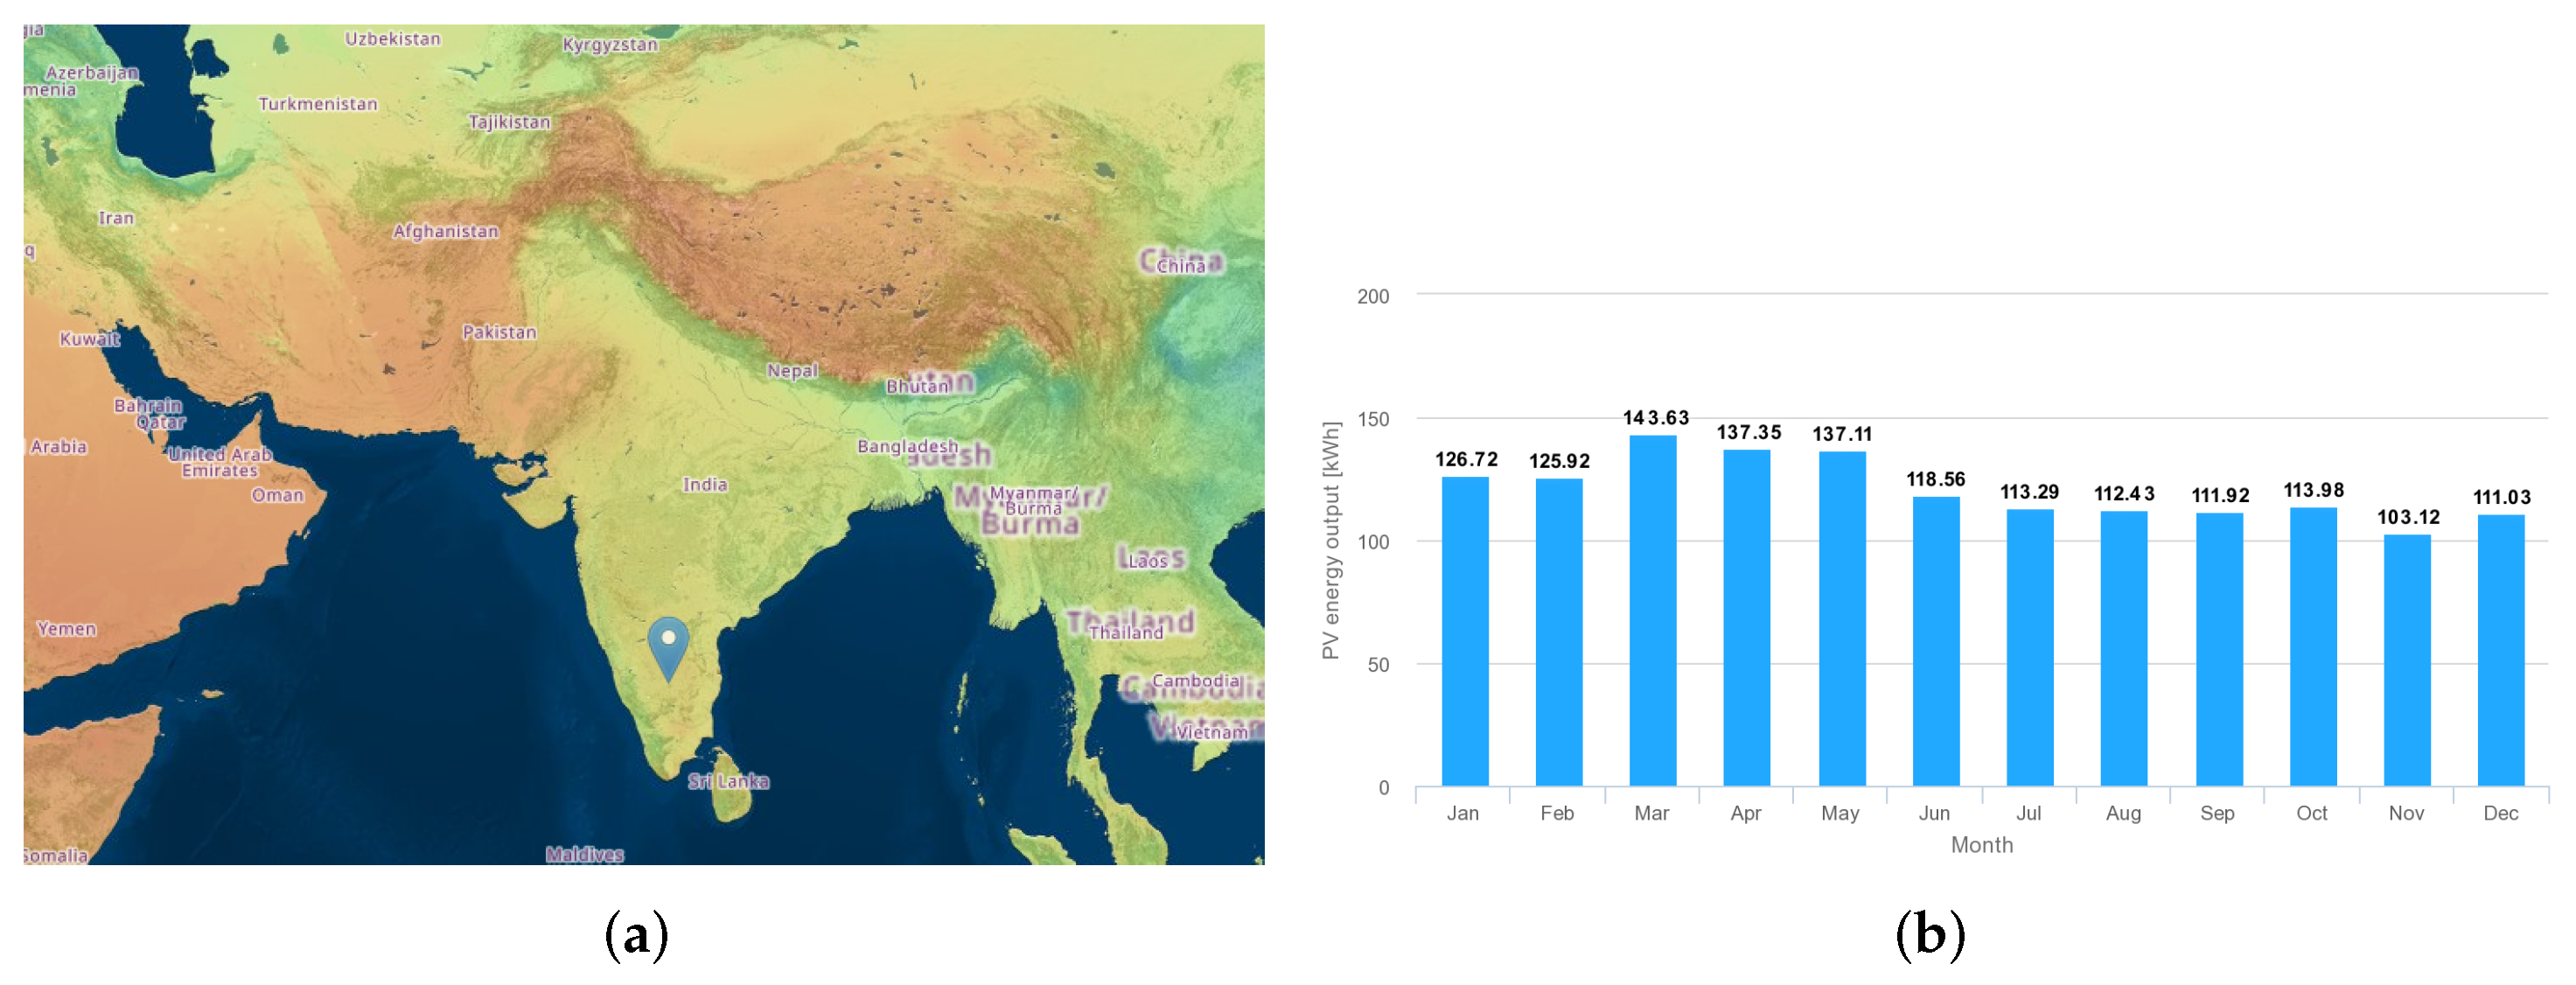
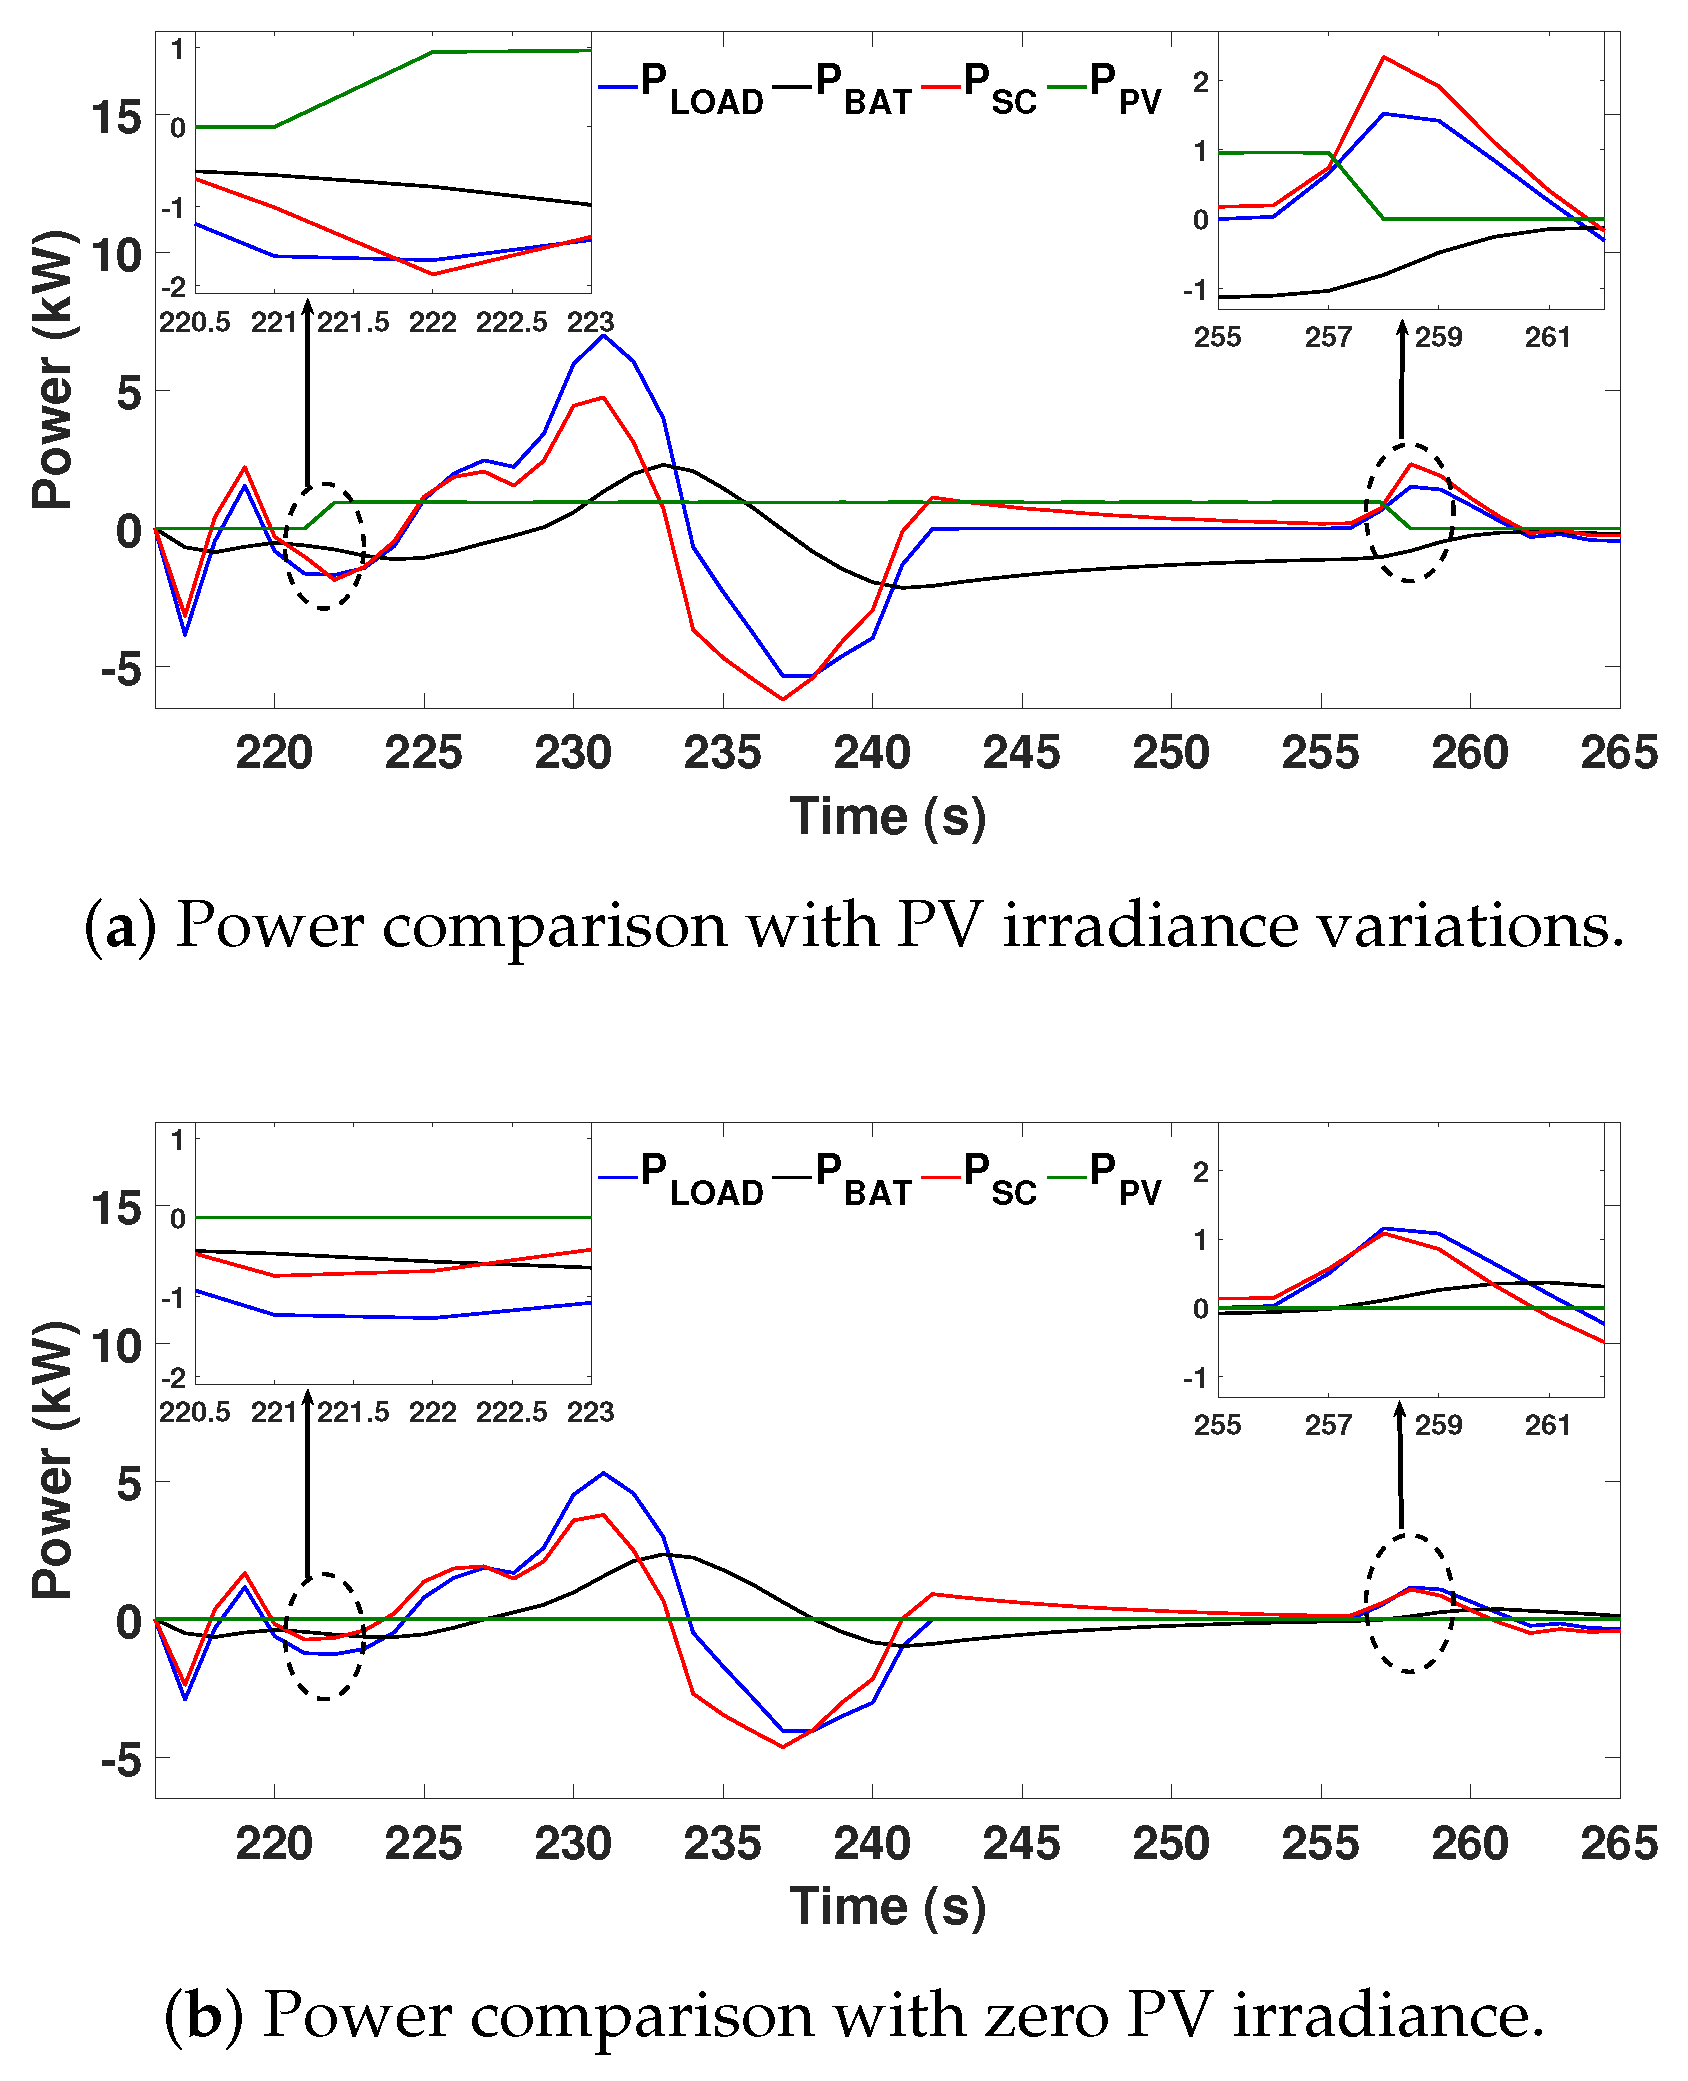
3.1. Impact of PV Power
- Case I: Where daily average PV irradiance is available for charging;
- Case II: Where half of daily average PV irradiance is available for charging;
- Case III: Where zero daily average PV irradiance is available for charging.
3.2. Techno-Economic Analysis
3.2.1. Technical Performance Comparison of EMSs
3.2.2. Economy Analysis of EMSs
4. Conclusions
- The battery’s stress reduces in IHSEMS by reducing RMS current by 46.60%, 37.88%, and 17.03% compared with BEV, SMC, and FDS methods.
- The battery peak power reduces in IHSEMS by 50.2%, 30.74%, and 3.71% compared with BEV, SMC, and FDS methods.
- Compared to BEV, the battery capacity reduces in IHSEMS by 26.72% (7.37 kWh to 5.4 kWh).
- The IHSEMS exhibits a reduction in battery peak power, RMS current, and continuous charge–discharge cycles, which improves the battery lifespan by 92.68%, 80.22%, and 32.40% compared with BEV, SMC, and FDS EMS, respectively.
- Economic analysis of IHSEMS shows a reduction of 60%, 43.9%, and 23.68% in total operation cost compared to BEV, SMC, and FDS, respectively.
Author Contributions
Funding
Data Availability Statement
Acknowledgments
Conflicts of Interest
Abbreviations
| BEV | Battery Electric vehicles |
| BMS | Battery management systems |
| DP | Dynamic programming |
| ECMS | Equivalent consumption minimization strategy |
| EV | Electric vehicle |
| EM | Energy Management |
| EMS | Energy management strategies |
| FCEV | Fuel cell electric vehicles |
| GA | Genetic algorithm |
| HSEV | Hybrid source electric vehicles |
| IHSEMS | Intelligent Hybrid Source Energy Management Strategy |
| MPC | Model predictive control |
| NDC | Nationally Determined Contribution |
| NYCC | New York city cycle |
| PSO | Particle swarm optimization |
| PV | Photovoltaic |
| RMS | Root mean square |
| STEPS | Stated Policies Scenario |
| SC | Supercapacitor |
| SDS | Sustainable Development Scenario |
| 3W | Three-wheeler |
| WLTP | Worldwide Harmonized Light Vehicles Test Procedure |
References
- International Energy Agency. Outlook for Biogas and Biomethane: Prospects for Organic Growth 2020. Available online: https://www.iea.org/reports/outlook-for-biogas-and-biomethane-prospects-for-organic-growth (accessed on 12 January 2022).
- International Energy Agency. World Energy Outlook 2021. Available online: https://www.iea.org/reports/india-energy-outlook-2021 (accessed on 18 May 2022).
- International Energy Agency. India Energy Outlook 2021. Available online: https://www.iea.org/reports/india-energy-outlook-2021/energy-in-india-today (accessed on 25 April 2022).
- Jia, L.; Ma, J.; Cheng, P.; Liu, Y. A perspective on solar energy-powered road and rail transportation in China. J. Power Energy Syst. 2021, 6, 760–771. [Google Scholar]
- International Renewable Energy Agency. Global Energy Transformation: A Roadmap to 2050 (2019 Edition). 2019. Available online: https://www.irena.org/publications/2019/Apr/Global-energytransformation-a-roadmap-to-2050 (accessed on 15 April 2021).
- Resources for the Future. (2020, May). Global Energy Outlook 2020: Energy Transition or Energy Addition? Available online: https://www.rff.org/publications/reports/global-energy-outlook-2020 (accessed on 22 May 2021).
- Goel, S.; Sharma, R.; Rathore, A.K. A review on barrier and challenges of electric vehicle in India and vehicle to grid optimisation. Transp. Eng. 2021, 4, 1–14. [Google Scholar] [CrossRef]
- The Oil and Gas Industry in Energy Transitions. Available online: https://www.iea.org/reports/the-oil-and-gas-industry-in-energy-transitions (accessed on 10 November 2021).
- Peter, R.; Gregor, K.; Timur, G.; Wolfgang, S.; Janusz, C.; Zbigniew, K.; Pallav, P.; Chris, H.; Markus, A.; Jens, B.-K.; et al. Outlook for clean air in the context of sustainable development goals. Glob. Environ. Chang. 2018, 53, 1–11. [Google Scholar]
- Agrawal, R.C.; Pandey, G.P. Solid polymer electrolytes: Materials designing and all-solid-state battery applications: An overview. J. Phys. D Appl. Phys. 2008, 41, 1–18. [Google Scholar] [CrossRef]
- Andwari, A.M.; Pesiridis, A.; Rajoo, S. A review of Battery Electric Vehicle technology and readiness levels. Renew. Sustain. Energy Rev. 2017, 78, 414–430. [Google Scholar] [CrossRef]
- Schuster, S.F.; Brand, M.J.; Berg, P.; Gleissenberger, M. Lithium-ion cell-to-cell variation during battery electric vehicle operation. J. Power Sources 2017, 297, 242–251. [Google Scholar] [CrossRef]
- Marques, P.; Garcia, R.; Kulay, L.; Freire, F. Comparative life cycle assessment of lithium-ion batteries for electric vehicles addressing capacity fade. J. Clean. Prod. 2019, 229, 787–794. [Google Scholar] [CrossRef]
- Zhang, J.; Wang, Z.; Liu, P.; Zhang, Z. Energy consumption analysis and prediction of electric vehicles based on real-world driving data. Appl. Energy 2020, 275, 1–15. [Google Scholar] [CrossRef]
- Bonfiglio, C.; Roessler, W. A cost optimized battery management system with active cell balancing for lithium ion battery stacks. IEEE Veh. Power Propuls. Conf. 2009, 275, 304–309. [Google Scholar]
- Sun, L.; Feng, K.; Chapman, C.; Zhang, N. An Adaptive Power-Split Strategy for Battery–Supercapacitor Powertrain—Design, Simulation, and Experiment. IEEE Trans. Power Electron. 2017, 32, 9364–9375. [Google Scholar] [CrossRef]
- Panaparambil, V.S.; Kashyap, Y. A review on hybrid source energy management strategies for electric vehicle. Int. J. Energy Res. 2021, 45, 19819–19850. [Google Scholar] [CrossRef]
- Xie, J.; Yang, P.; Wang, Y.; Qi, T.; Lei, Y.; Li, C.M. Puzzles and confusions in supercapacitor and battery: Theory and solutions. J. Power Sources 2018, 401, 213–223. [Google Scholar] [CrossRef]
- Snoussi, J.; Ben Elghali, S.; Benbouzid, M.; Mimouni, M. Auto-adaptive filtering-based energy management strategy for fuel cell hybrid electric vehicles. Energies 2018, 11, 2118. [Google Scholar] [CrossRef] [Green Version]
- Li, H.; Ravey, A.; N’Diaye, A.; Djerdir, A. Online adaptive equivalent consumption minimization strategy for fuel cell hybrid electric vehicle considering power sources degradation. Energy Convers Manag. 2019, 192, 133–149. [Google Scholar] [CrossRef]
- Solar Photovoltaic Power Potential by Country. Available online: https://www.worldbank.org/en/topic/energy/publication/solar-photovoltaic-power-potential-by-country (accessed on 13 January 2021).
- Kouchachvili, L.; Yaïci, W.; Entchev, E. Hybrid battery/supercapacitor energy storage system for the electric vehicles. J. Power Sources 2018, 374, 237–248. [Google Scholar] [CrossRef]
- Wen, H.; Xiao, W.; Li, H.; Wen, X. Analysis and minimisation of DC bus surge voltage for electric vehicle applications. IET Electr. Syst. Transp. 2012, 2, 68–76. [Google Scholar] [CrossRef]
- Nguyen, H.-L.T.; Nguyễn, B.-H.; Vo-Duy, T.; Trovão, J.P.F. A Comparative Study of Adaptive Filtering Strategies for Hybrid Energy Storage Systems in Electric Vehicles. Energies 2021, 14, 3373. [Google Scholar] [CrossRef]
- Vargas, U.; Lazaroiu, G.C.; Tironi, E.; Ramirez, A. Harmonic modeling and simulation of a stand-alone photovoltaic-battery-supercapacitor hybrid system. Int. J. Electr. Power Energy Syst. 2019, 105, 70–78. [Google Scholar] [CrossRef]
- Kumar, P.; Roy, S.; Karayaka, H.B.; Yan, Y.; Alqudah, Y. Investigations into best cost battery-supercapacitor hybrid energy storage system for a utility scale PV array. J. Energy Storage 2019, 22, 150–159. [Google Scholar]
- Cabrane, Z.; Kim, J.; Yoo, K.; Ouassaid, M. HESS-based photovoltaic/batteries/supercapacitors: Energy management strategy and DC bus voltage stabilization. Sol. Energy 2021, 216, 551–563. [Google Scholar] [CrossRef]
- Armenta, J.; Núñez, C.; Visairo, N.; Lázaro, I. An advanced energy management system for controlling the ultracapacitor discharge and improving the electric vehicle range. J. Power Sources 2015, 56, 452–458. [Google Scholar] [CrossRef]
- Blanes, J.M.; Gutiérrez, R.; Garrigós, A.; Lizán, J.L.; Cuadrado, J.M. Electric Vehicle Battery Life Extension Using Ultracapacitors and an FPGA Controlled Interleaved Buck–Boost Converter. IEEE Trans. Power Electron. 2013, 28, 5940–5948. [Google Scholar] [CrossRef]
- Demircali, A.; Koroglu., S. Modular energy management system with Jaya algorithm for hybrid energy storage in electric vehicles. Int. J. Energy Res. 2022, 28, 1–14. [Google Scholar] [CrossRef]
- Abeywardana, D.B.W.; Hredzak, B.; Agelidis, V.G.; Demetriades, G.D. Supercapacitor Sizing Method for Energy-Controlled Filter-Based Hybrid Energy Storage Systems. IEEE Trans. Power Electron. 2017, 32, 1626–1637. [Google Scholar] [CrossRef]
- Castaings, A.; Lhomme, W.; Trigui, R.; Bouscayrol, A. Comparison of energy management strategies of a battery/supercapacitors system for electric vehicle under real-time constraints. Appl. Energy 2016, 163, 190–200. [Google Scholar] [CrossRef]
- Florescu, A.; Bacha, S.; Munteanu, I.; Bratcu, A.I.; Rumeau, A. Adaptive frequency separation-based energy management system for electric vehicles. J. Power Sources 2015, 280, 410–421. [Google Scholar] [CrossRef]
- Zhang, F.; Wang, L.; Coskun, S.; Pang, H.; Cui, Y.; Xi, J. Energy Management Strategies for Hybrid Electric Vehicles: Review, Classification, Comparison, and Outlook. Energies 2020, 13, 3352. [Google Scholar] [CrossRef]
- Chen, Z.; Xiong, R.; Cao, J. Particle swarm optimization-based optimal power management of plug-in hybrid electric vehicles considering uncertain driving conditions. Energy 2015, 96, 197–208. [Google Scholar] [CrossRef]
- Wieczorek, M.; Lewandowski, M. A mathematical representation of an energy management strategy for hybrid energy storage system in electric vehicle and real time optimization using a genetic algorithm. Appl. Energy 2017, 192, 222–233. [Google Scholar] [CrossRef]
- Li, H.; Ravey, A.; N’Diaye, A.; Djerdir, A. Equivalent consumption minimization strategy for fuel cell hybrid electric vehicle considering fuel cell degradation. In Proceedings of the IEEE Transportation Electrification Conference and Expo (ITEC), Chicago, IL, USA, 22–24 June 2017; pp. 540–544. [Google Scholar]
- Zhou, F.; Xiao, F.; Chang, C.; Shao, Y.; Song, C. Adaptive model predictive control-based energy management for semi-active hybrid energy storage systems on electric vehicles. Energies 2017, 10, 1063. [Google Scholar] [CrossRef] [Green Version]
- Sellali, M.; Abdeddaim, S.; Betka, A.; Djerdir, A.; Drid, S.; Tiar, M. Fuzzy-Super twisting control implementation of battery/super capacitor for electric vehicles. ISA Trans. 2019, 95, 243–253. [Google Scholar] [CrossRef] [PubMed]
- Trovão, J.P.F.; Roux, M.; Ménard, É.; Dubois, M.R. Energy- and Power-Split Management of Dual Energy Storage System for a Three-Wheel Electric Vehicle. IEEE Trans. Veh. Technol. 2017, 66, 5540–5550. [Google Scholar] [CrossRef]
- Njoya Motapon, S.; Dessaint, L.A.; Al-Haddad, K. A Comparative Study of Energy Management Schemes for a Fuel-Cell Hybrid Emergency Power System of More-Electric Aircraft. IEEE Trans. Ind. Electron. 2014, 61, 1320–1334. [Google Scholar] [CrossRef]
- Cabrane, Z.; Batool, D.; Kim, J.; Yoo, K. Design and simulation studies of battery-supercapacitor hybrid energy storage system for improved performances of traction system of solar vehicle. J. Energy Storage 2020, 32, 5540–5550. [Google Scholar] [CrossRef]
- Vukajlović, N.; Milićević, D.; Dumnić, B.; Popadić, B. Comparative analysis of the supercapacitor influence on lithium battery cycle life in electric vehicle energy storage. J. Energy Storage 2020, 31, 101603. [Google Scholar] [CrossRef]
- Niu, J.; Zhuang, W.; Ye, J.; Song, Z.; Yin, G.; Zhang, Y. Optimal sizing and learning-based energy management strategy of NCR/LTO hybrid battery system for electric taxis. Energy 2022, 257, 124653. [Google Scholar] [CrossRef]
- NPTEL: 2020. Available online: https://nptel.ac.in/courses/108/103/108103009/ (accessed on 6 May 2021).
- USEP-Agency. Dynamometer Drive Schedules. 4.1. 2022. Available online: https://www.epa.gov/vehicle-and-fuel-emissions-testing/dynamometer-drive-schedule (accessed on 5 October 2022).
- Mellincovsky, M.; Kuperman, A.; Lerman, C.; Gadelovits, S.; Aharon, I.; Reichbach, N. Performance and limitations of a constant power-fed supercapacitor. IEEE Trans. Energy Convers 2014, 3, 191–200. [Google Scholar]
- Raman, S.R.; Cheng, K.-W.; Xue, X.-D.; Fong, Y.-C.; Cheung, S. Hybrid Energy Storage System with Vehicle Body Integrated Super-Capacitor and Li-Ion Battery: Model, Design and Implementation, for Distributed Energy Storage. Energies 2021, 14, 6553. [Google Scholar] [CrossRef]
- Sunrunmotors. 2022. Available online: http://www.sunrunmotors.com/ (accessed on 2 November 2022).
- Wang, C.; Liu, R.; Tang, A. Energy management strategy of hybrid energy storage system for electric vehicles based on genetic algorithm optimization and temperature effect. J. Energy Storage 2022, 51, 104314. [Google Scholar] [CrossRef]
- Erickson, R.W. Maksimovic, Controller Design. In D. Fundamentals of Power Electronics; Springer: Berlin, Germany, 2020; pp. 347–405. [Google Scholar]
- Samad, N.A.; Kim, Y.; Siegel, J.B.; Stefanopoulou, A.G. Influence of Battery Downsizing and SOC Operating Window on Battery Pack Performance in a Hybrid Electric Vehicle. In Proceedings of the IEEE Vehicle Power and Propulsion Conference (VPPC), Montreal, QC, Canada, 19–22 October 2015; pp. 1–6. [Google Scholar]
- Xiong, R.; Pan, Y.; Shen, W.; Li, H.; Sun, F. Lithium-ion battery aging mechanisms and diagnosis method for automotive applications: Recent advances and perspectives. Renew. Sustain. Energy Rev. 2020, 131, 110048. [Google Scholar] [CrossRef]
- Jangid, M.K.; Mukhopadhyay, A.; Mater, J. Real-time monitoring of stress development during electrochemical cycling of electrode materials for Li-ion batteries: Overview and perspectives. Chem. A 2019, 7, 23679–23726. [Google Scholar] [CrossRef]
- Hussain, S.; Ali, M.U.; Park, G.S.; Nengroo, S.H.; Khan, M.A.; Kim, H.J. A Real-Time Bi-Adaptive Controller-Based Energy Management System for Battery–Supercapacitor Hybrid Electric Vehicles. Energies 2019, 12, 4662. [Google Scholar] [CrossRef] [Green Version]
- Song, Z.; Li, J.; Hou, J.; Hofmann, H.; Ouyang, M.; Du, J. The battery-supercapacitor hybrid energy storage system in electric vehicle applications: A case study. Energy 2018, 154, 433–441. [Google Scholar] [CrossRef]
- BloombergNEF. Hitting the EV Inflection Point. 2021. Available online: https://www.transportenvironment.org/discover/hitting-the-ev-inflection-point/ (accessed on 2 January 2022).
- Wang, J.; Liu, P.; Hicks-Garner, J.; Sherman, E.; Soukiazian, S.; Verbrugge, M.; Tataria, H.; Musser, J.; Finamore, P. Cycle-life model for graphite-LiFePO4 cells. J. Power Sources 2011, 196, 3942–3948. [Google Scholar] [CrossRef]
- Guide to EV Adoption. Available online: https://www.wbcsd.org/Programs/Cities-and-Mobility/Transforming-Urban-Mobility/Mobility-Decarbonization/Coalitions/Resources/India-Business-Guide-to-EV-Adoption (accessed on 15 May 2020).
- Spotnitz, R. Simulation of capacity fade in lithium-ion batteries. J. Power Sources 2003, 113, 72–80. [Google Scholar] [CrossRef]
- Huang, J.; Huang, Z.; Wu, Y.; Liu, Y.; Li, H.; Jiang, F.; Peng, J. Sizing optimization research considering mass effect of hybrid energy storage system in electric vehicles. J. Energy Storage 2022, 48, 103892. [Google Scholar] [CrossRef]
- Akar, F.; Tavlasoglu, Y.; Vural, B. An Energy Management Strategy for a Concept Battery/Ultracapacitor Electric Vehicle With Improved Battery Life. IEEE Trans. Transp. Electrif. 2016, 3, 191–200. [Google Scholar] [CrossRef]
- Sagaria, S.; Duarte, G.; Neves, D.; Baptista, P. Photovoltaic integrated electric vehicles: Assessment of synergies between solar energy, vehicle types and usage patterns. J. Clean. Prod. 2022, 348, 131402. [Google Scholar] [CrossRef]
- European, Commission. Photovoltaic Geographical Information System. Available online: https://ec.europa.eu/jrc/en/pvgis (accessed on 30 January 2015).
- Brito, M.C.; Santos, T.; Moura, F.; Pera, D.; Rocha, J. Urban solar potential for vehicle integrated photovoltaics. Transp. Res. Part D Transp. Environ. 2021, 94, 102810. [Google Scholar] [CrossRef]
- Elia, A.; Kamidelivand, M.; Rogan, F.; Gallachóir, B.Ó. Impacts of innovation on renewable energy technology cost reductions. Renew. Sustain. Energy Rev. 2022, 138, 110488. [Google Scholar] [CrossRef]
- Lightyear. 2022. Available online: https://lightyear.one/ (accessed on 10 August 2022).


| Sl No | Parameters | Symbols | Values |
|---|---|---|---|
| 1 | Vehicle category | L5M auto | |
| 2 | Seating capacity | Driver + 3 seaters | |
| 3 | Kerb weight | 450 kg | |
| 4 | Gross weight (with full capacity) | M | 800 kg |
| 5 | Gradability | 10° | |
| 6 | Average velocity | V | 40 km/h |
| 7 | Frontal area | 2 m2 | |
| 8 | Rolling coefficient | 0.01 | |
| 9 | Drag coefficient | 0.5 | |
| 10 | Air density | 1.225 kg/m3 | |
| 11 | Roof area | 5 m2 | |
| 12 | Acceleration due to gravity | g | 9.81 m/s2 |
| 13 | Efficiency of hybrid system (%) | 95 | |
| 14 | Transmission efficiency (%) | 90 | |
| 15 | Motor drive efficiency (%) | 85 |
| Sl No | Components | Parameters | Values | Values |
|---|---|---|---|---|
| 1 | Lithium-ion battery | Cell type | 3.2 V, 2.6 Ah, LFP cell | |
| 2 | Battery capacity | 5.4 kWh | ||
| 3 | Rated voltage | 36 V | ||
| 4 | Specific energy | 151 Wh/kg | ||
| 5 | Supercapacitor | Module ratings | 32 V, 250 F | |
| 6 | Maximum current | 1900 A | ||
| 7 | Specific energy | 3.65 Wh/kg | ||
| 8 | Solar PV | PV array power | 965.6 W | |
| 9 | Voltage at maximum power | 34 V | ||
| 10 | Current at maximum power | 28.4 A | ||
| 11 | Total panel area | 4.8 m2 |
| Sl no | Parameters | Case-I | Case-II | Case-III |
|---|---|---|---|---|
| 1 | Daily energy demand (Wh) | 3445 | 3445 | 3445 |
| 2 | Monthly energy demand (Wh) | 124,020 | 124,020 | 124,020 |
| 3 | Monthly PV energy generation (Wh) | 63,600 | 31,800 | 0 |
| 4 | Monthly battery energy consumption (Wh) | 60,420 | 92,220 | 124,020 |
| 5 | Daily 3W EV drive distance(km) | 100 | 100 | 100 |
| 6 | Daily PV range (km) | 60 | 30 | 0 |
| Sl no | Parameters | BEV | SMC | FDS | IHSEMS |
|---|---|---|---|---|---|
| 1 | Battery Peak Power (kW) | 10.93 | 7.96 | 5.64 | 5.44 |
| 2 | Battery capacity (kWh) | 7.37 | 5.4 | 5.4 | 5.4 |
| 3 | Battery di/dt (A/s) | 113 | 98 | 61 | 26.8 |
| 4 | Battery RMS current (A) | 64 | 54.95 | 41.14 | 34.13 |
| 5 | Battery Capacity Loss | 4.20 × 10 | 3.92 × 10 | 2.88 × 10 | 2.18 × 10 |
| 6 | Battery Life Span Improvement (%) | - | 6.91% | 45.50% | 92.68% |
| 7 | DC bus voltage fluctuations (%) | 13.19% | 10.40% | 5.20% | 2.05% |
| 8 | Total Operational Cost (INR.) | 18.54 | 12.942 | 9.50 | 7.25 |
Disclaimer/Publisher’s Note: The statements, opinions and data contained in all publications are solely those of the individual author(s) and contributor(s) and not of MDPI and/or the editor(s). MDPI and/or the editor(s) disclaim responsibility for any injury to people or property resulting from any ideas, methods, instructions or products referred to in the content. |
© 2023 by the authors. Licensee MDPI, Basel, Switzerland. This article is an open access article distributed under the terms and conditions of the Creative Commons Attribution (CC BY) license (https://creativecommons.org/licenses/by/4.0/).
Share and Cite
Sidharthan, V.P.; Kashyap, Y.; Kosmopoulos, P. Adaptive-Energy-Sharing-Based Energy Management Strategy of Hybrid Sources in Electric Vehicles. Energies 2023, 16, 1214. https://doi.org/10.3390/en16031214
Sidharthan VP, Kashyap Y, Kosmopoulos P. Adaptive-Energy-Sharing-Based Energy Management Strategy of Hybrid Sources in Electric Vehicles. Energies. 2023; 16(3):1214. https://doi.org/10.3390/en16031214
Chicago/Turabian StyleSidharthan, Vishnu P., Yashwant Kashyap, and Panagiotis Kosmopoulos. 2023. "Adaptive-Energy-Sharing-Based Energy Management Strategy of Hybrid Sources in Electric Vehicles" Energies 16, no. 3: 1214. https://doi.org/10.3390/en16031214