1. Introduction
Heat exchangers (HEs) comprise devices that exchange heat among two or more different fluids. The heat transfer between the fluid is solely based on temperature difference, without the aid of an external energy source. Optimizing the exchanged energy transfer of HE comes from the priority of the researcher for maximizing energy saving and reducing capital costs for better heat exchangers efficiency. They are classified according to their geometries such as plate, extended surface, and tubular. Corrugated plate heat exchangers (C-PHEs) are commonly used in various applications such as automotive, chemical and metal industries, heating and heat recovery, power generation, and food processes. Many research articles concentrate on improving thermal-hydraulic performance using various techniques such as geometry retrofit, inserting nanofluid, and injecting air bubbles.
Khan et al. [
1] experimentally investigated the pressure losses for two symmetrical chevron angles of 30°/30°, 60°/60° and non-symmetrical angle of 30°/60° of a PHE. They noticed that the plate of the non-symmetrical chevron angle enhanced the performance more than the other two symmetrical angles did. The maximum pressure losses of 50, 42, and 40 kPa were observed for chevron angles of 60°/60°, 30°/30°, and 30°/60° respectively. Faizal and Ahmed [
2] conducted their experimental study on a C-PHE of 20 plates with a total heat transfer area of 1.163 m
2 and three varying spaces between the plates ranging from 6 to 12 mm to evaluate the best HTR optimally. Their experimental tests were performed with a parallel fluid flow configuration. They concluded that the corrugations on the plates augment turbulence at higher flow rates, which results in improving the HTR. Hence, the optimum HTR was achieved at a minimum plate spacing of 6 mm. Al Zahrani et al. [
3] experimentally and numerically performed tests on C-PHE to evaluate the HTR characteristics. Their results showed that the Nusselt number (
) increases as Reynolds numbers (
) increase and vice versa with the friction coefficient. Another experimental investigation conducted by Attalla and Maghrabie [
4] studied the impacts of plate roughness on the performance of a C-PHE has 16 plates. Their findings revealed that the C-PHE effectiveness decreases from 48% to 28% as the mass flow rate increases from 0.08 kg/s to 0.8 kg/s, respectively, for smooth plates. Moreover, the pressure loss (
) and pumping power were increased with increasing the
. In addition, they noticed that the rough plate surface enhanced the effectiveness (
) by 11.5% compared to the smooth plates. YANG et al. [
5] experimentally demonstrated the effect of flow direction on the thermal performance of Refrigerant R-410A in PHE. The authors found that the evaporation heat transfer coefficient is greater within a parallel-flow configuration than in a counterflow arrangement, while the parallel-flow configuration has a lower overall heat transfer
performance than the counterflow arrangement. Zhi-Jian et al. [
6] presented their experimental and numerical studies about a novel PHE design using unclean working fluid. Their results showed that the new design enhanced the heat transfer rate by 25% compared to the Chevron type. Hence, the new design prevents flow blockage from happening during the use of unclean fluid. Elbarghthi et al. [
7] numerically investigated the performance of a PHE using R744 and HFOs as working fluids which use at critical low temperatures. Their work was simulated by MATLAB integrated with the NIST standard database. The authors reported that the evaluated parameters of PHE have an insignificant difference in the number of plates greater than 40 plates. Moreover, the convection coefficient was enhanced by 50% for R1233zd(E) and resulting in increasing the pressure of the hot stream from 10 MPa to 12 MPa.
Numerous studies are exploring the impacts of using various nanofluids at different concentrations in HEs, especially for C-PHEs. Ajeeb et al. [
8] used an experimental method to investigate the performance of a PHE using Al
2O
3 nanoparticles with low concentrations ranging from 0.01% to 0.2% with 0.05 fixed increasing vol.% concentration step. Moreover, the nanoparticles’ performance was tested and compared to utilize the ethylene glycol with 15% and 30% concentrations. The reported results showed that HTR was enhanced with increased nanoparticle concentration that reached 27% at 0.2 vol% for distilled water-based Al
2O
3 nanofluid followed by an increase in
by 8%. In addition, the heat transfer enhancement decreased as the ethylene glycol concentration increased based on Al
2O
3 nanofluid. Çuhadaroğlu and Hacisalihoğlu [
9] experimentally evaluated the thermal-hydraulic performance of a PHE using H
2O/CuO nanofluids with a four-volume fraction. The authors reported that the PHE effectiveness reached a maximum value of 96% at a volume fraction of 0.8 for H
2O/CuO nanofluids. Furthermore, the lowest thermal efficiency and high pumping power occur at a high-volume fraction of 1.1 which also decreases the PHE effectiveness. The theoretical study presented by Ham et al. [
10] examines the effect of various nanofluids based on lithium bromide solution as a working fluid on the thermal performance of a PHE. Their results indicated that nanoparticles have a generally significant impact in improving the thermal performance of the PHE for all utilized nanofluids in this study, especially Al
2O
3 nanoparticle has a great effect than TiO
2, Fe
2O
3, CuO, and CNT at the same volume concentrations. Bhattad et al. [
11] theoretically studied the energetic-exergetic performance of C-PHE having 10 plates utilizing hybrid nanoparticles. Their results showed that HTR was enhanced by 1.44% for hybrid propylene glycol.
On the other hand, PHEs are often utilized for two-phase flow engineering applications such as evaporation or absorption. The ABI technique is used for most types of HEs as a performance enhancement method. Hence, it received great attention, as there is no need to redesign, reinstall, or retrofit the system. Marouf et al. [
12] experimentally investigated the impacts of ABI on the HWS on the performance of C-PHE. Their study arranged with parallel flow direction with seven discharge hot water streams ranging from 280 L/h to 880 L/h and a constant amount of cold water of 290 L/h. Furthermore, the air was injected with four volumetric flow rates ranging between 150 and 840 L/h. The author found that ABI has a great effect on enhancing the NTU ratio by 12.4% and the
by 14.6%. Zarei et al. [
13] experimentally evaluate the helical-coil-heat-exchanger performance utilizing the vapor compression refrigeration cycle on one side and the other side injected air bubbles into the working fluid. Four different tube configurations of ABI were tested with airflow rates ranging from 180 to 660 L/h. It was noticed that the optimum airflow rate was 540 L/h and the coefficient of performance for the refrigeration cycle improved by 124%. Furthermore, the
was enhanced by 452% for the case of ABI compared with the original case (without ABI). Marzouk et al. [
14] conducted their experimental study to study the effects of injected air bubbles on the thermo-hydraulic performance of a shell-and-tube-heat exchanger. In their study, the shell fluid volume flow rate was kept constant at 1080 L/h and the tube side volume ranged between 840 and 960 L/h. Furthermore, the air was injected into the tube side with three different amounts ranging from 60 to 180 L/h and two configurations. Their results showed that the performance parameters were enhanced from 1% to 23% for injected air bubbles inside the inserted tube. Asano et al. [
15] visualized a two-phase flow using thermal neutron radiography for a PHE. They observed that the entrance ports of PHE have bad effects on the flow behavior of the mixed two-phase. Furthermore, more research is required to improve the design of the inlet ports. Another three experimental studies were carried out by Buscher [
16,
17,
18] to visualize and simulate the flow pattern of two-phase flow in C-PHE. In this work [
16] and related references, edge detection was used to separate large bubble clusters and texture analysis identified the local film and bubbly flow. This method was appropriate for locally inhomogeneous two-phase flow that is difficult to visualize. According to his investigation [
18], the centrifugal force has a great effect on the flow direction of two-phase flow which circumvents the channel corrugations concerning the buoyancy force. Hence, He observed that the effects of flow direction on two-phase flow in both cases of a dominant centrifugal and dominant buoyancy were small to negligible and significant on the mean diameter, respectively [
17]. Lee et al. [
19] conducted their experimental work to evaluate the pressure losses of inlet and outlet ports for single-phase and two-phase R1234ze(E) flows inside PHE. They noted that the gravity and flow direction notably influences the port pressure loss due to the non-uniformity of flow distribution of two-phase flow.
However, the ABI technique proves its superiority as an effective method for heat transfer enhancement in several types of HEs, there is only a recent experimental study has been conducted for investigating the combined energetic-exergetic performance of a PHE. Furthermore, there are no attempts to compare ABI on both sides of water streams (HWS and CWS) with different fluid directions, i.e., counter and parallel flows. However, the recent investigation that focuses on studying the energetic and exergetic performance of C-PHE presented by Marouf et al. [
12] deals with ABI into the HWS with a parallel flow arrangement. Moreover, few research papers focus on the mechanisms of heat transfer due to ABI in PHE using visualization and simulation techniques without addressing the impacts on the energetic-exergetic performance of PHE [
15,
16,
17,
18,
19].
Efforts were taken in this study to investigate the impacts of ABI on both sides of water streams, i.e., CWS and HWS on the combined energetic-exergetic performance of C-PHE with a counterflow configuration. Moreover, compare the obtained results with the recently studied work [
12] for the same C-PHE in the same operating conditions with a parallel fluid flow configuration. Hence, optimize the energy and exergy effectiveness using optimization techniques in order to identify the optimal operating conditions while injecting ABI.
2. Experimental Setup
The experimental setup of this study presented in
Figure 1 is fully addressed in this section.
Figure 2 shows the three main components of the experimental test rig as follows: hot-water-bench (HWB), cold-water-bench (CWB), and C-PHE.
The HWB is providing the C-PHE with the desired amount of hot water by heating the cold water to the desired temperature. This process required a temperature controller to regulate the two electric heaters’ temperature, which had a heating capacity of 6 kW. A hot cubic storage tank with 1.0 m length, 1.16 m width, and 0.75 m height. In addition, used to supply the C-PHE with hot water and keep the heated water at the desired temperature. In addition, the circulation pump used to pump the hot water to C-PHE has a nominal volumetric flow rate of 2.4 m3/h, the main cabinet for switching the power, feed, and returned pipelines, temperature transducer is used for measuring the temperature of heated water inside the tank, main valves, and ABB rotameter model (D10A11/115767) used for measuring the amount of hot water into C-PHE that has = 1060 L/h, = 1.4 MPa, and = 368 K.
The CWB is the device responsible for cooling the heated water brought from C-PHE to the desired low temperature throughout the refrigerant circuit having a 3 kW cooling capacity, a circulating cold water pump with 500 L/h flow rate, the main cabinet, a feed water piping system, and returned piping system, thermocouples, cold water storage tank provides circulated pump with the desired amount of cold water of 1.1 m length, 0.75 m width, and 1.37 m height. A variable area rotameter GEMÜ model (805-R20-D7R-2214) is used for measuring the cold-water flowrates that have = 675 L/h, and = 1.5 MPa.
A (C-PHE) with the following technical specifications tabulated in
Table 1 has −10-corrugated plates with −5-cold-water channels and −4-hot-water channels. It was manufactured by Tranter and fabricated from 1.4401 stainless steel.
An air compressor utilizes to inject air into the mixing chamber that was manufactured by the BOYU model (ACQ-003) with a maximum flow rate of 3000 L/h. In addition, the air pressure transducer, control valves, and YF-S201 hall effect air sensor were used for measuring the airflow rate connected to Arduino Uno and calibrated by measuring the output signal using a stethoscope.
Experimental Procedure
Water was heated to the desired temperature of 50 °C by the means of an HWB that has two heaters connected to a thermistor for temperature control purposes. In addition, a temperature inductor to visualize the heated water temperature inside the storage tank. A circulating pump was used to pump the hot water to the mixing chamber and then to the C-PHE.
Air was injected into the mixing chamber via an air compressor, valve regulators were used for controlling the amount of airflow rate, which was measured using YF-S201 with ±3% accuracy. Moreover, the schematic diagram for the mixing chamber illustrated in
Figure 3 has three ports used depending on whether air bubbles were injected in a side of the two tested water sides (CWS or HWS) cold/hot water inlet, air inlet, and cold/hot water exit. A small air inlet tube of 6.5 mm has −30-tiny holes equally distributed, a pressure transducer, and a digital airflow rate sensor.
The chiller refrigerating cycle cools down the heated water coming from C-PHE to the desired low temperature using the CWB. The circulating pump is pumped cold water to the mixing chamber through supplied pipelines to the C-PHE. Hence, there are two thermocouples used for measuring the feed and return water temperature for each bench water. The variable area flow meter (rotamer) is used to measure the volumetric flow rate of cold water with a maximum error of ±0.5%.
The C-PHE contains a differential pressure transducer with a maximum operating pressure of 100 kPa and two digital flow meters for inlet hot and cold-water type Endress + Hauser model (PROMAG-10H15) with a calibrated maximum error of ±2.5 L/h to double-check the obtained volumetric flow rate.
3. Data Analysis
In this section, brief data analyses are presented for this investigation based on the first and second laws of thermodynamics. The combination of the first and second laws of thermodynamics includes the entropy generation rate (
)and exergy destruction rate (
) which are widespread in recent decades and are essential for evaluating the performance of a C-PHE [
20].
The dimensionless Reynolds number (
) for C-PHE channels is the ratio of inertia forces to the viscous shear force that can be computed as follows:
where
where,
is the hydraulic diameter and b is the corrugation depth that can be obtained from Equation (2) [
21] and
is the number of (cold/hot) channels.
We started by investigating the overall heat transfer coefficient (
) as follows:
where
The involved Equations (7) and (8) are used for calculating the temperature difference across the C-PHE inlet and outlet ports for parallel and counter flow directions, respectively.
The
is the second important parameter used for summarizing the combination of
A,
U, and,
which can be obtained from Equation (9) as follows:
The equation that describes the effectiveness (
) of C-PHE is the third important parameter and is defined as the ratio of the actual HTR to the maximum heat transfer rate, illustrated in Equation (11):
where,
The heat transfer process between hot and cold streams results in some heat losses which prevent the process to return to its initial state. The heat losses during the operation of HEs are divided into three types such as exchanged heat loss, fluid friction loss, and surrounding losses [
22]. The entropy generation
implies the irreversibility rate in the processes that are divided into two terms, namely, thermal and friction entropy generation, which are illustrated below in Equation (13). The fluid friction terms in the equation for hot and cold streams may be neglected as a result of values fluctuation as two-phase has fluid streams as air bubbles were injected into water [
23]; also, their value is very small compared to the thermal entropy generation with a value not exceeding 0.3% [
24]. Furthermore, authors are disregarded during their work analysis [
25]. The dimensionless augmentation entropy generation number (
) is the most frequently utilize criterion, while the EGM criterion has been used to model and optimize HEs design and can be calculated from Equation (14) [
20,
26].
The entropy generation number (
) is a dimensionless number which is the ratio of entropy generation rate to the minimum heat capacity and can be calculated as:
Exergy destruction rate (
) is defined as the maximum useful energy that a system can undergo in a given environment. The rate of exergy destruction can be calculated as:
Witte-Shamsundar efficiency (
), is an important principle for evaluating the combined energetic and exergetic performance of HEs [
27,
28]
The exergy effectiveness (
) was introduced by Bruges and Reistad [
24,
29], which is used to quantify the HEs irreversibility in terms of exergy gained by the cold water and the exergy offered by the hot water.
Uncertainty Analysis
The uncertainties analysis was performed for the tested parameters to estimate the error in the obtained results during the measuring process by different measurement devices while conducting the tests using Kline and McClintock method [
30] as follows and tabulated in
Table 2.
Effectiveness uncertainty (
) can be estimated from Equation (19) and derived from Formulas (20) and (21).
Overall heat transfer coefficient uncertainty
can be obtained from Equation (22) and derived from (23) to (25).
NTU uncertainty (
) can be calculated as follows:
where,
4. Results and Discussion
This section discusses the obtained results from the experimental tests and compared them with the previously published article authored by Marouf et al. [
12]. Air was injected in four amounts (
) of 150 L/h, 350 L/h, 630 L/h, and 840 L/h into CWS and HWS and seven (
) varies from 280 to 880 L/h with an increasing flow step of 100 L/h, which corresponds to the channel Reynolds number (
) of 391, 530, 670, 809, 949, 1088, and 1227. Moreover, a fixed hot temperature and cold-water flow rate of 50 °C and 290 L/h, respectively, that has a corresponding
of 224, respectively. Marouf et al. [
12] studied the aforementioned tested parameters for parallel flow configuration with ABI into HWS without comparing their results for the case of ABI into CWS. The following terminology is used to facilitate calling the performed experimental test cases:
Case 0: Original case (without ABI)
= 150c: ABI-CWS with 150 L/h
= 150h: ABI-HWS with 150 L/h
= 350c: ABI-CWS with 350 L/h
= 350h: ABI-HWS with 350 L/h
= 630c: ABI-CWS with 630 L/h
= 630h: ABI-HWS with 630 L/h
= 840c: ABI-CWS with 840 L/h
= 840h: ABI-HWS with 840 L/h
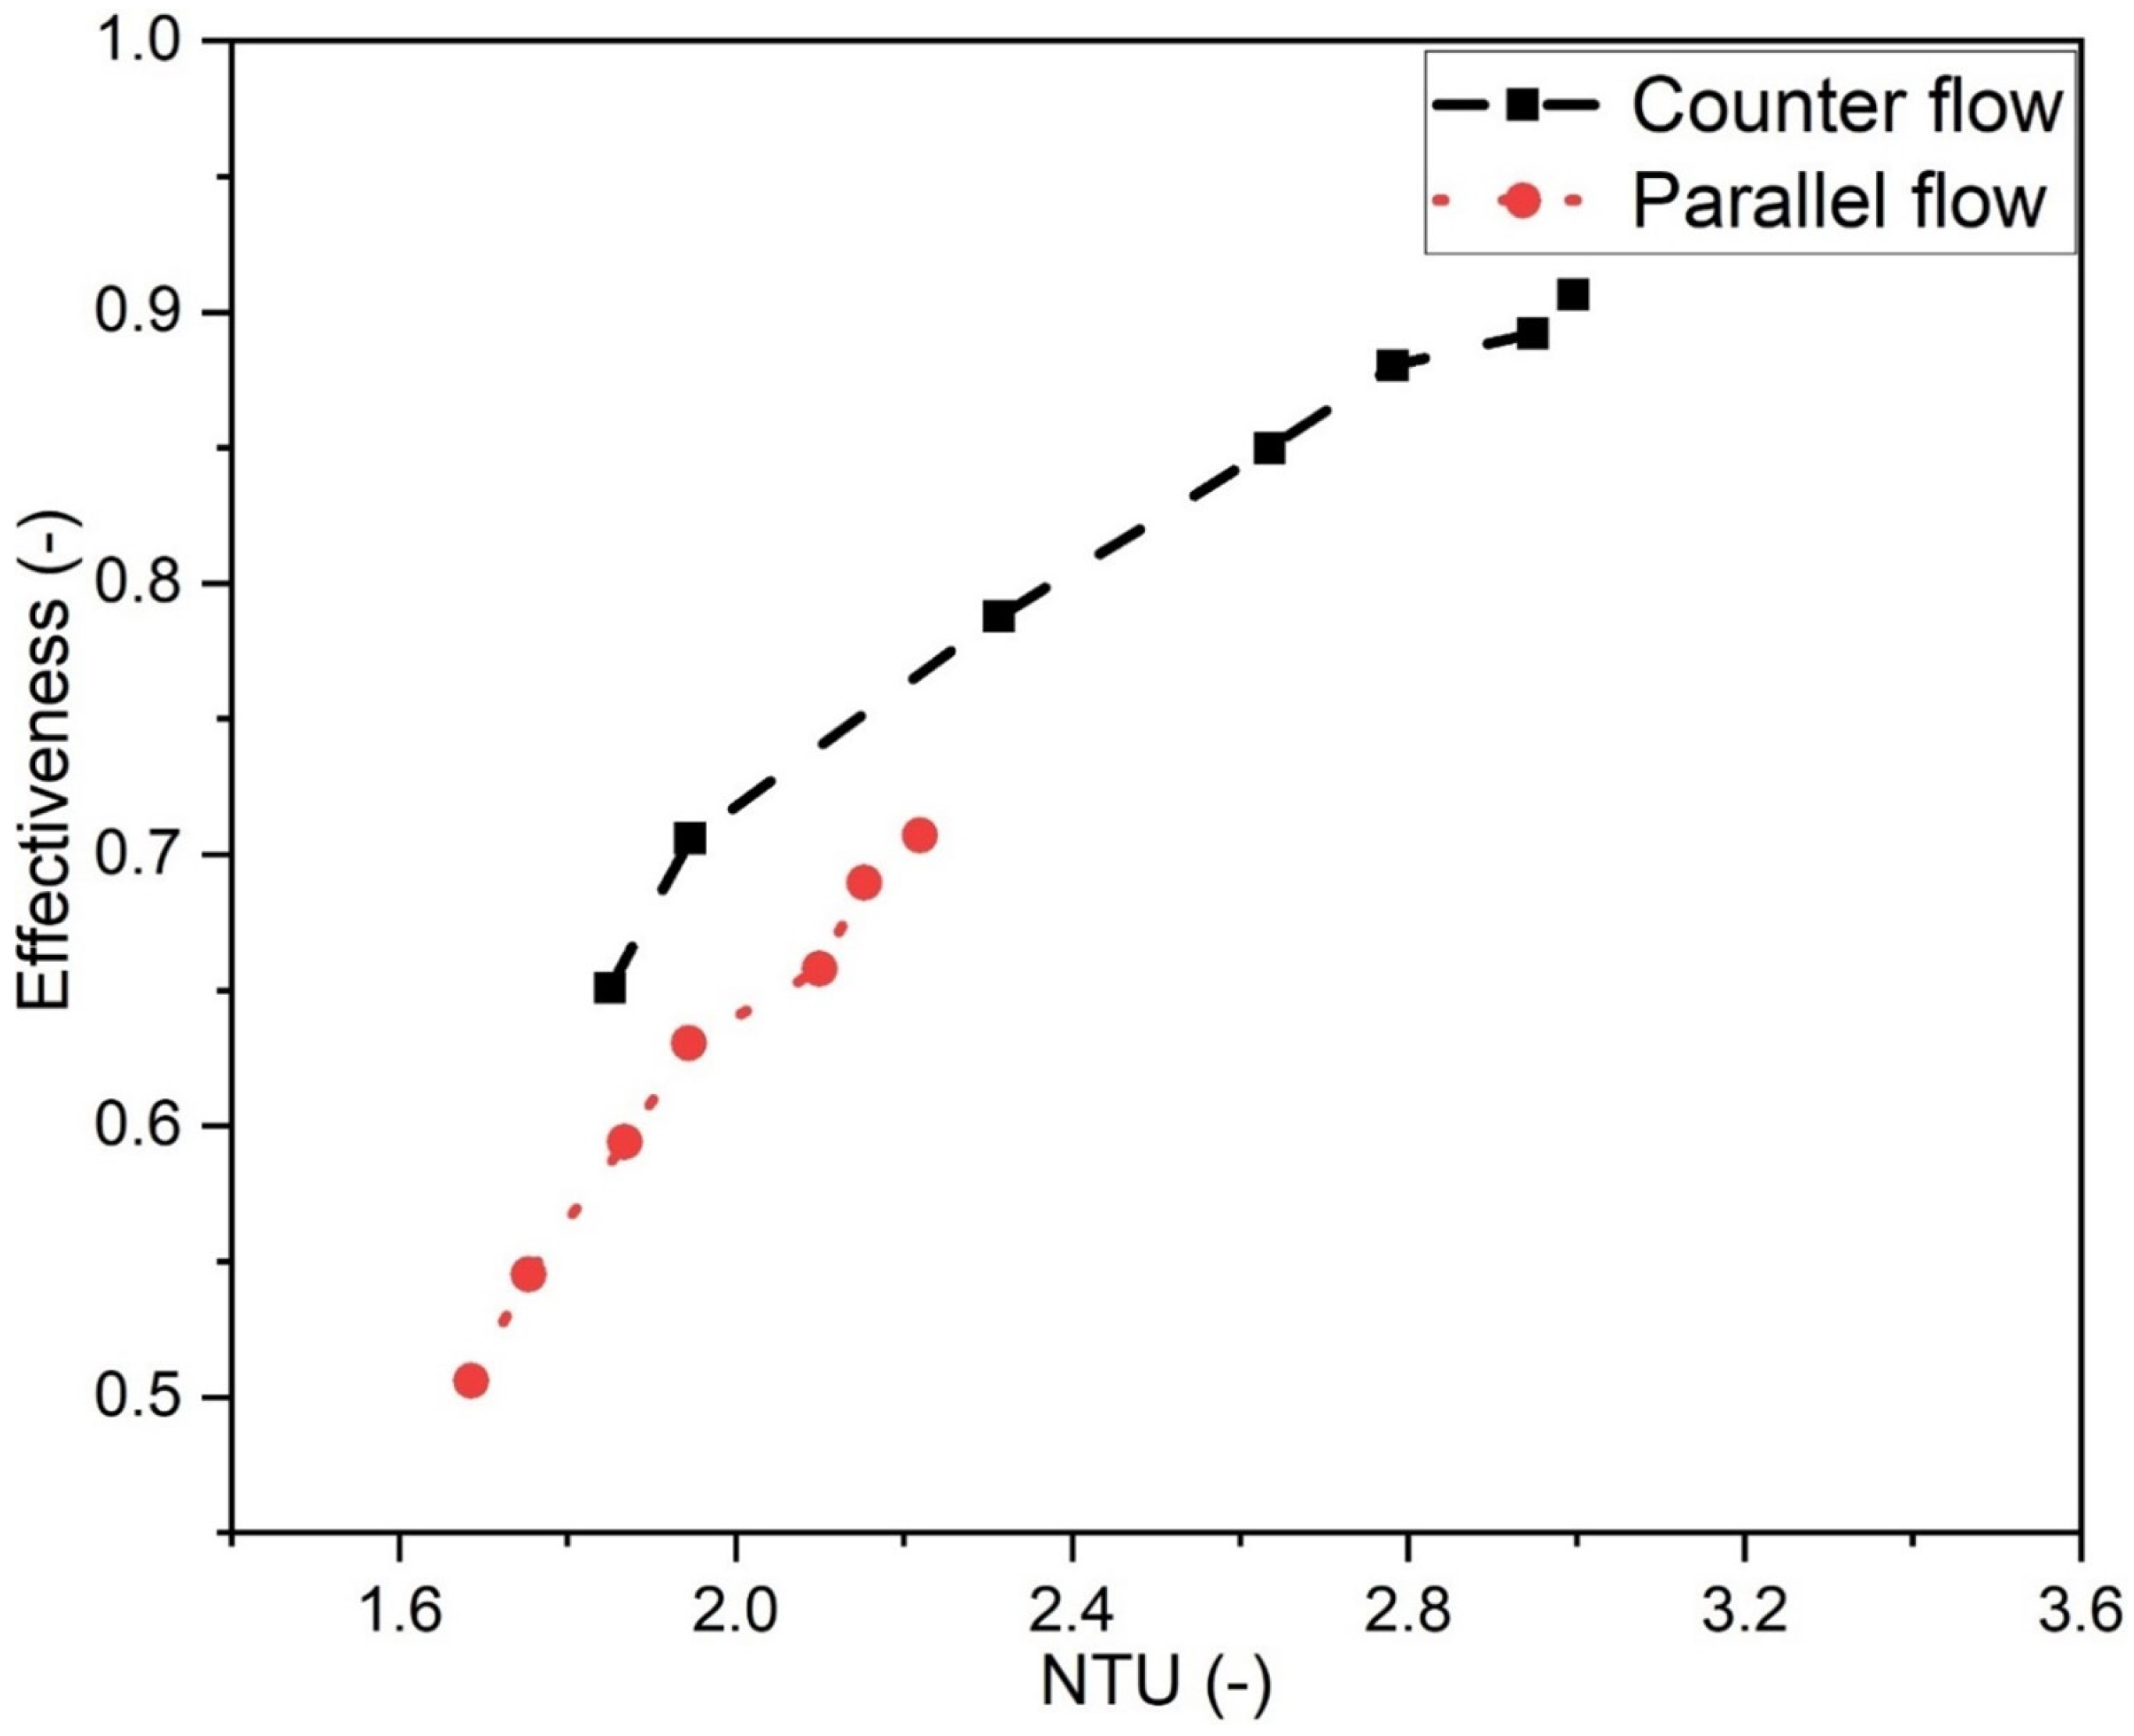
The NTU and effectiveness (ε) were increased significantly with the counter-flow direction with maximum values of 2.996 and 0.906, respectively, compared with parallel flow arrangements that have maximum values of 2.219 and 0.707, respectively, for the original case (without ABI) as illustrated in
Figure 4. This indicates that the counter-flow configuration generally has a great thermal performance as the hot and cold water moves in opposite directions. More exchanged energy is transferred, which increases the cold water exit temperature rather than in the parallel flow configuration. However, the low thermal performance in the parallel flow direction, many engineering applications required used flow configuration in the C-PHE. Furthermore, the pressure drop (ΔP) across hot water of C-PHE was investigated for both flow directions as depicted in
Figure 5. The obtained results showed that the hot water in the counter-flow direction has a maximum ΔP of 19 kPa at
= 880 L/h and ΔP = 14.2 kPa at the same flow rate, for parallel flow direction. This indicates that the fluid flow within the counter-flow direction has bad hydraulic performance over the parallel fluid flow direction for the original case.
4.1. Energetic Performance Analysis
In this section, the authors discuss the energetic performance of a C-PHE that includes the analysis of effectiveness, , NTU, and NTU Ratio at different operating conditions.
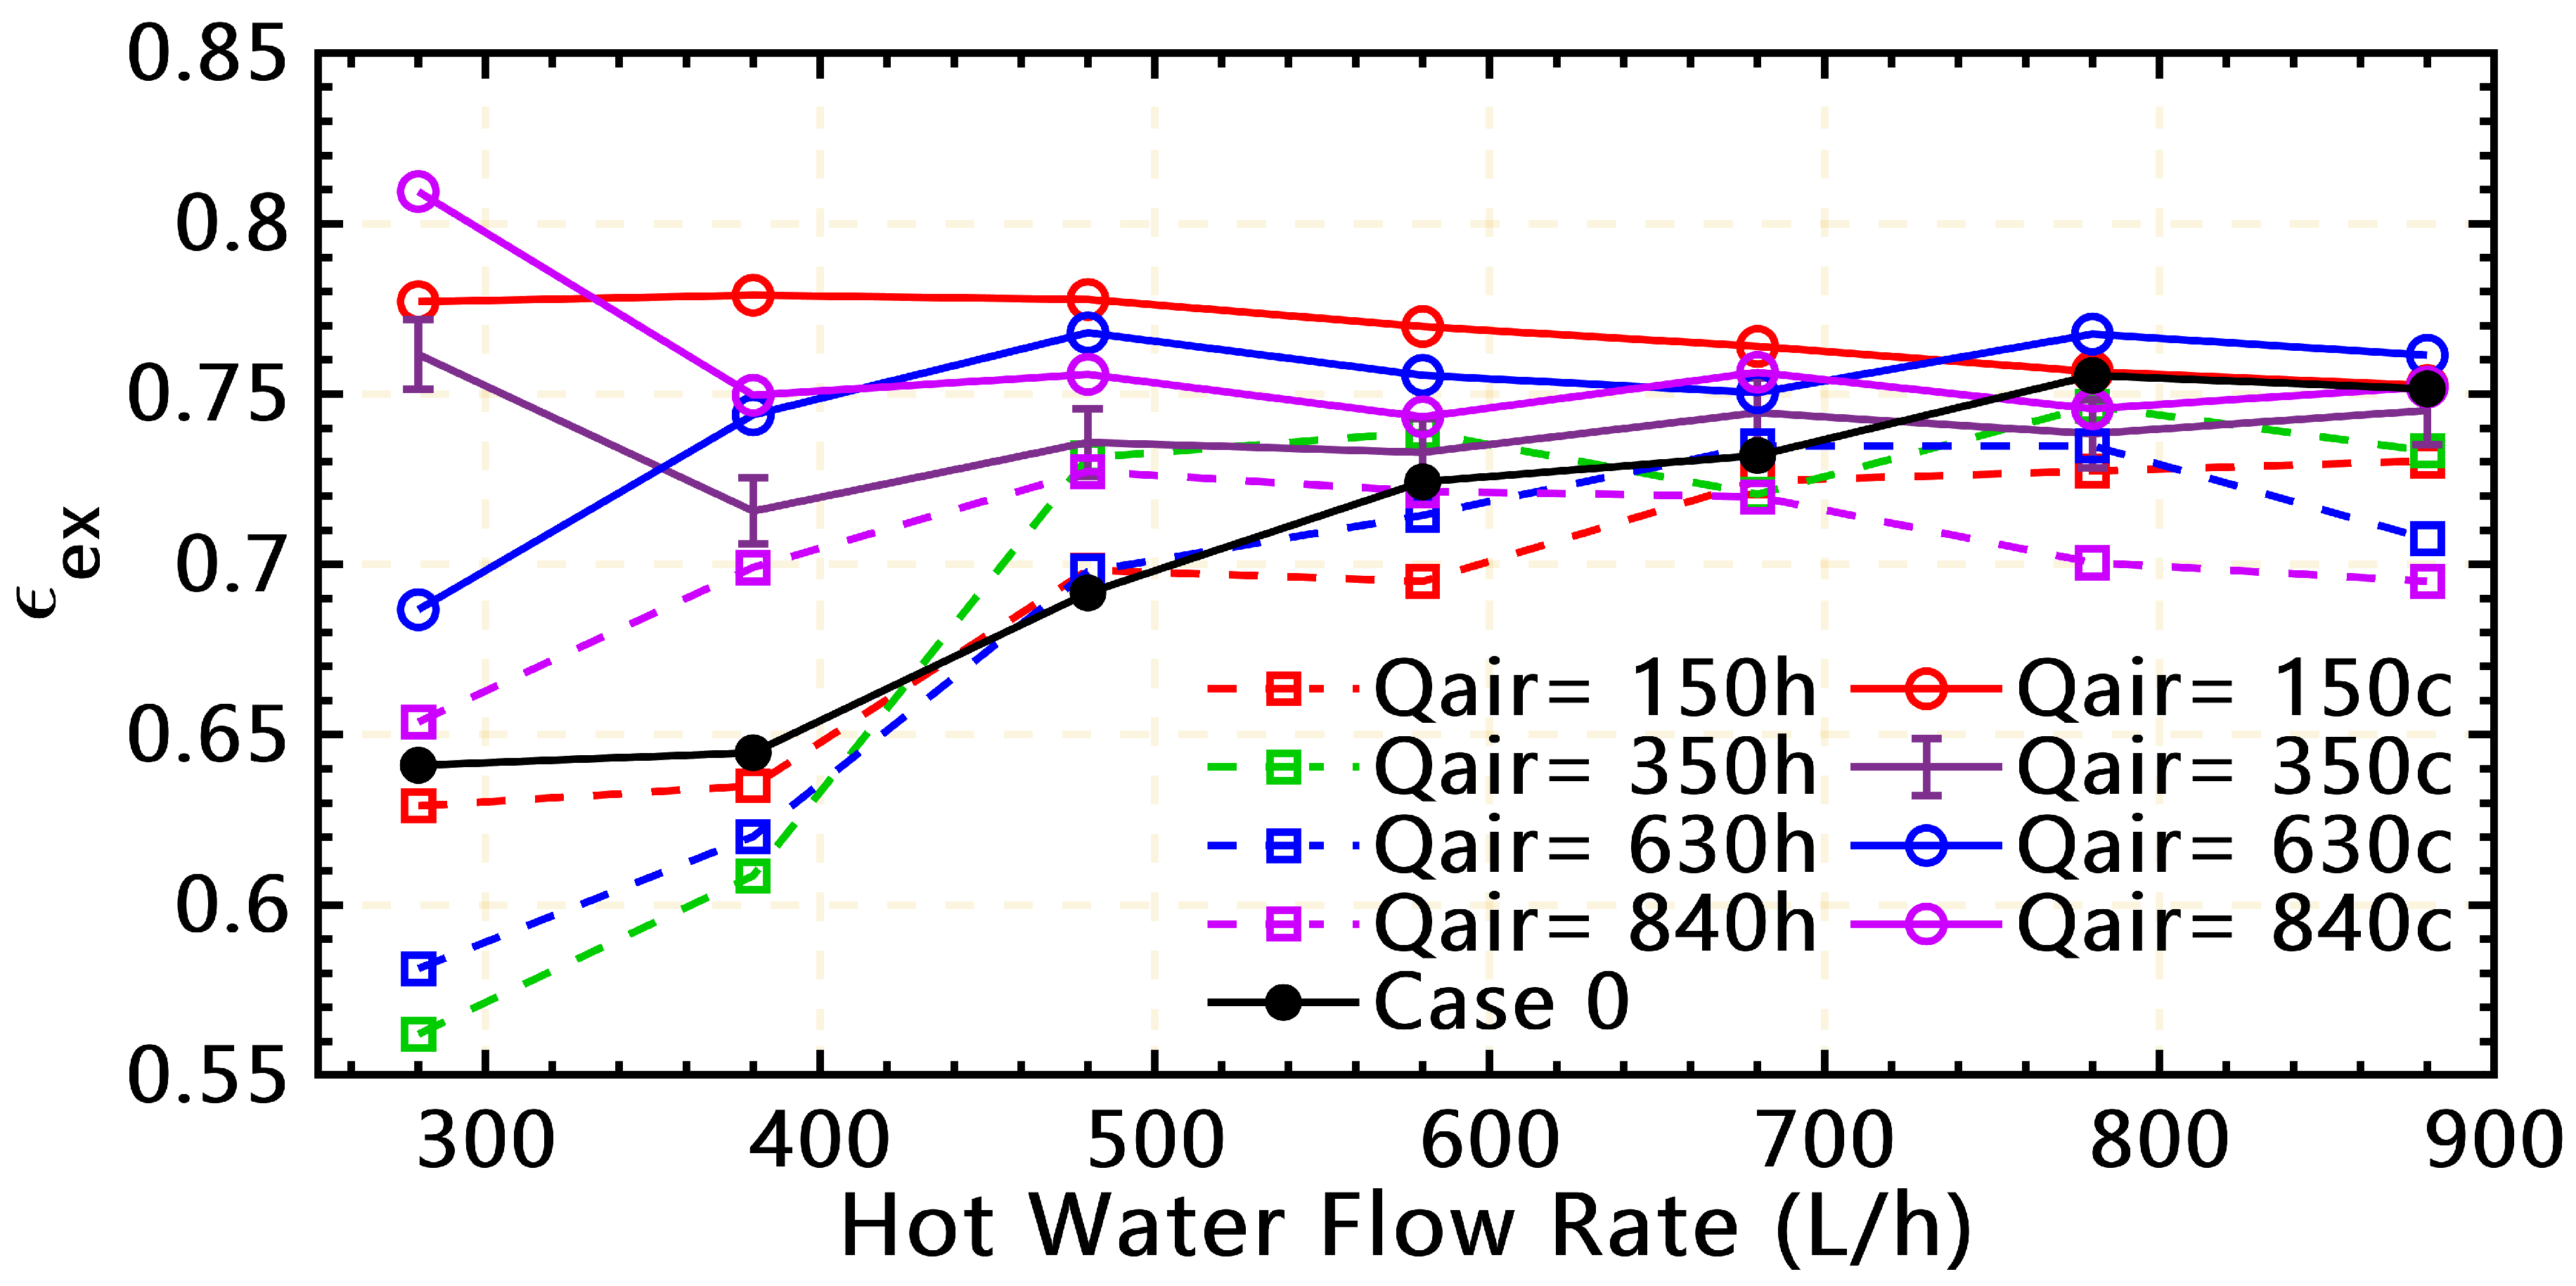
4.1.1. Effectiveness and Effectiveness Ratio Analysis
Numerous experimental tests were carried out to evaluate the thermal performance of C-PHE for ABI on both HWS and CWS. The demonstrated results shown in
Figure 6a indicate that
increases from 0.651 to 0.906 at
ranging from 280 L/h to 880 L/h for the original case (Case 0). Injected air bubbles into a CWS have superior effects on the
that reached 0.989 for
= 150 c at
= 880 L/h compared to a maximum value of
of 0.957 for
= 630 h at
= 880 L/h with counter flow arrangement. The curves 630 h and 840 h intersect at high flow rates because air injecting air bubbles with high flow rates inside C-PHE increases the turbulence intensity and the mixing thermal boundary layer of fluid which results in augmented HTR. Comparing the obtained results of ABI into the HWS to the previous work [
12] under the same operating conditions, the authors noticed that the maximum
= 0.792 occurs at
= 630 L/h and
= 880 L/h within the inflow direction. This indicates that the ABI has great thermal effects within the counter-flow rather than the parallel flow arrangement, especially in the CWS.
Effectiveness ratio (
) is the newly investigated parameter that represents the ratio of
of the single phase to the
of the two-phase flow and can be calculated as illustrated in Equation (30).
The
was enhanced with a maximum value of 1.186 at
= 840 L/h and
= 880 L/h and 1.133 at
= 630 L/h and
= 280 L/h, for ABI into CWS and HWS, respectively, as shown in
Figure 6b. Furthermore, the
for ABI in both cases have the same trend with great thermal enhancement. In addition, comparing these results with the previously studied
reached a maximum value of 1.146 at
= 350 L/h and
= 280 L/h within parallel flow configuration which is greater than the present study value. Although the value of
was greater in the previous work, the enhancement was greater at the other operating conditions with the counter flow direction. These enhancements in
result in an increase in HTR significantly at different ABI.
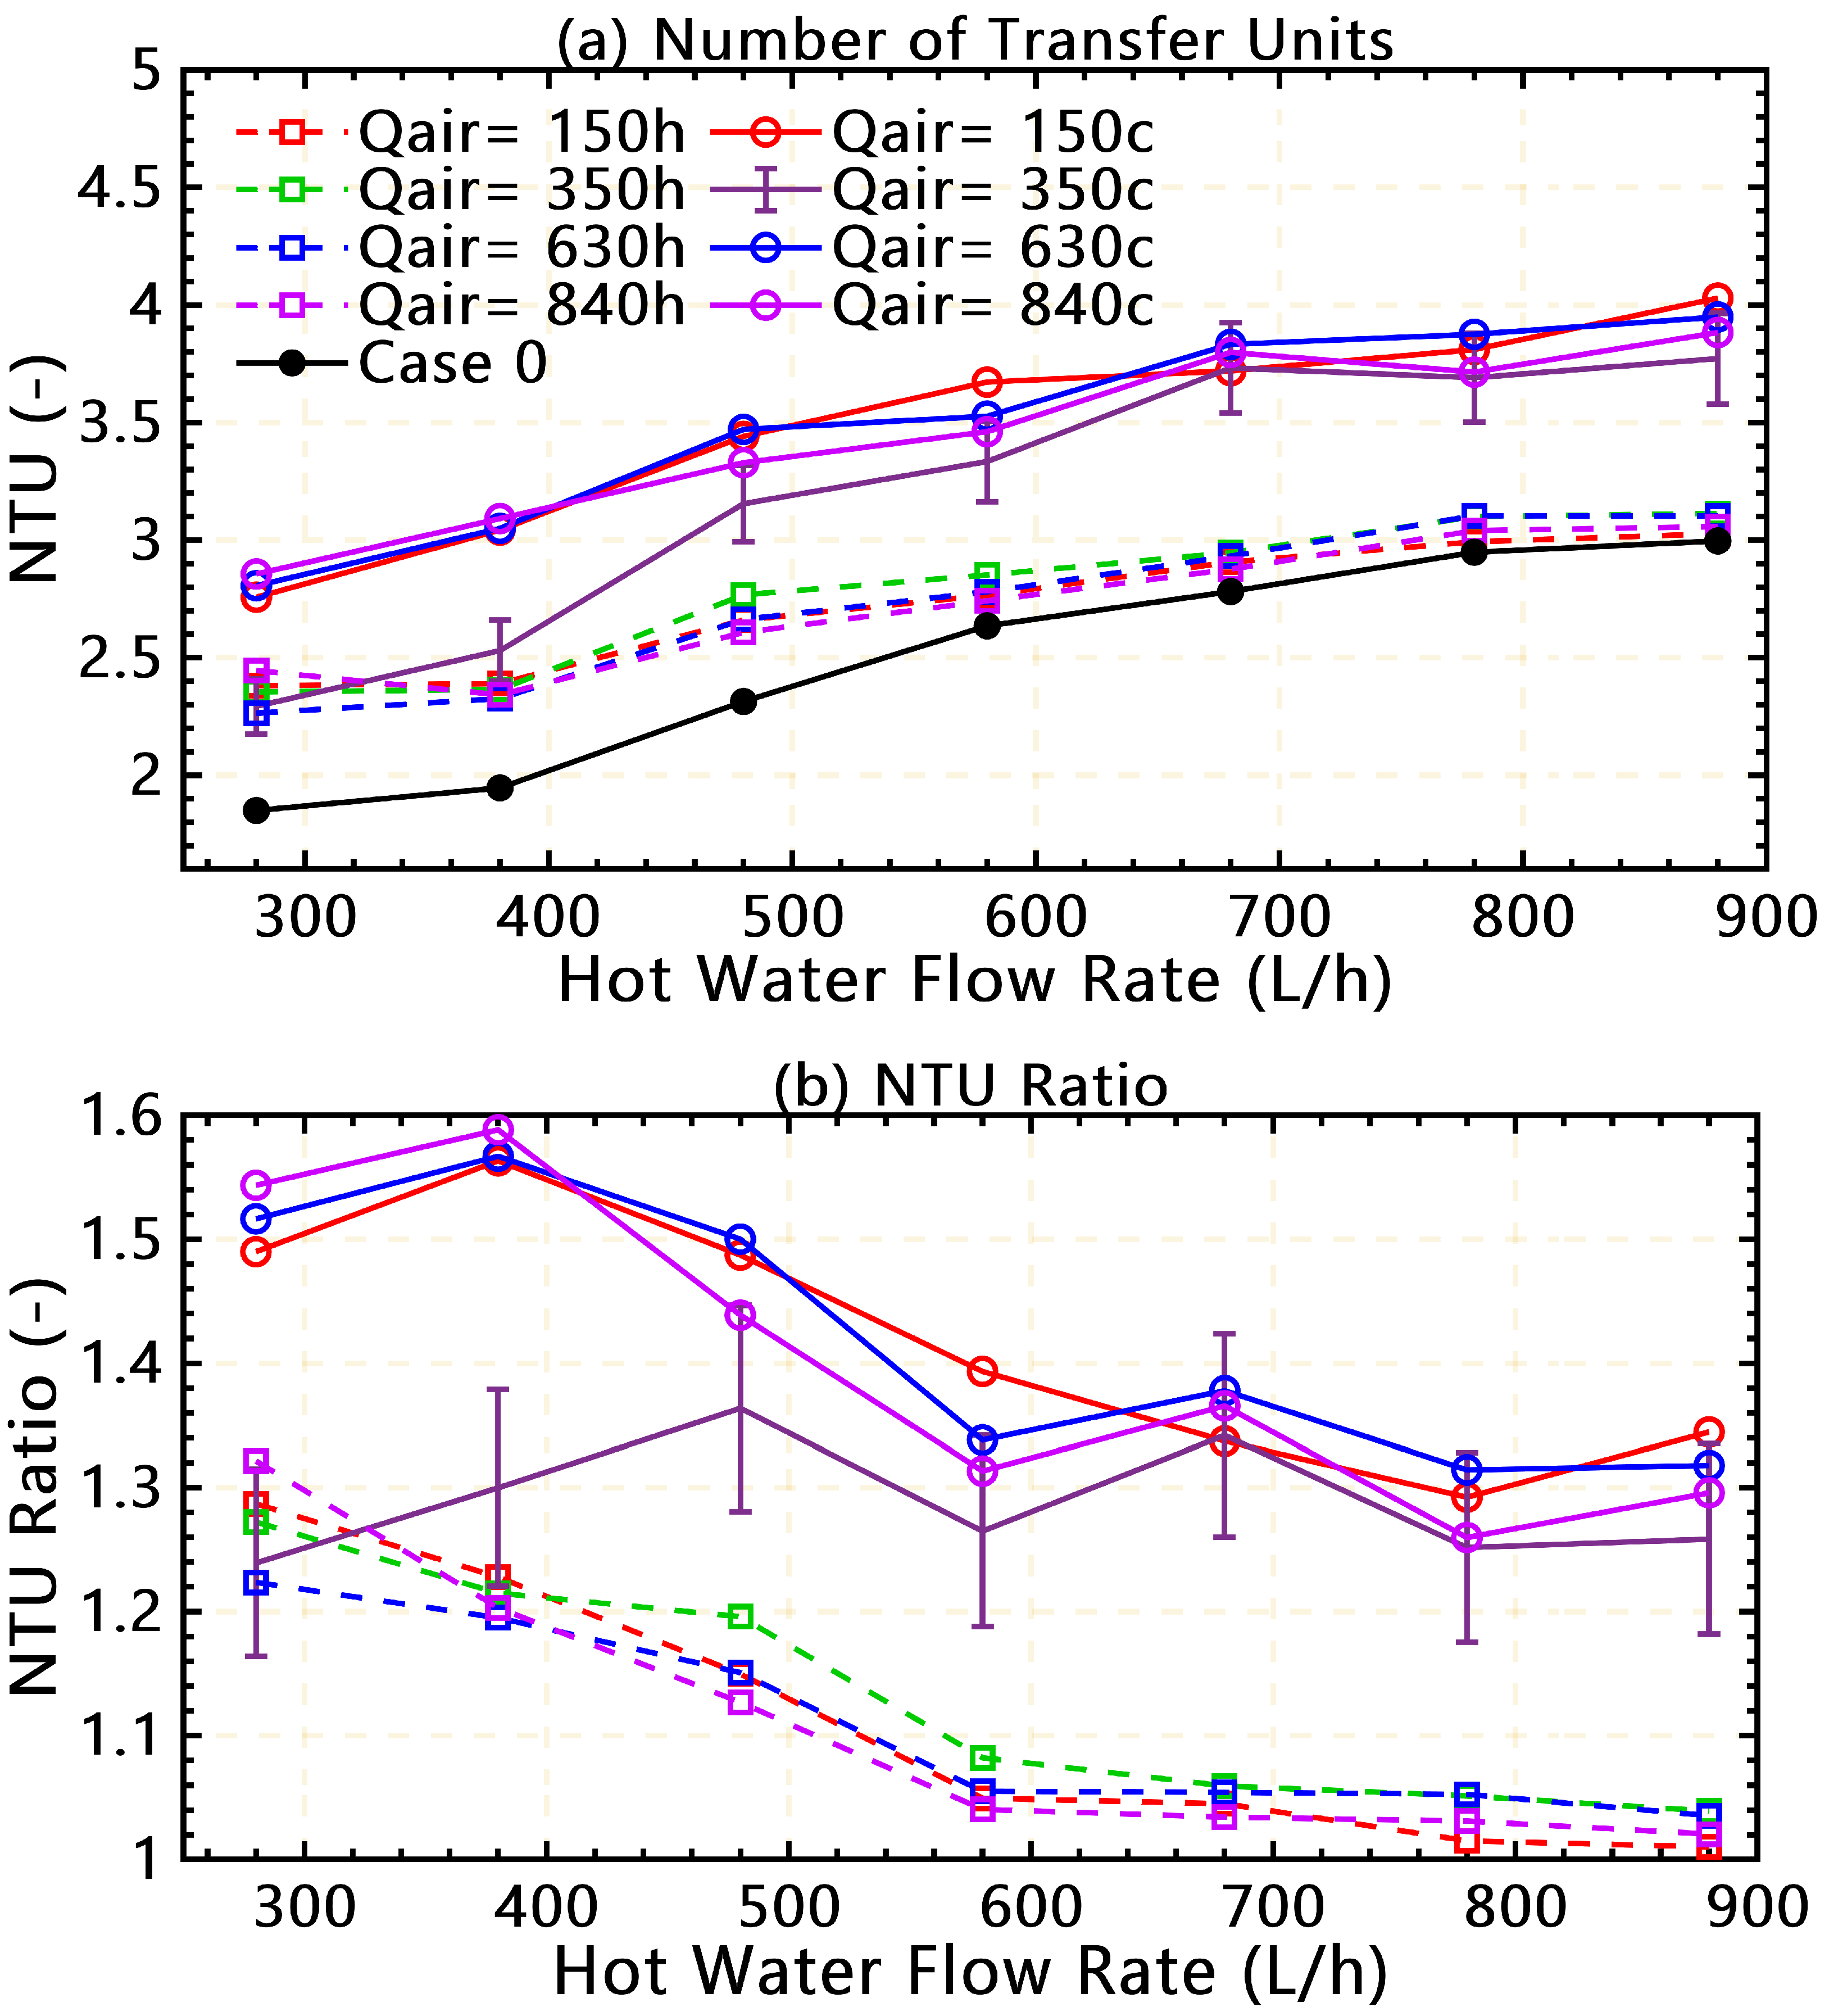
4.1.2. NTU and NTU Ratio Analysis
Figure 7a outlines another important parameter (NTU) which expresses the amount of HTR as a dimensionless number that affects the thermal performance of C-PHE. For the original case, NTU increases from 1.85 to 2.996 as
increased from 280 to 880 L/h, respectively. For ABI into CWS, NTU increases at a low ABI of
= 150 L/h with a maximum value of 2.76 to 4.03 at
ranged from 280 to 880 L/h, respectively. Hence, ABI into HWS, NTU increased significantly at
= 350 L/h from about 2.35 to 3.11 at
ranged from 280 to 880 L/h, respectively. We can notice that the effects of ABI on enhancing the HTR for CWS are the greatest compared with ABI in HWS. This thermal enhancement is due to the large-scale mixing of cold water and ABI as the distance between the mixing chamber and the C-PHE entrance port is greater than 0.7 m [
28]. In addition, as the air bubbles approach the C-PHE wall the heat transfer boosts as the plate corrugations act as bluff bodies [
31].
A new parameter was introduced as a ratio of NTU for two-phase to single-phase flows called
as illustrated in Equation (31).
Figure 7b shows the remarkable increases in the NTU Ratio that reached a maximum value of 1.59 at
= 840 L/h and
= 380 L/h, for ABI into CWS. Hence, this superiority continuo at the same
at different ABI of 630 and 150 L/h that reached a maximum
of 1.57 for both airflows. For HWS, NTU Ratio reached its maximum value of 1.32 at
= 630 L/h and
= 280 L/h then decreases to 1.021 at low
= 880 L/h. The same trend is repeated at the other airflow rates with
decreasing at high
ranged from 580 to 880 L/h, which indicates the superiority of ABI in CWS for all cases even high
. Injecting bubbles with a proper size affect significantly enhanced HTR that results in an increasing the NTU by 59%.
4.2. Exergetic Performance Analysis
In this section, the exergetic performance according to the second law analysis is discussed briefly as follows:
4.2.1. Entropy Generation Rate Analysis
Figure 8 gives an example of the entropy generation rate (
) that has been investigated for the original case and with different ABI into both CWS and HWS.
has a maximum value at
= 280 L/h for all the tests conditions;
0.809 W/K for original case;
W/K at
of 350, 630, and 840 L/h for CWS;
1.33 W/K at
L/h for HWS. A better quality of energy transfer can be achieved with a minimum
that is associated with minimum irreversibility. The
is a good indicator of the HTR. In addition,
is used for evaluating the
which is a very important parameter.
4.2.2. Entropy Generation Number Analysis
Consider
Figure 9 which demonstrates the dimensionless entropy generation number (
that is prevalently used for EGM in order to minimize irreversibility that is required as the relation between
and HTR.
reached its maximum value of 0.00255 at
= 280 L/h for (case 0) compared to the ABI into CWS that has a maximum value of about 0.00237 at
of 350, 630, and 840 L/h. Hence, at
of 380 and 480 L/h the same trend of increased
values until averaged between the remaining hot flow rates at different ABI. Furthermore, the best performance of ABI into CWS has been achieved at
= 630 L/h for all operating conditions with minimum values of
even compared to the original case. This performance reflects the positive effect of ABI in enhancing the quality of energy transferred. Comparing these results to the previously published study, the
for ABI into HWS with counter flow direction has minimum values at all testing conditions.
4.2.3. Augmentation Entropy Generation Number Analysis
The relationship between
and
at different ABI for both CWS and HWS can be founded in
Figure 10. The value of
which is below one is the preferred from the thermodynamics point of view. These criteria are established in this study at
= 630 L/h at all tested flow rates for ABI into CWS. Hence, all the values of
with the acceptable limits except for
= 350 L/h at
= 680 L/h reached a maximum value of 4.25. Additionally, the trend is accomplished in the case of ABI into HWS, and most
values are below two except four values at a high
that may be due to the bubble collision that results in configure separation zones between the hot plate surfaces, thus resulting in an evacuation of part of the surface area from hot water. Comparing these results with ABI into HWS with the parallel flow, we can notice that the
has a maximum value compared to ABI into HWS with the counter-flow arrangement, which negatively affects the quality of HTR.
4.2.4. Exergy Destruction Rate Analysis
Thermal exergy destruction rate at different
for the original case and ABI into CWS and HWS illustrated in
Figure 11. The
has high rates at the low volumetric of hot water of 280 L/h at different operating conditions that reached 241.18 W, 230.3 W, and 395.1 W at (case 0), ABI of
= 350c, 630c, and 840c, and ABI of
= 150 h, respectively. Hence, for low hot flow rates, the favorable performance of injecting air occurs at
= 150 L/h for CWS at
ranging between 280 L/h to 580 L/h which
reaches its minimum values that ranged between 55.4 W to 13.25 W which is lower than the original case. This result indicates that most of the energy available is transferred to useful heat which strongly affects the performance of C-PHE and enhanced HTR. The noticeable rapid increase in
at curve 630h for the high hot water flow rate is due to injecting air bubbles with a great amount of 630 L/h into HWS that increases the turbulence intensity and irreversibility which is responsible for increasing the
.
4.3. Combined Energetic-Exergetic Performance Analysis
4.3.1. Exergy Effectiveness
ABI into CWS has great effects on exergy effectiveness (
) for all operating conditions especially at low
of 150 L/h for
ranging from 280 to 580 L/h that are reached about 0.778, then drops at high
ranged from 680 to 880 L/h to 0.752 as shown in
Figure 12. ABI enhanced the
with a maximum value of 0.809 at
= 840 L/h and
= 280 L/h into CWS compared to 0.774 at the same operating conditions in the case of ABI into HWS. Moreover, it shows the superiority of ABI in enhancing the quality of energy transfer and the effectiveness of C-PHE compared to the case without ABI. For ABI into HWS, almost all the tests haven’t enhanced the
compared to the original case, there was a clear improvement in only two cases of ABI at
= 350 and 840 L/h low
compared to the original case. This may be due to the large number of bubbles that vanishes with hot water, especially at high
that result in energy destruction. Marouf et al.’s [
12] results showed the same trend of fluctuated values at different operating conditions of ABI into HWS with parallel flow arrangement.
4.3.2. Witte-Shamsundar Efficiency
The efficiency of energy usage can be evaluated using Witte-Shamsundar efficiency according to the second law analysis, as depicted in
Figure 13. ABI has superiority in enhancing the efficiency of all the testing conditions with a maximum value of 0.986 for
= 150 L/h and
= 380 L/h into CWS, at this tested condition the entropy generation rate has a minimum value of 0.0382 W/K. Furthermore, these effects are extended also to ABI into HWS but with deterioration at high
of 880 L/h. Although the maximum improvement in of
that reached its maximum value of 0.983 at
of 840 L/h and
= 280 L/h, it decreases until reached 0.98. This drop in efficiency could be resulting from the large streams of injected bubbles that escape from the thermal boundary layer, resulting in cooling the hot plates’ wall surfaces. Thus, we can notice that as HTR increases and at the same time
decreases the value of
tends to approach unity. Moreover, the injected air into CWS shows its great energetic and exergetic performance than in HWS.
4.4. Thermo-Economic Analysis
This section discusses the consequences of using the ABI as a performance enhancement technique for the economical purpose that is defined as [
12,
32]
with
and
Table 3 provides a list of the values utilized in this assessment.
The net profit per unit transfer load (
) values depicted in
Figure 14 for ABI into HWS exhibit competitive advantage at lower values of
and
for case 150h that reaches 0.35 USD/kJ. This value corresponds to a maximum value of
of 0.4 kW. In addition, a noticeable increase in
corresponds to case 630h at high
that also corresponds to a large
as it is a function in
, this could be due to irreversibility in the system and slug flow that occurs to PHE two-phase flow and cannot be observed experimentally [
18]. In general, all the tests condition has positive values which indicate that ABI is economically beneficial.
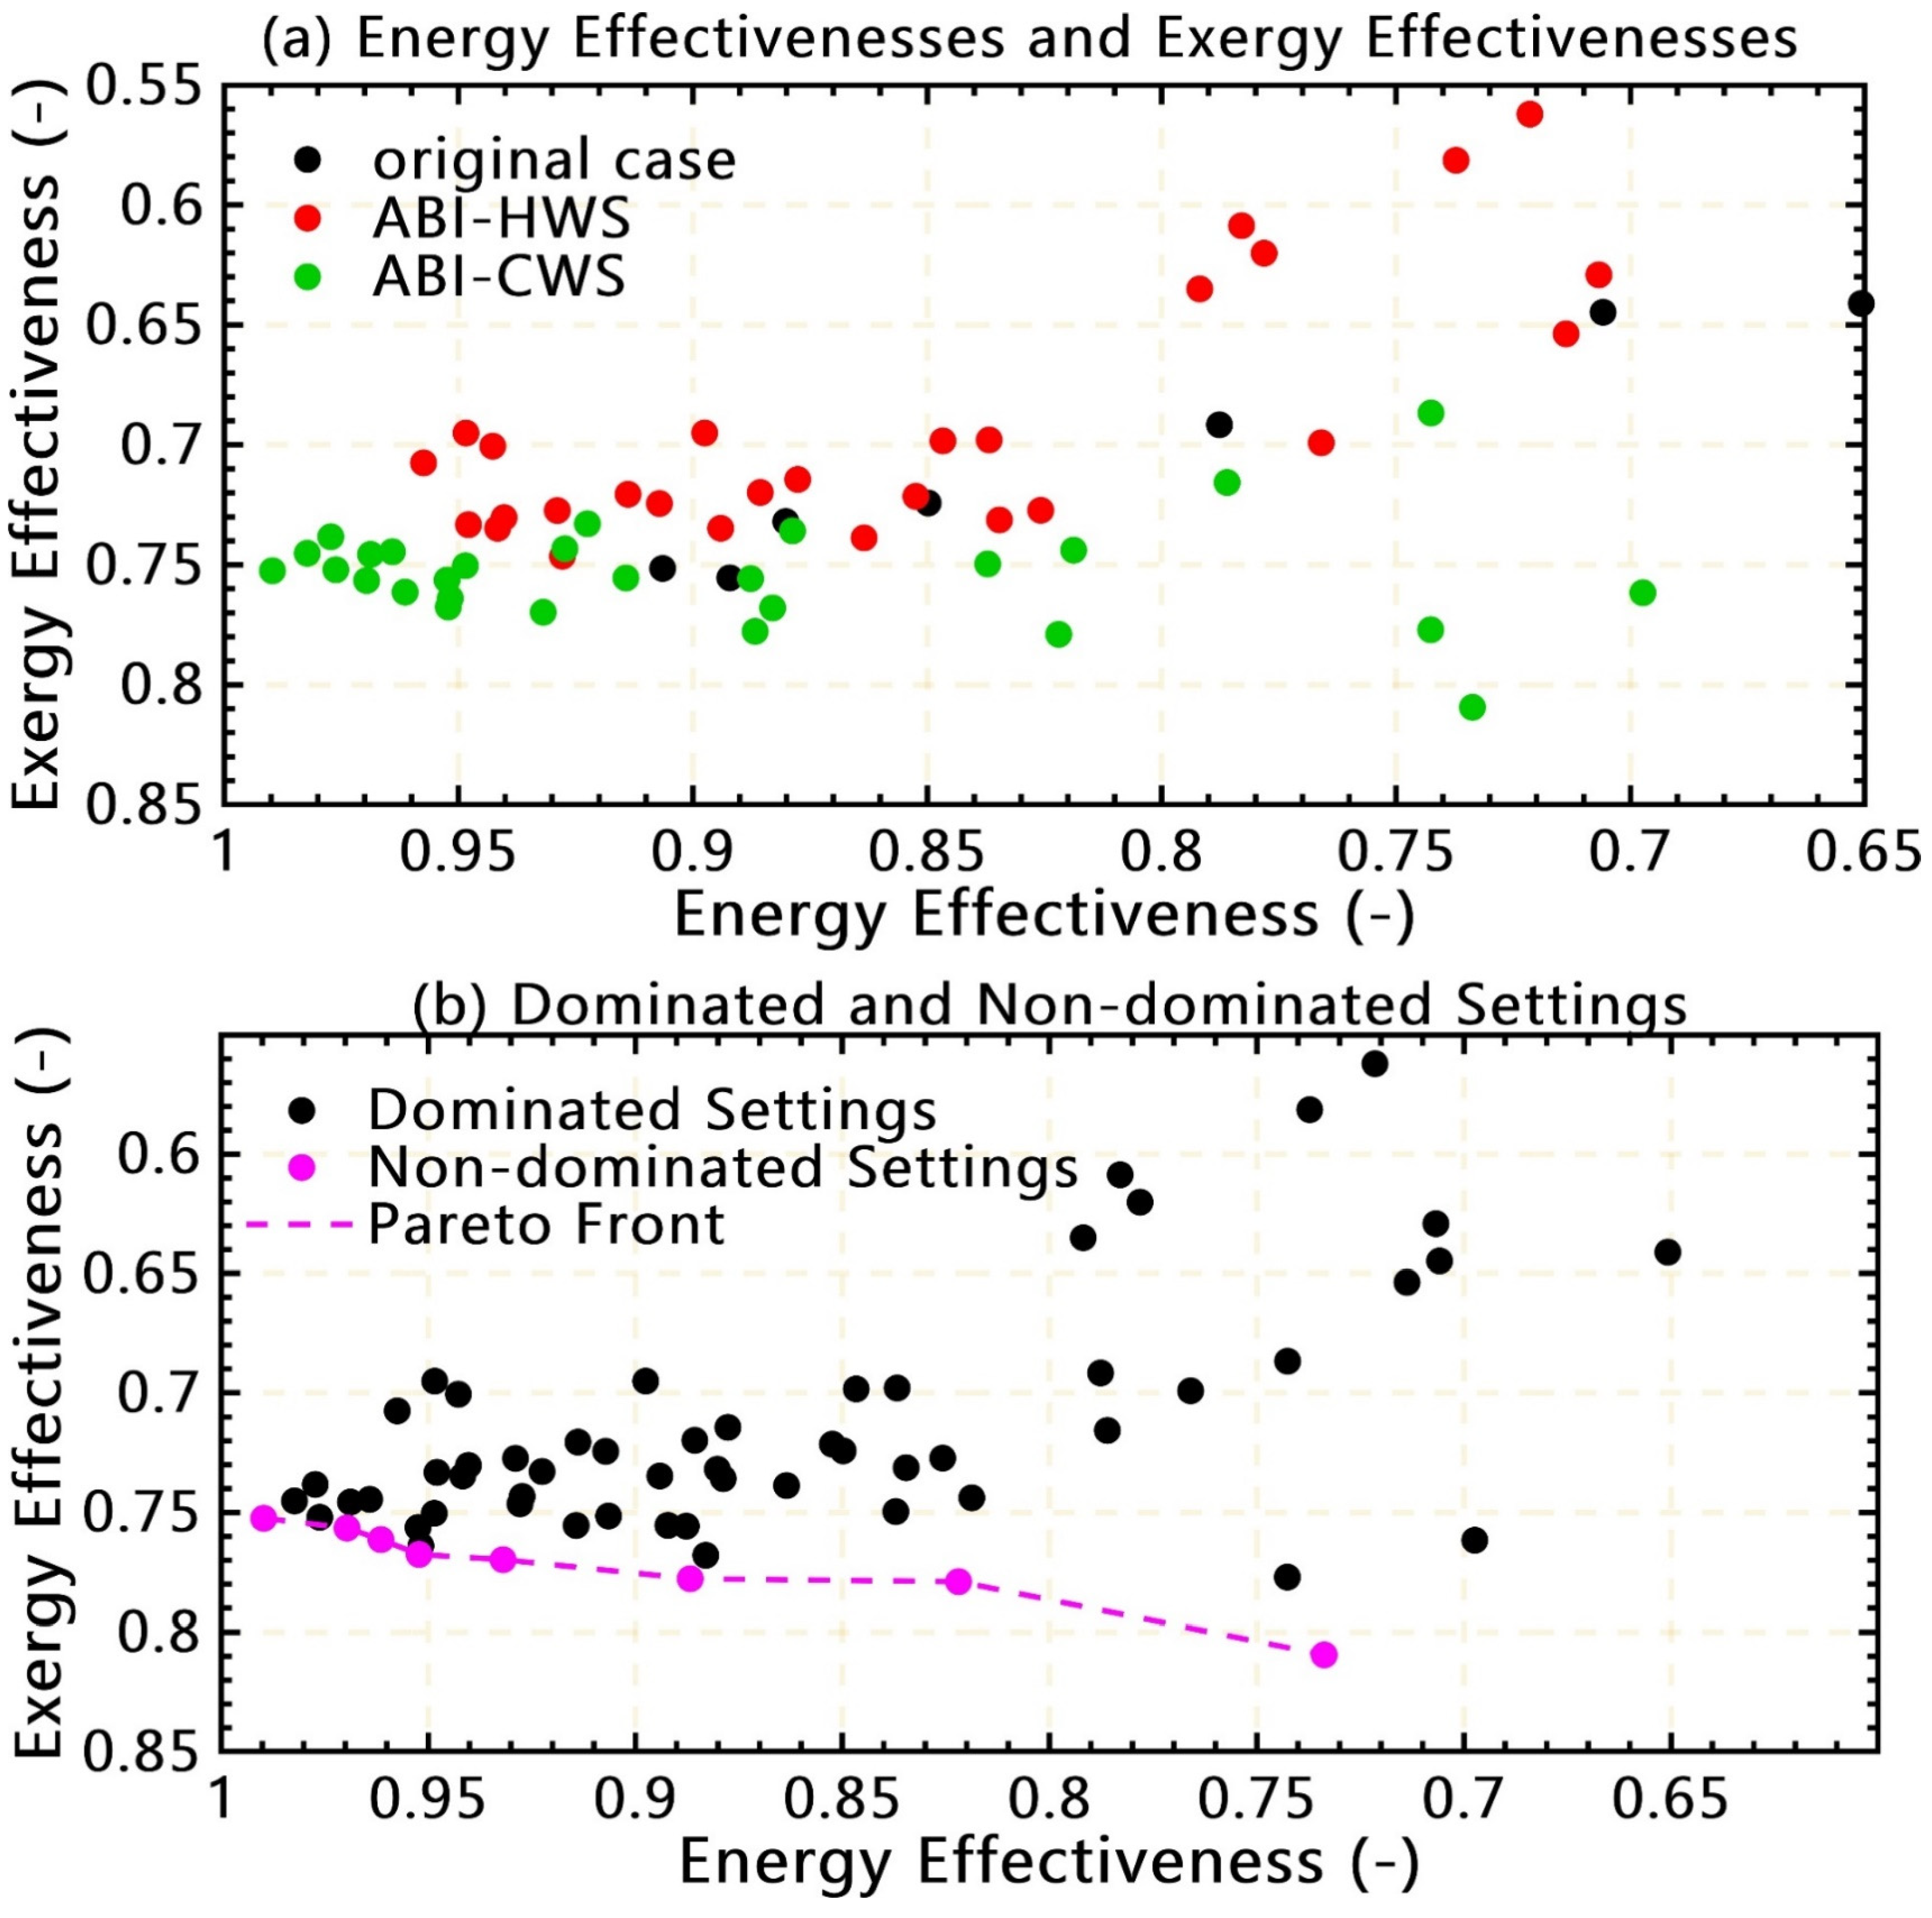
4.5. Energy and Exergy Effectiveness Optimization
In order to provide a favorable compromise between the energetic and exergetic performance analysis of the C-PHE,
Figure 15a demonstrates the
. It was noticed that the thermal effectiveness approaches unity for ABI into CWS. Additionally, there are considerable effects at HWS that have maximum values for both thermal and exergy effectiveness.
Figure 15b illustrates the dominated and non-dominated solutions of the Pareto front. Air bubbles injected into HWS are favorable in terms of
, whereas ABI into CWS is superior in terms of
.


