

Environmental Protection Tax and Energy Efficiency: Evidence from Chinese City-Level Data
Abstract
:1. Introduction
2. Literature Review
2.1. Measurement of Energy Efficiency
2.2. Environmental Policy and Energy Efficiency
3. Background and Research Hypotheses
3.1. Institutional Background of EPT Policy in China
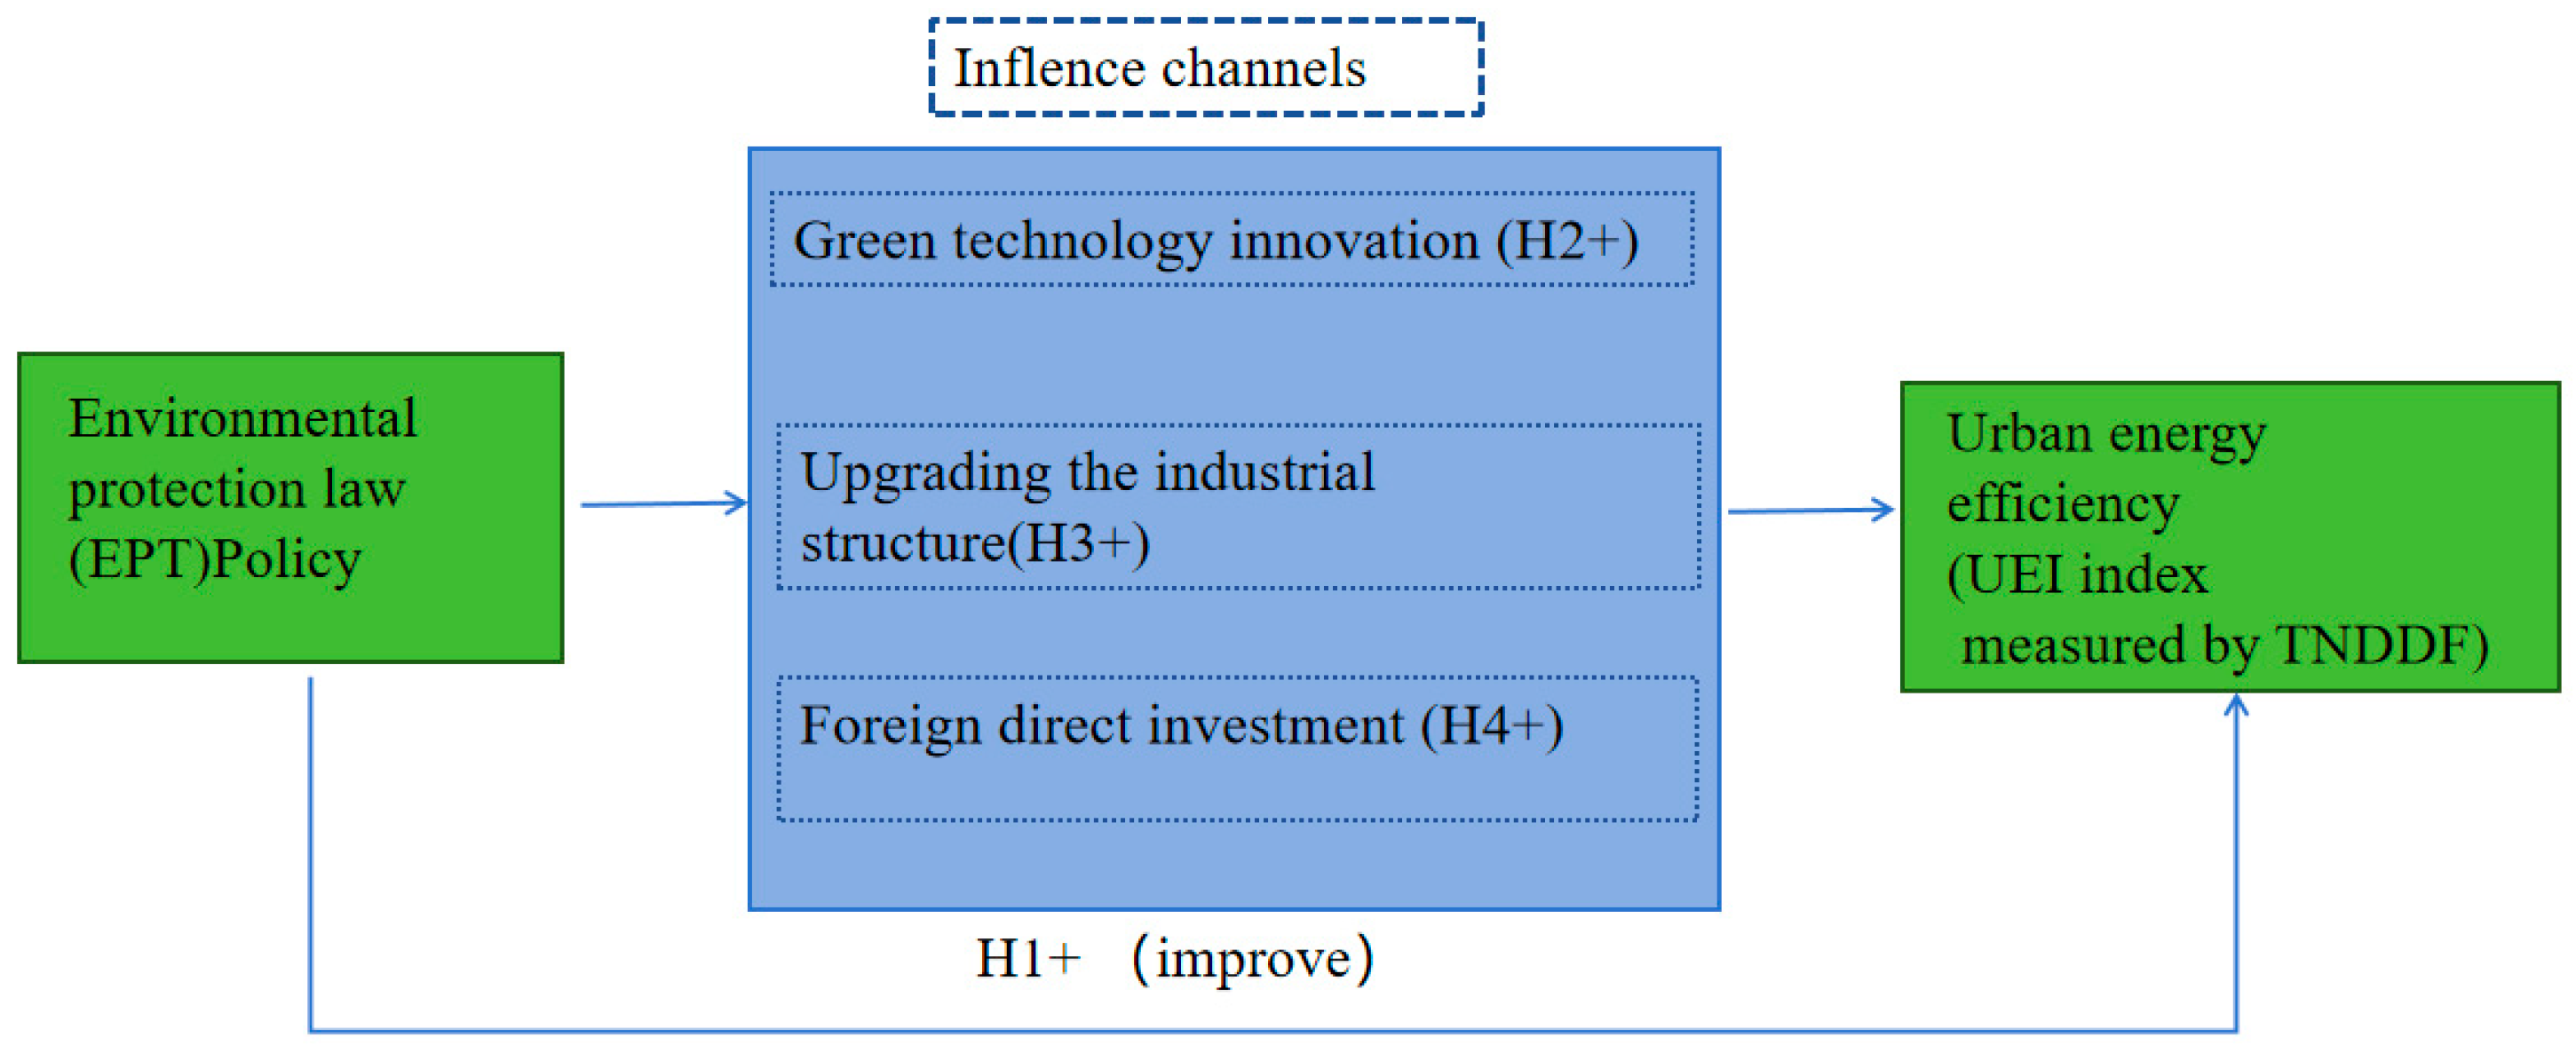
3.2. Research Hypothesis
3.2.1. Basic Hypothesis
3.2.2. Mechanism Hypothesis
4. Methodology and Data Source
4.1. Measurement of Energy Efficiency
- Inputs and undesirable outputs are highly disposable. That is, if and then ;
- A weakly disposable set is satisfied by the joint production set of desirable and undesirable outputs. Namely if and , ;
- Desirable output has no intersection with undesirable output. Then if and , ;
4.2. DID Model for Exploring the Effects of the EPT
- (1)
- Environmental regulation (lnregulation). Existing evidence certifies that environmental regulations have an impact on energy efficiency [50,54]. Thus, environmental regulation is expected to affect urban energy efficiency. Following the method of Zhou et al. [55], the environmental regulation index of a city is used to measure environmental regulation. Meanwhile, the improved entropy method is used to put different weights on different indicators to construct the comprehensive index. The indicators included in the comprehensive index contain industrial wastewater emissions, industrial smoke (dust) emissions, and industrial sulfur dioxide emissions. Considering emission intensity and environmental regulation intensity usually have a negative correlation, we take the inverse of the weighted index to represent lnregulation.
- (2)
- Economic development level (lnGDP). Existing evidence has demonstrated that the level of regional economic development can influence the mode of production and energy consumption in regions [55,56]. Thus, the per capita GDP is expected to affect a city’s energy efficiency. The logarithm of 1 plus the per capita GDP of each city is used in this paper.
- (3)
- Foreign direct investment (lnFDI). There is an ongoing debate on whether FDI has environmental effects on the host countries, on which there are mainly two views. The “pollution haven hypothesis” holds that FDI can amplify carbon emissions and energy consumption burdens directly in the host country, which leads to a decrease in energy efficiency [46,57]. However, based on the “pollution halo effect”, Antweiler et al. [58] found that the introduction of FDI can increase the inflow of technological innovation knowledge and increase the technological spillover effect. Therefore, the FDI of a city is expected to have an influence on the city’s energy efficiency. In this study, we measure the variable by using the logarithm of 1 plus the total foreign direct investment of each city.
- (4)
- Export (Inexport). Export behavior is often closely related to city business activities [59]. Through the export trade, a city can gain advanced technology and business experience to promote its energy efficiency, which may have a significant influence on the city’s energy efficiency. Lnexport is calculated by the logarithm of 1 plus the total exports in a city.
- (5)
- Industrial structure (lntertind). Existing literature has shown that rationalizing and upgrading industrial structures can boost energy efficiency [46]. Thus, it is expected that a city’s industrial structure may affect urban energy efficiency. To measure the industrial structure of a city, we used the ratio of the tertiary industry to the city’s GDP.
- (6)
- Freight (lnfreight). The production intensity of a city can be represented by its road freight, which could have an impact on the consumption of energy and pollutant emissions of cities, thereby influencing energy efficiency. We use the logarithm of 1 plus the road freight to measure the variable.
4.3. Data Description
4.3.1. Data for Urban Energy Efficiency Measurement
- (1)
- Capital (K). To calculate the capital input indicator, we use the city’s actual capital stock, which is calculated by the “perpetual inventory approach”. The data are from the CCSY and the NBSC.
- (2)
- Labor (L). The total labor of each city is used to measure the labor input indicator. The total number of employees in the unit plus all private and independent employees is used to calculate labor input. Data are collected from the CCSY.
- (3)
- Energy (E). The total energy consumption of a city is used to measure the energy input indicator. The energy consumption unit is expressed in tons of coal equivalent (tcc). We compensated for the missing energy data in some cities following Yu et al. [56]. The data resources are from CSY, CCSY, and CESY.
- (4)
- Desirable output (Q). We convert the desirable output to constant 2011 prices using each city’s GDP as the desirable output indicator. The data on the GDP of each city are from CCSY.
- (5)
- Undesirable output (C). We use each city’s total CO2 emissions to measure undesirable output indicators. The primary sources of city CO2 emissions are direct energy use, for instance, coal gas and liquefied petroleum gas. Secondary sources of city CO2 emissions are indirect energy use of electricity and thermal. To calculate the CO2 emissions from direct energy use, we use the conversion coefficients provided by the IPCC [10,60]. The following is the calculation formula:
4.3.2. Data for the DID Model
5. Results and Discussion
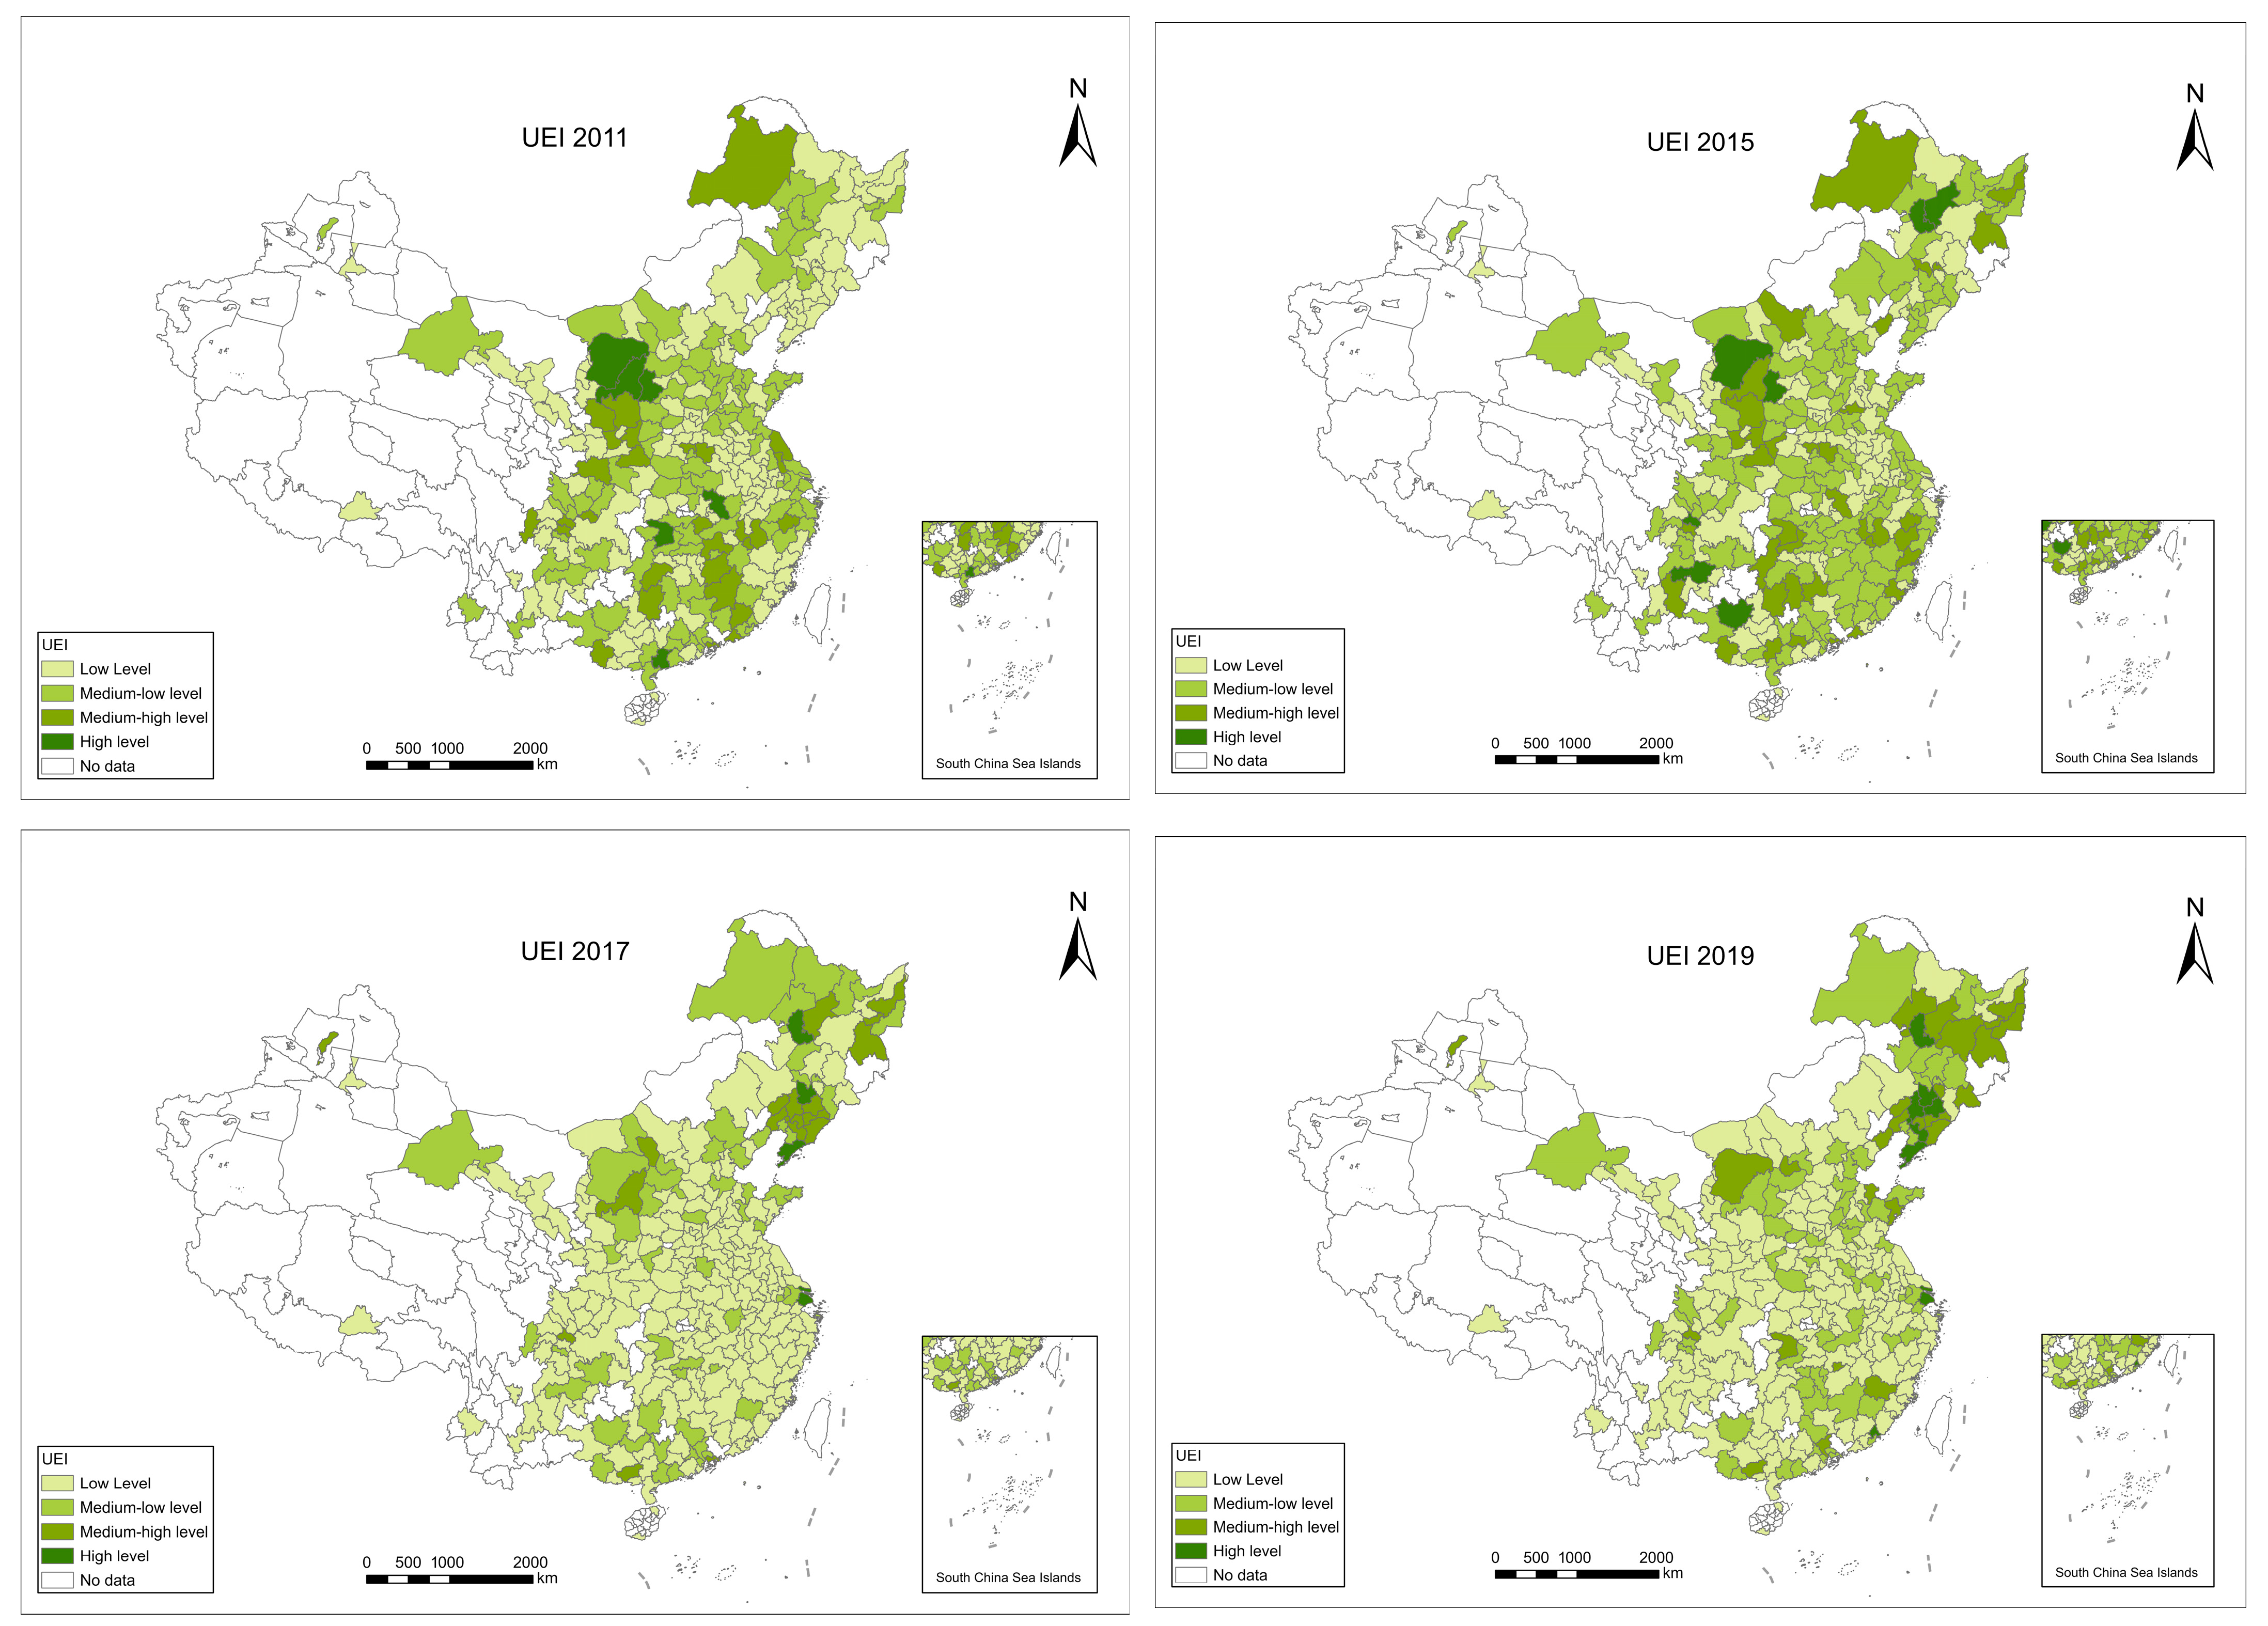
5.1. Overall Analysis of the Energy Efficiency in Chinese Cities
5.2. Analysis of the Effect of the EPT Policy on Urban Energy Efficiency
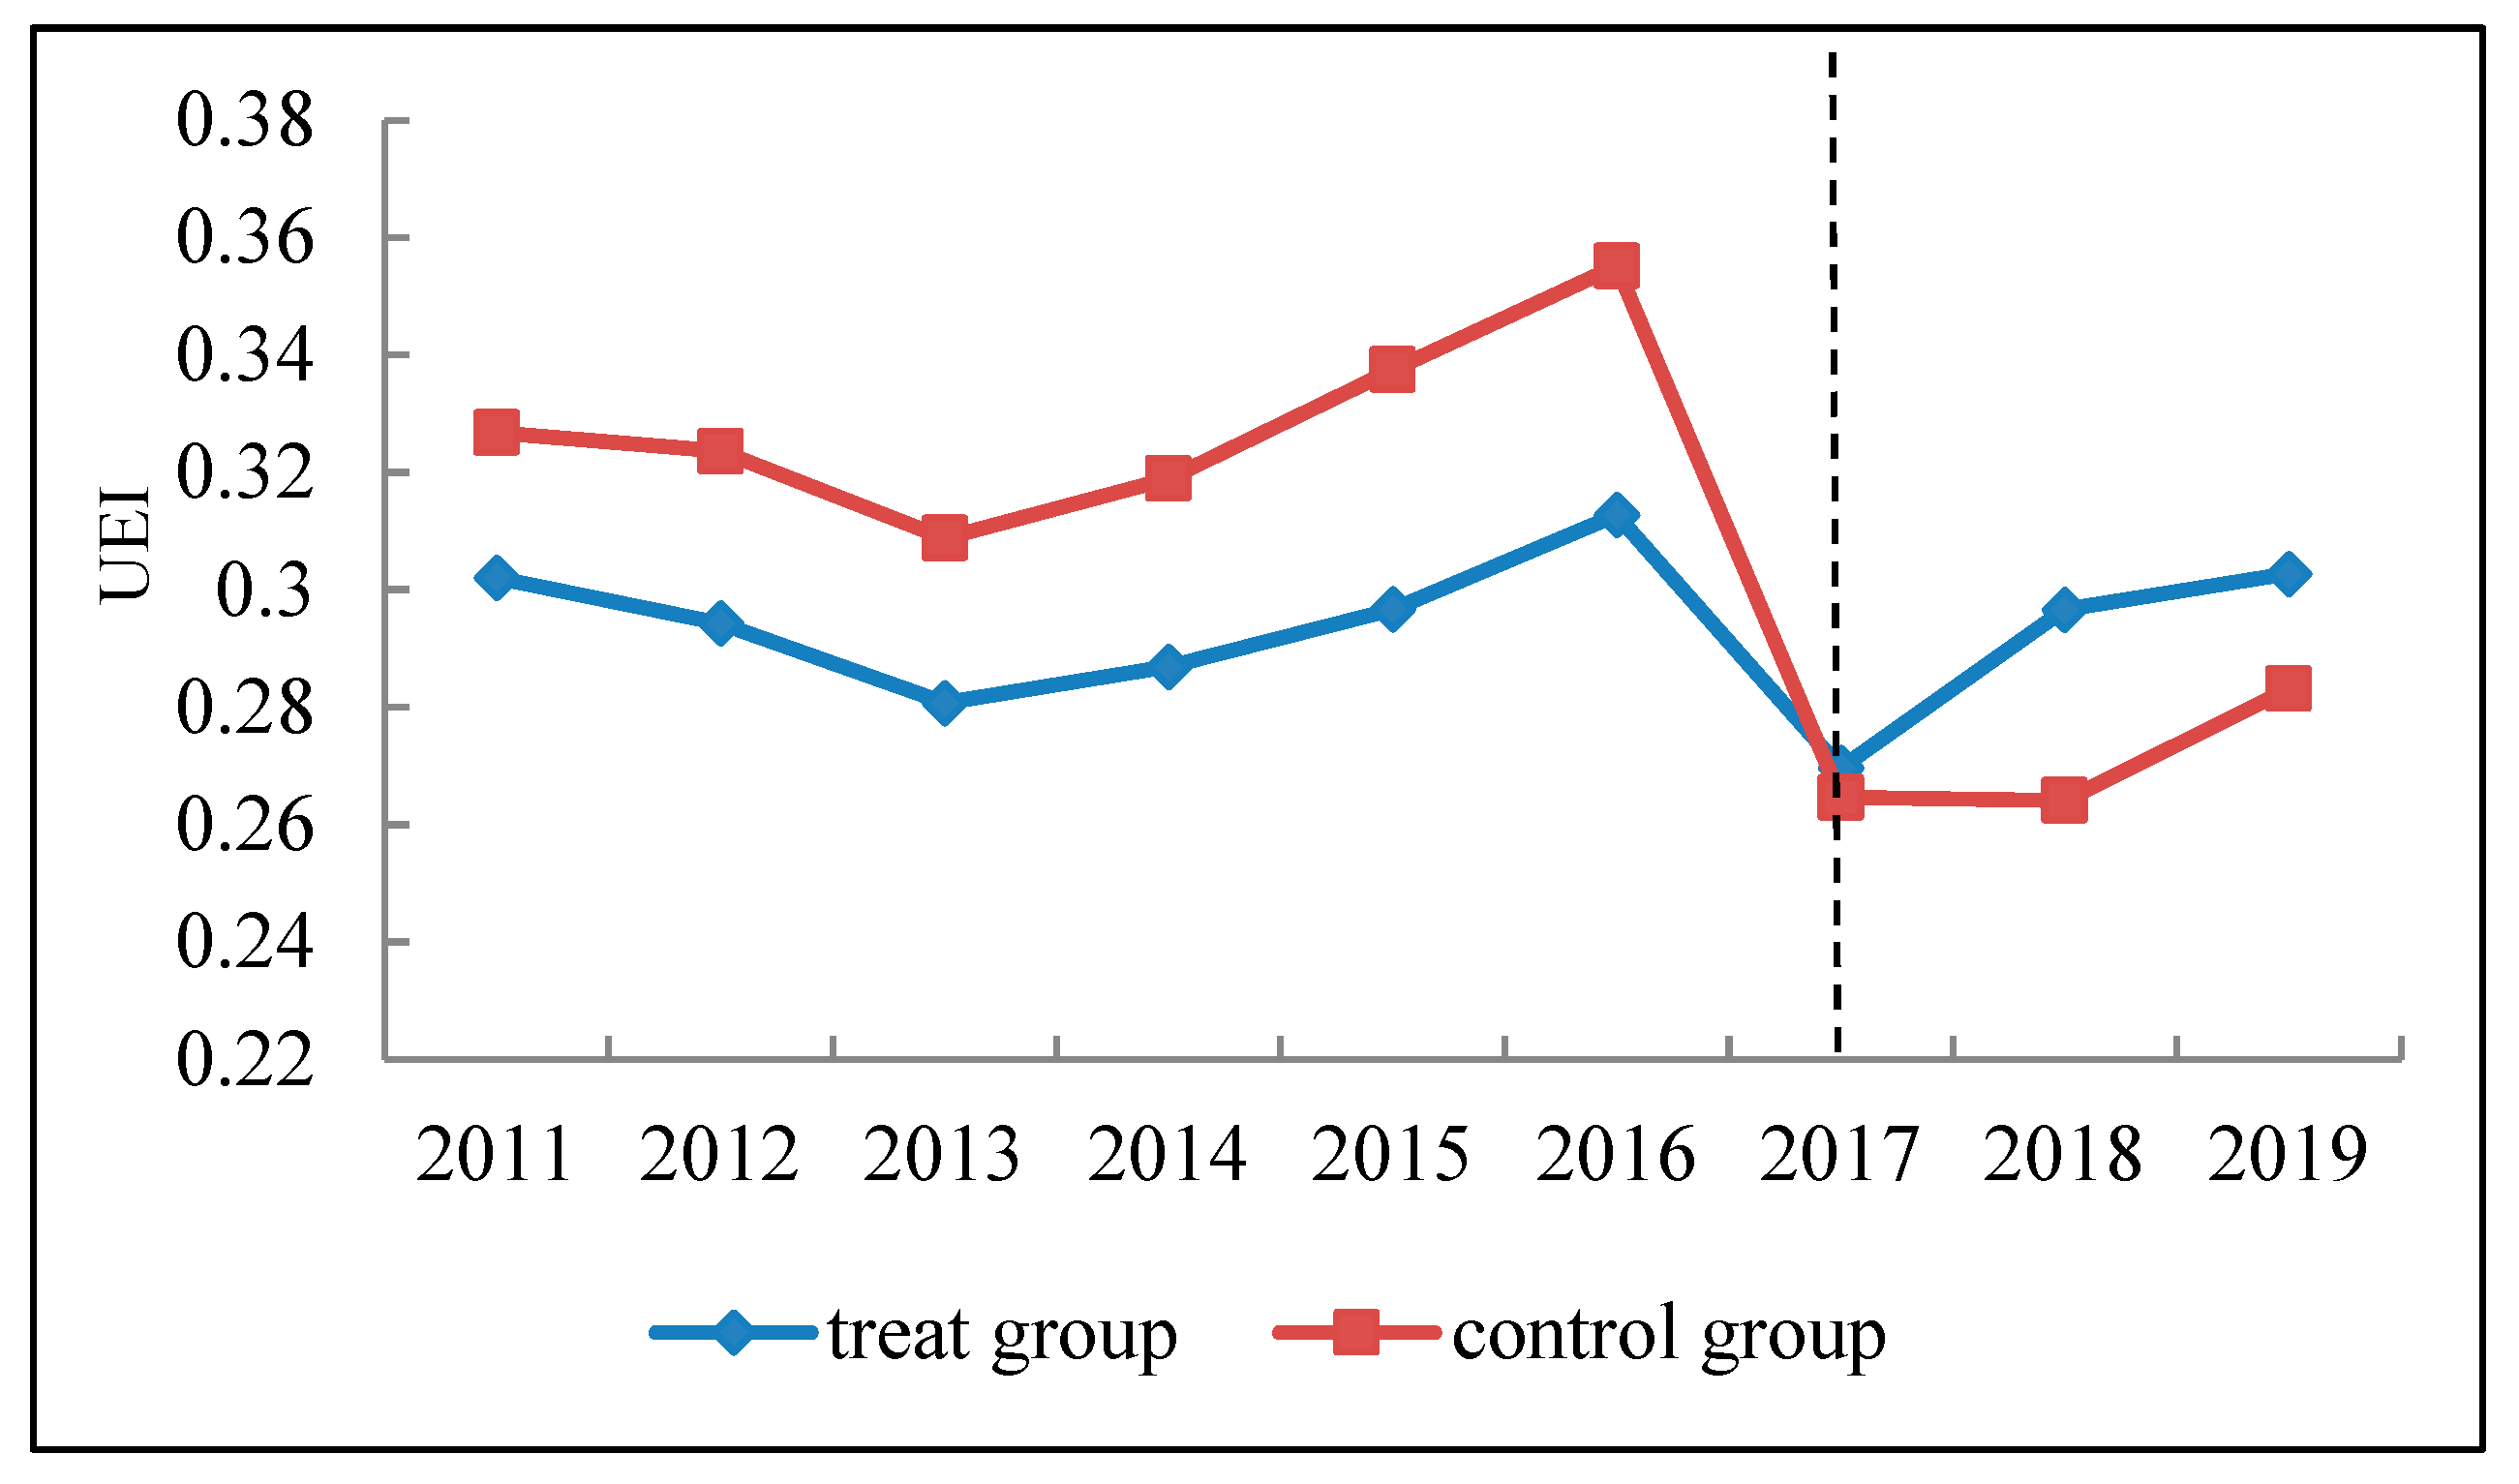
5.3. Dynamic Effect of the EPT
6. Robustness Test
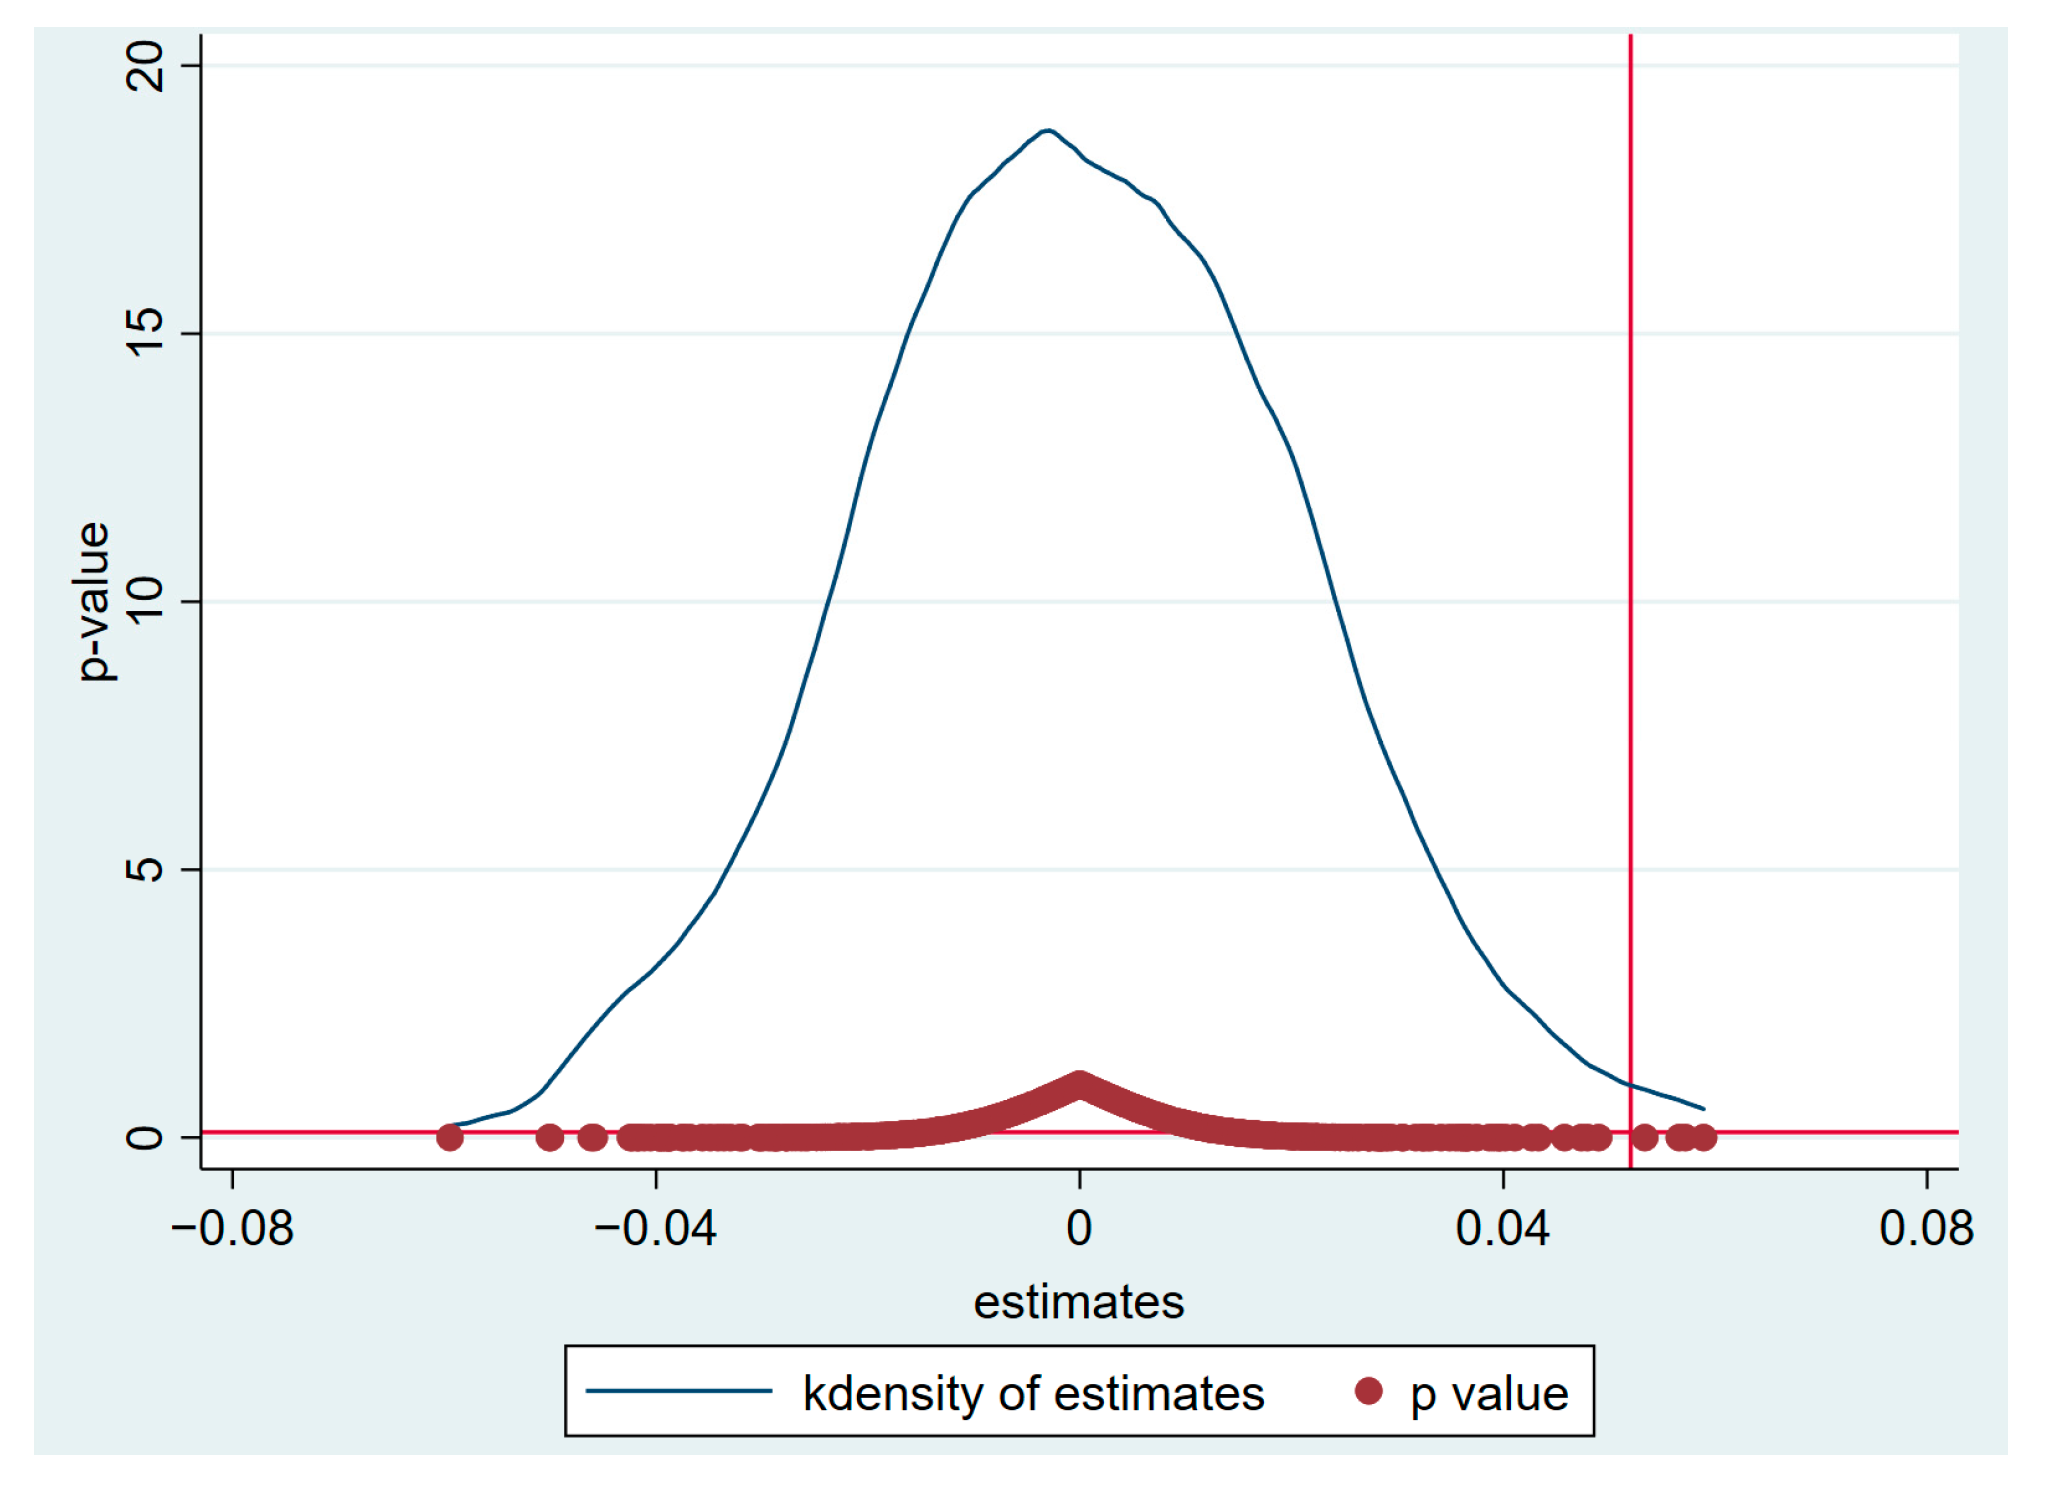
6.1. Placebo Test
6.2. Excluding the Influence of Other Policies
6.3. Heterogeneity Analysis
6.4. Mechanism Analysis
7. Conclusions and Policy Implications
Author Contributions
Funding
Data Availability Statement
Conflicts of Interest
Abbreviations
| UEI | Unified Efficiency Index |
| TNDDF | Total-factor Non-radial Directional Distance Function |
| DID | Difference-In-Difference |
| EPT | Environmental Protection Tax law |
| CER | Command-and-control Environmental Regulation |
| MER | Market-based Environmental Regulation |
| CSY | China Statistical Yearbook |
| CCSY | China City Statistical Yearbook |
| NBSC | The National Bureau of Statistics of China |
| CESY | China Energy Statistical Yearbook |
| CSYRE | China Statistical Yearbook for Regional Economic |
| CSYE | China Statistical Yearbook on Environment, |
| CUCSY | China Urban Construction Statistical Yearbook |
| SIPO | The State Intellectual Property Office of the People’s Republic of China |
References
- Wang, M.; Feng, C. The Win-Win Ability of Environmental Protection and Economic Development during China’s Transition. Technol. Forecast. Soc. Change 2021, 166, 120617. [Google Scholar] [CrossRef]
- Cheng, B.; Qiu, B.; Chan, K.C.; Zhang, H. Does a Green Tax Impact a Heavy-Polluting Firm’s Green Investments? Appl. Econ. 2022, 54, 189–205. [Google Scholar] [CrossRef]
- Long, F.; Lin, F.; Ge, C. Impact of China’s Environmental Protection Tax on Corporate Performance: Empirical Data from Heavily Polluting Industries. Environ. Impact Assess. Rev. 2022, 97, 106892. [Google Scholar] [CrossRef]
- Wang, Y.; Yu, L. Can the Current Environmental Tax Rate Promote Green Technology Innovation?—Evidence from China’s Resource-Based Industries. J. Clean. Prod. 2021, 278, 123443. [Google Scholar] [CrossRef]
- Han, F.; Li, J. Assessing Impacts and Determinants of China’s Environmental Protection Tax on Improving Air Quality at Provincial Level Based on Bayesian Statistics. J. Environ. Manag. 2020, 271, 111017. [Google Scholar] [CrossRef]
- Lu, J. Can Environmental Protection Tax Aggravate Illegal Pollution Discharge of Heavy Polluting Enterprises? Environ. Sci. Pollut. Res. 2022, 29, 33796–33808. [Google Scholar] [CrossRef] [PubMed]
- Niu, T.; Yao, X.; Shao, S.; Li, D.; Wang, W. Environmental Tax Shocks and Carbon Emissions: An Estimated DSGE Model. Struct. Change Econ. Dyn. 2018, 47, 9–17. [Google Scholar] [CrossRef]
- Li, P.; Lin, Z.; Du, H.; Feng, T.; Zuo, J. Do Environmental Taxes Reduce Air Pollution? Evidence from Fossil-Fuel Power Plants in China. J. Environ. Manag. 2021, 295, 113112. [Google Scholar] [CrossRef]
- Yang, J.; Xiong, G.; Shi, D. Innovation and Sustainable: Can Innovative City Improve Energy Efficiency? Sustain. Cities Soc. 2022, 80, 103761. [Google Scholar] [CrossRef]
- Zhang, Y.; Li, X.; Jiang, F.; Song, Y.; Xu, M. Industrial Policy, Energy and Environment Efficiency: Evidence from Chinese Firm-Level Data. J. Environ. Manag. 2020, 260, 110123. [Google Scholar] [CrossRef]
- Wang, J.-M.; Shi, Y.-F.; Zhang, J. Energy Efficiency and Influencing Factors Analysis on Beijing Industrial Sectors. J. Clean. Prod. 2017, 167, 653–664. [Google Scholar] [CrossRef]
- Wu, H.; Hao, Y.; Ren, S.; Yang, X.; Xie, G. Does Internet Development Improve Green Total Factor Energy Efficiency? Evidence from China. Energy Policy 2021, 153, 112247. [Google Scholar] [CrossRef]
- Zhang, Y.; Song, Y. Environmental Regulations, Energy and Environment Efficiency of China’s Metal Industries: A Provincial Panel Data Analysis. J. Clean. Prod. 2021, 280, 124437. [Google Scholar] [CrossRef]
- Shephard, R.W. Theory of Cost and Production Functions; Princeton University Press: Princeton, NJ, USA, 1970. [Google Scholar]
- Chambers, R.G.; Chung, Y.; Färe, R. Benefit and Distance Functions. J. Econ. Theory 1996, 70, 407–419. [Google Scholar] [CrossRef]
- Chung, Y.H.; Färe, R.; Grosskopf, S. Productivity and Undesirable Outputs: A Directional Distance Function Approach. J. Environ. Manag. 1997, 51, 229–240. [Google Scholar] [CrossRef]
- Färe, R.; Grosskopf, S.; Pasurka, C.A. Environmental Production Functions and Environmental Directional Distance Functions. Energy 2007, 32, 1055–1066. [Google Scholar] [CrossRef]
- Zhang, N.; Choi, Y. A Note on the Evolution of Directional Distance Function and Its Development in Energy and Environmental Studies 1997–2013. Renew. Sustain. Energy Rev. 2014, 33, 50–59. [Google Scholar] [CrossRef]
- Fukuyama, H.; Weber, W.L. A Directional Slacks-Based Measure of Technical Inefficiency. Socio Econ. Plan. Sci. 2009, 43, 274–287. [Google Scholar] [CrossRef]
- Sueyoshi, T.; Goto, M. DEA Approach for Unified Efficiency Measurement: Assessment of Japanese Fossil Fuel Power Generation. Energy Econ. 2011, 33, 292–303. [Google Scholar] [CrossRef]
- Barros, C.P.; Managi, S.; Matousek, R. The Technical Efficiency of the Japanese Banks: Non-Radial Directional Performance Measurement with Undesirable Output. Omega 2012, 40, 1–8. [Google Scholar] [CrossRef]
- Färe, R.; Grosskopf, S. Directional Distance Functions and Slacks-Based Measures of Efficiency. Eur. J. Oper. Res. 2010, 200, 320–322. [Google Scholar] [CrossRef]
- Zhou, P.; Ang, B.W.; Wang, H. Energy and CO2 Emission Performance in Electricity Generation: A Non-Radial Directional Distance Function Approach. Eur. J. Oper. Res. 2012, 221, 625–635. [Google Scholar] [CrossRef]
- Zhang, N.; Kong, F.; Choi, Y.; Zhou, P. The Effect of Size-Control Policy on Unified Energy and Carbon Efficiency for Chinese Fossil Fuel Power Plants. Energy Policy 2014, 70, 193–200. [Google Scholar] [CrossRef]
- Zhang, N.; Choi, Y. Total-Factor Carbon Emission Performance of Fossil Fuel Power Plants in China: A Metafrontier Non-Radial Malmquist Index Analysis. Energy Econ. 2013, 40, 549–559. [Google Scholar] [CrossRef]
- Yao, X.; Zhou, H.; Zhang, A.; Li, A. Regional Energy Efficiency, Carbon Emission Performance and Technology Gaps in China: A Meta-Frontier Non-Radial Directional Distance Function Analysis. Energy Policy 2015, 84, 142–154. [Google Scholar] [CrossRef]
- Li, J.; Lin, B. Does Energy and CO2 Emissions Performance of China Benefit from Regional Integration? Energy Policy 2017, 101, 366–378. [Google Scholar] [CrossRef] [PubMed]
- Gray, W.B. The Cost of Regulation: OSHA, EPA and the Productivity Slowdown. Am. Econ. Rev. 1987, 77, 998–1006. [Google Scholar]
- Porter, M.E.; van der Linde, C. Toward a New Conception of the Environment-Competitiveness Relationship. J. Econ. Perspect. 1995, 9, 97–118. [Google Scholar] [CrossRef]
- Leinert, S.; Daly, H.; Hyde, B.; Gallachóir, B.Ó. Co-Benefits? Not Always: Quantifying the Negative Effect of a CO2-Reducing Car Taxation Policy on NOx Emissions. Energy Policy 2013, 63, 1151–1159. [Google Scholar] [CrossRef]
- Metcalf, G.E. Designing a Carbon Tax to Reduce U.S. Greenhouse Gas Emissions. Rev. Environ. Econ. Policy 2009, 3, 63–83. [Google Scholar] [CrossRef]
- Mandal, S.K. Do Undesirable Output and Environmental Regulation Matter in Energy Efficiency Analysis? Evidence from Indian Cement Industry. Energy Policy 2010, 38, 6076–6083. [Google Scholar] [CrossRef]
- Martin, R.; de Preux, L.B.; Wagner, U.J. The Impact of a Carbon Tax on Manufacturing: Evidence from Microdata. J. Public Econ. 2014, 117, 1–14. [Google Scholar] [CrossRef]
- Rivers, N.; Schaufele, B. Salience of Carbon Taxes in the Gasoline Market. J. Environ. Econ. Manag. 2015, 74, 23–36. [Google Scholar] [CrossRef]
- Sen, S.; Vollebergh, H. The Effectiveness of Taxing the Carbon Content of Energy Consumption. J. Environ. Econ. Manag. 2018, 92, 74–99. [Google Scholar] [CrossRef]
- Fu, M.; Wu, W.; Tian, L.; Zhen, Z.; Ye, J. Analysis of Emission Reduction Mechanism of High-Tiered Carbon Tax under Green and Low Carbon Behavior. Energies 2023, 16, 7555. [Google Scholar] [CrossRef]
- Chen, W.; Wu, X.; Xiao, Z. Impact of Environmental Policy Mix on Carbon Emission Reduction and Social Welfare: Scenario Simulation Based on Private Vehicle Trajectory Big Data. Energies 2023, 16, 5839. [Google Scholar] [CrossRef]
- Si, S.; Lyu, M.; Lin Lawell, C.-Y.C.; Chen, S. The Effects of Energy-Related Policies on Energy Consumption in China. Energy Econ. 2018, 76, 202–227. [Google Scholar] [CrossRef]
- Li, H.; Zhu, X.; Chen, J.; Jiang, F. Environmental Regulations, Environmental Governance Efficiency and the Green Transformation of China’s Iron and Steel Enterprises. Ecol. Econ. 2019, 165, 106397. [Google Scholar] [CrossRef]
- Shao, S.; Yang, Z.; Yang, L.; Ma, S. Can China’s Energy Intensity Constraint Policy Promote Total Factor Energy Efficiency? Evidence from the Industrial Sector. Energy J. 2019, 40, 101–128. [Google Scholar] [CrossRef]
- Gao, D.; Li, Y.; Li, G. Boosting the Green Total Factor Energy Efficiency in Urban China: Does Low-Carbon City Policy Matter? Environ. Sci. Pollut. Res. 2022, 29, 56341–56356. [Google Scholar] [CrossRef]
- He, Y.; Zhao, X.; Zheng, H. How Does the Environmental Protection Tax Law Affect Firm ESG? Evidence from the Chinese Stock Markets. Energy Econ. 2023, 127, 107067. [Google Scholar] [CrossRef]
- Gao, X.; Liu, N.; Hua, Y. Environmental Protection Tax Law on the Synergy of Pollution Reduction and Carbon Reduction in China: Evidence from a Panel Data of 107 Cities. Sustain. Prod. Consum. 2022, 33, 425–437. [Google Scholar] [CrossRef]
- Li, G.; Gao, D.; Li, Y. Dynamic Environmental Regulation Threshold Effect of Technical Progress on Green Total Factor Energy Efficiency: Evidence from China. Environ. Sci. Pollut. Res. 2021, 29, 8804–8815. [Google Scholar] [CrossRef] [PubMed]
- Liu, Y.; Xiong, R.; Lv, S.; Gao, D. The Impact of Digital Finance on Green Total Factor Energy Efficiency: Evidence at China’s City Level. Energies 2022, 15, 5455. [Google Scholar] [CrossRef]
- Xu, L.; Fan, M.; Yang, L.; Shao, S. Heterogeneous Green Innovations and Carbon Emission Performance: Evidence at China’s City Level. Energy Econ. 2021, 99, 105269. [Google Scholar] [CrossRef]
- Xie, X.; Zhu, Q.; Wang, R. Turning Green Subsidies into Sustainability: How Green Process Innovation Improves Firms’ Green Image. Bus. Strategy Environ. 2019, 28, 1416–1433. [Google Scholar] [CrossRef]
- Du, K.; Li, P.; Yan, Z. Do Green Technology Innovations Contribute to Carbon Dioxide Emission Reduction? Empirical Evidence from Patent Data. Technol. Forecast. Soc. Change 2019, 146, 297–303. [Google Scholar] [CrossRef]
- Xu, X.; Xu, X.; Chen, Q.; Che, Y. The Impact on Regional “Resource Curse” by Coal Resource Tax Reform in China—A Dynamic CGE Appraisal. Resour. Policy 2015, 45, 277–289. [Google Scholar] [CrossRef]
- Gao, D.; Mo, X.; Xiong, R.; Huang, Z. Tax Policy and Total Factor Carbon Emission Efficiency: Evidence from China’s VAT Reform. Int. J. Environ. Res. Public Health 2022, 19, 9257. [Google Scholar] [CrossRef]
- Liu, H.; Li, J.; Long, H.; Li, Z.; Le, C. Promoting Energy and Environmental Efficiency within a Positive Feedback Loop: Insights from Global Value Chain. Energy Policy 2018, 121, 175–184. [Google Scholar] [CrossRef]
- Zhang, Y.; Song, Y.; Zou, H. Transformation of Pollution Control and Green Development: Evidence from China’s Chemical Industry. J. Environ. Manag. 2020, 275, 111246. [Google Scholar] [CrossRef] [PubMed]
- Bertrand, M.; Mullainathan, S. Are Emily and Greg More Employable Than Lakisha and Jamal? A Field Experiment on Labor Market Discrimination. Am. Econ. Rev. 2004, 94, 991–1013. [Google Scholar] [CrossRef]
- Zhao, X.; Mahendru, M.; Ma, X.; Rao, A.; Shang, Y. Impacts of Environmental Regulations on Green Economic Growth in China: New Guidelines Regarding Renewable Energy and Energy Efficiency. Renew. Energy 2022, 187, 728–742. [Google Scholar] [CrossRef]
- Zhou, Q.; Zhang, X.; Shao, Q.; Wang, X. The Non-Linear Effect of Environmental Regulation on Haze Pollution: Empirical Evidence for 277 Chinese Cities during 2002–2010. J. Environ. Manag. 2019, 248, 109274. [Google Scholar] [CrossRef] [PubMed]
- Ouyang, X.; Shao, Q.; Zhu, X.; He, Q.; Xiang, C.; Wei, G. Environmental Regulation, Economic Growth and Air Pollution: Panel Threshold Analysis for OECD Countries. Sci. Total Environ. 2019, 657, 234–241. [Google Scholar] [CrossRef] [PubMed]
- Cole, M.A.; Elliott, R.J.R.; Okubo, T. Trade, Environmental Regulations and Industrial Mobility: An Industry-Level Study of Japan. Ecol. Econ. 2010, 69, 1995–2002. [Google Scholar] [CrossRef]
- Antweiler, W.; Copeland, B.R.; Taylor, M.S. Is Free Trade Good for the Environment? Am. Econ. Rev. 2001, 91, 877–908. [Google Scholar] [CrossRef]
- Ren, S.; Liu, D.; Li, B.; Wang, Y.; Chen, X. Does Emissions Trading Affect Labor Demand? Evidence from the Mining and Manufacturing Industries in China. J. Environ. Manag. 2020, 254, 109789. [Google Scholar] [CrossRef]
- Mi, Z.; Meng, J.; Guan, D.; Shan, Y.; Song, M.; Wei, Y.-M.; Liu, Z.; Hubacek, K. Chinese CO2 Emission Flows Have Reversed since the Global Financial Crisis. Nat. Commun. 2017, 8, 1712. [Google Scholar] [CrossRef]
- Glaeser, E.L.; Kahn, M.E. The Greenness of Cities: Carbon Dioxide Emissions and Urban Development. J. Urban Econ. 2010, 67, 404–418. [Google Scholar] [CrossRef]
- Shi, F.; Liao, X.; Shen, L.; Meng, C.; Lai, Y. Exploring the Spatiotemporal Impacts of Urban Form on CO2 Emissions: Evidence and Implications from 256 Chinese Cities. Environ. Impact Assess. Rev. 2022, 96, 106850. [Google Scholar] [CrossRef]
- Wang, K.; Yu, S.; Zhang, W. China’s Regional Energy and Environmental Efficiency: A DEA Window Analysis Based Dynamic Evaluation. Math. Comput. Model. 2013, 58, 1117–1127. [Google Scholar] [CrossRef]
- Pan, L.; Han, W.; Li, Y.; Wu, H. Legitimacy or Efficiency? Carbon Emissions Transfers under the Pressure of Environmental Law Enforcement. J. Clean. Prod. 2022, 365, 132766. [Google Scholar] [CrossRef]
- Wang, J.; Zhao, T. Regional Energy-Environmental Performance and Investment Strategy for China’s Non-Ferrous Metals Industry: A Non-Radial DEA Based Analysis. J. Clean. Prod. 2017, 163, 187–201. [Google Scholar] [CrossRef]
- Xiong, S.; Ma, X.; Ji, J. The Impact of Industrial Structure Efficiency on Provincial Industrial Energy Efficiency in China. J. Clean. Prod. 2019, 215, 952–962. [Google Scholar] [CrossRef]
- ul Haq, I.; Zhu, S.; Shafiq, M. Empirical Investigation of Environmental Kuznets Curve for Carbon Emission in Morocco. Ecol. Indic. 2016, 67, 491–496. [Google Scholar] [CrossRef]
- Jacobson, L.S.; LaLonde, R.J.; Sullivan, D.G. Earnings Losses of Displaced Workers. Am. Econ. Rev. 1993, 83, 685–709. [Google Scholar]


| Author(s) | Sample | Period | Method | Result |
|---|---|---|---|---|
| Cheng et al. [2] | heavy-polluting firms | 2015–2018 | DID model | EPT policy promotes the green investments of heavy-polluting firms. |
| Long et al. [3] | heavily polluting industries | 2015–2020 | DID model | EPT policy significantly reduces the performance of heavy-polluting companies. |
| He et al. [42] | Listed companies | 2014–2021 | DID model | EPT policy significantly promotes heavy-polluting firms’ ESG performance. |
| Han and Li [5] | 31 provinces in China | 2013–2018 | Bayesian LASSO regression model | EPT policies improve air quality. |
| Li et al. [8] | 30 provinces, 804 plants | July 2017 to December 2019 | DID model | EPT policy significantly reduces emissions of pollutants (including sulfur dioxide (SO2), nitrogen oxide (NOx), and dust) from fossil fuel power plants. |
| Gao et al. [43] | 107 cities | 2015–2019 | DID model | EPT policy accelerates the synergistic reduction of both pollution and carbon reduction. |
| Yang et al. [9] | 281 cities | 2005–2017 | DID-model (Energy efficiency is measured by the ratio of the GDP of a city to the energy consumption of the city. | The construction of innovative cities boosts urban energy efficiency. |
| Li et al. [44] | 271 cities | 2004 to 2016 | dynamic panel threshold model (undesirable SBM model) | Technical innovation has a positive effect on urban energy efficiency. |
| Liu et al. [45] | 1370 observations at city level | 2011 to 2018 | dynamic panel data models (undesirable SBM model) | Digital finance can improve urban energy efficiency. |
| Gao et al. [41] | 277 cities | 2006 to 2019 | DID model (undesirable SBM model) | Low-carbon city policies (LCCP) boost urban energy efficiency. |
| Time | Relevant Events |
|---|---|
| 2 May 1982 | The State Council enacted the “Provisional Measures for the Collection of Pollutant Discharge Fees” on 1 July 1982. |
| 15 August 1993 | The State Planning Commission and the Ministry of Finance issued the “Notice on Collection of Sewage Discharge Fees.” |
| 2 January 2003 | The State Council enacted the “Regulations on the Administration of Collection and Use of Pollutant Discharge Fees” on 1 July 2003. |
| 1 September 2014 | The “Notice on Adjusting the Collection Standards of Pollutant Discharge Fees and Other Relevant Issues” has been released. |
| 9–12 November 2013 | The Third Plenary Session of the 18th Central Committee decided to promote the reform of changing pollutant discharge fees to taxes. |
| 13 November 2014 | The “Environmental Protection Tax Law of the People’s Republic of China” (draft) is submitted to the State Council. |
| 10 June 2015 | The Legislative Affairs Office of the State Council issued and published the “Environmental Protection Tax Law of the People’s Republic of China” (Call for Opinions) and the explanations to the public. |
| 5 August 2015 | The Environmental Protection Tax Law was added to the legislative plan of the 12th National People’s Congress Standing Committee. |
| 29 August–3 September 2016 | The 20th meeting of the 12th National People’s Congress Standing Committee reviews the EPT policy draft for the first time. |
| 25 December 2016 | The EPT policy was passed. |
| 1 January 2018 | The EPT policy was formally implemented. |
| Ch | Sample Size | Mean | Standard Deviation | Minimum | Maximum |
|---|---|---|---|---|---|
| K (108 RMB) | 2502 | 1853.783 | 1942.934 | 35.62 | 24,844.25 |
| L (104 persons) | 2502 | 122.986 | 173.345 | 8.508 | 1729.071 |
| E (104 tce) | 2502 | 184.868 | 338.482 | 3.63 | 4067.33 |
| Q (108 RMB) | 2502 | 2518.183 | 3626.195 | 222.42 | 65,858.27 |
| C (104 tons) | 2502 | 1132.108 | 1632.306 | 15.58 | 14,812.43 |
| Variable | Sample Size | Unit | Data Source | Mean | Standard Deviation | Minimum | Maximum |
|---|---|---|---|---|---|---|---|
| UEI | 2502 | — | CCSY; CSY NBSC; CESY | 0.305 | 0.134 | 0.108 | 1 |
| treat | 2502 | — | — | 0.237 | 0.426 | 0 | 1 |
| time | 2502 | — | — | 0.333 | 0.471 | 0 | 1 |
| lnregulation | 2502 | — | CCSY; CSYE | 3.216 | 1.018 | 0.851 | 8.204 |
| lnGDPper | 2502 | RMB/person | CCSY NBSC | 10.697 | 0.57 | 9.091 | 12.503 |
| lnFDI | 2502 | 104 dollars | CCSY | 9.974 | 1.695 | 4.511 | 14.212 |
| lnexport | 2502 | 104 RMB | CCSY; CSYRE | 6.78 | 1.101 | 0.693 | 7.816 |
| lntertind | 2502 | — | CCSY NBSC | 0.348 | 0.089 | 0.052 | 1.644 |
| lnfreight | 2476 | 104 tons | CCSY CUCSY | 9.015 | 1.063 | 0 | 13.225 |
| lnpatent | 2502 | — | SIPO | 4.343 | 1.723 | 0 | 10.182 |
| Variable | Tobit | |
|---|---|---|
| (1) | (2) | |
| 0.0519 *** | 0.0521 *** | |
| (0.00871) | (0.00876) | |
| 0.182 *** | 0.0375 | |
| (0.0413) | (0.0601) | |
| −0.0454 *** | −0.139 *** | |
| (0.00769) | (0.0214) | |
| lnRegulation | 0.00319 | |
| (0.00517) | ||
| lnGDPper | 0.160 *** | |
| (0.0382) | ||
| ln FDI | −0.00273 | |
| (0.0191) | ||
| ln export | −0.00429 * | |
| (0.00239) | ||
| Intertind | 0.0792 ** | |
| (0.0329) | ||
| Infreight | −0.0100 *** | |
| (0.00264) | ||
| Constant | 0.237 *** | −1.268 *** |
| (0.0296) | (0.361) | |
| Year fixed effect | yes | yes |
| City fixed effect | yes | yes |
| Observations | 2502 | 2476 |
| Variables | Coefficient | Variables | Coefficient |
|---|---|---|---|
| 0.0572 | lnregulation | 0.00470 | |
| (0.0608) | (0.00515) | ||
| 0.0527 | lnGDPper | 0.150 *** | |
| (0.0606) | (0.0381) | ||
| 0.0533 | lnFDI | −0.00917 | |
| (0.0605) | (0.0189) | ||
| 0.0497 | lnexport | −0.00402 * | |
| (0.0604) | (0.00238) | ||
| 0.0440 | lntertind | 0.0669 ** | |
| (0.0601) | (0.0328) | ||
| 0.0409 | Constant | −1.197 *** | |
| (0.0603) | (0.354) | ||
| 0.0896 | Year-fixed effect | yes | |
| (0.0600) | City-fixed effect | yes | |
| 0.117 * | Observations | 2502 | |
| (0.0602) | |||
| 0.103 * | |||
| (0.0600) |
| Variable | (1) | (2) |
|---|---|---|
| 0.0404 *** | 0.0422 *** | |
| (0.00920) | (0.00928) | |
| 0.186 *** | 0.0320 | |
| (0.0413) | (0.0607) | |
| −0.0374 *** | −0.141 *** | |
| (0.00827) | (0.0224) | |
| LnRegulation | 0.00346 | |
| (0.00552) | ||
| LnGDPper | 0.158 *** | |
| (0.0383) | ||
| In FDI | −0.00323 | |
| (0.0191) | ||
| In export | −0.00551 ** | |
| (0.00249) | ||
| Intertind | 0.169 *** | |
| (0.0545) | ||
| Infreight | −0.00833 *** | |
| (0.00268) | ||
| Constant | 0.232 *** | −1.274 *** |
| (0.0296) | (0.362) | |
| Year-fixed effect | yes | yes |
| City-fixed effect | yes | yes |
| Observations | 2178 | 2153 |
| Variables | (1) | (2) | (3) | (4) |
|---|---|---|---|---|
| Non-resource-based cities | Resource-based cities | High economic level | Low economic level | |
| 0.0821 *** | 0.00170 | 0.0401 *** | −0.000101 | |
| (0.0104) | (0.0150) | (0.0128) | (0.0152) | |
| −0.104 | 0.272 ** | −0.254 | −0.262 * | |
| (0.135) | (0.129) | (0.322) | (0.138) | |
| −0.209 *** | 0.100 ** | 0.0329 | −0.0894 *** | |
| (0.0226) | (0.0500) | (0.106) | (0.0316) | |
| LnRegulation | −0.00362 | 0.00953 | −0.00654 | 0.0106 * |
| (0.00594) | (0.00936) | (0.00989) | (0.00616) | |
| lnGDPper | 0.276 *** | −0.277 *** | −0.0753 | −0.0343 |
| (0.0395) | (0.0922) | (0.213) | (0.0588) | |
| lnFDI | −0.0295 | 0.110** | 0.135 | 0.0347 * |
| (0.0192) | (0.0527) | (0.107) | (0.0202) | |
| lnexport | −0.000291 | −0.00620 * | −0.00372 | −0.00210 |
| (0.00329) | (0.00347) | (0.00459) | (0.00261) | |
| lntertind | 0.0377 | 0.135 * | 0.143 * | 0.0731 ** |
| (0.0354) | (0.0698) | (0.0790) | (0.0335) | |
| lnfreight | −0.0145 *** | −0.00434 | −0.00929 ** | −0.0115 *** |
| (0.00423) | (0.00354) | (0.00451) | (0.00316) | |
| Constant | −2.037 *** | 1.981 ** | 0.000858 | 0.437 |
| (0.351) | (0.941) | (2.069) | (0.522) | |
| Year-fixed effect | yes | yes | yes | yes |
| City-fixed effect | yes | yes | yes | yes |
| Observations | 1514 | 962 | 910 | 1566 |
| Variable | (1) | (2) | (3) |
|---|---|---|---|
| 0.0236 *** | |||
| (0.00472) | |||
| 0.817 *** | |||
| (0.126) | |||
| 0.0296 *** | |||
| (0.00458) | |||
| −0.0975 *** | −0.281 *** | −0.282 *** | |
| (0.0306) | (0.0520) | (0.0524) | |
| 0.0744 | 0.0371 | 0.0348 | |
| (0.0593) | (0.0596) | (0.0596) | |
| −0.0968 *** | −0.139 *** | −0.141 *** | |
| (0.0219) | (0.0212) | (0.0212) | |
| lnpatent | −0.0319 *** | ||
| (0.00427) | |||
| lnregulation | 0.00279 | 0.00321 | 0.00391 |
| (0.00509) | (0.00513) | (0.00513) | |
| lnGDPper | 0.183 *** | 0.159 *** | 0.160 *** |
| (0.0377) | (0.0379) | (0.0379) | |
| lnFDI | −0.00847 | −0.00254 | −0.00269 |
| (0.0188) | (0.0189) | (0.0189) | |
| lnexport | −0.00413 * | −0.00380 | −0.00400 * |
| (0.00235) | (0.00237) | (0.00237) | |
| lntertind | 0.0711 ** | 0.0720 ** | 0.0883 *** |
| (0.0325) | (0.0326) | (0.0327) | |
| lnfreight | −0.00944 *** | −0.00993 *** | −0.0109 *** |
| (0.00260) | (0.00261) | (0.00262) | |
| Constant | −1.364 *** | −1.269 *** | −1.273 *** |
| (0.355) | (0.358) | (0.358) | |
| Year-fixed effect | yes | yes | yes |
| City-fixed effect | yes | yes | yes |
| Observations | 2476 | 2476 | 2476 |
Disclaimer/Publisher’s Note: The statements, opinions and data contained in all publications are solely those of the individual author(s) and contributor(s) and not of MDPI and/or the editor(s). MDPI and/or the editor(s) disclaim responsibility for any injury to people or property resulting from any ideas, methods, instructions or products referred to in the content. |
© 2023 by the authors. Licensee MDPI, Basel, Switzerland. This article is an open access article distributed under the terms and conditions of the Creative Commons Attribution (CC BY) license (https://creativecommons.org/licenses/by/4.0/).
Share and Cite
Qi, J.; Song, Y.; Zhang, Y. Environmental Protection Tax and Energy Efficiency: Evidence from Chinese City-Level Data. Energies 2023, 16, 8104. https://doi.org/10.3390/en16248104
Qi J, Song Y, Zhang Y. Environmental Protection Tax and Energy Efficiency: Evidence from Chinese City-Level Data. Energies. 2023; 16(24):8104. https://doi.org/10.3390/en16248104
Chicago/Turabian StyleQi, Junmei, Yi Song, and Yijun Zhang. 2023. "Environmental Protection Tax and Energy Efficiency: Evidence from Chinese City-Level Data" Energies 16, no. 24: 8104. https://doi.org/10.3390/en16248104