
An Analysis of National Position, Opportunity, and Challenge of Indonesia’s Nuclear Program to Support Net-Zero Emissions by 2060
 , ,
, ,
Abstract
:1. Introduction
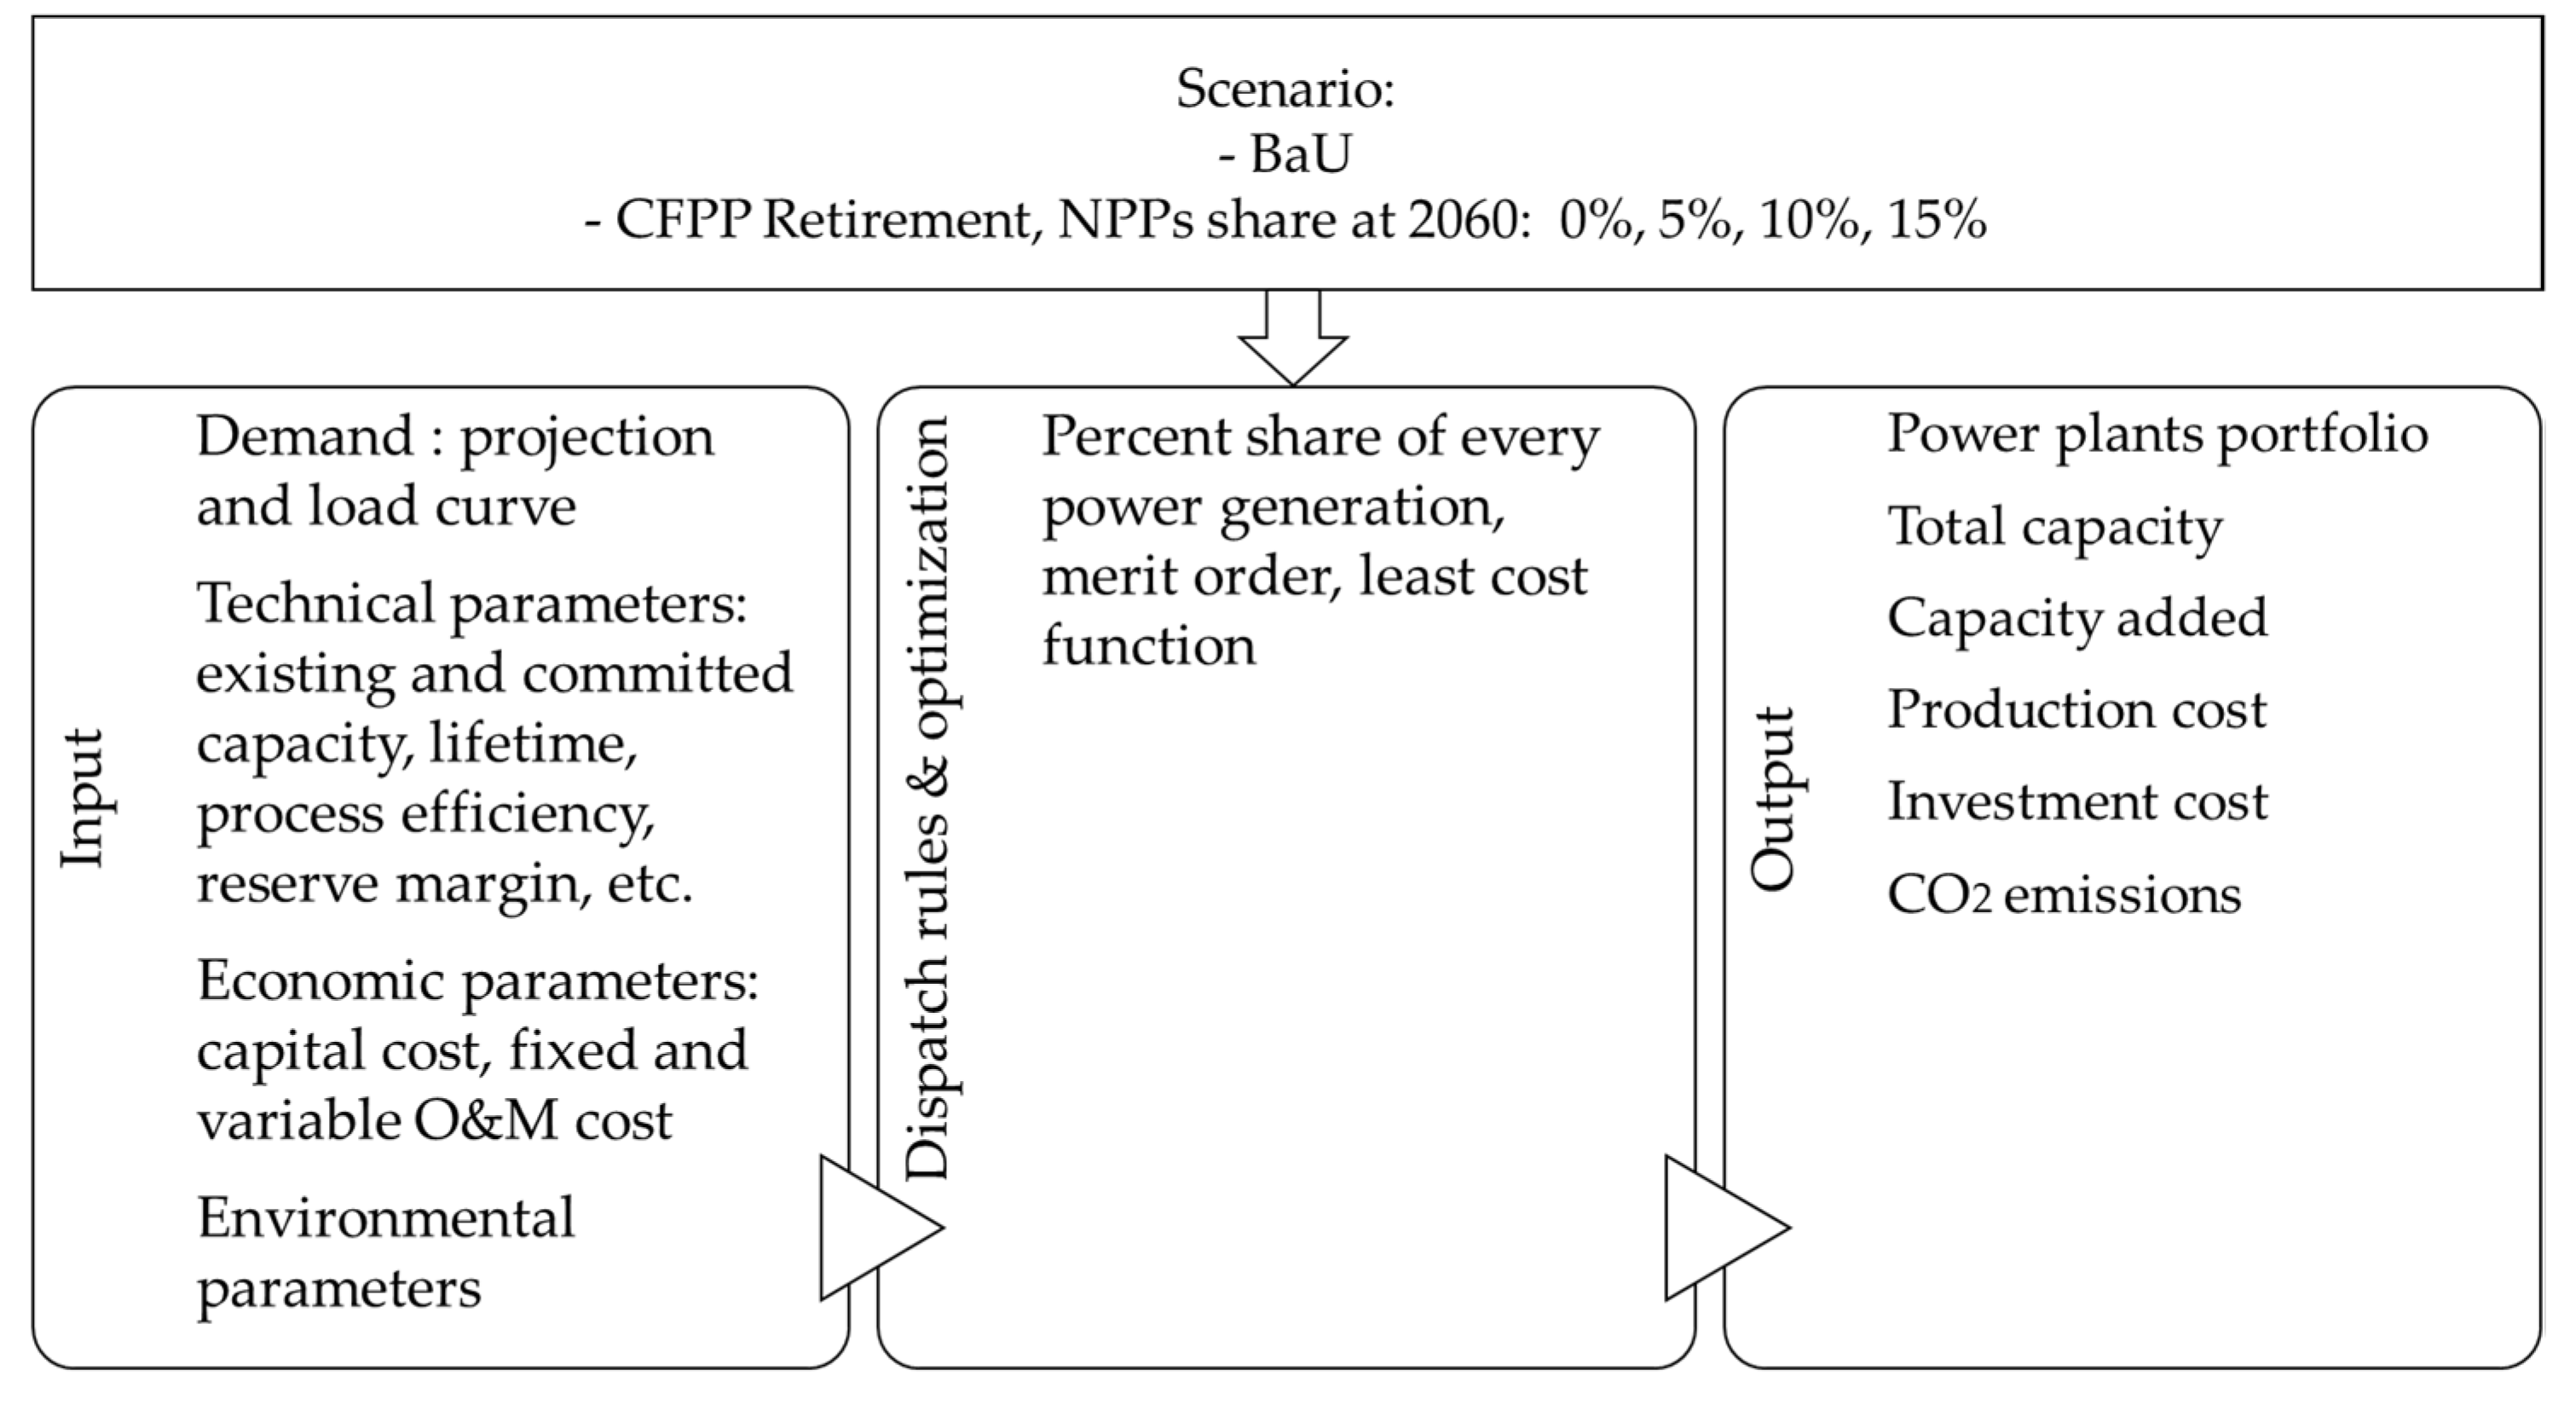
2. Materials and Methods
3. Nuclear Technology and IAEA’s Guideline for NPP Development
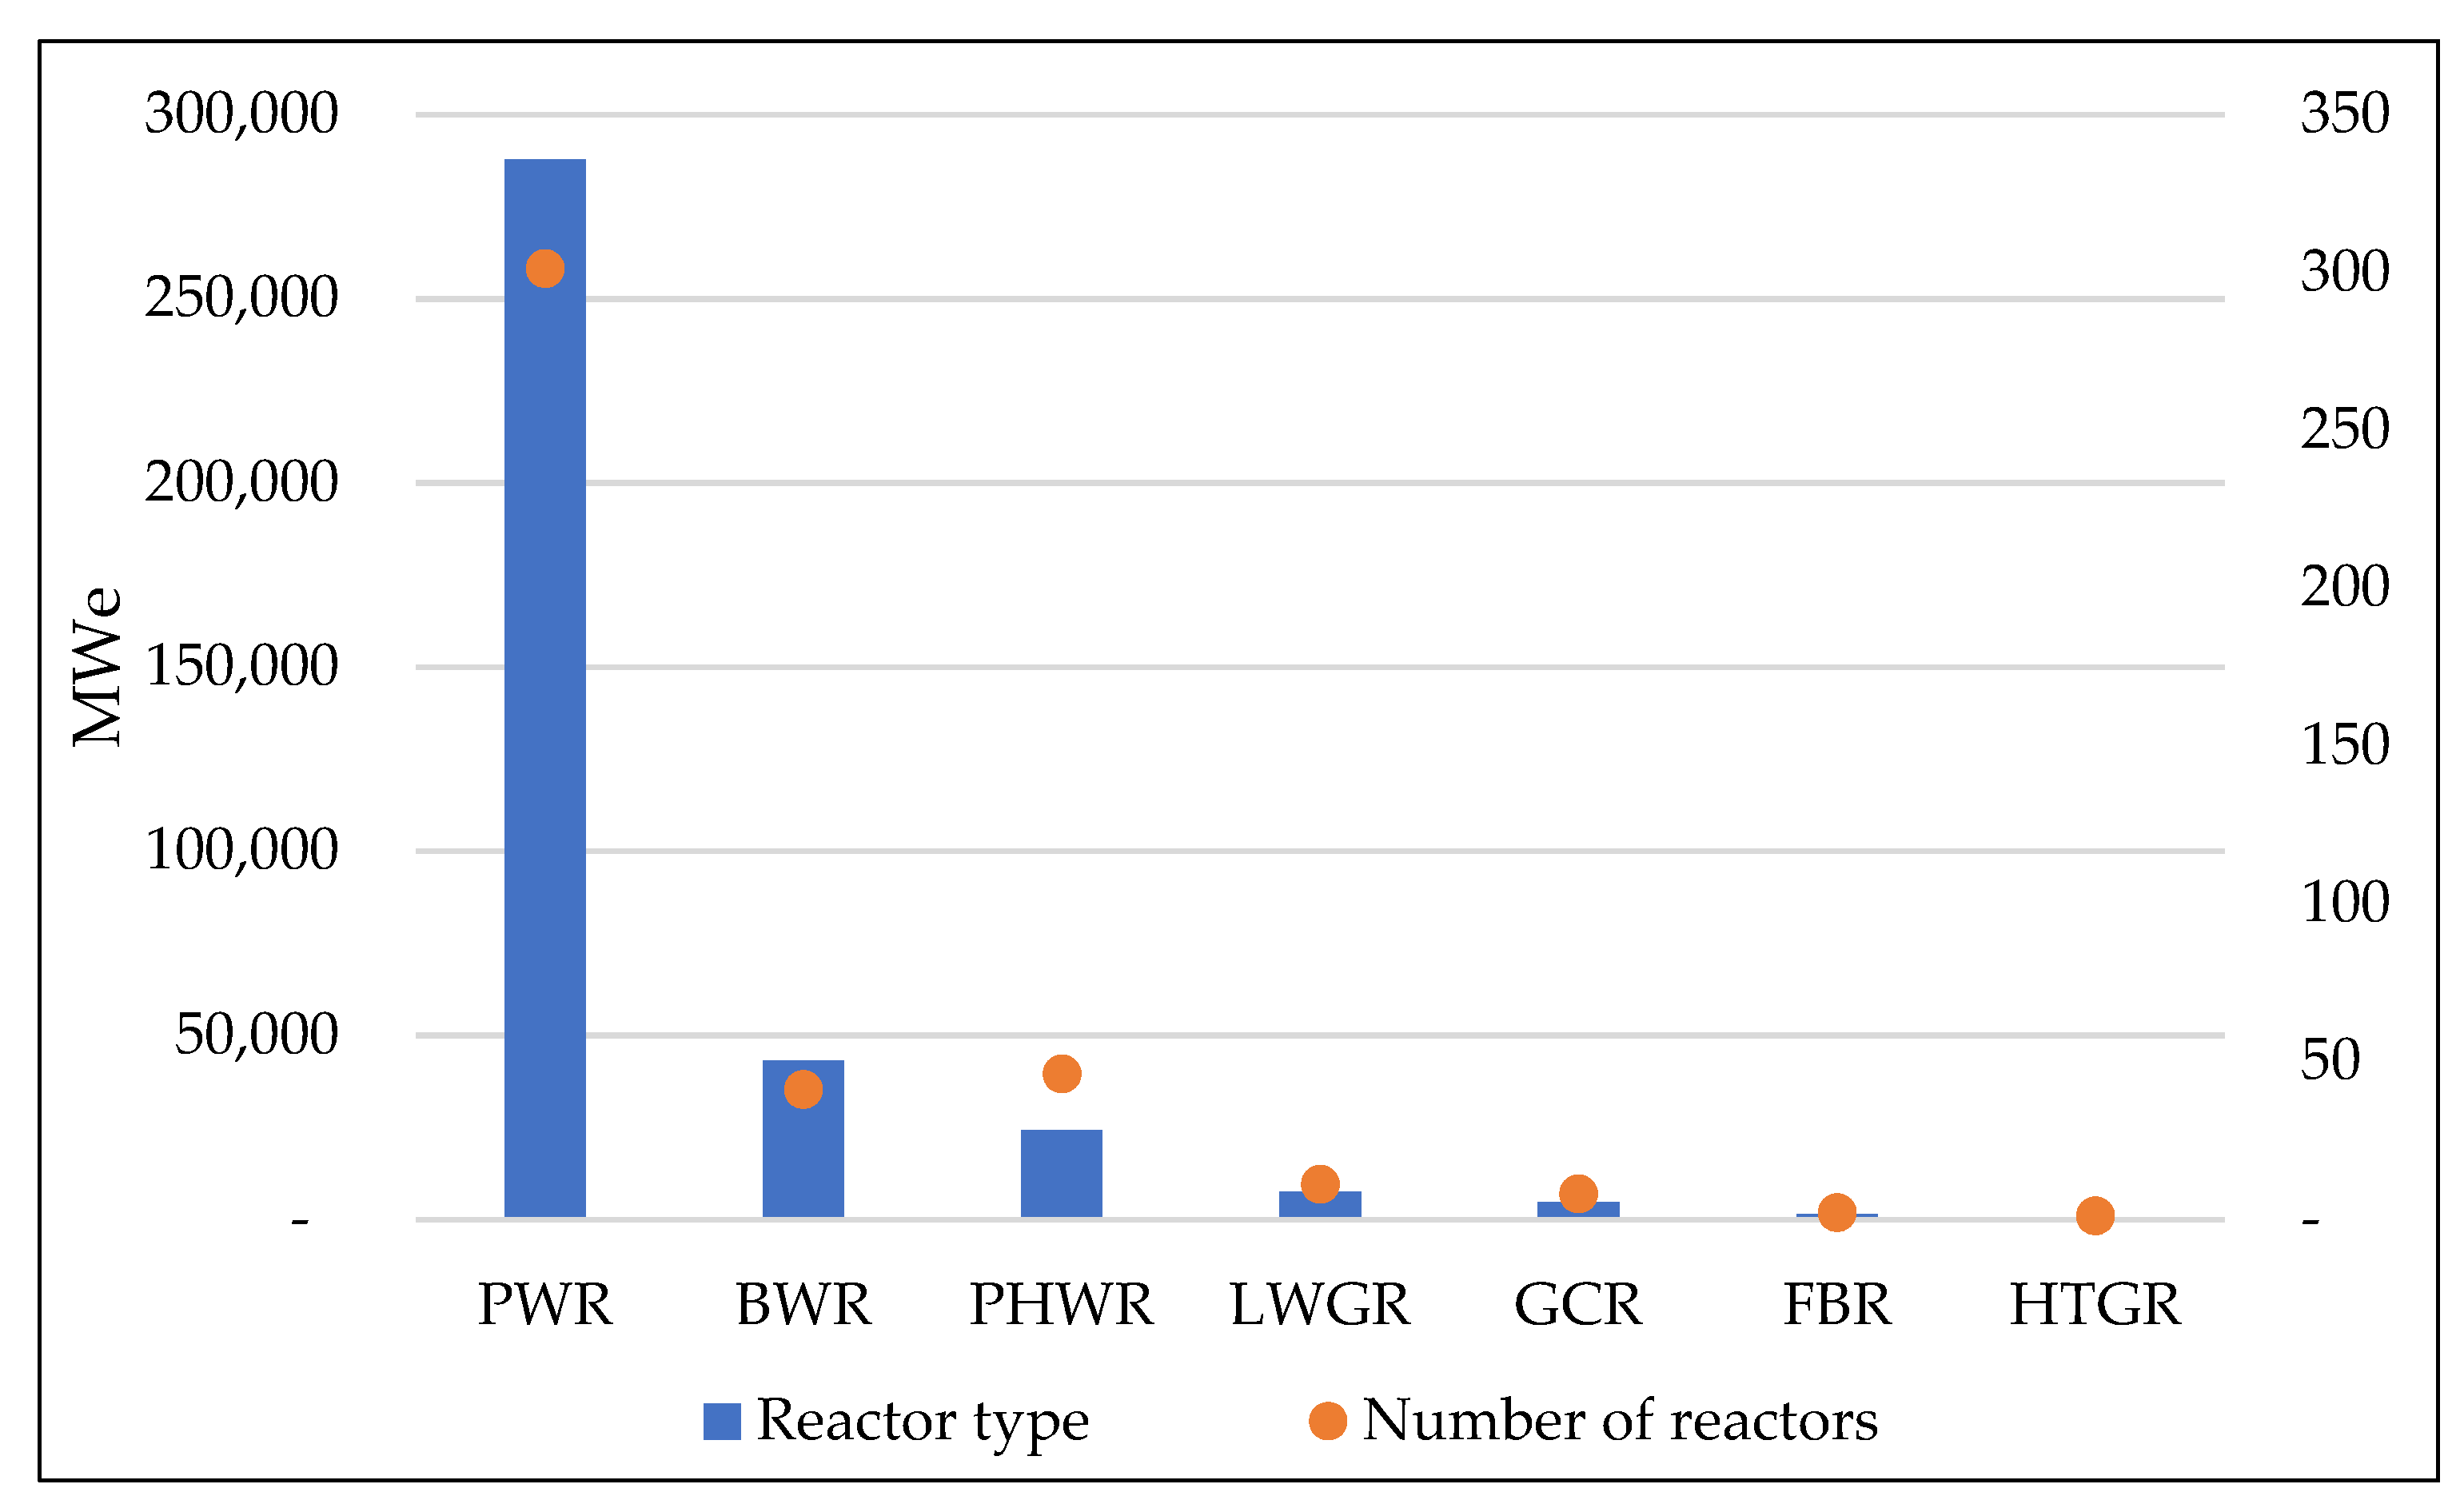
3.1. Nuclear Power Plant (NPP) Technology Overview
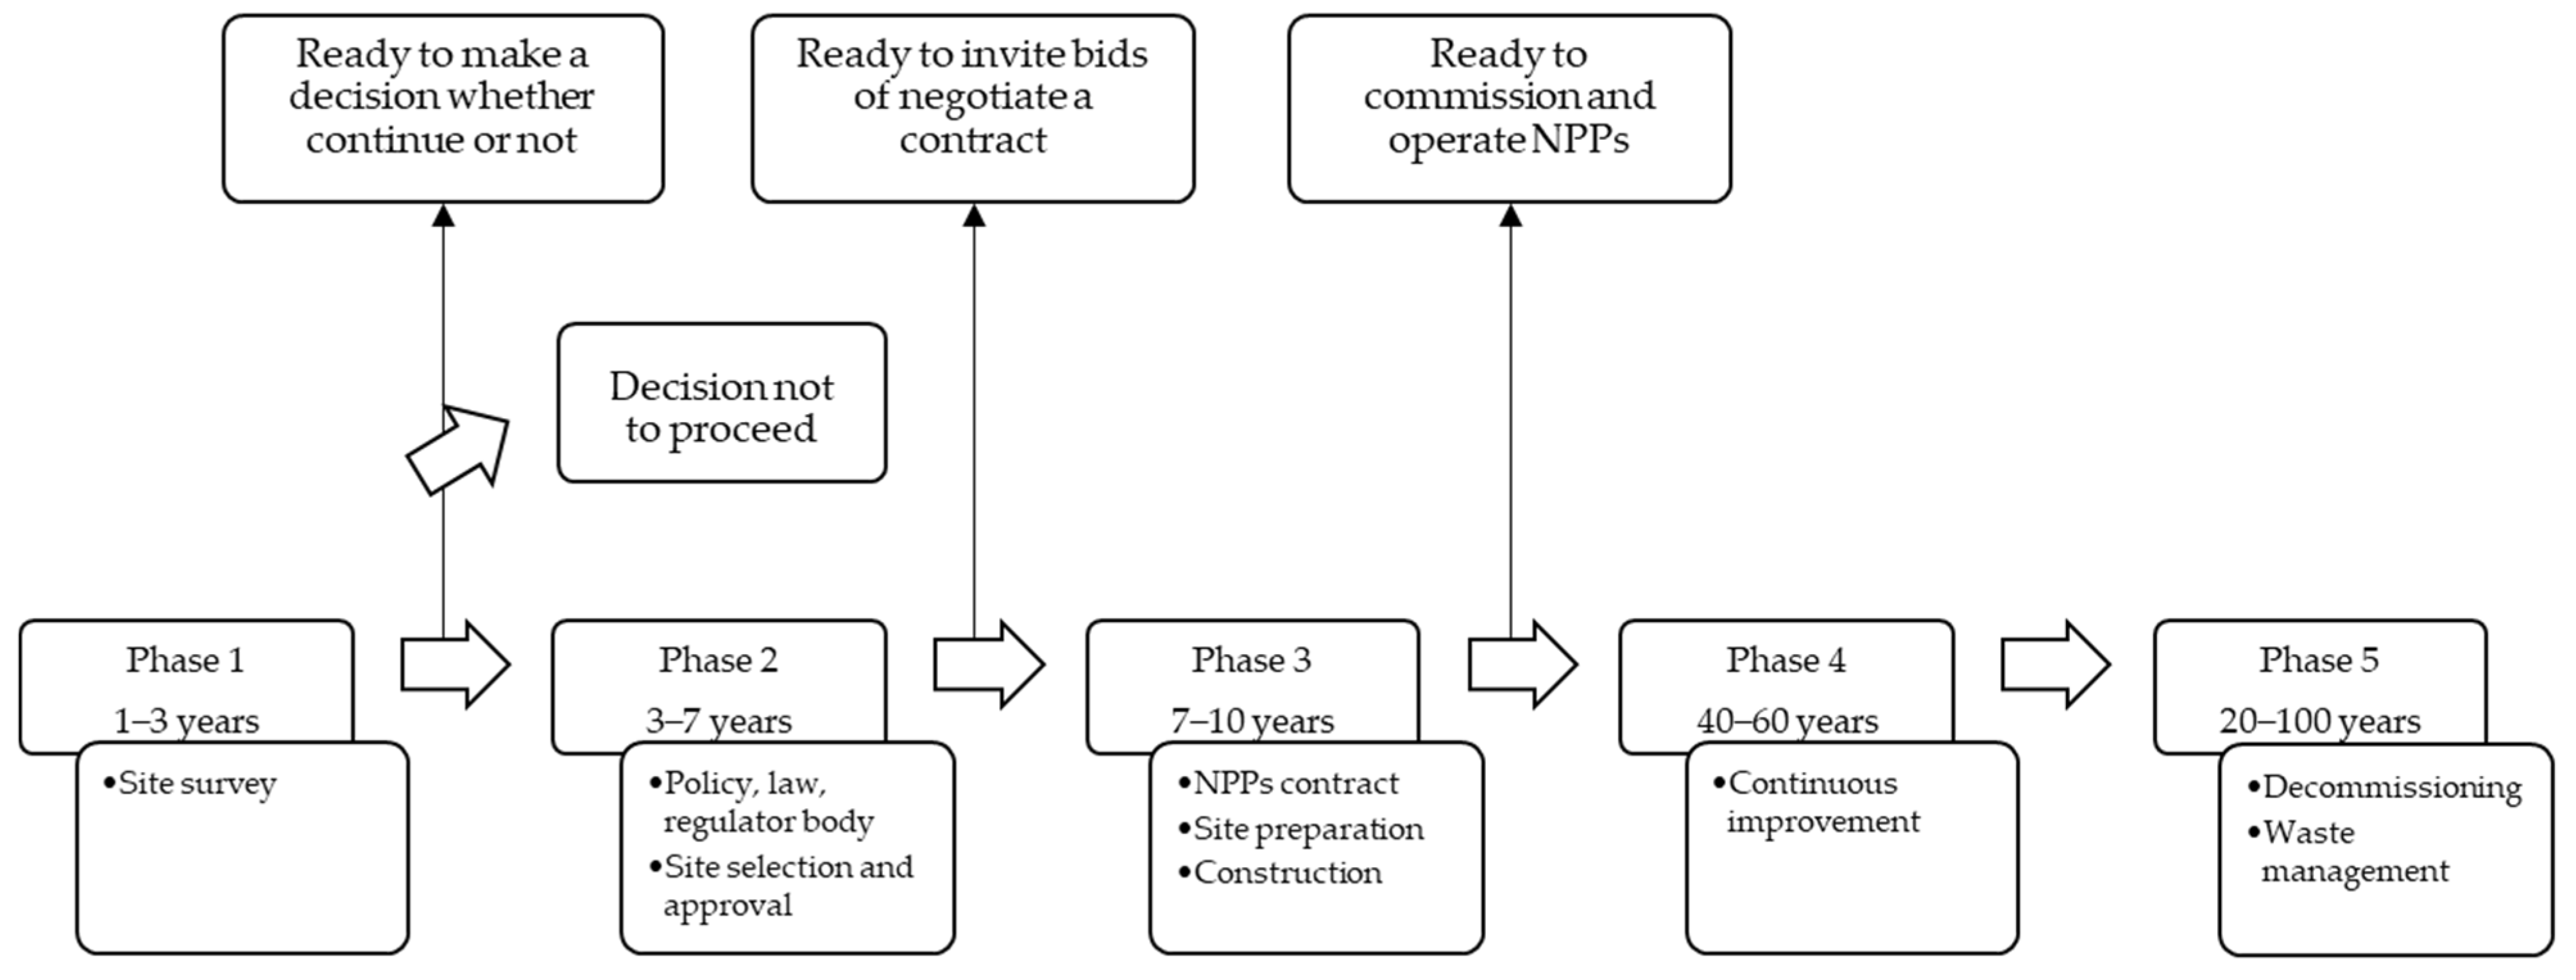
3.2. IAEA Guideline for NPP Program
- Phase 1 comprises security infrastructure considerations to address before making a decision to launch a nuclear power program. This phase is the basis for the nuclear program to operate safely and sustainably through the creation of a legal basis, a nuclear program management agency, and policies on the use of nuclear power. After the reflection period, political decision-makers can decide whether to continue the nuclear program (towards phase 2).
- Phase 2 involves the preparation of the security infrastructure for the construction of a nuclear power plant after a political decision has been made. This step ensures the safe construction and operation of nuclear power plants in the future. Site assessment and security analysis are conducted in depth.
- In phase 3, safety infrastructure activities to deploy the first nuclear power plant are implemented to ensure the nuclear power plant can operate safely.
- In phase 4, safety infrastructure during the operational phase of a nuclear power plant can be achieved through continuous improvement in various aspects, both regulatory and operational.
- In phase 5, safety infrastructure during the decommissioning and waste management phases of a nuclear power plant is in place to ensure that these phases are safe and do not pose a threat to the environment.
4. Results and Discussion
4.1. Analysis of National Position
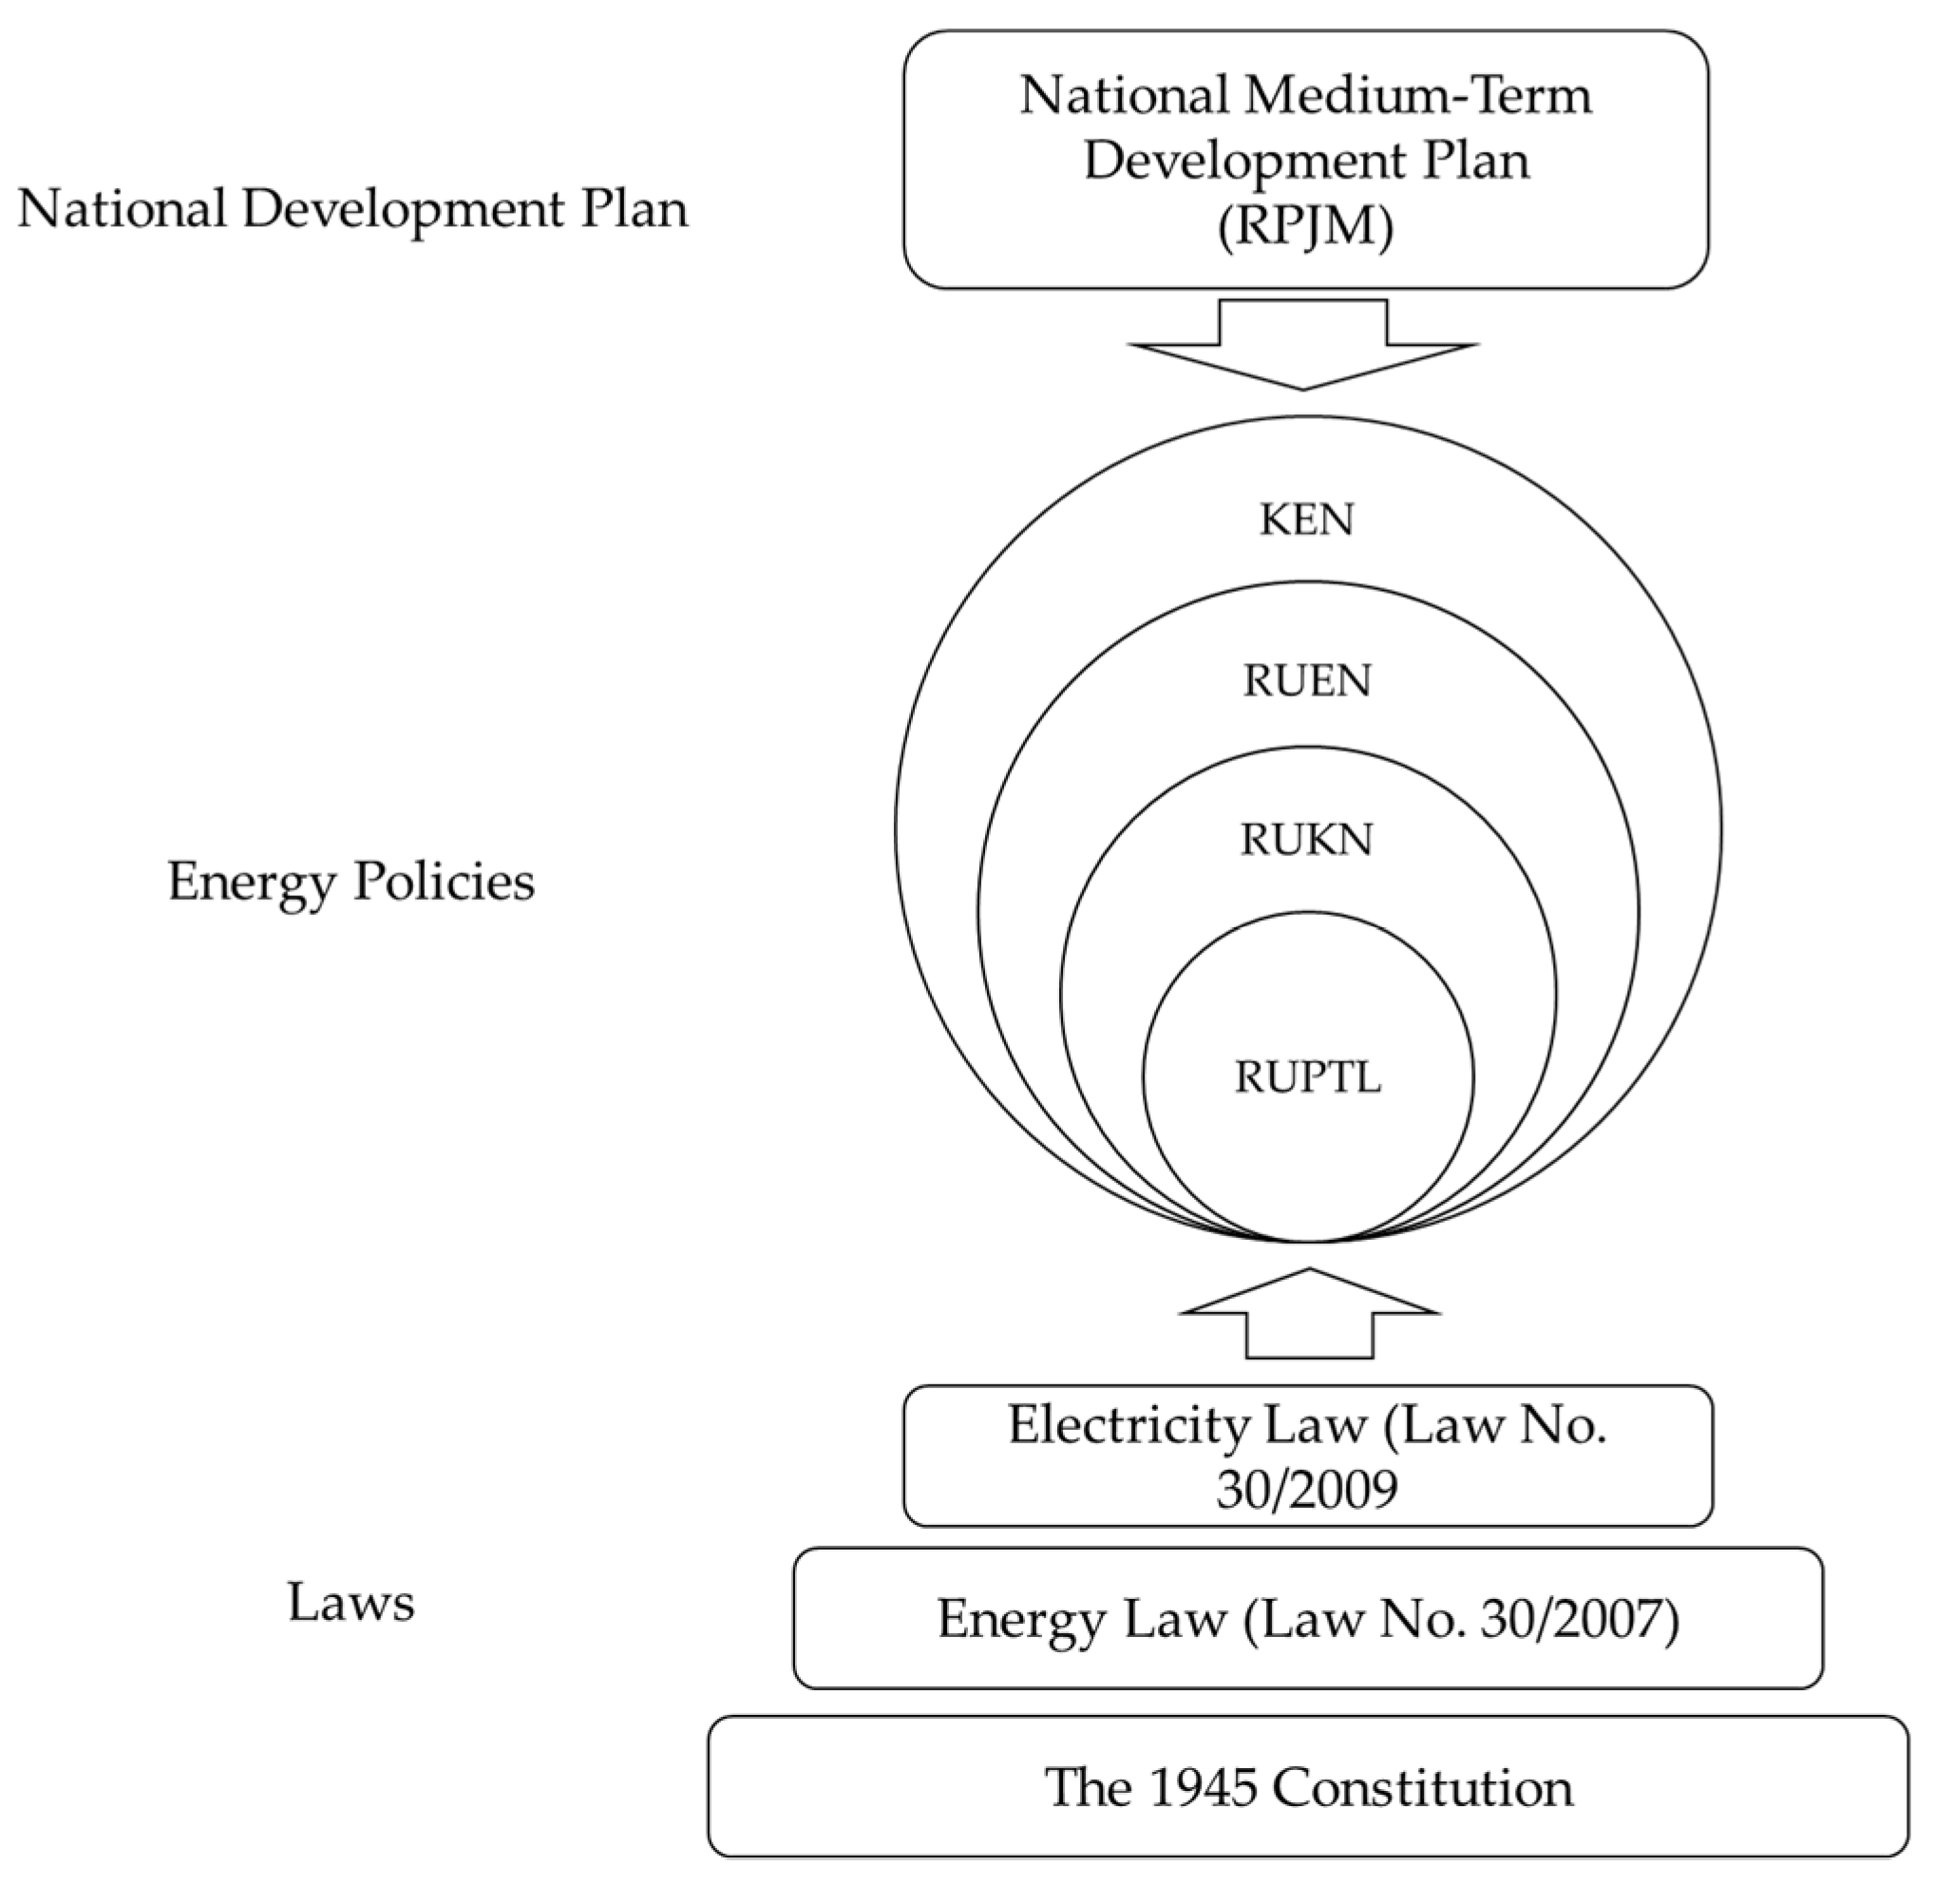
4.1.1. National Energy Policy
- The development of a commercial nuclear reactor is decided by the government after consulting with the Council of Representatives of the People’s Republic of Indonesia (DPR RI) [83].
- Nuclear energy is the last resort, taking into account strict safety [33].
- Operators of nuclear facilities must pay attention to safety and the risk of accidents and must compensate third parties for damage caused by nuclear accidents [33].
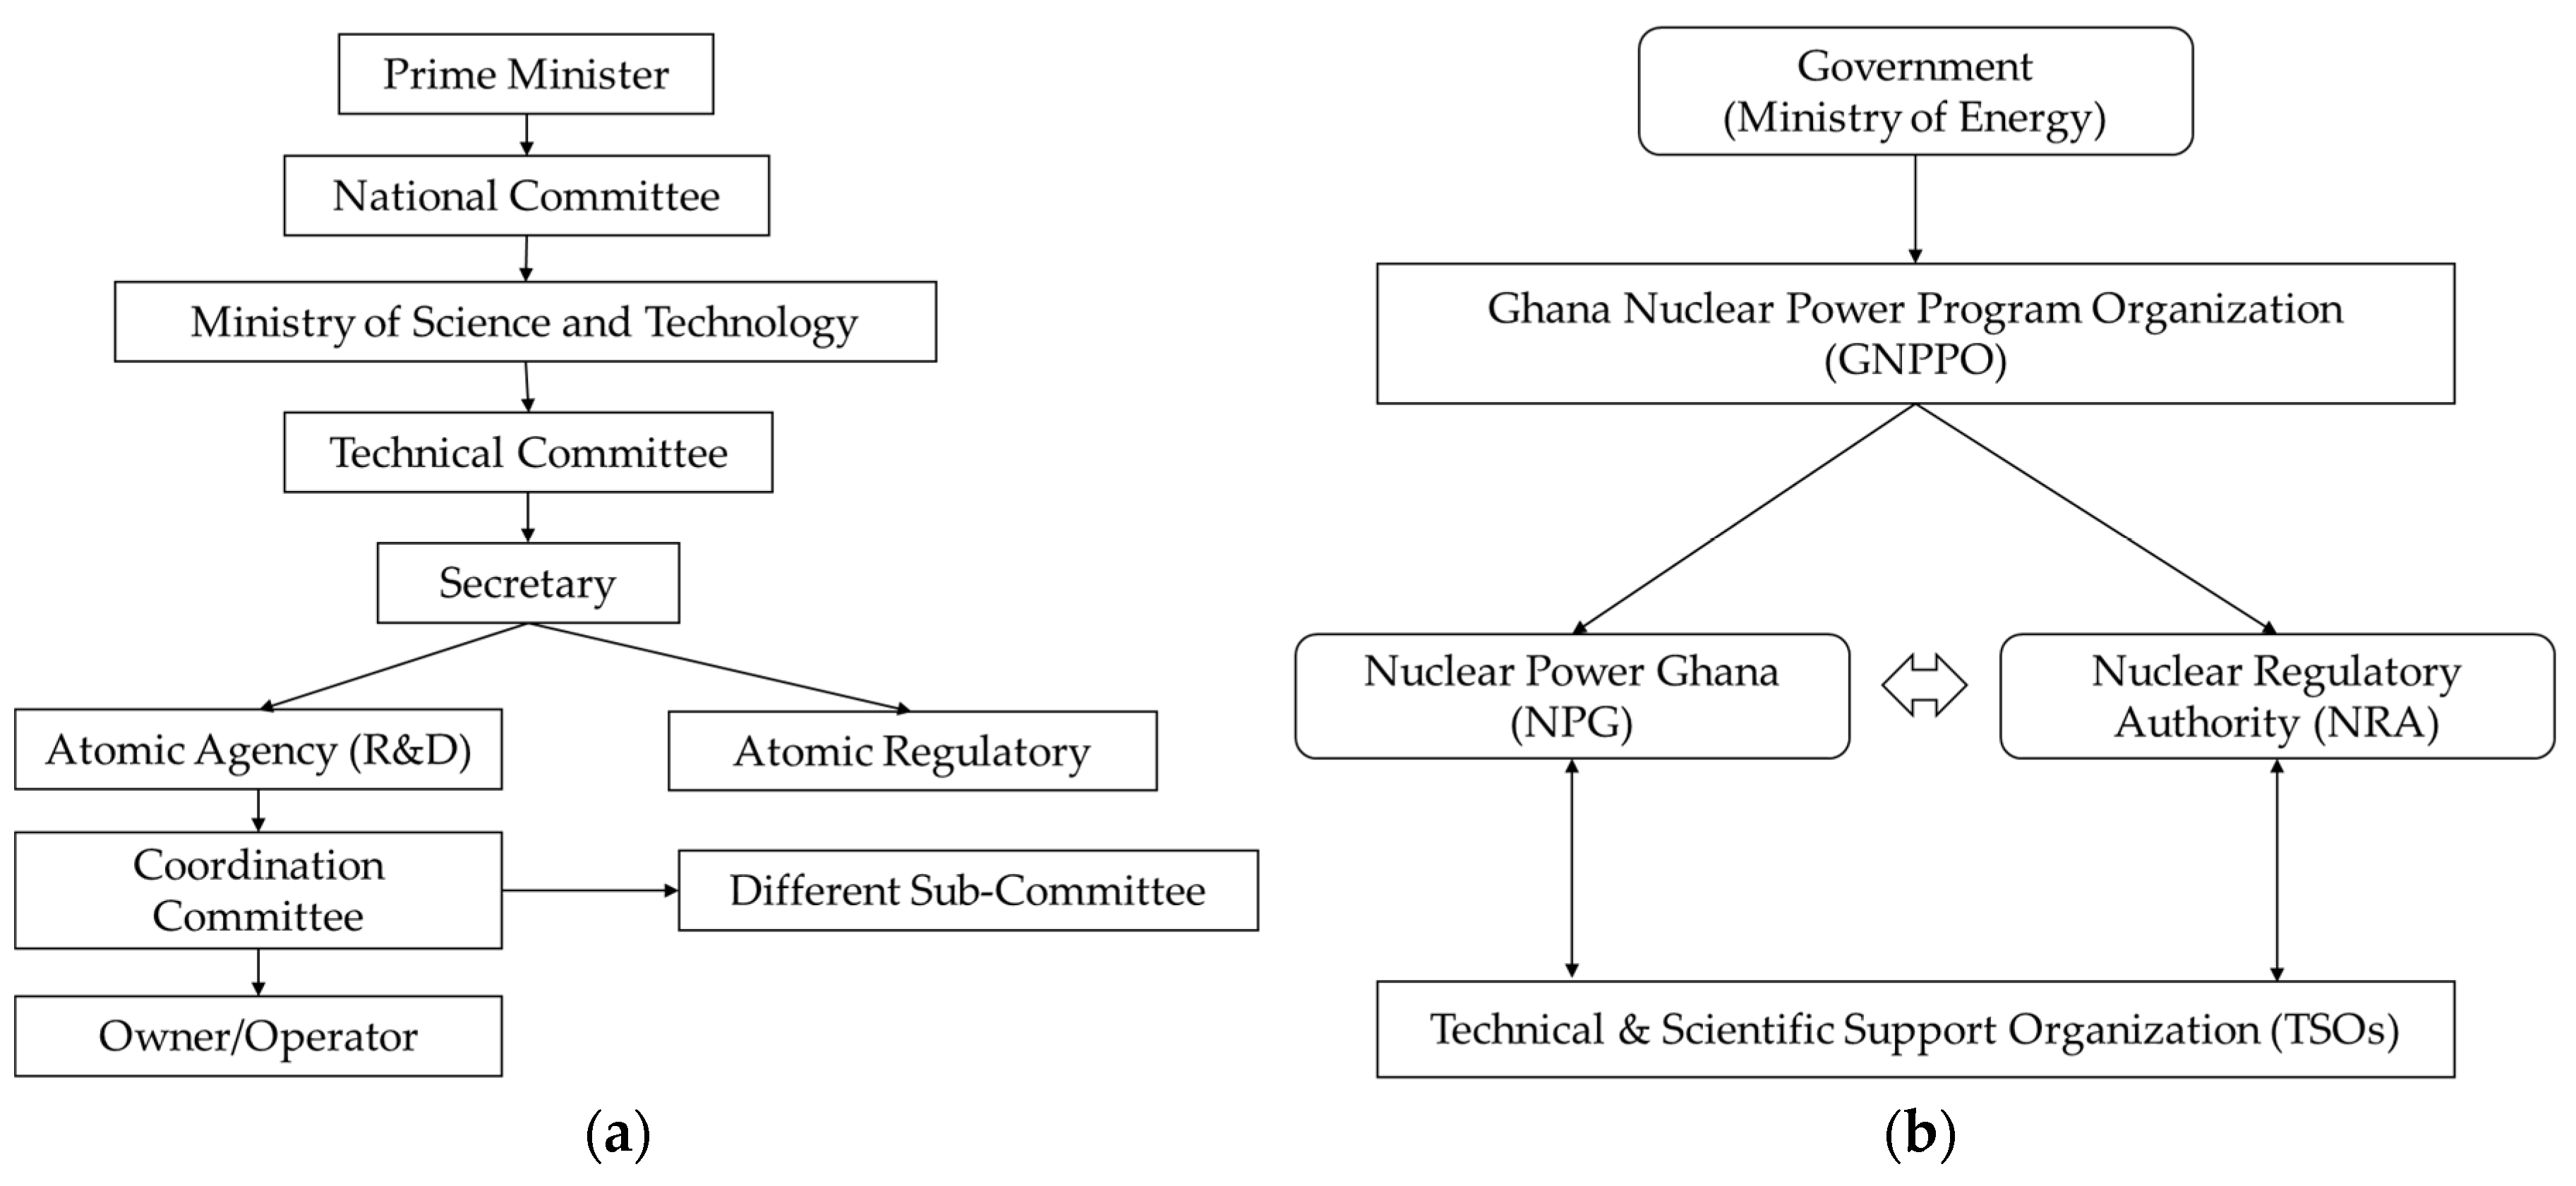
4.1.2. The NEPIO Established
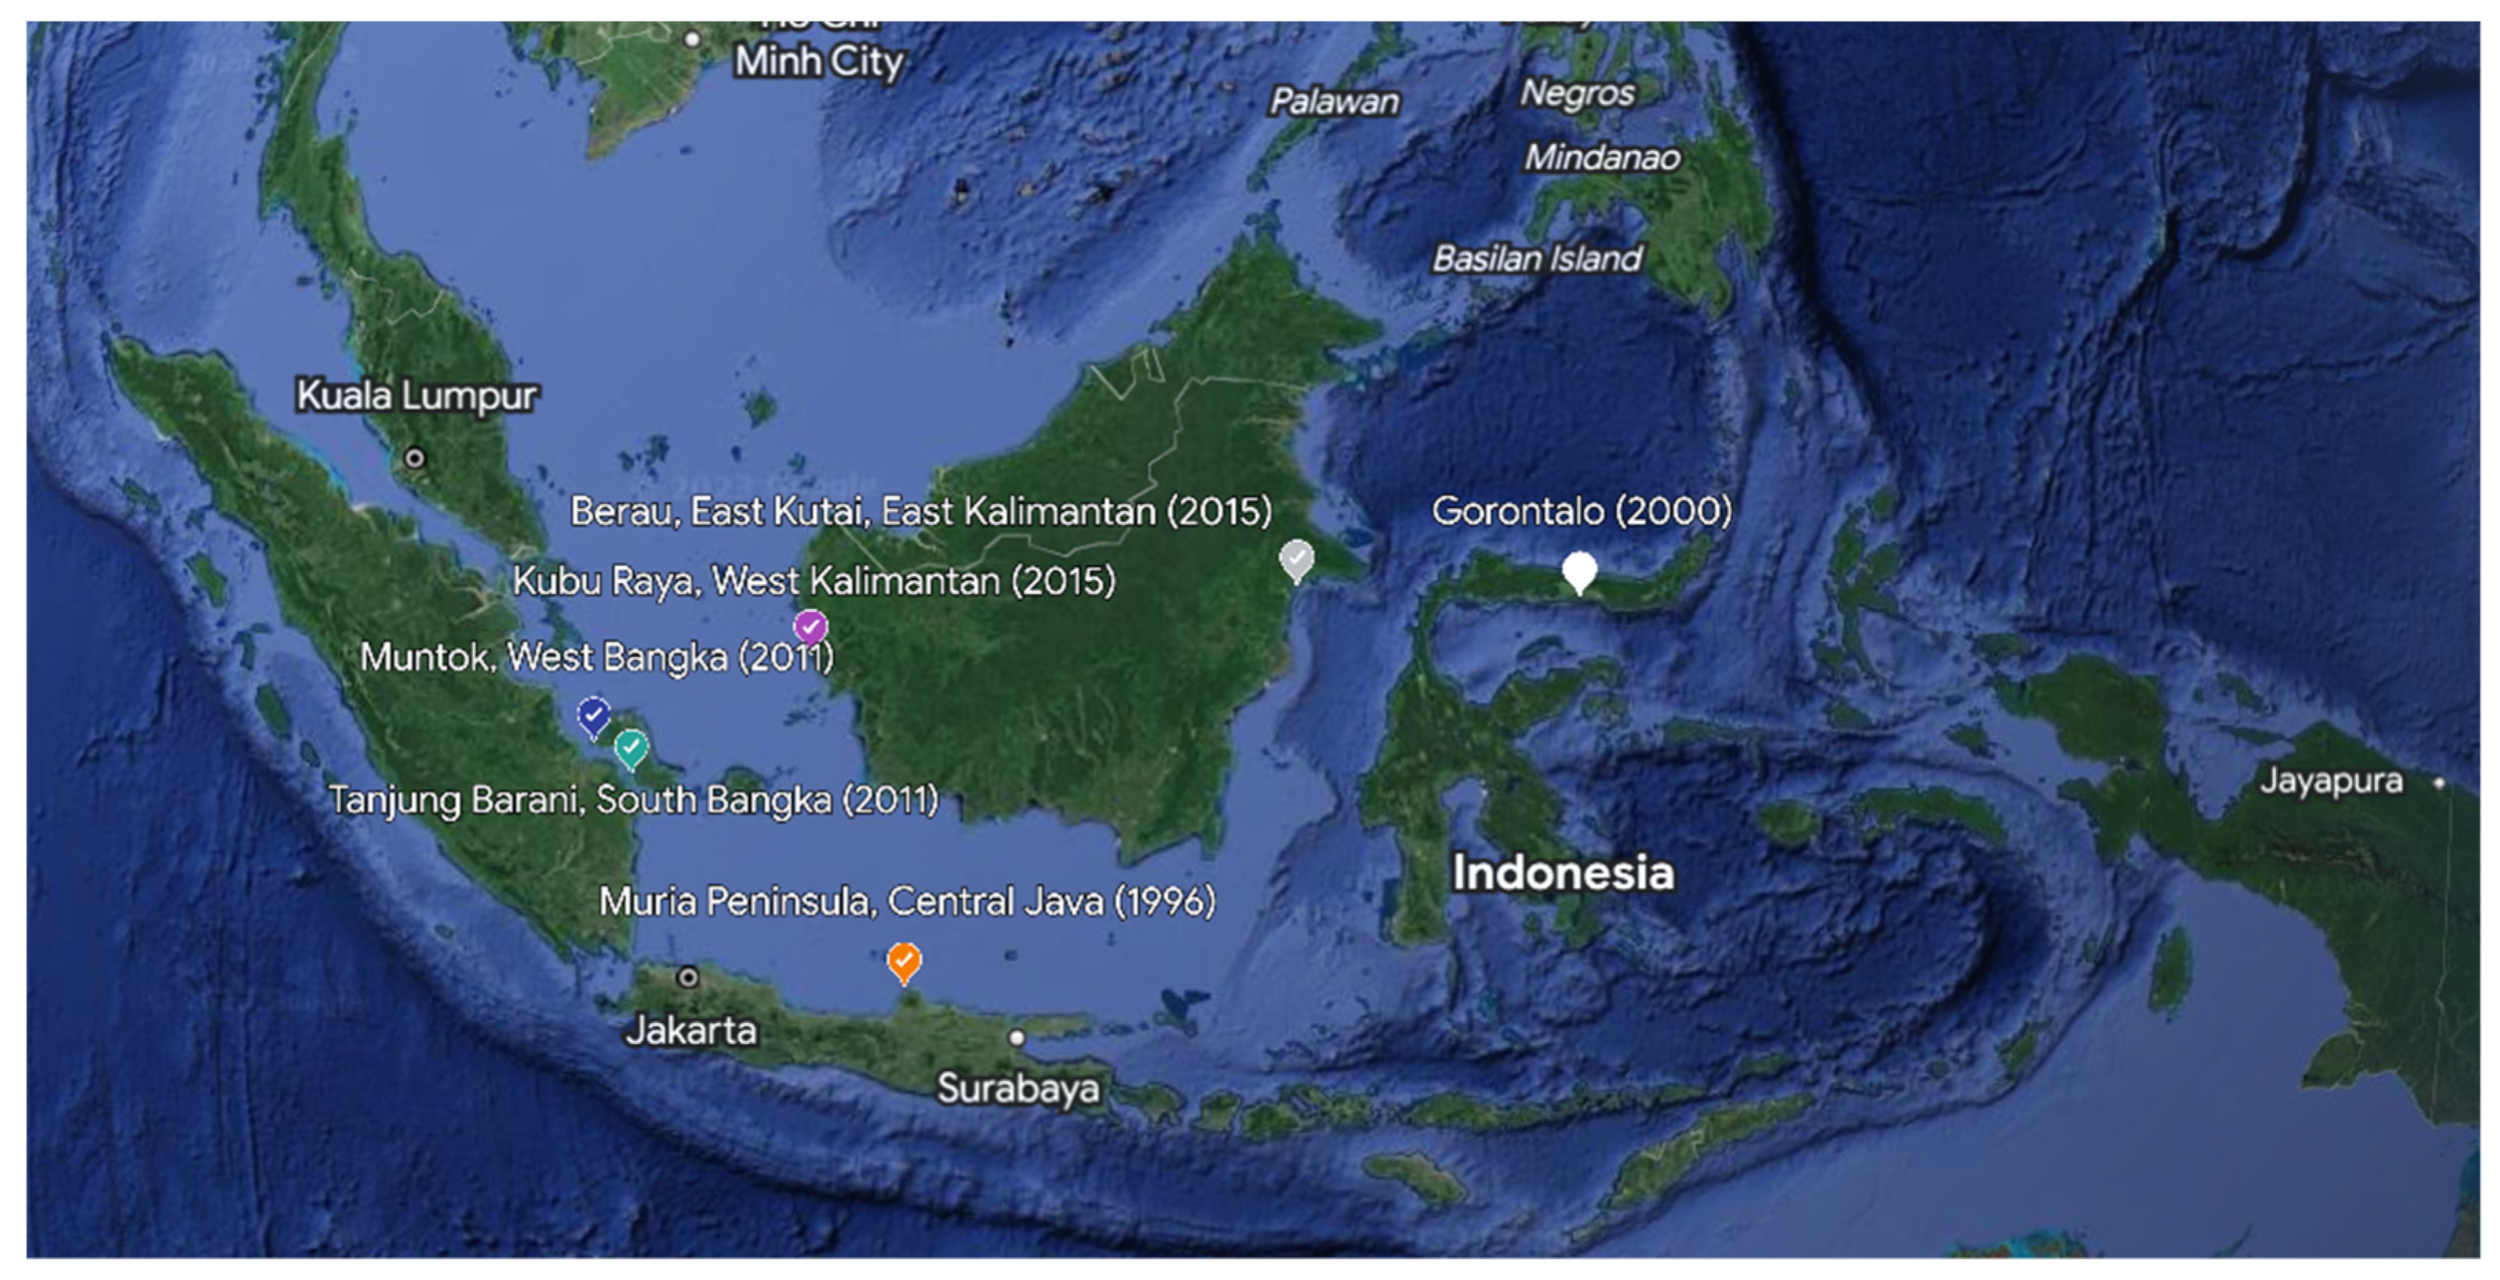
4.1.3. Prefeasibility Study
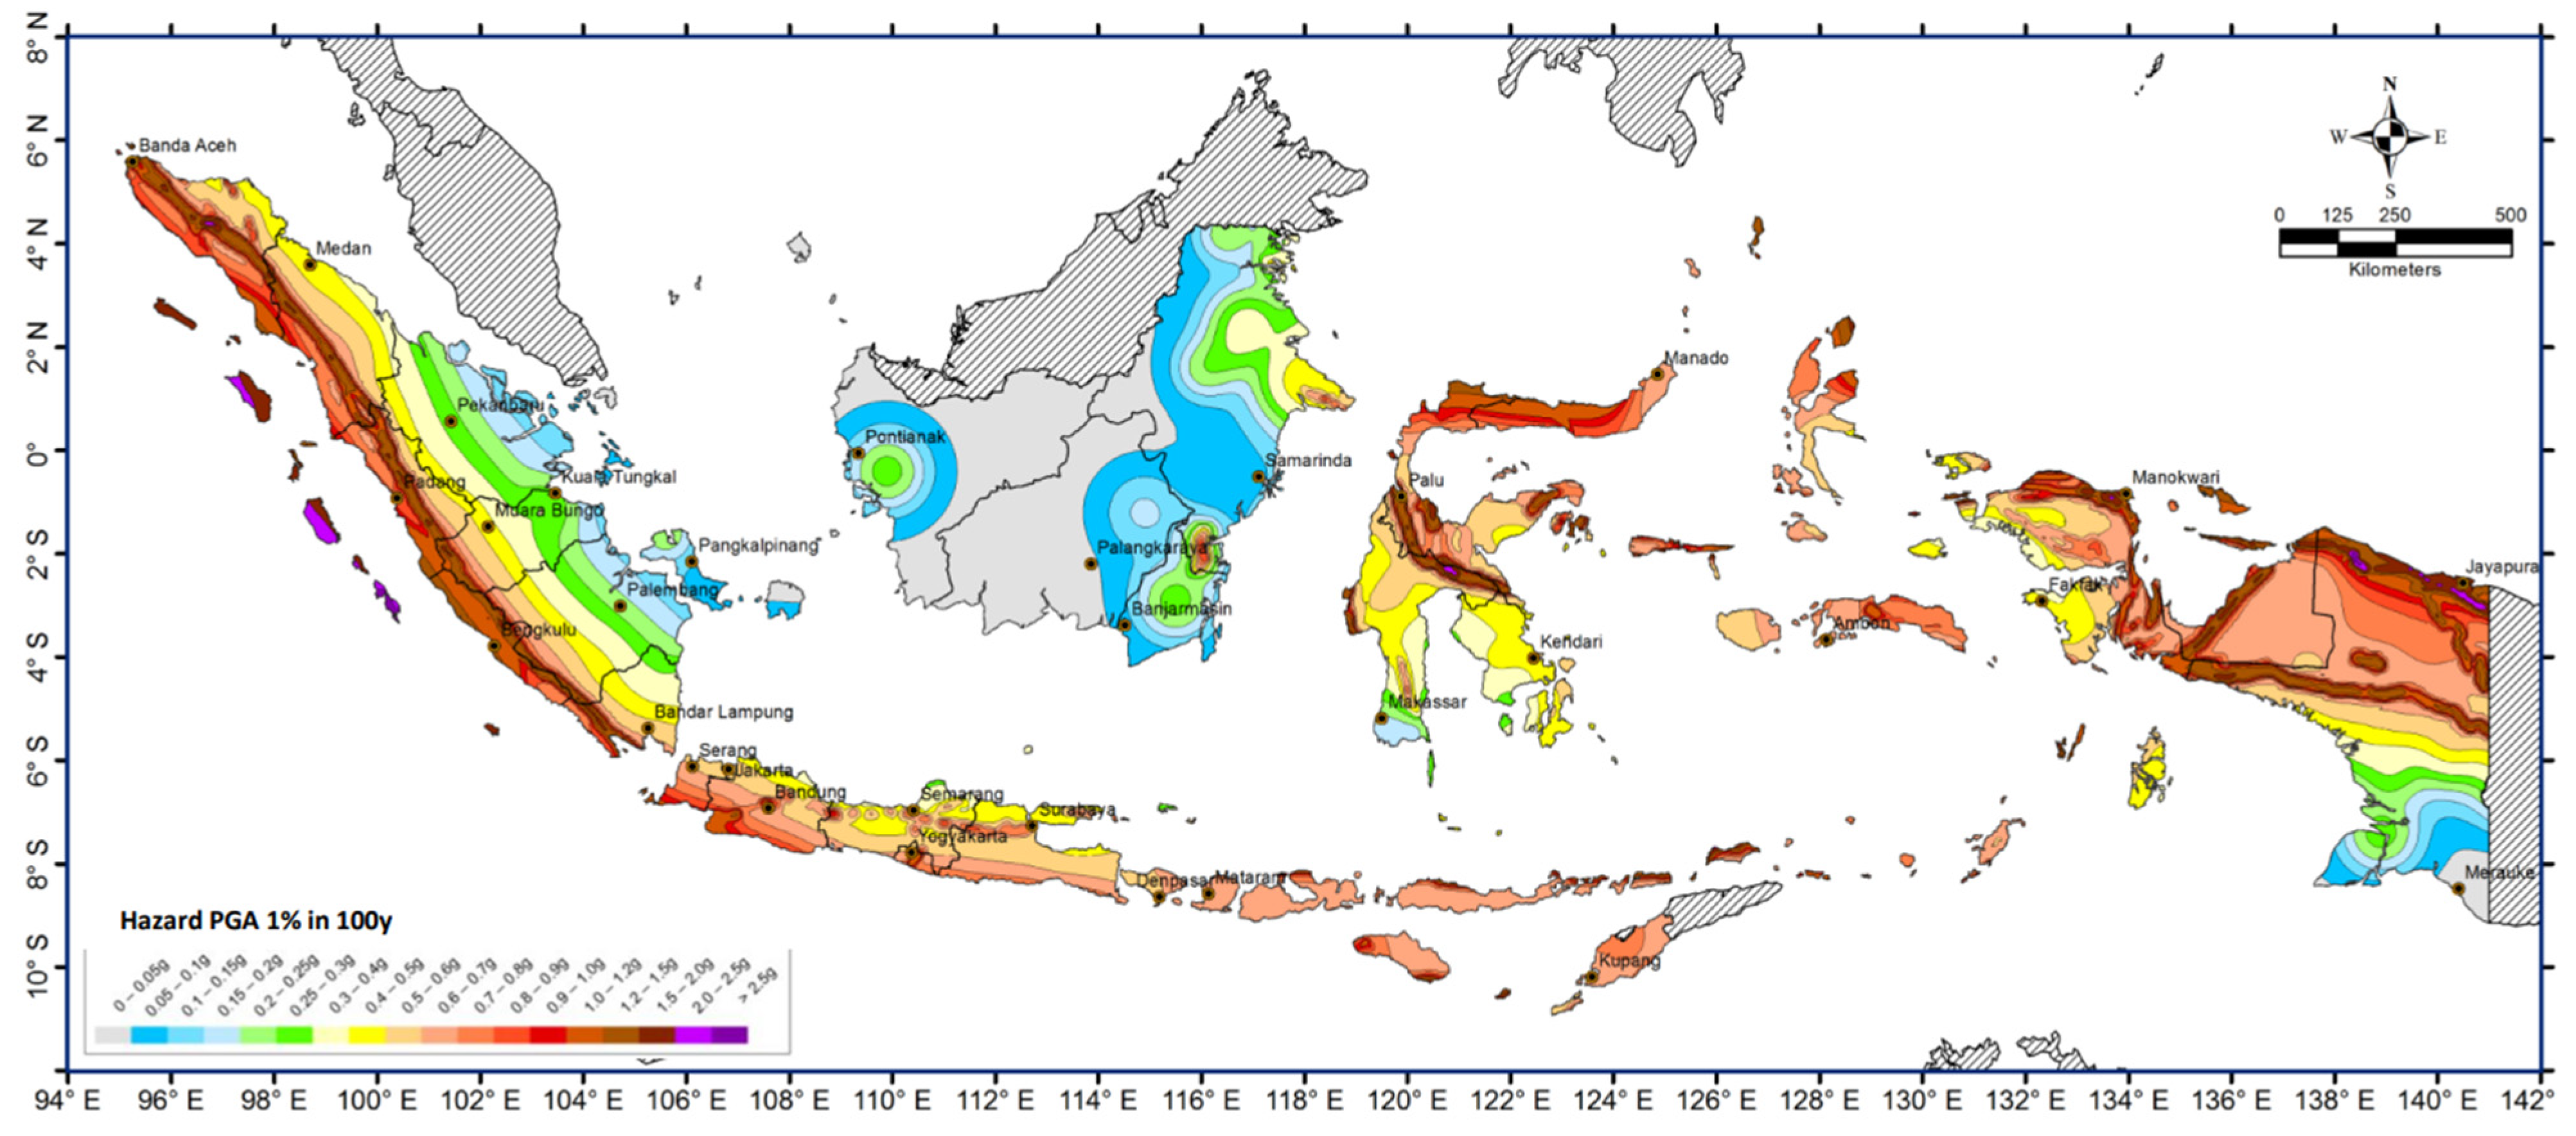
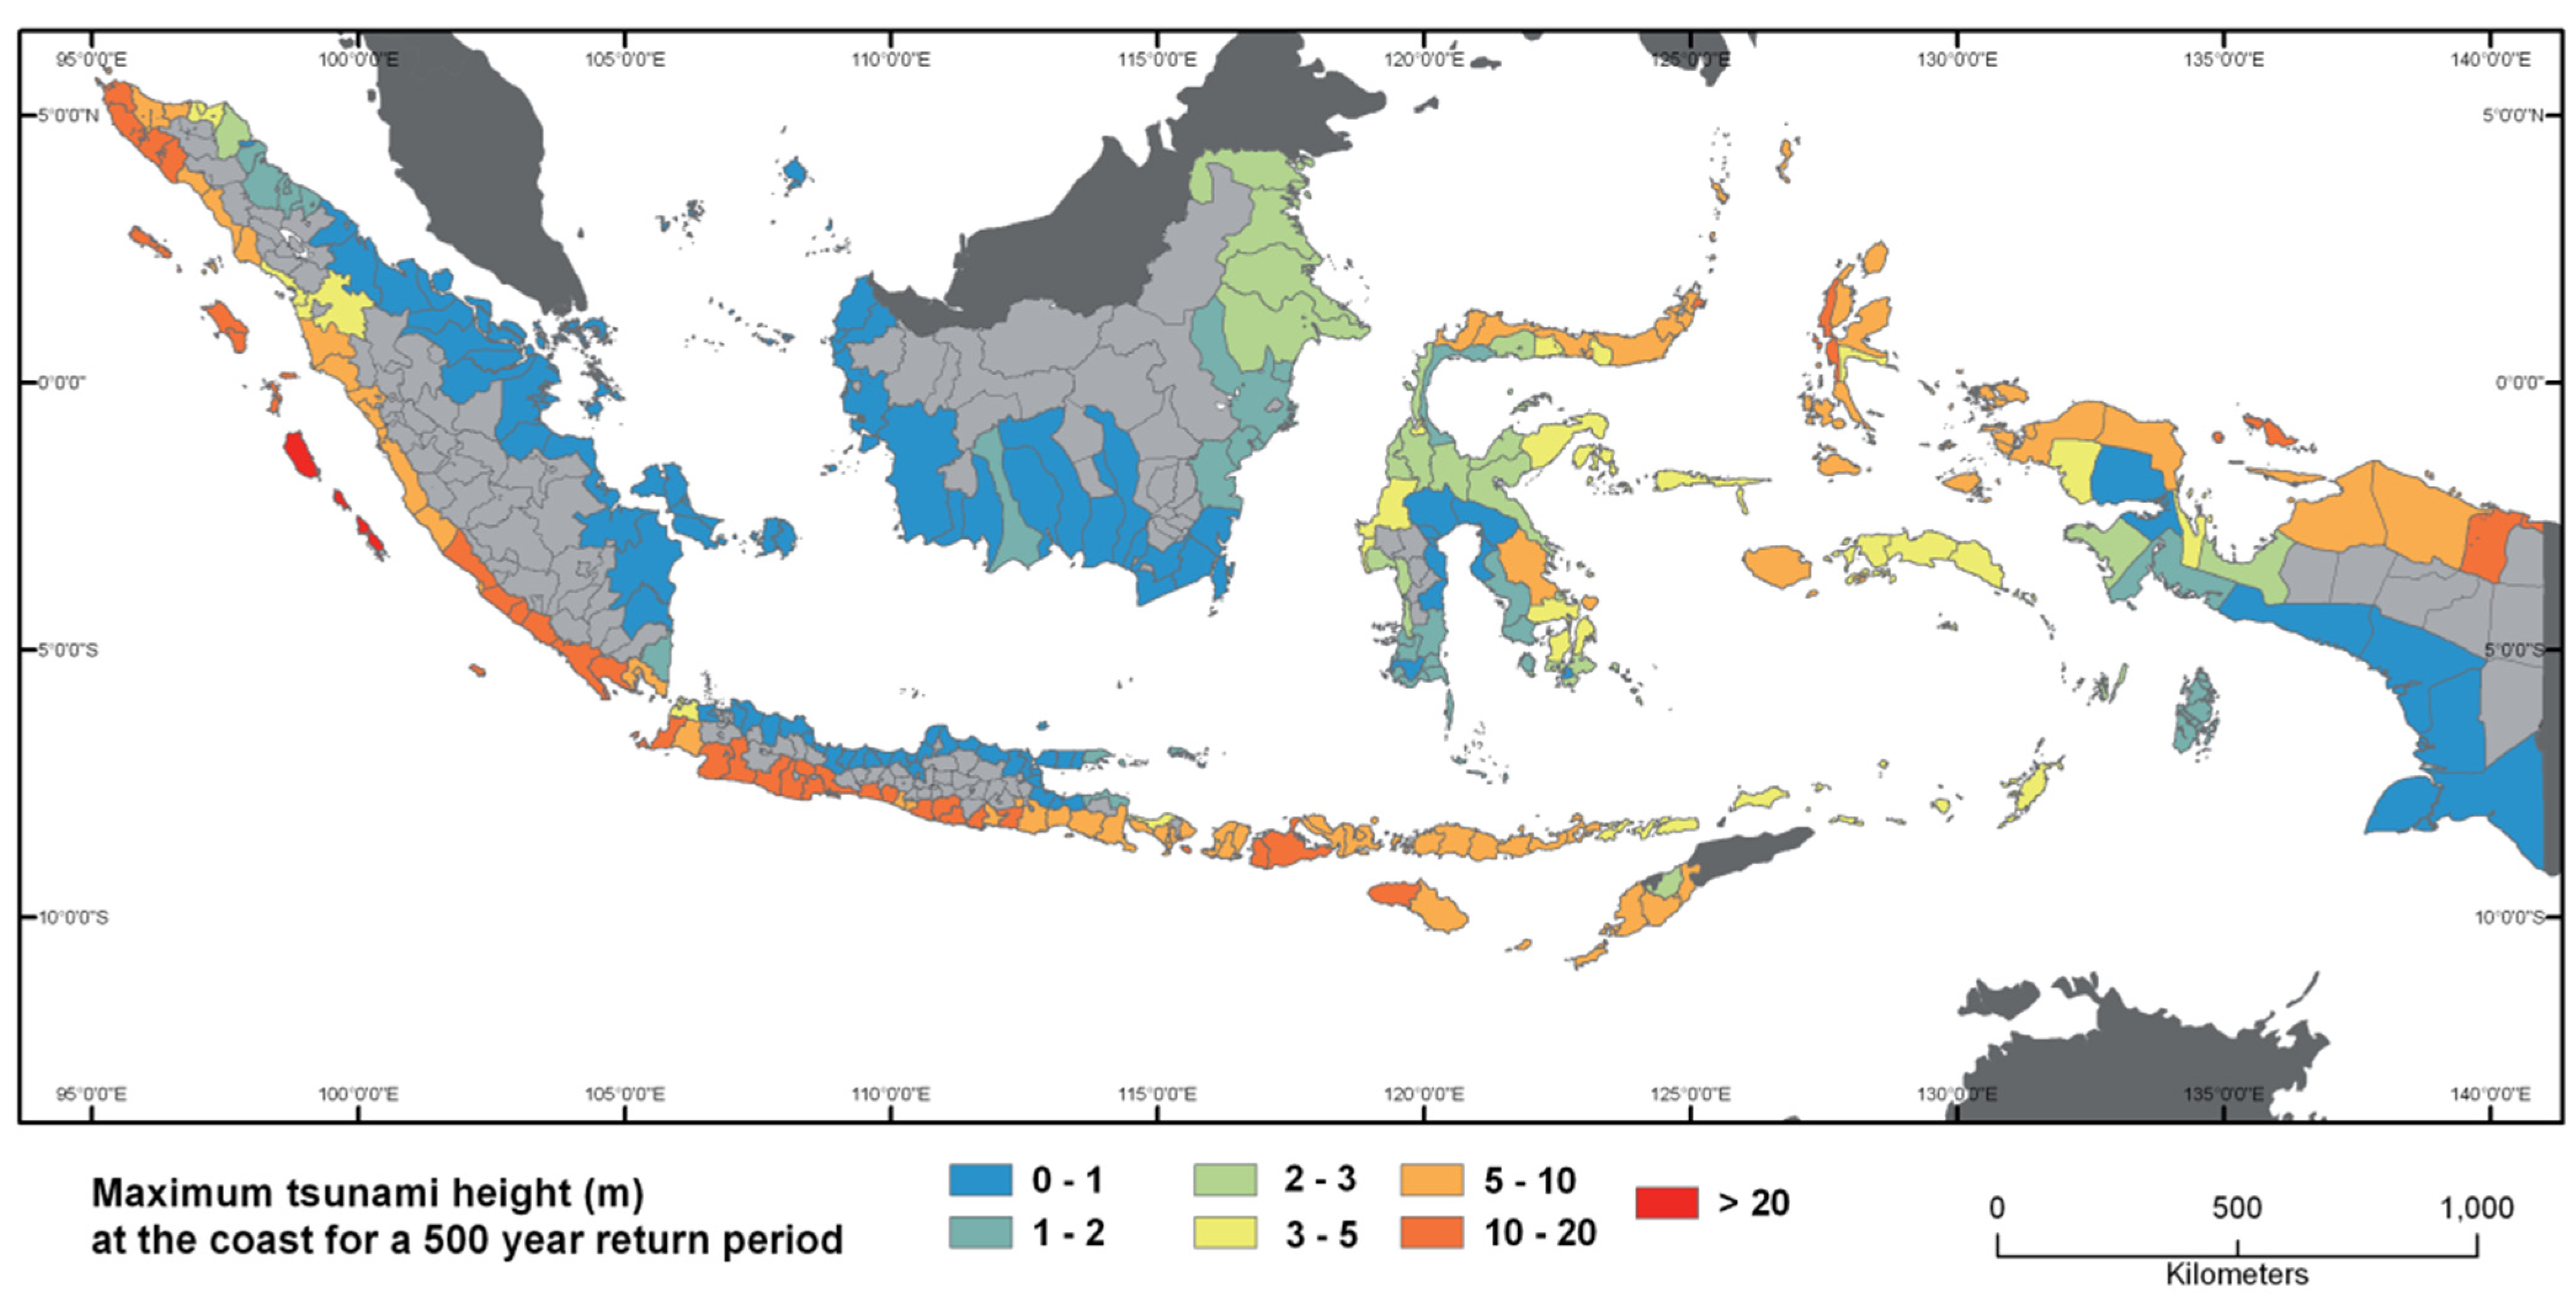
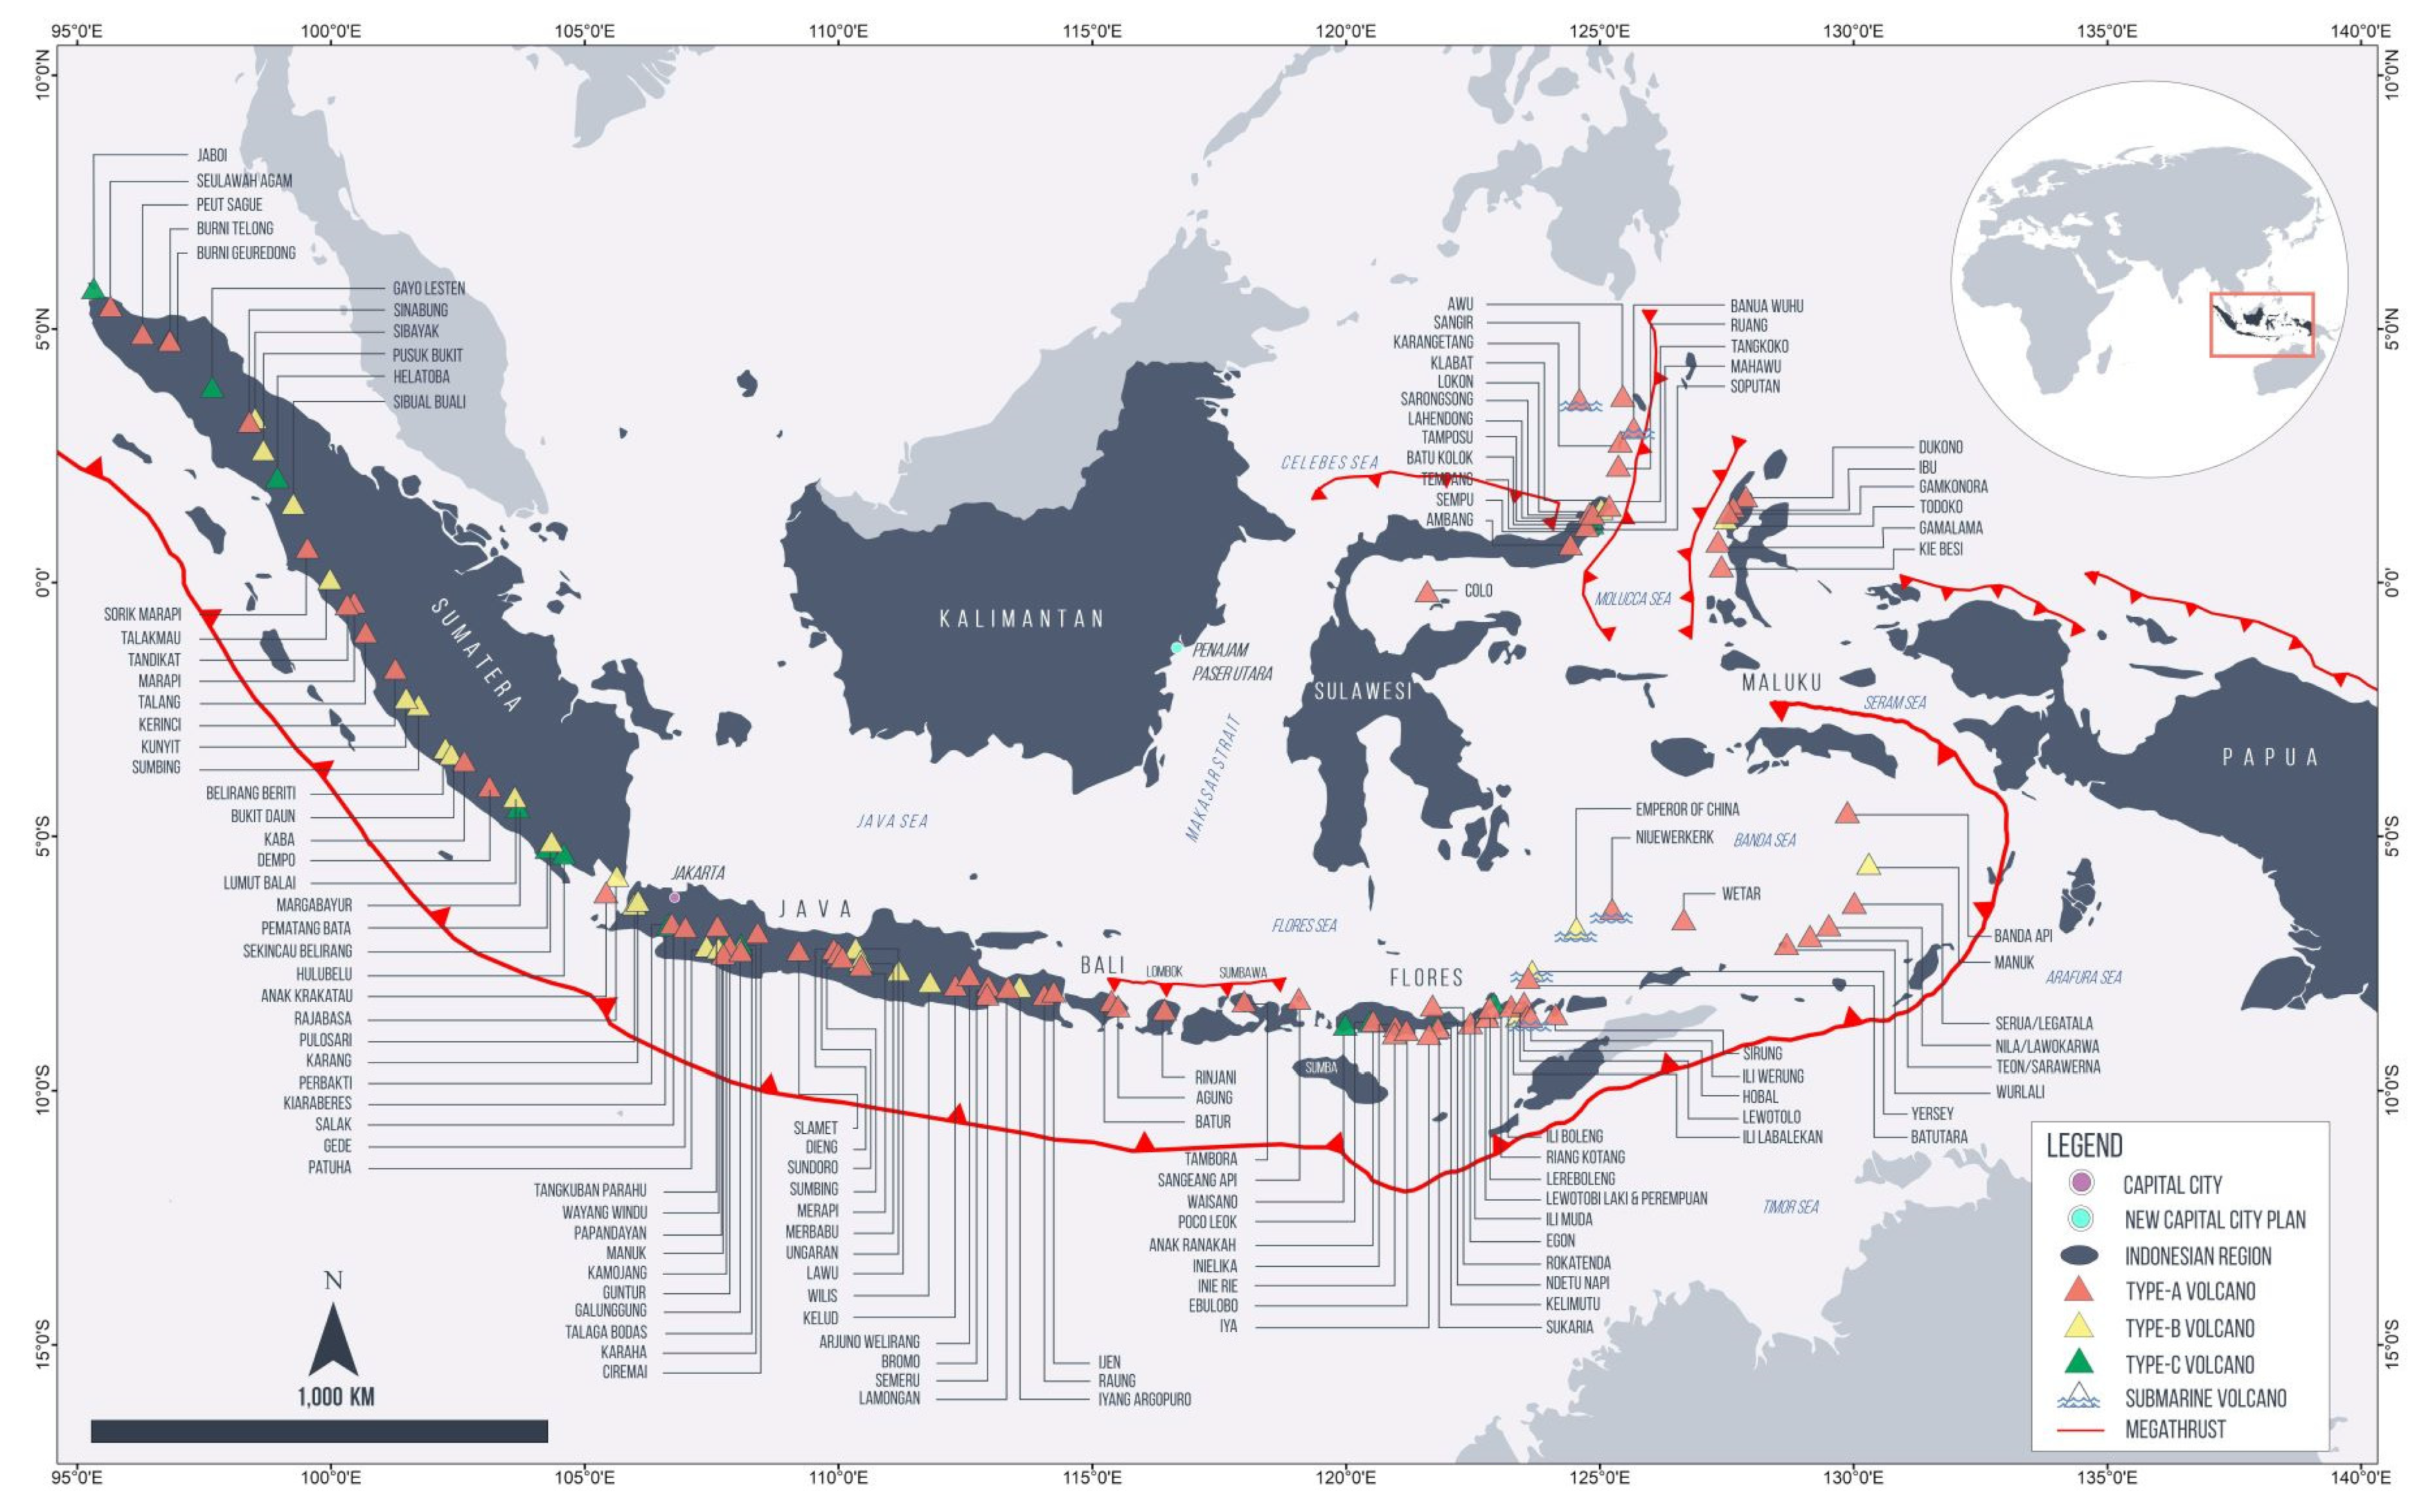
4.2. Analysis of the Seismic, Tsunamic, and Volcanic Risks
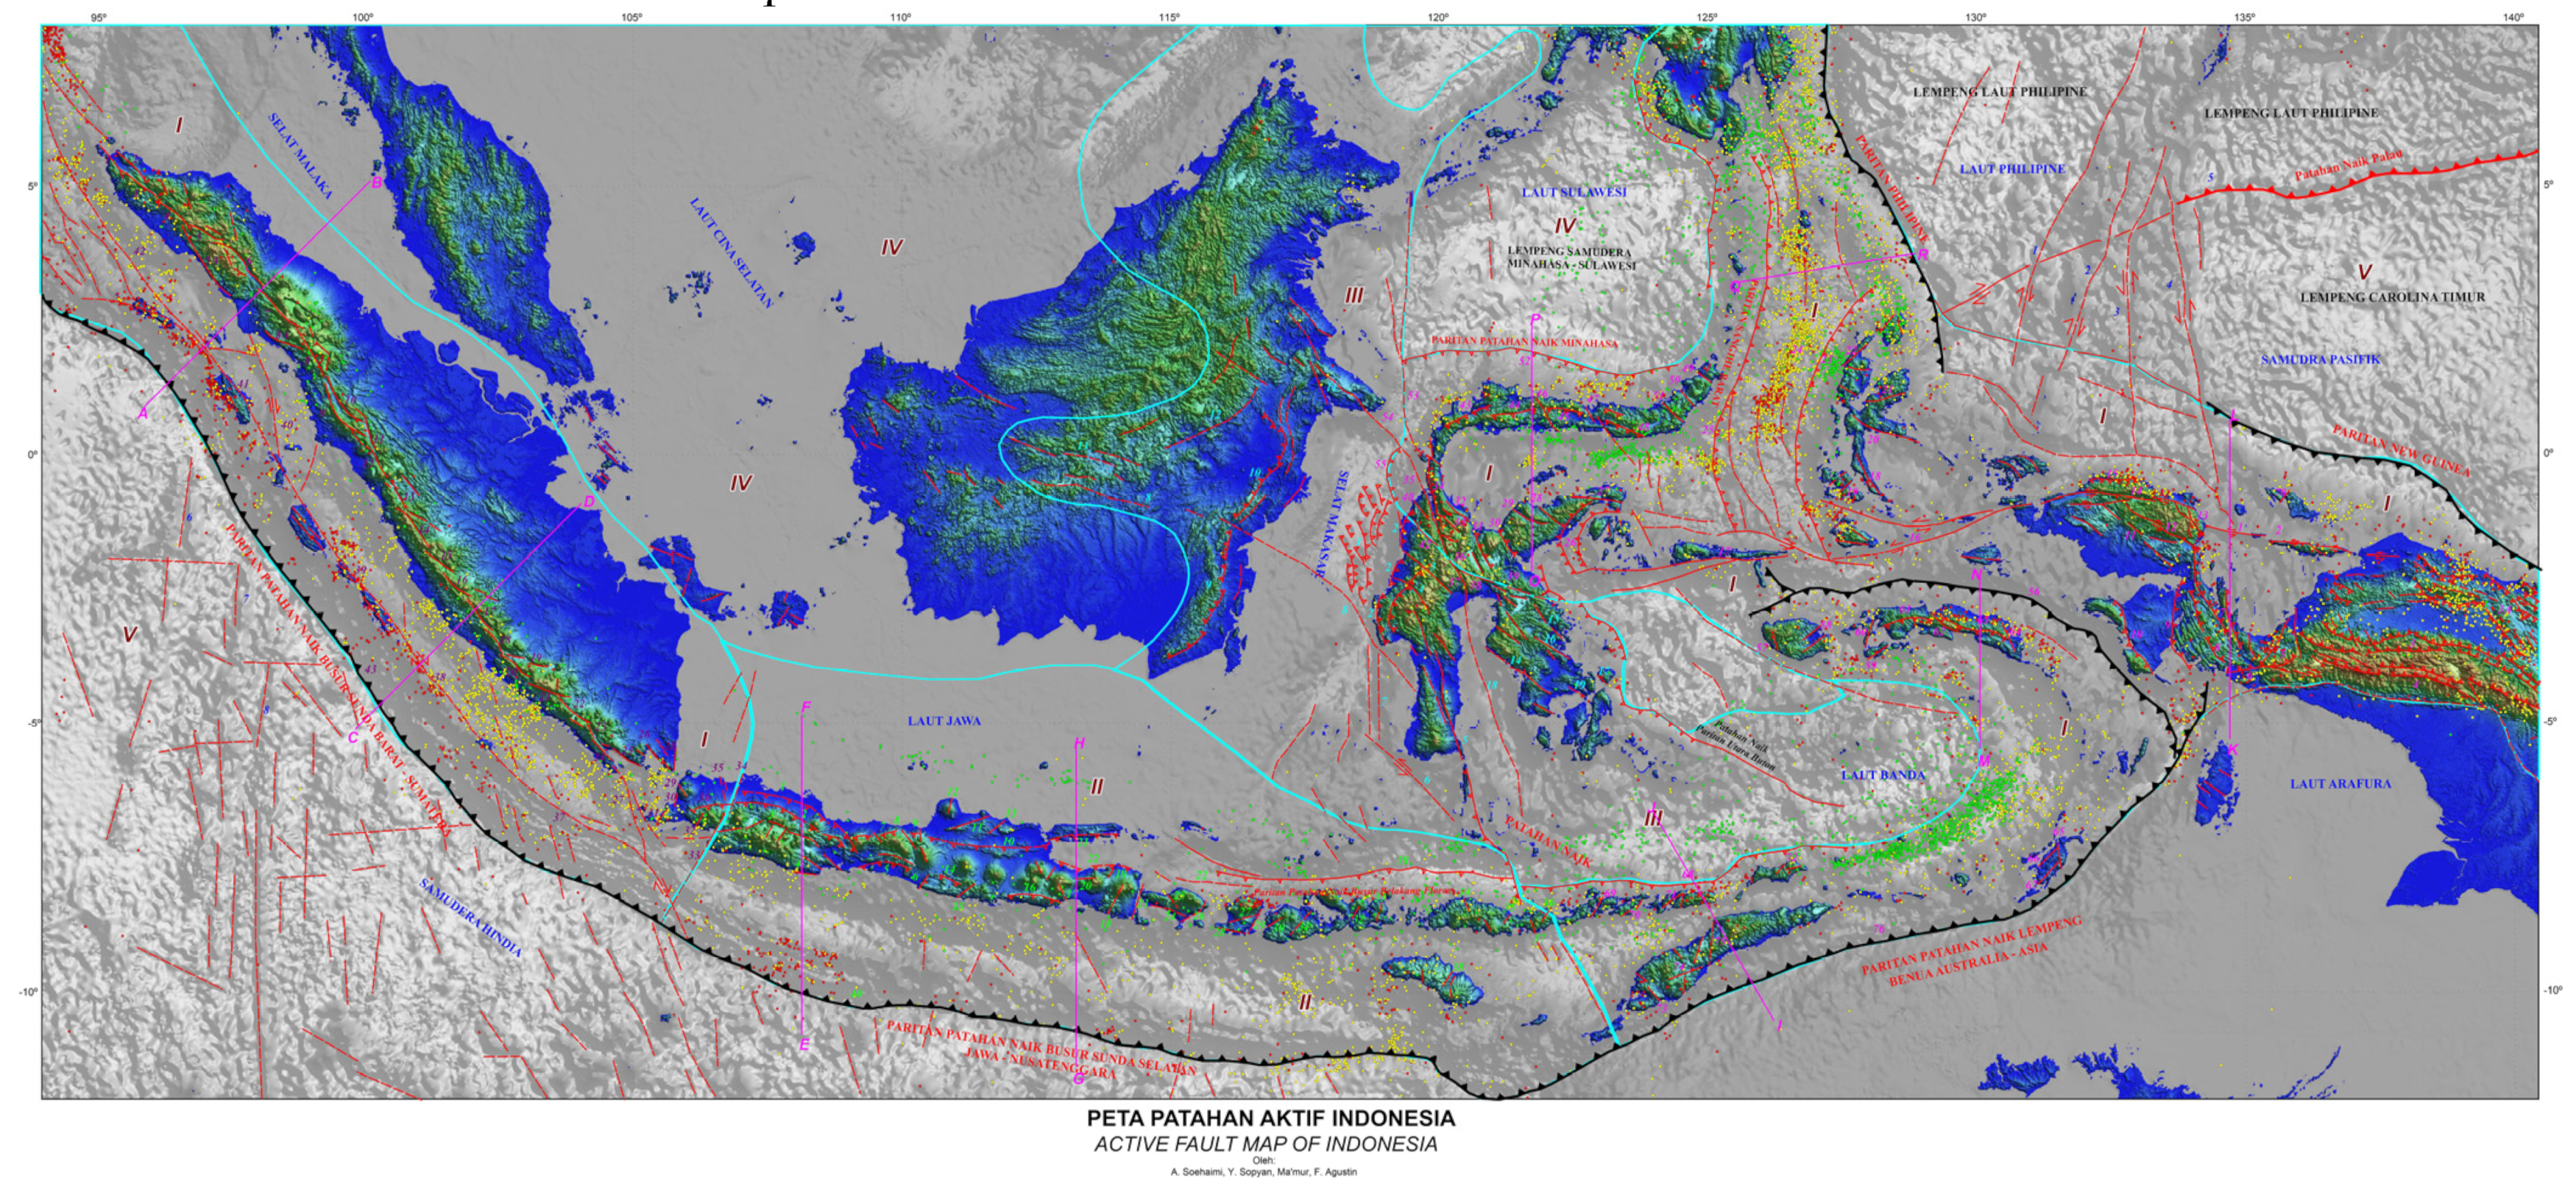
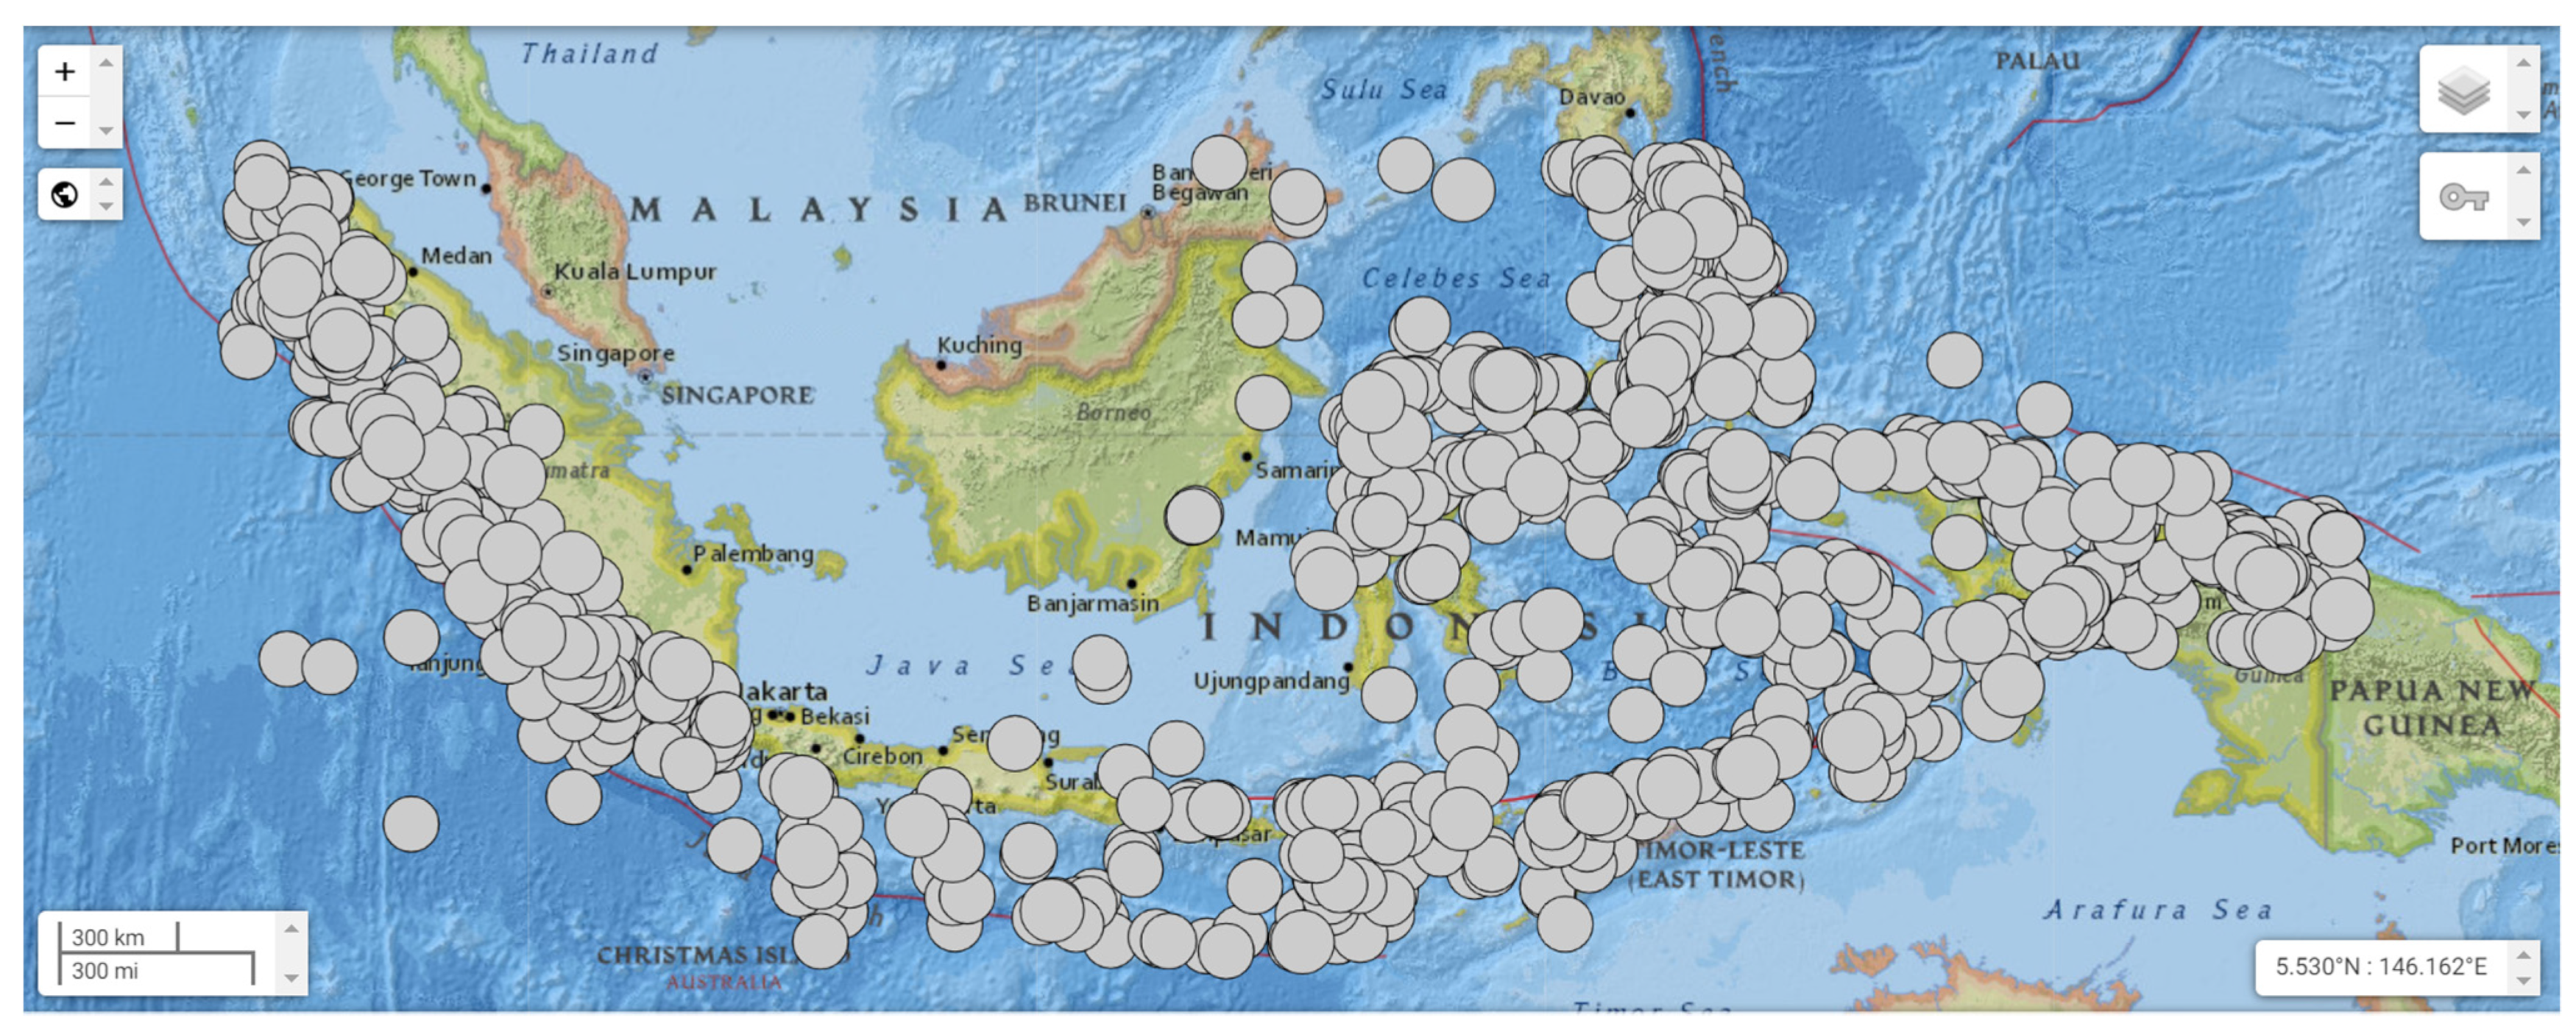
4.2.1. Seismic Investigation
- Seismic Condition
- 2.
- Mitigating Seismic Risks
4.2.2. Tsunami Investigation and Mitigation
4.2.3. Volcanic Investigation and Mitigation
4.3. Analysis of the Use of NPPs in the National Energy Mix
4.3.1. Potential Energy Resources
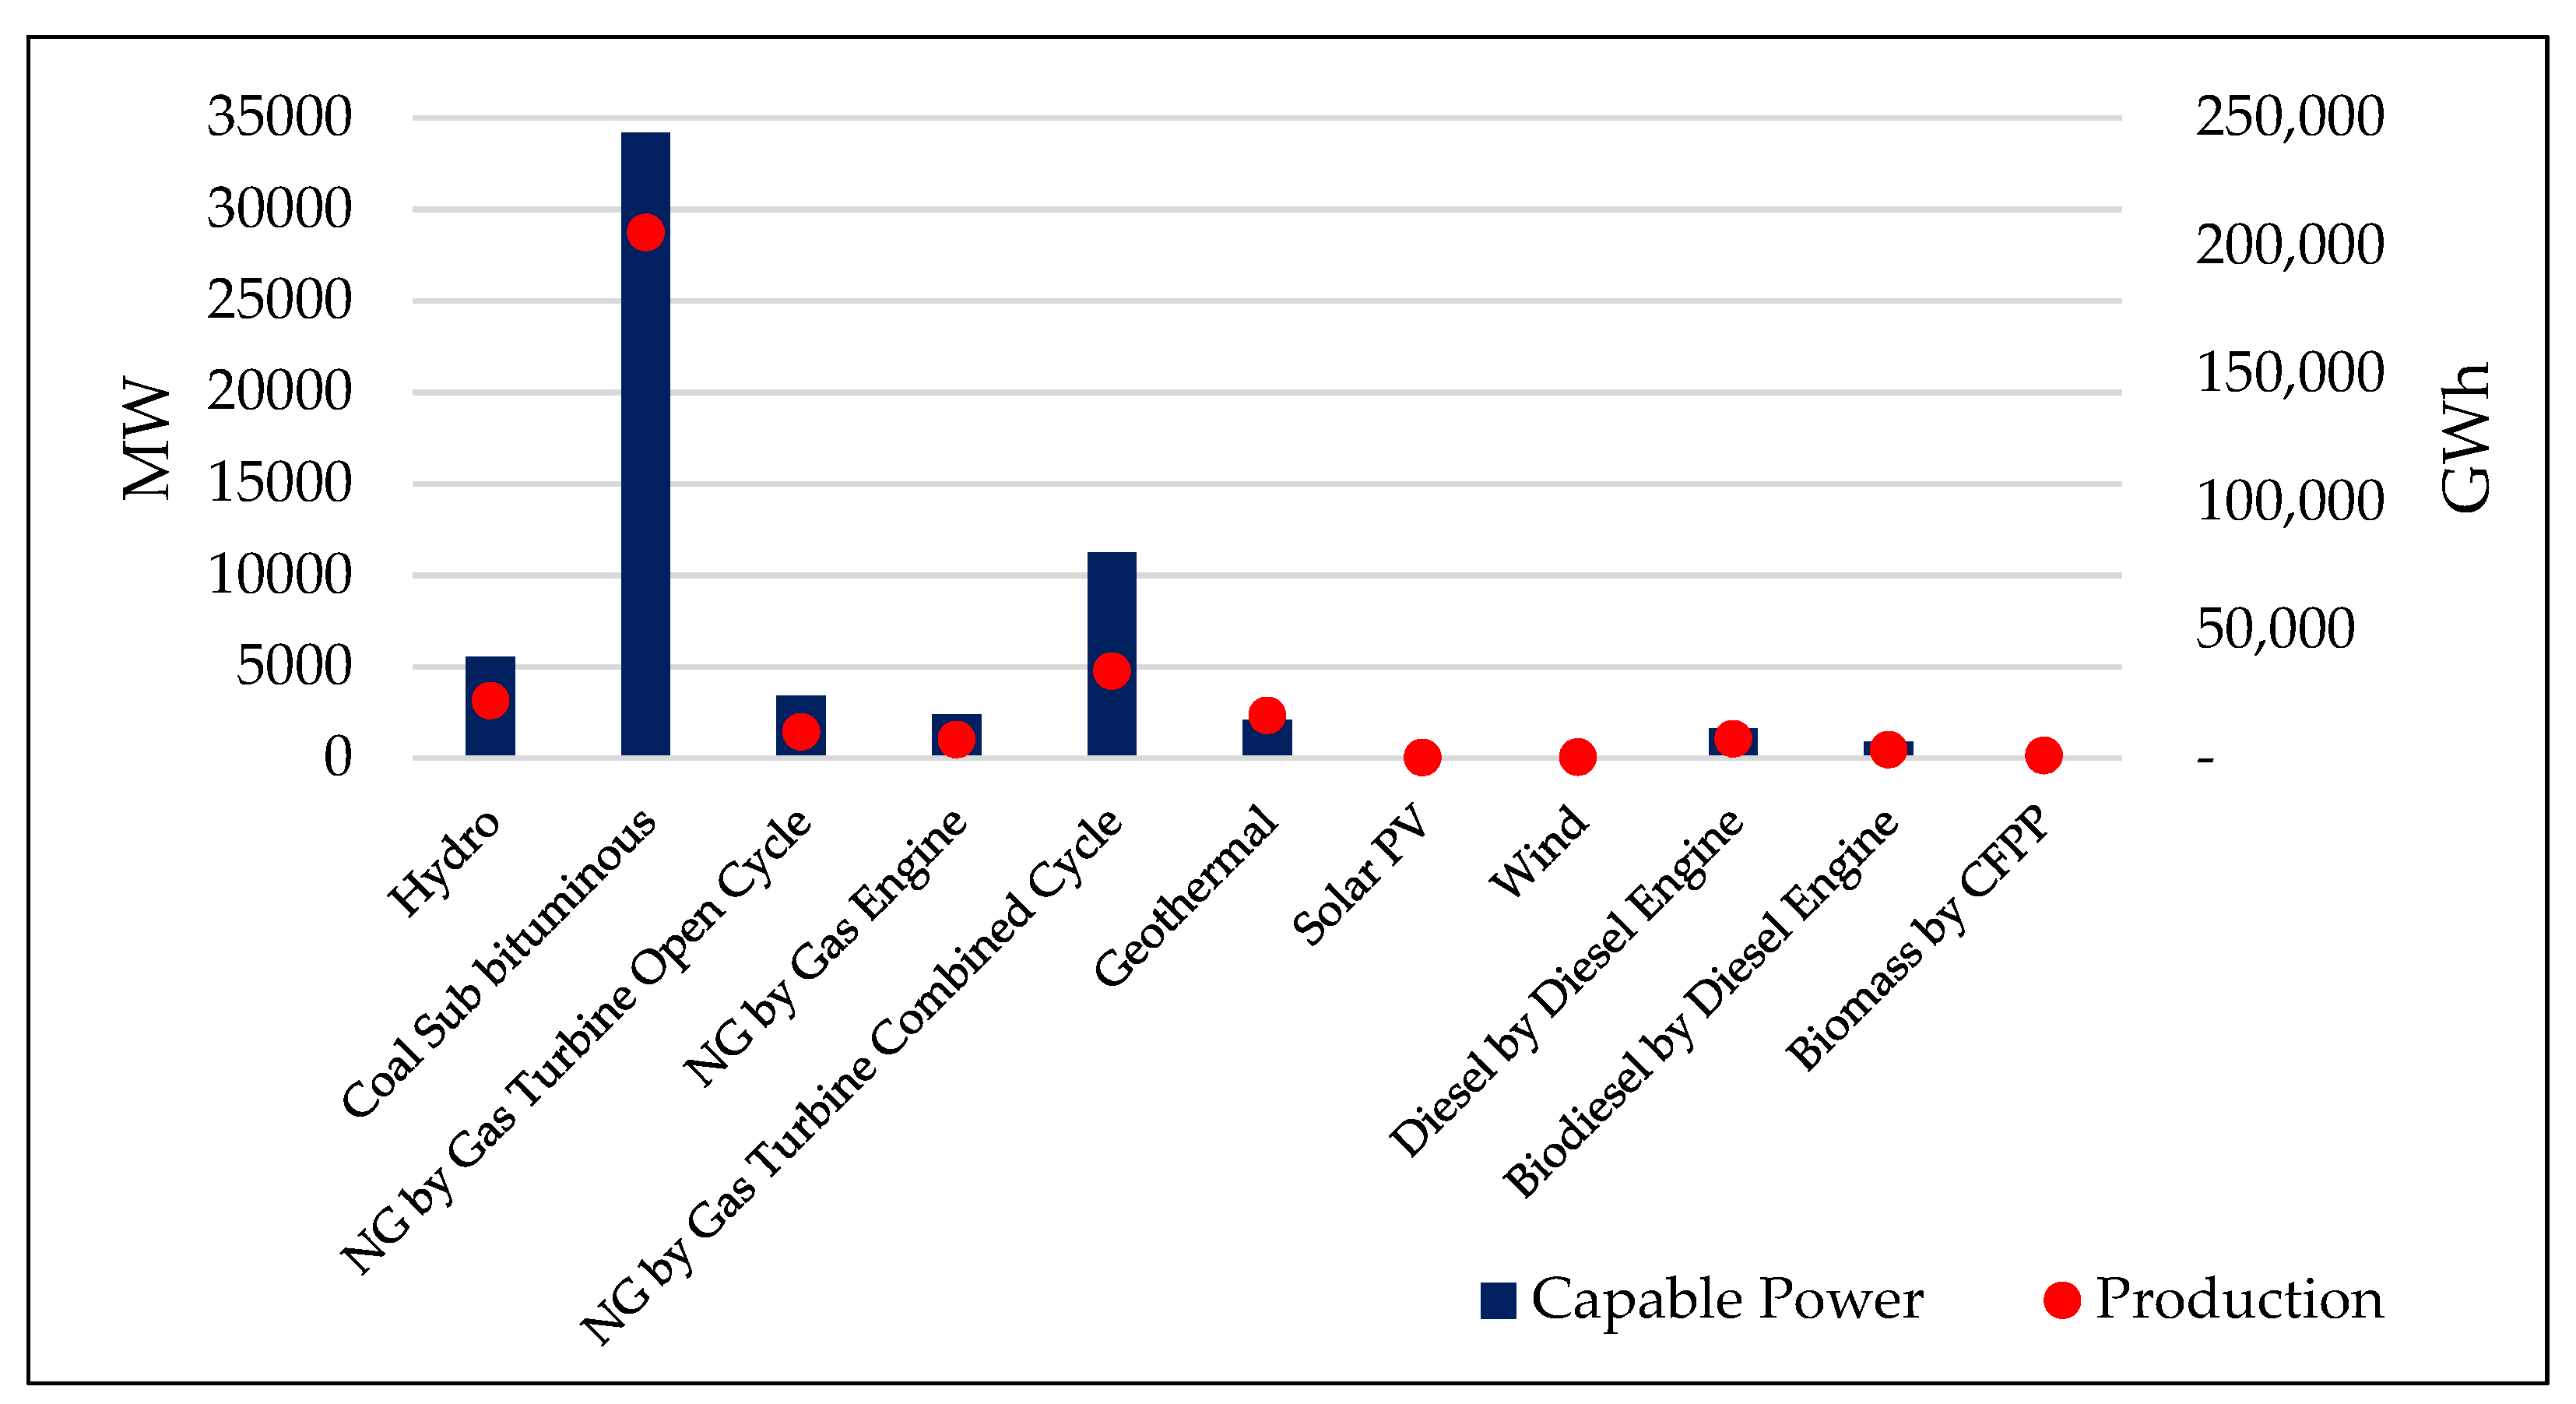
4.3.2. Electricity Condition
4.3.3. Assumptions and Simulations
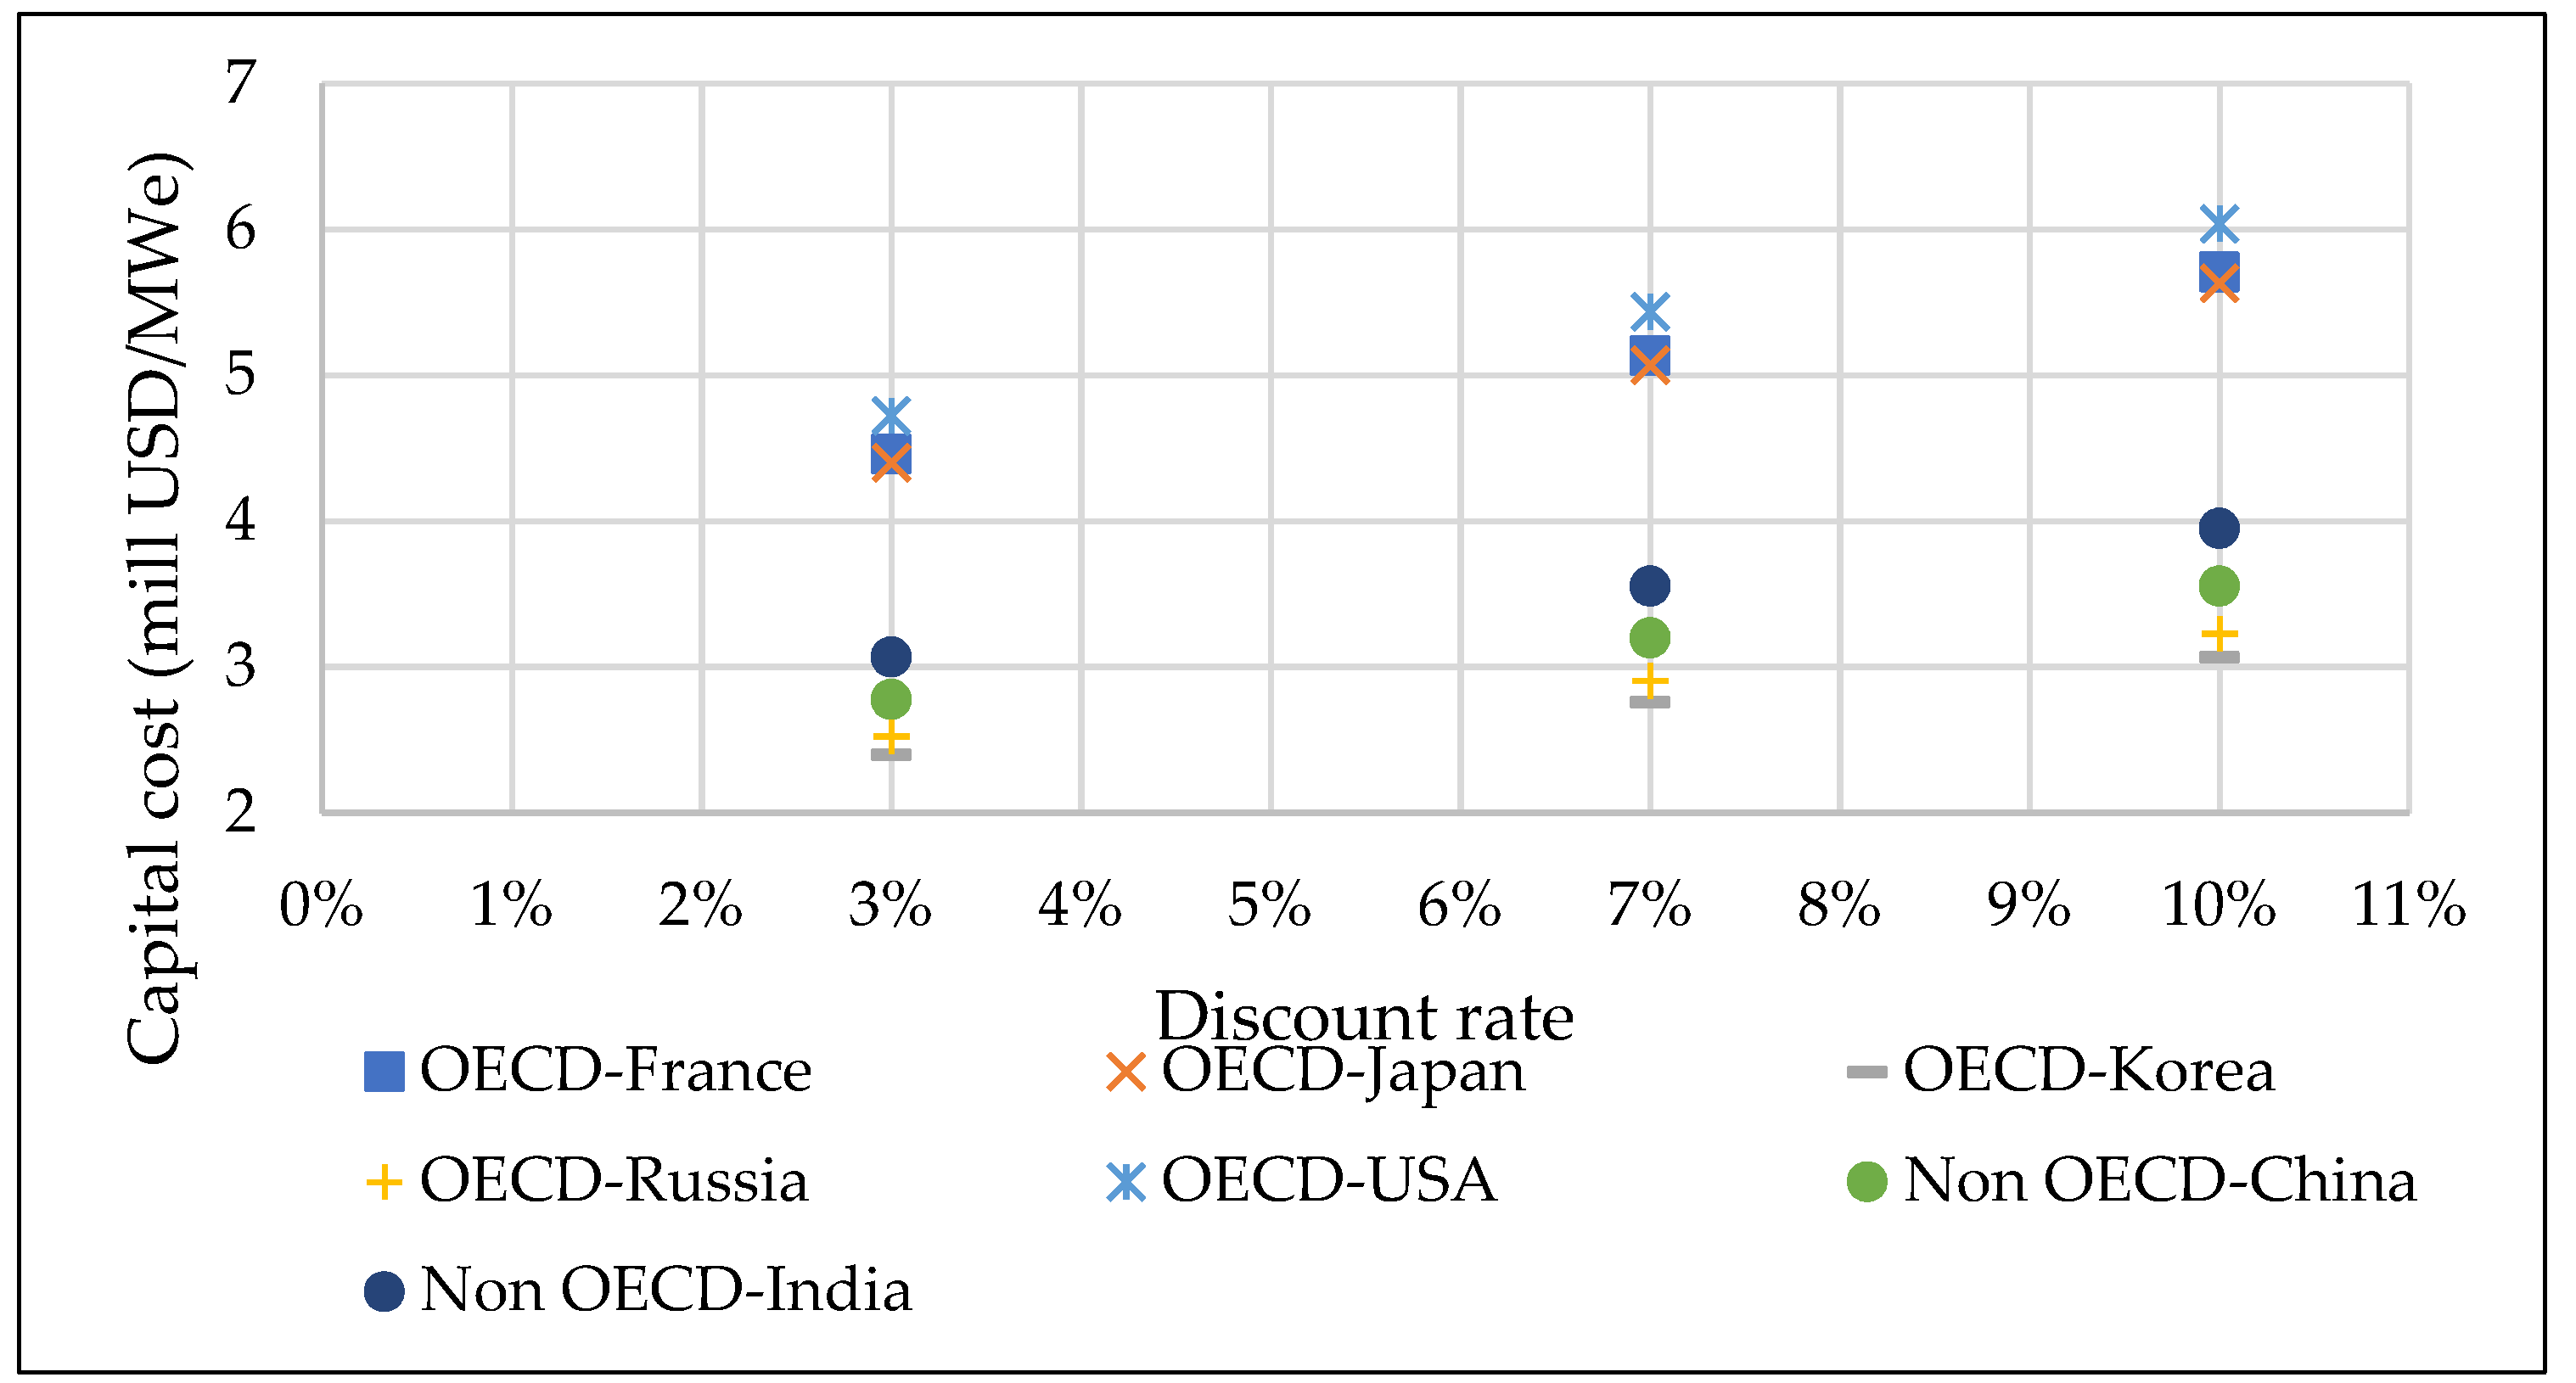
- Economics of NPPsLarge Reactors (LRs)
- Large Reactors (LRs)
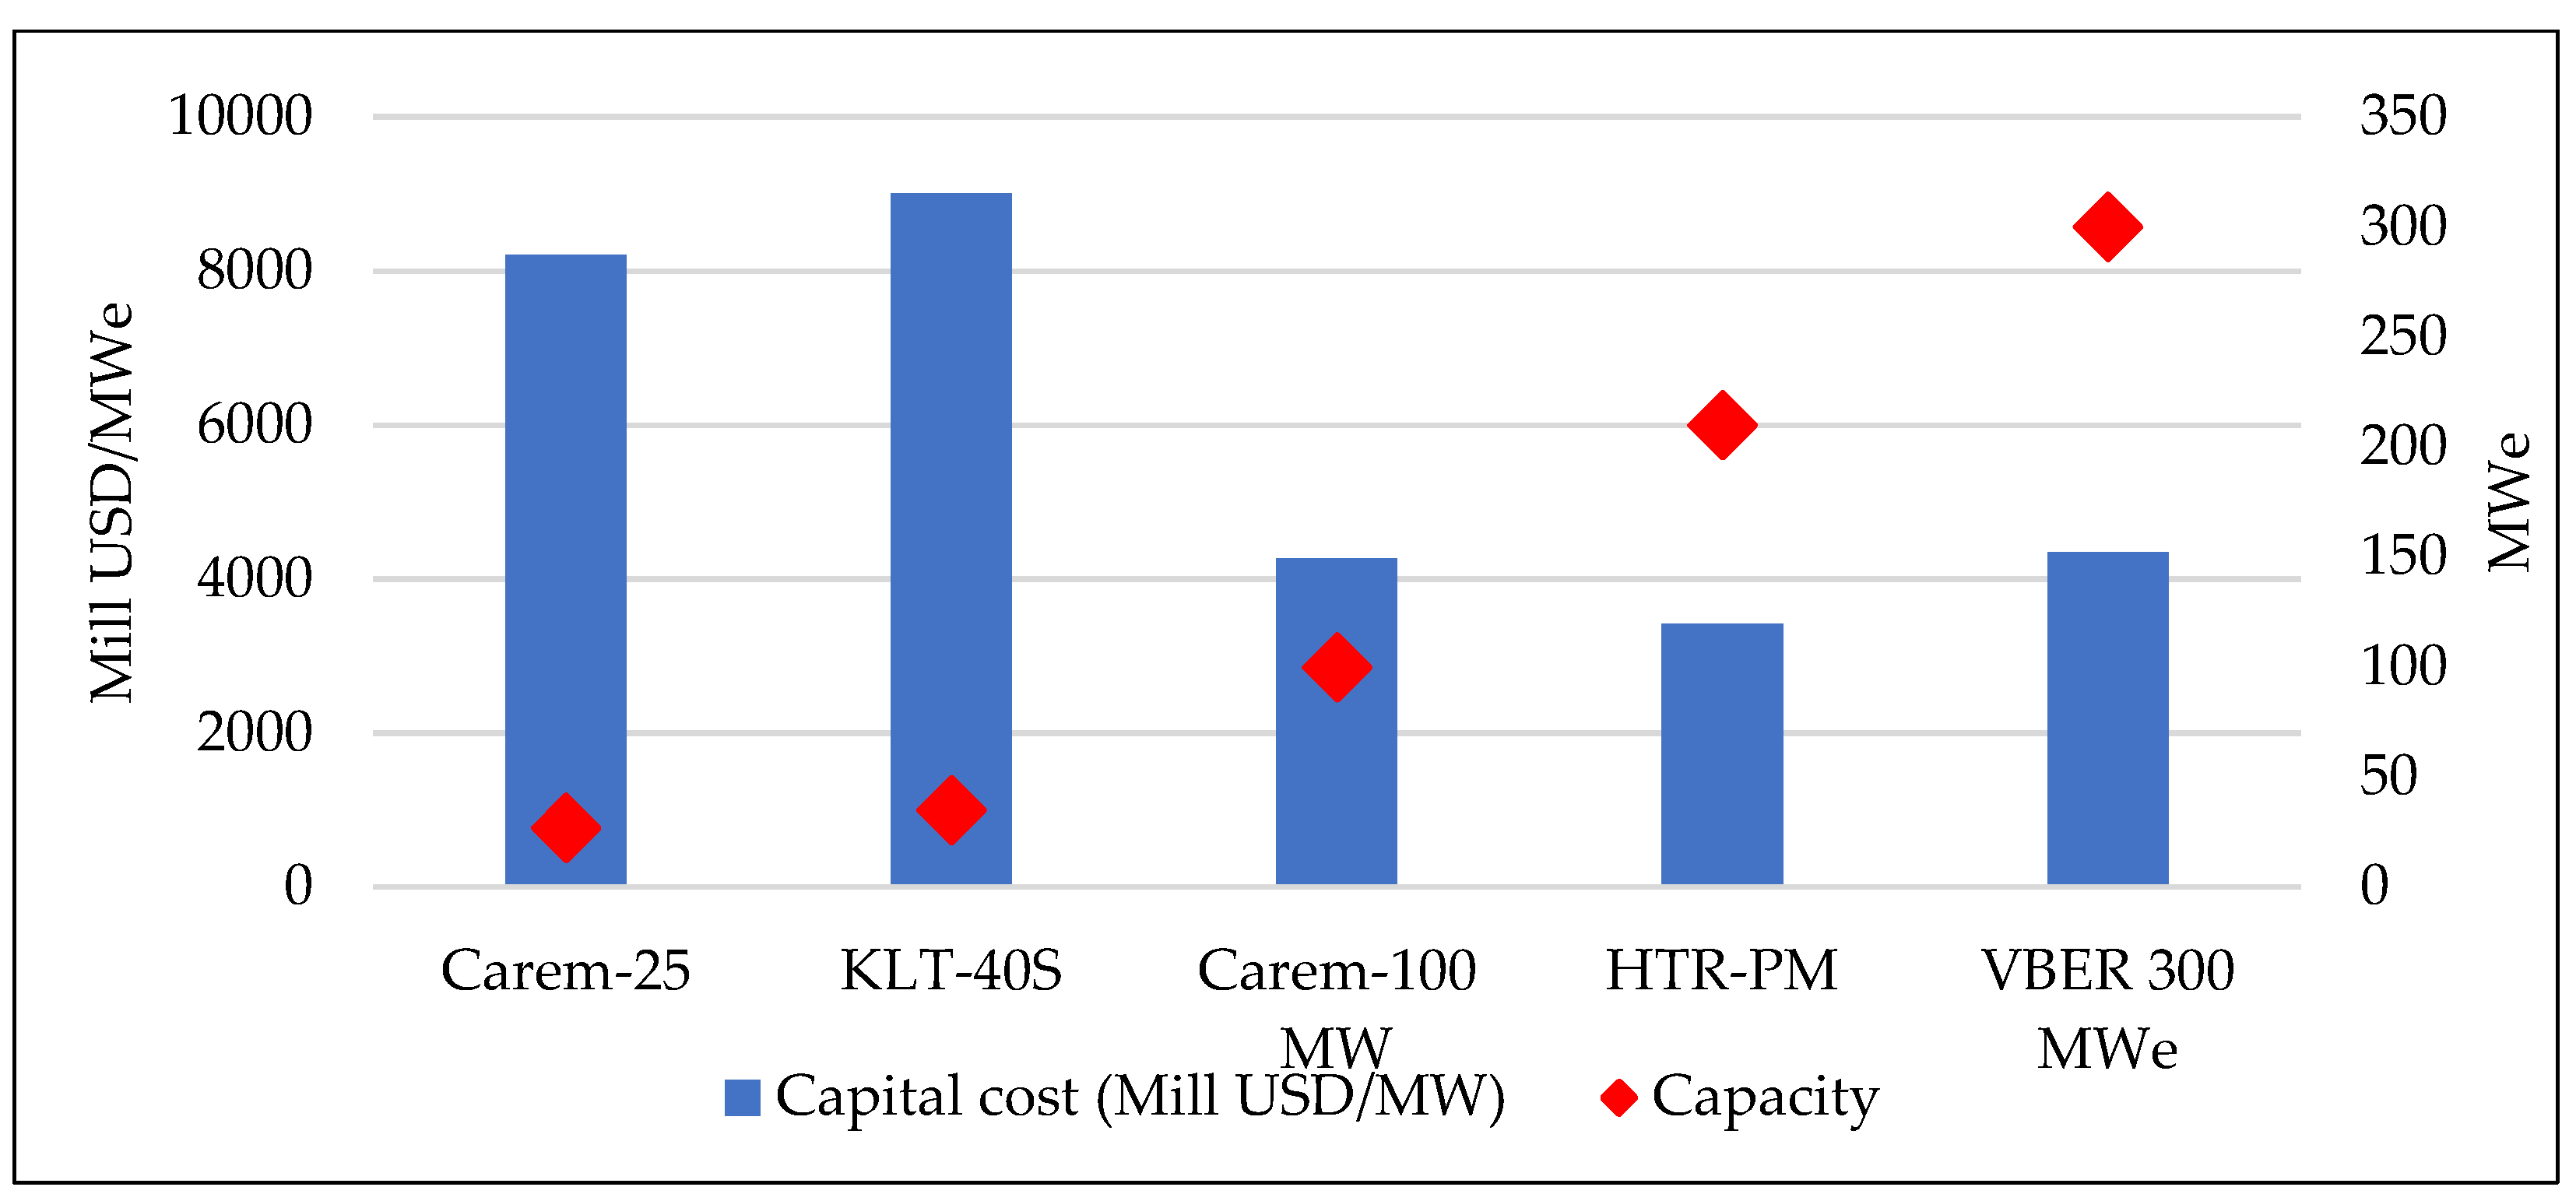
- Small Modular Reactors (SMRs)
- 2.
- Scenario assumptions
- 3.
- Annualized production and investment cost and GHG emission calculation
4.3.4. Simulation Result
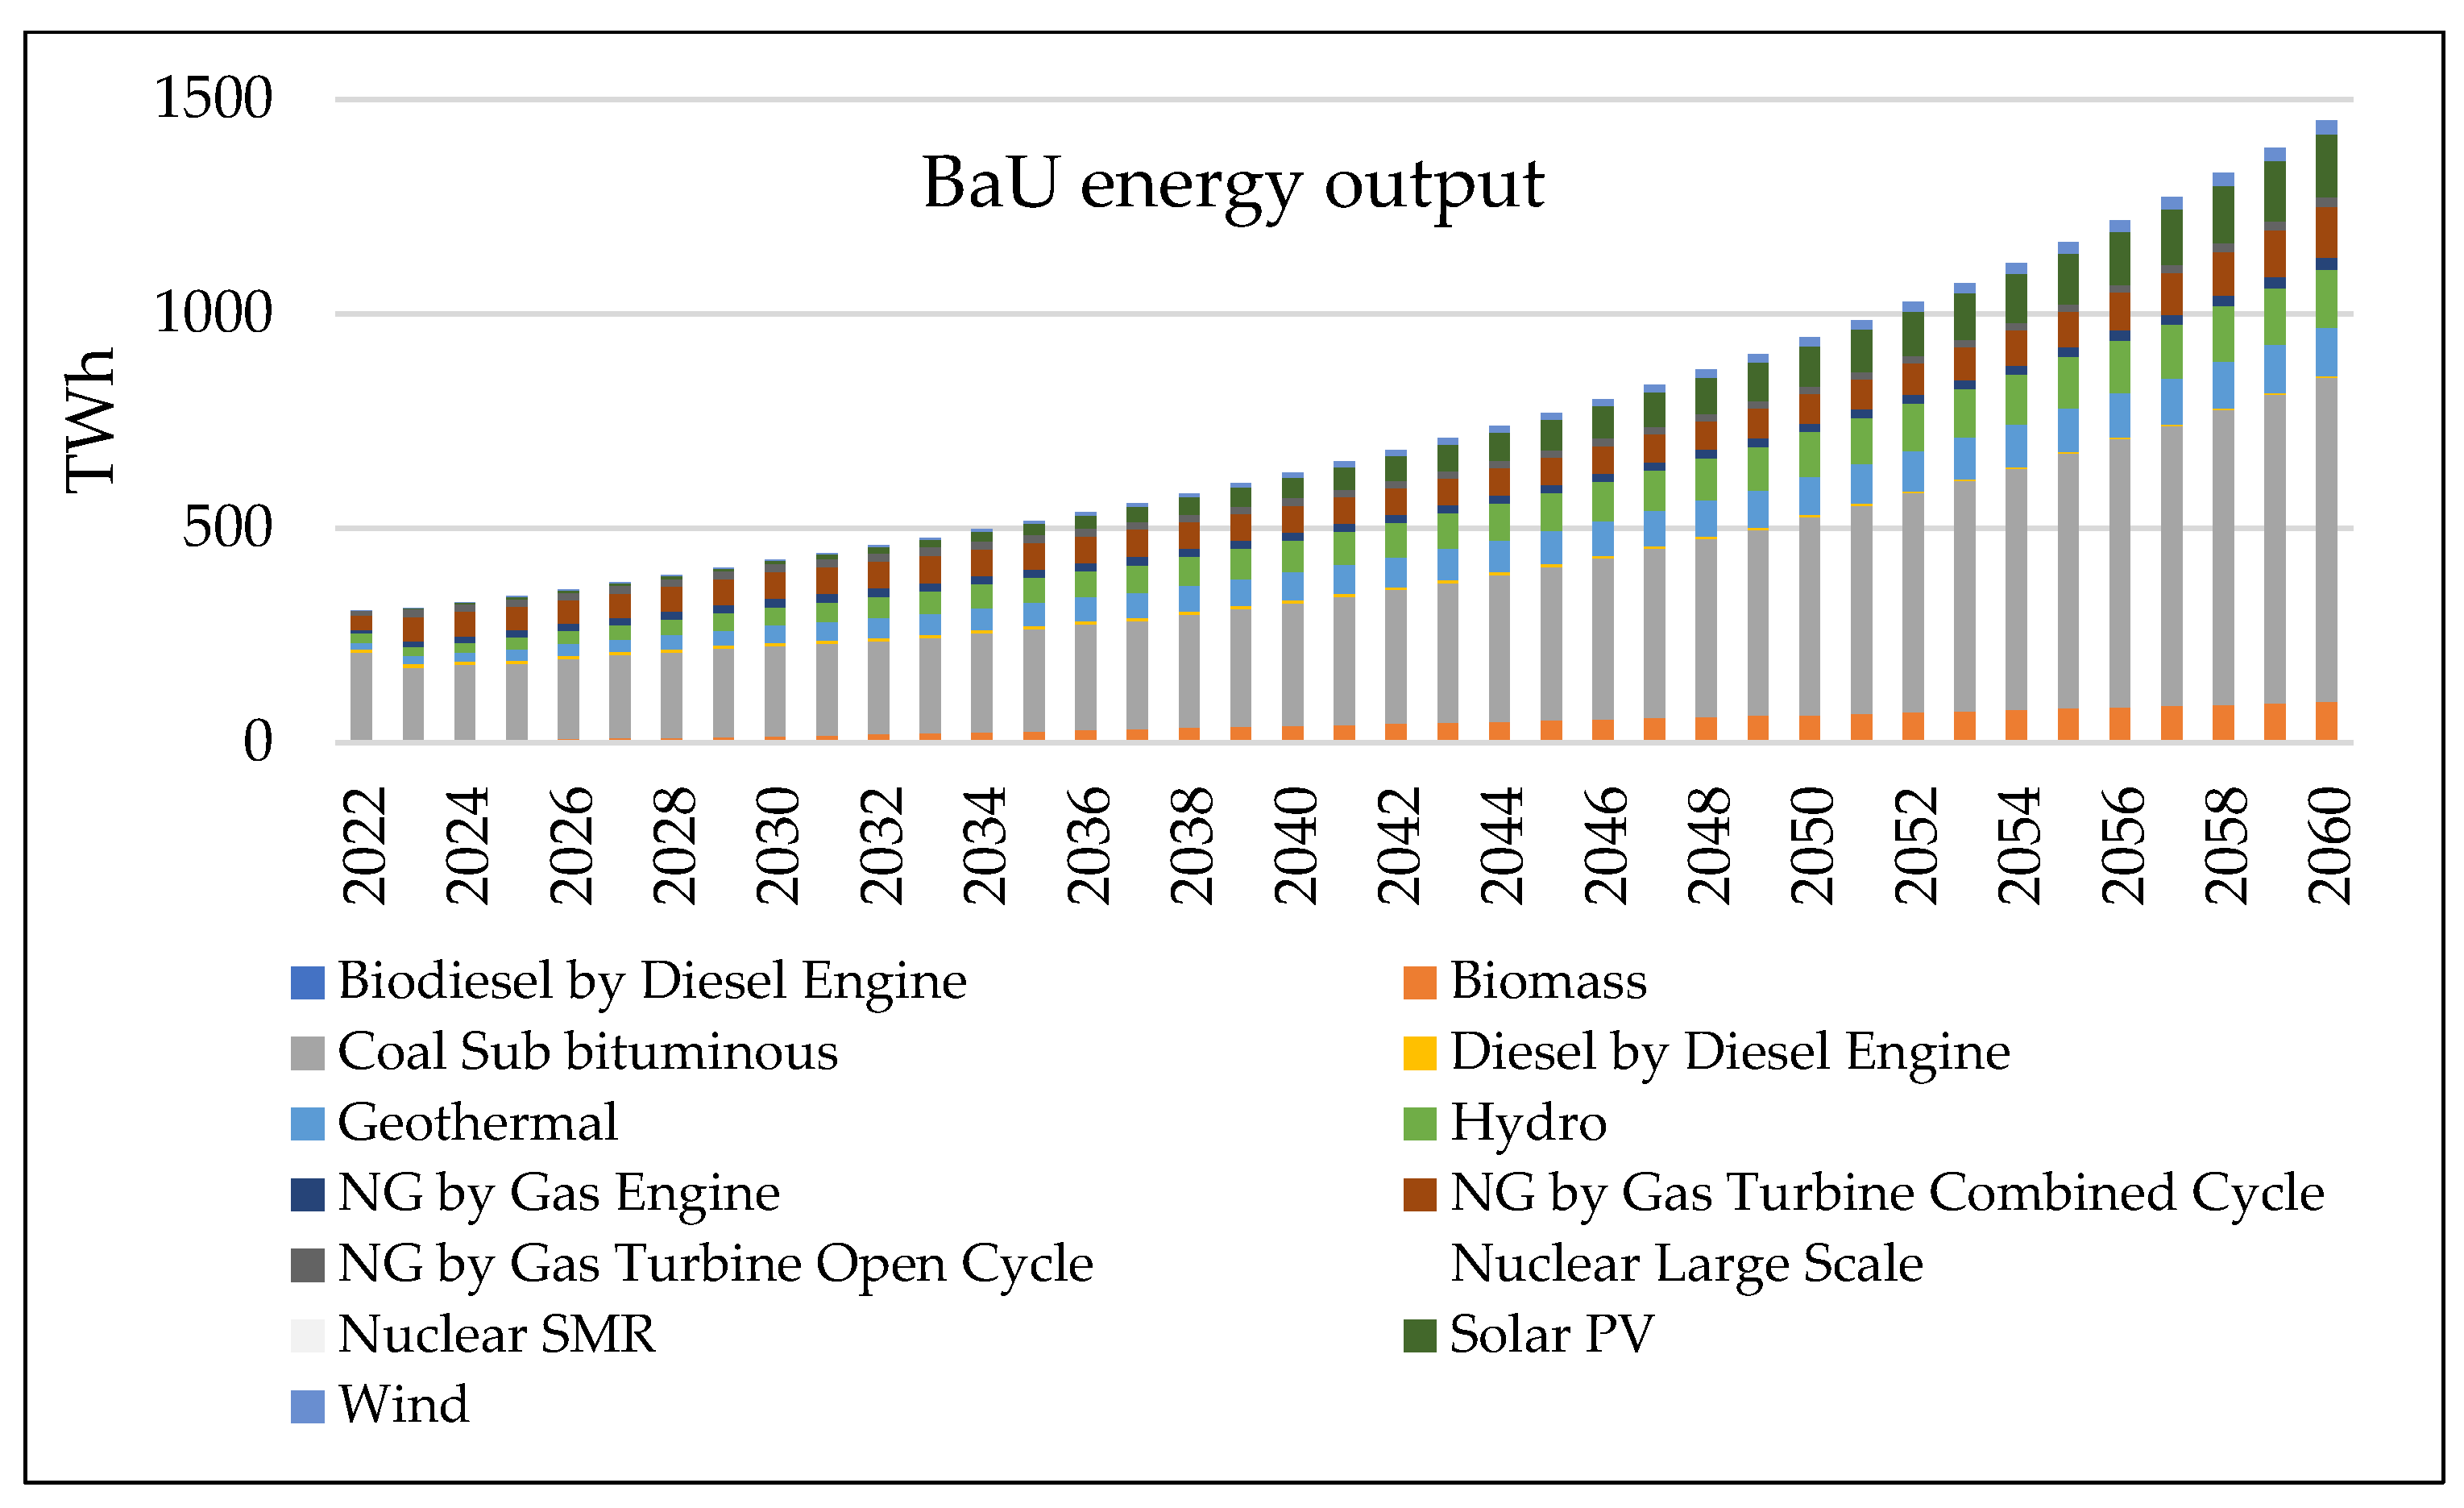
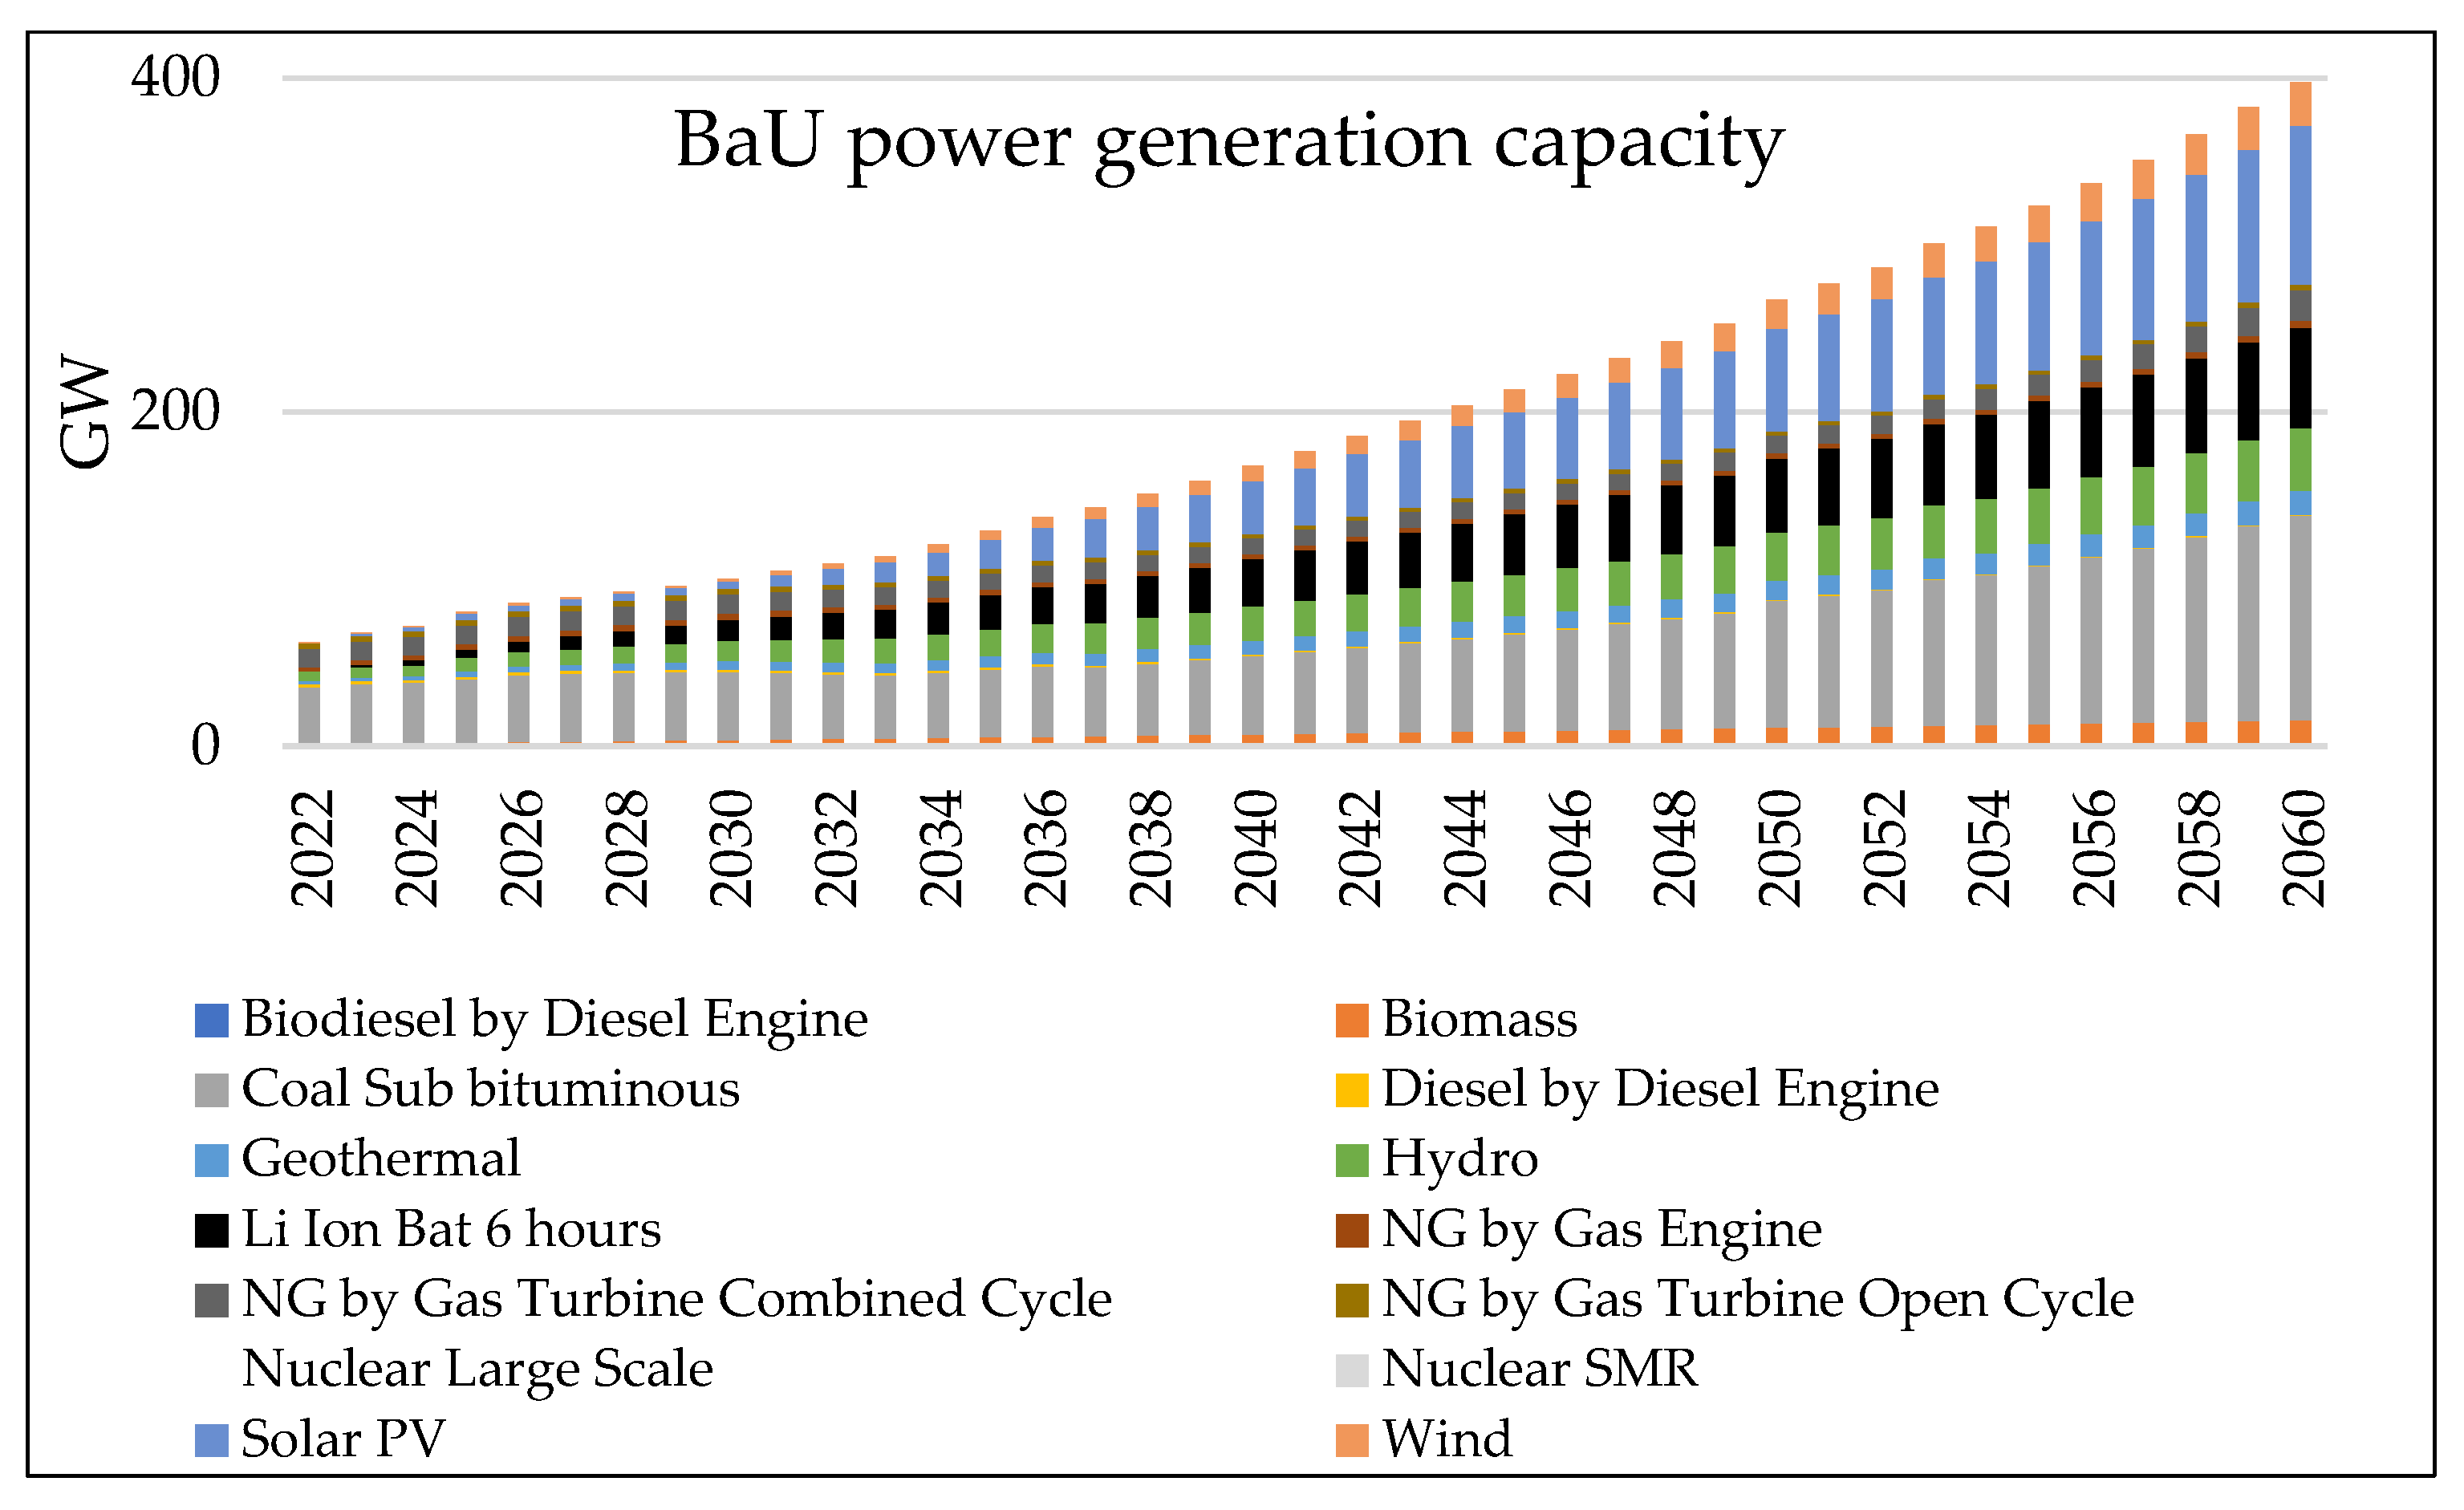
- BaU Scenario
- 2.
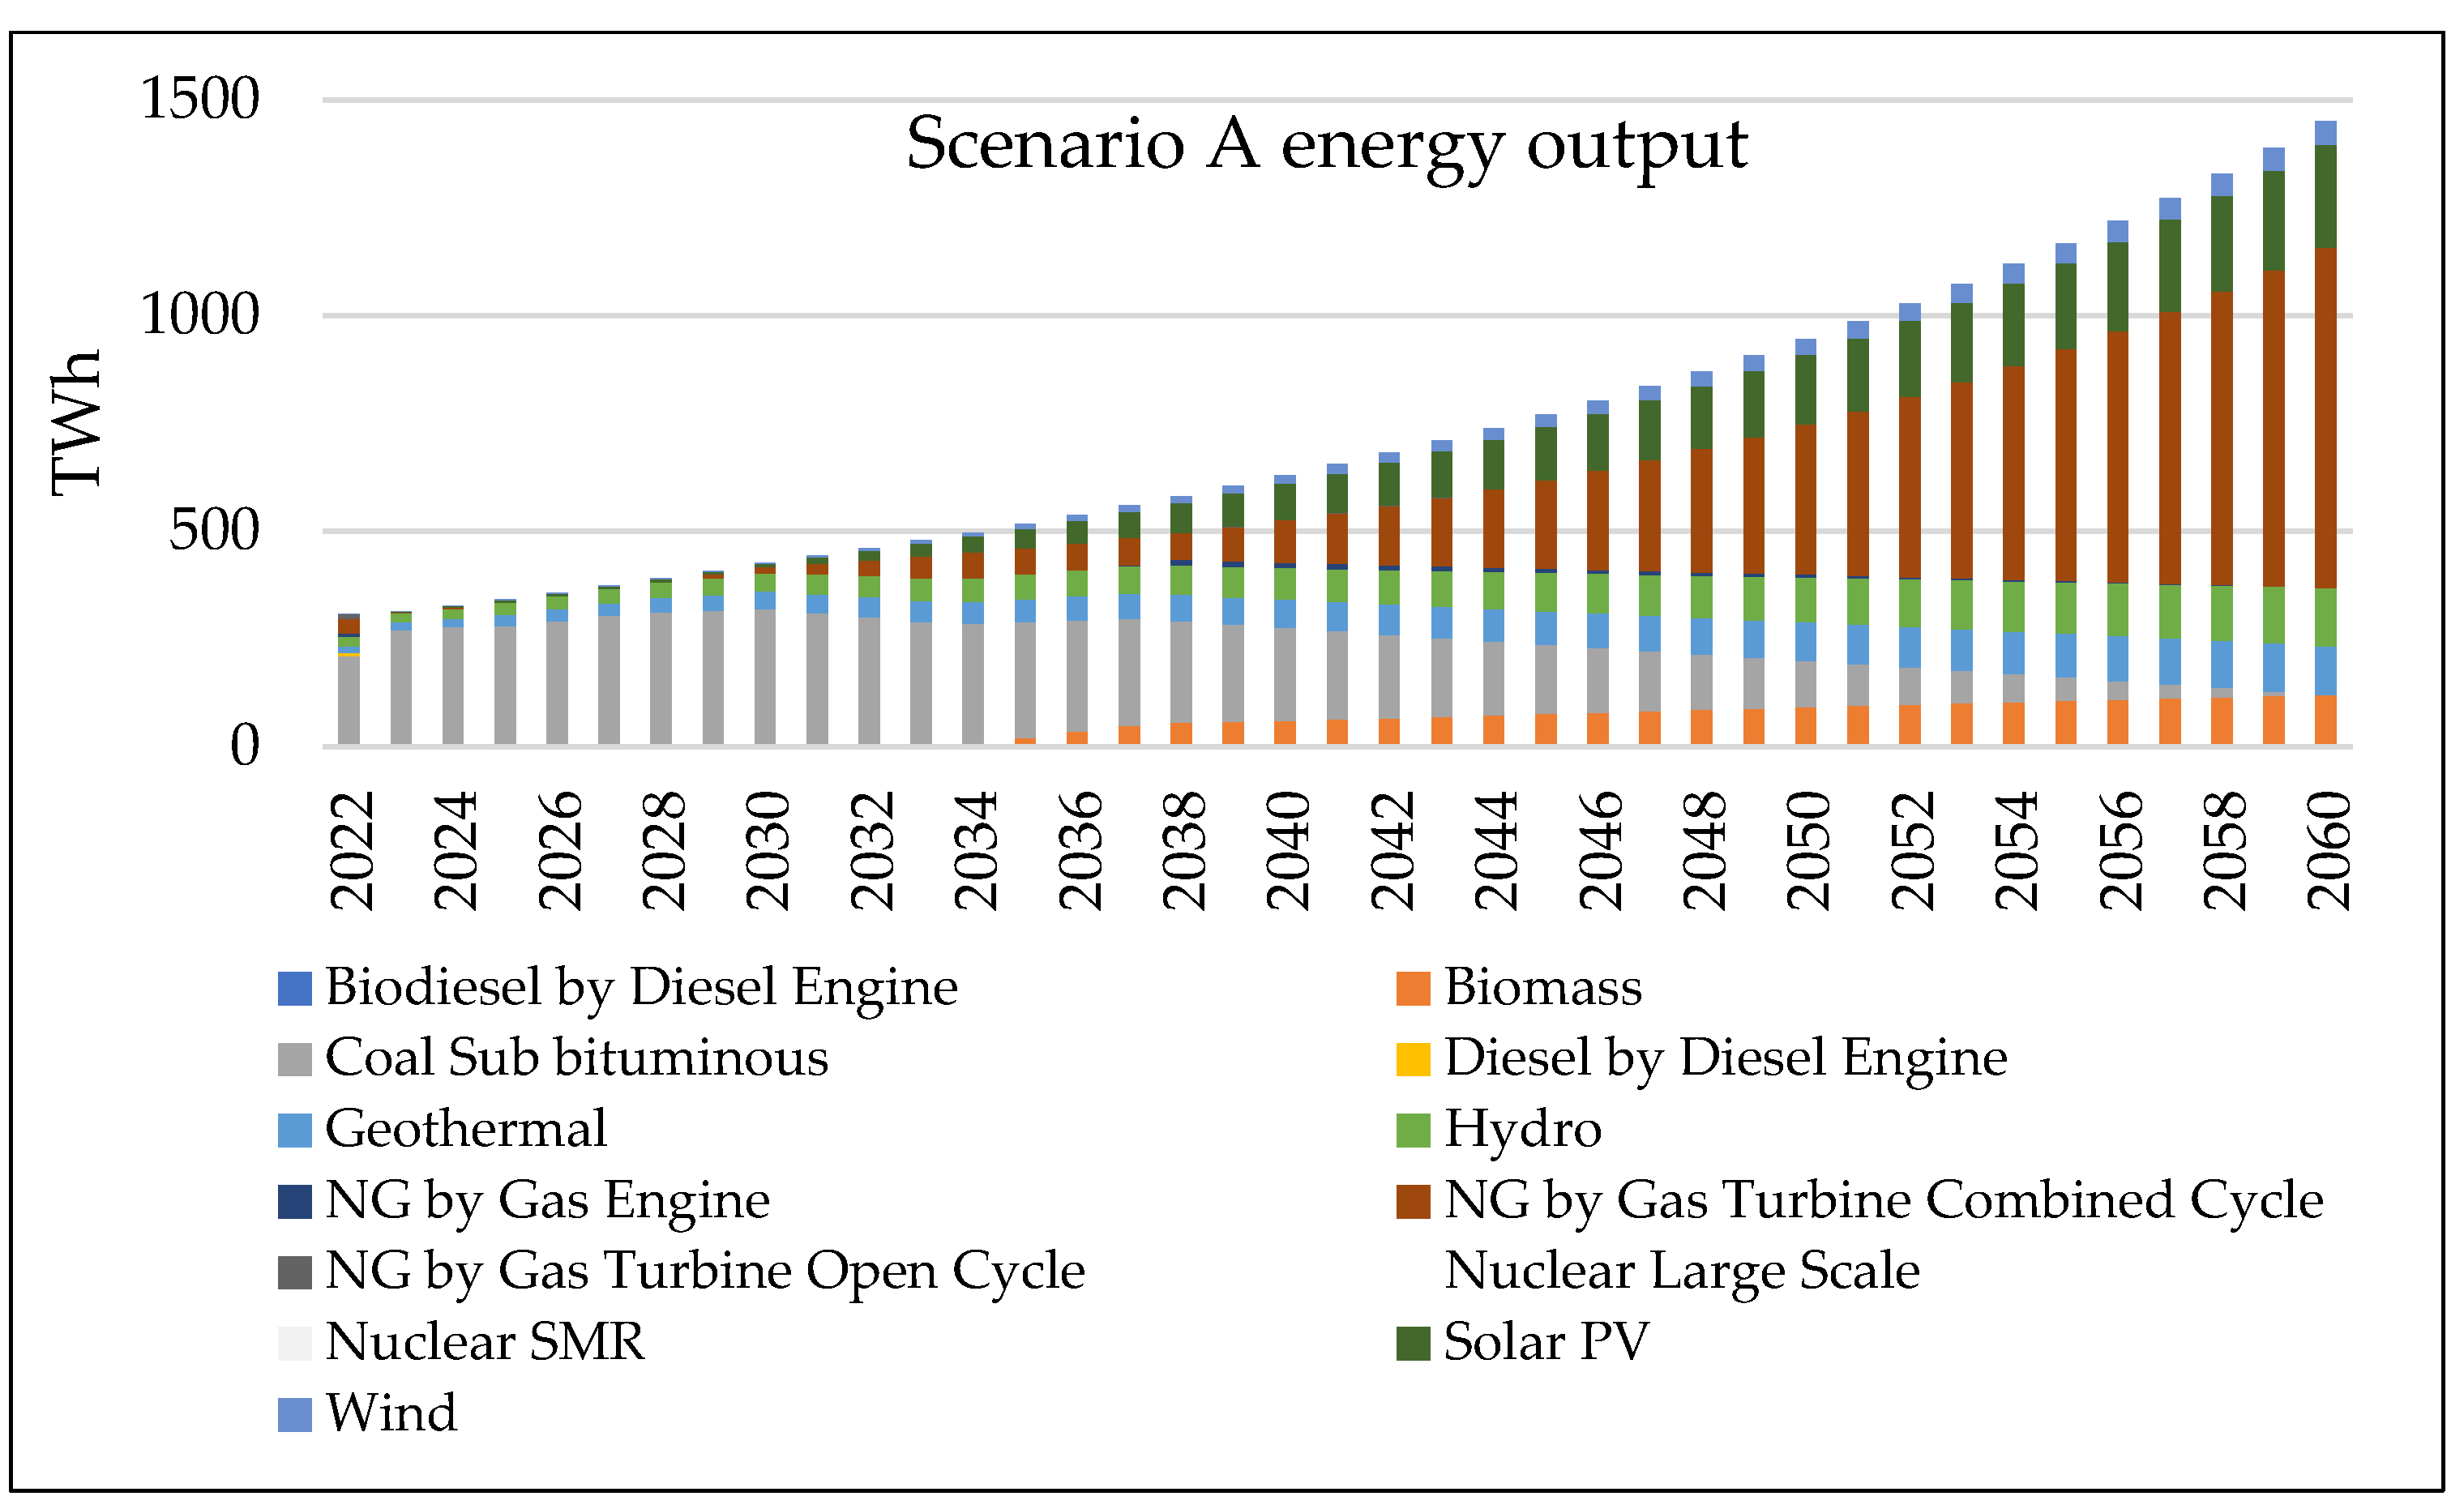
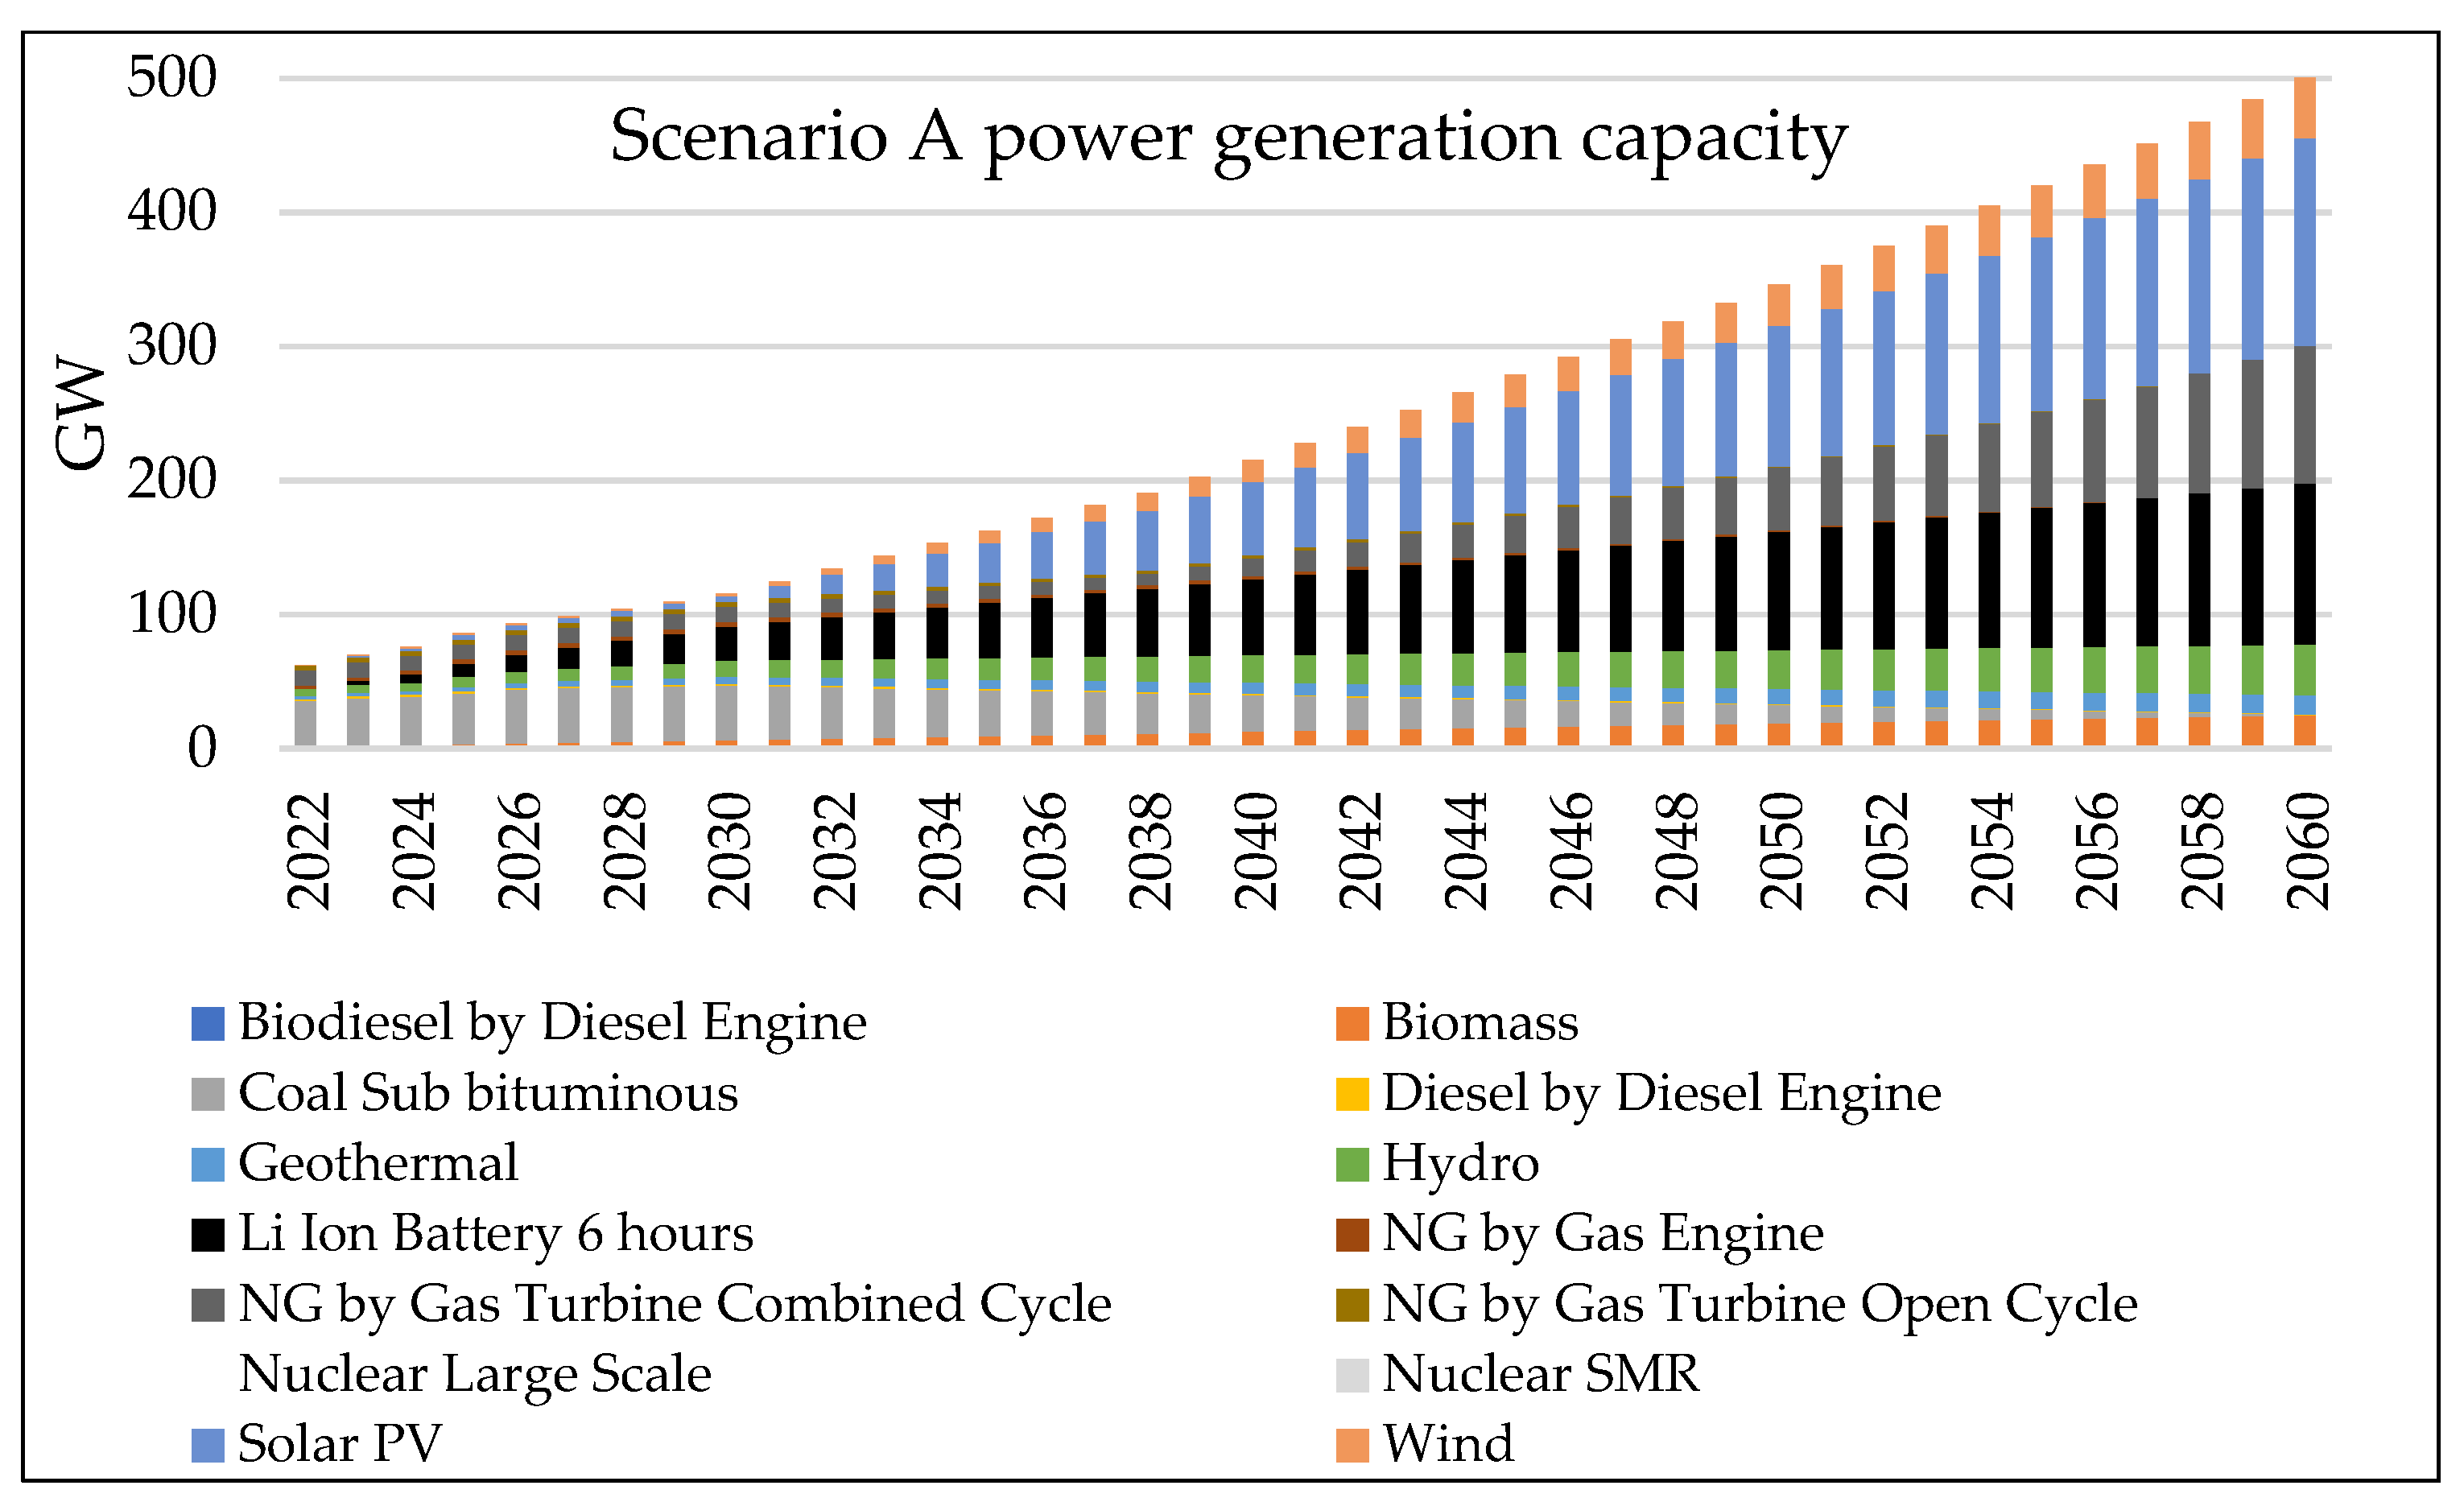
- Scenario A
- 3.
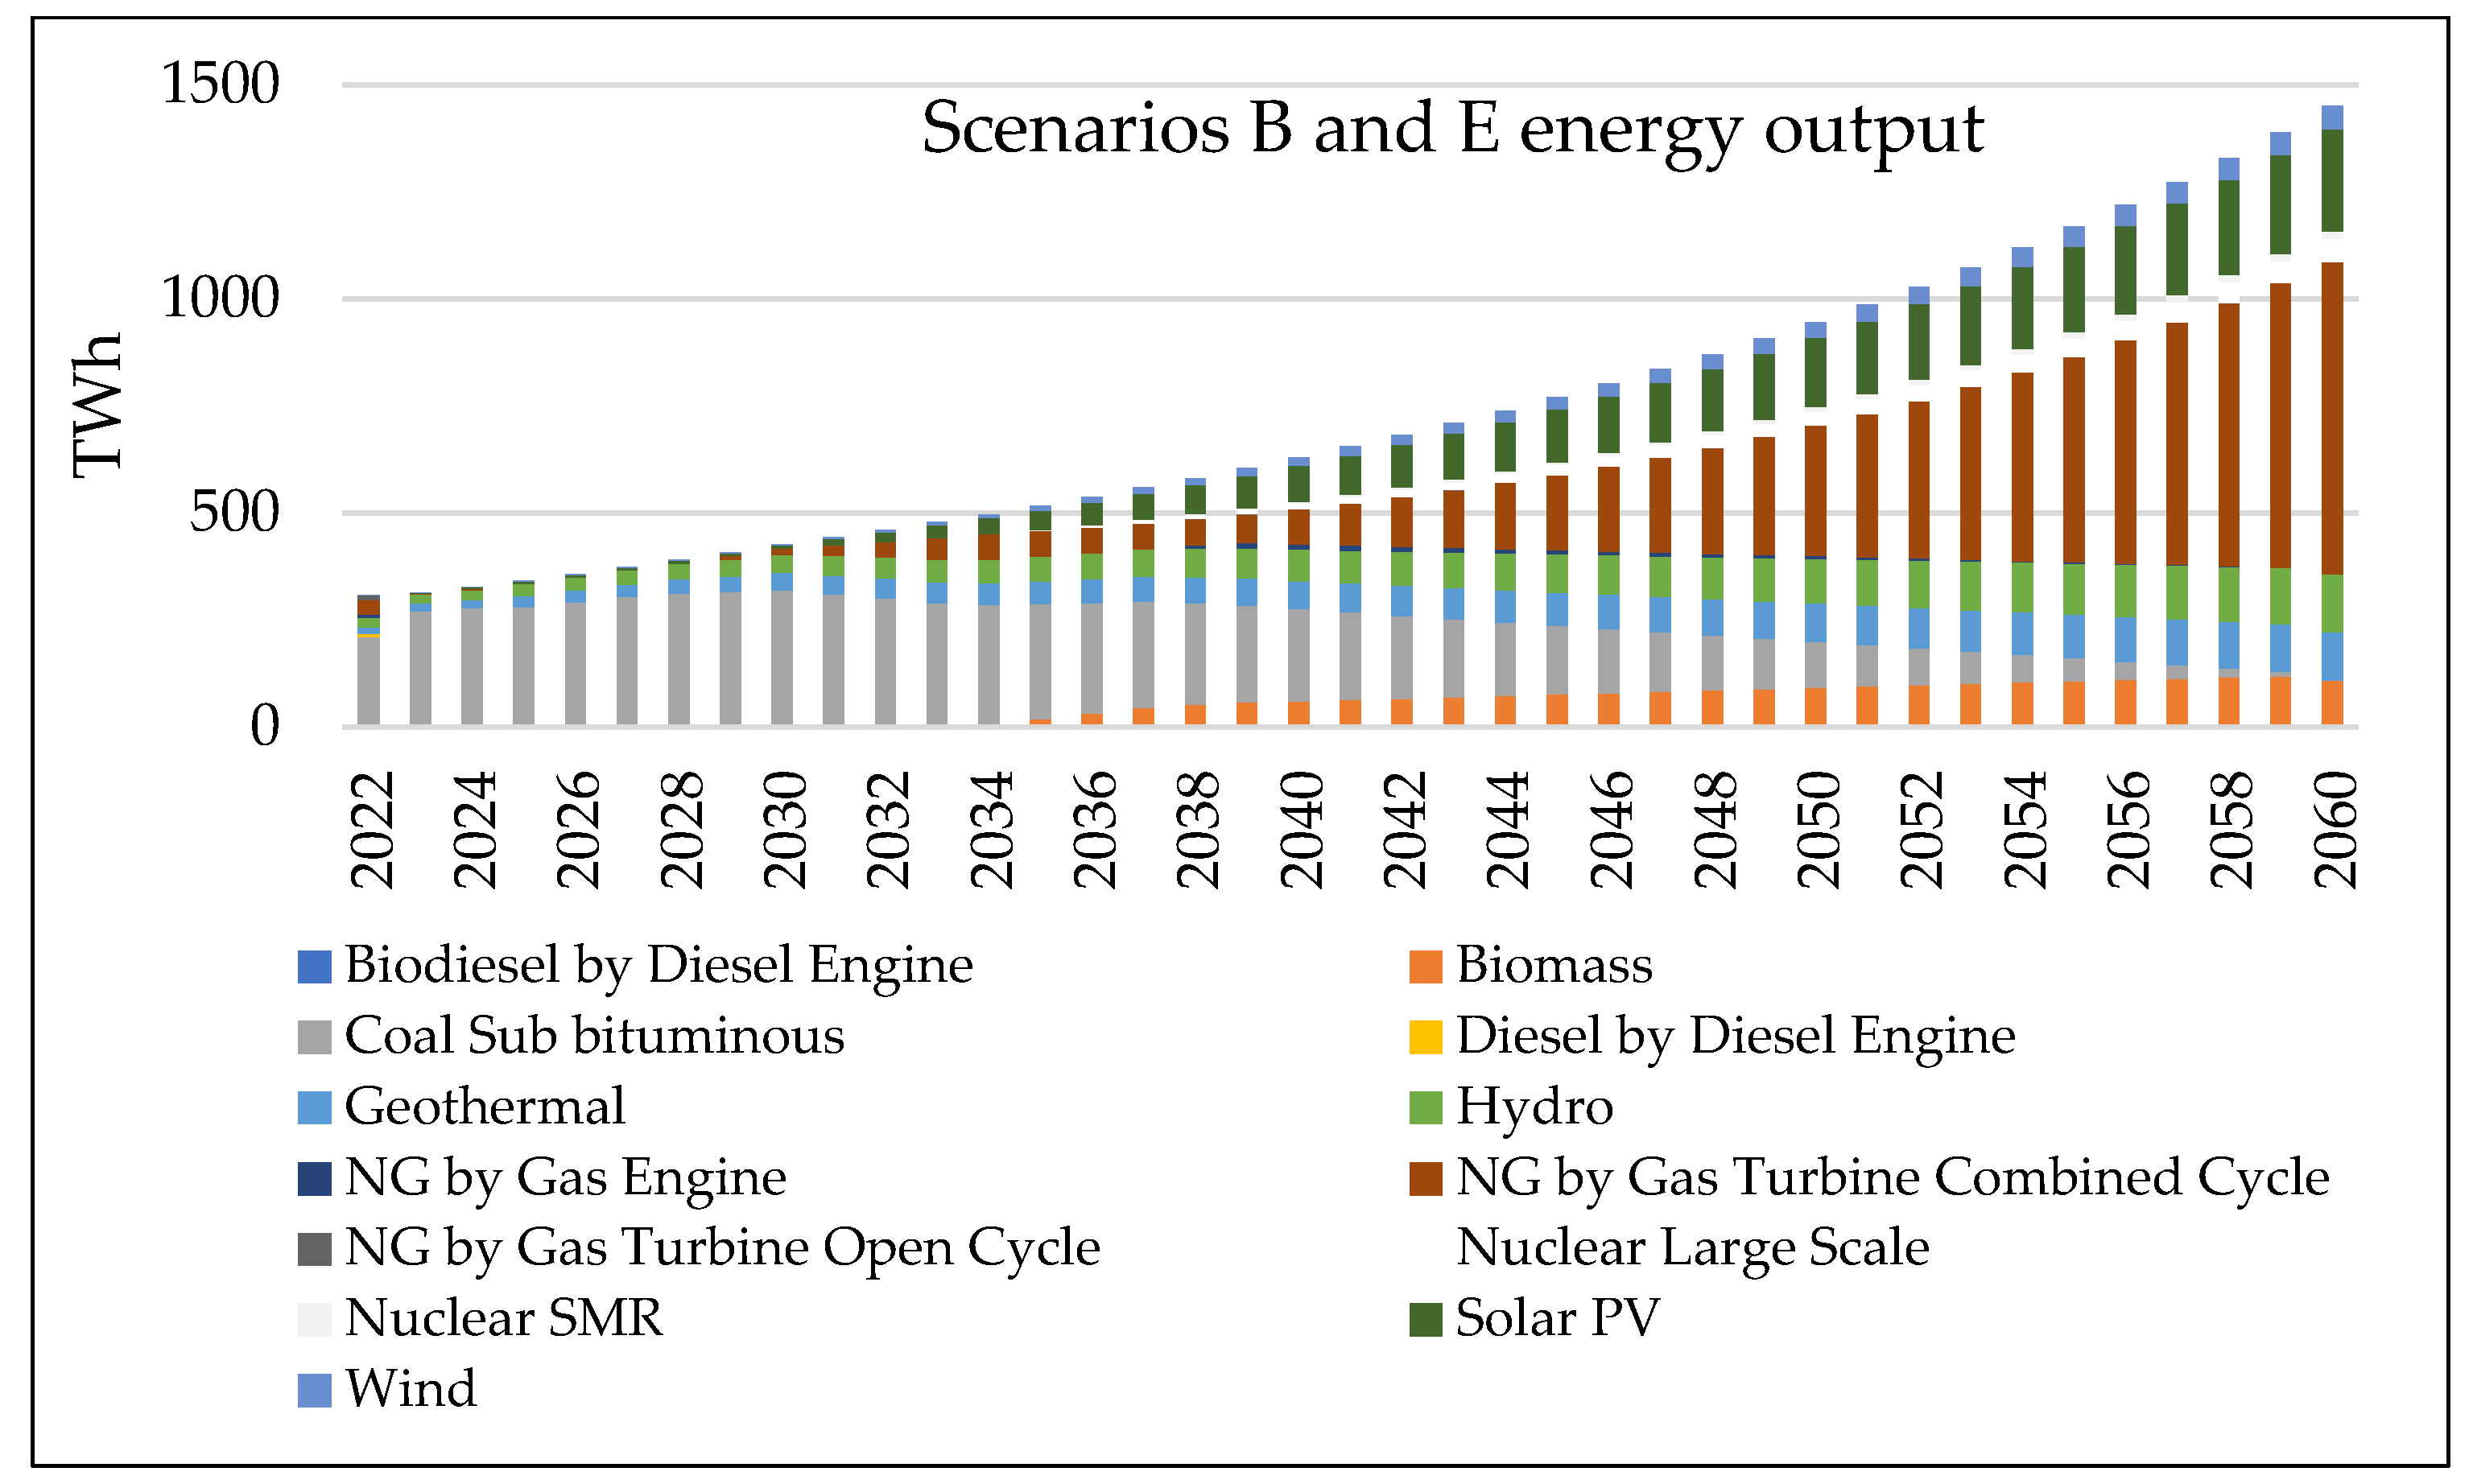
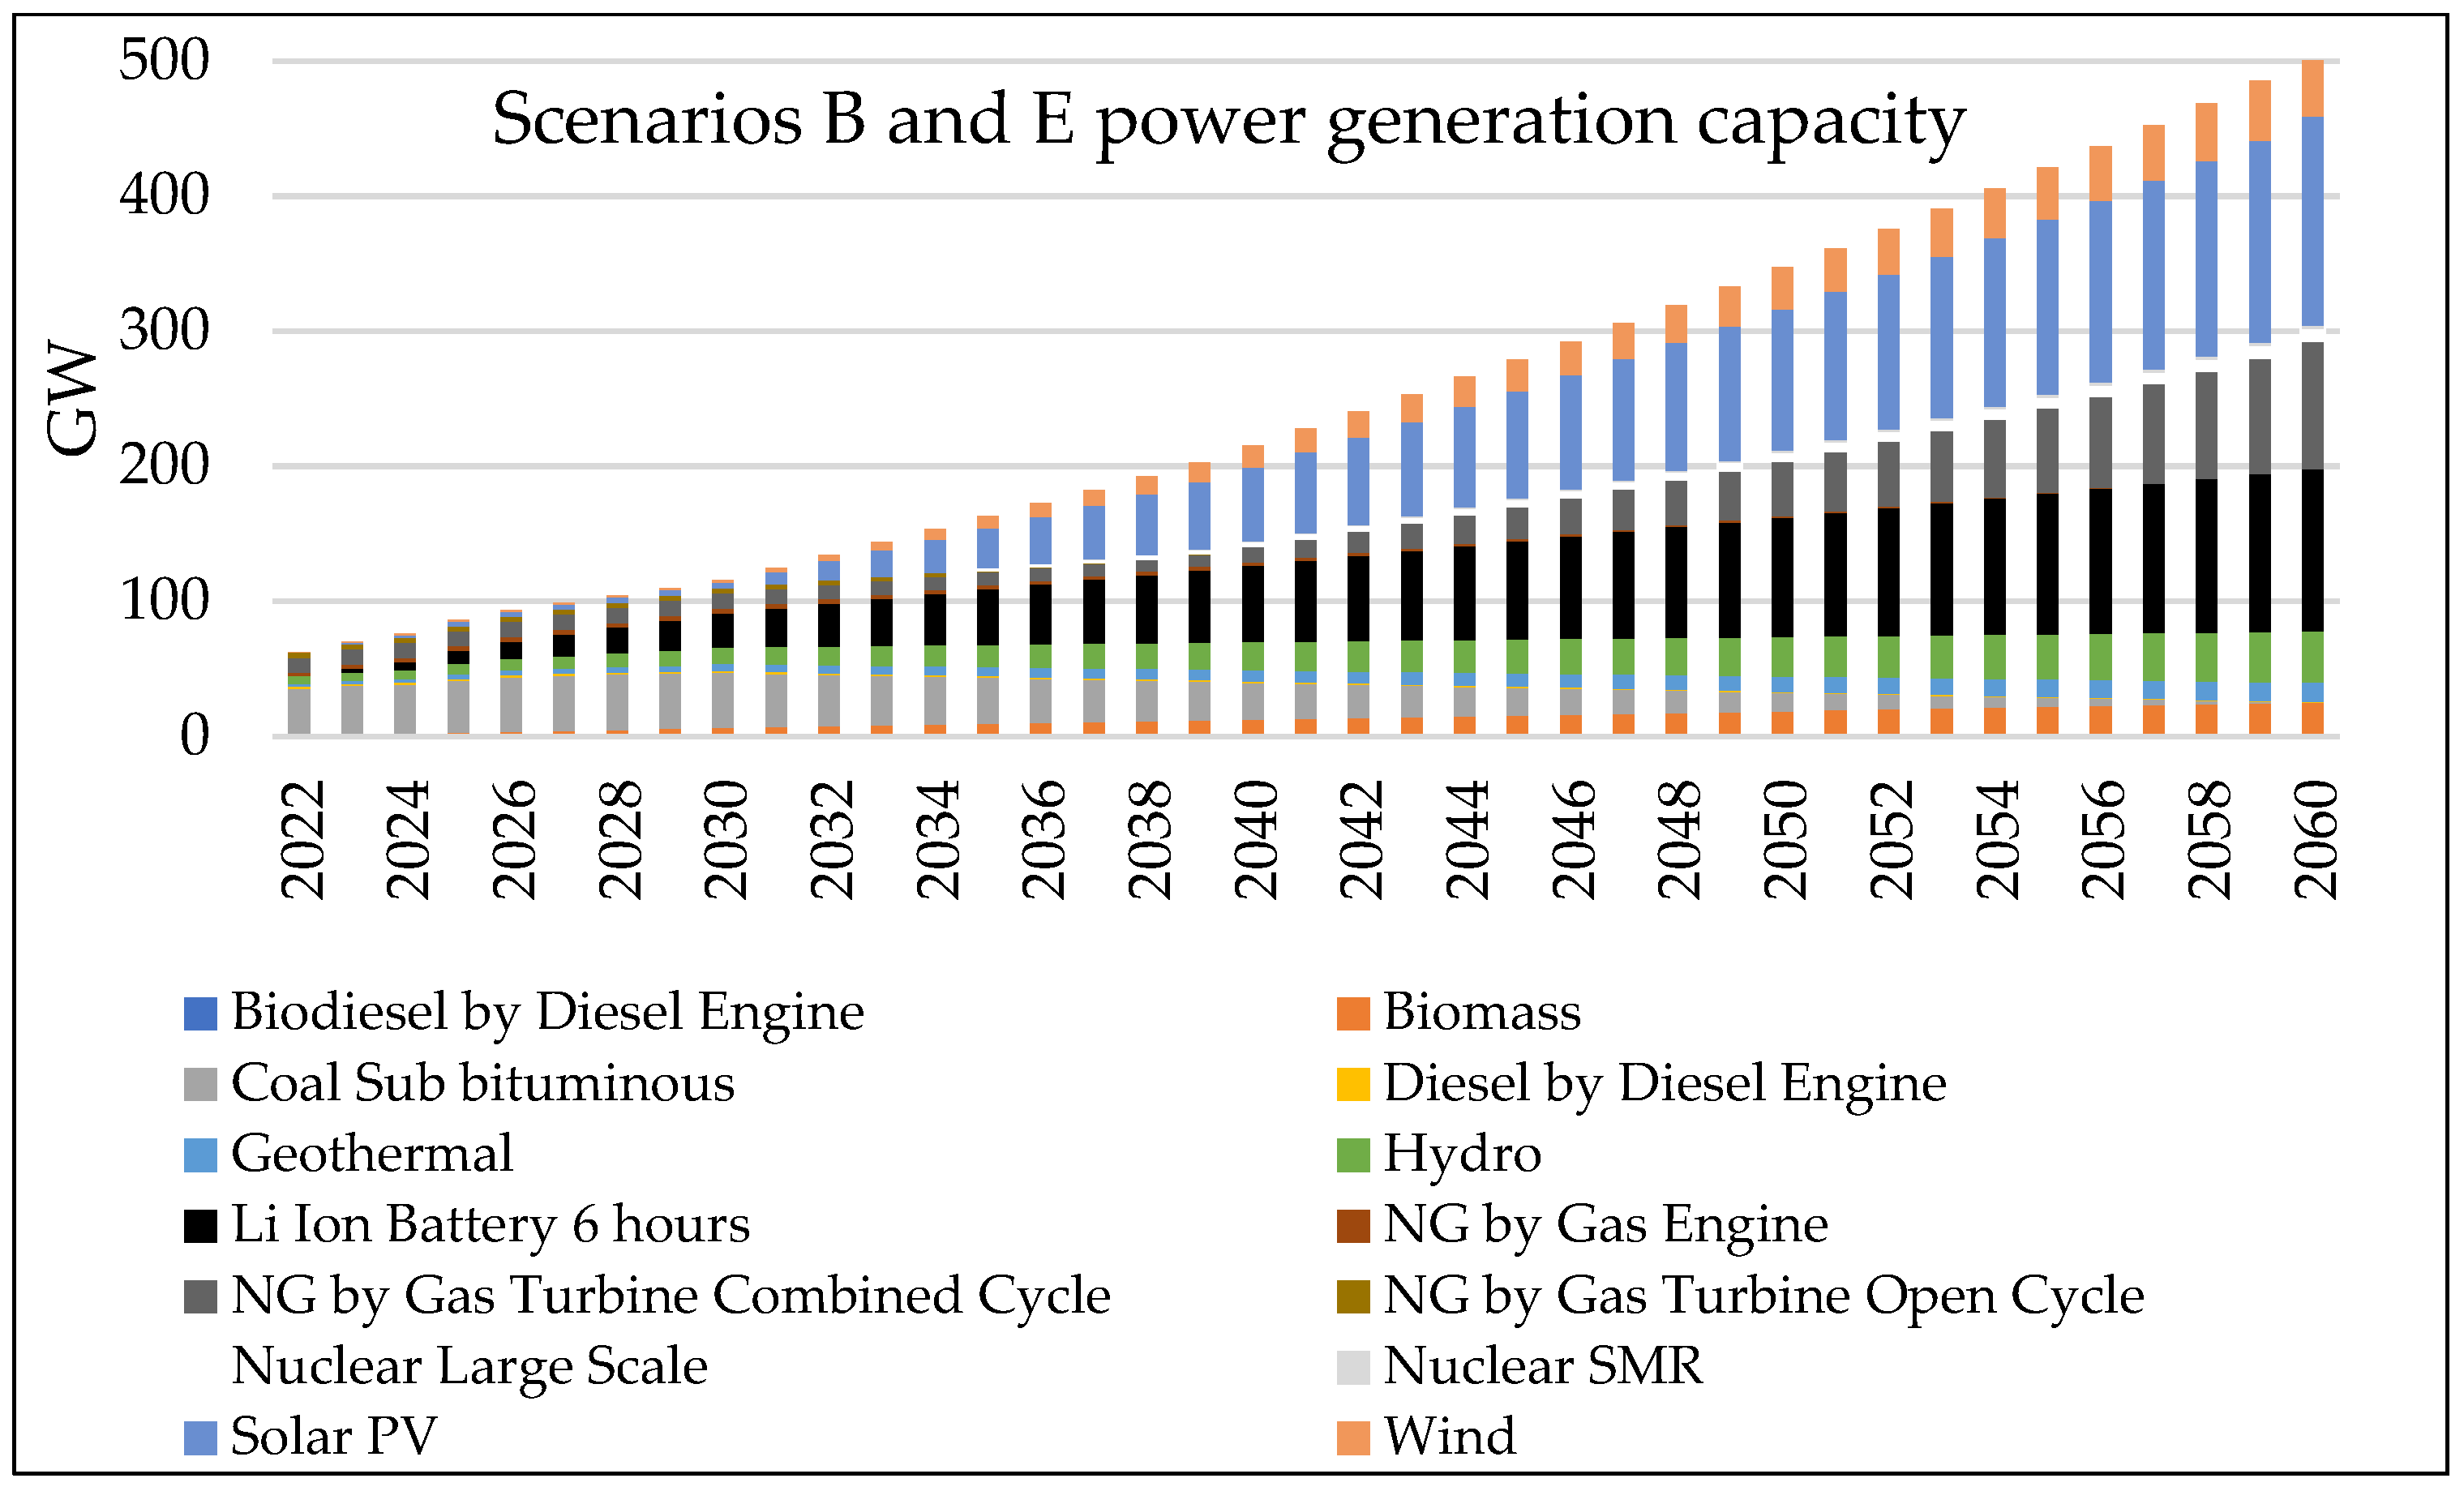
- Scenario B and E
- 4.
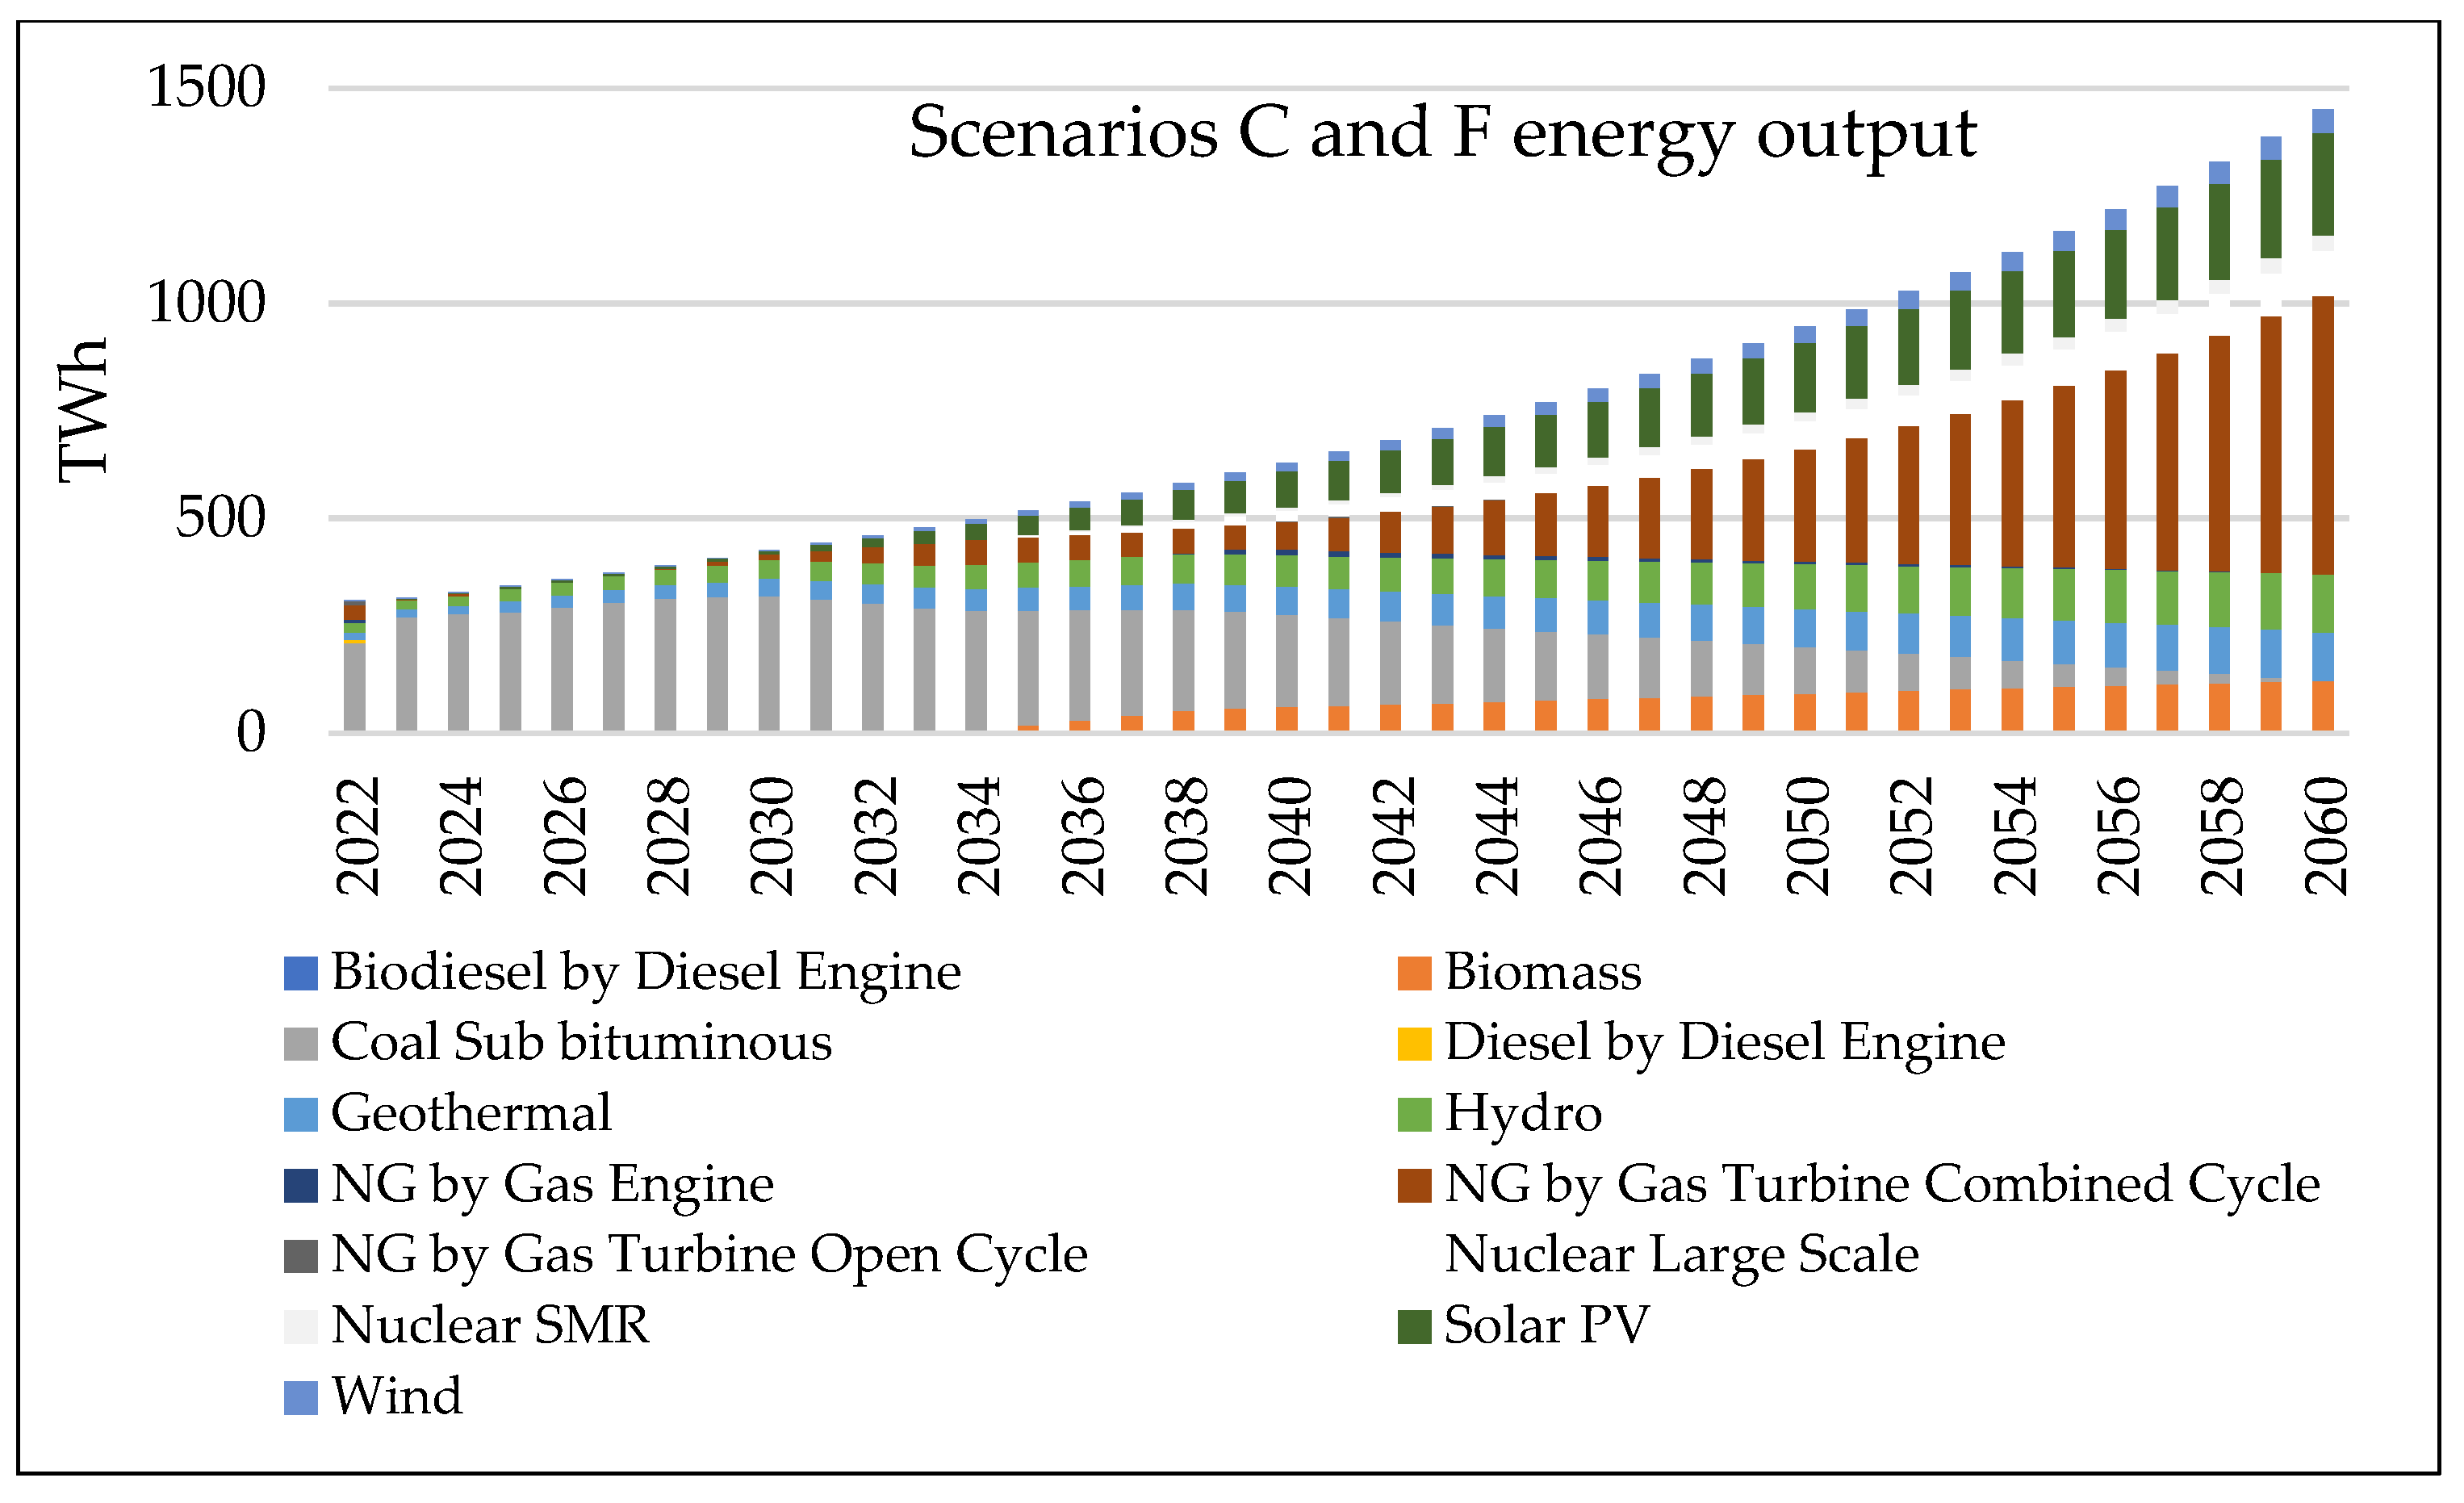
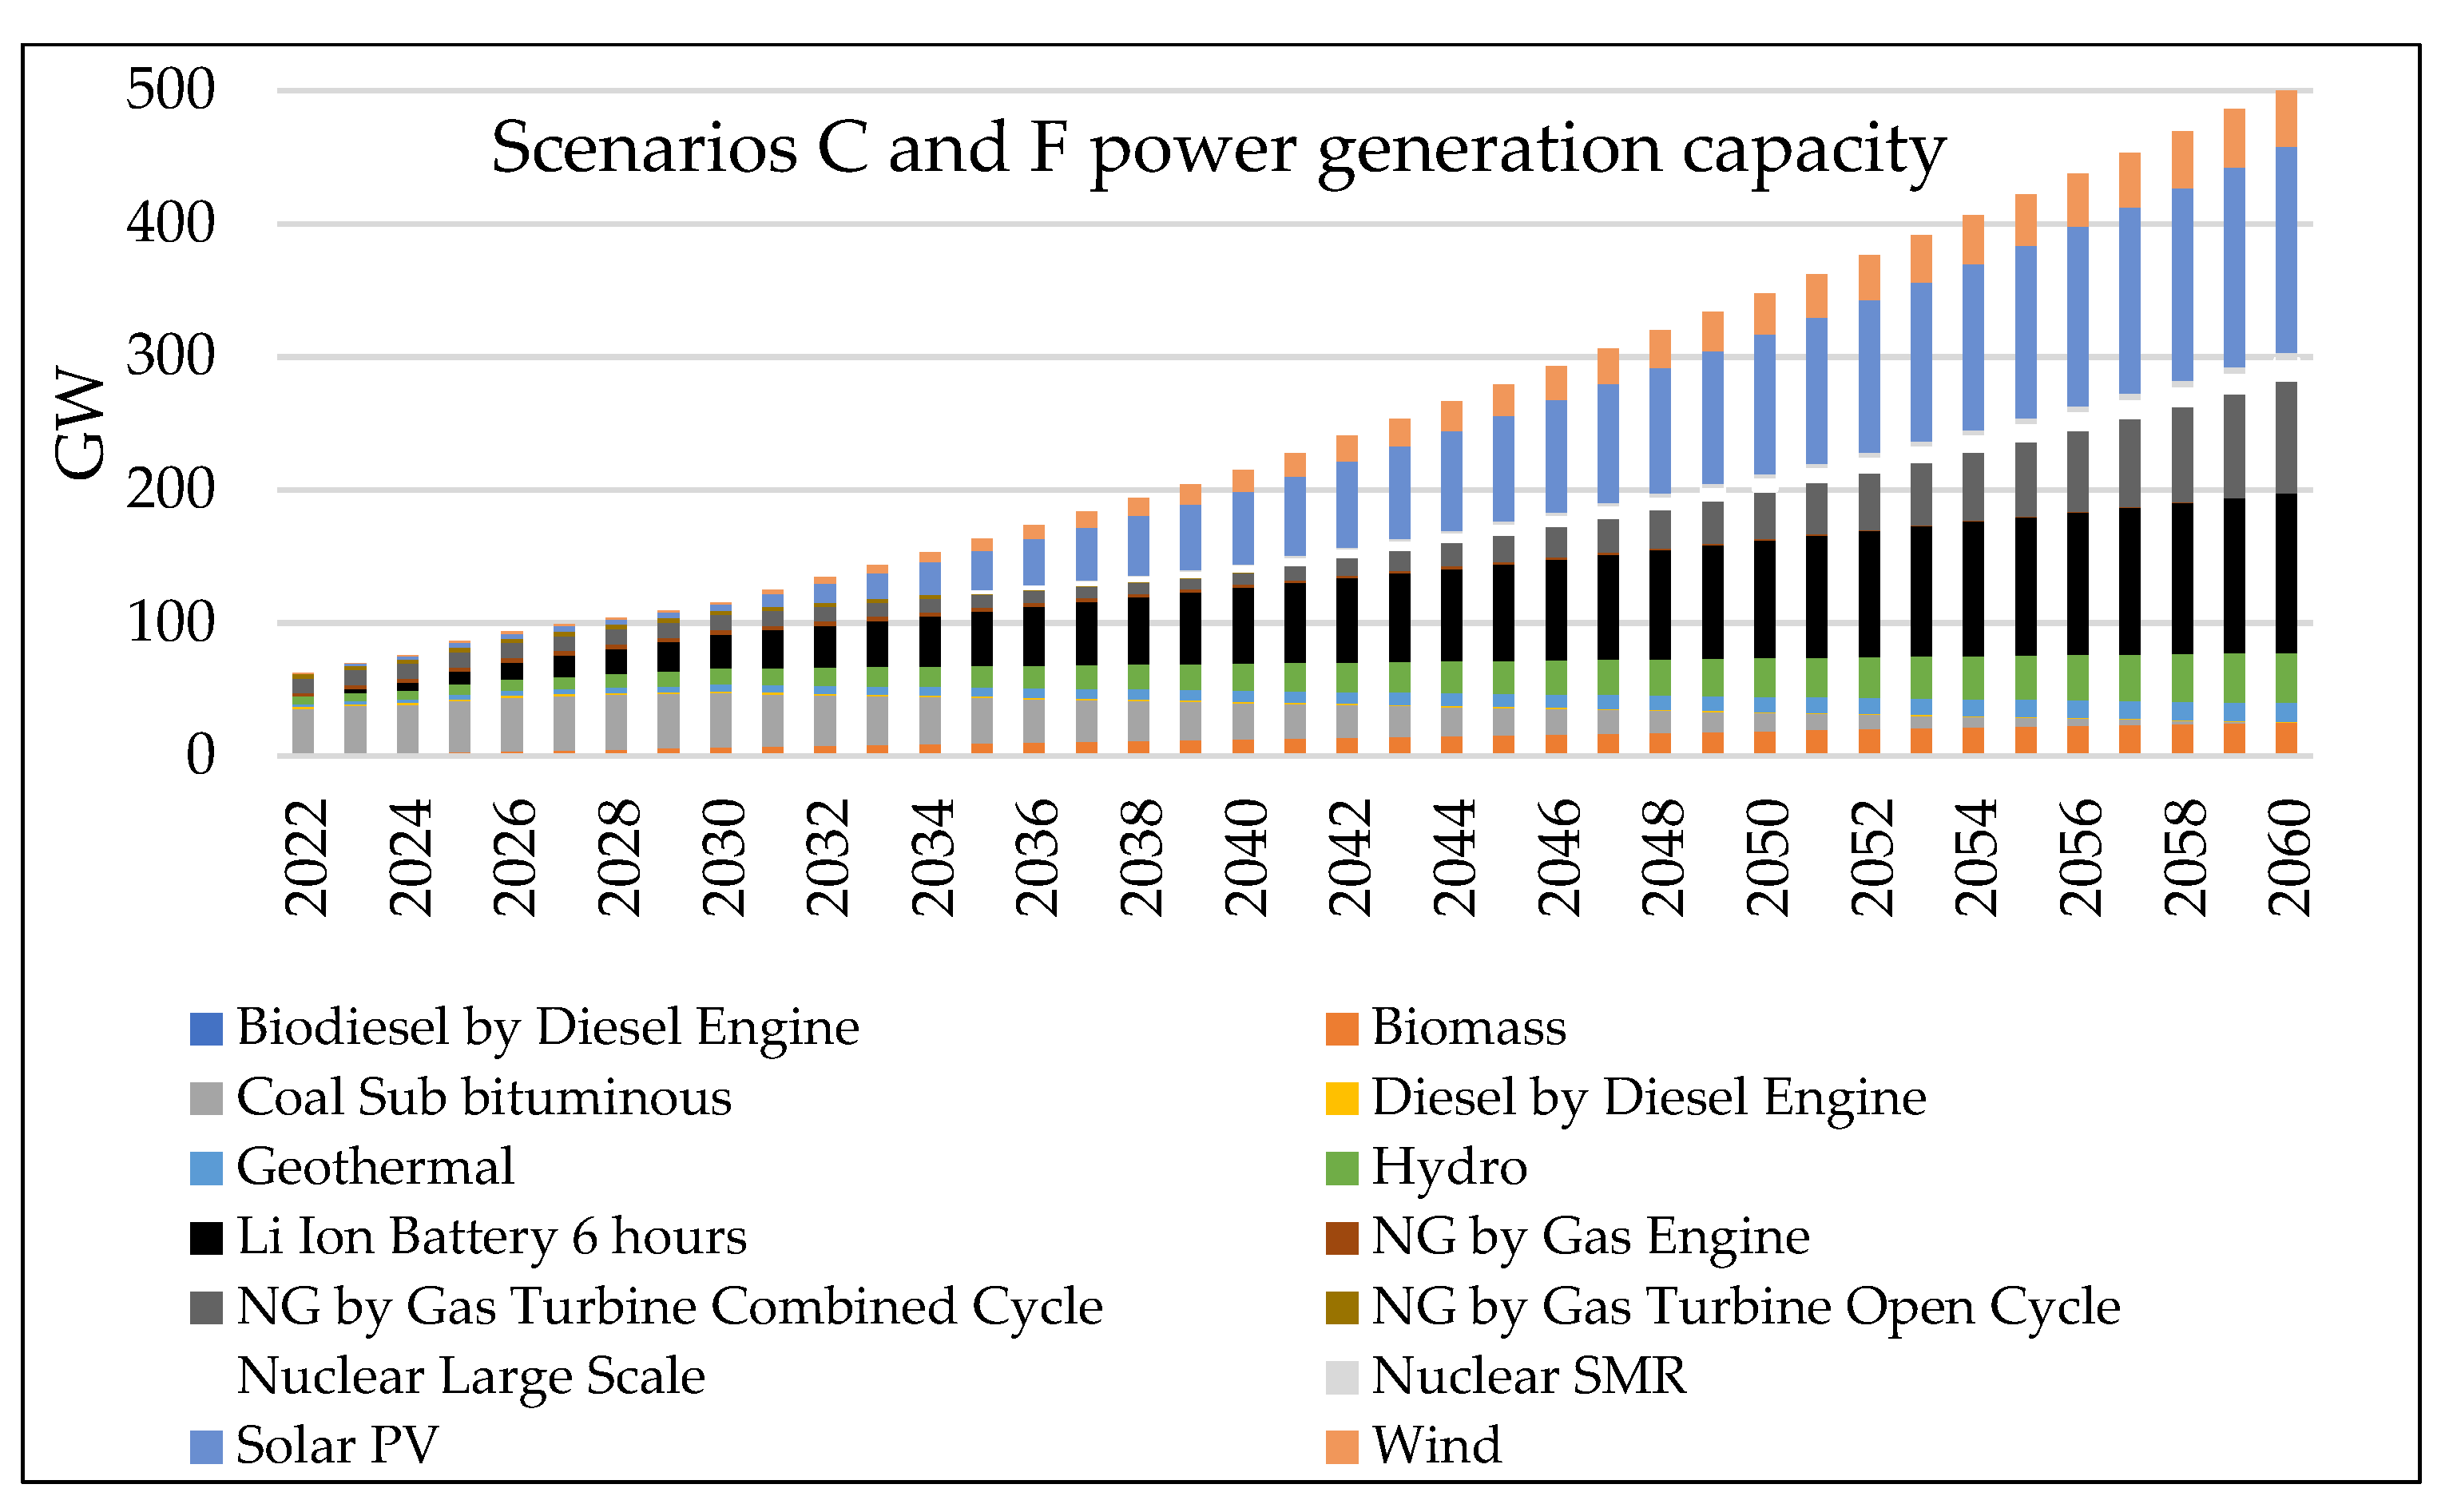
- Scenario C and F
- 5.
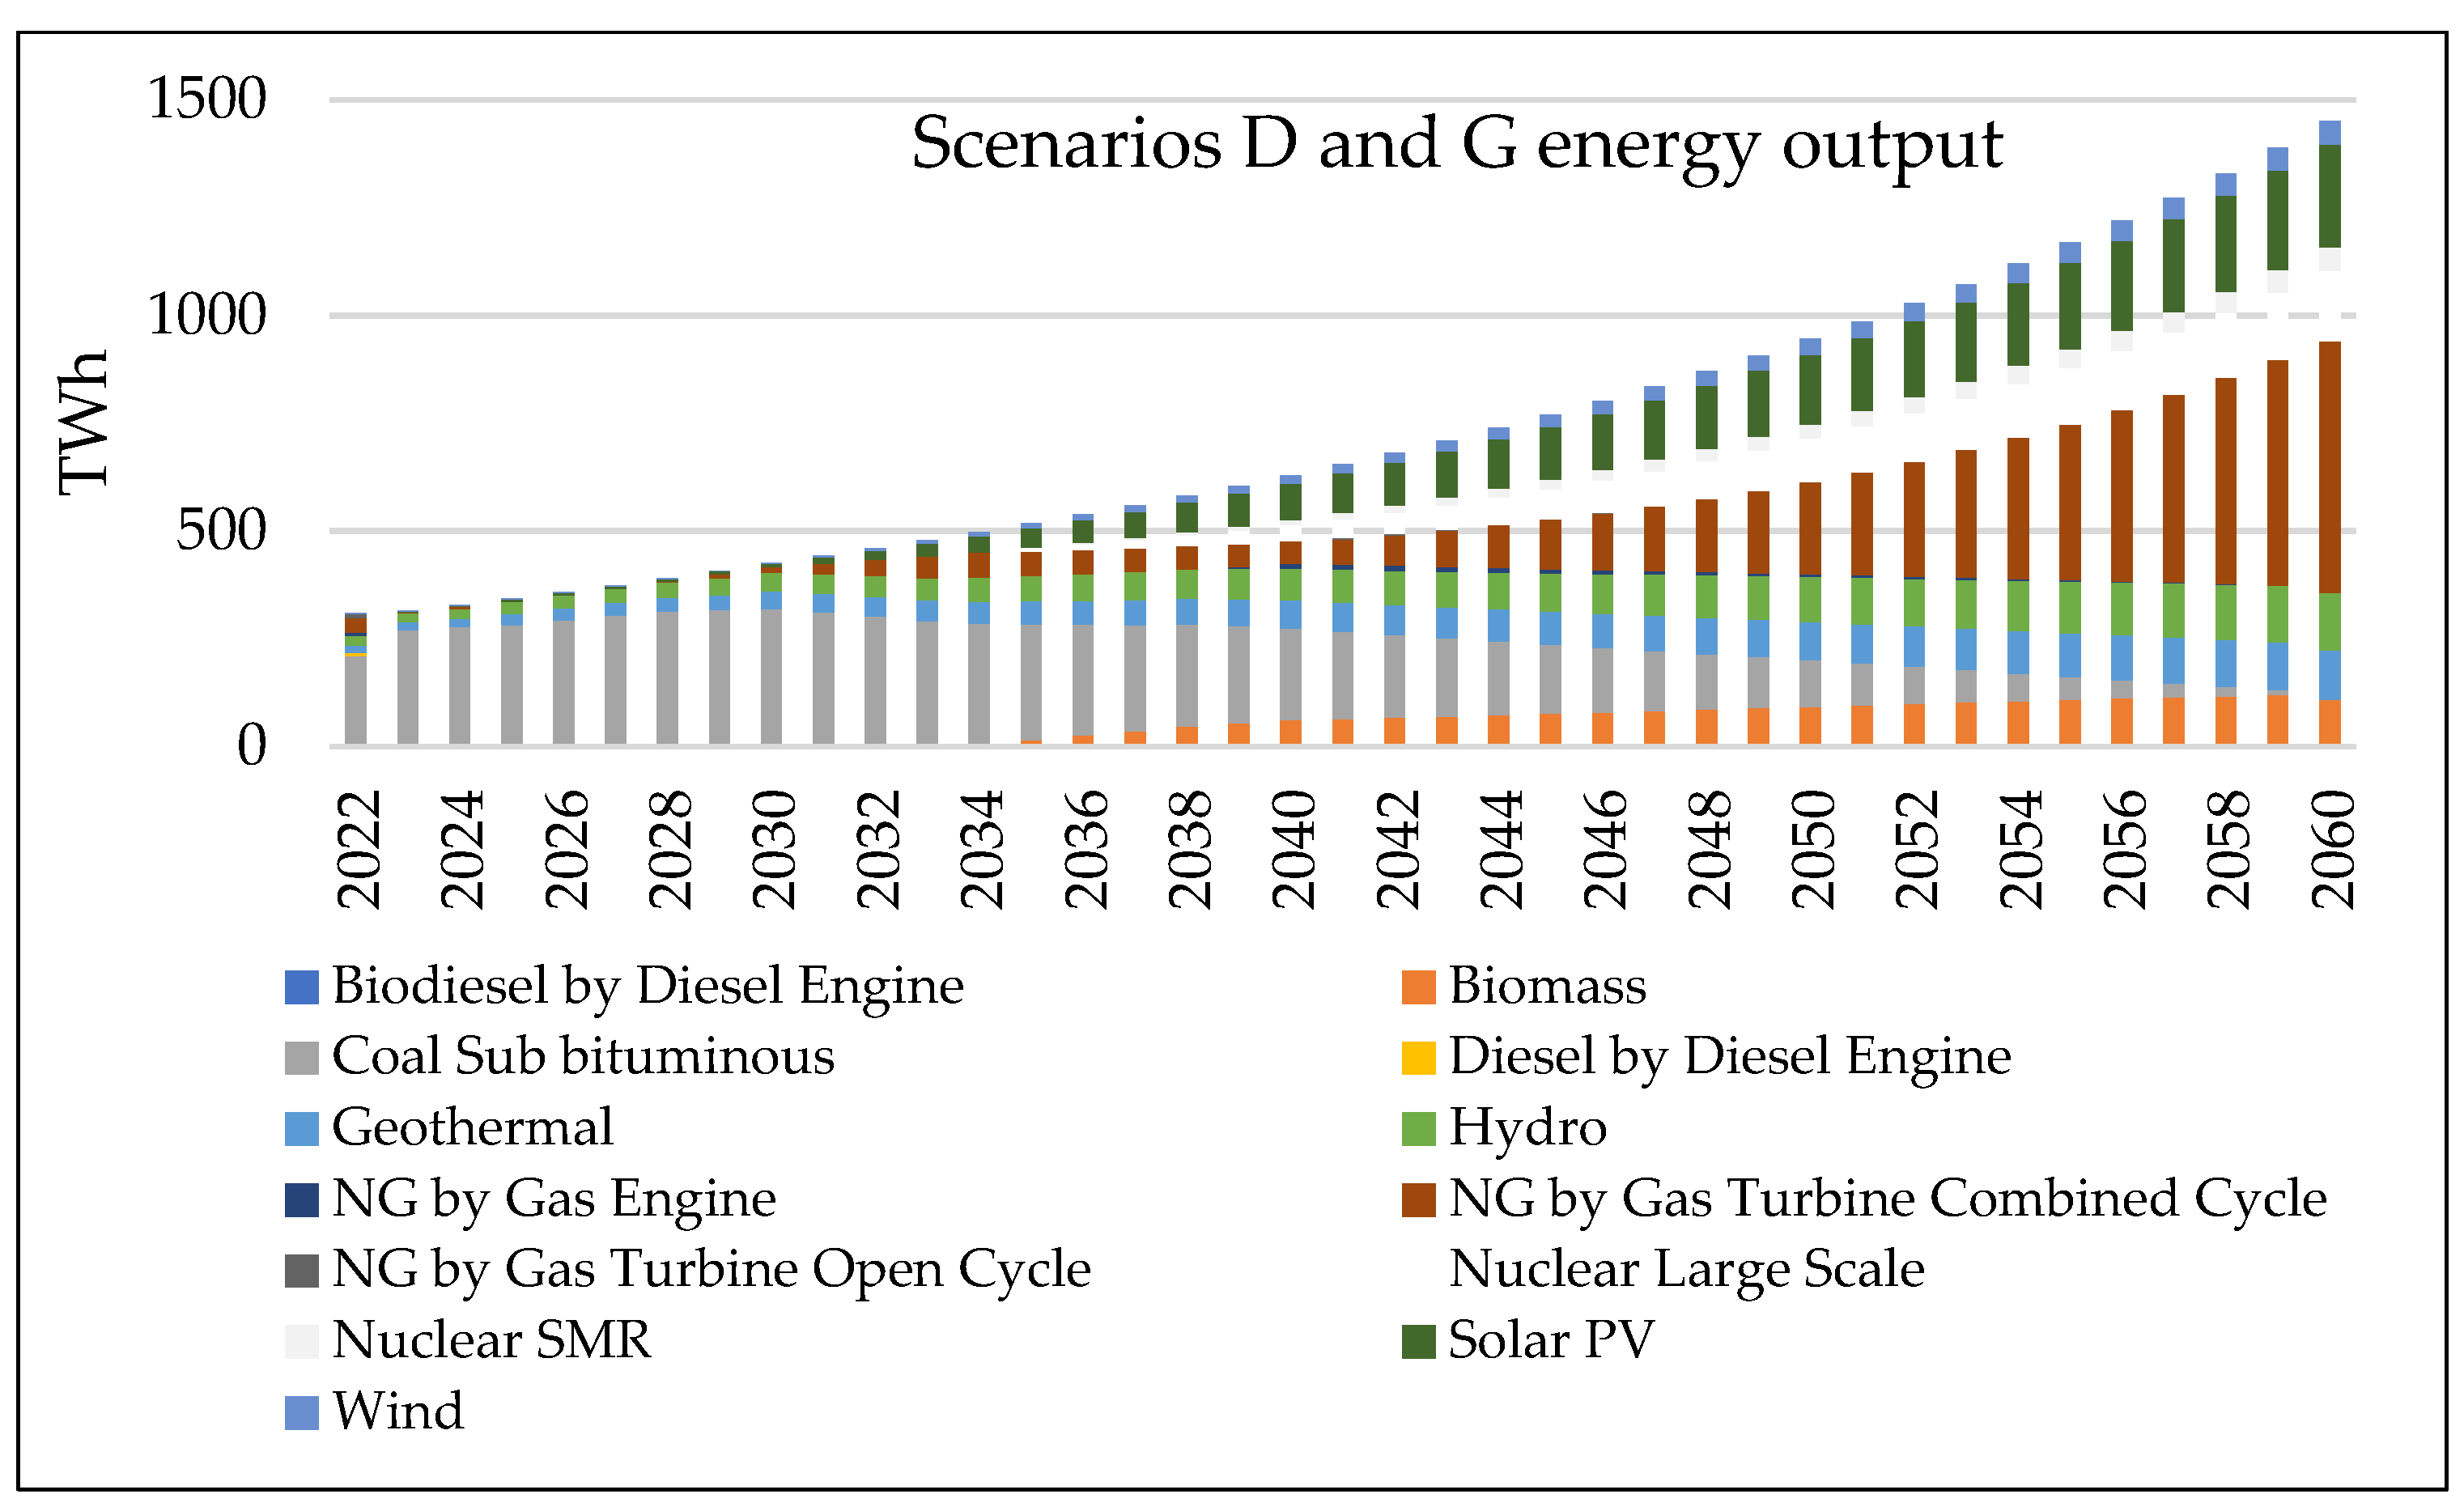
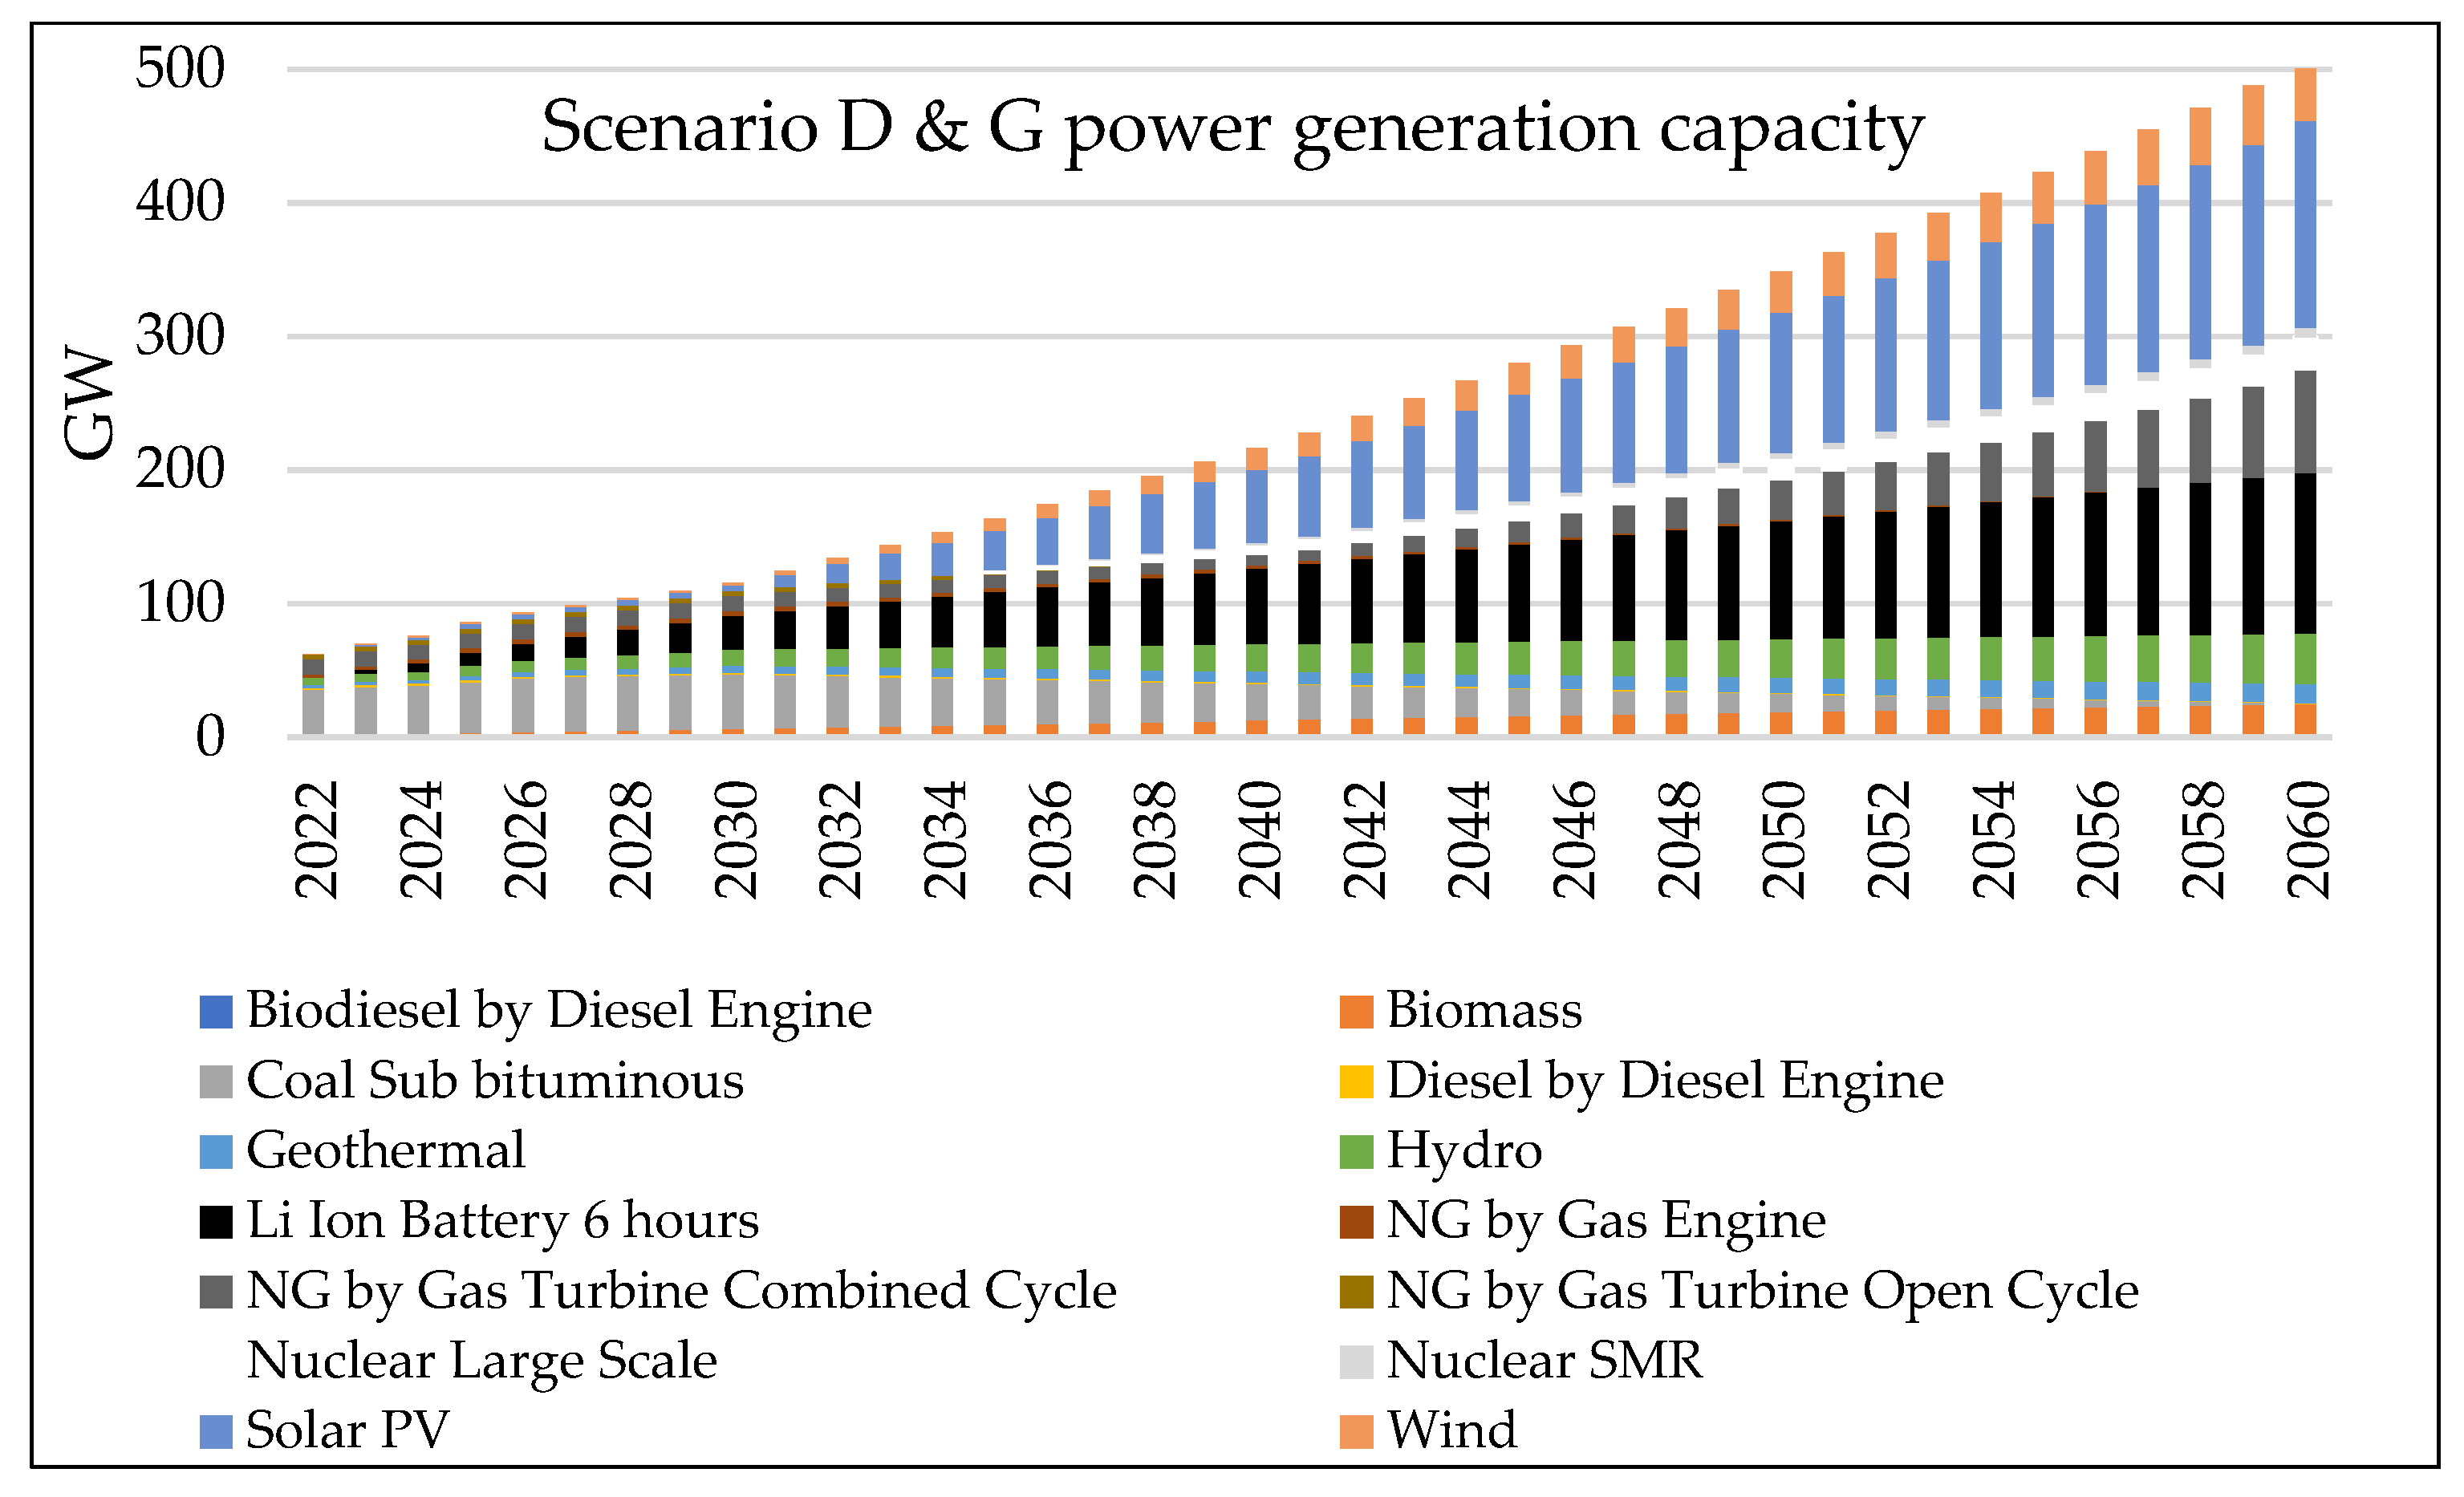
- Scenarios D and G
4.4. Analysis of the Opportunity and Challenge of NPPs to Support Net-Zero Emissions
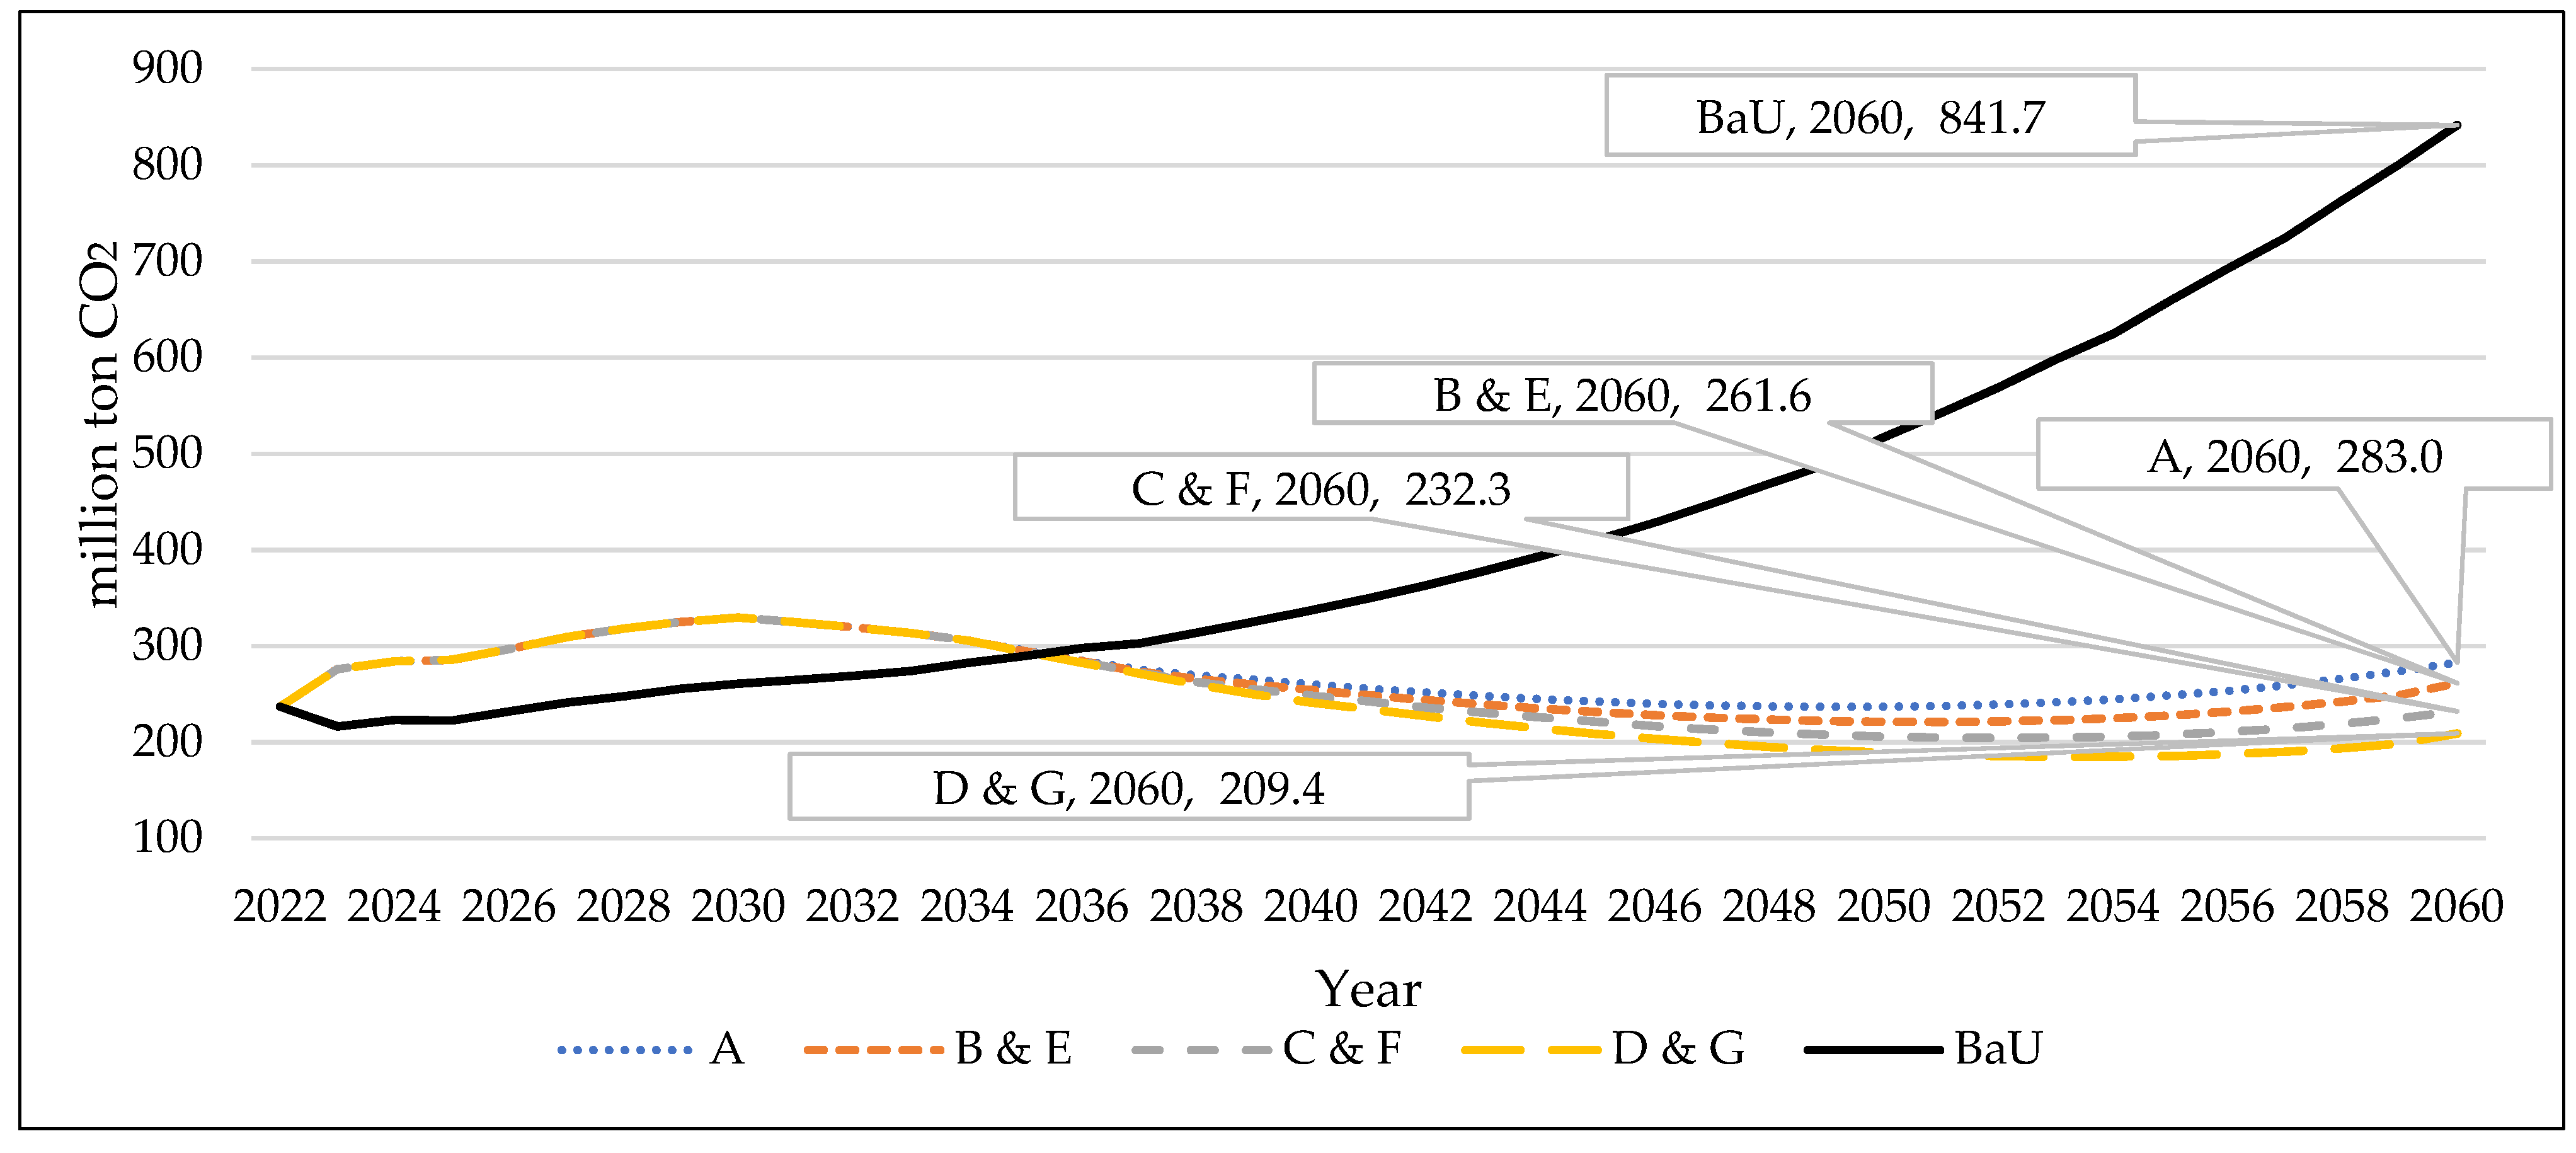
- CO2 Emission
- 2.
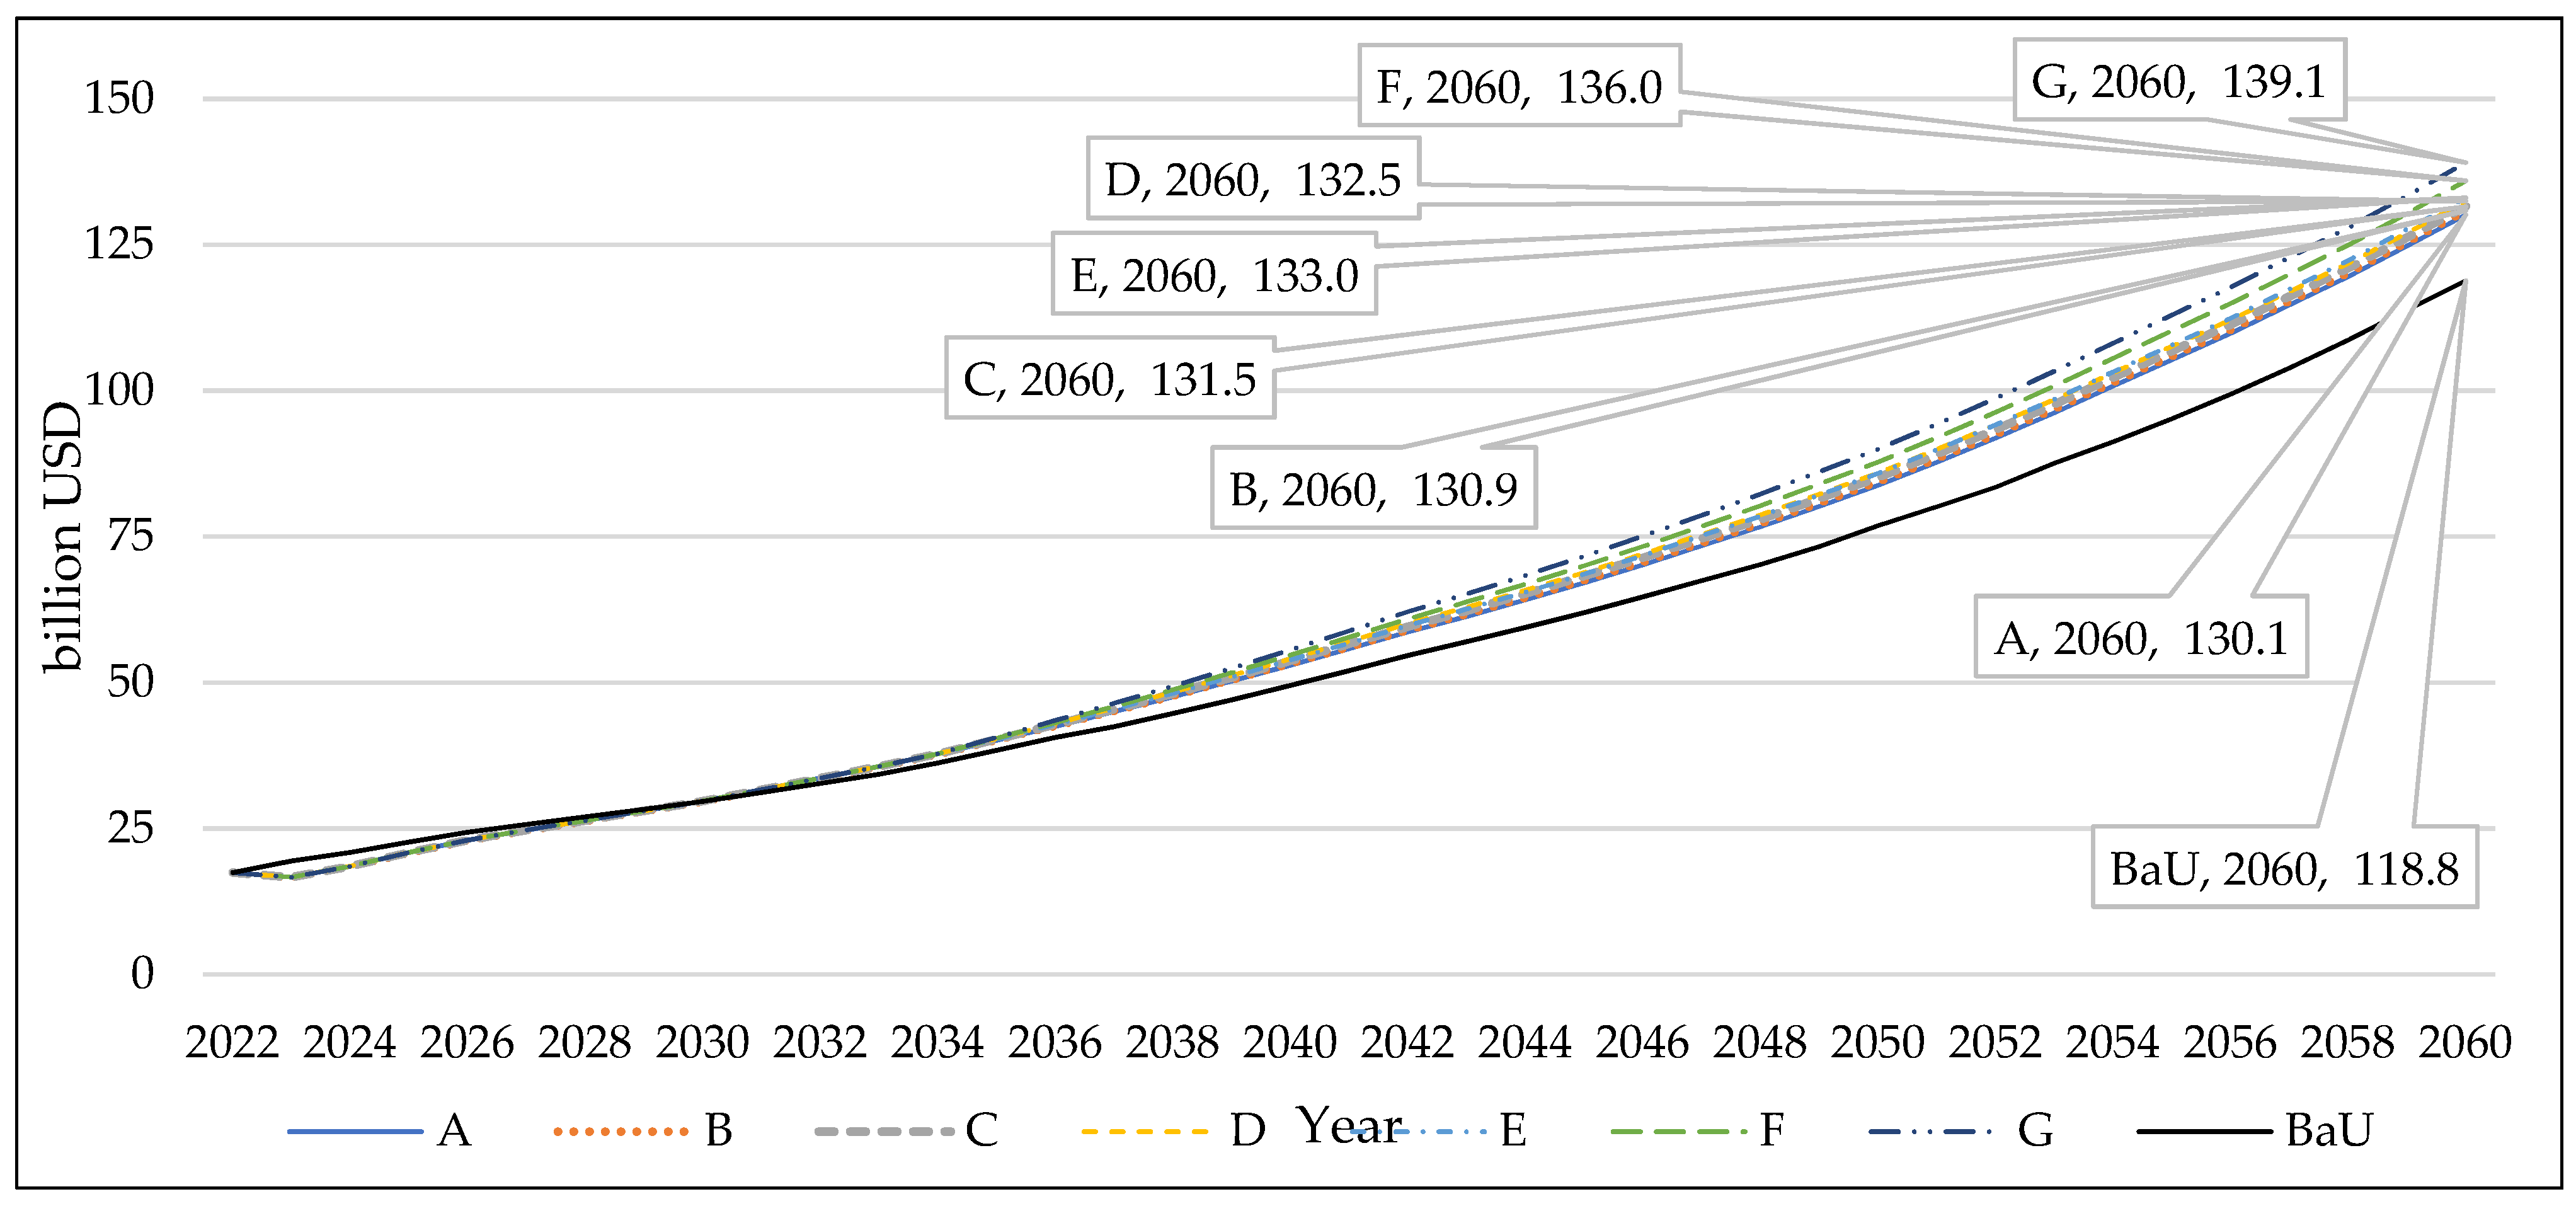
- Cost of production
- 3.
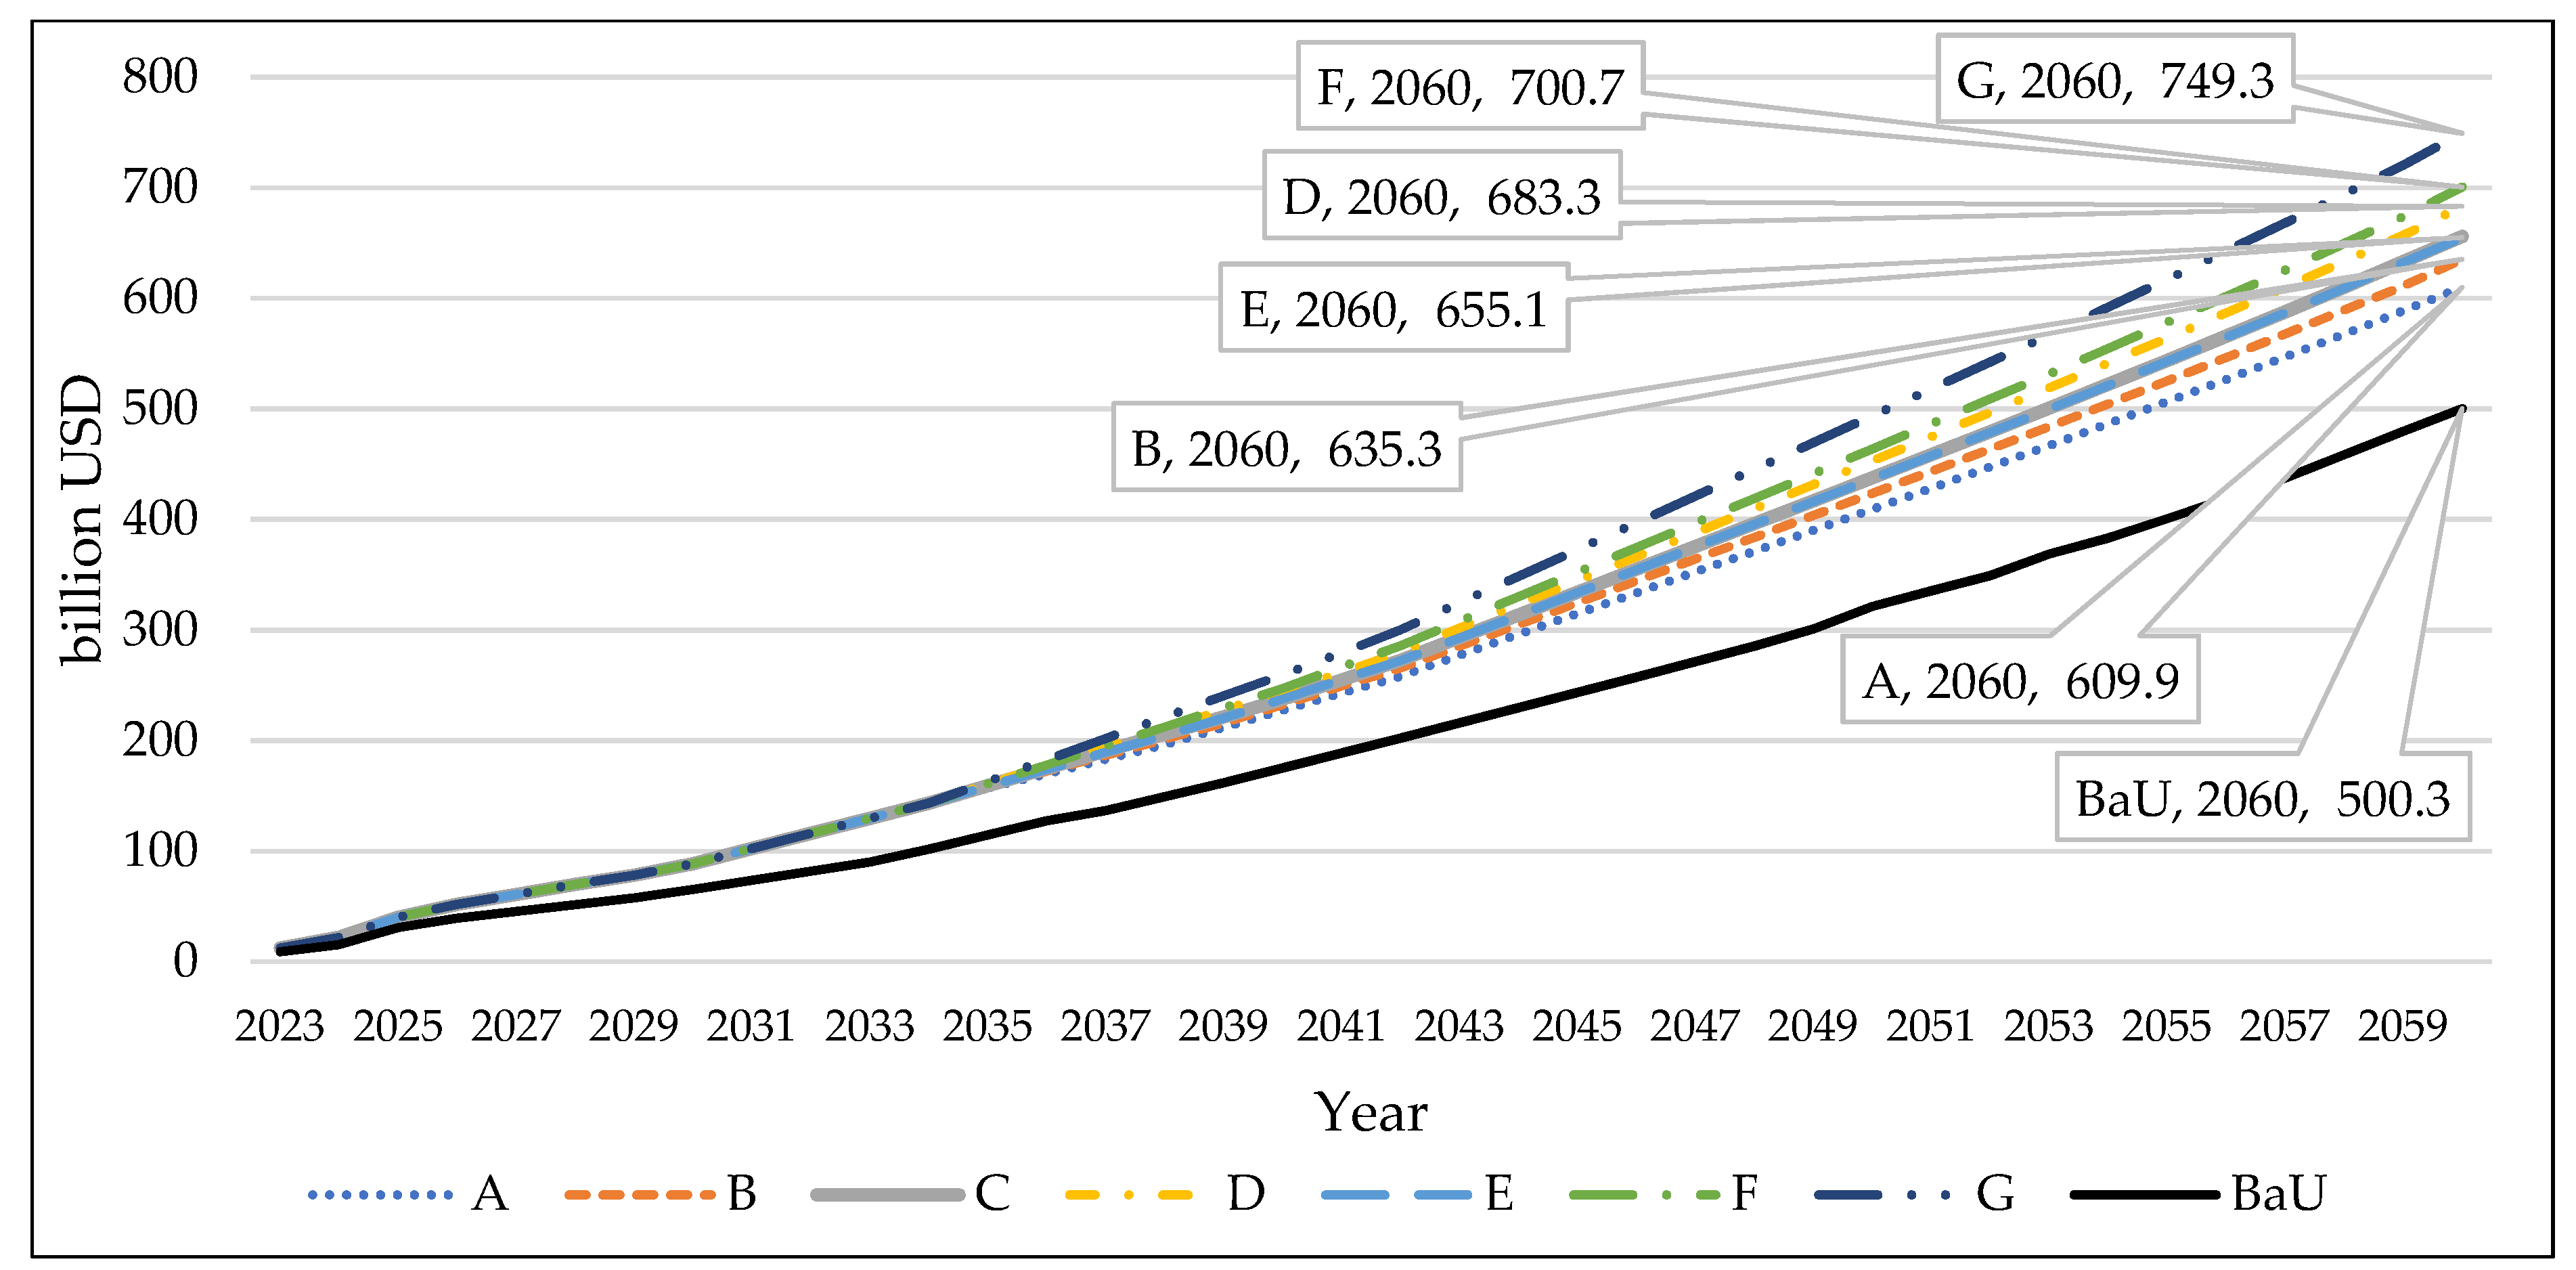
- Cost of investment
5. Conclusions
Author Contributions
Funding
Data Availability Statement
Conflicts of Interest
Abbreviations
| BATAN | National Energy Atomic Agency, now part of BRIN (national research and innovation agency) |
| BaU | Business as Usual |
| BWR | Boiling Water Reactor |
| GHG | Greenhouse gasses |
| IAEA | International Atomic Energy Agency |
| INIR | Integrated Nuclear Infrastructure Review |
| KEN | National Energy Policy |
| LEAP | Low emissions analysis platform |
| LRs | Large Reactor |
| NEPIO | The Nuclear Energy Program Implementation Organization |
| NPPs | Nuclear power plants |
| O & M | Operation and maintenance |
| PLN | Perusahaan Listrik Negara (State Electricity Company of Indonesia) |
| PWR | Pressurized Water Reactor |
| RUEN | National Energy Plan |
| RUKN | National Electricity Master Plan |
| RUPTL | National Electricity Plan |
| SMRs | Small Modular Reactors |
| VRE | Variable renewable energy |
Appendix A. Leap Model Parameter

| Demand | 2018 | 2019 | 2020 | 2021 | 2022 |
|---|---|---|---|---|---|
| Household | 97.83 | 103.73 | 112.16 | 115.37 | 116.10 |
| Business | 44.03 | 46.91 | 42.82 | 44.40 | 50.53 |
| Public | 15.81 | 17.00 | 16.37 | 16.92 | 18.65 |
| Industry | 76.95 | 77.89 | 72.24 | 80.90 | 88.5 |
| Total | 234.62 | 245.53 | 243.59 | 257.59 | 273.76 |
| Year | 2022 | 2023 | 2024 | 2025 | 2026 | 2027 | 2028 | 2029 | 2030 |
|---|---|---|---|---|---|---|---|---|---|
| Hydro | 207 | 409 | 376 | 1627 | 470 | 721 | 885 | 1061 | 856 |
| Coal sub-bituminous | 2444 | 1542 | 350 | 1891 | 2260 | 624 | - | 20 | - |
| Natural gas by gas turbine open cycle | - | - | - | - | - | - | - | - | - |
| Natural gas by gas engine | 543 | 316 | 240 | 370 | 80 | 95 | - | 10 | 70 |
| Natural gas by gas turbine combined cycle | 1279 | - | - | - | 80 | - | - | - | 100 |
| Geothermal | 108 | 190 | 141 | 870 | 290 | 123 | 450 | 240 | 808 |
| Solar PV | 287 | 1308 | 624 | 1631 | 127 | 148 | 165 | 172 | 157 |
| Wind | 45 | 121 | 528 | 376 | 90 | - | 15 | - | 300 |
| Diesel by diesel engine | - | - | - | - | - | - | - | - | - |
| Biodiesel by diesel engine | - | - | - | - | - | - | - | - | - |
| Biomass by CFPP | - | - | - | - | - | - | - | - | - |
| Total | 4913 | 3886 | 2259 | 6765 | 3397 | 1711 | 1515 | 1503 | 2291 |
| Fuel | Unit | 2019 | 2020 | 2021 | 2022 | 2030 | 2040 | 2050 | 2060 |
|---|---|---|---|---|---|---|---|---|---|
| Oil | USD/barrel | 80.21 | 61.10 | 83.11 | 139.09 | 110.00 | 105.00 | 102.00 | 100.00 |
| Coal sub-bituminous | USD/ton | 51.07 | 61.13 | 50.93 | 57.67 | 60.00 | 63.00 | 65.00 | 68.00 |
| Biomass | USD/ton | 71.49 | 85.59 | 71.31 | 80.73 | 84.00 | 88.20 | 91.00 | 95.20 |
| UO2 | USD/kWh | 0.007 | 0.007 | 0.007 | 0.007 | 0.007 | 0.008 | 0.008 | 0.008 |
| Biodiesel | USD/barrel | 74.19 | 84.79 | 127.19 | 137.79 | 120.00 | 110.00 | 100.00 | 95.00 |
| Natural gas | USD/MMBTU | 7.70 | 6.78 | 5.87 | 7.45 | 8.00 | 9.00 | 10.00 | 11.00 |


References
- United Nations Causes and Effects of Climate Change. Available online: https://www.un.org/en/climatechange/science/causes-effects-climate-change (accessed on 1 April 2023).
- EPA Impacts of Climate Change. Available online: https://www.epa.gov/climatechange-science/impacts-climate-change (accessed on 10 August 2023).
- EPA Causes of Climate Change. Available online: https://www.epa.gov/climatechange-science/causes-climate-change (accessed on 12 May 2023).
- NAS; The Royal Society. Climate Change, Evidence, & Causes. 2021. Available online: https://royalsociety.org/~/media/royal_society_content/policy/projects/climate-evidence-causes/climate-change-evidence-causes.pdf (accessed on 1 July 2023).
- Ebi, K.L.; Vanos, J.; Baldwin, J.W.; Bell, J.E.; Hondula, D.M.; Errett, N.A.; Hayes, K.; Reid, C.E.; Saha, S.; Spector, J.; et al. Extreme Weather and Climate Change: Population Health and Health System Implications. Annu. Rev. Public Health 2020, 42, 293–315. [Google Scholar] [CrossRef]
- European Commission Consequences of Climate Change. Available online: https://climate.ec.europa.eu/climate-change/consequences-climate-change_en (accessed on 12 May 2023).
- Malhi, Y.; Franklin, J.; Seddon, N.; Solan, M.; Turner, M.G.; Field, C.B.; Knowlton, N. Climate Change and Ecosystems: Threats, Opportunities and Solutions. Philos. Trans. R. Soc. B Biol. Sci. 2020, 375, 20190104. [Google Scholar] [CrossRef]
- Abbass, K.; Qasim, M.Z.; Song, H.; Murshed, M.; Mahmood, H.; Younis, I. A Review of the Global Climate Change Impacts, Adaptation, and Sustainable Mitigation Measures. Environ. Sci. Pollut. Res. 2022, 29, 42539–42559. [Google Scholar] [CrossRef]
- IPCC. Summary for Policymakers. In Climate Change 2022: Mitigation of Climate Change. Contribution of Working Group III to the Sixth Assessment Report of the Intergovernmental Panel on Climate Change; Cambridge University Press: Cambridge, UK; New York, NY, USA, 2022; ISBN 9781107415416. [Google Scholar]
- IEA. CO2 Emissions in 2022; IEA: Paris, France, 2023; Available online: https://www.iea.org/reports/co2-emissions-in-2022 (accessed on 12 May 2023).
- Ritchie, H.; Roser, M.; Rosado, P. CO2 and Greenhouse Gas Emissions. Our World Data 2020. Available online: https://ourworldindata.org/co2-and-greenhouse-gas-emissions (accessed on 31 March 2023).
- IEA. CO2 Emissions from Electricity and Heat Production by Fuel, and Share by Fuel, 2000–2021. Available online: https://www.iea.org/data-and-statistics/charts/co2-emissions-from-electricity-and-heat-production-by-fuel-and-share-by-fuel-2000-2021 (accessed on 12 May 2023).
- Ritchie, H.; Rosado, P. Electricity Mix. Available online: https://ourworldindata.org/electricity-mix (accessed on 11 August 2023).
- BP. Statistical Review of World Energy. 2022. Available online: https://www.bp.com/content/dam/bp/business-sites/en/global/corporate/pdfs/energy-economics/statistical-review/bp-stats-review-2022-full-report.pdf (accessed on 10 July 2023).
- Statista. Ember Generation of Electricity Worldwide from 1990 to 2022, by Energy Source. Available online: https://www-statista-com.ezproxy.ugm.ac.id/statistics/273273/world-electricity-generation-by-energy-source/ (accessed on 28 September 2023).
- Ritchie, H.; Rosado, P.; Roser, M. Energy Production and Consumption. Available online: https://ourworldindata.org/energy-production-consumption (accessed on 9 October 2023).
- Ritchie, H.; Rosado, P.; Roser, M. Energy. Available online: https://ourworldindata.org/energy (accessed on 15 July 2023).
- Patel, P. Three Mile Island, Chernobyl, and, Fukushima A Comparison of Three Nuclear Reactor Calamities Reveals Some Key Differences. Available online: https://spectrum.ieee.org/three-mile-island-chernobyl-and-fukushima (accessed on 23 March 2023).
- Nian, V.; Chou, S.K. The State of Nuclear Power Two Years after Fukushima—The ASEAN Perspective. Appl. Energy 2014, 136, 838–848. [Google Scholar] [CrossRef]
- Nam, H.; Konishi, S.; Nam, K. Technology in Society Comparative Analysis of Decision Making Regarding Nuclear Policy after the Fukushima Dai-Ichi Nuclear Power Plant Accident: Case Study in Germany and Japan. Technol. Soc. 2021, 67, 101735. [Google Scholar] [CrossRef]
- Enerdata Electricity Production. Available online: https://yearbook.enerdata.net/electricity/world-electricity-production-statistics.html (accessed on 9 August 2023).
- PT. PLN (Persero). PLN Statistics; PLN (Persero): Jakarta, Indonesia, 2022. [Google Scholar]
- Kementerian Energi & Sumber Daya Mineral Realisasi Produksi & Penjualan Batubara. Available online: https://modi.esdm.go.id/produksi-batubara (accessed on 9 August 2023).
- Kementerian Energi & Sumber Daya Mineral. Laporan Kinerja 2022 Direktorat Jenderal Mineral Dan Batubara; Kementerian Energi & Sumber Daya Mineral: Jakarta, Indonesia, 2023; Available online: https://www.esdm.go.id/assets/media/content/content-laporan-kinerja-direktorat-jenderal-mineral-dan-batubara-tahun-2022.pdf (accessed on 12 July 2023).
- PT. PLN (Persero). Diseminasi RUPTL 2021-2030; PLN (Persero): Jakarta, Indonesia, 2021; Available online: https://web.pln.co.id/statics/uploads/2021/10/materi-diseminasi-2021-2030-publik.pdf (accessed on 12 December 2022).
- PT. PLN (Persero). Statistik PLN 2022; PLN (Persero): Jakarta, Indonesia, 2023; Available online: https://web.pln.co.id/stakeholder/laporan-statistik (accessed on 1 February 2023).
- Statista Emissions from Electricity Generation in Indonesia from 2011 to 2020. Available online: https://www.statista.com/statistics/1303565/indonesia-emissions-from-electricity-generation/ (accessed on 8 August 2023).
- UNFCC What Is the Kyoto Protocol? Available online: https://unfccc.int/kyoto_protocol (accessed on 12 May 2023).
- United Nations. Kyoto Protocol to the United Nations Framework Convention on Climate Change; United Nations: New York, NY, USA, 1998.
- UNFCC UNFCC Indonesia. Available online: https://unfccc.int/node/61083 (accessed on 10 August 2023).
- UNFCCC The Paris Agreement. Available online: https://unfccc.int/process-and-meetings/the-paris-agreement (accessed on 10 August 2023).
- Republic of Indonesia. Enhanced Nationally Determined Contribution Republic of Indonesia. 2022. Available online: https://unfccc.int/sites/default/files/NDC/2022-09/23.09.2022_EnhancedNDCIndonesia.pdf (accessed on 10 February 2023).
- President Republic of Indonesia. Peraturan Pemerintah Republik Indonesia No.79 Tahun 2014 Tentang Kebijakan Energi Nasional. 2014. Available online: https://jdih.esdm.go.id/peraturan/PP%20No.%2079%20Thn%202014.pdf (accessed on 11 April 2023).
- Hasan, B.M.; Wahjosudibjo, A.S. Feed-In Tariff f or Indonesia’ s Geothermal Energy Development, Current Status and Challenges. In Proceedings of the Thirty-Ninth Workshop on Geothermal Reservoir Engineering Stanford University, Stanford, CA, USA, 24–26 February 2014. [Google Scholar]
- Alhusni, H.; Satria, T.; Perdana, P.; Purwanto, E.H.; Setyawan, H. Geothermal Business Outlook in Indonesia. In Proceedings of the 48th Workshop on Geothermal Reservoir Engineering Stanford University, Stanford, CA, USA, 6–8 February 2023; pp. 1–12. [Google Scholar]
- IEA. Nuclear Power in a Clean Energy System; IEA: Paris, France, 2019. [Google Scholar]
- Mertens, S. Design of Wind and Solar Energy Supply, to Match Energy Demand. Clean. Eng. Technol. 2022, 6, 100402. [Google Scholar] [CrossRef]
- Mathew, M.D. Progress in Nuclear Energy Nuclear Energy: A Pathway towards Mitigation of Global Warming. Prog. Nucl. Energy 2022, 143, 104080. [Google Scholar] [CrossRef]
- WNA Carbon Dioxide Emissions From Electricity. Available online: https://www.world-nuclear.org/information-library/energy-and-the-environment/carbon-dioxide-emissions-from-electricity.aspx (accessed on 7 August 2023).
- Kementerian Energi & Sumber Daya Mineral Ini Prinsip Dan Peta Jalan Pemerintah Capai Net Zero Emission. Available online: https://www.esdm.go.id/id/media-center/arsip-berita/ini-prinsip-dan-peta-jalan-pemerintah-capai-net-zero-emission (accessed on 4 November 2022).
- Suparman, S. Nuclear Power Program in Indonesia: Potential and Challenges. 2020. Available online: http://karya.brin.go.id/id/eprint/9634/ (accessed on 2 March 2023).
- Santoso, B. National Roadmap for Nuclear Power Programme-Indonesia; International Atomic Energy Agency: Vienna, Austria, 2017. [Google Scholar]
- Latief, H.; Puspito, N.; Imamura, F. Tsunami Catalog and Zones in Indonesia. J. Nat. Disaster Sci. 2000, 22, 25–43. [Google Scholar] [CrossRef]
- U.S. Geological Survey Advanced National Seismic System (ANSS) Comprehensive Earthquake Catalog (ComCat). Available online: https://www.usgs.gov/programs/earthquake-hazards/earthquakes (accessed on 12 October 2023).
- Hutchings, S.J.; Mooney, W.D. The Seismicity of Indonesia and Tectonic Implications. Geochem. Geophys. Geosystems 2021, 22, e2021GC009812. [Google Scholar] [CrossRef]
- Palmer, W. Verhandelingen van Het Koninklijk Instituut Voor Taal-, Land- En Volkenkunde; Springer: Berlin/Heidelberg, Germany, 2010; ISBN 9789004253483. [Google Scholar]
- Hariyono, E.; Liliasari, S. The Characteristics of Volcanic Eruption in Indonesia. In Volcanoes: Geological and Geophysical Setting, Theoretical Aspects and Numerical Modeling, Applications to Industry and Their Impact on the Human Health; IntechOpen: London, UK, 2018. [Google Scholar] [CrossRef]
- Masum, M.; Akbar, M.A. The Pacific Ring of Fire Is Working as a Home. In Proceedings of the 2nd International Geothermal Conference; IOP Publishing: Bristol, UK, 2019. [Google Scholar]
- Ratiko, R.; Wisnubroto, D.S.; Nasruddin, N.; Mahlia, T.M.I. Current and Future Strategies for Spent Nuclear Fuel Management in Indonesia. Energy Strateg. Rev. 2020, 32, 100575. [Google Scholar] [CrossRef]
- WNA Nuclear Power in Indonesia. Available online: https://world-nuclear.org/information-library/country-profiles/countries-g-n/indonesia.aspx (accessed on 12 May 2023).
- Kanugrahan, S.P.; Hakam, D.F. Long-Term Scenarios of Indonesia Power Sector to Achieve Nationally Determined Contribution (NDC) 2060. Energies 2023, 16, 4719. [Google Scholar] [CrossRef]
- Kanugrahan, S.P.; Hakam, D.F.; Nugraha, H. Techno-Economic Analysis of Indonesia Power Generation Expansion to Achieve Economic Sustainability and Net Zero Carbon 2050. Sustainability 2022, 14, 9038. [Google Scholar] [CrossRef]
- Sunarko, S.; Suparman, S.; Nurhasanah, N. Coal Phase-out and the Potential Role of Nuclear Power in the Low Carbon Electricity Sector in Indonesia. In AIP Conference Proceedings; AIP Publishing: Woodbury, NY, USA, 2022. [Google Scholar]
- Handayani, K.; Anugrah, P.; Goembira, F.; Overland, I.; Suryadi, B. Moving beyond the NDCs: ASEAN Pathways to a Net-Zero Emissions Power Sector in 2050. Appl. Energy 2022, 311, 118580. [Google Scholar] [CrossRef]
- Yudiartono, Y.; Windarta, J.; Adiarso, A. Sustainable Long-Term Energy Supply and Demand: The Gradual Transition to a New and Renewable Energy System in Indonesia by 2050. Int. J. Renew. Energy Dev. 2023, 12, 419–429. [Google Scholar] [CrossRef]
- Reyseliani, N.; Purwanto, W.W. Pathway towards 100% Renewable Energy in Indonesia Power System by 2050. Renew. Energy 2021, 176, 305–321. [Google Scholar] [CrossRef]
- Nian, V.; Mignacca, B.; Locatelli, G. Policies toward Net-Zero: Benchmarking the Economic Competitiveness of Nuclear against Wind and Solar Energy Association of South East Asian Nations. Appl. Energy 2022, 320, 119275. [Google Scholar] [CrossRef]
- International Atomic Energy Agency Guidelines for Preparing and Conducting an Integrated Nuclear Infrastructure Review (INIR); IAEA: Vienna, Austria, 2017; p. 54.
- International Atomic Energy Agency Department of Energy (Philippines) Mission Report on The Integrated Nuclear Infrastructure Review (INIR)—Phase 1. 2018. Available online: https://www.iaea.org/sites/default/files/documents/review-missions/inir-report-philippines-171218.pdf (accessed on 23 May 2023).
- Kementerian Energi & Sumber Daya Mineral. Rencana Usaha Penyediaan Tenaga Listrik (RUPTL) PT. PLN (Persero) 2021–2030; Kementerian Energi & Sumber Daya Mineral: Jakarta, Indonesia, 2021. Available online: https://web.pln.co.id/statics/uploads/2021/10/ruptl-2021-2030.pdf (accessed on 2 August 2022).
- Kementerian Lingkungan Hidup dan Kehutanan Republik Indonesia, M.L.H. dan K.R. Peraturan Menteri Lingkungan Hidup Dan Kehutanan Republik Indonesia Nomor P.15/MENLHK/SETJEN/KUM.1/4/2019 Tentang Baku Mutu Emisi Pembangkit Listrik Tenaga Termal. 2019. Available online: https://ditppu.menlhk.go.id/portal/uploads/laporan/1593657762_PERMENLHK%20NO%2015%20TH%202019%20ttg%20BM%20Emisi%20Pembangkit%20Listrik%20Thermal.pdf (accessed on 17 October 2023).
- Mulyasari, F.; Harahap, A.K.; Rio, A.O.; Sule, R.; Kadir, W.G.A. Potentials of the Public Engagement Strategy for Public Acceptance and Social License to Operate: Case Study of Carbon Capture, Utilisation, and Storage Gundih Pilot Project in Indonesia. Int. J. Greenh. Gas Control 2021, 108, 103312. [Google Scholar] [CrossRef]
- Setiawan, A.D.; Cuppen, E. Stakeholder Perspectives on Carbon Capture and Storage in Indonesia. Energy Policy 2013, 61, 1188–1199. [Google Scholar] [CrossRef]
- IAEA. What Is Nuclear Energy? The Science of Nuclear Power. Available online: https://www.iaea.org/newscenter/news/what-is-nuclear-energy-the-science-of-nuclear-power (accessed on 23 August 2023).
- Goldberg, S.M.; Rosner, R. Nuclear Reactors: Generation to Generation; American Academy of Arts and Sciences: Cambridge, MA, USA, 2011; ISBN 0877240906. [Google Scholar]
- Reinberger, D.; Ajanovic, A.; Haas, R. The Technological Development of Different Generations and Reactor Concepts. Energy Policy Clim. Prot. 2019, 243–258. [Google Scholar] [CrossRef]
- World Nuclear Nuclear Power Reactor Characteristics. Available online: https://www.world-nuclear.org/uploadedFiles/org/WNA/Publications/Nuclear_Information/PocketGuideReactors.pdf (accessed on 10 August 2023).
- IAEA. IAEA Nuclear Energy Series: Design Features to Achieve Defence in Depth in Small and Medium Sized Reactors; IAEA: Vienna, Austria, 2009. [Google Scholar]
- UNECE. Technology Brief Nuclear Power; UNECE: Geneva, Switzerland, 2020. [Google Scholar]
- Mignacca, B.; Locatelli, G. Economics and Finance of Small Modular Reactors: A Systematic Review and Research Agenda. Renew. Sustain. Energy Rev. 2020, 118, 109519. [Google Scholar] [CrossRef]
- IAEA. Status of Innovative Small and Medium Sized Reactor Designs 2005; IAEA: Vienna, Austria, 2006; ISBN 9201010060. [Google Scholar]
- Black, G.; Shropshire, D.; Araújo, K.; van Heek, A. Prospects for Nuclear Microreactors: A Review of the Technology, Economics, and Regulatory Considerations. Nucl. Technol. 2023, 209, S1–S20. [Google Scholar] [CrossRef]
- Imperial Trajano, J.C. A Policy Analysis of Nuclear Safety Culture and Security Culture in East Asia: Examining Best Practices and Challenges. Nucl. Eng. Technol. 2019, 51, 1696–1707. [Google Scholar] [CrossRef]
- Sterling Types of Nuclear Power Plants. Available online: https://www.sterlingtt.com/2023/06/07/types-of-nuclear-power-plants/ (accessed on 23 August 2023).
- Fernández-Arias, P.; Vergara, D.; Orosa, J.A. A Global Review of PWR Nuclear Power Plants. Appl. Sci. 2020, 10, 4434. [Google Scholar] [CrossRef]
- IAEA. Nuclear Power Reactors in the World; IAEA: Vienna, Austria, 2022. [Google Scholar]
- IAEA. Power Reactor Information System. Available online: https://pris.iaea.org/PRIS/WorldStatistics/OperationalReactorsByType.aspx (accessed on 21 August 2023).
- IAEA. Establishing the Safety Infrastructure for a Nuclear Power Programme; IAEA: Vienna, Austria, 2020. [Google Scholar]
- Ali, A.; Shams, A.; Al-Athel, K.S.; Alwafi, A. Saudi Arabia’s Nuclear Energy Ambition and Its Compliance with IAEA Guidelines for Newcomers: An Overview. Nucl. Eng. Des. 2023, 411, 112448. [Google Scholar] [CrossRef]
- IAEA. Building a National Position for a New Nuclear Power Programme; IAEA: Vienna, Austria, 2016. [Google Scholar]
- International Atomic Energy Agency (IAEA). Milestones in the Development of a National Infrastructure for Nuclear Power; IAEA: Vienna, Austria, 2015. [Google Scholar]
- JICA. Data Collection Survey on Power Sector in Indonesia: Final Report; JICA: Singapore, 2022.
- Republic of Indonesia. Undang-Undang Republik Indonesia Nomor 10 Tahun 1997 tentang Ketenaganukliran. 1997. Available online: https://jdih.bapeten.go.id/unggah/dokumen/peraturan/377-full.pdf (accessed on 21 April 2023).
- Kementerian Energi dan Sumber Daya Mineral RUKN 2019–2038. 2004; pp. 1–14. Available online: https://policy.asiapacificenergy.org/node/4171 (accessed on 20 April 2023).
- Debrah, S.K. Ghana Nuclear Power Programme: Status and Development National Environment for Nuclear Power Development. Available online: https://www.afcone.org/wp-content/uploads/2020/12/12-Dr-Seth-Kofi-Debrah-Ghana-NPP-Status_10_12_2020.pdf (accessed on 15 August 2023).
- Islam, M.S.; Faisal, S.I.; Khan, S. Development and Strengthening of the Nuclear and Radiation Safety Infrastructure for Nuclear Power Program of Bangladesh. Nucl. Eng. Technol. 2021, 53, 1705–1716. [Google Scholar] [CrossRef]
- Ashraf, A.A.; Islam, M.S. Explaining Public Policy Choices: A Case Study of the First Nuclear Power Plant in Bangladesh. Strateg. Anal. 2018, 42, 503–523. [Google Scholar] [CrossRef]
- IAEA. Mission Report on The Phase 1 Follow-up Integrated Nuclear Infrastructure Review (INIR) Mission in Ghana; IAEA: Vienna, Austria, 2019. [Google Scholar]
- IAEA. Mission Report on The Integrated Nuclear Infrastructure Review (INIR) Phase 1 Mission in Sudan; IAEA: Vienna, Austria, 2018. [Google Scholar]
- IAEA. Mission Report on The Integrated Nuclear Infrastructure Review (INIR) Phase 1 Mission in Uganda; IAEA: Vienna, Austria, 2021. [Google Scholar]
- Google Google Earth. Available online: https://earth.google.com/web/search/indonesia/@-1.15038486,118.92347937,468.66442716a,5607526.22418523d,35y,360h,0t,0r/data=CigiJgokCZcA9BrNIAlAEVYALn3PCf2_GbiG4Cbtn19AIepSfT-3zFxA (accessed on 23 August 2023).
- Cogswell, B.K.; Siahaan, N.; Siera, F.; Ramana, M.V.; Tanter, R. Nuclear Power and Small Modular Reactors in Indonesia: Potential and Challenges; Indonesian Institute for Energy Economics and Nautilus Institute for Security and Sustainibility: Jakarta, Indonesia, 2017; Available online: https://sppga.ubc.ca/wp-content/uploads/sites/5/2021/12/IIEE-Nautilus-SMR-Report-Final-For-Publication-April2017.pdf (accessed on 24 August 2023).
- IAEA Country Nuclear Power Profiles Indonesia. Available online: https://www-pub.iaea.org/MTCD/publications/PDF/cnpp2016/countryprofiles/Indonesia/Indonesia.htm (accessed on 21 August 2023).
- Tanter, R. Indonesian Nuclear Power Reactors, under Governmental Consideration, 2010–2015. Available online: https://nautilus.org/wp-content/uploads/2015/07/Indonesian-nuclear-power-reactors-under-governmental-consideration-2010-2015-with-full-sources.pdf (accessed on 24 August 2023).
- Suparman, S. Pengembangan PLTN Dan Tinjauan Keekonomiannya. 2022. Available online: https://www.youtube.com/watch?v=dFOWnlQ719U (accessed on 4 April 2023).
- Pusat Survey Geologi Indonesia Peta Patahan Aktif Indonesia 2021. Available online: https://geologi.esdm.go.id/geomap/pages/preview/peta-patahan-aktif-indonesia (accessed on 12 October 2023).
- U.S. Geological Survey What Is a Fault and What Are the Different Types? Available online: https://www.usgs.gov/faqs/what-a-fault-and-what-are-different-types (accessed on 15 October 2023).
- Badan Penelitian dan Pengembangan Kementerian Pekerjaan Umum dan Perumahan Rakyat. Peta Sumber Dan Bahaya Gempa Indonesia Tahun 2017; Badan Penelitian dan Pengembangan Kementerian Pekerjaan Umum dan Perumahan Rakyat: Bandung, Indonesia, 2017; ISBN 9786025489013. [Google Scholar]
- Horspool, N.; Pranantyo, I.R.; Latief, H.; Natawidjaja, D.; Kongko, W.; Cipta, A. A National Tsunami Hazard Assessment for Indonesia A National Tsunami Hazard Assessment for Indonesia; Australian Government Department of Foreign Affairs and Trade: Canberra, Australia, 2013. [Google Scholar]
- Kepala Badan Pengawas Tenaga Nuklir Republik Indonesia Peraturan Kepala Badan Pengawas Tenaga Nuklir Republik Indonesia No. 8 Tahun 2013. 2013. Available online: https://jdih.bapeten.go.id/unggah/dokumen/peraturan/233-full.pdf (accessed on 16 October 2023).
- MEMR Tipe Gunung Api Di Indonesia (A, B, Dan C). Available online: https://magma.esdm.go.id/v1/edukasi/tipe-gunung-api-di-indonesia-a-b-dan-c (accessed on 11 December 2022).
- Kementerian Energi dan Sumber Daya Mineral. Laporan Kinerja Direktorat Jenderal Minyak Dan Gas Bumi Kementerian Energi Dan Sumber Daya Mineral Tahun 2022; Kementerian Energi & Sumber Daya Mineral: Jakarta, Indonesia, 2023; Available online: https://migas.esdm.go.id/uploads/uploads/LAKIN-Ditjen-Migas-2022-24Feb2023-Final.pdf (accessed on 16 May 2023).
- President of Republic Indonesia. Peraturan Presiden Republik Indonesia Nomor 22 Tahun 2017 Tentang Rencana Umum Energi Nasional. 2017. Available online: https://peraturan.bpk.go.id/Details/68772 (accessed on 19 May 2023).
- Ardiansyah, H. Hydropower Technology: Potential, Challenges, and the Future. In Indonesia Post-Pandemic Outlook: Strategy towards Net-Zero Emissions by 2060 from the Renewables and Carbon-Neutral Energy Perspectives; BRIN Publishing: Jakarta, Indonesia, 2022; pp. 89–107. [Google Scholar] [CrossRef]
- JICA. Project for the Master Plan Study of Hydropower Development in Indonesia; JICA: Singapore, 2011; Volume I.
- Langer, J.; Quist, J.; Blok, K. Review of Renewable Energy Potentials in Indonesia and Their Contribution to a 100% Renewable Electricity System. Energies 2021, 14, 7033. [Google Scholar] [CrossRef]
- Theglobal Economy Geothermal Electricity Capacity—Country Rankings. Available online: https://www.theglobaleconomy.com/rankings/geothermal_electricity_capacity/ (accessed on 17 May 2023).
- Sovacool, B.K. The Intermittency of Wind, Solar, and Renewable Electricity Generators: Technical Barrier or Rhetorical Excuse? Util. Policy 2009, 17, 288–296. [Google Scholar] [CrossRef]
- Reynolds, S.S.; Collard-wexler, W.A.; Cronin, A.; Cullen, J.; Davis, L.; Gillingham, K.; Hogan, B.; Joskow, P.; Keith, D.; Lemoine, D.; et al. Intermittency and Value of Renewable Energy; National Bureau Of Economic Research: Cambridge, MA, USA, 2011; Available online: https://www.nber.org/system/files/working_papers/w17086/revisions/w17086.rev2.pdf (accessed on 17 October 2023).
- Asiaban, S.; Kayedpour, N.; Samani, A.E.; Bozalakov, D.; De Kooning, J.D.M.; Crevecoeur, G.; Vandevelde, L. Wind and Solar Intermittency and the Associated Integration Challenges: A Comprehensive Review Including the Status in the Belgian Power System. Energies 2021, 14, 2630. [Google Scholar] [CrossRef]
- CEC. Electricity Generation in China from 2011 to 2021, by Source. Available online: https://www-statista-com.ezproxy.ugm.ac.id/statistics/302233/china-power-generation-by-source/ (accessed on 9 October 2023).
- BP Statistical Review of World Energy & Ember Electricity Production by Source, Indonesia. Available online: https://ourworldindata.org/grapher/electricity-prod-source-stacked?country=~IDN (accessed on 7 October 2023).
- Zhao, F.; Bai, F.; Liu, X. A Review on Renewable Energy Transition under China’ s Carbon Neutrality Target. Sustainability 2022, 14, 15006. [Google Scholar] [CrossRef]
- Lorenczik, S.; Kim, S.; Wanner, B.; Bermudez Menendez, J.M.; Remme, U.; Hasegawa, T.; Keppler, J.H.; Mir, L.; Sousa, G.; Berthelemy, M.; et al. Projected Costs of Generating Electricity-2020 Edition; Organisation for Economic Co-Operation and Development: Paris, France, 2020. [Google Scholar]
- Heaps, C.G. LEAP: The Low Emissions Analysis Platform. Available online: https://leap.sei.org (accessed on 31 August 2023).
- WNA Economics of Nuclear Power. Available online: https://www.world-nuclear.org/information-library/economic-aspects/economics-of-nuclear-power.aspx#ECSArticleLink1 (accessed on 31 October 2023).
- Lovering, J.R.; Yip, A.; Nordhaus, T. Historical Construction Costs of Global Nuclear Power Reactors. Energy Policy 2016, 91, 371–382. [Google Scholar] [CrossRef]
- Lévêque, F. The Economics and Uncertainties of Nuclear Power; Cambridge University Press: Cambridge, UK, 2015; ISBN 9781107087286. [Google Scholar]
- Choi, S.; Jun, E.; Hwang, I.; Starz, A.; Mazour, T.; Chang, S.; Burkart, A.R. Fourteen Lessons Learned from the Successful Nuclear Power Program of the Republic of Korea. Energy Policy 2009, 37, 5494–5508. [Google Scholar] [CrossRef]
- Alonso, G.; Bilbao, S. Economic Competitiveness of Small Modular Reactors versus Coal and Combined Cycle Plants. Energy 2016, 116, 867–879. [Google Scholar] [CrossRef]
- Kementerian Riset Teknologi dan Pendidikan Tinggi Republik Indonesia. Pengukuran Dan Penetapan Tingkat Kesiapan Teknologi; 2016; Available online: https://peraturan.bpk.go.id/Home/Download/132670/Permenristekdikti%20Nomor%2042%20Tahun%202016.pdf (accessed on 11 June 2022).
- Rahmanta, M.A.; Harto, A.W.; Agung, A.; Ridwan, M.K. Nuclear Power Plant to Support Indonesia’ s Net Zero Emissions: A Case Study of Small Modular Reactor Technology Selection Using Technology Readiness Level and Levelized Cost of Electricty. Energies 2023, 16, 3752. [Google Scholar] [CrossRef]
- IAEA. Advances in Small Modular Reactor Technology Developments 2022; IAEA: Vienna, Austria, 2022. [Google Scholar]
- PT. PLN (Persero) Percepat Transisi Energi, Pemerintah Dukung PLN Pensiunkan PLTU Lewat ETM. Available online: https://web.pln.co.id/media/siaran-pers/2022/07/percepat-transisi-energi-pemerintah-dukung-pln-pensiunkan-pltu-lewat-etm (accessed on 4 November 2022).
- Trading Economics Indonesia Interest Rate. Available online: https://tradingeconomics.com/indonesia/interest-rate (accessed on 4 September 2023).
- Bank of Indonesia BI 7-Day (Reverse) Repo Rate. Available online: https://www.bi.go.id/en/statistik/indikator/bi-7day-rr.aspx (accessed on 4 September 2023).
- NEA. Current Status, Technical Feasibility, and Economics of Small Nuclear Reactors; NEA: Singapore, 2011. [Google Scholar]
- Trading Economics Indonesia Inflation Rate. Available online: https://tradingeconomics.com/indonesia/inflation-cpi (accessed on 2 September 2023).
- Bank of Indonesia Inflation Data. Available online: https://www.bi.go.id/en/statistik/indikator/data-inflasi.aspx (accessed on 3 September 2023).
- Badan Pusat Statistik Republik Indonesia Jumlah Penduduk Pertengahan Tahun (Ribu Jiwa), 2021–2023. Available online: https://www.bps.go.id/indicator/12/1975/1/jumlah-penduduk-pertengahan-tahun.html (accessed on 30 August 2023).
- Badan Pusat Statistik Republik Indonesia. Proyeksi Penduduk Indonesia 2020–2050 Hasil Sensus Penduduk 2020; Badan Pusat Statistik Republik Indonesia: Jakarta, Indonesia, 2020; ISBN 9786024385217.
- PT. PLN (Persero). Statistik PLN 2018; PLN (Persero): Jakarta, Indonesia, 2019; Available online: https://web.pln.co.id/statics/uploads/2021/09/statistik-PLN-2018-english.pdf (accessed on 2 February 2023).
- PT. PLN (Persero). Statistik PLN 2019; PLN (Persero): Jakarta, Indonesia, 2020; Available online: https://web.pln.co.id/statics/uploads/2020/08/Statistik-2019-4-8-20-rev.pdf (accessed on 4 February 2023).
- PT. PLN (Persero). Statistik PLN 2020; PLN (Persero): Jakarta, Indonesia, 2021; Available online: https://web.pln.co.id/statics/uploads/2021/07/Statistik-PLN-2020.pdf (accessed on 5 February 2023).
- PT. PLN (Persero). Statistik PLN 2021; PLN (Persero): Jakarta, Indonesia, 2022; Available online: https://web.pln.co.id/statics/uploads/2022/03/Statistik-PLN-2021-Unaudited-21.2.22.pdf (accessed on 3 February 2023).
- Kementerian Energi & Sumber Daya Mineral Draft RUKN 2023–2060; Direktorat Jenderal Imigrasi: Jakarta, Indonesia, 2023.
- PT. PLN (Persero) Laporan Kondisi Kelistrikan-Mercusuar. Available online: https://mercusuar.pln.co.id/neraca-daya/harian (accessed on 2 August 2023).
- Kementerian Energi dan Sumber Daya Mineral Harga Indeks Bahan Bakar Nabati (BBN). Available online: https://ebtke.esdm.go.id/category/22/hip.bbn (accessed on 2 September 2023).
- Energy, K. Probabilistic Analysis on Levelized Unit Electricity Cost (LUEC) Calculation of Small Medium Reactor Nuclear Power Plant (SMR NPP) In Indonesia. Sciences 2016, 2016, 144–154. [Google Scholar]
- Adhiguna, P. Indonesia’s Biomass Cofiring Bet, Beware of the Implementation Risks; Institute for Energy Economics and Financial Analysis: Lakewood, OH, USA, 2021. [Google Scholar]
- National Renewable Energy Laboratory (NREL). 2022 Annual Technology Baseline. 2022. Available online: https://atb.nrel.gov/electricity/2023/data (accessed on 2 April 2023).
- Pfenninger, S.; Staffell, I. Long-Term Patterns of European PV Output Using 30 Years of Validated Hourly Reanalysis and Satellite Data. Energy 2016, 114, 1251–1265. [Google Scholar] [CrossRef]
- Staffell, I.; Pfenninger, S. Using Bias-Corrected Reanalysis to Simulate Current and Future Wind Power Output. Energy 2016, 114, 1224–1239. [Google Scholar] [CrossRef]
- Ministry of Energy and Mineral Resources. Danish Energy Agency Technology Data for the Indonesian Power Sector; Ministry of Energy and Mineral Resources: Jakarta, Indonesia, 2021; pp. 1–215.
- President of Republic Indonesia. Peraturan Presiden Republik Indonesia No 74 Tahun 2012. 2012. Available online: https://peraturan.bpk.go.id/Details/207901/perpres-no-74-tahun-2022 (accessed on 22 April 2023).
- MIT. The Future of Nuclear Energy in a Carbon-Constrained World; MIT: Cambridge, MA, USA, 2018. [Google Scholar]
- Boldon, L.M.; Sabharwall, P. Small Modular Reactor: First-of-a-Kind (FOAK) and Nth-of-a-Kind (NOAK) Economic Analysis; Idaho National Laboratory: Idaho Falls, ID, USA, 2014. [Google Scholar]
- KEPCO Outline of Thermal Power Generation. Available online: https://www.kepco.co.jp/english/energy/fuel/thermal_power/shikumi/index.html (accessed on 5 October 2023).
- Lund, P.D.; Lindgren, J.; Mikkola, J.; Salpakari, J. Review of Energy System Fl Exibility Measures to Enable High Levels of Variable Renewable Electricity. Renew. Sustain. Energy Rev. 2015, 45, 785–807. [Google Scholar] [CrossRef]
- Klimstra, J.; Hotakainen, M. Smart Power Generation; Avain: Helsinski, Finland, 2013; ISBN 9789529316403. [Google Scholar]
- Beaudin, M.; Zareipour, H.; Schellenberglabe, A.; Rosehart, W. Energy for Sustainable Development Energy Storage for Mitigating the Variability of Renewable Electricity Sources: An Updated Review. Energy Sustain. Dev. 2010, 14, 302–314. [Google Scholar] [CrossRef]
- Deguenon, L.; Yamegueu, D.; Moussa, S.; Gomna, A. Overcoming the Challenges of Integrating Variable Renewable Energy to the Grid: A Comprehensive Review of Electrochemical Battery Storage Systems. J. Power Sources 2023, 580, 233343. [Google Scholar] [CrossRef]
- Görtz, S. Battery Energy Storage for Intermittent Renewable Electricity Production A Review and Demonstration of Energy Storage Applications Permitting Higher Penetration of Renewables; UMEA Universitet: Umea, Switzerland, 2015. [Google Scholar]
- Amrouche, S.O.; Rekioua, D.; Rekioua, T.; Bacha, S. Overview of Energy Storage in Renewable Energy Systems. Int. J. Hydrogen Energy 2016, 41, 20914–20927. [Google Scholar] [CrossRef]
- Dwyer, C.O.; Ryan, L.; Flynn, D.; Member, S. Efficient Large-Scale Energy Storage Dispatch: Challenges in Future High Renewable Systems. IEEE Trans. Power Syst. 2017, 32, 3439–3450. [Google Scholar] [CrossRef]
- IEA. Concentrated Solar Power, Pumped Hydro and Batteries, Installed Storage Capacity in 2020 and 2026; IEA: Paris, France, 2021. [Google Scholar]
- Blanco, H.; Faaij, A. A Review at the Role of Storage in Energy Systems with a Focus on Power to Gas and Long-Term Storage. Renew. Sustain. Energy Rev. 2018, 81, 1049–1086. [Google Scholar] [CrossRef]
- Zsibor, H. Intermittent Renewable Energy Sources: The Role of Energy Storage in the European Power System of 2040. Sustainability 2019, 8, 729. [Google Scholar] [CrossRef]
- IPCC. Technology-Specific Cost and Performance Parameters; IPCC: Geneva, Switzerland, 2014.
- Edenhofer, O.; Pichs-Madruga, R.; Sokona Mali, Y.; Kadner, S.; Minx, J.C.; Brunner, S.; Agrawala, S.; Baiocchi, G.U.; Alexeyevich Bashmakov, I.; Blanco, G.; et al. TS Technical Summary; IPCC: Geneva, Switzerland, 2014. [Google Scholar]
- Ordonez, J.A.; Fritz, M.; Eckstein, J. Coal vs. Renewables: Least-Cost Optimization of the Indonesian Power Sector. Energy Sustain. Dev. 2022, 68, 350–363. [Google Scholar] [CrossRef]
- Direktorat Jenderal Ketenagalistrikan Kementerian Energi dan Sumber Daya Mineral Republik Indonesia. Laporan Kinerja Direktorat Jenderal Ketenagalistrikan Kementerian Energi Dan Sumber Daya Mineral Republik Indonesia; Direktorat Jenderal Ketenagalistrikan Kementerian Energi dan Sumber Daya Mineral Republik: Jakarta, Indonesia, 2022.
- IEA. An Energy Sector Roadmap to Net Zero Emissions in Indonesia; IEA: Paris, France, 2022. [Google Scholar]


| NPPs | Gen I | Gen II | Gen III | Gen III+ | Gen IV | Ref. |
|---|---|---|---|---|---|---|
| Period (years) | 1945–1965 | 1965–1995 | 1995–2010 | 2010–2030 | 2030 | [65,66] |
| Stage | Early prototype reactors | Commercial power reactors | Advanced LWRs | Improved economics | Highly economical, minimal waste | [65] |
| Type | Shipping port | LWR-PWR | ABWR | |||
| Dresden | BWR | System 80+ | [65] | |||
| Magnox | Candu | AP600 |
| Characteristic | PWR | BWR | AGR | PHWR (Candu) | LWGR (RBMK) | FBR |
|---|---|---|---|---|---|---|
| Active core height (m) | 4.2 | 3.7 | 8.3 | 5.9 | 7 | 1 |
| Active core diameter (m) | 3.4 | 4.7 | 9.3 | 6 | 11.8 | 3.7 |
| Fuel inventory (tones) | 104 | 134 | 110 | 90 | 192 | 32 |
| Vessel type | Cylinder | Cylinder | Cylinder | Tubes | Tubes | Cylinder |
| Fuel | UO2 | UO2 | UO2 | UO2 | UO2 | PuO2/UO2 |
| Form | Enriched | Enriched | Enriched | Natural | Enriched | - |
| Coolant | H2O | H2O | CO2 | D2O | H2O | Sodium |
| Steam generation | Indirect | Direct | Indirect | Indirect | Direct | Indirect |
| Moderator | H2O | H2O | Graphite | D2O | Graphite | None |
| No. | Location | Type | Size (MW) | Institution |
|---|---|---|---|---|
| 1 | Muria, Central Java | LRs | 4 × 1000 | Batan (BRIN), IAEA |
| 2 | West Bangka, Bangka | LRs | 6 × 1000 | Batan (BRIN), Bangka Belitung Provincial Government |
| 3 | South Bangka, Bangka | LRs | 4 × 1000 | Batan (BRIN), Bangka Belitung Provincial Government |
| 4 | East Kalimantan | LRs | 1000 | Batan (BRIN), East Kalimantan Provincial Government |
| 5 | West Kalimantan | SMRs | 30 | Batan (BRIN), West Kalimantan Provincial Government |
| 6 | Gorontalo | SMRs | 90 | Batan (BRIN), RAO UES, Rosatom |
| Scenario | Simulation Years | Ref. | ||||
|---|---|---|---|---|---|---|
| 2030 | 2038 | 2050 | 2060 | |||
| BaU | - CFPPs 64% - RE 22% - NG 12% | - Dominated by CFPPs - RE 28% | - Dominated by CFPPs - RE 31% | - Max. cap. geothermal 14.4 GW (75% utilization of potential) - Max. cap. hydro 37.5 GW (75% utilization of potential) - Max. cap. biomass 24.5 GW (75% utilization of potential) - Max. cap. solar PVs 155 GW (75% utilization of potential) - Max. cap. wind 45.5 GW (75% utilization of potential) - Min. RE 35% of energy mix (assumption) | Dominated CFPPs | [60,84,103] |
| CFPPs retired 1, 2 | CFPPs 0% | |||||
| (a) 0% NPPs | NPPs 0% | [40,60,124] | ||||
| (b) 5% NPPs | - CFPPs 64% - RE 22% - NG 12% | -Stop building CFPPs | NPPs 5% (optimistic) | [40,60,124] | ||
| (c) 10% NPPs | NPPs 10% (optimistic) | [40,60,124] | ||||
| (d) 15% NPPs | NPPs 15% (optimistic) | [40,60,124] | ||||
| (e) 5% NPPs | NPPs 5% (conservative) | [40,60,124] | ||||
| (f) 10% NPPs | NPPs 10% (conservative) | [40,60,124] | ||||
| (g) 15% NPPs | NPPs 15% (conservative) | [40,60,124] | ||||
| Input Parameters | Metric | Data | Ref. |
|---|---|---|---|
| Discount rate a | % | 10% | [138,139] |
| Inflation rate b | % | 5% | [140,141,142] |
| Population | Mill. persons | 275.77 (2022) | [143] |
| Population | Mill. persons | 334.59 (2060) | [144] |
| Population growth | % p.a. | 0.51% | [144] |
| Electricity demand history | Table A1 | [26,145,146,147,148] | |
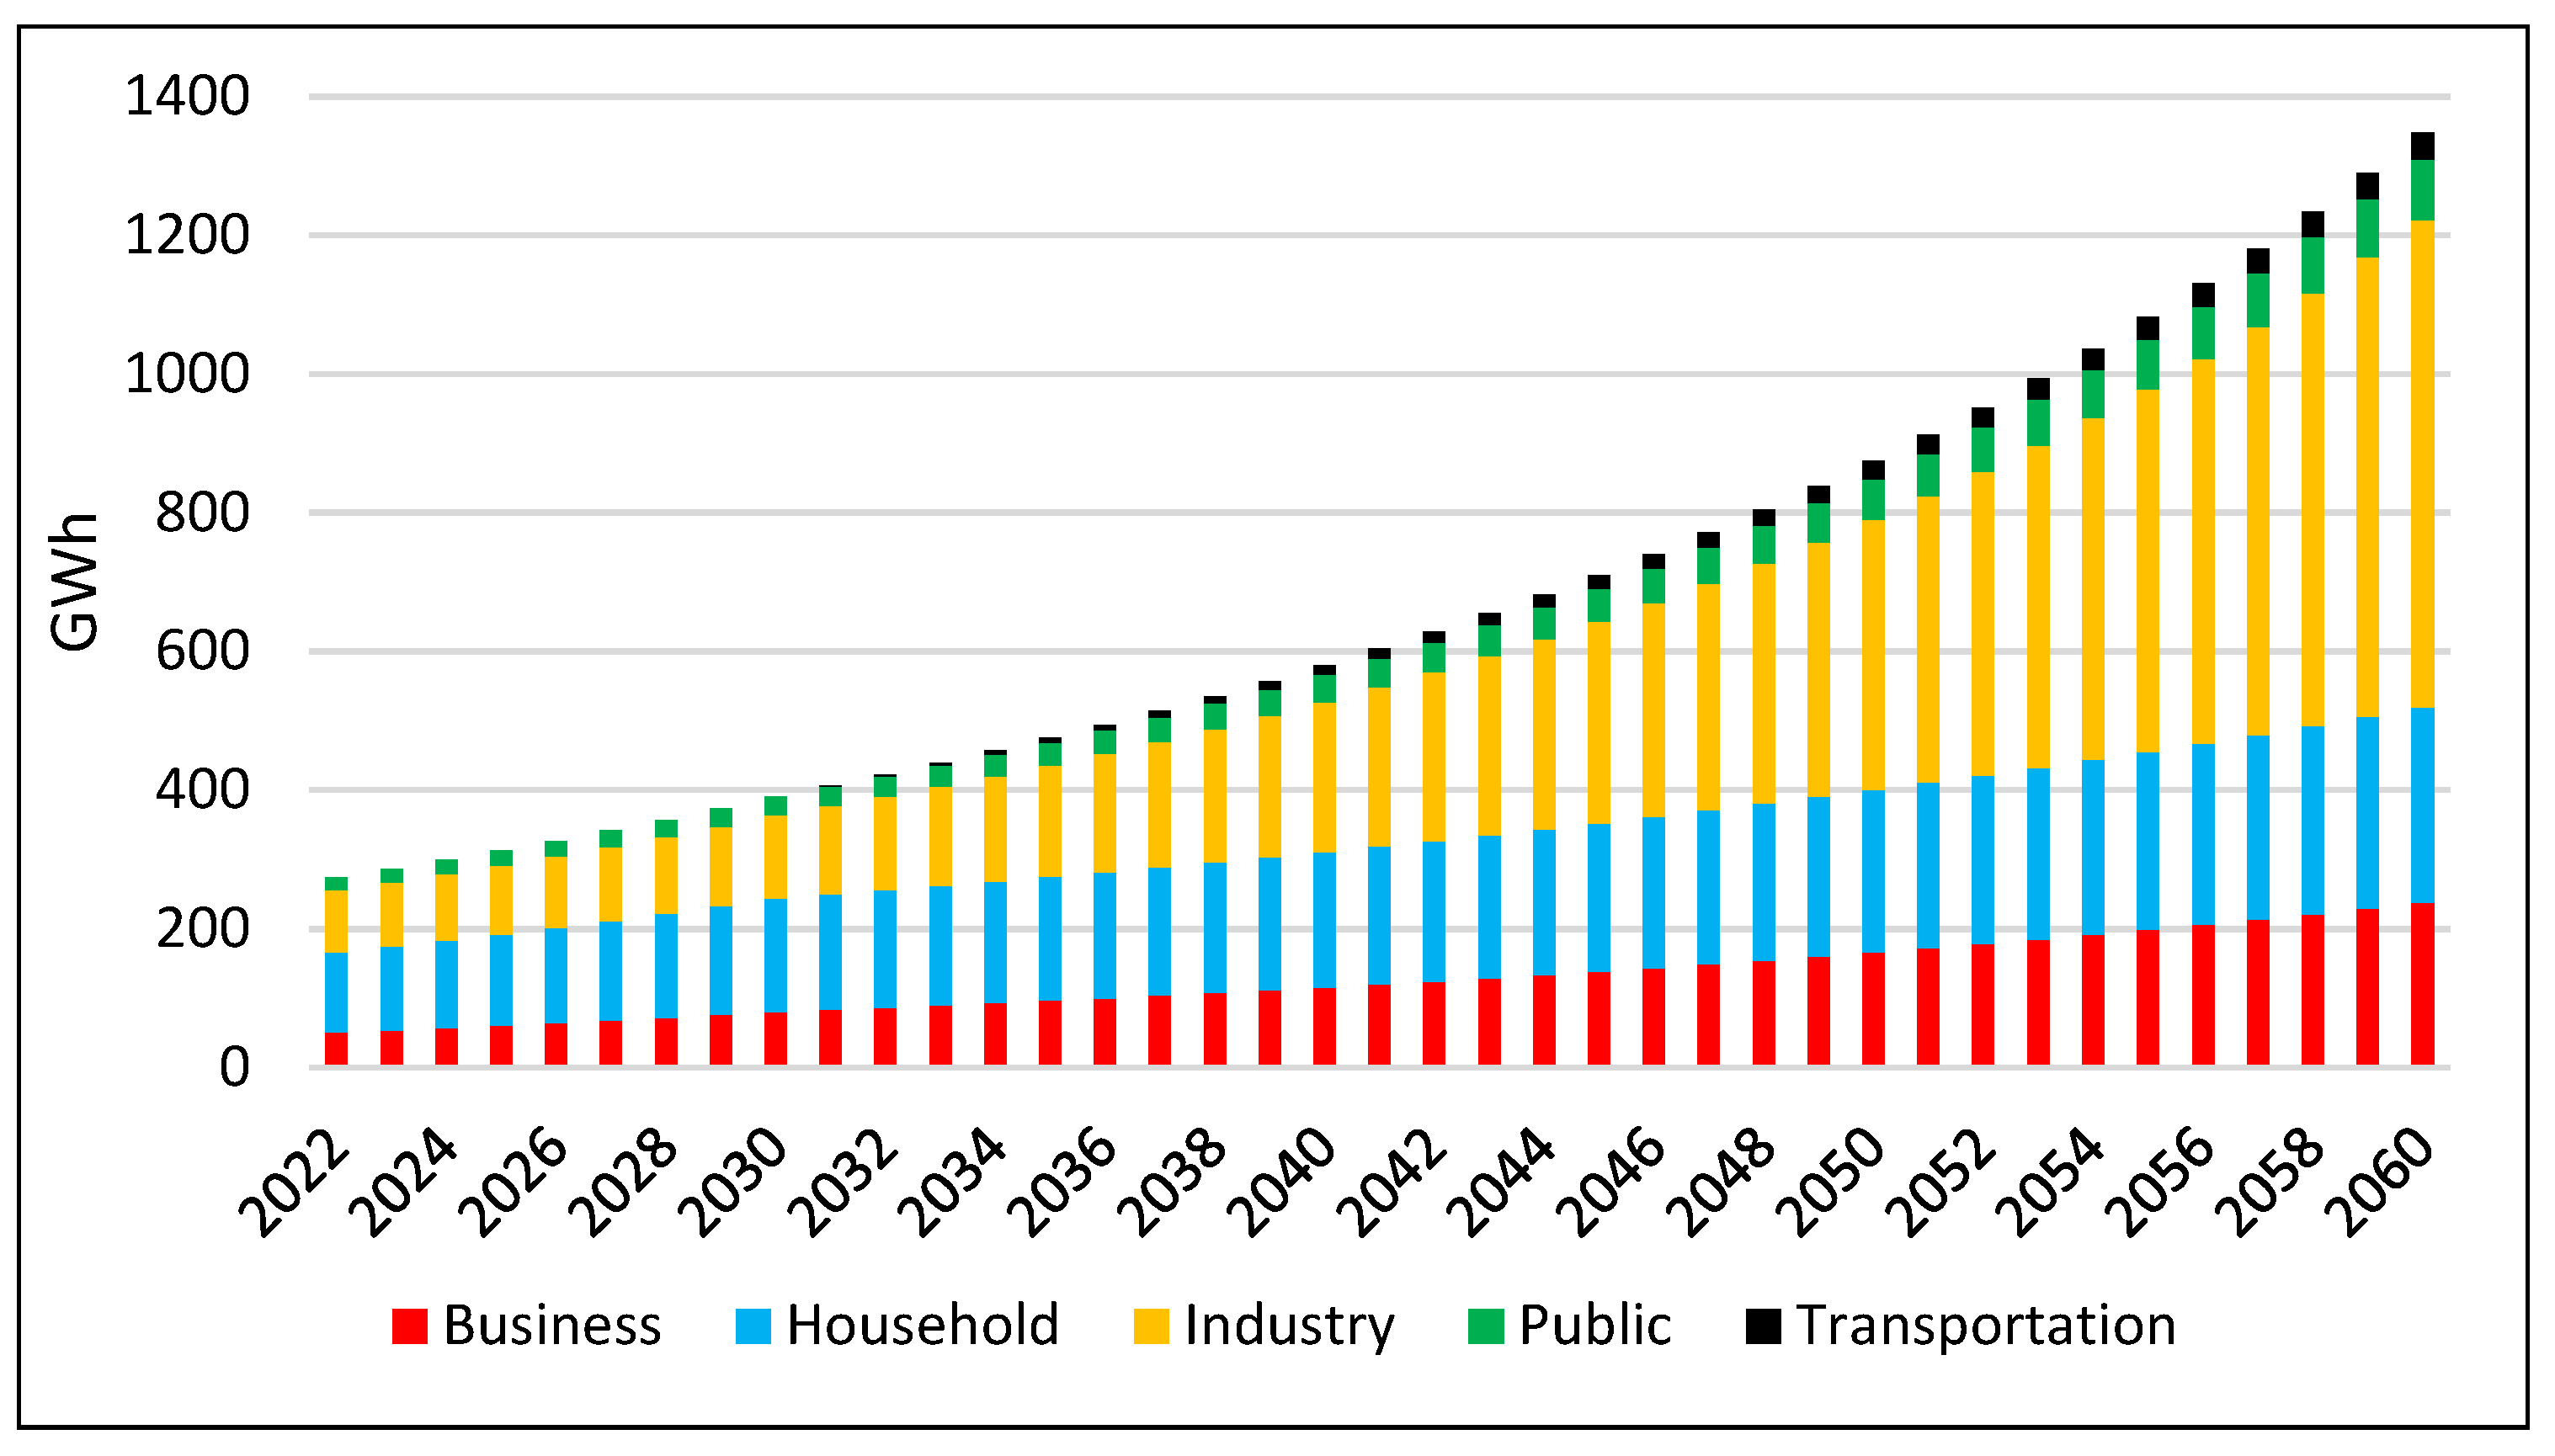
| Demand growth | % | 4.28% | [60,149] |
| Household | % | 2.35% | [60,149] |
| Business | % | 4.16% | [60,149] |
| Public | % | 4.14% | [60,149] |
| Industry | % | 5.60% | [60,149] |
| Transportation | TWh | 0 (2030); 39 (2060) | [60,149] |
| T n D losses | % | 8.75% (2022)–7% (2060) | [26,145,146,147,148] |
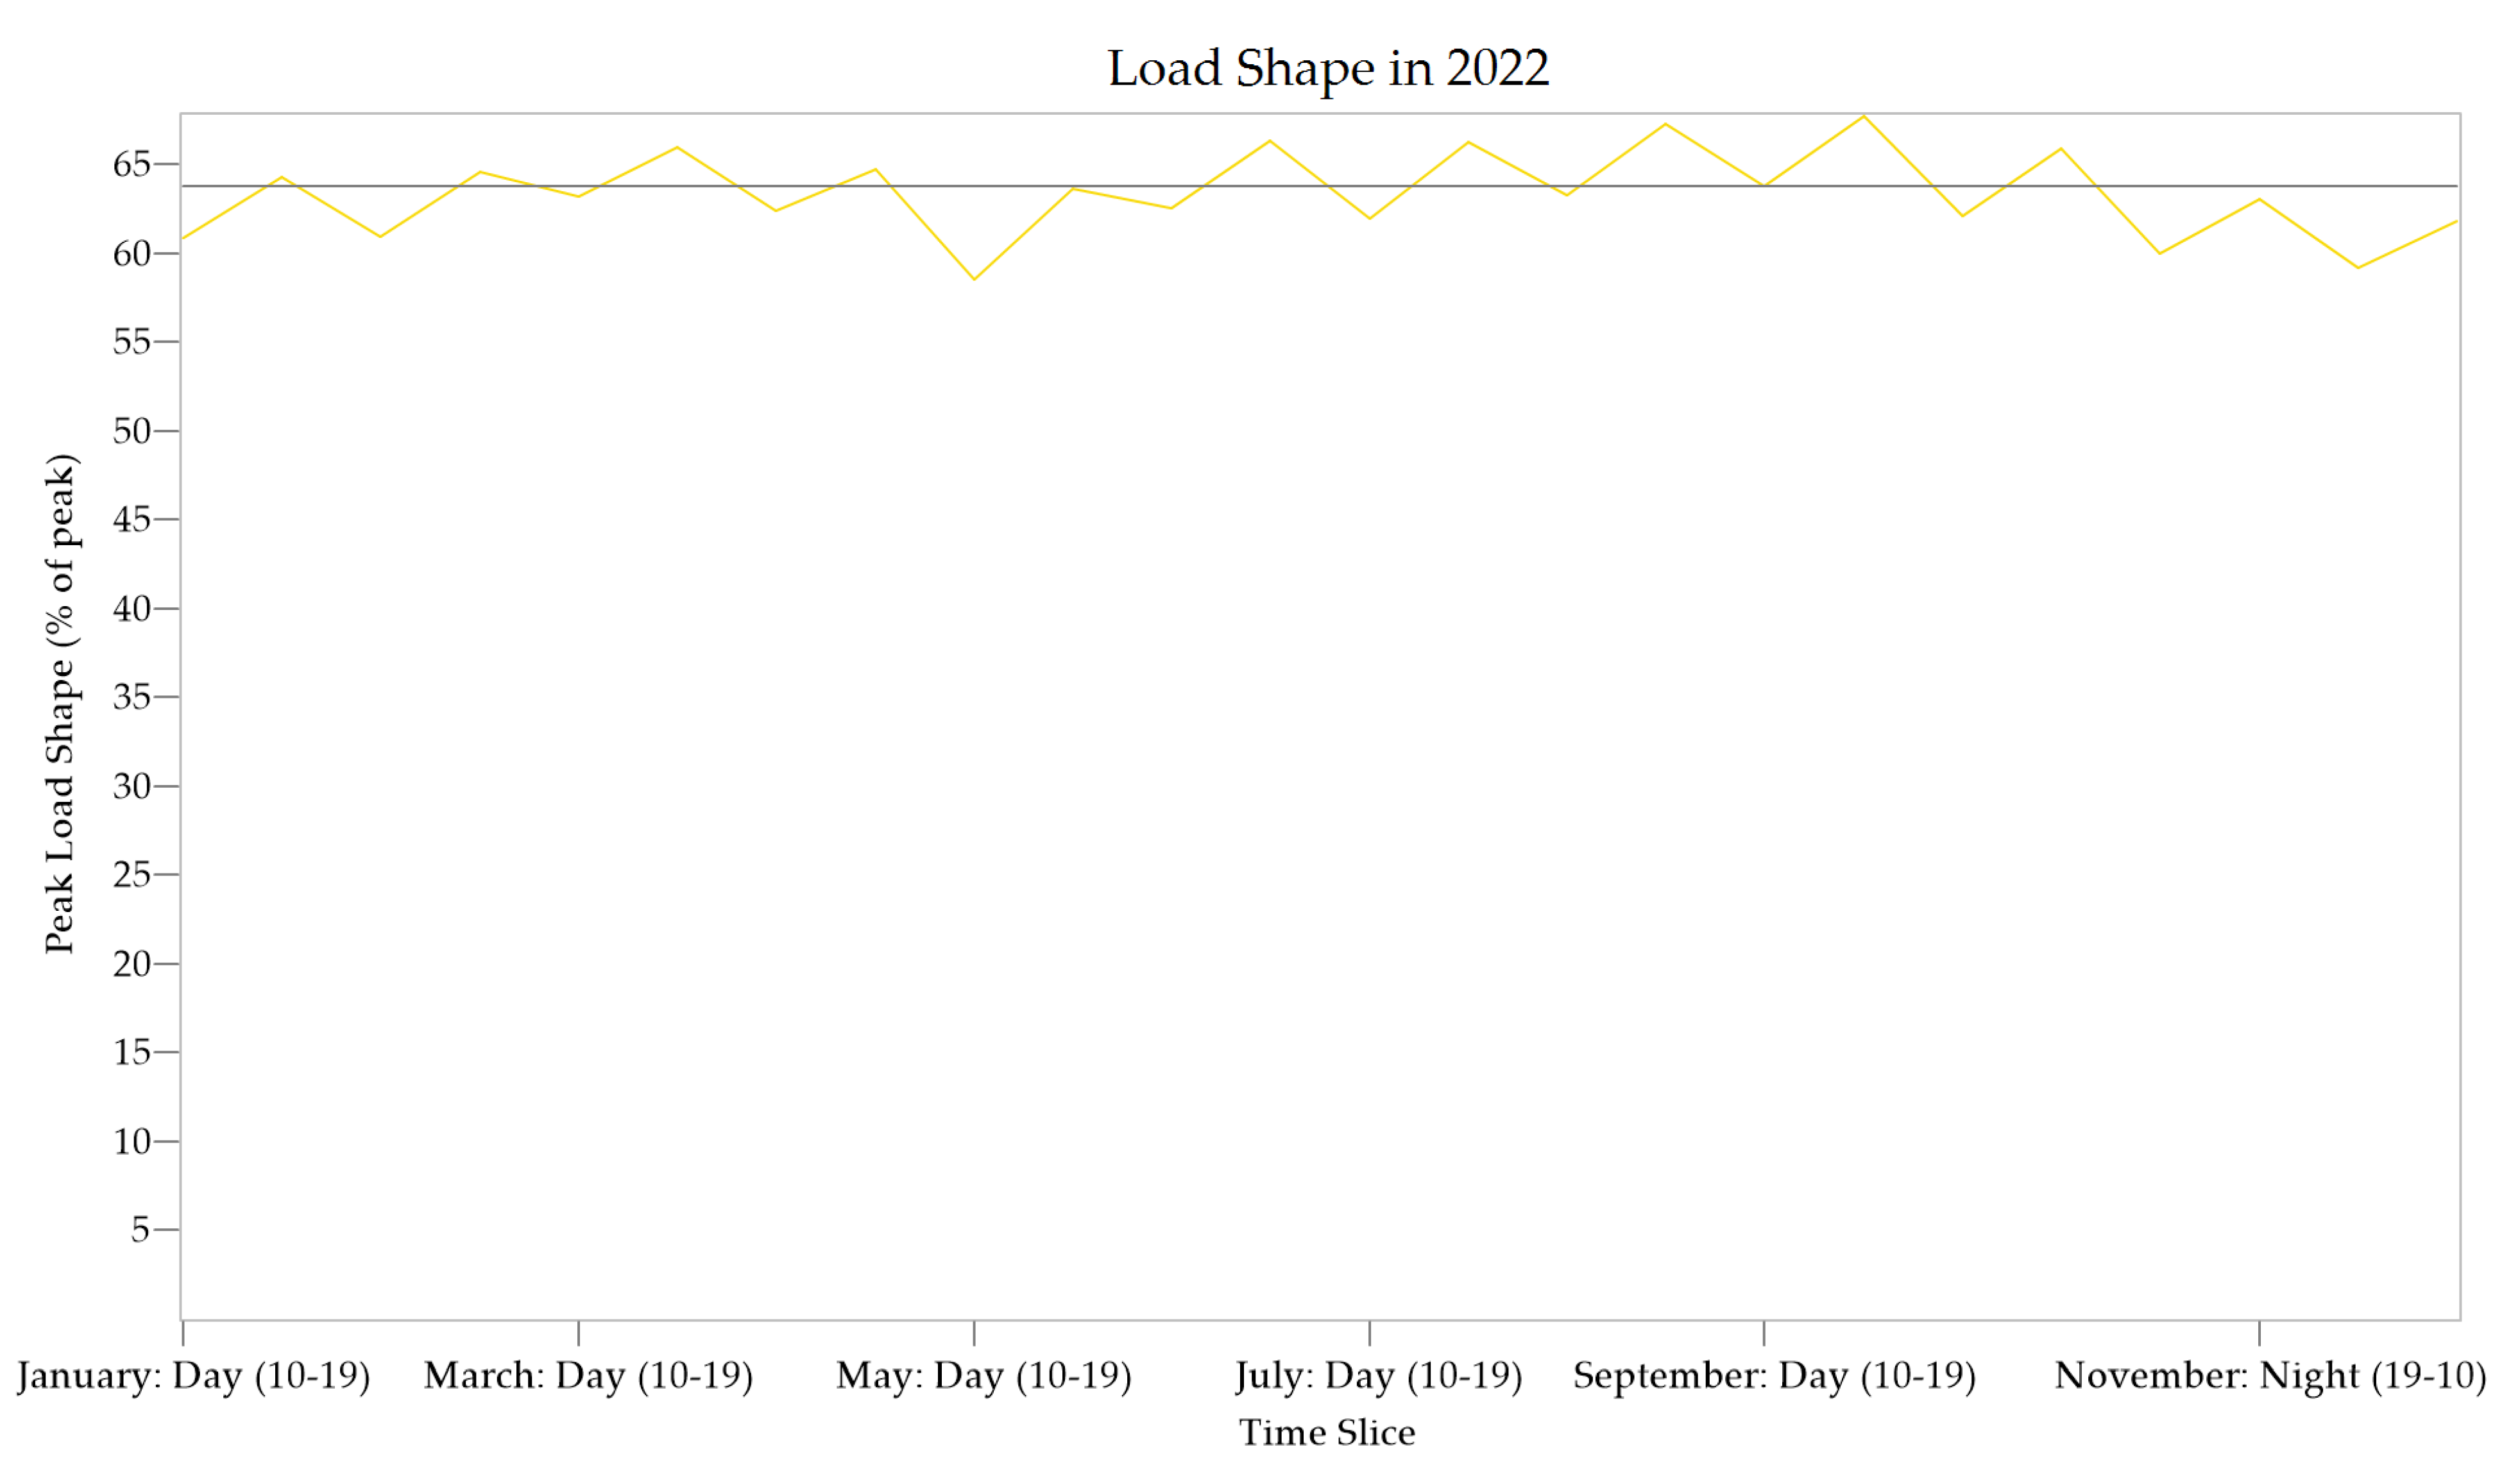
| Load shape | Figure A1 | [150] | |
| Fuel cost | Table A3 | [26,82,140,146,147,148,151,152,153,154] | |
| Lifetime | Years | Table 5 | [52,54,82,119] |
| Efficiency | % | Table 5 | [52,54,82,119] |
| Maximum availability | % | Table 5 | [52,54,77,82,119] |
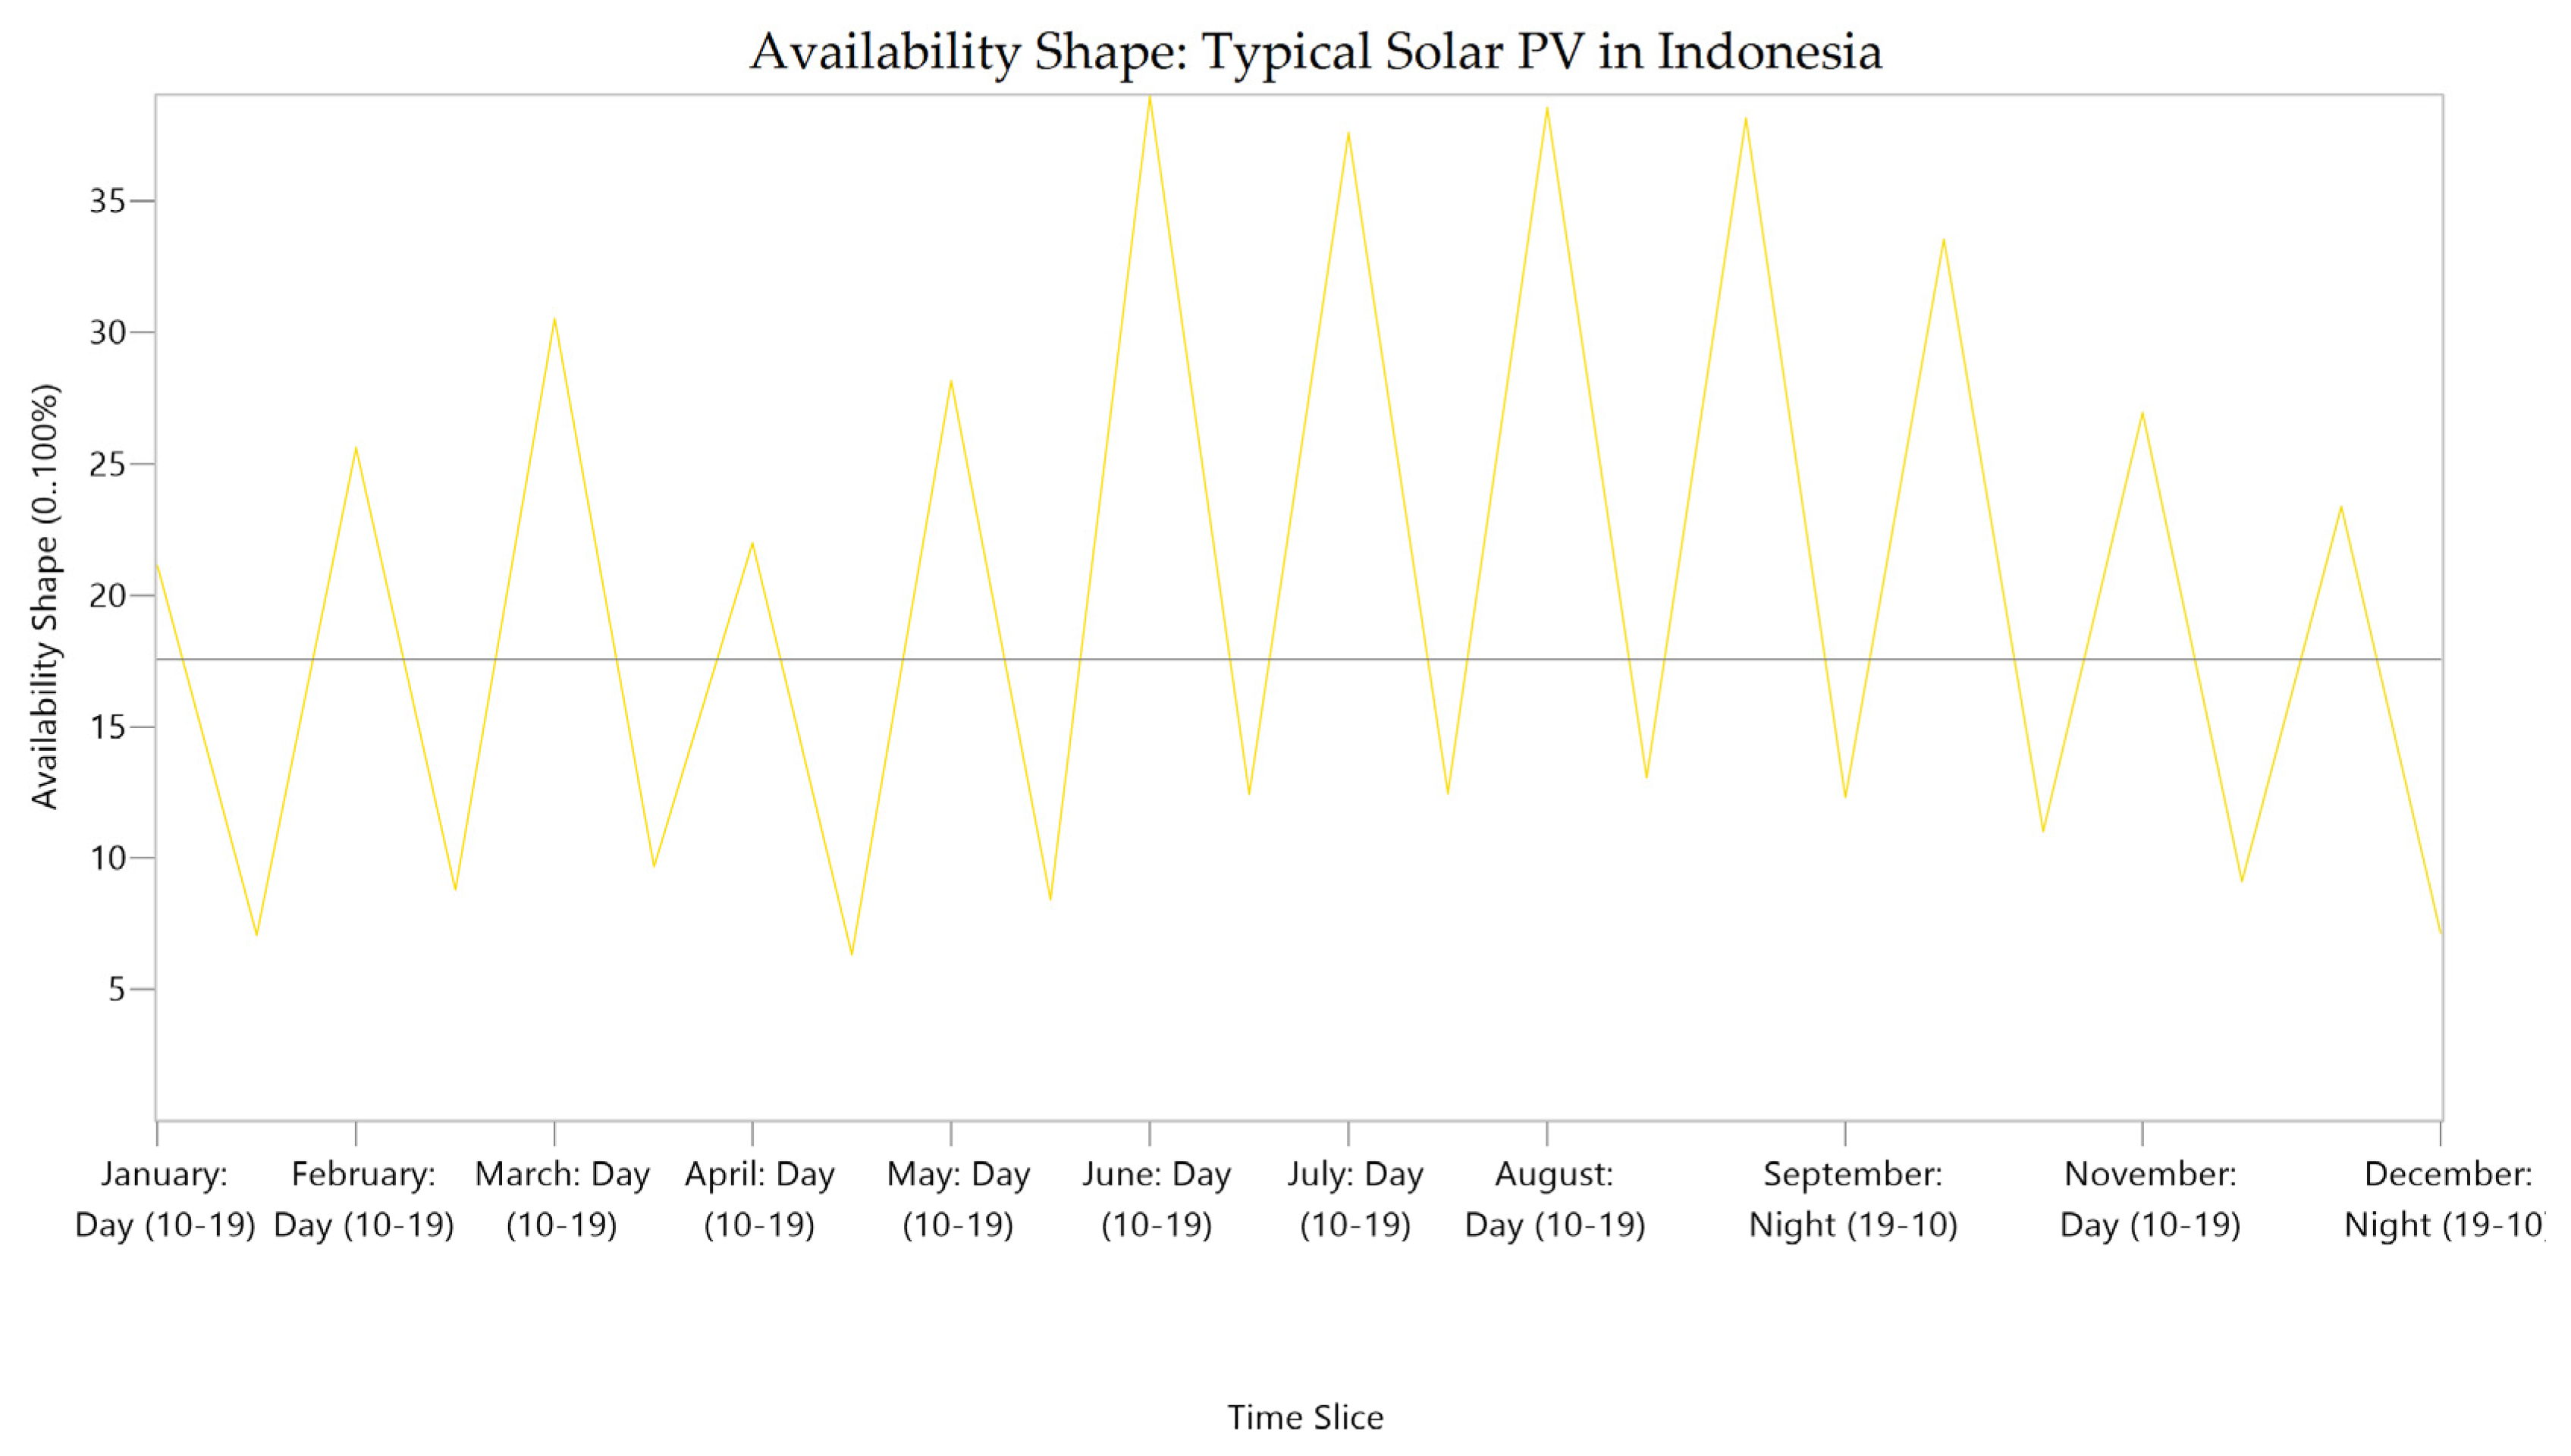
| Solar PV availability | % | Figure A2 | [155] |
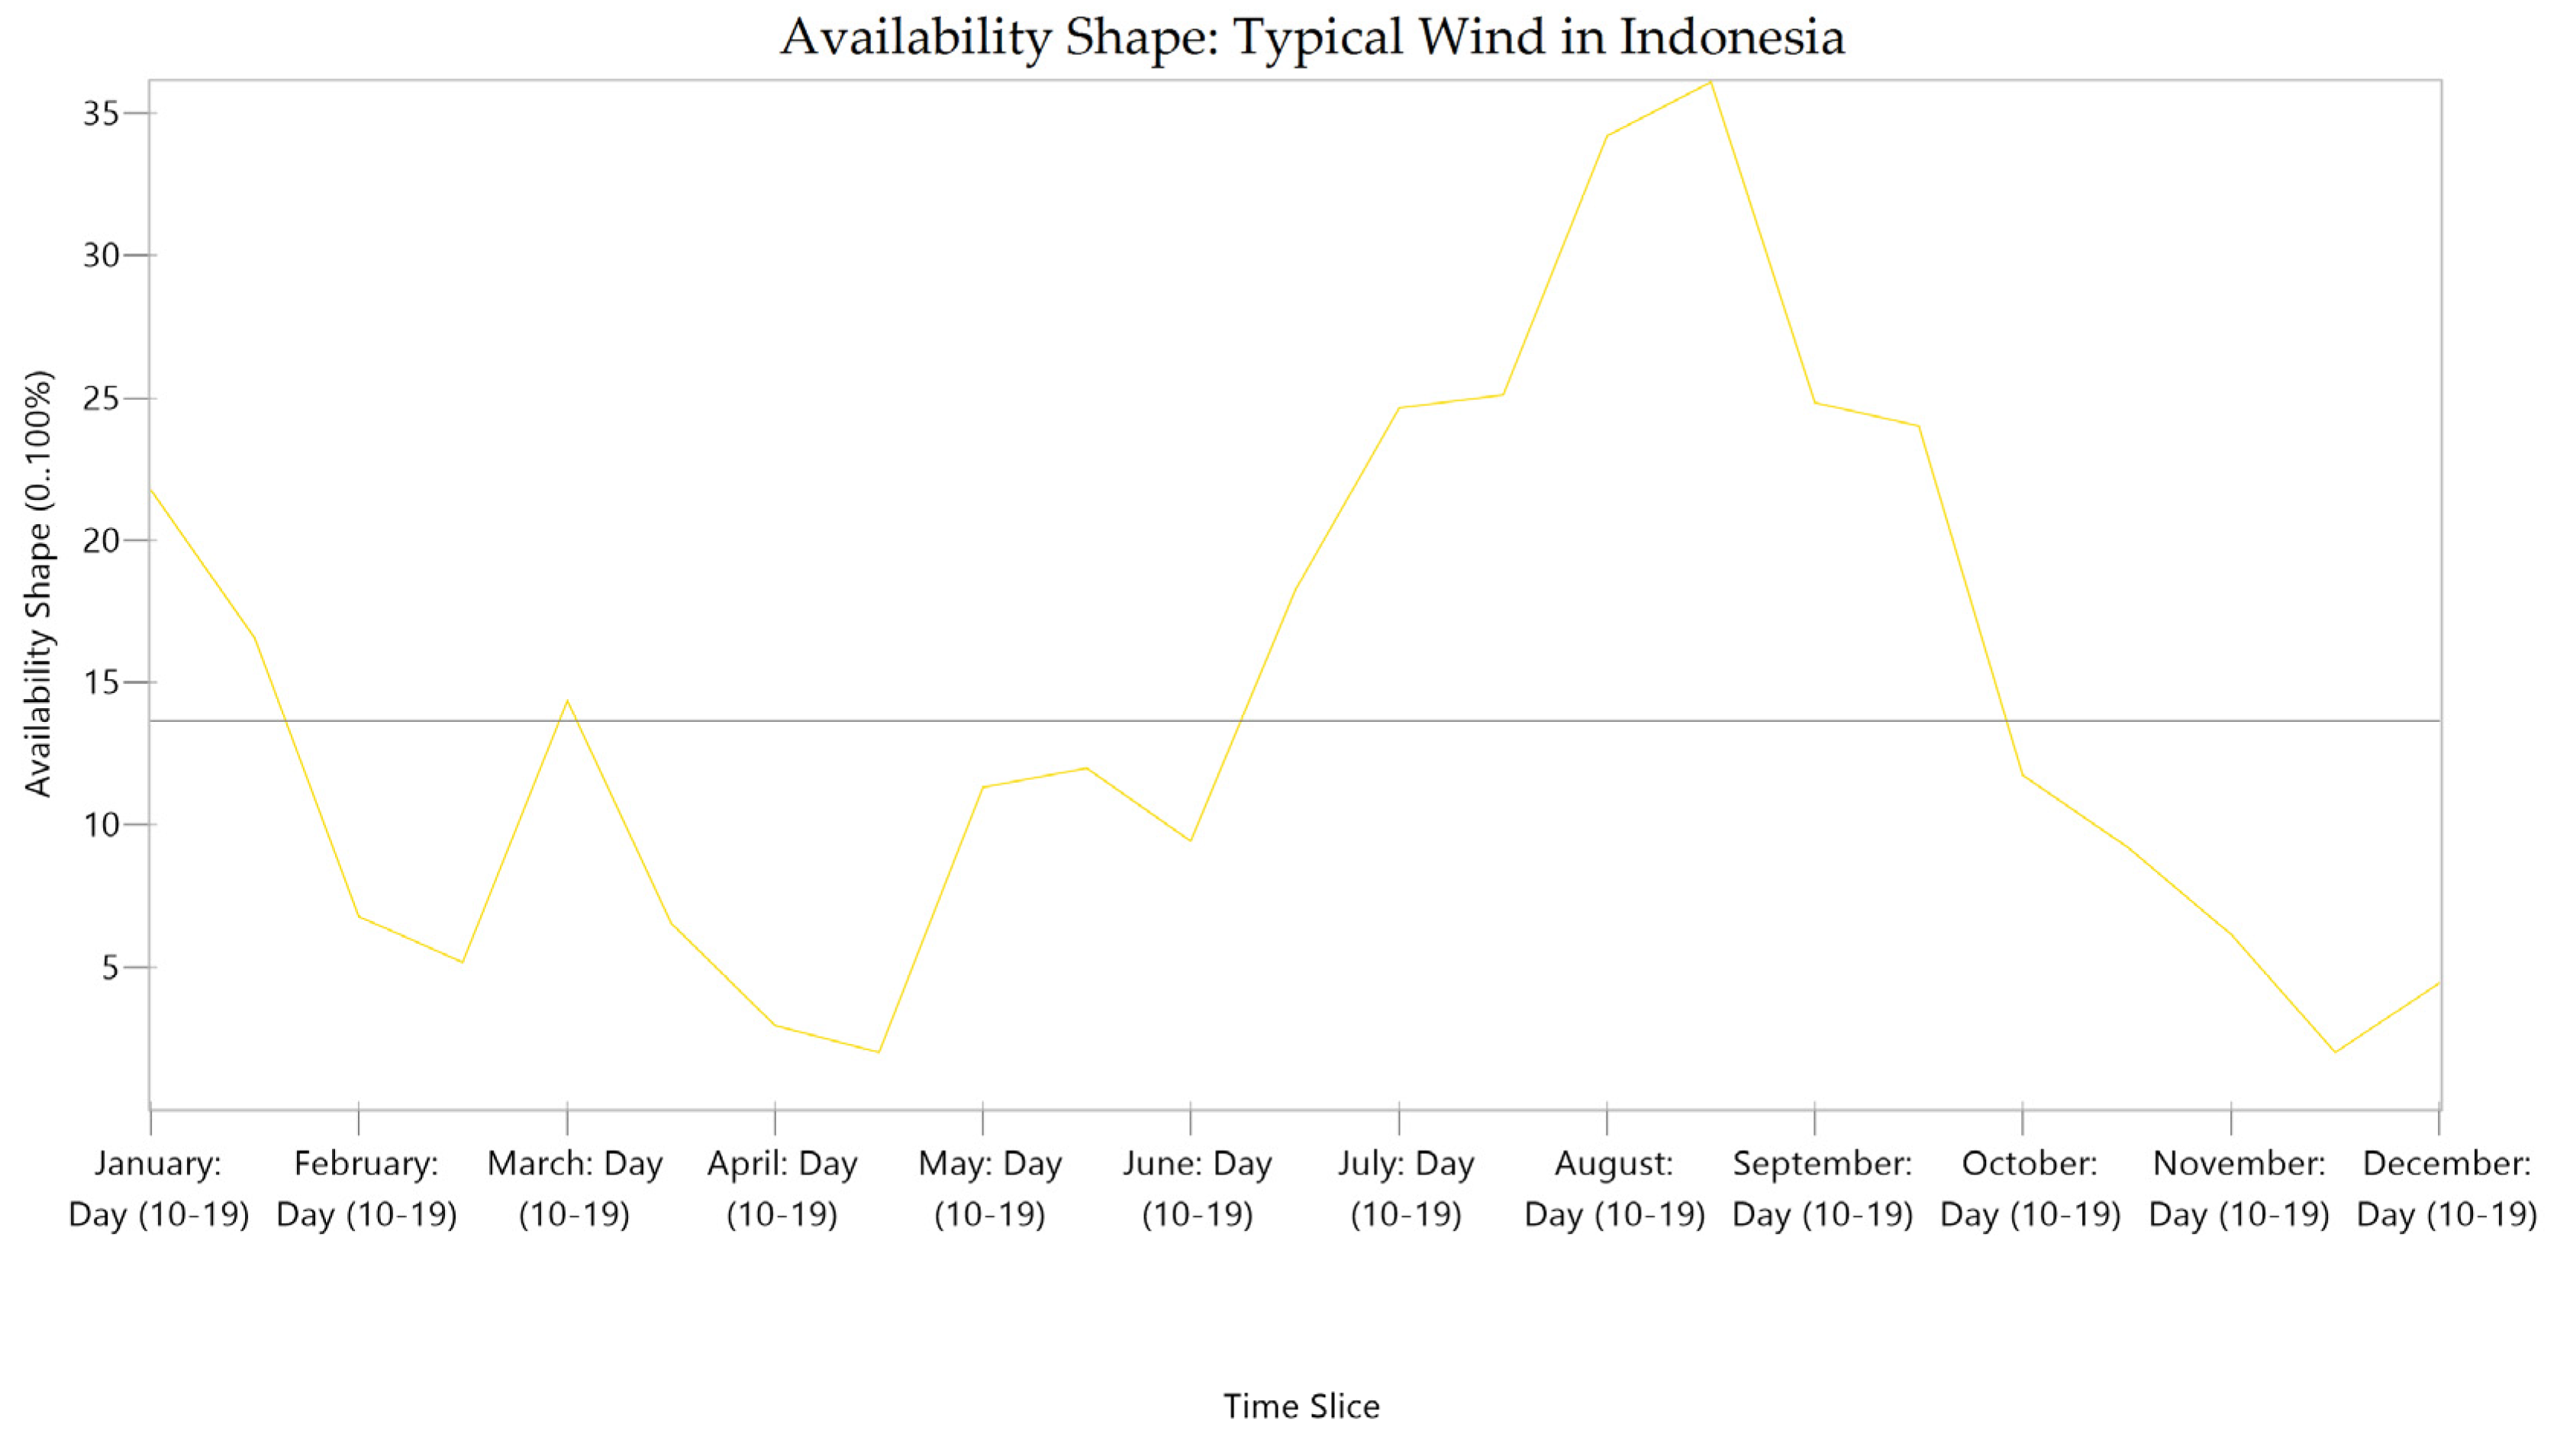
| Wind availability | % | Figure A3 | [156] |
| Capital cost | USD/MW | Table 5 | [82,119,122,157,158] |
| Capacity credit | % | Table 5 | [82,119,122,157] |
| Fixed O/M Cost | USD/MW | Table 6 | [57,82,119,122,154,157] |
| Variable O/M Cost | USD/MWh | Table 6 | [82,119,122,157,159] |
| Liability cost (NPPs) c | USD/MW | 66,667 | [158] |
| Liability cost (SMRs) d | USD/MW | 66,667 | [158] |
| Decommissioning d | 0.01 USD/kWh | [160] | |
| Reserve margin | % | 39% | [60,82] |
| Power Generation Technology | Lifetime | Efficiency | Maximum Availability | Capacity Credit | Capital Cost (Thousand USD/MW) | ||||
|---|---|---|---|---|---|---|---|---|---|
| (years) | (%) | (%) | (%) | 2020 | 2030 | 2040 | 2050 | 2060 | |
| Hydro | 80 | 100 | 41 | 51 | 2203 | 2203 | 2203 | 2203 | 2203 |
| Sub-bituminous CFPP (USC) | 40 | 35 | 90 | 100 | 1469 | 1469 | 1469 | 1469 | 1469 |
| Gas turbine open cycle (NG) | 30 | 33 | 97 | 100 | 770 | 730 | 680 | ||
| Gas engine (NG) | 30 | 45 | 97 | 100 | 800 | 800 | 780 | ||
| Gas turbine combined cycle (NG) | 30 | 56 | 95 | 100 | 944 | 944 | 944 | 944 | 944 |
| Geothermal a | 30 | 100 | 90 | 80 | 3724 | 3567 | 3462 | 3360 | 3360 |
| Solar PV | 25 | 100 | Figure A2 | 22 | 1.154 | 896 | 786 | 689 | 604 |
| Wind | 25 | 100 | Figure A3 | 35 | 1252 | 1217 | 1154 | 1094 | 1038 |
| Li-Ion 6 hours (moderate) | 15 | 85 | 25 | 25 | 2466 | 1210 | 1059 | 908 | |
| Diesel engine (diesel fuel) | 30 | 45 | 97 | 100 | 800 | 800 | 780 | ||
| Diesel engine (biodiesel) | 30 | 45 | 97 | 100 | 800 | 800 | 780 | ||
| CFPP (biomass) | 40 | 35 | 90 | 100 | 1469 | 1469 | 1469 | 1469 | 1469 |
| Typical Korea LRs b | 60 | 36 | 83 | 100 | 3133 | 3133 | 3133 | 3133 | 3133 |
| Typical France LRs b | 60 | 33 | 83 | 100 | 5772 | 5772 | 5772 | 5772 | 5772 |
| SMR HTR-PM b | 60 | 42 | 83 | 100 | 3485 | 3485 | 3485 | 3485 | 3485 |
| SMR VBER 300 Mwe b | 60 | 24 | 83 | 100 | 4415 | 4415 | 4415 | 4415 | 4415 |
| Power Generation Technology | Fixed O&M Cost USD/MW/Year | Variable Cost (USD/MWh) | ||||
|---|---|---|---|---|---|---|
| 2020 | 2030 | 2050 | 2020 | 2030 | 2050 | |
| Hydro | 37,700 | 36,200 | 33,600 | 0.65 | 0.62 | 0.58 |
| Sub-bituminous CFPP (USC) | 56,600 | 54,900 | 53,200 | 4.70 | 4.70 | 4.70 |
| Gas turbine open cycle (NG) | 23,200 | 22,500 | 21,800 | 3.90 | 3.90 | 3.90 |
| Gas engine (NG) | 8000 | 8000 | 7760 | 6.40 | 6.00 | 5.80 |
| Gas turbine combined cycle (NG) | 23,500 | 22,800 | 22,100 | 2.30 | 2.23 | 2.16 |
| Geothermal | 50,000 | 43,000 | 35,500 | 0.25 | 0.22 | 0.18 |
| Solar PV | 14,400 | 10,000 | 8000 | - | - | - |
| Wind | 60,000 | 51,000 | 43,200 | - | - | - |
| Li-Ion 6 hours (moderate) | 62,000 | 30,000 | 23,000 | |||
| Diesel engine (diesel fuel) | 8000 | 8000 | 7760 | 6.40 | 6.00 | 5.80 |
| Diesel engine (biodiesel) | 8000 | 8000 | 7760 | 6.40 | 6.00 | 5.80 |
| CFPP (biomass) | 56,600 | 54,900 | 53,200 | 4.70 | 4.70 | 4.70 |
| Typical Korea LRs | 138,000 | 138,000 | 138,000 | 4.30 | 4.30 | 4.30 |
| Typical France LRs | 138,000 | 138,000 | 138,000 | 4.30 | 4.30 | 4.30 |
| SMR HTR-PM | 114,000 | 114,000 | 114,000 | 4.30 | 4.30 | 4.30 |
| SMR VBER-300 MWe | 114,000 | 114,000 | 114,000 | 4.30 | 4.30 | 4.30 |
Disclaimer/Publisher’s Note: The statements, opinions and data contained in all publications are solely those of the individual author(s) and contributor(s) and not of MDPI and/or the editor(s). MDPI and/or the editor(s) disclaim responsibility for any injury to people or property resulting from any ideas, methods, instructions or products referred to in the content. |
© 2023 by the authors. Licensee MDPI, Basel, Switzerland. This article is an open access article distributed under the terms and conditions of the Creative Commons Attribution (CC BY) license (https://creativecommons.org/licenses/by/4.0/).
Share and Cite
Rahmanta, M.A.; Adhi, A.C.; Tambunan, H.B.; Digwijaya, W.; Damanik, N.; Al Hasibi, R.A. An Analysis of National Position, Opportunity, and Challenge of Indonesia’s Nuclear Program to Support Net-Zero Emissions by 2060. Energies 2023, 16, 8089. https://doi.org/10.3390/en16248089
Rahmanta MA, Adhi AC, Tambunan HB, Digwijaya W, Damanik N, Al Hasibi RA. An Analysis of National Position, Opportunity, and Challenge of Indonesia’s Nuclear Program to Support Net-Zero Emissions by 2060. Energies. 2023; 16(24):8089. https://doi.org/10.3390/en16248089
Chicago/Turabian StyleRahmanta, Mujammil Asdhiyoga, Andrew Cahyo Adhi, Handrea Bernando Tambunan, Wigas Digwijaya, Natalina Damanik, and Rahmat Adiprasetya Al Hasibi. 2023. "An Analysis of National Position, Opportunity, and Challenge of Indonesia’s Nuclear Program to Support Net-Zero Emissions by 2060" Energies 16, no. 24: 8089. https://doi.org/10.3390/en16248089