Article

Decomposition Analysis of Regional Electricity Consumption Drivers Considering Carbon Emission Constraints: A Comparison of Guangdong and Yunnan Provinces in China

1
Guangzhou Institute of Geochemistry, Chinese Academy of Sciences, Guangzhou 510640, China
2
Guangzhou Institute of Energy Conversion, Chinese Academy of Sciences, Guangzhou 510640, China
3
University of Chinese Academy of Sciences, Beijing 100049, China
4
School of Environment, Jinan University, Guangzhou 511486, China
*
Authors to whom correspondence should be addressed.
Energies 2023, 16(24), 8052; https://doi.org/10.3390/en16248052
Submission received: 27 October 2023 / Revised: 1 December 2023 / Accepted: 7 December 2023 / Published: 14 December 2023
(This article belongs to the Topic Energy Policy, Regulation and Sustainable Development)

Abstract

:
Electricity consumption is closely linked to economic growth, social development, and carbon emissions. In order to fill the gap of previous studies on the decomposition of electricity consumption drivers that have not adequately considered carbon emission constraint, this study constructs the Kaya extended model of electricity consumption and analyzes the effects of drivers in industrial and residential sectors using the Logarithmic Mean Divisia Index (LMDI) method, and empirically explores the temporal and spatial differences in electricity consumption. Results show that: (1) During 2005–2021, the total final electricity consumption growth in Guangdong was much higher than that in Yunnan, but the average annual growth rate in Guangdong was lower, and the largest growth in both provinces was in the industrial sector. (2) The labor productivity level effect is the primary driver that increases total final electricity consumption (Guangdong: 78.5%, Yunnan: 87.1%), and the industrial carbon emission intensity effect is the primary driver that decreases total final electricity consumption (Guangdong: −75.3%, Yunnan: −72.3%). (3) The year-to-year effect of each driver by subsector is overall positively correlated with the year-to-year change in the corresponding driver, and declining carbon emission intensity is a major factor in reducing electricity consumption. (4) The difference in each effect between Guangdong and Yunnan is mainly determined by a change in the corresponding driver and subsectoral electricity consumption. Policy implications are put forward to promote energy conservation and the realization of the carbon neutrality goal.

1. Introduction

In order to achieve the purpose and long-term goals of the Paris Agreement, much more global mitigation and adaptation action and support are needed now on all fronts; otherwise, the window of opportunity for creating a livable and sustainable future for all will rapidly close [1]. Low GHG emissions development is an important way to achieve sustainable development, contributing to addressing the climate crisis. Electricity consumption is closely related to socio-economic development and improvement in living standards [2,3]. As is well known, China’s dual carbon goals are achieving carbon peaking by 2030 and carbon neutrality by 2060 [4]. However, fossil fuel consumption is the main source of carbon emissions in China’s energy sector, of which coal consumption accounts for the highest proportion, and coal electricity accounts for the highest proportion of total power generation at present [5]. Hence, the carbon emission reduction task of China’s energy sector is arduous.
Different regions face varying pressures on electricity supply and sale, security risk, and carbon emissions reduction [6]. Therefore, it is important to understand the differences in regional electricity consumption in relation to economic growth, social development, and carbon emissions between different regions. This study takes Guangdong Province and Yunnan Province in China as examples. Guangdong is one of the most developed provinces in China, and in 2021, its GDP, permanent population, and total energy consumption were the highest in the country, accounting for 10.82%, 8.98%, and 7.00% of the country’s total, respectively [7]. Guangdong’s energy resources are relatively scarce, and electricity consumption is dominated by thermal power, with renewable energy generation and electricity imported from other provinces also accounting for a certain percentage. While Yunnan’s relative lag in economic development, and in 2021, its GDP, permanent population, and total energy consumption accounted for 2.36%, 3.32%, and 2.55% of the country’s total, respectively [8]. Yunnan is relatively rich in energy resources, and its renewable energy power generation accounts for 87.93% of total power generation in 2021, with hydropower accounting for 80.32% of that total. As can be seen, there are significant differences between Guangdong and Yunnan in terms of socio-economic development, population, energy resource endowment, energy and electricity consumption, etc. Therefore, exploring the differences in the drivers of electricity consumption is an important research topic, which can clarify the different impacts of multiple drivers on electricity consumption in these two provinces and provide locally adapted strategies for economic development, energy conservation, and carbon emission reduction, as well as provide theoretical and methodological references and empirical evidence for other provinces, which will help China’s dual-carbon goals to be realized.

2. Literature Review

Decomposition analysis has been widely used in the study of energy–economic–environmental systems. Index decomposition analysis (IDA) [9], structural decomposition analysis (SDA) [10], and production–theoretical decomposition analysis (PDA) [11] are the three types of decomposition analysis methods that have been applied more commonly. Because of the simplicity and applicability of IDA, it is suitable for analyzing the effects of multiple factors based on time series data, especially for the study of issues related to energy consumption and carbon emissions. The Logarithmic Mean Divisia Index (LMDI) method is one of the IDA methods, which is more advantageous due to no residual terms, ease of dealing with zero value, and the fact that addition and product decomposition forms can be converted to each other [12,13,14]. In addition, the LMDI method effectively avoids the pseudo-regression problem, can maintain a high degree of consistency among the various decomposition indicators [15], and makes it easy to compare the degree of contribution of different drivers [16]. Therefore, the LMDI method is frequently adopted to analyze the drivers of electricity consumption.
Many previous studies decomposed and analyzed the drivers of carbon emissions [17,18,19], water resources [20,21,22], and energy consumption [23,24,25] using the LMDI method. Scholars conducted extensive analysis and discussion from the perspectives of a country, region, sector, and so on and tapped many factors affecting electricity consumption. Electricity share, energy consumption intensity, economic structure, economic activity, and population are often considered to be influencing factors on electricity consumption in a country or region [26,27,28]. Praene et al. [29] obtained three different effects related to the number of consumers that influenced the variation in electricity consumption: activity effect, structural effect, and intensity effect. Fang et al. [30] decomposed China’s electricity consumption into four factors: economic scale, economic geographical structure, electricity consumption intensity, and industrial electricity consumption structure. Fang et al. [31] explored the impact of eight drivers on total electricity consumption in China’s Key Economic Regions, of which three quantitative factors (GDP scale, capital stock, and population) and five relative factors (output electricity consumption intensity, investment electricity consumption intensity, per capita electricity consumption, per capita output, and proportion of investment in GDP).
From a sectoral perspective, the existing literature considers different drivers. Park et al. [32] assessed how production, structure, fuel efficiency, and electrification affected the increase in electricity consumption in 11 industrial sectors in Korea. Shi et al. [33] estimated the effects of advanced technology, structural effects, income effects, and population effects on the production power consumption changes of the Yangtze River Economic Zone. Huang [34] factorized residential electricity consumption in Taiwan, considering climate, household, floor area, ownership, efficiency, and usage effects. Meng et al. [35] studied the growth of residential electricity consumption in China and obtained three factors: living standards, population, and provincial demographic structure. Zhang et al. [36] decomposed the change in total electricity consumption in the Yangtze River Delta region of China into industry effect (economic growth, industrial structure, and industry electricity consumption intensity) and domestic effect (population scale, urbanization, and domestic electricity consumption intensity).
The existing literature has analyzed the drivers of electricity consumption by geographic region or sector, with the drivers being categorized as economic, demographic, and social factors. To the best of our knowledge, almost no literature considers carbon emission constraints, such as carbon emission intensity, which motivates us to conduct research to fill the research gap. There are significant differences in the mechanisms influencing industrial and residential electricity consumption, but there is less literature on the division of total regional electricity consumption into industrial and residential electricity consumption to study their evolutionary driving mechanisms separately [36]. Based on the research deficiencies mentioned above, this study conducts a decomposition analysis of the drivers of electricity consumption considering carbon emission constraints in two typical regions to formulate more targeted energy-saving and emission-reduction policies in accordance with the local conditions.
The three main contributions of this study are as follows: (1) This study introduces carbon emission-related factors, such as carbon emission intensity and energy consumption per unit of carbon emission, into the LMDI decomposition model of electricity consumption in order to explore the evolution of electricity consumption, which fills the gap in the research field. (2) This study constructs the Kaya extended models of electricity consumption in industrial and residential sectors, respectively, and analyzes the impact of each driver on electricity consumption in each subsector using the LMDI method. It is an important addition to studies related to electricity consumption. (3) This study takes Guangdong and Yunnan, which have typical characteristics, as the research areas and empirically explores the temporal and spatial differences in electricity consumption so as to provide locally adapted strategies for economic development, energy conservation, and carbon emission reduction, as well as provide theoretical and methodological references and empirical evidence for other provinces.

3. Methods and Data Sources

3.1. Decomposition Modeling of Electricity Consumption Drivers

The basic expression of Kaya Identity [37] is as follows:
C O 2 = C O 2 E × E G D P × G D P P
It was initially used to explore the relationship between anthropogenic CO2 emissions and factors such as energy consumption, economic development, and population. However, as research in the field of energy-economy-environment has developed in-depth, a variety of Kaya extended models applicable to different research objects have been constructed and applied more widely. In this section, based on the basic principle of Kaya Identity and taking into account the carbon emissions factor, we construct the Kaya extended model of electricity consumption and analyze the decomposition of the drivers of electricity consumption in the industrial sector and residential sector using the LMDI decomposition method, respectively.

3.1.1. LMDI Decomposition Model of Electricity Consumption in Industrial Sector

The Kaya extended model of electricity consumption in the industrial sector is constructed as follows:
E l 1 = i E l i F E i × F E i F C E i × F C E i G D P i × G D P i G D P × G D P P E × P E = i ( a i × b i × c i × d i × e i × f i )
where EL1 denotes the final electricity consumption in the industrial sector; i denotes the type of industrial subsector, including six subsectors, namely, agriculture (abbreviation for agriculture, forestry, animal husbandry, fishery and water conservancy), industry, construction, transportation (abbreviation for transportation, warehousing, and postal services), commercial services (abbreviation for wholesale, retail, lodging, and catering). and other services; ELi denotes the final electricity consumption in industrial subsector i, excluding grid transmission loss, and unless otherwise specified, electricity consumption in this study refers to final electricity consumption. FEi denotes the final energy consumption in industrial subsector i; FCEi denotes the final energy consumption related to carbon emissions in industrial subsector i; GDPi denotes the value added in industrial subsector i; GDP denotes the Gross Domestic Product or Gross Regional Product, i.e., the sum of GDP of all industrial subsectors; and PE denotes the number of employed people at the end of the year.
Then, let:
a i = E l i F E i ,   b i = F E i F C E i ,   c i = F C E i G D P i ,   d i = G D P i G D P ,   e i = G D P P E ,   f i = P E
where ai denotes the share of electricity in final energy consumption in industrial subsector i, representing the electrification level; bi denotes the average final energy consumption per unit of carbon emissions (or called energy consumption intensity in this study) in industrial subsector i; ci denotes the carbon emissions intensity in industrial subsector i; di denotes the ratio of value-added to GDP in industrial subsector i, representing industrial structure; ei denotes the average output per employed person, representing the labor productivity level, which also reflects technological progress; and fi denotes the employed population size.
The electricity consumption in a region will change year by year with the changes of various related influencing factors. Set the baseline year as T0, the final electricity consumption of the industrial sector in the baseline year as E l 1 0 , and the final electricity consumption of the industrial sector in year n as E l 1 n , then the change of the final electricity consumption of the industrial sector from the baseline year to year n is Δ E l 1 0 n . Δ E l 1 0 n is calculated as follows:
Δ E l 1 0 n = E l 1 n E l 1 0 = i a i n × b i n × c i n × d i n × e i n × f i n i ( a i 0 × b i 0 × c i 0 × d i 0 × e i 0 × f i 0 )
There are eight forms of LMDI decomposition models based on different weights, decomposition methods, and indicators [38]. In order to facilitate the analysis and discussion of the results at the subsector level, this study uses the additive form of the LMDI decomposition method to decompose the change in the final electricity consumption, then let:
Δ E l 1 0 n = Δ E l a 0 n + Δ E l b n 0 n + Δ E l c 0 n + Δ E l d 0 n + Δ E l e 0 n + Δ E l f 0 n
Δ E l a 0 n = i E l i n E l i 0 l n E l i n l n E l i 0 × ln a i n a i 0
Δ E l b 0 n = i E l i n E l i 0 l n E l i n l n E l i 0 × ln b i n b i 0
Δ E l c 0 n = i E l i n E l i 0 l n E l i n l n E l i 0 × ln c i n c i 0
Δ E l d 0 n = i E l i n E l i 0 l n E l i n l n E l i 0 × ln d i n d i 0
Δ E l e 0 n = i E l i n E l i 0 l n E l i n l n E l i 0 × ln e i n e i 0
Δ E l f 0 n = i E l i n E l i 0 l n E l i n l n E l i 0 × ln f i n f i 0
where Δ E l a 0 n denotes industrial electrification level effect (ELE1); Δ E l b 0 n denotes industrial energy consumption intensity effect (CEE1); Δ E l c 0 n denotes industrial carbon emission intensity effect (CIE1); Δ E l d 0 n denotes industrial structure effect (ISE1); Δ E l e 0 n denotes labor productivity level effect (LPE1); and Δ E l f 0 n denotes employed population size effect (EPE1). The above effect parameters represent cumulative effects from the baseline year to year n.
Δ E l 1 n 1 n , which denotes the year-to-year effect in the industrial sector from year n − 1 to year n, is calculated as follows:
Δ E l 1 n 1 n = Δ E l 1 0 n Δ E l 1 0 n 1

3.1.2. LMDI Decomposition Model of Electricity Consumption in Residential Sector

The Kaya extended model of electricity consumption in the residential sector is constructed as follows:
E l 2 = j ( E l j F E j × F E j F C E j × F C E j T I j × T I j P j × P j P × P ) = j ( h j × k j × l j × m j × o j × p j )
where EL2 denotes the final electricity consumption in the residential sector; j denotes the type of residential subsector, including urban residential subsector and rural residential subsector; ELj denotes the final electricity consumption in residential subsector j. FEj denotes the final energy consumption in residential subsector j; FCEj denotes the final energy consumption related to carbon emissions in residential subsector j; TIj denotes the total income of the residents in residential subsector j; Pj denotes permanent population at the end of the year in residential subsector j; and P denotes the total permanent population at the end of the year.
Then, let:
h j = E l j F E j ,   k j = F E j F C E j ,   l j = F C E j T I j , m j = T I j P j ,   o j = P j P , p j = P
where hj denotes the share of electricity in final energy consumption in residential subsector j, representing the electrification level; kj denotes residential energy consumption intensity related carbon emissions in residential subsector j; lj denotes the ratio of energy consumption related carbon emissions to the total income of residents in residential subsector j; mj denotes the income per capita in residential subsector j; oj denotes the urban–rural population structure; and pj denotes the total permanent population size at the end of the year.
Set the final electricity consumption of the residential sector in the baseline year as E l 2 0 , and the final electricity consumption of the residential sector in year n as E l 2 n , then the change of the final electricity consumption in the residential sector from the baseline year to year n is Δ E l 2 0 n . Δ E l 2 0 n is calculated as follows:
Δ E l 2 0 n = E l 2 n E l 2 0 = j h j n × k j n × l j n × m j n × o j n × p j n j h j 0 × k j 0 × l j 0 × m j 0 × o j 0 × p j 0
then, let:
Δ E l 2 0 n = Δ E l h 0 n + Δ E l k 0 n + Δ E l l 0 n + Δ E l m 0 n + Δ E l o 0 n + Δ E l p 0 n
Δ E l h 0 n = j E l j n E l j 0 l n E l j n l n E l j 0 ln h n h 0
Δ E l k 0 n = j E l j n E l j 0 l n E l j n l n E l j 0 ln k n k 0
Δ E l l 0 n = j E l j n E l j 0 l n E l j n l n E l j 0 ln l n l 0
Δ E l m 0 n = j E l j n E l j 0 l n E l j n l n E l j 0 ln m n m 0
Δ E l o 0 n = j E l j n E l j 0 l n E l j n l n E l j 0 ln o n o 0
Δ E l p 0 n = j E l j n E l j 0 l n E l j n l n E l j 0 ln p n p 0
where Δ E l h 0 n denotes residential electrification level effect (ELE2); Δ E l k 0 n denotes residential energy consumption intensity effect (CEE2); Δ E l l 0 n denotes residential carbon emission intensity effect (CIE2); Δ E l m 0 n denotes residential income per capita effect (RIE2); Δ E l o 0 n denotes urban–rural population structure effect (UPE2); And Δ E l p 0 n denotes permanent population size effect (PSE2). All of the above effect parameters represent cumulative effects from the baseline year to year n.
Δ E l 2 n 1 n , which denotes the year-to-year effect in the residential sector from year n − 1 to year n, is calculated as follows:
Δ E l 2 n 1 n = Δ E l 2 0 n Δ E l 2 0 n 1
See Table 1 for abbreviated names of effects.

3.2. Data Sources

Guangdong Province and Yunnan Province are used as the study area for the empirical study, and the study period is 2005–2021, with 2005 as the baseline year. The major data is extracted from China Energy Statistical Yearbook (2006–2022) [39], Guangdong Statistical Yearbook (2006–2022) [7], and Yunnan Statistical Yearbook (2006–2022) [8]. Energy consumption data by sector and by energy type are taken from the energy balance sheets of the two provinces in the China Energy Statistical Yearbook. Electricity is converted to standard coal by equivalent value (104 tons of standard coal = 1.229 × 10⁴ kWh). Final energy consumption-related carbon emissions data (Table A1 and Table A2) are calculated with reference to the carbon emission factors in [40]. The socio-economic data, such as GDP, residents’ incomes, and the permanent population and employed population at the end of the year, are taken from the Guangdong Statistical Yearbook and the Yunnan Statistical Yearbook, respectively. The current price GDP from 2006 to 2021 is converted at constant 2005 prices to eliminate the influence of price change factors.

4. Results and Discussion

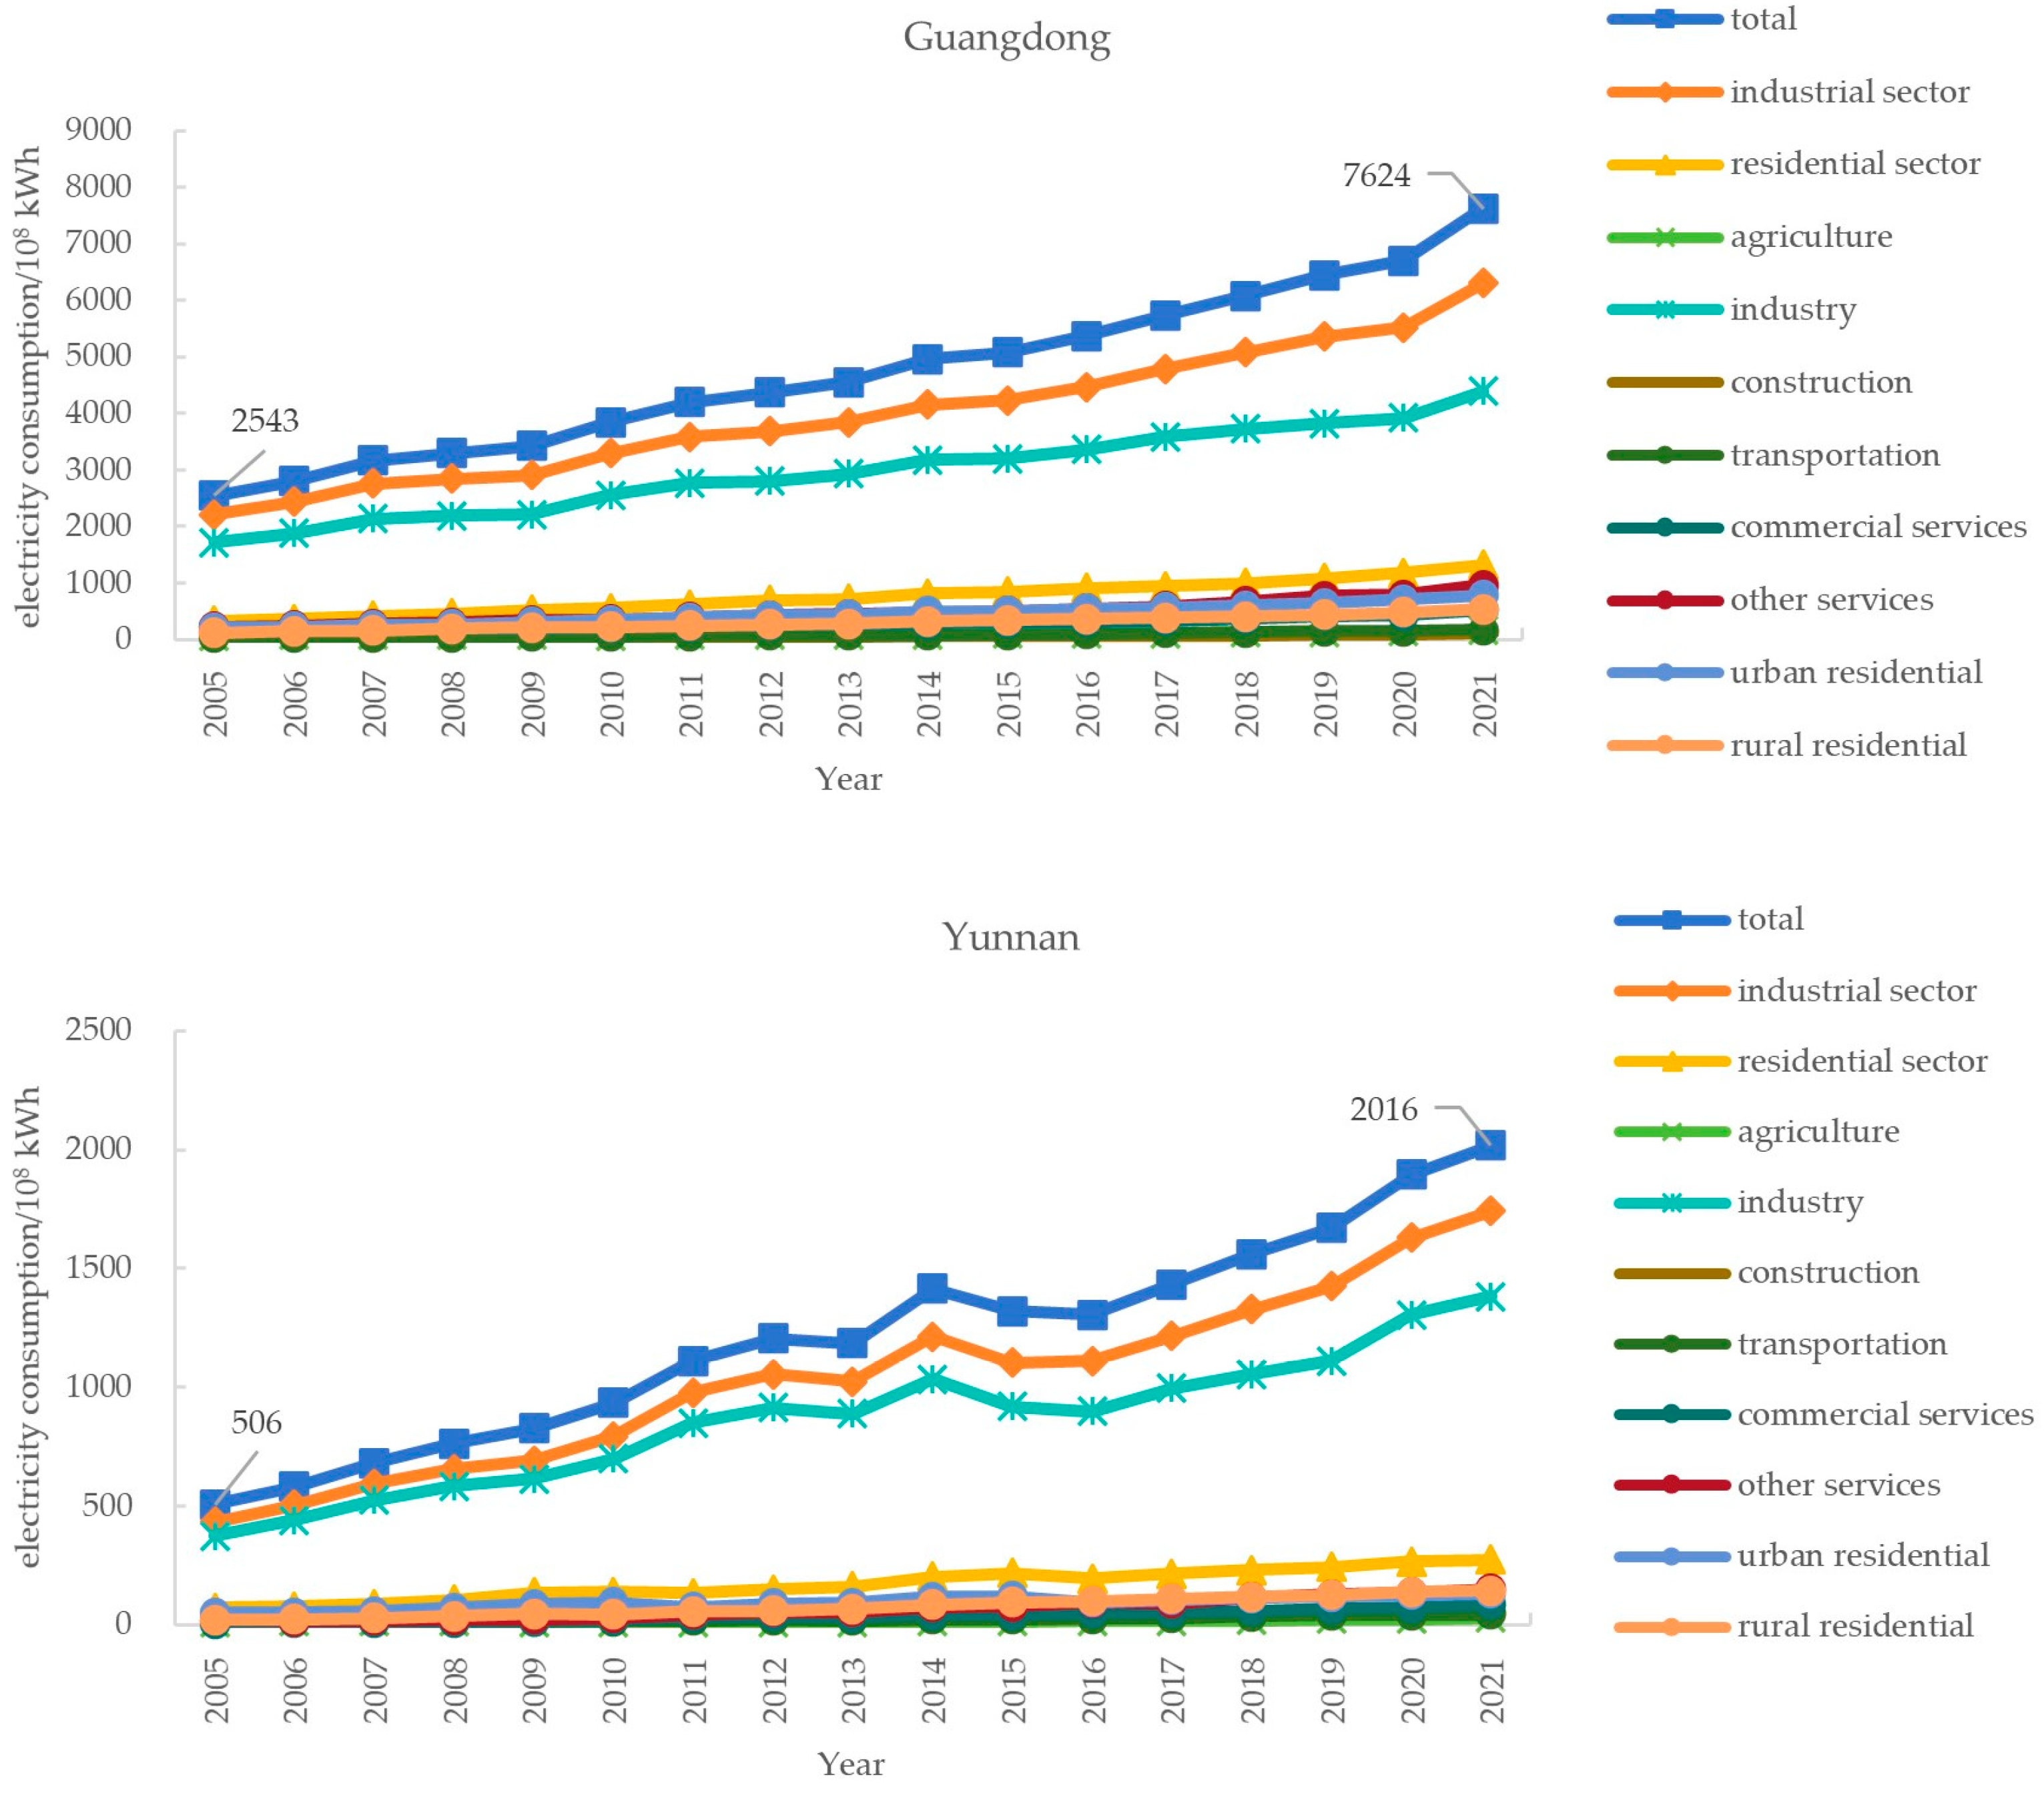
4.1. Historical Trends in Electricity Consumption

As shown in Figure 1, the total final electricity consumption and the electricity consumption by subsector in Guangdong and Yunnan showed growing trends from 2005 to 2021. The total final electricity consumption in Guangdong and Yunnan increased from 2543 × 108 kWh and 506 × 108 kWh in 2005 to 7624 × 108 kWh and 2016 × 108 kWh in 2021, with an average annual growth rate of 7.1% and 9.0%, respectively. The total final energy consumption in Guangdong and Yunnan increased from 10,315 × 104 tce and 4247 × 104 tce in 2005 to 20,100 × 104 tce and 8572 × 104 tce in 2021, with an average annual growth rate of 4.3% and 4.5%, respectively. Therefore, in these two provinces, the electrification level increased from 26.4% and 12.6% in 2005 to 38.6% and 25.0% in 2021, respectively. Although the total final electricity or energy consumption in Yunnan was much lower than that in Guangdong, the growth rate was higher than that in Guangdong.
From a sectoral perspective, the industrial sector accounted for a major share (more than 82%) of total final electricity consumption relative to the residential sector both in Guangdong and Yunnan from 2005 to 2021. From a subsector perspective, the industry accounted for a major share (more than 57%) of total final electricity consumption, but the share went down slowly from 2005 to 2021. The industry electricity consumption in Guangdong and Yunnan increased from 1717 × 108 kWh and 374 × 108 kWh in 2005 to 4391 × 108 kWh and 1381 × 108 kWh in 2021, with an average annual growth rate of 6.0% and 8.5%, respectively. It indicates that growth in industry electricity consumption is the main source of growth in total final electricity consumption. Of course, other subsectors also contributed to the growth in electricity consumption.

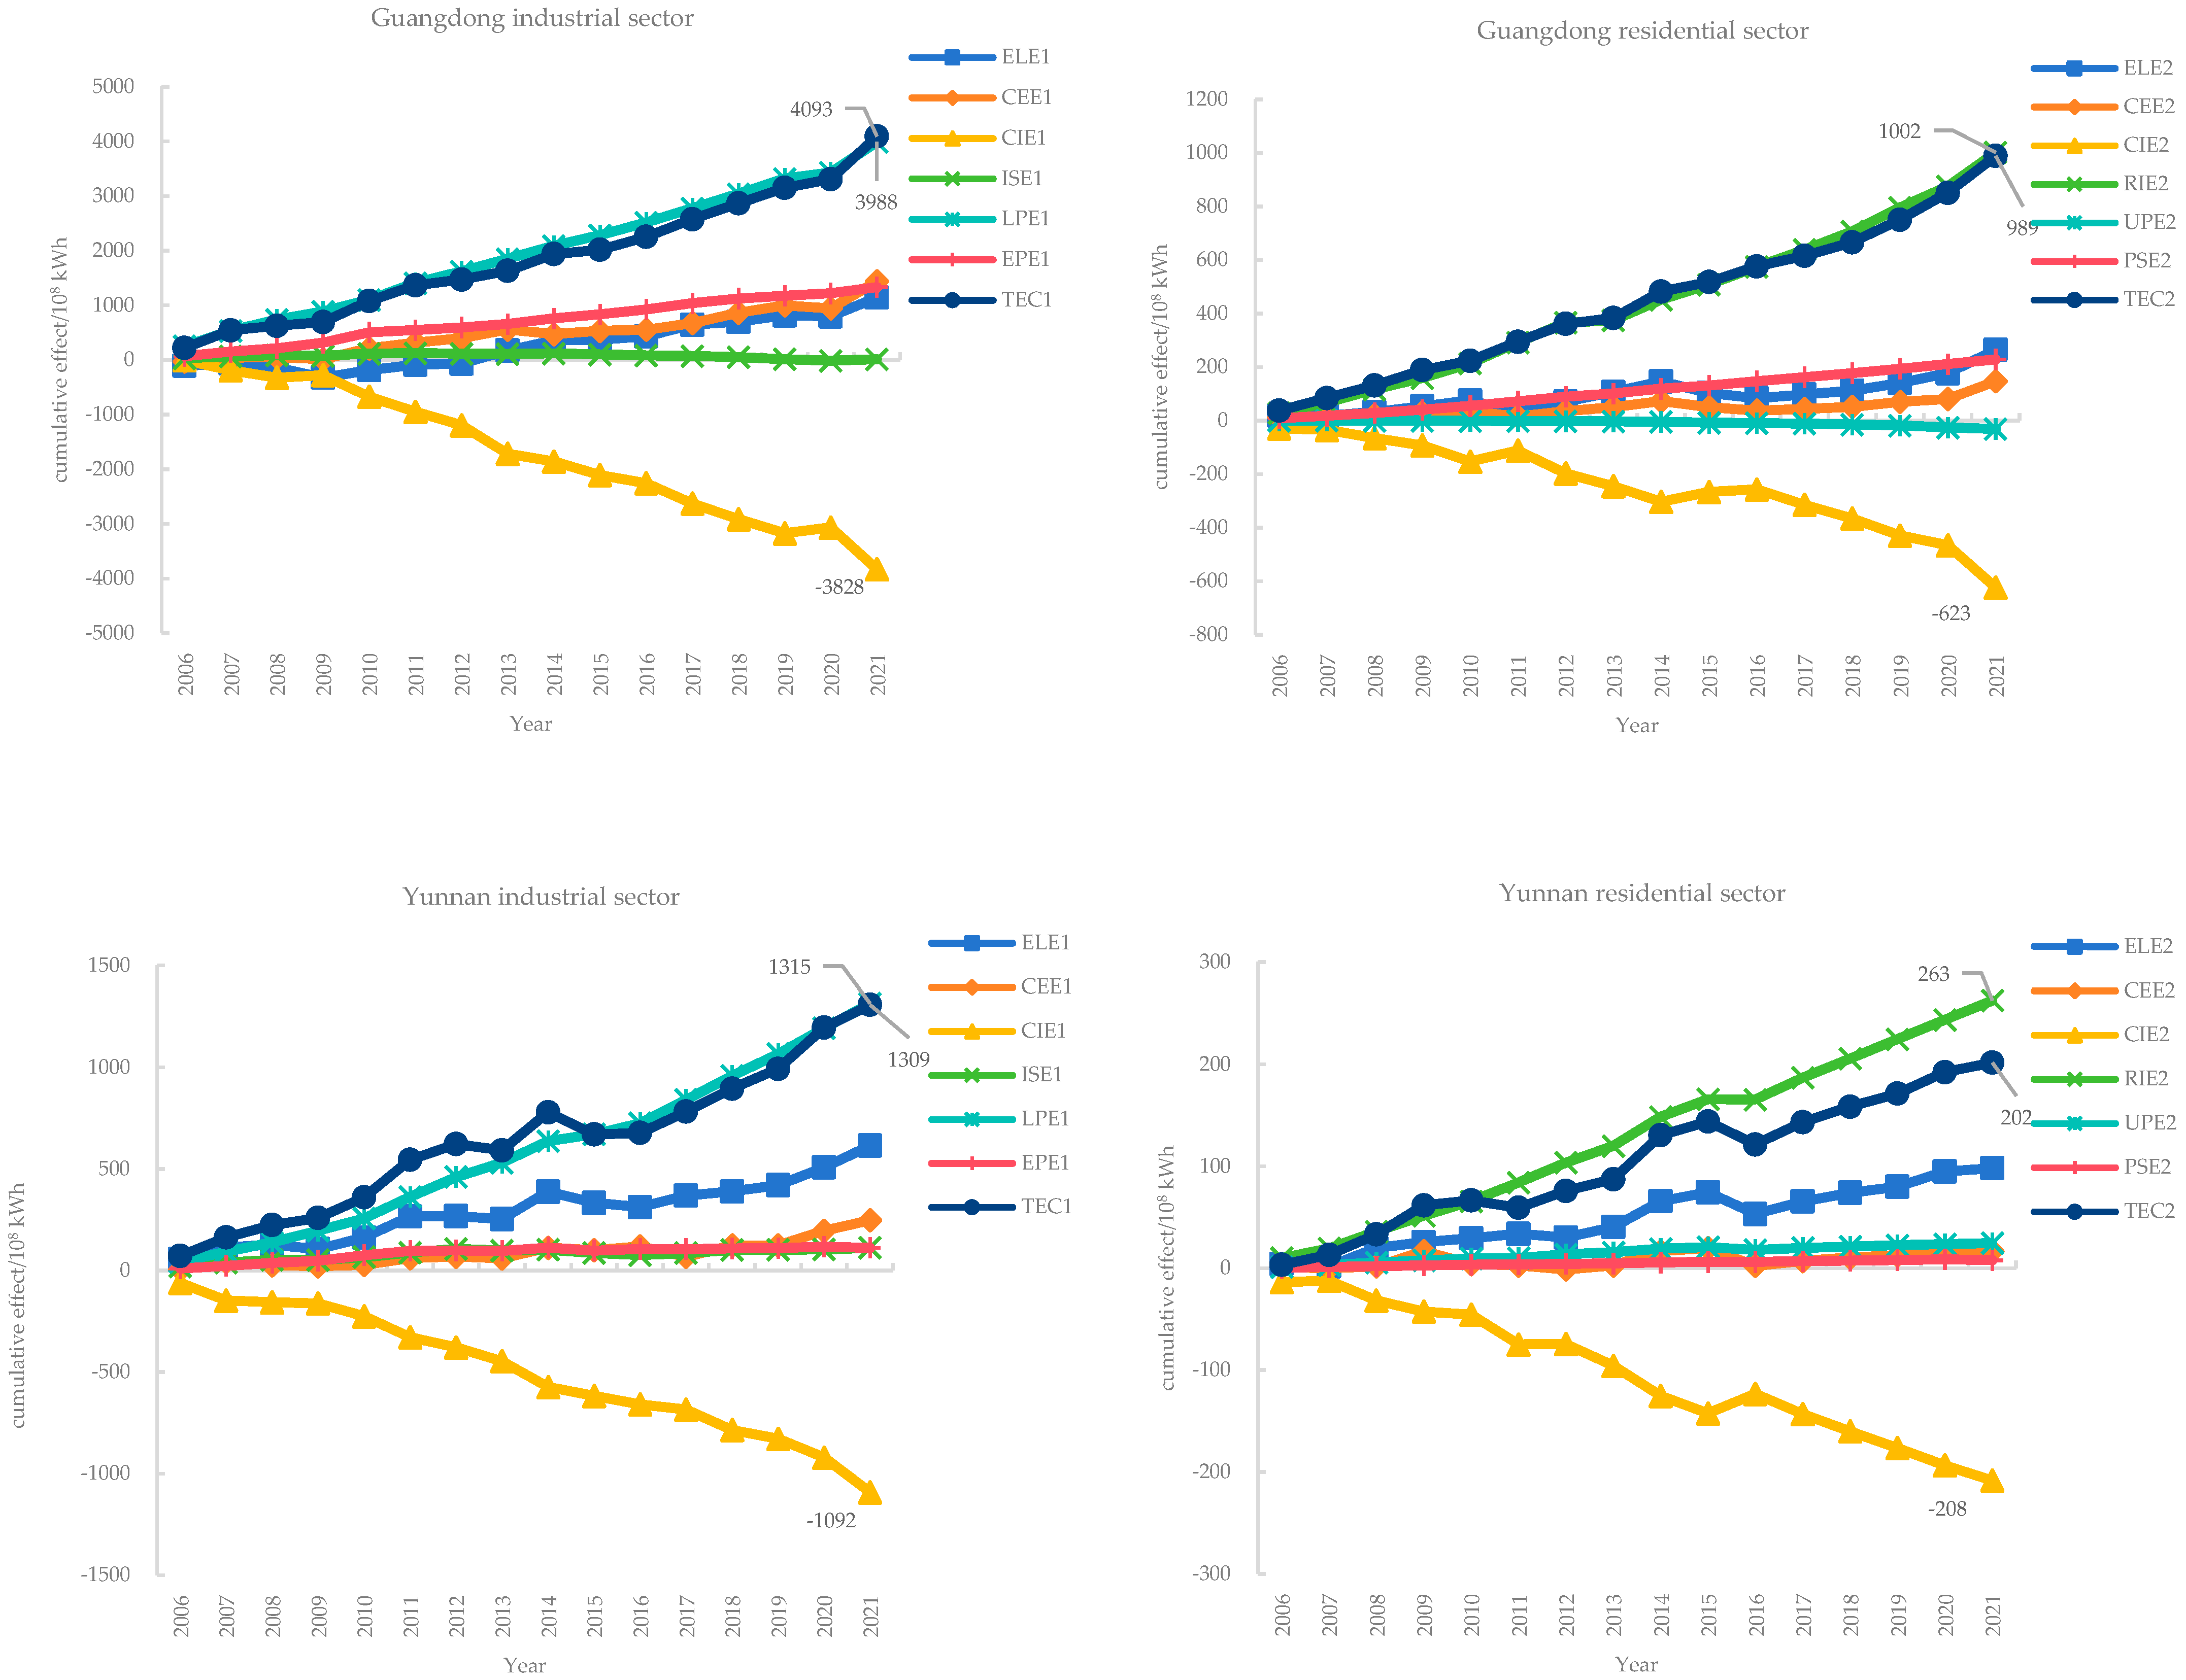
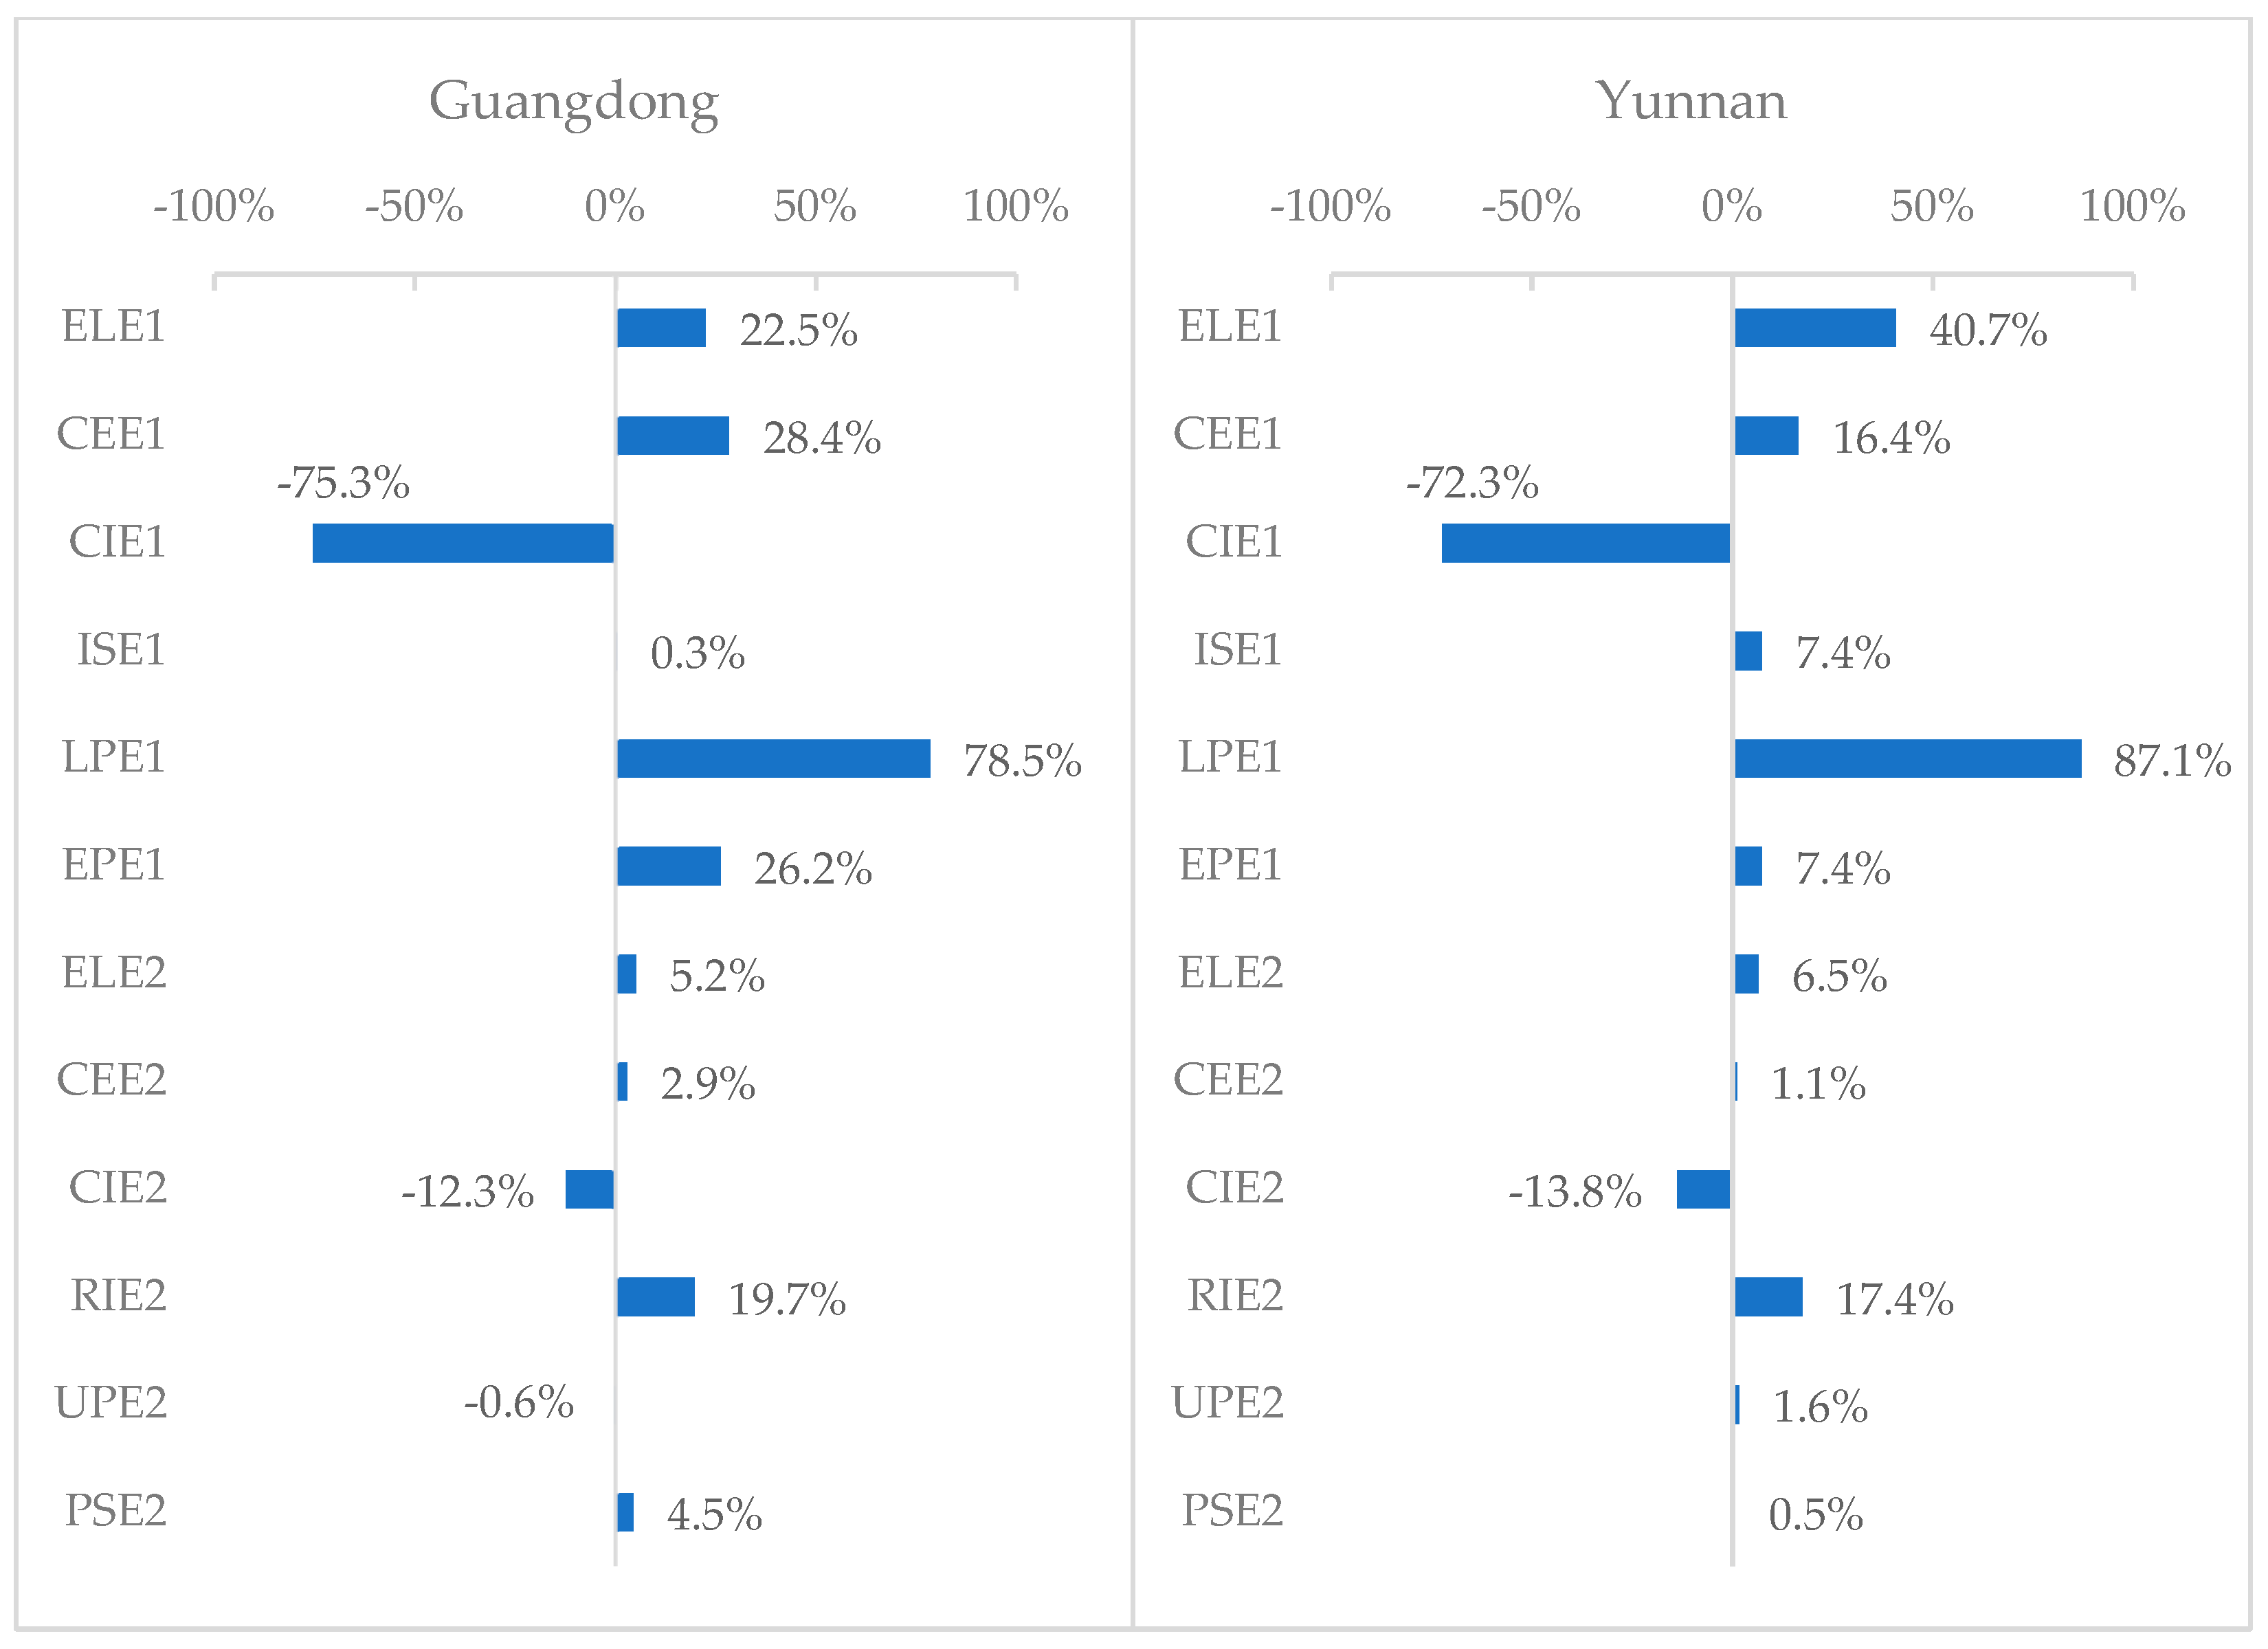
4.2. Cumulative Effects of Drivers

The cumulative effects of each driver on changes in total final electricity consumption are listed in Table 2 and Table 3. From 2005 to 2021, the electricity consumption of industrial and residential sectors in Guangdong increased by 4093 × 108 kWh (TEC1) and 989 × 108 kWh (TEC2), or 1.85 times and 3.01 times, respectively, while in Yunnan increased by 1309 × 108 kWh (TEC1) and 202 × 108 kWh (TEC2), or 3.03 times and 2.74 times, respectively. It indicates that the industrial sector dominated the growth in electricity consumption. The result is similar to that of Lv et al. [2], who explored the influencing factors of electricity consumption in China’s Yangtze River Delta region. In addition, although the growth rate of electricity consumption in Yunnan’s industrial sector is much higher than that in Guangdong, the amount of growth is much lower. The reason is that in the base year of 2005, Guangdong’s industrial electricity consumption was 2214 × 108 kWh, while Yunnan’s was 432 × 108 kWh, with a significant gap between the two provinces.
Both in Guangdong and Yunnan, LPE1, CEE1, EPE1, and ELE1 show a positive growth trend during the 2005–2021 period. As shown in Figure 2 and Figure 3, LPE1 gave the largest positive contribution to the increase in industrial electricity consumption, with 3988 × 108 kWh (contribution rate of 78.5%, the same as below) in Guangdong and 1315 × 108 kWh (87.1%) in Yunnan. The finding is similar to that of Fang et al. [31], who analyzed the impact of the drivers on total electricity consumption in China’s Key Economic Regions. In contrast, CIE1 gave the largest negative contribution to the increase in industrial electricity consumption, with −3828 × 108 kWh (−75.3%) in Guangdong and −1092 × 108 kWh (−72.3%) in Yunnan. ISE1 in Guangdong shows an increasing trend during 2005–2011 and a decreasing trend during 2011–2020, then a slight increase during 2020–2021, while ISE1 in Yunnan shows an increasing trend during 2005–2021. It reflects the differences in the industrial structure adjustment between Guangdong and Yunnan. During the period of 2005–2021, RIE2, ELE2, CEE2, and PSE2 had an overall increase effect on residential electricity consumption, respectively, of which RIE2 gave the largest positive contribution to the increase in residential electricity consumption, with 1002 × 108 kWh (19.7%) in Guangdong and 263 ×108 kWh (17.4%) in Yunnan. In contrast, CIE2 contributed the largest negative to the increase in residential electricity consumption, with −623 × 108 kWh (−12.3%) in Guangdong and −208 × 108 kWh (−13.8%) in Yunnan. It is worth noting that UPE2 had a negative contribution of −30.7 × 10⁸ kWh (−0.6%) in Guangdong and a positive contribution of 24.7 × 10⁸ kWh (1.6%) in Yunnan. It reflects the differences in the changes in urban–rural population structure between these two provinces. Permanent population size is a factor influencing the increase in electricity consumption, although its impact is weak. This result is consistent with Zhang et al. [36].

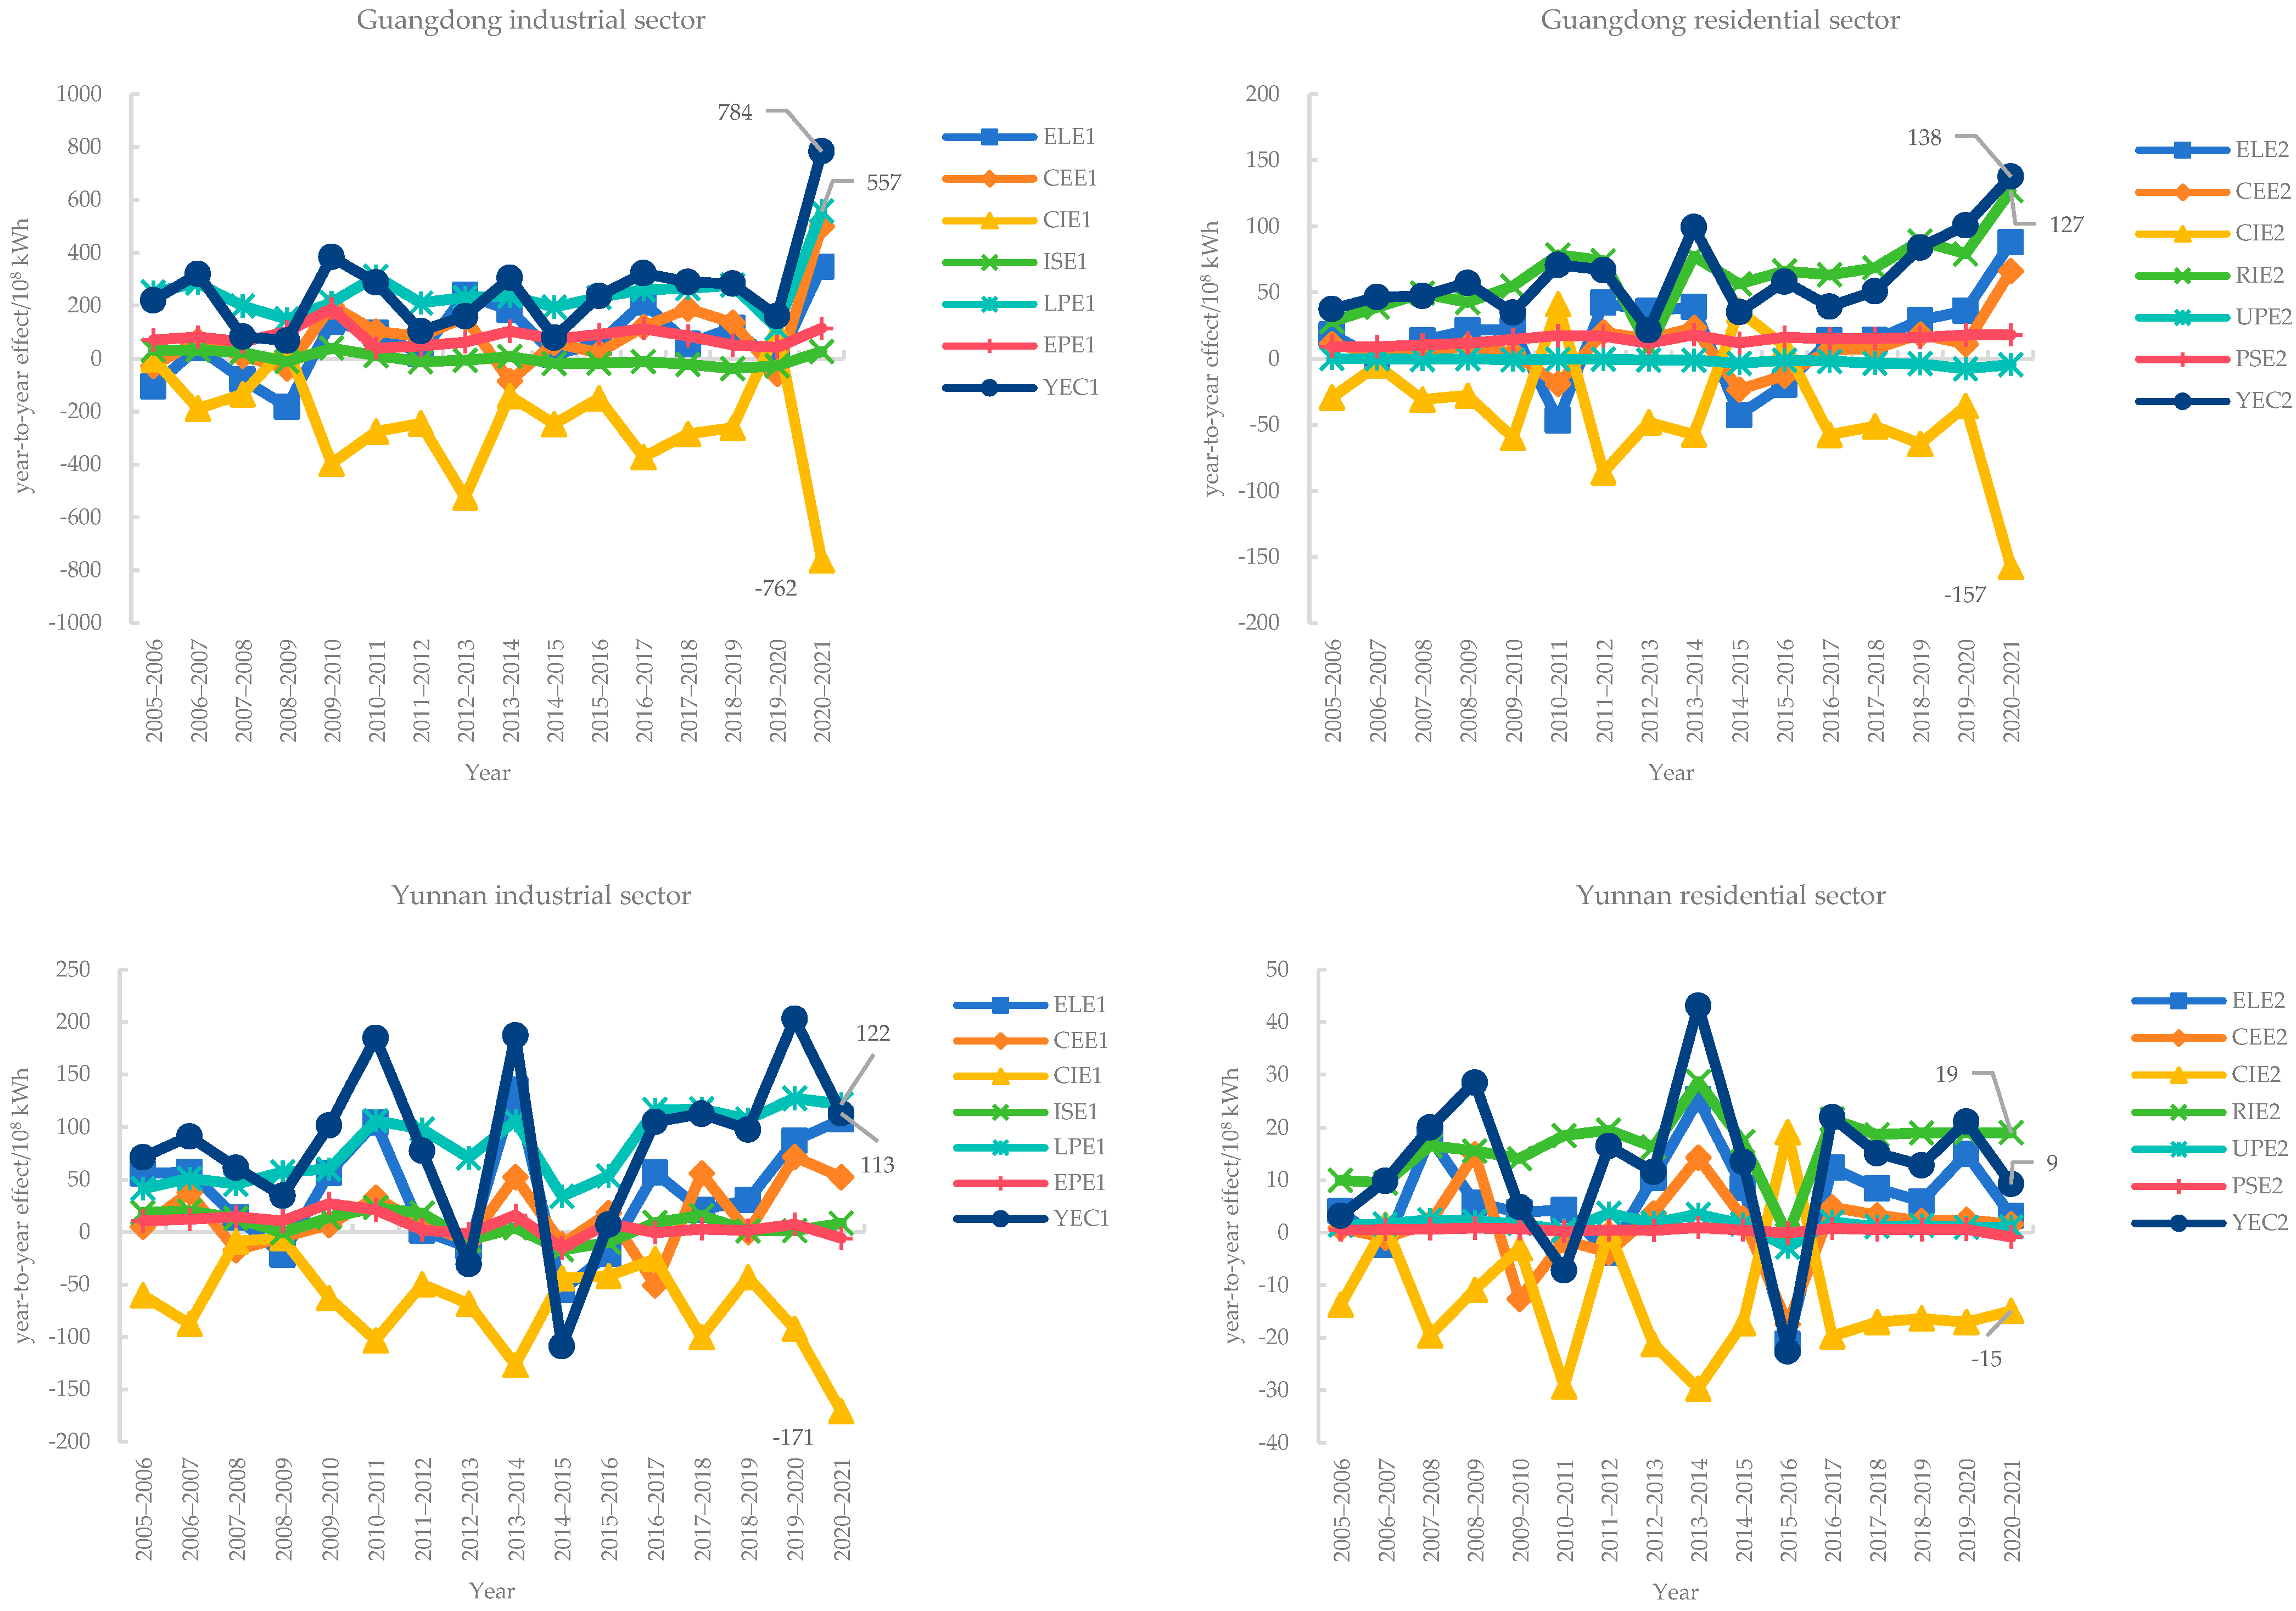
4.3. Year-to-Year Effects of Drivers

The year-to-year effects of each driver on changes in total final electricity consumption are listed in Table A3 and Table A4. As shown in Figure 4, during the period of 2005–2021, the year-to-year effects of each driver fluctuated up and down both in Guangdong and Yunnan. The maximum value of the year-to-year effect in the industrial sector (YEC1) was 784 × 108 kWh in 2020–2021 (Guangdong) and 203 × 108 kWh in 2019–2020 (Yunnan), respectively. The year-to-year LPE1 in Guangdong and Yunnan were all positive, with the maximum value of 557 × 108 kWh in 2020–2021 (Guangdong) and 127 × 108 kWh in 2019–2020 (Yunnan), respectively. The year-to-year CIE1 were all negative values in Yunnan, with the largest negative contribution of −171 × 108 kWh in 2020–2021. In comparison, the year-to-year CIE1 were mostly negative values in Guangdong, with the largest negative contribution of −762 × 108 kWh in 2020–2021. The year-to-year effects of other drivers in the industrial sector were positive or negative in different years in these two provinces.
During the period of 2005–2021, the maximum value of year-to-year effect in the residential sector (YEC2) was 138 × 108 kWh in 2020–2021 (Guangdong) and 43 × 108 kWh in 2013–2014 (Yunnan), respectively. The year-to-year RIE2 were all positive, with the maximum value of 127 × 108 kWh in 2019–2020 (Guangdong) and 28.7 × 10⁸ kWh in 2013–2014 (Yunnan), respectively. The year-to-year PSE2 were all positive in Guangdong but mostly positive values, with two negative values in Yunnan (in 2015–2016 and in 2020–2021). The year-to-year CIE2 was mostly negative in these two provinces, with the largest negative contribution of −157 × 108 kWh in 2020–2021(Guangdong) and −29.7 × 10⁸ kWh in 2013–2014(Yunnan), respectively. The year-to-year effects of other drivers in the residential sector are positive or negative in different years in these two provinces.

4.4. Decomposition Analysis of Drivers by Subsector

In order to explore the impact of each driver on electricity consumption, a detailed description and decomposition analysis of drivers by subsector is given as follows.

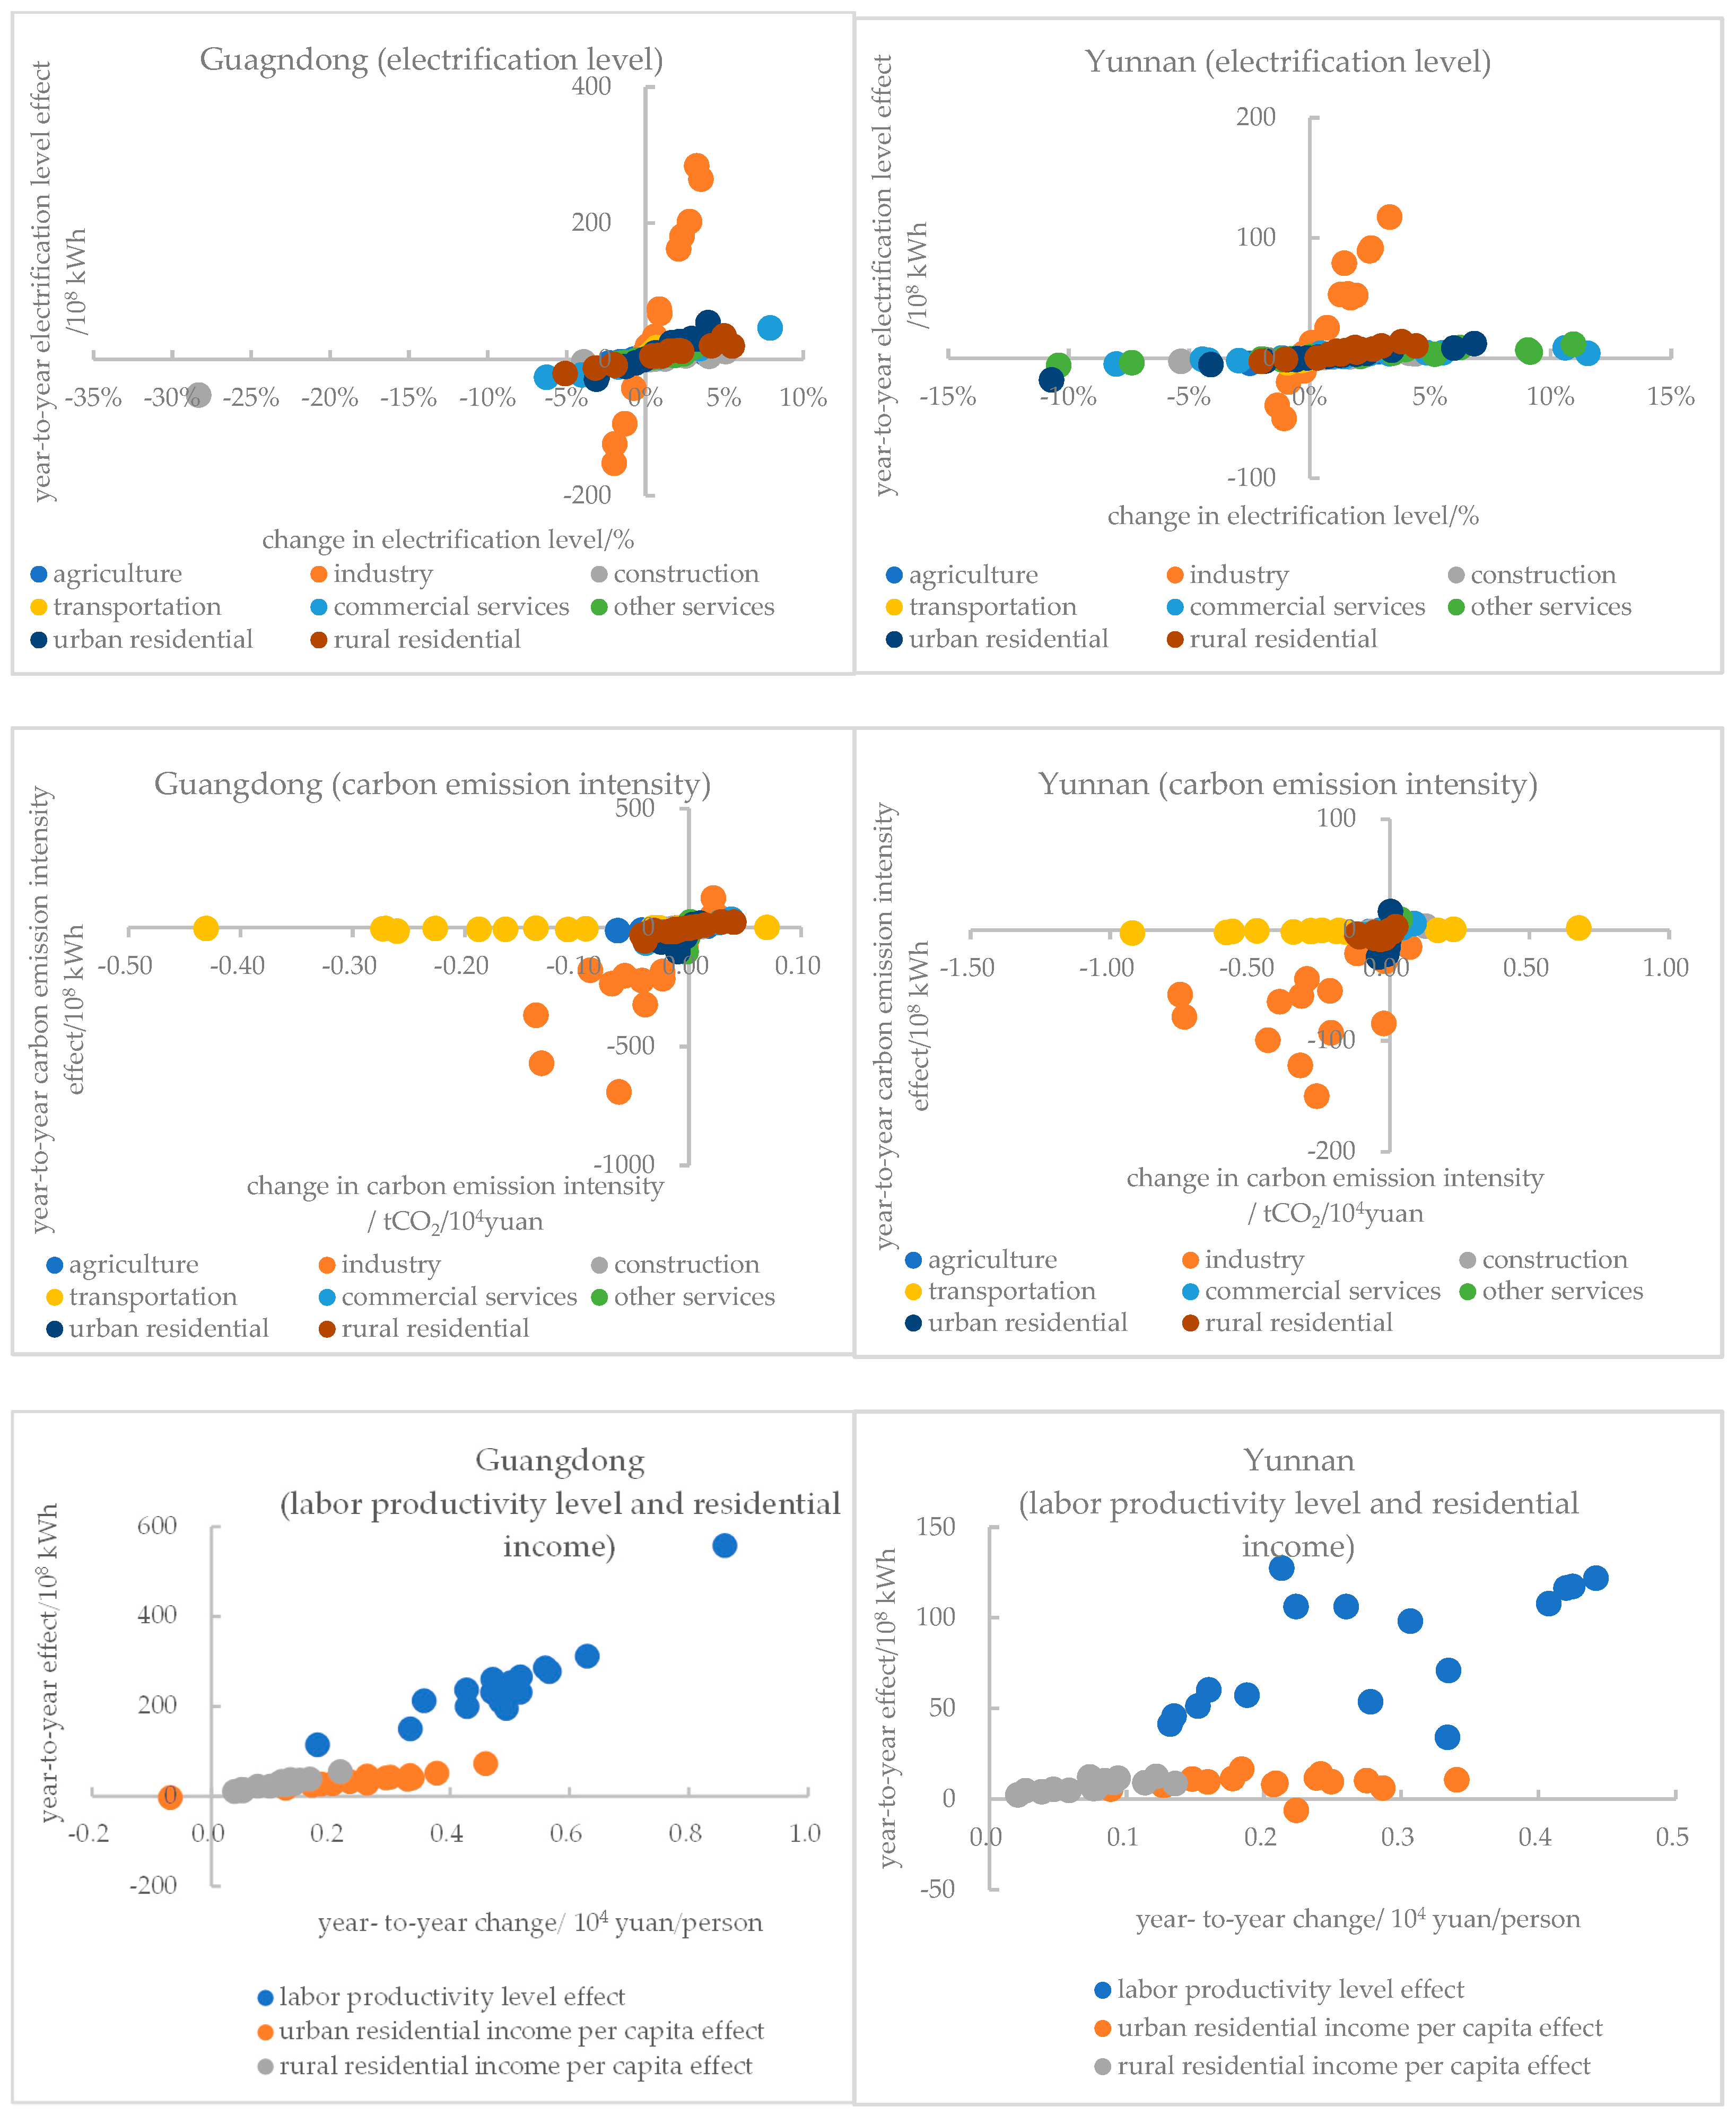
4.4.1. Relationship between Driver Changes and Corresponding Effects

Scatterplots are obtained based on the year-to-year changes in each driver and the corresponding year-to-year effects. It is found that each of the year-to-year effects by subsector is overall positively correlated with the year-to-year change in corresponding drivers both in Guangdong and Yunnan from 2005 to 2021. Consequently, the increase in one driver promotes electricity consumption, and the decrease in one driver inhibits electricity consumption. Figure 5 presents scatterplots for the four drivers: electrification level, carbon emission intensity, labor productivity level, and residential income per capita.

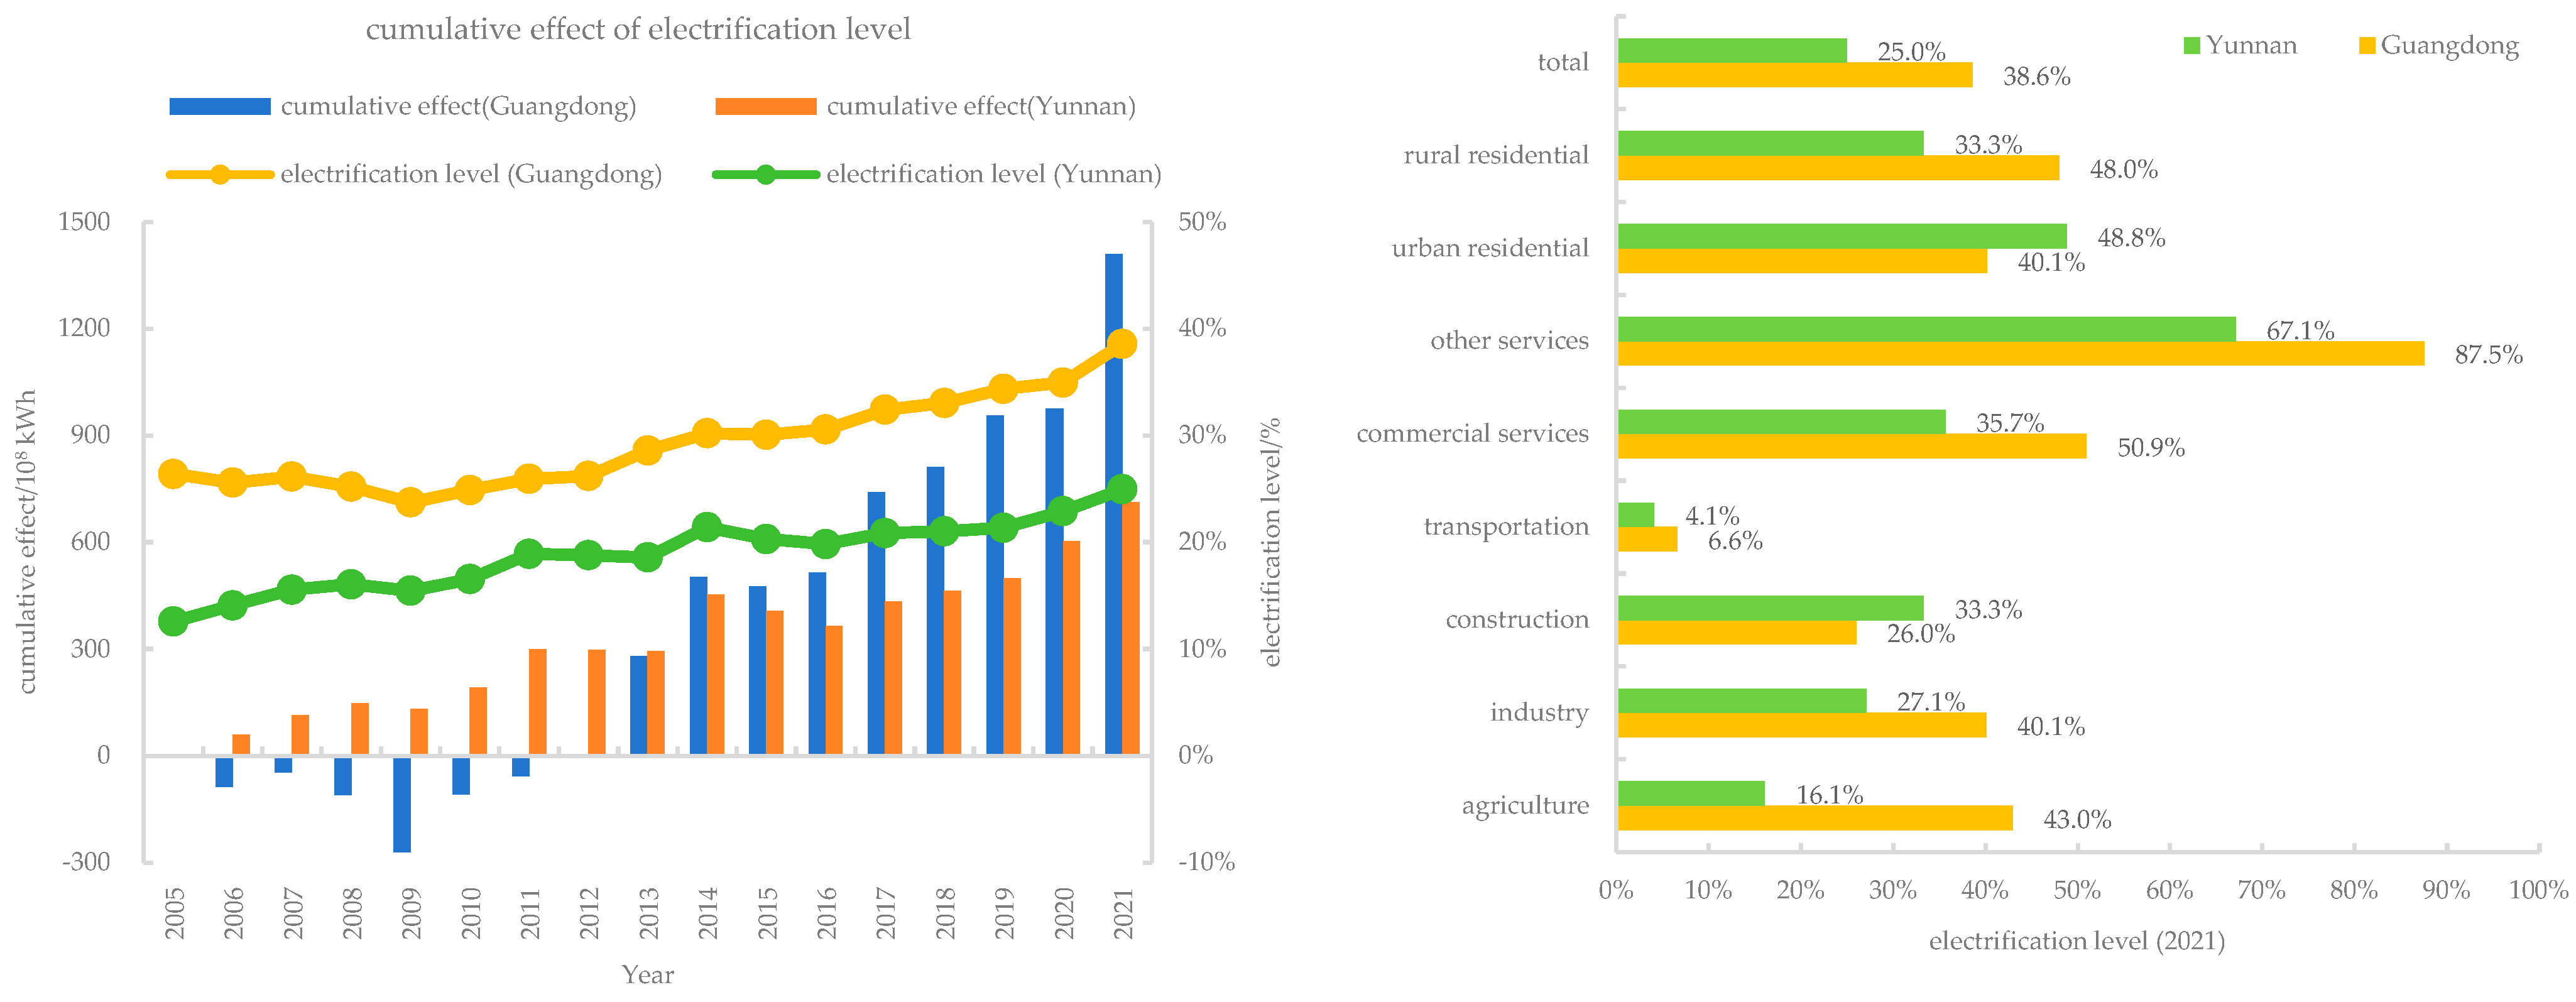
4.4.2. Electrification Level Effect

Table 4 lists the cumulative effects of each driver by subsector from 2005 to 2021. The top three subsectors in terms of cumulative electrification level effect were industry (914 × 108 kWh, 64.9%), urban residential (174 × 108 kWh, 12.3%), transportation (93 × 108 kWh, 6.6%) in Guangdong, and industry (508 × 108 kWh, 71.3%), rural residential (88 × 108 kWh, 12.3%), and other services (37 × 108 kWh, 5.3%) in Yunnan. As shown in Figure 6, the trends of electrification levels fluctuated upwards in both Guangdong and Yunnan during 2005–2021. The cumulative electrification level effect increased with increasing electrification level and decreased with decreasing electrification level. The overall electrification level in Guangdong increased from 26.4% to 38.6%, while Yunnan increased from 12.6% to 25.0%. There is a large gap in the overall electrification level, but the electrification level varies in different subsectors in the two provinces. Compared to Guangdong, there is more room for improvement in electrification levels in all subsectors except the construction and urban residential subsectors. The electrification level of transportation in both provinces is low, which also means that there is great potential for growth in electricity consumption.

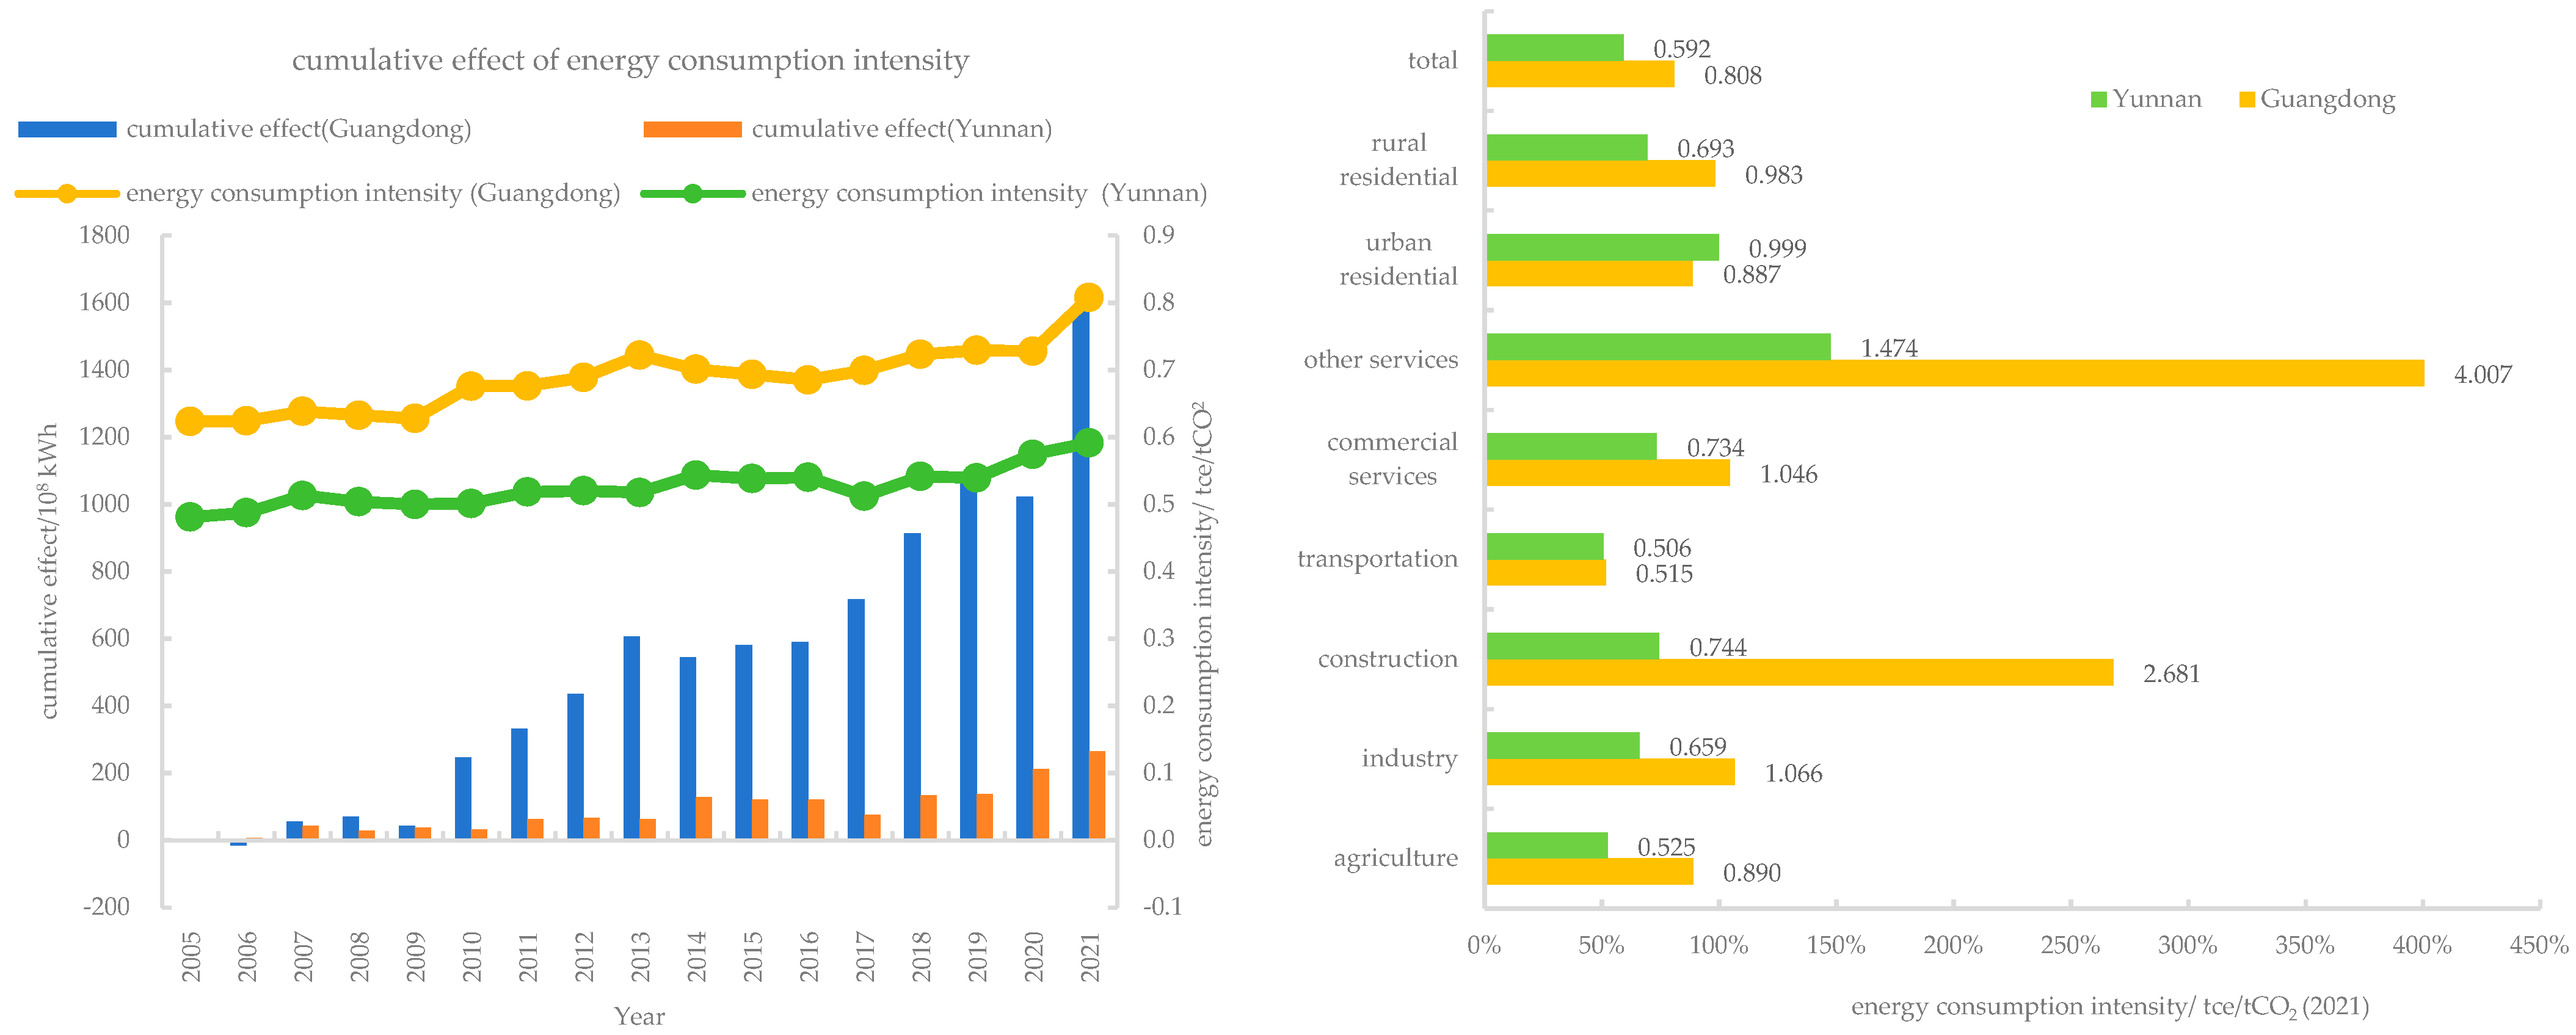
4.4.3. Energy Consumption Intensity Effect

What needs to be clarified is that energy consumption intensity denotes the average final energy consumption per unit of carbon emissions in this study. In Table 4, it is worth noting that the cumulative energy consumption intensity effect in Yunnan’s agriculture sector was −3.3 × 10⁸ kWh due to the decrease in energy consumption intensity during this period. The top three subsectors in terms of cumulative energy consumption intensity effect were industry (987 × 108 kWh, 62.1%), other services (271 × 108 kWh, 17.0%), urban residential (88 × 108 kWh, 5.6%) in Guangdong, and industry (195 × 108 kWh, 73.6%), other services (43 × 108 kWh, 17.0%), urban residential (10 × 108 kWh, 4.0%) in Yunnan. As shown in Figure 7, during 2005–2021, energy consumption intensity fluctuated upwards both in Guangdong and Yunnan, and the corresponding effects changed in the same direction as energy consumption intensity. Guangdong’s energy consumption intensity rose from 0.623 tce/tCO2 to 0.808 tce/tCO2, while Yunnan’s rose from 0.481 tce/tCO2 to 0.592 tce/tCO2. In this study, higher energy consumption intensity indicates higher decarbonization of energy consumption. Compared to Guangdong, Yunnan’s energy decarbonization has some room for improvement to increase electricity consumption in the agriculture industry, construction, and other services. The energy consumption intensity of transportation in both provinces is low, so transportation is a key sector for the low-carbon transformation of energy.

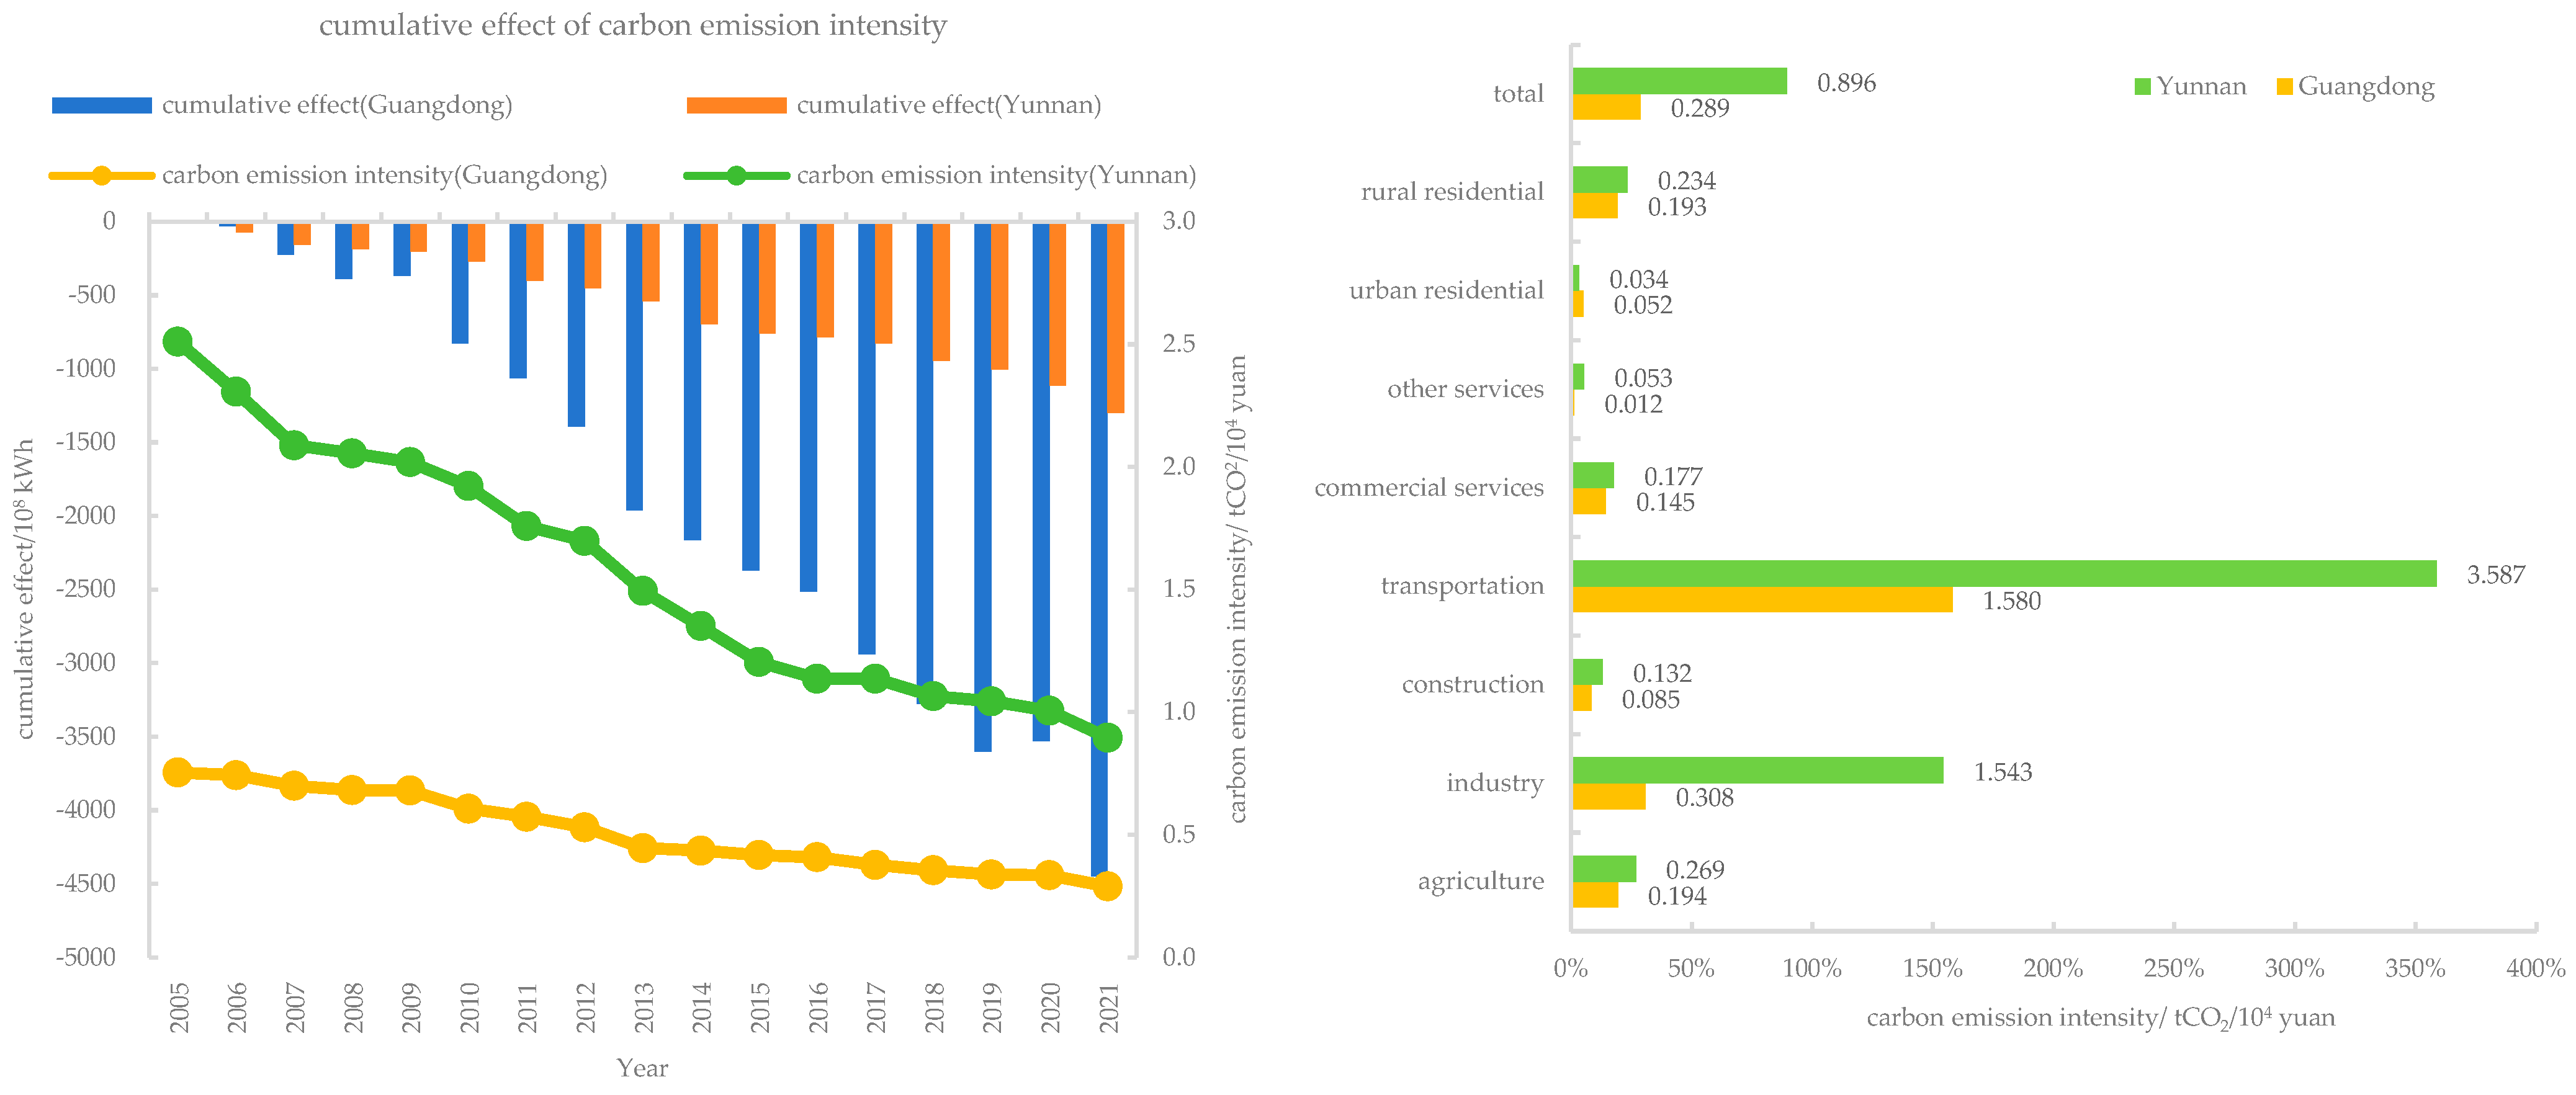
4.4.4. Carbon Emission Intensity Effect

The top three subsectors in terms of cumulative carbon emission intensity effect were industry (−3181 × 108 kWh, 71.5%), urban residential (−489 × 108 kWh, 11.0%), other services (−326 × 108 kWh, 7.3%) in Guangdong, and industry (−995 × 108 kWh, 76.5%), urban residential (−135 × 108 kWh, 11.0%), rural residential (−74 × 108 kWh, 5.7%) in Yunnan (Table 4). From 2005 to 2021, the cumulative carbon emission intensity effect in Guangdong and Yunnan decreased with the decrease of carbon emission intensity (Figure 8). The total cumulative contribution of carbon emission intensity to final electricity consumption in Guangdong and Yunnan was from −30 × 108 kWh and −74 × 108 kWh in 2006 to −4452 × 108 kWh and −1300 × 108 kWh in 2021, respectively. Guangdong’s carbon emission intensity declined from 0.753 tCO2/104 yuan to 0.289 tCO2/104 yuan, while Yunnan’s declined from 2.510 tCO2/104 yuan to 0.896 tCO2/104 yuan. Compared to Guangdong, Yunnan’s carbon emission intensity has a lot of room to decline in industry and transportation, implying that it has a great potential to reduce electricity consumption.

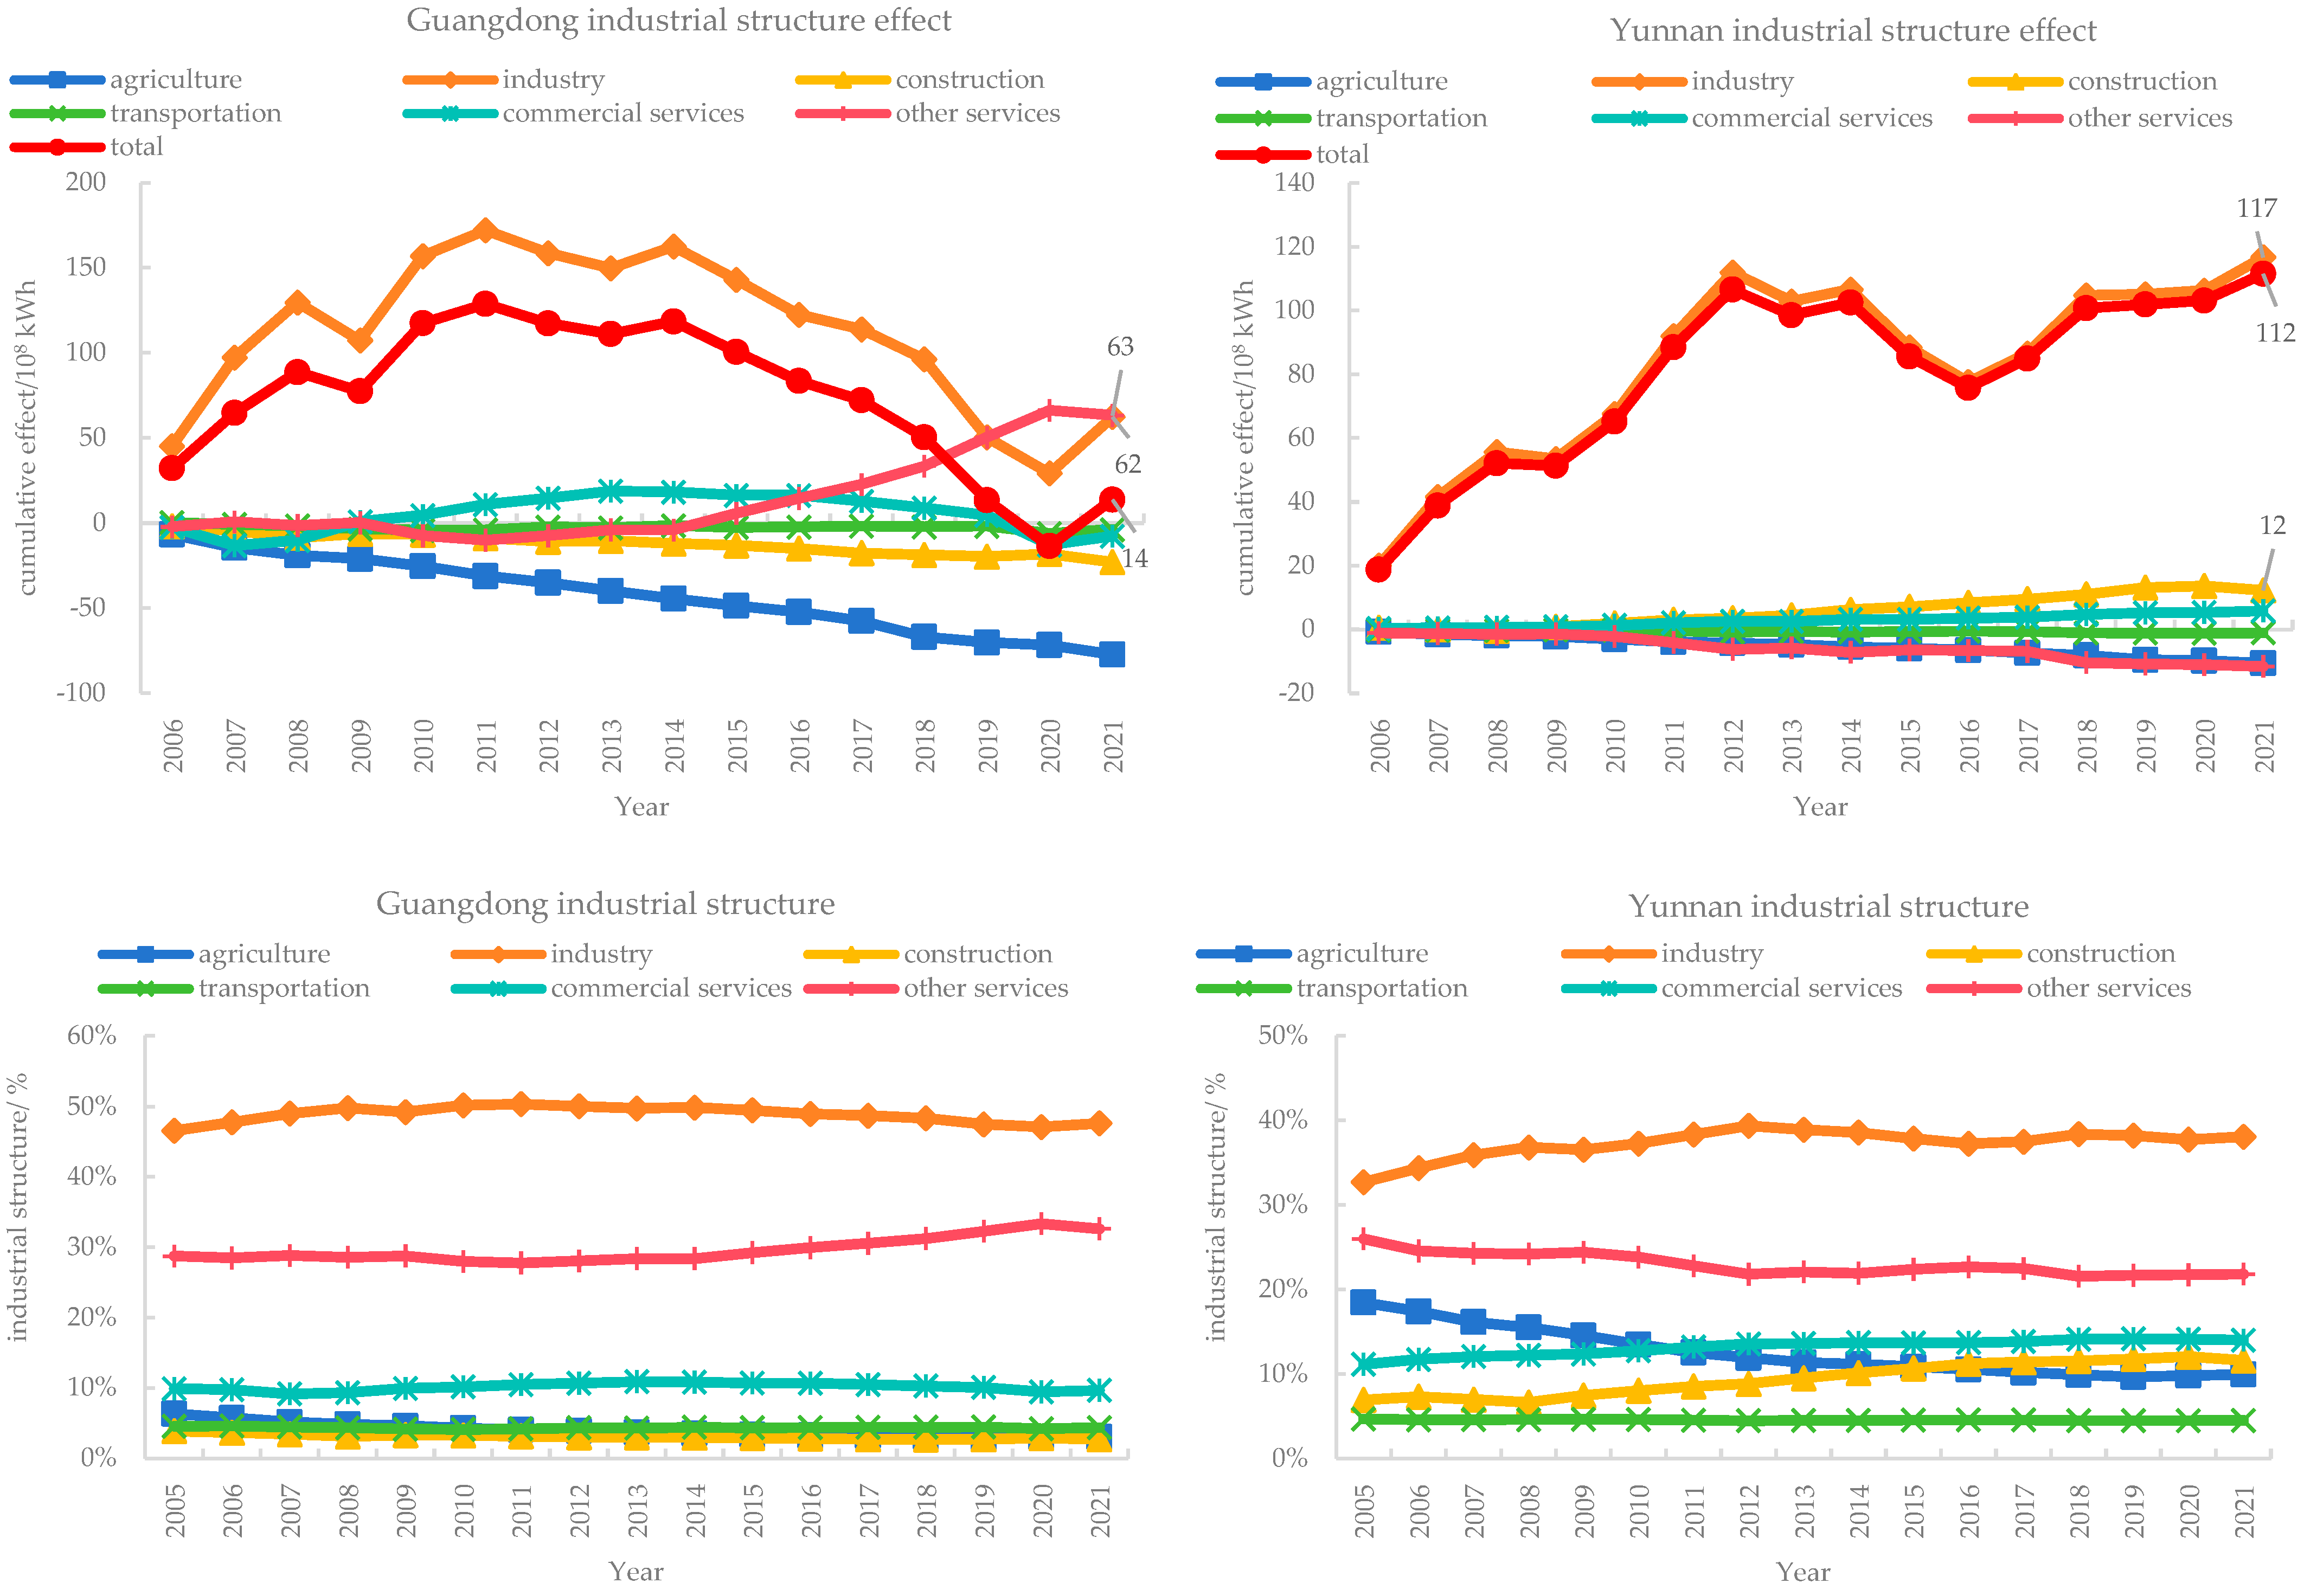
4.4.5. Industrial Structure Effect

Changes in the share of value added of industrial subsectors reflect changes in industrial structure. As shown in Figure 9, during the period of 2005–2021, the industrial structure effect of each industrial subsector varied in the same direction with the change in value-added share. Both in Guangdong and Yunnan, the change in the value-added share of the industry subsector had the most obvious impact on the total industrial structure effect. The cumulative industrial structure effects of industry were 62 × 108 kWh in Guangdong and 117 × 108 kWh in Yunnan. The decrease in value-added share of agriculture led to a negative cumulative effect (−77 × 108 kWh in Guangdong and −11 × 108 kWh in Yunnan). In addition, the increase in value-added share of other services in Guangdong increased electricity consumption by 63 × 108 kWh, while the decrease in Yunnan decreased electricity consumption by −12 × 108 kWh.

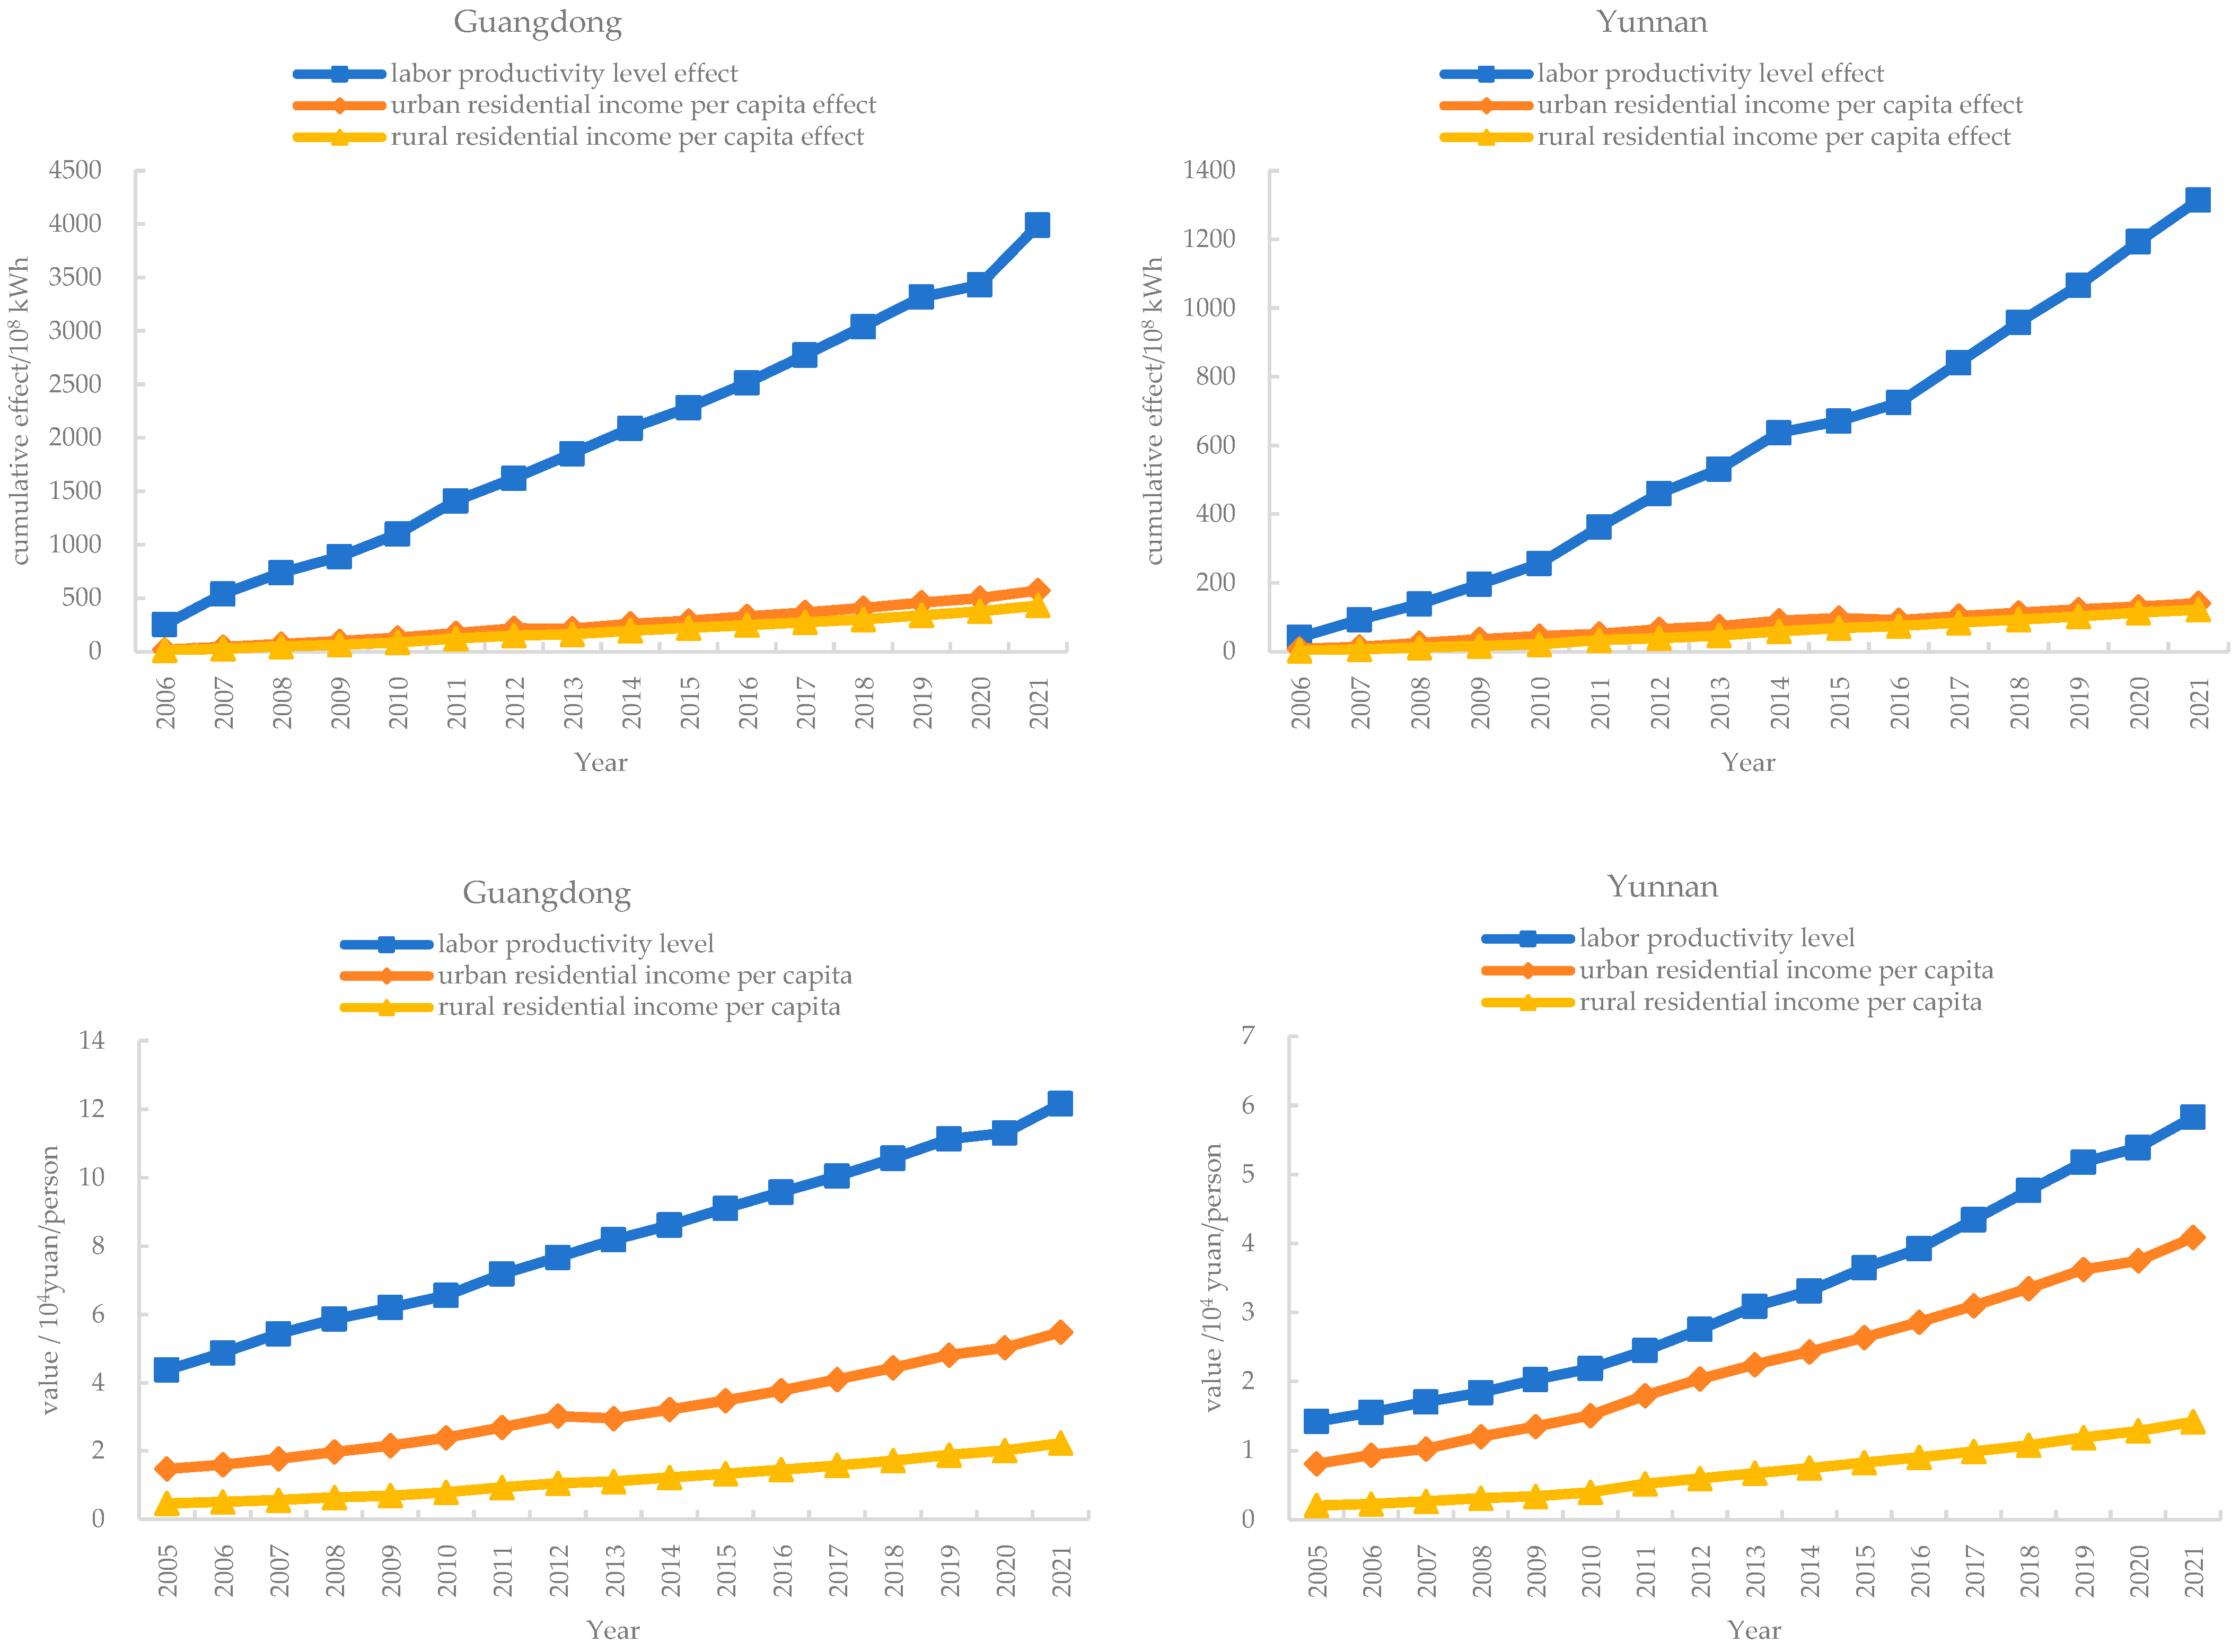
4.4.6. Labor Productivity Level Effect and Residential Income Per Capita Effect

As shown in Figure 10, during 2005–2021, labor productivity level, urban residential income per capita, and rural residential income per capita in Guangdong and Yunnan increased year by year, resulting in the corresponding cumulative effects overall year by year. The cumulative labor productivity level effects in Guangdong and Yunnan were 3988 × 108 kWh and 1315 × 108 kWh, respectively. That was due to the fact that the labor productivity level in Guangdong and Yunnan increased from 4.37 × 10⁴ yuan/person and 1.42 × 10⁴ yuan/person in 2005 to 12.17 × 10⁴ yuan/person and 5.82 × 10⁴ yuan/person in 2021, respectively. Labor productivity level not only represents the economic output per laborer but also reflects technological progress to a certain extent. The increase in labor productivity level was the primary driver for the growth of electricity consumption in Guangdong and Yunnan during the 2005–2021 period. In addition, Yunnan’s labor productivity level is much lower than Guangdong’s, and as it grows, it will contribute significantly to the growth of Yunnan’s electricity consumption.
Residential income per capita is an important indicator representing the living standard of residents, and the larger it is, the higher the living standard of residents. As shown in Figure 10, during the period of 2005–2021, the cumulative urban residential income per capita effect and rural residential income per capita effect in Guangdong were 572 × 108 kWh and 430 × 108 kWh, respectively, and that in Yunnan were 141 × 108 kWh and 122 × 108 kWh, respectively. The per capita income of urban and rural residents in Yunnan is slightly lower than that in Guangdong, but both have increased significantly from 2005 to 2021, playing a positive role in increasing residential electricity consumption. With the future economy’s expected growth, the per capita income of urban and rural residents will increase, contributing to an increase in residential electricity consumption.

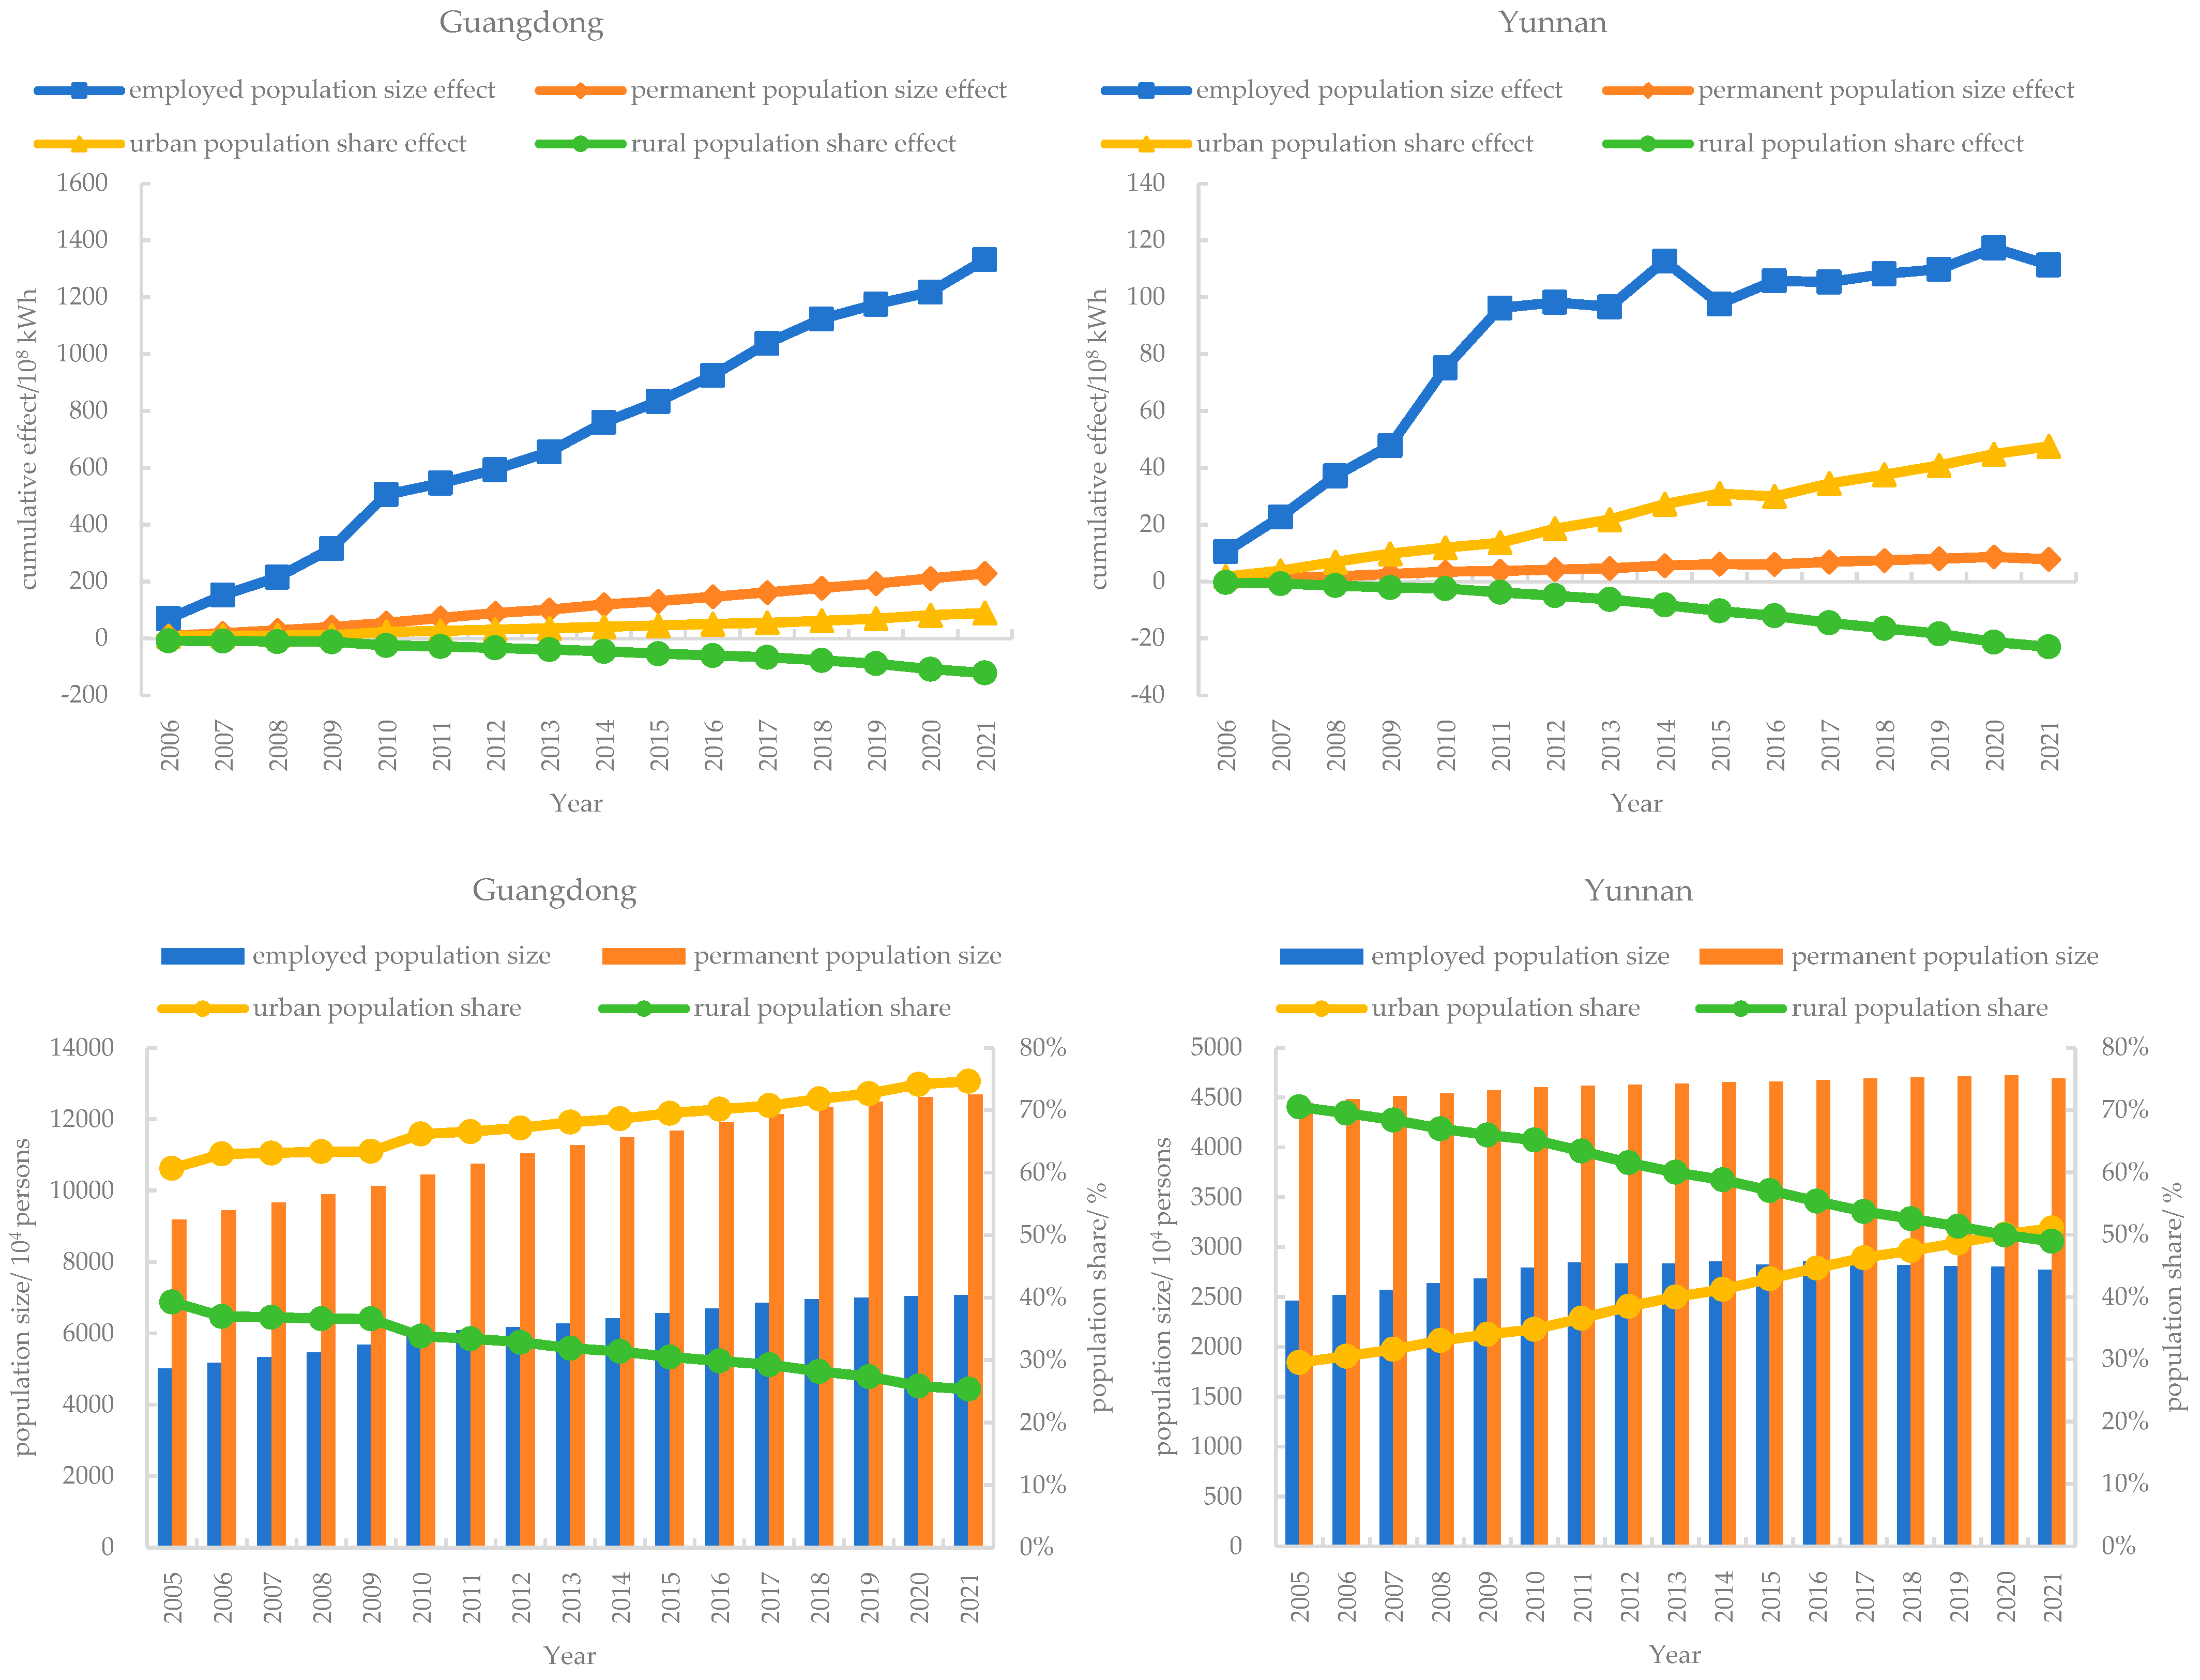
4.4.7. Population-Related Effects

As shown in Figure 11, during the period of 2005–2021, Growth in the employed population size and the permanent population size increased electricity consumption. Guangdong’s cumulative employment-population size effect was 1333 × 108 kWh, much larger than Yunnan’s 111 × 108 kWh. Similarly, Guangdong’s cumulative permanent population size effect was 229 × 108 kWh, much larger than Yunnan’s 8 × 10⁸ kWh. This is mainly attributable to the faster growth of Guangdong’s employed and permanent population. As population growth slows or even declines across China and as employment decreases due to the aging population, this will lead to a reduction in electricity consumption.
With continued urbanization, the urban population share increased and promoted electricity consumption, while the rural population share decreased and inhibited electricity consumption. Nevertheless, during 2005–2021, Guangdong’s cumulative urban–rural population structure effect was negative (−31 × 108 kWh), while Yunnan’s was positive (25 × 108 kWh). This is due to the large difference in the urbanization process between Guangdong and Yunnan during the period.

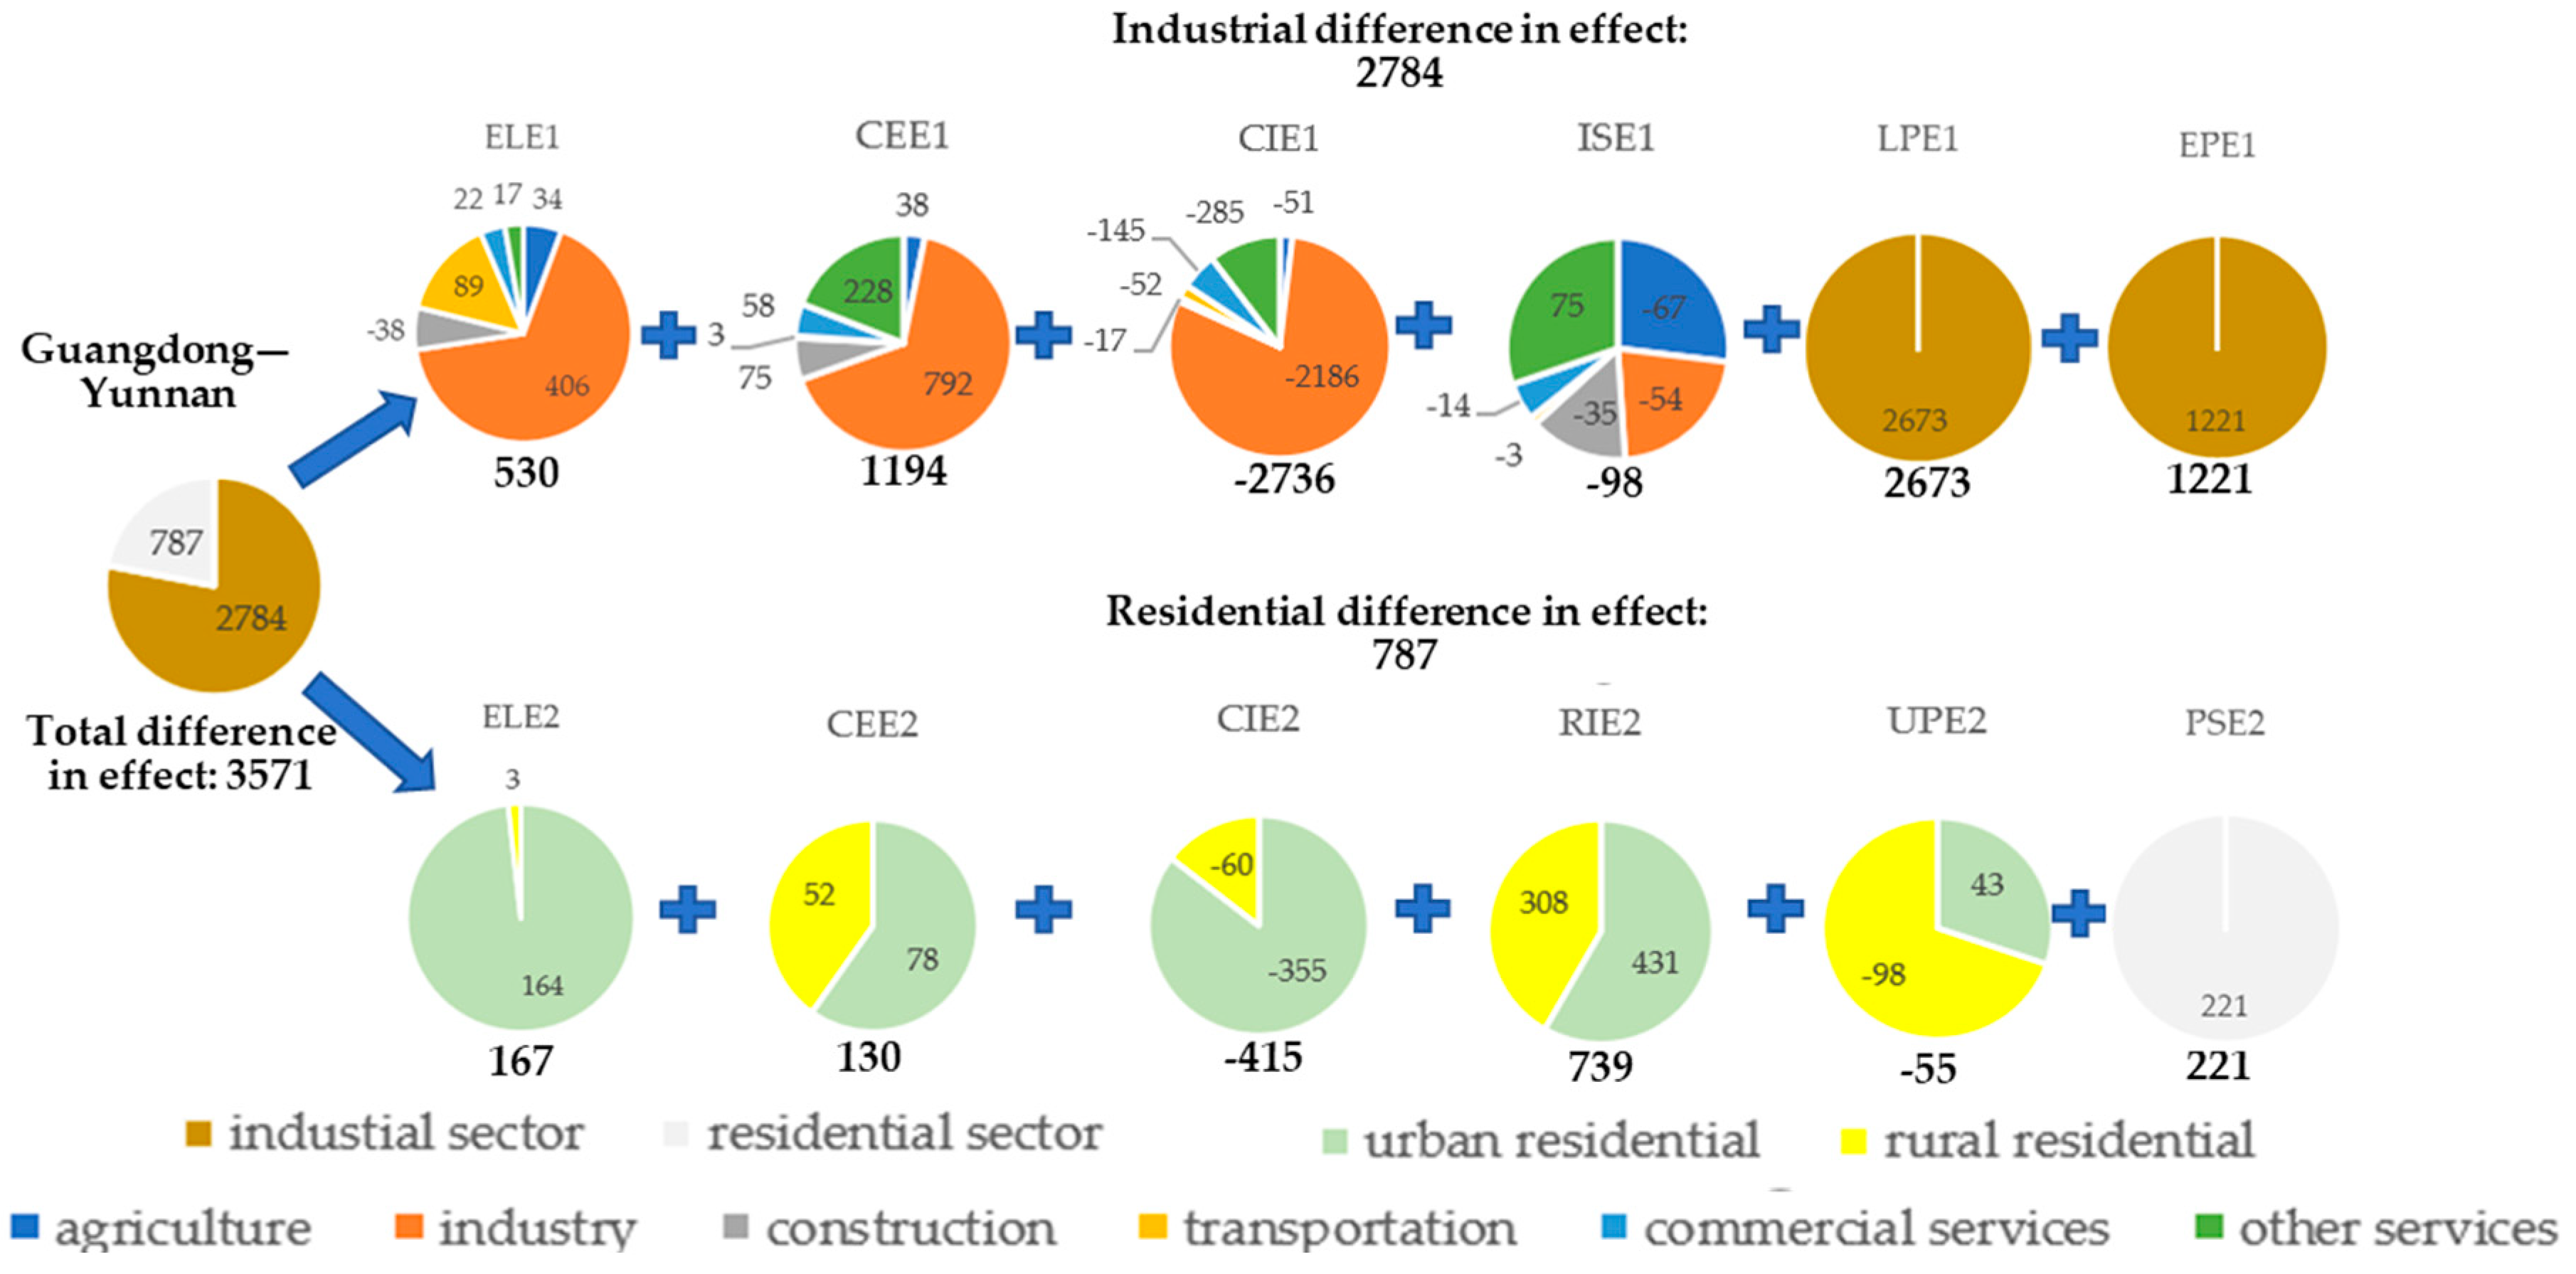
4.4.8. Spatial Difference in Effect by Subsector

Spatial difference is expressed in terms of subtraction of corresponding cumulative effects between Guangdong and Yunnan. Taking 2021 as the year for comparison, Figure 12 shows the differences in effect between the two provinces at the provincial, sectoral, and subsectoral levels. The total difference in effect was 3571 × 108 kWh, of which 2784 × 108 kWh (78.0%) for the industrial sector and 787 × 108 kWh (22.0%) for the residential sector. It indicates that industrial electricity is the main source of the total electricity consumption gap between Guangdong and Yunnan.
The industrial labor productivity level effect (LPE1) is the main driver in promoting the total electricity consumption in Guangdong to be higher than that in Yunnan, which expands the electricity consumption gap between Guangdong and Yunnan to 2673 × 108 kWh. It is mainly attributed to the fact that the labor productivity level in Guangdong increased by 7.8 × 10⁴ yuan/person, much higher than the increase of 4.4 × 10⁴ yuan/person in Yunnan during the period of 2005–2021. However, the industrial carbon emission intensity effect (CIE1), which is the main driver in inhibiting the total electricity consumption, has narrowed the electricity consumption gap between Guangdong and Yunnan by −2737 × 108 kWh, mainly caused by the industry subsector (−2186 × 108 kWh). The employed population size effect (EPE1) has widened the electricity consumption gap between Guangdong and Yunnan by 1221 × 108 kWh.
In the residential sector, the residential income per capita effect (RIE2), which is the main driver in promoting residential electricity consumption, has expanded the electricity consumption gap between Guangdong and Yunnan by 739 × 108 kWh, caused by urban residential sector (431 × 108 kWh) and rural residential sector (308 × 108 kWh). Nevertheless, the residential carbon emission intensity effect (CIE2), which is the main driver in inhibiting residential electricity consumption, has narrowed the electricity consumption gap between Guangdong and Yunnan by −415 × 108 kWh, mainly caused by the urban industrial sector (−355 × 108 kWh). The permanent population size effect (PSE2) has widened the electricity consumption gap between Guangdong and Yunnan by 221 × 108 kWh.
The average effect of change in drivers during 2005–2021 is listed in Table 5. It indicates that the average effects vary considerably across different subsectors. For example, when the electrification level of each subsector in Guangdong increases by 1%, the average electrification level effects range from 2.1 × 10⁸ kWh (construction) to 83.1 ×10⁸ kWh (industry). In addition, the average effect in Guangdong is larger than the corresponding average effect in Yunnan. This can be explained by the fact that the effect is related to the change in the corresponding driver and the change in subsector electricity consumption. The change in subsector electricity consumption in Guangdong is often larger than that in Yunnan, resulting in a large average effect.

5. Conclusions and Policy Implications

5.1. Conclusions

Taking carbon emissions constraint factor into account, this study constructs the Kaya extended model of electricity consumption, analyzes the decomposition of the drivers of electricity consumption in the industrial sector and residential sector using the LMDI method, and empirically explores the temporal and spatial differences in the driving effects on provincial, sectoral and subsectoral electricity consumption, respectively. The main findings are as follows:
(1)
During the period of 2005–2021, the total final electricity consumption growth in Guangdong (5093 × 108 kWh) is much higher than that in Yunnan (1510 × 108 kWh), but the average annual growth rate in Guangdong (7.1%) is lower than Yunnan (9.0%). The industrial sector accounted for a primary share of total final electricity consumption relative to the residential sector, and the share of industrial electricity consumption went down slowly in Guangdong and fluctuated in Yunnan. In addition, the growth of industry subsector electricity consumption is the main contributor to growth in total final electricity consumption, but the share of industry subsector electricity consumption went down slowly both in Guangdong and Yunnan;
(2)
Except for the carbon emission intensity effect and urban–rural population structure effect, all other cumulative effects contributed to the growth of total final electricity consumption in Guangdong and Yunnan during 2005–2021. The industrial labor productivity level effect is the primary driver that increases total final electricity consumption (Guangdong: 3988 × 108 kWh or 78.5%, Yunnan: 1315 × 108 kWh or 87.1%), and industrial carbon emission intensity effect is the primary driver that decreases total final electricity consumption (Guangdong: −3828 × 108 or −75.3%, Yunnan: −1092 × 108 kWh or −72.3%). The industrial energy consumption intensity effect and employed population size effect are the second and third drivers that increase industrial electricity consumption in Guangdong, while the industrial electrification level effect and industrial energy consumption intensity effect are the second and third drivers that increase industrial electricity consumption in Yunnan. The industrial structure effect in Guangdong shows an upward and then a downward trend, while in Yunnan, it shows an upward trend during 2005–2021;
(3)
In the residential sector, the residential income per capita effect and residential electrification level effect are the primary and secondary drivers that increase residential electricity consumption during 2005–2021, while the residential carbon emission intensity effect is the primary driver that reduces residential electricity consumption both in Guangdong and Yunnan. The urban–rural population structure effect was a negative contribution of −30.7 × 10⁸ kWh (−0.6%) in Guangdong, while a positive contribution of 24.7 × 10⁸ kWh (1.6%) in Yunnan. This is mainly caused by the differences in the urbanization process and urban–rural electricity consumption between the two provinces;
(4)
As the drivers change, the year-to-year effects of each driver fluctuate up and down both in Guangdong and Yunnan from 2005 to 2021. The year-to-year effect of each driver by subsector is overall positively correlated with the year-to-year change in the corresponding driver, i.e., the increase in driver promotes electricity consumption, while the decrease in driver inhibits electricity consumption. Carbon emission intensity and rural population share generally decrease from year to year, with the corresponding effect being a decrease in electricity consumption, while other effects generally increase electricity consumption;
(5)
The total difference in effect between Guangdong and Yunnan was 3571 × 108 kWh, of which 2784 × 108 kWh (78.0%) for the industrial sector and 787 × 108 kWh (22.0%) for the residential sector and the industrial labor productivity level effect. The largest positive difference lies in the industrial labor productivity level effect, which widens the gap in electricity consumption by 2673 × 108. The largest negative difference lies in the industrial carbon emission intensity effect, which narrows the gap in electricity consumption by −2737 × 108 kWh, mainly caused by the industry subsector (−2186 × 108 kWh). The difference in each effect between the two provinces is mainly determined by change in the corresponding driver and change in subsectoral electricity consumption. The average effect of change in driver varies considerably across different subsectors, helping to understand the difference in effect between Guangdong and Yunnan.

5.2. Policy Implications

Based on the analysis of the results, we propose the following policy implications:
(1)
A high share of industrial electricity consumption in Guangdong and Yunnan needs to be rationalized. With further industrialization, urbanization, and intelligence development, electricity consumption will still increase significantly. The expected continued improvement in the living standards of the residents foretells that there is little room for a reduction in electricity consumption in the residential sector. Therefore, controlling industrial electricity consumption is a priority, such as using more efficient electrical equipment, optimizing production processes, and upgrading production technology. The residential sector also needs to implement locally adapted tariff policies to scientifically manage electricity consumption to avoid wastage;
(2)
Increasing the electrification level in sectors with a high share of fossil energy consumption is urgent. Guangdong is the largest province in terms of energy consumption and carbon emissions. Yunnan’s end-use energy consumption has a high proportion of fossil energy consumption, and its overall electrification level is much lower than Guangdong’s. In the context of the carbon-neutral strategy, both provinces are under tremendous pressure to control energy consumption and reduce carbon emissions. Further promoting the implementation of an electricity substitution policy can be less effective for final fossil energy consumption and improve the electrification level in industry, transportation, construction, and other sectors. The electrification rate has more room for improvement in Yunnan;
(3)
Improving technology and reducing carbon emission intensity is fundamental. The improvement of labor productivity will increase economic output and electricity consumption. However, improving technology can optimize energy management and economic structure and control energy-intensive industries to lower energy consumption and electricity consumption intensity. Compared to Guangdong, Yunnan’s carbon emission intensity has a lot of room to decline in industry and transportation. Guangdong should rely on its strong economic strength and talent advantage to strengthen the research investment and the application of advanced technologies and further optimize the structure of energy production and consumption to increase the share of low-carbon electricity. In addition, it is necessary to enhance public awareness of energy saving, low carbon, and environmental protection.

5.3. Limitation and Future Research

This study also has some limitations. In analyzing the factors related to final carbon emissions, the estimation of carbon emissions only includes direct carbon emissions from the combustion of fossil fuels, and the indirect carbon emissions from electricity consumption are not included. In further studies, we will consider this point and also consider the potential impacts of cross-regional electricity transmission. In addition, this study only uses Guangdong and Yunnan provinces as comparisons, and future studies will expand the regional scope to explore different electricity consumption characteristics in more regions.

Author Contributions

H.C.: conceptualization, investigation, methodology, project administration, supervision, visualization, writing–original draft, writing—review and editing. S.L.: investigation, data curation, formal analysis, visualization. Y.K.: methodology, data curation, formal analysis, validation, writing—review and editing. J.S.: validation, data curation, formal analysis. Z.M.: validation, formal analysis. All authors have read and agreed to the published version of the manuscript.

Funding

This research was funded by the “Special Fund for Science and Technology Innovation of Jiangsu Province (grant number: BE2022610)”.and the “Guangdong Basic and Applied Basic Research Foundation (grant number: 2022A1515240035)”.

Data Availability Statement

The data that support the findings of this study are available from the corresponding author upon reasonable request.

Conflicts of Interest

The authors declare no conflict of interest. The funders had no role in the design of the study, in the collection, analyses, or interpretation of data, in the writing of the manuscript, or in the decision to publish the results.

Appendix A

Table A1. Final CO2 emissions by subsector in Guangdong.
YearAgricultureIndustryConstructionTransportationCommercial ServicesOther
Services
Urban
Residential
Rural
Residential
2005500.54 9634.34 142.11 3762.60 510.18 145.30 1321.26 532.12
2006427.87 11,656.03 153.02 3868.02 567.85 145.69 1419.48 502.02
2007378.59 12,505.43 168.24 4263.49 649.77 165.47 1629.72 542.05
2008390.58 13,675.78 154.53 4596.10 616.60 150.95 1673.24 618.73
2009392.07 15,202.03 177.85 4816.74 818.48 161.08 1736.97 665.07
2010405.68 14,721.58 192.68 5309.77 846.40 173.47 1664.64 732.72
2011419.28 14,783.01 203.93 5448.02 885.17 183.77 2132.86 1021.13
2012428.96 14,539.45 210.25 5664.91 969.85 184.76 2073.19 1014.46
2013439.69 12,330.90 218.25 5488.15 1285.49 217.52 2013.23 890.03
2014452.30 13,258.39 223.31 5747.96 1177.93 224.30 2081.99 928.02
2015469.58 12,963.01 190.43 6279.50 1225.16 247.83 2424.00 1138.65
2016517.40 13,041.44 219.34 6703.92 1350.63 298.09 2765.70 1308.50
2017497.14 12,620.13 225.51 6794.97 1398.82 309.54 2808.11 1319.89
2018493.06 12,534.06 227.81 6924.76 1391.27 317.68 2877.04 1352.05
2019477.02 12,884.86 207.44 7015.23 1144.25 286.25 2834.72 1452.36
2020528.92 13,890.87 205.10 6150.76 1173.96 290.52 2910.48 1527.46
2021507.82 12,633.79 199.34 5903.57 1201.28 336.77 2708.40 1387.22
Note: The unit of CO2 emissions is 104 t.
Table A2. Final CO2 emissions by subsector in Yunnan.
YearAgricultureIndustryConstructionTransportationCommercial ServicesOther
Services
Urban
Residential
Rural
Residential
2005385.71 6418.54 102.97 1064.14 66.82 88.75 170.37 482.79
2006396.77 6528.10 114.04 1203.21 66.88 90.88 170.32 446.34
2007409.11 6500.91 113.16 1303.71 83.05 67.69 210.86 474.29
2008408.38 7163.88 160.86 1339.62 120.37 120.12 212.13 449.01
2009430.41 8038.40 175.81 1374.26 159.98 113.28 227.93 470.55
2010442.24 8306.95 201.64 1724.90 188.51 127.95 268.81 485.28
2011405.87 8574.91 256.14 1844.25 225.51 128.51 218.45 588.59
2012412.50 9222.86 240.67 1970.62 307.35 171.36 284.80 653.28
2013407.52 9143.48 240.14 1867.05 344.49 184.88 275.44 622.74
2014440.27 8635.20 236.11 2111.80 253.72 215.98 261.72 641.27
2015495.13 8061.62 247.58 2043.91 399.11 229.99 259.89 659.06
2016451.30 8256.18 261.33 2138.98 382.47 178.25 312.07 754.53
2017462.84 9454.23 270.41 2184.95 380.15 180.15 324.64 721.24
2018459.55 9506.62 269.73 2454.90 394.98 198.74 327.18 721.60
2019449.77 10,151.85 273.91 2672.77 399.01 200.85 340.66 708.06
2020457.23 10,297.63 253.46 2538.50 343.55 222.21 318.75 776.29
2021433.00 9507.47 247.52 2618.45 401.07 187.99 333.15 761.46
Note: The unit of CO2 emissions is 104 t.
Table A3. Year-to-year effects of each driver on final electricity consumption in Guangdong.
YearIndustrial Sector
ELE1CEE1CIE1ISE1LPE1EPE1YEC1
2005–2006−105.16 −27.28 −0.98 32.10 252.10 70.17 220.96
2006–200741.16 67.43 −188.70 32.51 285.50 81.99 319.90
2007–2008−77.88 9.70 −134.70 24.01 199.16 62.90 83.19
2008–2009−181.53 −37.28 47.38 −11.27 149.72 101.50 68.51
2009–2010139.21 200.13 −396.40 40.06 212.04 189.17 384.22
2010–201197.53 103.30 −275.91 11.32 311.20 40.08 287.53
2011–201218.70 83.48 −244.43 −11.45 210.35 48.02 104.68
2012–2013241.31 156.47 −523.98 −6.25 230.93 62.37 160.85
2013–2014183.70 −84.31 −140.92 7.35 236.42 103.36 305.60
2014–201515.19 59.87 −247.15 −17.84 195.04 73.90 79.01
2015–201658.38 21.93 −149.45 −17.11 231.41 91.62 236.78
2016–2017212.69 120.23 −371.87 −11.29 260.17 112.97 322.91
2017–201855.82 189.10 −284.48 −21.73 265.49 85.42 289.61
2018–2019116.18 136.48 −261.11 −37.03 277.15 51.75 283.41
2019–2020−17.67 −57.40 106.19 −26.93 114.23 42.86 161.28
2020–2021346.70 500.15 −761.99 27.24 557.45 114.73 784.29
YearResidential Sector
ELE2CEE2CIE2RIE2UPE2PSE2YEC2
2005–200618.42 11.04 −29.42 27.93 0.20 9.24 37.39
2006–2007−0.58 4.29 −4.97 38.90 −0.04 8.99 46.59
2007–200813.76 5.29 −30.84 49.42 −0.63 10.39 47.39
2008–200921.47 9.48 −27.83 42.48 −0.01 11.67 57.26
2009–201022.14 4.02 −59.79 54.78 −0.95 14.47 34.67
2010–2011−46.51 −19.05 41.12 78.42 −0.46 17.43 70.95
2011–201242.24 20.02 −85.89 74.03 −0.42 16.97 66.95
2012–201335.92 14.71 −48.03 8.32 −1.11 11.73 21.55
2013–201439.04 23.36 −57.39 77.47 −1.09 18.07 99.47
2014–2015−42.58 −23.43 36.39 56.47 −3.54 11.82 35.12
2015–2016−19.74 −12.73 9.59 66.25 −1.33 16.26 58.29
2016–201713.72 6.71 −57.49 63.36 −1.92 15.00 39.37
2017–201814.09 7.46 −51.12 68.77 −3.45 15.26 51.01
2018–201929.01 18.40 −64.34 88.94 −3.90 15.89 83.99
2019–202036.19 11.02 −35.83 79.22 −7.54 17.80 100.85
2020–202187.93 66.40 −157.25 127.14 −4.48 18.03 137.77
Note: The unit is 108 kWh.
Table A4. Year-to-year effects of each driver on final electricity consumption in Yunnan.
YearIndustrial Sector
ELE1CEE1CIE1ISE1LPE1EPE1YEC1
2005–200655.70 5.30 −60.28 18.77 41.34 10.54 71.38
2006–200757.28 37.97 −87.48 20.09 51.20 12.17 91.23
2007–200814.06 −17.30 −8.85 13.26 45.69 14.48 61.35
2008–2009−21.65 −5.08 −5.82 −0.81 57.30 10.62 34.56
2009–201056.40 6.90 −63.04 13.86 60.12 27.31 101.55
2010–2011104.60 32.72 −103.27 23.31 106.17 21.04 184.58
2011–20121.34 7.70 −49.83 18.10 98.14 2.07 77.51
2012–2013−14.54 −8.83 −68.31 −8.04 70.80 −1.61 −30.53
2013–2014135.14 52.50 −126.63 3.91 106.11 16.09 187.14
2014–2015−55.50 −11.48 −43.87 −16.89 34.03 −15.10 −108.80
2015–2016−21.03 18.33 −41.96 −9.84 53.52 8.20 7.23
2016–201756.59 −50.84 −25.71 9.15 116.44 −0.52 105.10
2017–201821.13 56.01 −100.33 15.85 117.21 2.91 112.77
2018–201930.54 −0.01 −43.20 1.16 107.69 1.60 97.78
2019–202087.13 71.90 −92.17 1.24 127.34 7.49 202.92
2020–2021107.33 52.45 −171.00 8.41 121.79 −5.92 113.06
YearResidential Sector
ELE2CEE2CIE2RIE2UPE2PSE2YEC2
2005–20064.15 0.86 −13.72 9.96 1.43 0.55 3.23
2006–2007−2.36 −0.98 1.53 9.43 1.66 0.58 9.87
2007–200818.03 1.87 −19.56 16.54 2.44 0.70 20.01
2008–20095.74 14.97 −10.85 15.55 2.19 0.87 28.47
2009–20103.88 −12.62 −2.94 14.09 1.74 0.74 4.89
2010–20114.31 −1.44 −29.28 18.48 0.49 0.27 −7.17
2011–2012−3.80 −3.77 0.35 19.51 3.67 0.51 16.47
2012–201310.44 3.70 −21.20 16.31 1.89 0.41 11.55
2013–201425.32 14.27 −29.67 28.66 3.49 1.00 43.08
2014–20158.55 2.77 −17.24 17.31 1.64 0.48 13.51
2015–2016−21.12 −17.40 19.16 −0.44 −2.73 −0.07 −22.60
2016–201712.34 4.84 −19.70 21.59 2.06 0.83 21.97
2017–20188.43 3.34 −17.01 18.64 1.17 0.56 15.13
2018–20195.95 2.26 −16.33 19.00 1.38 0.57 12.83
2019–202014.98 2.48 −17.01 18.98 1.03 0.65 21.11
2020–20213.22 1.63 −14.88 19.03 1.10 −0.83 9.27
Note: The unit is 108 kWh.

References

  1. UNFCCC. Secretariat. Synthesis Report of the Technical Dialogue of the First Global Stocktake. Available online: https://unfccc.int/documents/631600 (accessed on 27 October 2023).
  2. Lv, T.; Pi, D.; Deng, X.; Hou, X.; Xu, J.; Wang, L. Spatiotemporal Evolution and Influencing Factors of Electricity Consumption in the Yangtze River Delta Region. Energies 2022, 15, 1753. [Google Scholar] [CrossRef]
  3. Lin, B.; Omoju, O.E.; Okonkwo, J.U. Factors Influencing Renewable Electricity Consumption in China. Renew. Sustain. Energy Rev. 2016, 55, 687–696. [Google Scholar] [CrossRef]
  4. Wen, H.; Liang, W.; Lee, C.C. China’s Progress toward Sustainable Development in Pursuit of Carbon Neutrality: Regional Differences and Dynamic Evolution. Environ. Impact Assess. Rev. 2023, 98, 106959. [Google Scholar] [CrossRef]
  5. He, Y.; Xing, Y.; Zeng, X.; Ji, Y.; Hou, H.; Zhang, Y.; Zhu, Z. Factors Influencing Carbon Emissions from China’s Electricity Industry: Analysis Using the Combination of LMDI and K-means Clustering. Environ. Impact Assess. Rev. 2022, 93, 106724. [Google Scholar] [CrossRef]
  6. Yuan, Y.; Suk, S. Decomposition Analysis and Trend Prediction of Energy-Consumption CO2 Emissions in China’s Yangtze River Delta Region. Energies 2023, 16, 4510. [Google Scholar] [CrossRef]
  7. Guangdong Statistical Yearbook. Available online: http://www.stats.gd.gov.cn/gdtjnj/index.html (accessed on 27 October 2023).
  8. Yunnan Statistical Yearbook. Available online: http://www.http://stats.yn.gov.cn/tjsj/tjnj (accessed on 27 October 2023).
  9. Wang, H.; Zhou, P. Assessing Global CO2 Emission Inequality from Consumption Perspective: An Index Decomposition Analysis. Ecol. Econ. 2018, 154, 257–271. [Google Scholar] [CrossRef]
  10. Wang, H.; Ang, B.W.; Su, B. Assessing Drivers of Economy-wide Energy Use and Emissions: IDA Versus SDA. Energy Policy 2017, 107, 585–599. [Google Scholar] [CrossRef]
  11. Wang, H.; Ang, B.W.; Zhou, P. Decomposing Aggregate CO2 Emission Changes with Heterogeneity: An Extended Production-theoretical Approach. Energy J. 2018, 39, 59–79. [Google Scholar] [CrossRef]
  12. Ang, B.W.; Liu, F.L. A New Energy Decomposition Method: Perfect in Decomposition and Consistent in Aggregation. Energy 2001, 26, 537–548. [Google Scholar] [CrossRef]
  13. Ang, B.W.; Liu, N. Handling Zero Values in the Logarithmic Mean Divisia Index Decomposition Approach. Energy Policy 2007, 35, 238–246. [Google Scholar] [CrossRef]
  14. Ang, B.W. Decomposition Analysis for Policymaking in Energy: Which is the Preferred Method? Energy Policy 2004, 32, 1131–1139. [Google Scholar] [CrossRef]
  15. Ang, B.W. The LMDI Approach to Decomposition Analysis: A Practical Guide. Energy Policy 2005, 33, 867–871. [Google Scholar] [CrossRef]
  16. Yang, X.; Xu, H.; Su, B. Factor Decomposition for Global and National Aggregate Energy Intensity Change During 2000–2014. Energy 2022, 254, 124347. [Google Scholar] [CrossRef]
  17. Liu, M.; Zhang, X.; Zhang, M.; Feng, Y.; Liu, Y.; Wen, J.; Liu, L. Influencing Factors of Carbon Emissions in Transportation Industry Based on CD Function and LMDI Decomposition Model: China as an Example. Environ. Impact Assess. Rev. 2021, 90, 106623. [Google Scholar] [CrossRef]
  18. Chen, J.; Wang, P.; Cui, L.; Huang, S.; Song, M. Decomposition and Decoupling Analysis of CO2 Emissions in OECD. Appl. Energy 2018, 231, 937–950. [Google Scholar] [CrossRef]
  19. Dong, K.; Hochman, G.; Timilsina, G.R. Do Drivers of CO2 Emission Growth Alter Overtime and by the Stage of Economic Development? Energy Policy 2020, 140, 111420. [Google Scholar] [CrossRef]
  20. Wang, Q.; Wang, X.W. Moving to Economic Growth Without Water Demand Growth—A Decomposition Analysis of Decoupling from Economic Growth and Water Use in 31 Provinces of China. Sci. Total Environ. 2020, 726, 138362. [Google Scholar] [CrossRef]
  21. Zhang, C.J.; Zhao, Y.; Shi, C.F.; Chiu, Y. Can China Achieve its Water Use Peaking in 2030? A Scenario Analysis Based on LMDI and Monte Carlo Method. J. Clean. Prod. 2021, 278, 123214. [Google Scholar] [CrossRef]
  22. Long, H.Y.; Lin, B.Q.; Ou, Y.T.; Chen, Q. Spatio-temporal Analysis of Driving Factors of Water Resources Consumption in China. Sci. Total Environ. 2019, 690, 1321–1330. [Google Scholar] [CrossRef]
  23. Luo, Y.; Zeng, W.; Wang, Y.; Li, D.; Hu, X.; Zhang, H. A Hybrid Approach for Examining the Drivers of Energy Consumption in Shanghai. Renew. Sustain. Energy Rev. 2021, 151, 111571. [Google Scholar] [CrossRef]
  24. Tenaw, D. Decomposition and Macroeconomic Drivers of Energy Intensity: The Case of Ethiopia. Energy Strategy Rev. 2021, 35, 100641. [Google Scholar] [CrossRef]
  25. Zhou, Q.; Fu, C.; Ni, H.; Gong, L. What are the Main Factors that Influence China’s Energy Intensity? —Based on Aggregate and Firm-level Data. Energy Rep. 2021, 7, 2737–2750. [Google Scholar] [CrossRef]
  26. Zhang, C.; Su, B.; Zhou, K.L.; Yang, S.L. Analysis of Electricity Consumption in China (1990–2016) Using Index Decomposition and Decoupling Approach. J. Clean. Prod. 2019, 209, 224–235. [Google Scholar] [CrossRef]
  27. Wang, Y.; Liu, Y.Z.; Huang, L.Q.; Zhang, Q.Y.; Gao, W.; Sun, Q.; Li, X. Decomposition the Driving Force of Regional Electricity Consumption in Japan from 2001 to 2015. Appl. Energy 2022, 308, 118365. [Google Scholar] [CrossRef]
  28. Lin, B.; Raza, M.Y. Analysis of Electricity Consumption in Pakistan Using Index Decomposition and Decoupling Approach. Energy 2021, 214, 118888. [Google Scholar] [CrossRef]
  29. Praene, J.P.; Rasamoelina, R.M.; Ayagapin, L. Past and Prospective Electricity Scenarios in Madagascar: The Role of Government Energy Policies. Renew. Sustain. Energy Rev. 2021, 149, 111321. [Google Scholar] [CrossRef]
  30. Fang, D.; Hao, P.; Hao, J. Study of the Influence Mechanism of China’s Electricity Consumption Based on Multi-period ST-LMDI Model. Energy 2019, 170, 730–743. [Google Scholar] [CrossRef]
  31. Fang, D.; Hao, P.; Yu, Q.; Wang, J. The Impacts of Electricity Consumption in China’s Key Economic Regions. Appl. Energy 2020, 267, 115078. [Google Scholar] [CrossRef]
  32. Park, J.; Jin, T.; Lee, S.; Woo, J. Industrial Electrification and Efficiency: Decomposition Evidence from the Korean Industrial Sector. Energies 2021, 14, 5120. [Google Scholar] [CrossRef]
  33. Shi, C.; Zhao, Y.; Zhang, C.; Pang, Q.; Chen, Q.; Li, A. Research on the Driving Effect of Production Electricity Consumption Changes in the Yangtze River Economic Zone-Based on Regional and Industrial Perspectives. Energy 2022, 238, 121635. [Google Scholar] [CrossRef]
  34. Huang, Y.H. Examining Impact Factors of Residential Electricity Consumption in Taiwan Using Index Decomposition Analysis Based on End-use Level Data. Energy 2020, 213, 119067. [Google Scholar] [CrossRef]
  35. Meng, M.; Wang, L.; Shang, W. Decomposition and Forecasting Analysis of China’s Household Electricity Consumption Using Three-dimensional Decomposition and Hybrid Trend Extrapolation Models. Energy 2018, 165, 143–152. [Google Scholar] [CrossRef]
  36. Zhang, C.J.; Wang, Y.Z.; Xu, J.R.; Shi, C.F. What Factors Drive the Temporal-spatial Differences of Electricity Consumption in the Yangtze River Delta Region of China. Environ. Impact Assess. Rev. 2023, 103, 107247. [Google Scholar] [CrossRef]
  37. Kaya, Y. Impact of Carbon Dioxide Emission Control on GNP Growth: Interpretation of Proposed Scenarios; Intergovernmental Panel on Climate Change/Response Strategies Working Group: Geneva, Switzerland, 1989; Volume 13, pp. 20–33. [Google Scholar]
  38. Ang, B.W. LMDI Decomposition Approach: A Guide for Implementation. Energy Policy 2015, 86, 233–238. [Google Scholar] [CrossRef]
  39. National Bureau of Statistics of China. China Energy Statistical Yearbook (2006–2022); China Statistics Press: Beijing, China, 2022.
  40. Shan, Y.; Huang, Q.; Guan, D.; Hubacek, K. China CO2 Emission Accounts 2016–2017. Sci. Data 2020, 7, 54. [Google Scholar] [CrossRef] [PubMed]
Figure 1. Trends of electricity consumption in Guangdong and Yunnan from 2005 to 2021.
Energies 16 08052 g001
Figure 2. Cumulative effects of each driver on changes in final electricity consumption from 2005 to 2021.
Energies 16 08052 g002
Figure 3. Cumulative contribution rates of drivers to changes in total final electricity consumption during the period of 2005–2021.
Energies 16 08052 g003
Figure 4. Year-to-year effects of each driver on changes in final electricity consumption from 2005 to 2021.
Energies 16 08052 g004
Figure 5. Scatterplot of changes in drivers and corresponding year-to-year effects from 2005 to 2021.
Energies 16 08052 g005
Figure 6. Cumulative electrification level effect and electrification level.
Energies 16 08052 g006
Figure 7. Cumulative energy consumption intensity effect and energy consumption intensity.
Energies 16 08052 g007
Figure 8. Cumulative carbon emission intensity effect and carbon emission intensity.
Energies 16 08052 g008
Figure 9. Cumulative industrial structure effect by subsector.
Energies 16 08052 g009
Figure 10. Cumulative labor productivity level effect and residential income per capita effect.
Energies 16 08052 g010
Figure 11. Cumulative population-related effects.
Energies 16 08052 g011
Figure 12. Decomposition of spatial difference of total final electricity consumption between Guangdong and Yunnan (2021).
Energies 16 08052 g012
Table 1. Abbreviated names of effects.
Abbreviated NameEffectAbbreviated NameEffect
ELE1industrial electrification level effectELE2residential electrification level effect
CEE1industrial energy consumption intensity effectCEE2residential energy consumption intensity effect
CIE1industrial carbon emissions intensity effectCIE2residential carbon emissions intensity effect
ISE1industrial structure effectRIE2residential income per capita effect
LPE1labor productivity level effectUPE2urban–rural population structure effect
EPE1employed population size effectPSE2permanent population size effect
TEC1cumulative effect in the industrial sectorTEC2cumulative effect in the residential sector
YEC1year-to-year effect in the industrial sectorYEC2year-to-year effect in the residential sector
Table 2. Cumulative effects of each driver in the industrial sector.
ProvinceYearELE1CEE1CIE1ISE1LPE1EPE1TEC1
Guangdong2005–2010−184213−67311710995061077
2005–2015372532−210610122828332014
2005–2020798942−3067−14343112183308
2005–202111441442−382814398813334093
Yunnan2005–201016228−2256525675360
2005–2015333100−6178667198670
2005–2020507196−92110311931171196
2005–2021615248−109211213151111309
Note: The unit is 108 kWh.
Table 3. Cumulative effects of each driver in the residential sector.
ProvinceYearELE2CEE2CIE2RIE2UPE2PSE2TEC2
Guangdong2005–20107534−153214−1.455223
2005–201510350−267508−8.1131517
2005–202017781−466875−26211851
2005–2021265147−6231002−31229989
Yunnan2005–2010294−46669.53.466
2005–20157420−143166216.1144
2005–20209515−193244248.7192
2005–20219817−208263257.8202
Note: The unit is 108 kWh.
Table 4. Cumulative effects of each driver by subsector during the period of 2005–2021.
EffectProvinceAgricultureIndustryConstructionTransportationCommercial ServicesOther
Services
Urban
Residential
Rural
Residential
Total
ELEGuangdong57914−25935154174911409
Yunnan2250813429371088713
CEEGuangdong359878146427188591589
Yunnan−3.319570.3743106265
CIEGuangdong−64−3181−45−69−144−326−489−134−4452
Yunnan−14−995−28−160.8−40−135−74−1300
ISE1Guangdong−7762−23−4−863 14
Yunnan−1111712−1.16−12 112
RIE2Guangdong 5724301002
Yunnan 141122263
UPE2Guangdong 90−121−31
Yunnan 48−2325
Note: The unit is 108 kWh.
Table 5. Average effect of change in driver during 2005–2021.
DriverChangeProvinceAgricultureIndustryConstructionTransportationCommercial ServicesOther
Services
Urban
Residential
Rural
Residential
Total
electrification level+1%Guangdong3.2 83.1 2.1 20.5 6.4 6.0 13.2 6.7
Yunnan1.9 38.9 0.9 7.2 1.2 1.3 1.9 3.5
energy consumption intensity+0.1 tc/tCO2Guangdong13.8 316.2 4.3 15.7 31.7 16.1 54.3 31.1
Yunnan3.0 132.4 3.7 5.4 4.0 6.1 9.2 9.5
carbon emission intensity−0.1 tCO2/104 yuanGuangdong−39.1 −502.2 −54.5 −3.1 −160.2 −2953.5 −452.4 −110.9
Yunnan−4.2 −24.5 −9.5 −0.6 −14.7 −90.7 −106.3 −14.2
industrial
structure
+1%Guangdong23.3 60.5 20.3 17.8 30.5 16.3
Yunnan1.2 21.8 2.6 5.9 2.0 2.8
labor productivity level+104 yuan/personGuangdong 511.4
Yunnan 298.1
residential income per capita+104 yuan/personGuangdong 142.6 244.2
Yunnan 42.9 100.2
urban–rural population structure+1%Guangdong 6.5 8.7
Yunnan 2.2 1.1
employed population size+104 personsGuangdong 0.65
Yunnan 0.36
permanent population+104 personsGuangdong 0.07
Yunnan 0.03
Note: The unit is 108 kWh; + indicates an increase in the value of the driver, − indicates a decrease in the value of the driver.
Disclaimer/Publisher’s Note: The statements, opinions and data contained in all publications are solely those of the individual author(s) and contributor(s) and not of MDPI and/or the editor(s). MDPI and/or the editor(s) disclaim responsibility for any injury to people or property resulting from any ideas, methods, instructions or products referred to in the content.

