Article

Optimization of an Oil–Gas Separator of Gas Storage Compressor with Consideration of Velocity Uniformity in Filter Inlets

1
Hutubi Gas Storage Co., Ltd., Hutubi 831200, China
2
School of Energy and Power Engineering, Xi’an Jiaotong University, No. 28 West Xianning Road, Xi’an 710049, China
*
Author to whom correspondence should be addressed.
Energies 2023, 16(24), 8015; https://doi.org/10.3390/en16248015
Submission received: 1 November 2023 / Revised: 22 November 2023 / Accepted: 5 December 2023 / Published: 12 December 2023
(This article belongs to the Topic Oil, Gas and Water Separation Research)

Abstract

:
The oil–gas separator of the gas storage compressor serves as crucial equipment in a natural gas storage system to improve gas storage purity and efficiency. Its optimization is also essential to improve the separation efficiency and lifespan. Collision and centrifugal separation are two widely used optimized structures for oil–gas separators, and the enhancement in separation efficiency, as well as the decrease in pressure loss of optimized separators, has been thoroughly discussed. However, the velocity uniformity in the filter inlet has not been considered, which affects the filtration performance. Thus, the overall efficiency of the separator is reduced. Accordingly, optimization of an oil–gas separator with the consideration of velocity uniformity in filter inlets is introduced in this study. The effects of critical dimension parameters of optimized equipment on separator performance were analyzed. The results show that bb = 0.4, lb = 3, hb = 1.5, and kb = 0.5 and le = 0.9 and he = 4.11, as well as lc = 0.5 and dc = 0.52, are suitable for the case of placing baffles, adjusting the separator height and inlet position, as well as adding an inner cylinder, respectively. Subsequently, the analytic hierarchy process was employed to compare different optimized cases. It is observed that the overall rating for adding an inner cylinder reaches 88.46, which is the more suitable optimized method for the oil–gas separator. This work is relevant for oil–gas systems to improve their separation efficiency and enhance the gas storage performance.

1. Introduction

In recent years, there has been a progressive increase in the global energy structure, notably within China, with natural gas assuming a more prominent role. This shift can be attributed to its favorable economic and environmental advantages when contrasted with coal and oil. According to statistical data, in 2021, China’s aggregate natural gas consumption amounted to 369 billion cubic meters, indicating an 85.42% increase compared to the levels observed in 2012 [1]. Nonetheless, the distribution of natural gas resources in China is characterized by inequality [2], and natural gas consumption demonstrates pronounced seasonality. To secure a dependable energy supply, the development of extensive natural gas storage facilities with temporal and spatial transfer capabilities is of utmost significance [3], wherein natural gas is compressed and filtered for storage. Hence, high-precision oil–gas separators assume a crucial role within the realm of natural gas storage. Their function encompasses the separation of oil from compressor discharges [4], thereby preventing oil blockages in pipelines and, in turn, augmenting the overall efficiency of gas storage systems.
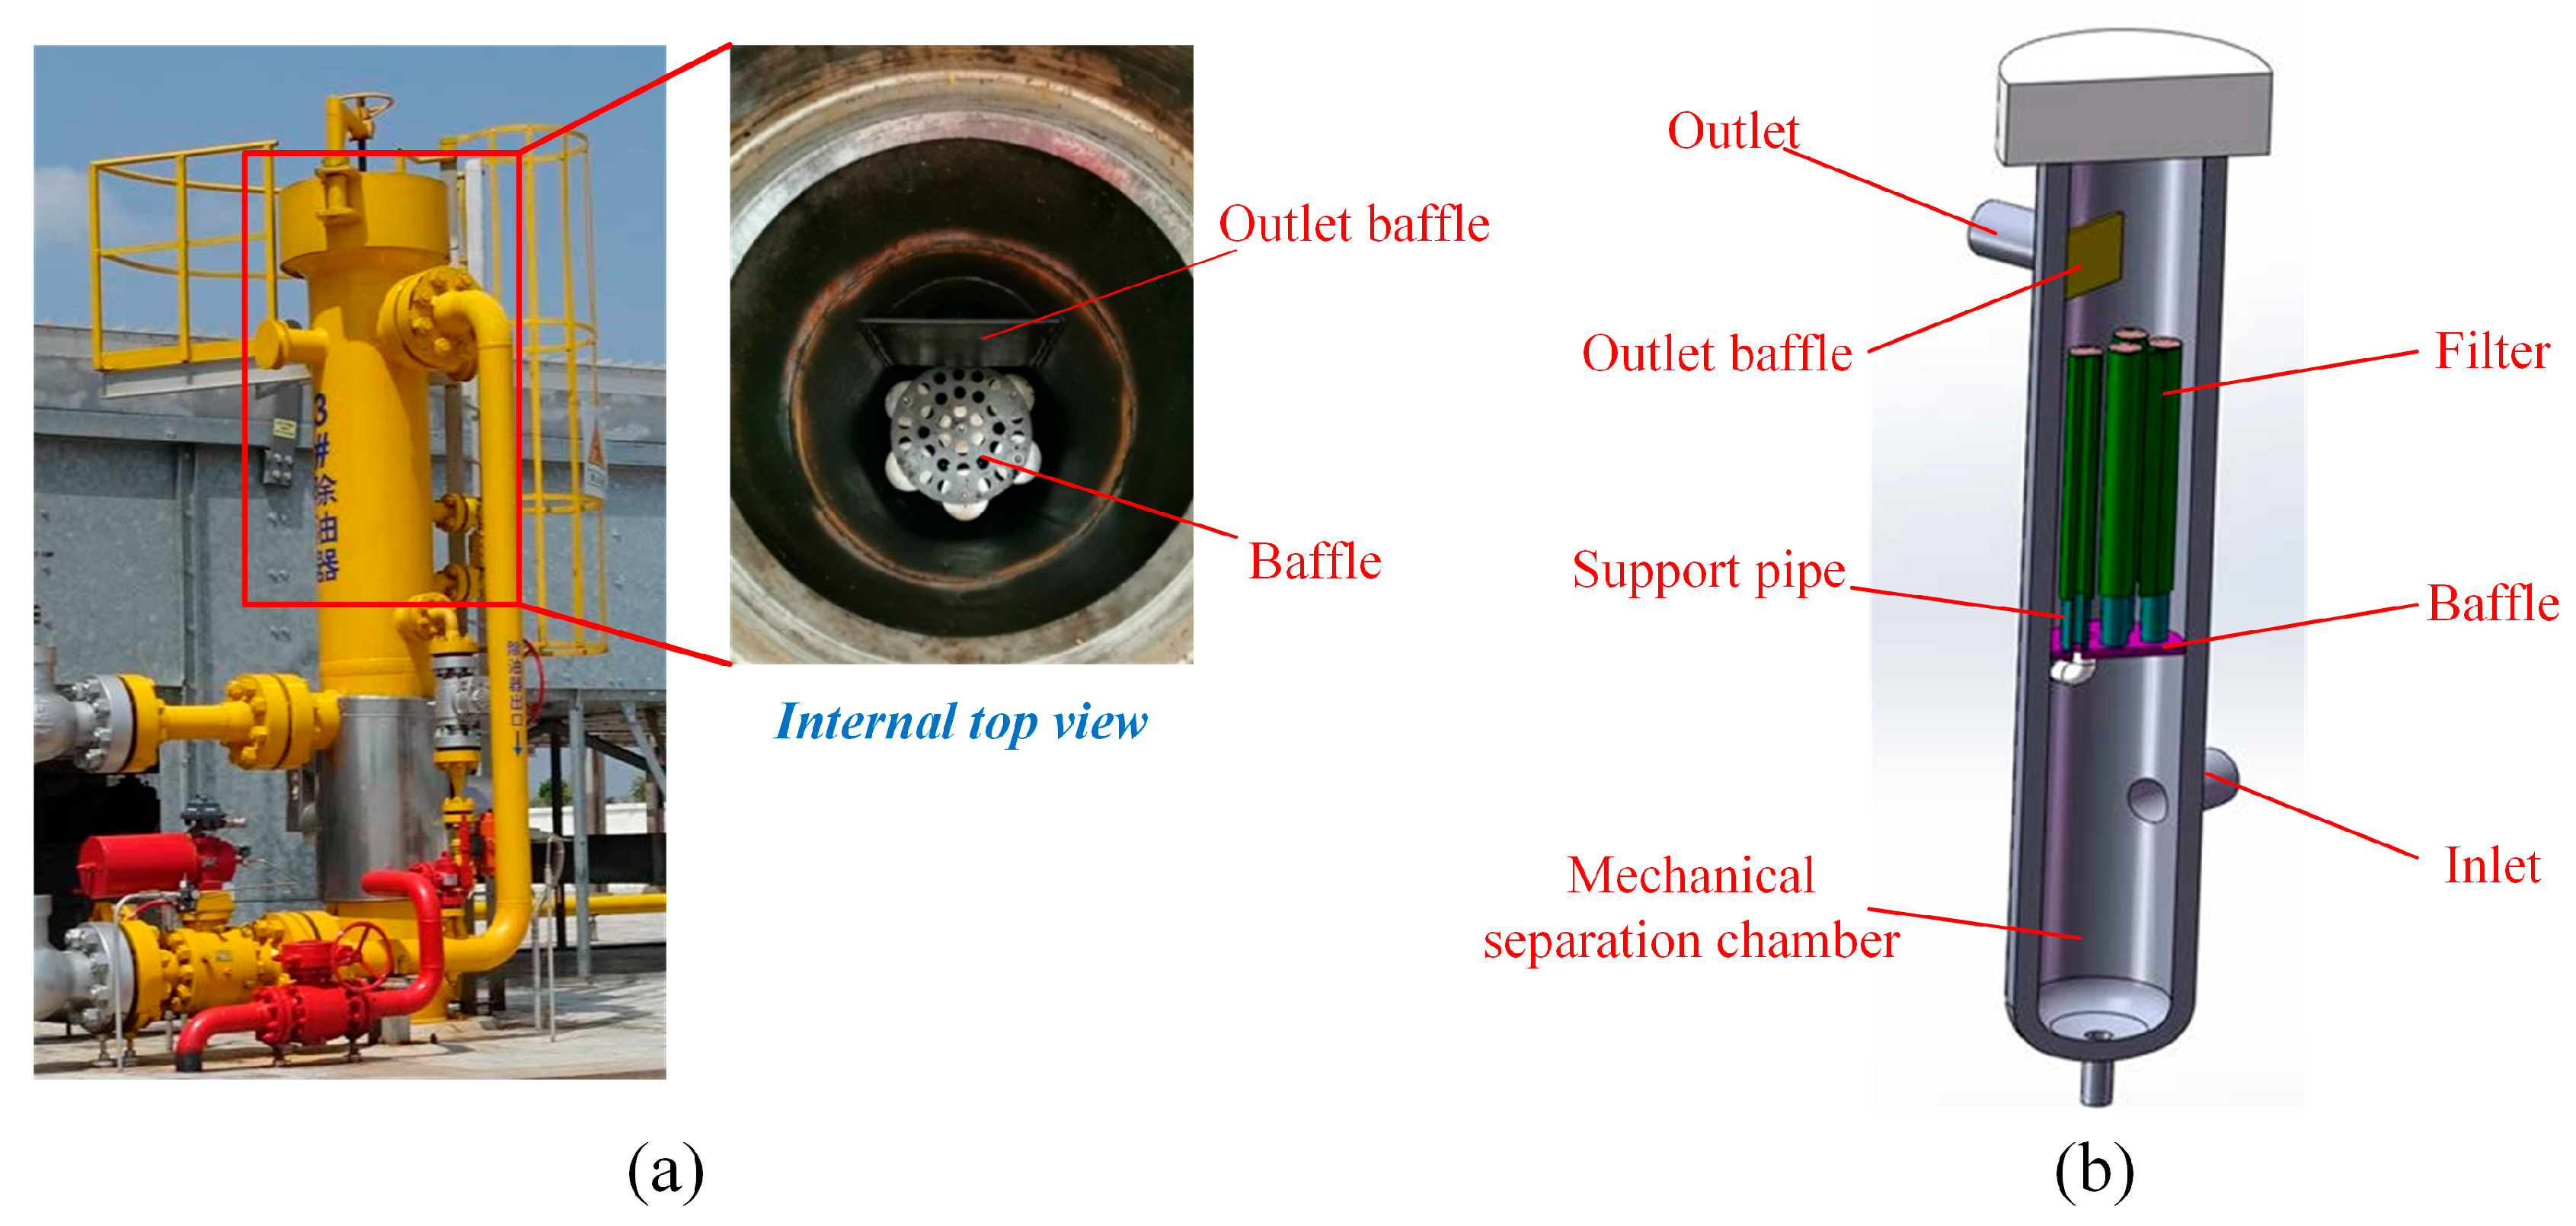
Advanced oil–gas separators typically comprise a dual-stage mechanism. In the initial stage, mechanical means, i.e., gravity, inertia, and centrifugal forces, have been utilized for the separation of oil droplets exceeding 10 μm in diameter. The subsequent stage involves the separation of smaller-diameter oil droplets through the utilization of porous filters. It is noteworthy that the efficiency of the first separation stage exerts a substantial influence on the overall separator efficiency because the performance of the filter core is related to the outlet of the first stage. Therefore, the enhancement of the effect of mechanical separators is highly important. Numerous optimized mechanical separators, as well as filters, have been extensively introduced and discussed in the literature, which are reviewed in the following subsections.
The mechanical oil–gas separator incorporates two main structures, namely, the gravity separation and centrifugal one [5]. The former primarily depends on structures like inlet baffles or deflector plates to alter the airflow direction, harnessing the inertia of liquid droplets for separation. The latter, on the other hand, is attributed to the disparity in density between gas and liquid, with liquid being notably influenced by centrifugal force, resulting in its adhesion to the wall for separation.
The planar designs have been employed for conventional deflectors. It can be found that the flow stability was improved [6,7], and the time for phase separation was decreased [8]. Solov’eva et al. [9] conducted experimental research on the process of water–oil emulsion separation in a gravity-dynamic separator, employing three distinct usage modes: without baffles, with baffles in the form of inserts made of open-cell foam material, and with plate baffles. It is demonstrated that separators with open-cell foam material baffles and plate baffles are more effective at lower and higher flow rates, respectively. Xu et al. [10] performed experiments to investigate the impact of eight distinct parameters of deflector plates on the flow field and separation efficiency. The findings suggested that reducing the gap width, increasing the number of bends, and raising the number of channels can improve separation efficiency, albeit at the cost of increased pressure drops. In the research carried out by Zhang et al. [5], the impact of radial baffle curvature on the jet flow within the separator was examined using experiments and numerical simulations. The results revealed that the concave baffle jet was confined to a narrow region near the concave baffle, leading to reduced flow disturbances in the center of the separator. In essence, it is suggested that concave baffles are a more suitable choice for the separator’s inlet compared to convex baffles.
Centrifugal separators featuring tangential inlets are also commonly known as cyclone separators [11]. Furthermore, altering the structural configuration of cyclone separators is a frequently employed optimization approach. Comparative investigations indicated that cylindrical height has a substantial impact on pressure drop and separation performance. Lengthening the cylindrical length in a uniflow hydrocyclone can improve separation efficiency while maintaining a specific pressure drop threshold [12]. In addition, it is claimed that the separation efficiency was increased by 11%, and the pressure losses were reduced by approximately 29% when the cylinder length exceeded 6.5 times the cylinder diameter [13]. Elsayed [14] determined that the foremost factors influencing separator pressure drop are the geometric dimensions of the cyclone and the size of the inlet cross-sectional area according to the Co-Kriging model. Subsequently, they devised an innovative cyclone separator, resulting in a reduction of pressure losses by more than 20% compared to the Stairmand design at the same volume flow rate. Moreover, it is revealed that the pressure drop is quadratic, i.e., first decreases and then increases, with the enhancement of the outlet duct length [15]. Misiulia et al. [16] discovered that utilizing a deswirler can effectively decrease pressure losses with a relatively modest effect on velocity and separation efficiency based on neural network optimization. It is shown that the separation efficiency has been improved by 21% with the utilization of a tangential chamber. Additionally, increasing the tangential inlet of the cyclone separator can enhance its separation efficiency [17] while maintaining a relatively lower pressure drop [18]. Another form of centrifugal separator is the axial flow separator, designed for space-constrained systems, with its central component being the guide blades. Valdez et al. [19] conducted experimental assessments on curved guide blades at different inclination angles to evaluate their separation performance. The findings revealed that the maximum separation performance can surpass 0.98. However, it is demonstrated that there is no significant change in the oil content at the separator outlet by reducing the stator diameter and the number of blades [20].
Filter performance is affected by many parameters, including operating conditions, the properties of the liquid, the properties of the filter material, and filter structures [21]. Many studies have focused on the single-fiber level. The forces acting on droplets and their shapes on fibers have been thoroughly investigated, and it is found that the droplets are predominantly observed in the Reynolds transition flow region [22,23]. Dawar et al. [24,25] developed an empirical correlation to calculate the average drag coefficient for drops detaching from a fiber, as well as a second correlation for predicting the fractional number. These correlations facilitate the study of the coalescence and motion of droplets along fibers. Moreover, it is observed that droplet interception and Brownian diffusion contribute to the growth of droplets on nanofibers within the range of droplet diameters from 100 to 1000 nm [26]. Some attention has been paid to the research regarding the level of the entire filter. It is revealed that the efficiency of wet filtration can be increased by increasing the angle of inclination of the filter and selecting the orientation [27]. Contal et al. [28] pointed out that high filtration velocities are beneficial to minimize the resistance of the deposit and the penetration of the filter. Similar conclusions have been obtained by the experiment in reference [29]. Frising et al. [30] established a single phenomenological model that can be utilized to predict the pressure drop and the penetration of a filter over the whole filtration span. Charvet et al. [31] indicated that, as the filter clogs, the medium’s performance for particles with diameters less than 100 nm diminishes, while that for particles with diameters greater than 200 nm improves. Additionally, the efficiency was enhanced significantly when the drainage layer was assembled outside of the coalescing layer [21]. Experimental results exhibited that non-uniform liquid distribution characteristics exist at various heights in the filter cartridge during the different stages of the filtration process, and the outlet concentration increases from the top to the bottom of the filter cartridge [32]. Innocentini et al. [33] investigated the permeation behavior of four industrial-grade media used for natural gas filtration under high pressure. The results indicated that considering the combined effect of the thickness and permeability coefficient of each filtering medium, a minimal pressure drop has been obtained when employing polyester.
Oil–gas separators have been extensively investigated in previous studies in terms of mechanical separators or filters. Furthermore, the discussion involved improving the overall separator performance through enhancements in their respective capabilities. However, most of the research has focused on reducing the oil content in the outlet and lowering the pressure loss, while neglecting the velocity uniformity that affects the performance of the filter, thereby indirectly reducing separation efficiency. Moreover, each optimization structure yields different improvement effects, which makes choosing the optimal optimization method challenging. Consequently, it is necessary to further study the oil–gas separators to understand the optimized method characteristics.
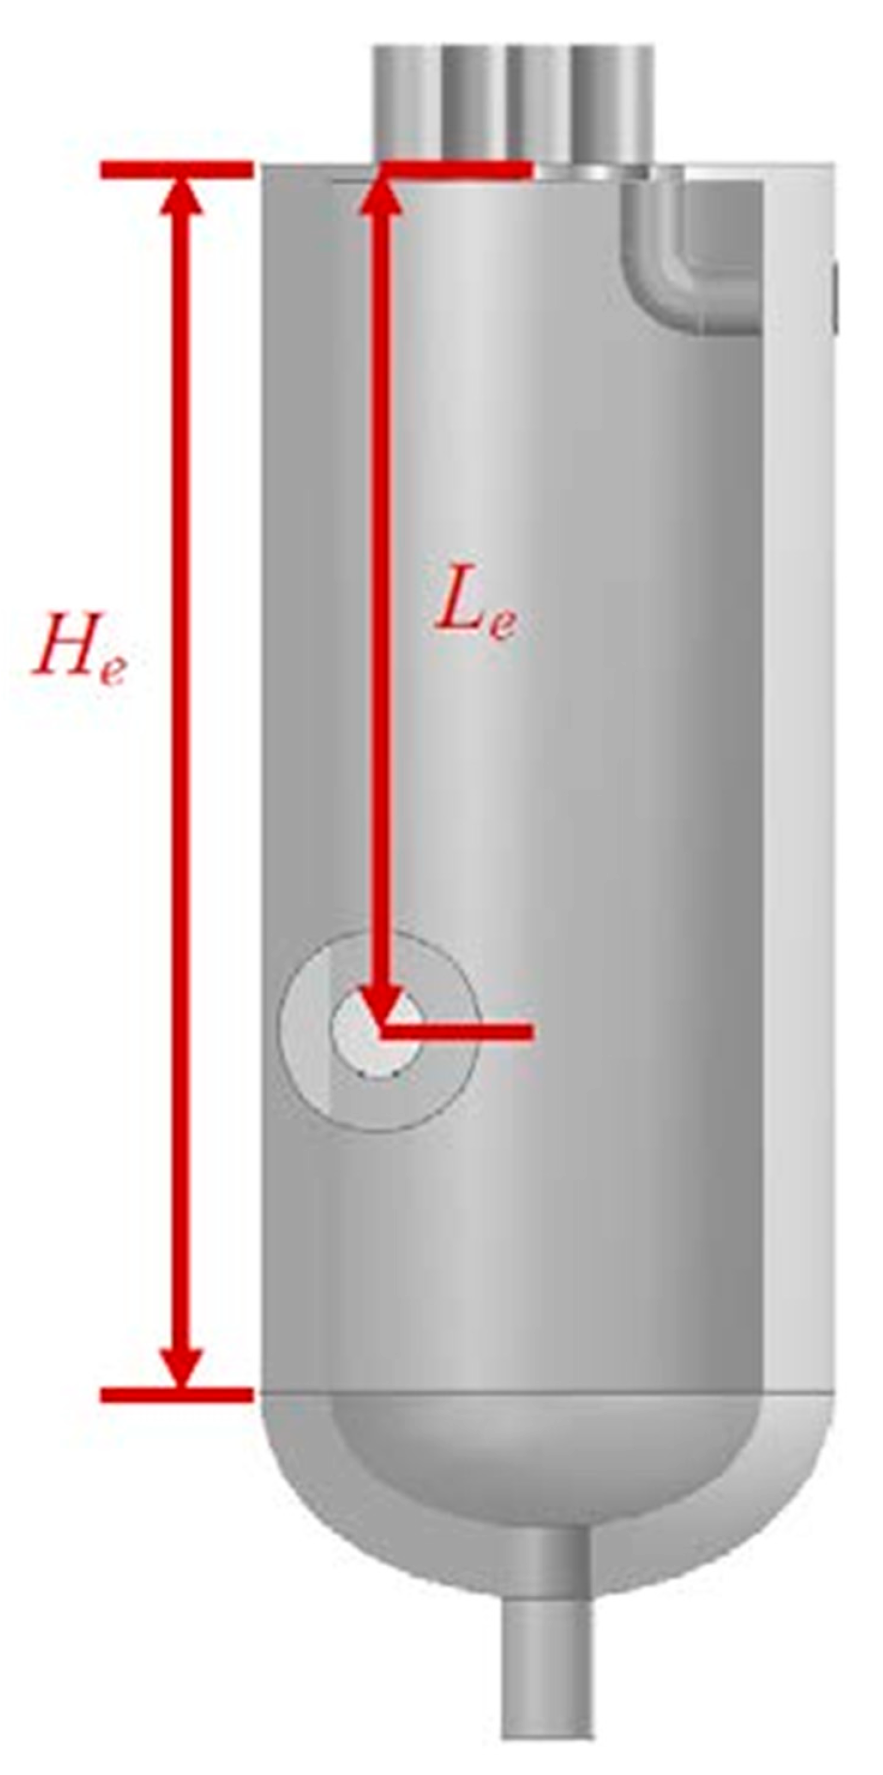
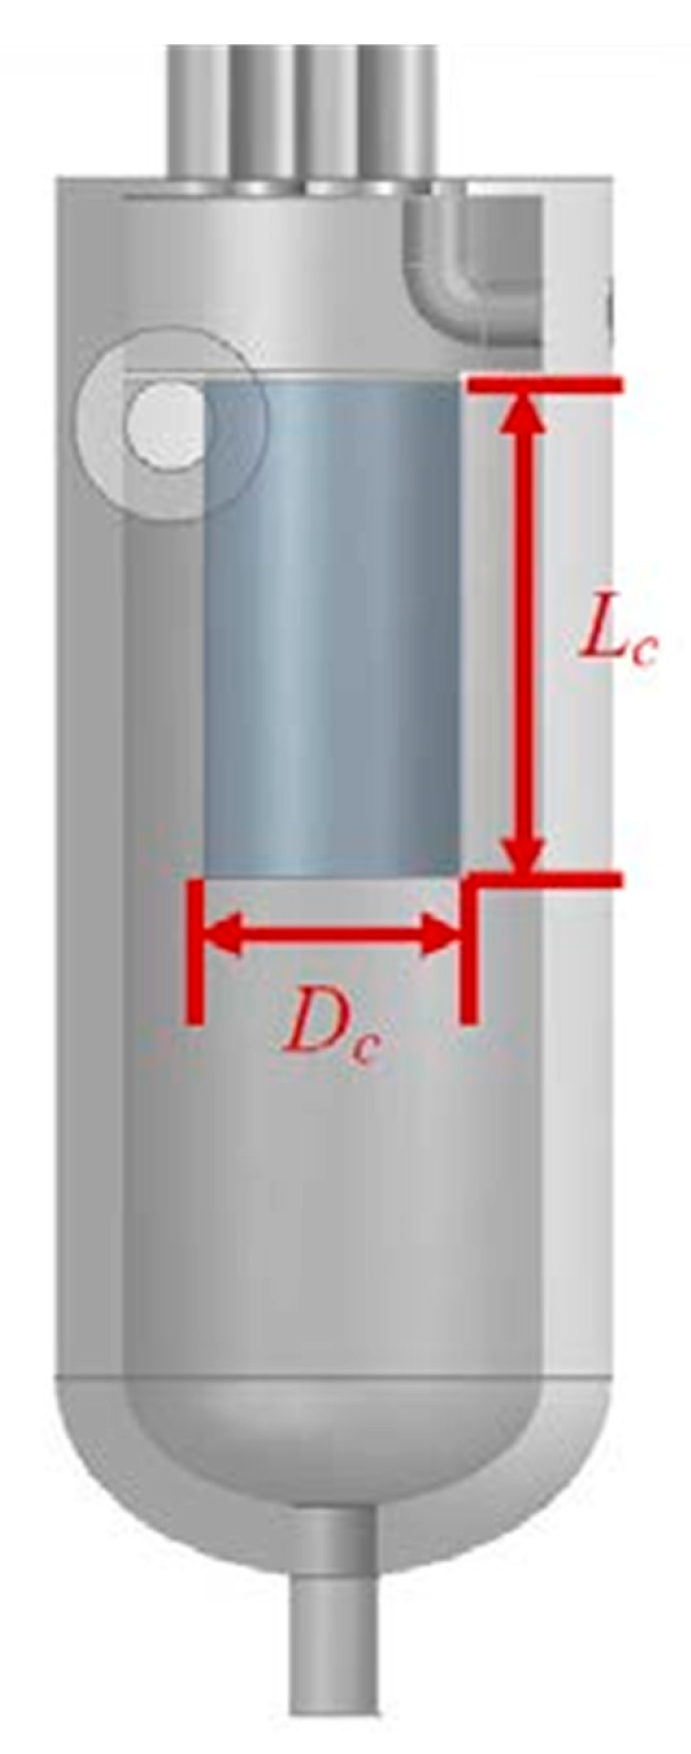
Motivated by the aforementioned research gaps, the present work aims to evaluate the optimized performance of an existing oil–gas separator of a natural gas storage compressor. Analysis of the existing separators, as well as optimized ones (placing baffles, adjusting the separator height and inlet position, and adding an inner cylinder), is conducted to introduce the selection of critical parameters regarding improved structures with the consideration of velocity uniformity in filter inlets. Moreover, the optimized separators are compared based on the analytic hierarchy process to introduce the choice of the more suitable separator optimization method. The novelty of this paper lies in considering the impact of separation chamber structure on the flow field at the filter inlet, as well as providing guidance for selecting optimized separators. This work is relevant for oil–gas separators to improve their separation efficiency and enhance the gas storage performance.

2. Models and Methods

2.1. Physical Model

The physical illustration and model schematic of the existing oil–gas separator used in this study are shown in Figure 1. Note that the model has been subject to reasonable simplifications, i.e., structures with minimal influence on the overall flow have been omitted. The tank is divided into two parts by a baffle placed in the middle. The lower part forms a cylindrical cavity, while the upper structure, as shown on the right in Figure 1a, includes six filter cores arranged on the baffle, and another baffle is placed at the outlet. The oil–gas mixture enters the mechanical separation chamber from the lower inlet of the separator. After separating the larger liquid droplets, the mixture flows into the filters on the baffle. Support short pipes on the baffle are connected to the filter cores, and the gas exits from the side of the filter cores, ultimately leaving from the outlet of the separator. The main dimensions of the physical model are given in Table 1.

2.2. Numerical Model

For viscous and incompressible fluids, the governing equations are given as follows:
Continuity   equation :   u k x k = 0
Momentum   equation :   u i t + u j u i x j = 1 ρ p x i + v 2 u j x i 2 + f i
Note that the heat transfer between fluids and walls has not been considered. Therefore, the energy equation is unnecessary.
The turbulence model can be divided into two forms, i.e., the eddy viscosity model and the Reynolds stress model. In the turbulence eddy viscosity model, it is postulated that the eddy viscosity coefficient, νt, exhibits isotropy, and notable correspondences emerge between impacts of Reynolds stress and the time-averaged flow and viscous stress. This circumstance facilitates the application of a dedicated numerical computation approach for ascertaining the Reynolds stress:
u i u j ¯ = 2 3 δ i j k + 2 ν t s i j ¯
This paper employs the kε model for solving the collision separation structure model. Thus, νt can be obtained as follows:
ν t = C μ k 2 ε
where Cμ is the model coefficient and is typically taken as 0.09. k and ε are solved by their respective transport equations:
k t + u i ¯ k x i = x i C k k 2 ε + ν k x i + P ε
ε t + u i ¯ ε x i = x i C ε k 2 ε + ν ε x i + C ε 1 ε k P C ε 1 ε 2 k
P = ν t u i ¯ x k + u k ¯ x i u i ¯ x k
The values of Ck, Cε, Cε1, and Cε2 are 0.09–0.11, 0.07–0.09, 1.41–1.45, and 1.91–1.92, respectively.
It is noteworthy that the eddy viscosity model is based on the assumption of isotropy for the eddy viscosity coefficient. The Reynolds stress model is more suitable for centrifugal separation structures, owing to the consideration of the effects of swirl, buoyancy, and curvature. Moreover, it does not rely on the definition of the eddy viscosity coefficient. The Reynolds stress is obtained directly by solving the transport equations:
D u i u j ¯ D t = x k C k k 2 ε + ν u i u j ¯ x k + P i j 2 3 δ i j ε C 1 ρ ε k u i u j ¯ 2 3 δ i j k C 2 P i j 2 3 δ i j P
ε t + u i ¯ ε x i = x i C ε k 2 ε + ν ε x i + C ε 1 ε k P C ε 1 ε 2 k
P = ν t u i ¯ x k + u k ¯ x i u i ¯ x k
The values of C1 and C2 are 1.5–2.2 and 0.4–0.5, respectively.
The filter is considered a porous medium. Hence, the porous medium model should be taken into account. For a simple, uniform porous medium, the model can be simplified:
S i = μ α u i + 1 2 C I ρ u j u j
where α is the permeability, and CI is the inertial resistance factor.
In order to simulate the motion of oil droplets, the discrete phase model is utilized. The model utilizes the Euler method to solve for the continuous phase (gas phase) and employs the Lagrange method to solve for the discrete phase. The force balance equation of a droplet is given as follows:
d u p d t = F D u u p + ρ p ρ ρ p g + F a
F D = 18 μ ρ p d p 2 C D R e 24
where Re is the relative Reynolds number of droplets, R e = ρ d p u p u μ ; CD is the drag coefficient, C D = a 1 + a 2 R e + a 3 R e ; Fa is the additional force, such as Saffman lift and virtual mass force.
The adopted droplet collision model was developed by O’Rourke [34]. The algorithm operates under the assumption that two droplets can only collide if they reside in the same continuous-phase cell. While this simplification reduces the computational cost of droplet collision, it does limit the possibility of collisions between droplets that are close but situated in different cells. To mitigate this limitation, the algorithm allows collisions between droplets that are somewhat further apart. The Taylor Analogy Breakup (TAB) model, introduced by Taylor in 1987 [35], was employed for simulating droplet breakup due to its suitability for low Weber number flow conditions.

2.3. Computational Methods

We use ANSYS Fluent software 2021 to solve the model. In order to achieve faster convergence and ensure higher reliability of the results, the PISO coupling method, suitable for unsteady calculations, is chosen. The specific discretization schemes for each equation are detailed in Table 2.
The inlet boundary condition is defined as a velocity inlet. The velocity is 10.3 m/s, according to the existing oil–gas separator. The outlet boundary condition is set as a pressure outlet. The pressure in the outlet is 30 MPa (identical to the inlet pressure) because of the extremely low pressure loss. The turbulence intensity and hydraulic diameter are employed to define the turbulent flow. The wall boundary condition is a no-slip boundary. The trap type is considered as the discrete phase model boundary condition. That is, a droplet is separated from the gas phase as it comes into contact with the wall, and its motion is ceased.
Table 3 lists the corresponding properties of lubricating oil. Note that the oil droplets are assumed to be evenly distributed within the gas. It is obtained that the daily oil injection volume for the compressor lubrication system is 50 L. In addition, the velocity of droplets is also 10.3 m/s, which is the same as that of the separator inlet. Consequently, the oil flow rate is 0.0005 kg/s in this situation.

3. Validation

3.1. Grid Independence Validation

The grid partitioning results for the separator are shown in Figure 2. As can be seen in Figure 2c, local refinement has been applied for the filter due to the significant variations in parameters. In order to prevent calculation errors regarding low grid density and to avoid excessive computational time caused by overly dense grids, grid independence verification is necessary. The relationship between the outlet mass flow rate of the separator and the mesh cells is exhibited in Figure 3. Four different numbers of grids, i.e., 1.79, 2.82, 4.83, and 9.48 million cells, have been thoroughly calculated. It is displayed that the discrepancy between the simulated and actual values of the outlet flow rate is around 6.79% when the number of grids improves from 4.83 million to 9.48 million. Accordingly, a grid density of 4.83 million is selected to save computational time in our work.

3.2. Model Validation

The numerical simulation results are validated by experimental data in the literature [36]. Corresponding comparison results are exhibited in Figure 4. It can be observed that the separation efficiency of both approaches is quite close, with a maximum error of less than 15%. Moreover, the higher the velocity is, the lower the error becomes. Note that the separation efficiency for the experiment is less than that for the simulation. It is because oil droplets collide with the oil film on the inner wall, even at relatively low impact speeds. It can lead to more small-diameter oil droplets.

4. Results and Discussion

4.1. Analysis of Existing Oil–Gas Separator

The simulation results regarding the axial cross-section and inlet for the existing oil–gas separator are shown in Figure 5 and Figure 6, respectively. As can be seen in Figure 5, the oil–gas mixture exhibits a slight upward shift in its velocity direction when it initially enters the mechanical separator. Subsequently, it impacts the wall on the side far from the inlet, with the primary gas stream moving directly upward, exiting the separation chamber. There is no doubt that the mechanical separation efficiency is affected by the inadequate flow distribution, which is attributed to the absence of a guiding device. Figure 6a displays that the velocity of the mixture continually decreases after entering the chamber, and it has notably reduced upon reaching the wall. It is because the airflow disperses in all directions caused by the enhancement in the flow area. Furthermore, it is exhibited in Figure 6b that a small part of the lubricating oil carried by the gas dissipates with the airflow before impacting the wall, which is difficult to separate in the initial separator. Accordingly, improvements to the mechanical separation chamber structure are necessary.
In addition to improving initial separation efficiency, it is essential to pay attention to the variations in velocity uniformity at the filter inlet because the velocity distribution at the filter inlet significantly influences the performance and service life of the filter element, thereby affecting the operation of the entire separator. The standard deviation of velocity (σ) is defined as the judgment criterion of velocity non-uniformity:
σ = i , j C u i j u ¯ N 1
uij is the velocity at (i, j) of the cross-section, u ¯ is the average velocity, and N is the number of samples. Note that the lower the σ, the better the uniformity of the velocity distribution. The result corresponding to velocity in the filter inlet for the existing separator is shown in Figure 7. The velocity non-uniformity is 0.48 m/s. Obviously, the non-uniformity is attributed to the relatively high speed near the wall far from the inlet.

4.2. Optimization Solutions for the Separator

There are two widely used optimization solutions for the separator, i.e., collision and centrifugal separation structure. For collision separation, a baffle is placed at the inlet, which serves as case A in this study. For centrifugal separation, adjusting the inlet position and the cylinder’s height and adding an inner cylinder are considered case B and case C, respectively. Obviously, structural optimization has the potential to improve the separation efficiency of the system but may introduce challenges related to the uniformity of the filter inlet. Therefore, when optimizing the separator, it is crucial to reduce the non-uniformity as much as possible.

4.2.1. Case A

The form of the baffle and the definition of structural parameters are illustrated in Figure 8. The baffle is sealed at both ends and welded to the separator, which constrains the flow direction of the gas and facilitates the circumferential flow along the wall for separation. Due to inertia, oil droplets collide with the baffle and, under the influence of surface tension, coalesce on the surface to form a liquid film. The liquid film gradually accumulates at the bottom of the baffle caused by gravity and then drips into the liquid storage space in the lower part of the separator.
The distance (B), width (Lb), and height (Hb) are normalized by inlet diameter, and the curvature of the baffle (Kb) is normalized by that of the separator ( K = 1 / r sep ) to make results generally applicable: b b = B / d i , l b = L b / d i , h b = H b / d i , and k b = K b / d i . When investigating how bb, lb, hb, and kb values affect the performance of the primary separation chamber, employing the controlled variables method would generate a significant number of combinations. Consequently, an orthogonal experimental design is utilized to select a representative subset of combinations for research, thereby mitigating the workload. The factors and their corresponding levels for this study are presented in Table 4. For this simulation, it is a 4-factor, 4-level study. Hence, an L16 (44) orthogonal array is selected for the experiments. The specific experimental parameters are provided in Table 5.

4.2.2. Case B

In contrast to collision separation, in a cyclone separation structure, the internal airflow spirals along the inner chamber wall, ascending toward the filter inlet. Augmenting the height of the initial separation chamber extends the contact duration between the oil–gas mixture and the chamber wall, thereby heightening droplet separation efficiency. Note that the relative position of the inlet pipe also changes. Therefore, this approach simultaneously investigates the tank height and the inlet position, as shown in Figure 9. Additionally, the cylinder height (He) and the distance between the inlet of the separator and that of the filter (Le) are normalized by separator diameter and cylinder height, respectively. That is, h e = H e / d sep and l e = L e / H e . The effects of he equals 2.81, 3.46, 4.11, and 4.76, and le equals 0.3, 0.5, 0.7, and 0.9, on the separation performance are studied.

4.2.3. Case C

In a cyclone structure separator, the flow path extends by incorporating an inner cylinder. It is realized that welding the inner cylinder directly onto the middle baffle would disrupt the existing structure of the separator, i.e., the filter arrangement and the oil guide pipe position should be changed. Consequently, the welding position of the inner cylinder was adjusted downward to prevent interference with the oil guide pipe, as depicted in Figure 10. Moreover, the impact of the length (Lc) and diameter (Dc) of the inner cylinder on the separation efficiency needs to be investigated. The length is normalized by the separator height: l c = L c / h sep . The diameter is normalized by the separator diameter: d c = D c / d sep . The effects of lc equals 0.5, 0.6, 0.7, and 0.8, and dc equals 0.35, 0.43, 0.52, and 0.61, on the separation performance are discussed.

4.3. Analysis of Optimized Oil–Gas Separators

4.3.1. Effect of the Baffle Parameters

The effect of the baffle on the flow field is demonstrated in Figure 11. Upon entering the separator, the gas immediately impacts the baffle without undergoing any diffusion and subsequently flows out from both sides of the baffle while following the wall. In addition, on the opposite side of the inlet, two streams of gas collide and then reach the central area of the tank at lower velocities. Simultaneously, velocity fluctuations primarily occur between the separator inlet and the baffle, with the velocity distribution in the center chamber area becoming more uniform. As shown in Figure 11b, pressure drop occurs predominantly in the region where the gas collides with the baffle. Figure 12 displays the comparative results of oil mass concentration within the separation chamber. Although the separation efficiency is improved for case A, the oil that passes through the baffle without effective separation is nearly impossible for further separation because the velocity is near the lower limit required for separation.
Orthogonal experimental designs typically use the range analysis method to analyze data. Range analysis determines the optimal levels for each factor by evaluating the average value of the experimental results for each factor at each level. It also assesses the impact of factors on the results by calculating the range value (R) for the average values at different levels of each factor, resulting in the final combination. The effect of baffle parameters on separation efficiency is shown in Figure 13. As displayed in Figure 13a, to achieve the highest separation efficiency, the ideal combination of the four parameters should be bb1, lb4, hb1, and kb1. Based on R values in Figure 13b, the order of the factors’ influence on separation efficiency is as follows: bb > lb > hb > kb. The effect of baffle parameters on pressure drop and velocity non-uniformity is exhibited in Figure 14 and Figure 15, respectively. The situation has undergone a complete transformation. For pressure loss, the best combination is bb3, lb1, hb1, and kb1, and the order of impact for each factor is bb > kb > lb > hb. For velocity non-uniformity, the best combination is bb3, lb4, hb3, and kb2, and the order of impact for each factor is bb = hb > lb > kb.
The optimal combinations obtained from the three criteria are all different. Considering the high precision requirements of the oil–gas separator in the natural gas storage facility and its allowance for higher pressure drop, the primary focus is on achieving the highest separation efficiency. It corresponds to the parameter combination of bb = 0.4, lb = 3, hb = 1.5, and kb = 0.5, excluded from the 16 results in the orthogonal experimental design. Thus, further discussion is necessary.
The results indicate that the separation efficiency of this combination reaches 98.64%, surpassing all the results obtained from the orthogonal experiments. As seen in Figure 16, upon gas impact with the baffle wall, its velocity decreases. However, as the exit area of the baffle is smaller than the inlet area of the separator, the gas flow velocity swiftly increases on both sides of the baffle, occasionally surpassing the separator inlet velocity. This phenomenon also leads to considerable localized pressure losses. At the same time, the overall velocity fluctuation within the separation chamber grows (see Figure 17b). Accordingly, the velocity non-uniformity at the filter inlet has increased, reaching a value of 0.7 m/s.

4.3.2. Effect of the Cylinder Height and Entrance Position

As shown in Figure 18, after the oil–gas mixture enters the separator, it flows approximately a quarter around the tank’s circumference. One of the streams spirals upward to reach the filter inlet. Moreover, another stream spirals downward to reach the bottom of the separation chamber, and then it exits the tank’s surface, converging toward the center. Figure 19 exhibits the flow field for case B. It is evident that both gas velocity and pressure drop exhibit a decreasing trend from the wall toward the center along the radial direction. Simultaneously, due to the rotation and high overall velocity of the gas, oil that has not separated promptly will continue to move alongside the gas near the wall, resulting in a further separation of droplets by centrifugal forces. However, the increase in velocity non-uniformity is observed at the filter inlet, as depicted in Figure 19d. The filter inlets distributed around the periphery display significantly higher velocities than the central filter inlet. Additionally, if the gas spiral rises to the baffle with the velocity direction precisely aligned with a filter inlet, the speed at that location will be significantly higher than at the others, approaching the level at the separator inlet.
The effect of the cylinder height and entrance position on separation efficiency, pressure drop, and velocity non-uniformity is demonstrated in Figure 20. For cyclone structures, once the gas enters the separator, the flow becomes complex, and the interaction between the upper and lower streams leads to a lack of evident regularity. For separation efficiency (Figure 20a), its maximum value is achieved at le = 0.9 and he = 4.11. Furthermore, the optimal he varies for different le. It is found that the pressure drop (Figure 20b) exhibits minimal fluctuation, i.e., the difference between the maximum and minimum values is 2386.1 Pa. Accordingly, the influence of pressure drop is almost disregarded in Case B. For velocity non-uniformity in Case B (Figure 20c), it is displayed that the uniformity (maximum value reaches 2.8 m/s) is significantly larger than in Case A, which is caused by the high-speed rotation near the wall. Moreover, velocity non-uniformity is lower and decreases with the enhancement of le when he is 4.11 and 4.76. The optimal parameters for case B should be le = 0.9 and he = 4.11 because the separation efficiency is highest, and velocity non-uniformity is relatively less in this case.

4.3.3. Effect of the Inner Cylinder Parameters

The path line and the flow field for case C are shown in Figure 21 and Figure 22, respectively. It is observed that the flow is prevented from moving upwards due to the obstruction of the welding plate, which results in a more regular flow path. Additionally, owing to the space between the welding plate and the middle baffle, when the gas flows out of the inner cylinder, there is a sudden expansion in the flow area, causing turbulence that prevents the gas from rotationally entering the filter. It helps improve the velocity distribution at the filter inlet. Note that the pressure drop is increased when the inner cylinder is added, which is attributed to the long flow path, high velocity, and complex structures.
The effect of inner cylinder parameters on separation efficiency, pressure drop, and velocity non-uniformity is demonstrated in Figure 23. Note that the performance is not sensitive to changes in length. As can be seen in Figure 23a, the addition of an inner cylinder further enhances separation efficiency, almost reaching 100%. Moreover, separation efficiency decreases with an increase in inner cylinder length and diameter. Therefore, smaller inner cylinder diameters and heights should be prioritized when considering separation efficiency. For pressure drop (Figure 23b), the situation has changed; namely, the pressure loss average decreases by 51.3% with an increase in inner cylinder diameter. As to velocity non-uniformity ((Figure 23c), it decreases initially with an increase in diameter and then increases. The optimal dimensionless diameter falls within the range of 0.43–0.53. Given the slight change in separation efficiency, lc = 0.5 and dc = 0.52 are appropriate for case C, as both pressure drop and velocity non-uniformity are sufficiently low.

4.4. Comparative Analysis of Optimized Oil–Gas Separators

Although all the optimized structures have improved the performance of the separator, the selection of the best one is still confusing. Accordingly, the analytic hierarchy process [37] is utilized to conduct a comprehensive evaluation of the three schemes. Thus, the optimal solution is obtained. Note that the cost is also one of the crucial factors that need to be considered in oil–gas separation systems. In this study, we quantified the direct costs of different approaches by evaluating the increase in material volume required compared to the existing separator. For the cyclone structure, cost variations resulting from changes in the inlet position have been disregarded.
For gas storage systems, separation efficiency is the most important. The velocity distribution at the filter inlet affects the performance and lifespan of the filter. In this regard, velocity uniformity is considered the second most critical factor. The pressure drop introduced by the initial separation chamber is relatively small in the overall system and does not need to be prioritized. However, one of the characteristics of a gas storage facility is its large working capacity, and the cumulative loss due to pressure drop should not be underestimated. On the other hand, the direct cost of structural improvements is a one-time expense, and the design lifespan of the separator is usually 20 years. Therefore, the importance of direct expenditures should be relatively lower compared to that of the pressure drop. Following the principle of criticality based on the factors in the order of separation efficiency > velocity uniformity > pressure drop> cost, we establish a judgment matrix as shown in Table 6. The normalized matrix and weights are given in Table 7.
The maximum eigenvalue (λmax) obtained is 4.066. The consistency index ( C I = λ max n n 1 , n is the matrix dimensions) equals 0.022. The consistency ratio ( C R = C I R I , RI equals 0.9 when n is 4) equals 0.024 and is less than 0.1. The consistency check has passed. The evaluation criteria for each factor are summarized in Table 8, and the final evaluation results are presented in Table 9. It can be observed that, although case C has a relatively high velocity non-uniformity, it has the highest overall score, reaching 88.46, making it the more optimal choice according to the analytic hierarchy process. Note that the corresponding optimized dimensionless physical parameters for case C are lc = 0.5 and dc = 0.52.

5. Conclusions

In this study, an existing oil–gas separator has been investigated to illustrate the performance of optimized devices with the consideration of velocity uniformity in the filter inlet. Analysis of existing separators, as well as optimized ones, was conducted to introduce the selection of critical parameters regarding improved structures. Moreover, the optimized separators were compared based on the analytic hierarchy process to guide the choice of the more suitable separator optimization method. The main conclusions are summarized as follows:
(1)
The separation efficiency of the existing separator is lower, owing to the sharp decrease in gas velocity within the separation chamber. However, the low velocity causes excellent velocity non-uniformity, i.e., 0.48 m/s.
(2)
For optimized collision separation (case A), the selection of the main parameters of the baffle is difficult based on the orthogonal experimental design due to the totally different sets of parameters for optimal separation efficiency, pressure drop, and velocity uniformity. Considering that separation efficiency is the most crucial factor, bb = 0.4, lb = 3, hb = 1.5, and kb = 0.5 have been considered. The separation efficiency is 98.64%, and the velocity non-uniformity is 0.7 m/s.
(3)
For optimized centrifugal separation (cases B and C), the separation efficiency has been effectively improved. Nevertheless, the velocity uniformity in the filter inlet has been significantly reduced because of the turbulent disturbances caused by the cyclone effect. The maximal velocity non-uniformity reaches 2.8 m/s for the case varying the cylinder height and inlet position. Considering the combined effects of parameter changes on separation efficiency, pressure drop, and velocity uniformity, le = 0.9 and he = 4.11, as well as lc = 0.5 and dc = 0.52, have been taken into account for cases B and C, respectively.
(4)
It is observed that the case of adding an inner cylinder is the more suitable optimized method for the oil–gas separator, according to the analytic hierarchy process. The overall rating for this situation reaches 88.46.

Author Contributions

Conceptualization, X.H. and B.Z.; methodology, Z.P.; software, D.C.; validation, Z.P., D.C. and Z.M.; formal analysis, Z.M.; investigation, W.L.; resources, X.H.; data curation, W.L.; writing—original draft preparation, X.H.; writing—review and editing, B.Z.; supervision, B.Z. All authors have read and agreed to the published version of the manuscript.

Funding

This research was funded by the National Natural Science Foundation of China, grant number 52106054 and China Postdoctoral Science Foundation, grant number 2018M643639.

Data Availability Statement

Data are contained within the article.

Conflicts of Interest

Authors Xiaobo Hu, Zenghui Ma and Wei Liu were employed by the company Hutubi Gas Storage Co., Ltd. The remaining authors declare that the research was conducted in the absence of any commercial or financial relationships that could be construed as a potential conflict of interest.

References

  1. Liang, X.; Ma, H.; Cai, R.; Zhao, K.; Zeng, Z.; Li, H.; Yang, C. Feasibility analysis of natural gas storage in the voids of sediment within salt cavern—A case study in China. Energy 2023, 285, 129340. [Google Scholar] [CrossRef]
  2. Wang, T.; Ao, L.; Wang, B.; Ding, S.; Wang, K.; Yao, F.; Daemen, J.J.K. Tightness of an underground energy storage salt cavern with adverse geological conditions. Energy 2022, 238, 121906. [Google Scholar] [CrossRef]
  3. Yang, C.; Wang, T.; Li, Y.; Yang, H.; Li, J.; Xu, B.; Yan, Y.; Daemen, J.J.K. Feasibility analysis of using abandoned salt caverns for large-scale underground energy storage in China. Appl. Energy 2015, 137, 467–481. [Google Scholar] [CrossRef]
  4. Wang, L.; Liu, B.; Feng, J.; Peng, X. Experimental study on the separation performance of a novel oil–gas cyclone separator. Powder Technol. 2023, 415, 118124. [Google Scholar] [CrossRef]
  5. Zhang, J.; Ge, Z.; Wang, W.; Gong, B.; Li, Y.; Wu, J. The concave-wall jet characteristics in vertical cylinder separator with inlet baffle component. Chin. J. Chem. Eng. 2022, 42, 178–189. [Google Scholar] [CrossRef]
  6. Kolaitis, D.I.; Founti, M.A. Modeling of the gas–particle flow in industrial classification chambers for design optimization. Powder Technol. 2002, 125, 298–305. [Google Scholar] [CrossRef]
  7. Salehi, S.; Afshin, H.; Farhanieh, B. Numerical investigation of the inlet baffle, header geometry, and triangular fins effects on plate-fin heat exchangers performance. Heat Transfer Eng. 2015, 36, 1397–1408. [Google Scholar] [CrossRef]
  8. Panda, S.K.; Buwa, V.V. Effects of geometry and internals of a continuous gravity settler on liquid–liquid separation. Ind. Eng. Chem. Res. 2017, 56, 13929–13944. [Google Scholar] [CrossRef]
  9. Solov’eva, O.; Solov’ev, S.; Yafizov, R.; Ponikarov, S.; Portnov, I.Y. Influence of Design of Baffles in a Gravity-Dynamic Separator Model on Water-Oil Emulsion Separation Efficiency. Chem. Pet. Eng. 2021, 56, 884–888. [Google Scholar] [CrossRef]
  10. Xu, J.; Hrnjak, P. Impinging oil separator for compressors. Int. J. Refrig. 2020, 119, 110–118. [Google Scholar] [CrossRef]
  11. Cortes, C.; Gil, A. Modeling the gas and particle flow inside cyclone separators. Prog. Energy Combust. Sci. 2007, 33, 409–452. [Google Scholar] [CrossRef]
  12. Mokni, I.; Dhaouadi, H.; Bournot, P.; Mhiri, H. Numerical investigation of the effect of the cylindrical height on separation performances of uniflow hydrocyclone. Chem. Eng. Sci. 2015, 122, 500–513. [Google Scholar] [CrossRef]
  13. Brar, L.S.; Sharma, R.; Elsayed, K. The effect of the cyclone length on the performance of Stairmand high-efficiency cyclone. Powder Technol. 2015, 286, 668–677. [Google Scholar] [CrossRef]
  14. Elsayed, K. Optimization of the cyclone separator geometry for minimum pressure drop using Co-Kriging. Powder Technol. 2015, 269, 409–424. [Google Scholar] [CrossRef]
  15. de Souza, F.J.; de Vasconcelos Salvo, R.; de Moro Martins, D. Effects of the gas outlet duct length and shape on the performance of cyclone separators. Sep. Purif. Technol. 2015, 142, 90–100. [Google Scholar] [CrossRef]
  16. Misiulia, D.; Elsayed, K.; Andersson, A.G. Geometry optimization of a deswirler for cyclone separator in terms of pressure drop using CFD and artificial neural network. Sep. Purif. Technol. 2017, 185, 10–23. [Google Scholar] [CrossRef]
  17. Al-Kayiem, H.H.; Osei, H.; Hashim, F.M.; Hamza, J.E. Flow structures and their impact on single and dual inlets hydrocyclone performance for oil–water separation. J. Pet. Explor Prod. Technol. 2019, 9, 2943–2952. [Google Scholar] [CrossRef]
  18. Safikhani, H.; Zamani, J.; Musa, M. Numerical study of flow field in new design cyclone separators with one, two and three tangential inlets. Adv. Powder Technol. 2018, 29, 611–622. [Google Scholar] [CrossRef]
  19. Valdez, J.G.; Pérez, L.D.; Cabello, R.; Blanco, W.A.; Lombano, G.; Segura, J. Experimental Evaluation of a Gas Liquid Axial Cyclone Separator. In Proceedings of the SPE Latin American and Caribbean Petroleum Engineering Conference, Quito, Ecuador, 18–20 November 2015. [Google Scholar]
  20. Matsubayashi, T.; Katono, K.; Hayashi, K.; Tomiyama, A. Effects of swirler shape on swirling annular flow in a gas–liquid separator. Nucl. Eng. Des. 2012, 249, 63–70. [Google Scholar] [CrossRef]
  21. Chang, C.; Ji, Z.; Zeng, F. The effect of a drainage layer on filtration performance of coalescing filters. Sep. Purif. Technol. 2016, 170, 370–376. [Google Scholar] [CrossRef]
  22. Mullins, B.J.; Braddock, R.D.; Agranovski, I.E.; Cropp, R.A.; O’Leary, R.A. Observation and modelling of clamshell droplets on vertical fibres subjected to gravitational and drag forces. J. Colloid Interface Sci. 2005, 284, 245–254. [Google Scholar] [CrossRef]
  23. Mullins, B.J.; Braddock, R.D.; Agranovski, I.E.; Cropp, R.A. Observation and modelling of barrel droplets on vertical fibres subjected to gravitational and drag forces. J. Colloid Interface Sci. 2006, 300, 704–712. [Google Scholar] [CrossRef]
  24. Dawar, S.; Chase, G. Drag correlation for axial motion of drops on fibers. Sep. Purif. Technol. 2008, 60, 6–13. [Google Scholar] [CrossRef]
  25. Dawar, S.; Chase, G. Correlations for transverse motion of liquid drops on fibers. Sep. Purif. Technol. 2010, 72, 282–287. [Google Scholar] [CrossRef]
  26. Yarin, A.; Chase, G.G.; Liu, W.; Doiphode, S.; Reneker, D. Liquid drop growth on a fiber. AIChE J. 2006, 52, 217–227. [Google Scholar] [CrossRef]
  27. Agranovski, I.E.; Myojo, T.; Braddock, R.D.; Jarvis, D. Inclined wettable filter for mist purification. Chem. Eng. J. 2002, 89, 229–238. [Google Scholar] [CrossRef]
  28. Contal, P.; Simao, J.; Thomas, D.; Frising, T.; Callé, S.; Appert-Collin, J.C.; Bémer, D. Clogging of fibre filters by submicron droplets. Phenomena and influence of operating conditions. J. Aerosol Sci. 2004, 35, 263–278. [Google Scholar] [CrossRef]
  29. Charvet, A.; Gonthier, Y.; Bernis, A.; Gonze, E. Filtration of liquid aerosols with a horizontal fibrous filter. Chem. Eng. Res. Des. 2008, 86, 569–576. [Google Scholar] [CrossRef]
  30. Frising, T.; Thomas, D.; Bémer, D.; Contal, P. Clogging of fibrous filters by liquid aerosol particles: Experimental and phenomenological modelling study. Chem. Eng. Sci. 2005, 60, 2751–2762. [Google Scholar] [CrossRef]
  31. Charvet, A.; Gonthier, Y.; Gonze, E.; Bernis, A. Experimental and modelled efficiencies during the filtration of a liquid aerosol with a fibrous medium. Chem. Eng. Sci. 2010, 65, 1875–1886. [Google Scholar] [CrossRef]
  32. Liu, Z.; Ji, Z.; Wu, X.; Ma, H.; Zhao, F.; Hao, Y. Experimental investigation on liquid distribution of filter cartridge during gas-liquid filtration. Sep. Purif. Technol. 2016, 170, 146–154. [Google Scholar] [CrossRef]
  33. Innocentini, M.D.; Tanabe, E.H.; Aguiar, M.L.; Coury, J.R. Filtration of gases at high pressures: Permeation behavior of fiber-based media used for natural gas cleaning. Chem. Eng. Sci. 2012, 74, 38–48. [Google Scholar] [CrossRef]
  34. O’Rouke, P.J. Collective Drop Effects on Vaporizing Liquid Sprays. Ph.D. Thesis, Princeton University, Princeton, NJ, USA, 1981. [Google Scholar]
  35. O’Rourke, P.J.; Amsden, A.A. The TAB Method for Numerical Calculation of Spray Droplet Breakup; SAE Technical Paper; SAE: Warrendale, PA, USA, 1987. [Google Scholar]
  36. Feng, J.; Yang, X.; Gao, X.; Chang, Y. Numerical Simulation and Experiment on Oil-Gas Cyclone Separator. J. Xi’an Jiaotong Univ. 2011, 45, 55–59. [Google Scholar]
  37. Liu, K.; Wang, Y.; Wang, X.; Sun, Z.; Song, Y.; Di, H.; Yan, Q.; Hua, D. Characteristic bands extraction method and prediction of soil nutrient contents based on an analytic hierarchy process. Measurement 2023, 220, 113408. [Google Scholar] [CrossRef]
Figure 1. Physical model: (a) physical illustration and (b) model schematic diagram.
Energies 16 08015 g001
Figure 2. Grids for separator: (a) inlet, (b) support pipes, and (c) filters.
Energies 16 08015 g002
Figure 3. Grid independence validation of separator model.
Energies 16 08015 g003
Figure 4. Model validation for oil–gas separator [34].
Energies 16 08015 g004
Figure 5. Axial velocity contour: (a) inlet axial cross-section and (b) outlet axial cross-section.
Energies 16 08015 g005
Figure 6. Inlet cross-section contour: (a) velocity and (b) oil mass concentration.
Energies 16 08015 g006
Figure 7. Filter inlet velocity contour.
Energies 16 08015 g007
Figure 8. Schematic diagram of the baffle.
Energies 16 08015 g008
Figure 9. Schematic diagram of the inlet position and cylinder height.
Energies 16 08015 g009
Figure 10. Schematic diagram of the position and dimensions of the inner cylinder.
Energies 16 08015 g010
Figure 11. Flow field for case A in inlet cross-section: (a) velocity and (b) pressure.
Energies 16 08015 g011
Figure 12. Oil mass concentration in separation chamber: (a) existing separator and (b) case A.
Energies 16 08015 g012
Figure 13. Effect of baffle parameters on separation efficiency: (a) separation efficiency and (b) range for separation efficiency.
Energies 16 08015 g013
Figure 14. Effect of baffle parameters on pressure drop: (a) pressure drop and (b) range for pressure drop.
Energies 16 08015 g014
Figure 15. Effect of baffle parameters on velocity non-uniformity: (a) velocity non-uniformity and (b) range for velocity non-uniformity.
Energies 16 08015 g015
Figure 16. Flow field for optimal case A in inlet cross-section: (a) velocity and (b) pressure.
Energies 16 08015 g016
Figure 17. Velocity distribution: (a) existing separator, (b) optimal case A, and (c) filter inlet for optimal case A.
Energies 16 08015 g017
Figure 18. Path line diagram for case B.
Energies 16 08015 g018
Figure 19. Flow field for case B: (a) velocity, (b) pressure, (c) oil mass concentration, and (d) filter inlet velocity.
Energies 16 08015 g019
Figure 20. Effect of the cylinder height and entrance position on (a) separation efficiency, (b) pressure drop, and (c) velocity non-uniformity.
Energies 16 08015 g020
Figure 21. Path line diagram for case C.
Energies 16 08015 g021
Figure 22. Flow field for case C: (a) velocity and (b) pressure.
Energies 16 08015 g022
Figure 23. Effect of inner cylinder parameters on (a) separation efficiency, (b) pressure drop, and (c) velocity non-uniformity.
Energies 16 08015 g023
Table 1. Characteristic dimensions of the separator.
Geometrical PropertiesDimension
Inlet diameter, di/mm100
Outlet diameter, do/mm100
Separator radius, rsep/mm462
Mechanical separation chamber height, hmsc/mm1300
Filtration chamber height, hfc/mm1600
Filter height, hf/mm910
Filter radius, rf/mm80
Table 2. Discrete format for physical quantities.
ParameterDiscrete Format
PressurePRESTO
MomentumQUICK
Turbulence energySecond Order Upwind
Turbulent dissipation rateSecond Order Upwind
Table 3. Properties of lubricating oil.
ParameterTypical Value
Boiling point (°C)>315
Flash point (°C)250
Density (kg/m3)877–928
Viscosity at 40 °C (mm2/s)198
Table 4. Factors and levels for baffle dimensions.
LevelFactors
bblbhbkb
10.41.51.50.5
20.6220.75
30.82.52.51
41331.25
Table 5. Orthogonal experimental design.
No.bblbhbkb
10.41.51.50.5
20.4220.75
30.42.52.51
40.4331.25
50.61.521
60.621.51.25
70.62.530.5
80.632.50.75
90.81.52.51.25
100.8231
110.82.51.50.75
120.8320.5
1311.530.75
14122.50.5
1512.521.25
16131.51
Table 6. Importance assessment matrix.
FactorSeparation EfficiencyVelocity UniformityPressure DropCost
Separation efficiency1369
Velocity uniformity1/3145
Pressure drop1/61/412
Cost1/91/51/21
Table 7. Normalized matrix and weights.
FactorSeparation EfficiencyVelocity UniformityPressure DropCostWeight
Separation efficiency0.620.620.520.530.59
Velocity uniformity0.210.220.350.290.27
Pressure drop0.10.060.090.120.09
Cost0.070.040.040.060.05
Table 8. Evaluation criteria for each factor.
FactorCriteria
Separation efficiency η η i 1 η i × 100
Velocity uniformity σ σ i σ i × 100
Pressure drop Δ p Δ p i Δ p × 100
Cost V V i V × 100
Table 9. Final scores for each factor.
FactorWeightCase ACase BCase C
Separation efficiency0.5865082.6194.25100.00
Velocity uniformity0.2683983.7251.1365.16
Pressure drop0.0910630.6090.9878.42
Cost0.0540598.545.5595.91
Final score179.0377.5888.46
Disclaimer/Publisher’s Note: The statements, opinions and data contained in all publications are solely those of the individual author(s) and contributor(s) and not of MDPI and/or the editor(s). MDPI and/or the editor(s) disclaim responsibility for any injury to people or property resulting from any ideas, methods, instructions or products referred to in the content.

