Article

Multi-Objective Co-Operative Game-Based Optimization for Park-Level Integrated Energy System Based on Exergy-Economic Analysis

1
Architectural Design Research Institute of SCUT, South China University of Technology, Guangzhou 510000, China
2
School of Electric Power, South China University of Technology, Guangzhou 510641, China
*
Author to whom correspondence should be addressed.
Energies 2023, 16(24), 7945; https://doi.org/10.3390/en16247945
Submission received: 9 November 2023 / Revised: 2 December 2023 / Accepted: 4 December 2023 / Published: 7 December 2023

Abstract

:
The park-level integrated energy system (PIES) can realize the gradient utilization of energy and improve the efficiency of energy utilization through the coupling between multiple types of energy sub-networks. However, energy analysis and exergy analysis cannot be used to evaluate the economics of PIES. In addition, conflicts of interest among integrated energy suppliers make the economic scheduling of the PIES more difficult. In this paper, we propose a multi-objective collaborative game-based optimization method based on exergy economics, in which the introduction of exergy economics realizes the economic assessment of any link within the PIES, and the optimization model constructed based on the potential game solves the problem of conflict of interest among multiple energy suppliers and improves the benefits of each supplier. Finally, taking a PIES in Guangzhou as an example, the rationality of the optimization scheme proposed in this paper is demonstrated by comparing it with the classical optimization scheme.

1. Introduction

Facing increasingly severe global climate change and the depletion of fossil fuels, the development of renewable energy and the efficient utilization of energy have become the focal points of current research [1]. Compared to a single energy system, a park-level integrated energy system (PIES) can achieve optimal resource allocation through the coordinated complementation between different types of energy subsystems, which has the potential for further cost reduction and efficiency enhancement [2,3]. However, the coupling of energy microgrids also greatly increases the difficulty of PIES modeling and optimization.
Analysis of energy systems is the prerequisite for system modeling and optimization. Currently, the main methods for analyzing energy systems are energy analysis and exergy analysis. The energy analysis method can only evaluate the performance of a system based on the quantity of energy [4]. In contrast, the exergy analysis not only considers the quantity of energy but also takes into account the quality differences among different types of energy, thus reflecting the essence of energy utilization [5,6]. However, both of these analytical methods only focus on the analysis of energy flow and energy efficiency, disregarding the economic characteristics of the system. Therefore, some researchers have linked the dynamic behavior of exergy with economic theory to calculate the energy costs of various components of energy systems and evaluate the economy of the systems. This theoretical framework is known as exergy economics [7,8].
Since the late 1950s, many scholars have conducted in-depth research on the theory of exergy economics [9,10,11]. Initially, exergy economics was primarily used for the economic evaluation of thermodynamic systems [12]. However, with the development of multi-energy coupling networks, an increasing number of scholars have applied them to different energy fields. Wang et al. provided a detailed introduction to the application of exergy analysis and exergy economics as a system evaluation and optimization approach in thermal power plants [13]. Kallio et al. conducted a review on the application of exergy analysis and exergy economics in hybrid renewable energy systems in buildings and concluded that exergy economics is an excellent tool for improving and optimizing hybrid renewable energy systems [14]. Catrini et al. proposed the use of exergy economics as a cost-accounting method in thermal grids and provided a case study of a building cluster interconnected with a thermal grid to confirm the prominent role of exergy economics in the cost analysis of thermal grids [15]. However, all of the above papers focus on a specific system or scenario within the energy domain, and the models used are too detailed and cumbersome to be generalizable. Mo et al. established a unified PIES analytical model based on exergy analysis and exergy economics and proposed a PIES analytical evaluation method based on the unification that integrates exergy efficiency and economy [16]. However, the study only dealt with the analysis and evaluation of PIES and did not apply them to the system’s optimal scheduling. And most of the existing studies on PIES system optimal scheduling rely on energy-based cost calculation methods for the analysis of system economy [17,18,19]. It can be seen that the optimization of PIES based on exergy economics is still relatively scarce and needs further research.
With the rapid development of the energy market, game theory is being gradually introduced to solve the issues of cooperation and conflicts among multiple energy supply entities in the energy dispatch process. Based on whether participants form alliances in the study, the research can be divided into co-operative games and non-co-operative games [20]. Co-operative game theory explores how participants form alliances to obtain additional benefits and how these benefits are distributed among the members. The literature [21,22,23,24] had established an energy producer–consumer alliance based on co-operative game theory, aiming to maximize the interests of the alliance. By utilizing the Nucleolus method or Shapley value method, the additional revenue is reasonably distributed among the members of the alliance. The non-co-operative game theory focuses on studying the process of balancing the interests of multiple participants with conflicting objectives. Li et al. developed a Stackelberg game optimization model for an integrated energy system containing multiple communities, which reconciled the conflicting interests between the system and the communities and improved the overall economic efficiency [25]. Chen et al. divided the integrated energy park into different sub-districts according to certain rules and established a two-layer optimal scheduling model based on the Stackelberg game theory to balance the interests between the park as a whole and the different sub-districts within it [26]. Xiong et al. constructed a two-layer game framework where the upper layer establishes a Stackelberg game between microgrid clusters and microgrid aggregators and the lower layer establishes a co-operative game between microgrid clusters, which ultimately improves the benefits of microgrid clusters [27]. In the above study, the model based on co-operative games prioritizes the interests of the coalition, which cannot give full play to the autonomy and self-interest of the participants. The non-co-operative game model based on the Stackelberg game divides the participants into master and subordinate, which makes it difficult to describe the real situation of a complex integrated energy system with multiple participants, and the status of the participants is unequal, with the master taking the information advantage. In contrast, the non-co-operative game model based on the potential game does not have a master–slave relationship, allowing multiple parties to participate with symmetric information. This makes it fair [28]. Zeng et al. applied potential game theory for modeling optimization to solve the economic dispatch and real-time reconfiguration problems in microgrids [29]. However, the study was limited to microgrids and not applied to integrated energy systems. In order to make up for the shortcomings of the existing studies, it is necessary to apply the potential game theory to the modeling and optimization process of PIES in order to describe the problem of conflict of interest between different types of participants in fair competition in PIES.
Considering the above situation, this paper constructs a PIES optimization model based on exergy analysis and exergy economics, utilizing a multi-agent collaborative game approach. First, the problem of calculating the benefits of different types of energy suppliers in different segments of the PIES is solved using an energy pricing and cost allocation scheme based on exergy economics. Then, based on the potential game theory, a distributed multi-subject collaborative game optimization model is constructed, and the equipment modeling and day-ahead optimization are carried out with a PIES in Guangzhou as an example, which proves the feasibility of the optimization scheme. On this basis, the link between the system’s exergy efficiency and economy is further investigated by incorporating system exergy efficiency into the optimization objective. The main contributions of this paper are as follows:
(a)
By utilizing the cost calculation method based on exergy economics, the precise calculation of energy costs for any link and any energy type within the system has been achieved;
(b)
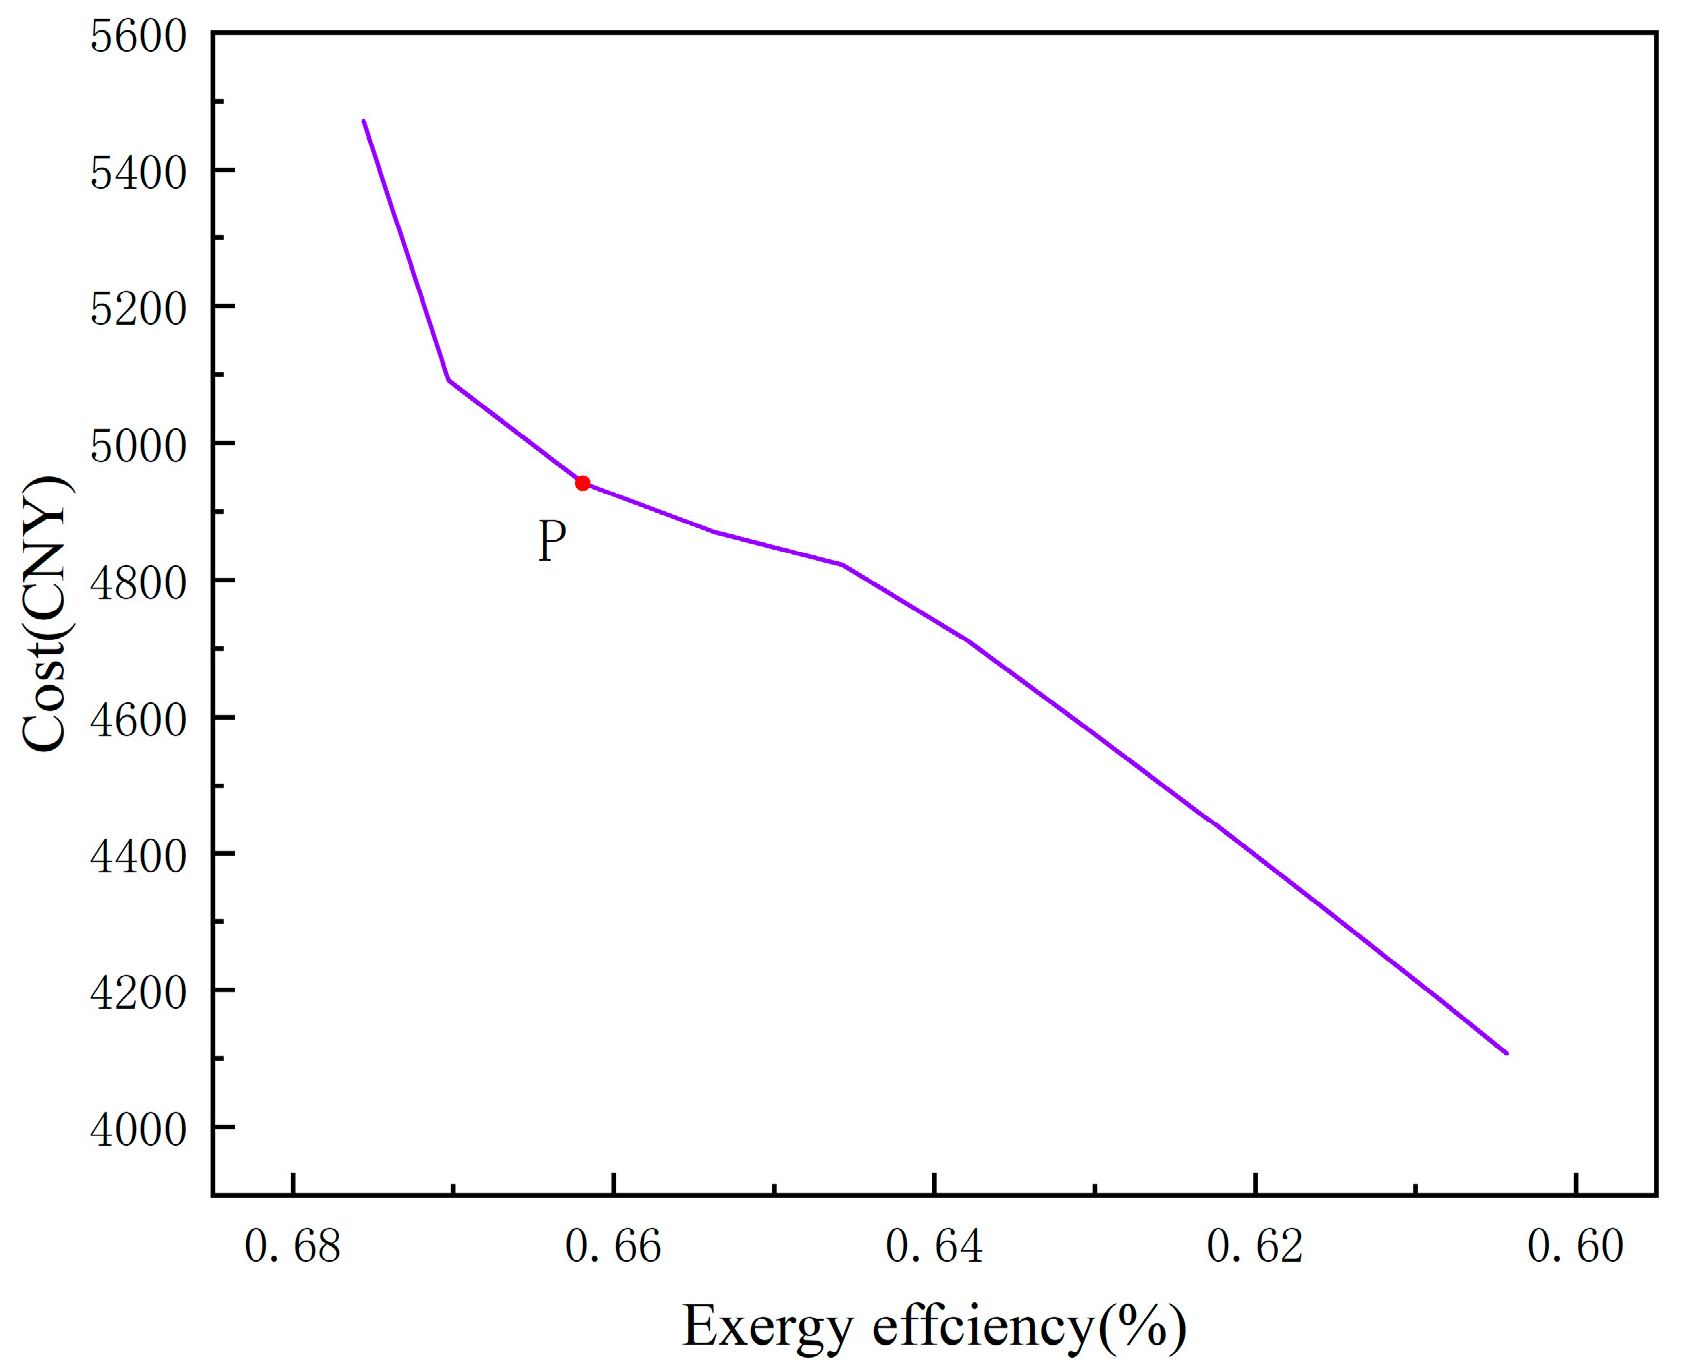
Taking into account the quality and quantity of energy, a system optimization scheduling plan considering exergy efficiency and exergy economy is proposed, and the relationship between system exergy efficiency and exergy economy in optimization is studied;
(c)
Considering the autonomy and self-interest of the main energy supply entities in the integrated energy system, a multi-agent distributed optimization model for the PIES is established based on the game theory of potential.

2. Exergy Analysis and Complete Potential Game Theory

In the past, researchers mainly used the energy analysis method developed based on the first law of thermodynamics to analyze and evaluate energy systems. This method measures the value of energy based on its quantity. However, the integrated energy system is composed of multiple energy subsystems that are interconnected, where the value of energy not only depends on its quantity but also on its type. The energy analysis method can only reflect the value of energy from the perspective of energy quantity and does not consider the variation in energy quality. Therefore, an increasing number of scholars have recognized the concept of “exergy”, developed based on the second law of thermodynamics, as a new metric for energy value and have developed exergy-based system analysis and evaluation methods, collectively referred to as exergy analysis. Exergy analysis can measure the changes in the actual value of energy caused by variations in both quantity and quality, providing more comprehensive and accurate indicators for the evaluation of integrated energy systems.

2.1. Exergy Analysis

2.1.1. Exergy and Exergy Factor

The concept of “exergy” is a physical quantity defined as the portion of energy that can theoretically be converted into useful work when a system reaches equilibrium with the environment [30]. The direct calculation of exergy is highly complex, so for convenience, the concept of the exergy factor is introduced. The exergy factor is defined as the proportion of exergy to energy in a given energy source, denoted as λ [31].
λ = E x E n
The calculation method of stoichiometric coefficients is related to the type of energy and the process of energy transfer and conversion. The stoichiometric coefficients for electrical energy and mechanical energy are both 1. The calculation method for stoichiometric coefficients of other energy types and processes mentioned in this article is as follows:
  • Thermal Energy [32]:
    λ = 1 T 0 T h w , in T h w , out ln T h w , in T h w , out
    where T 0 , T h w , in and T h w , out represent the environment temperature, the inlet temperature of the hot water, and the outlet temperature of the hot water, respectively;
  • Clod Energy [32]:
    λ = T h s , h T h s , l 1
    where T h s , h and T h s , l represent the temperature of the high-temperature heat source and the temperature of the low-temperature heat source, respectively;
  • Chemical Energy [32]:
    λ = 1 T 0 T b u r n T 0 ln T b u r n T 0
    where T b u r n represents the temperature of fuel combustion.

2.1.2. Exergy Loss and Exergy Efficiency

Exergy loss and exergy efficiency are both energy efficiency evaluation indicators based on exergy [8]. In this case, exergy loss represents the difference between the total input exergy flow and the total output exergy flow, while exergy efficiency represents the percentage of the total output exergy flow to the total input exergy flow. The mathematical expressions are as in Equations (5) and (6):
E x l o s s = E x i n E x o u t
η E x = E x o u t E x i n × 100 %
where E x i n represents the input exergy flow of the system, E x o u t represents the output exergy flow of the system, E x l o s s represents the exergy loss of the system, and η E x represents the exergy efficiency of the system.

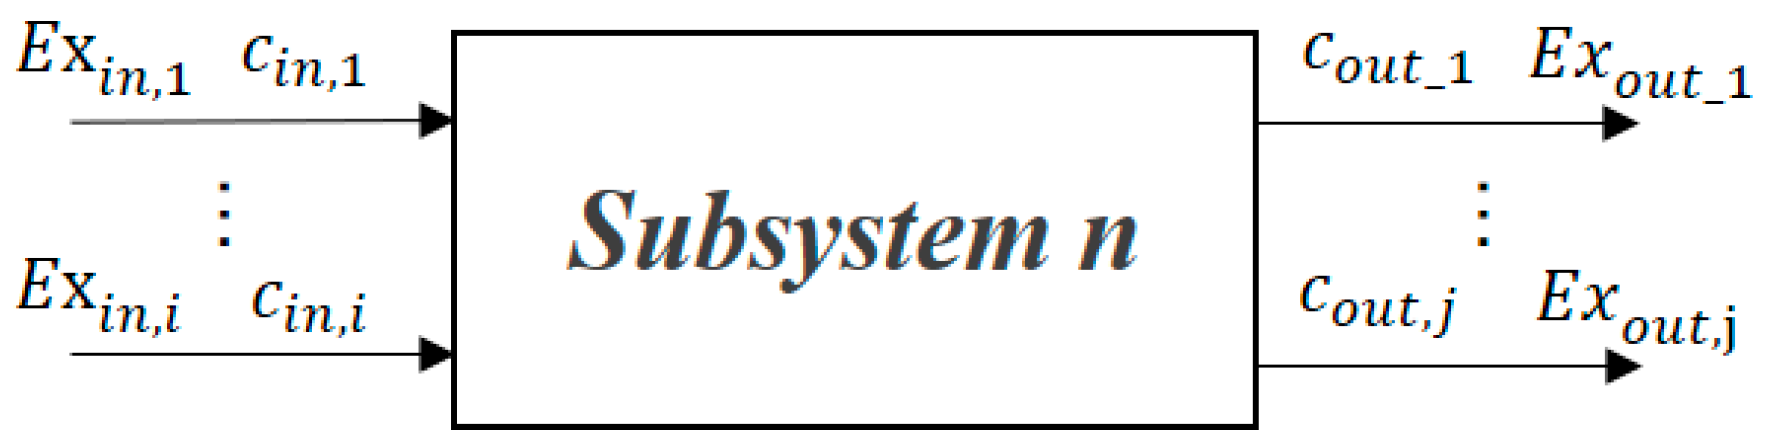
2.1.3. Cost Calculation Model of Exergy Flow Based on Exergy Economics Theory

Exergy economics theory is a set of system economic analysis and evaluation approaches based on exergy, which is used in this paper to determine the value of exergy flows within a system. The calculation model includes the cost balance Equation (7) and the cost allocation Equation (8).
The cost balance equation is constructed based on the subsystem model. A single device or a collection of multiple devices within the system can be viewed as a subsystem. The subsystem model is shown in Figure 1.
Where E x i n , i represents the ith type of input exergy flow in the subsystem n, c i n , i represents the unit exergy cost of input flow i in terms of economic value, E x o u t , j represents the jth type of output exergy flow in the subsystem, and c o u t , j represents the unit exergy cost of output flow j in terms of economic value.
The cost balance equation for subsystem n is as follows in Equation (7):
i = 1 I E x i n , i c i n , i + Z n = j = 1 J E x o u t , j c o u t , j
where Zn represents the non-energy cost per unit time of the subsystem, reflecting the equipment cost and operational maintenance expenses of the subsystem.
Considering that the subsystem may have multiple output exergy flows, this paper adopts a cost allocation method based on exergy factors in order to allocate the costs of different exergy flows appropriately.
c o u t , 1 λ 1 = c o u t , 2 λ 2 = = c o u t , j λ j

2.2. Complete Potential Game Theory

Game theory is the process in which the involved parties, under certain constraints, continuously adjust their strategies based on the information they possess to maximize their own benefits. Three fundamental elements exist in a game: players (N), strategies ({Si}, iN), and payoff functions ({pi}, iN). In a game, if the payoff of each player can be mapped proportionally to a global function with changing strategies, i.e., the global function U, it satisfies the following:
U S i , S i U S i , S i = p i S i , S i p i S i , S i
The function U, satisfying the given conditions, is referred to as the potential function of the game, and the game itself is called a complete potential game. Complete potential games belong to potential games and possess three properties [33]:
  • Property 1: Every finite potential game has a pure strategy Nash equilibrium solution;
  • Property 2: Every finite potential game has a finite improvement property;
  • Property 3: When the potential function converges to its optimum, the payoff functions of the players also converge to their respective optima.
Based on these properties, it can be concluded that if a mathematical optimization model is constructed within the framework of potential games, it will inevitably have a Nash equilibrium solution. Convergence is an inherent property of potential game models. According to Property 3, profit functions can be established for each energy supply entity in an integrated energy system. By constructing an optimization decision model with the overall benefit of the integrated energy system as the potential function, the Nash equilibrium solution that optimizes the overall system benefit and the benefits of individual energy supply entities can be obtained by solving the model.

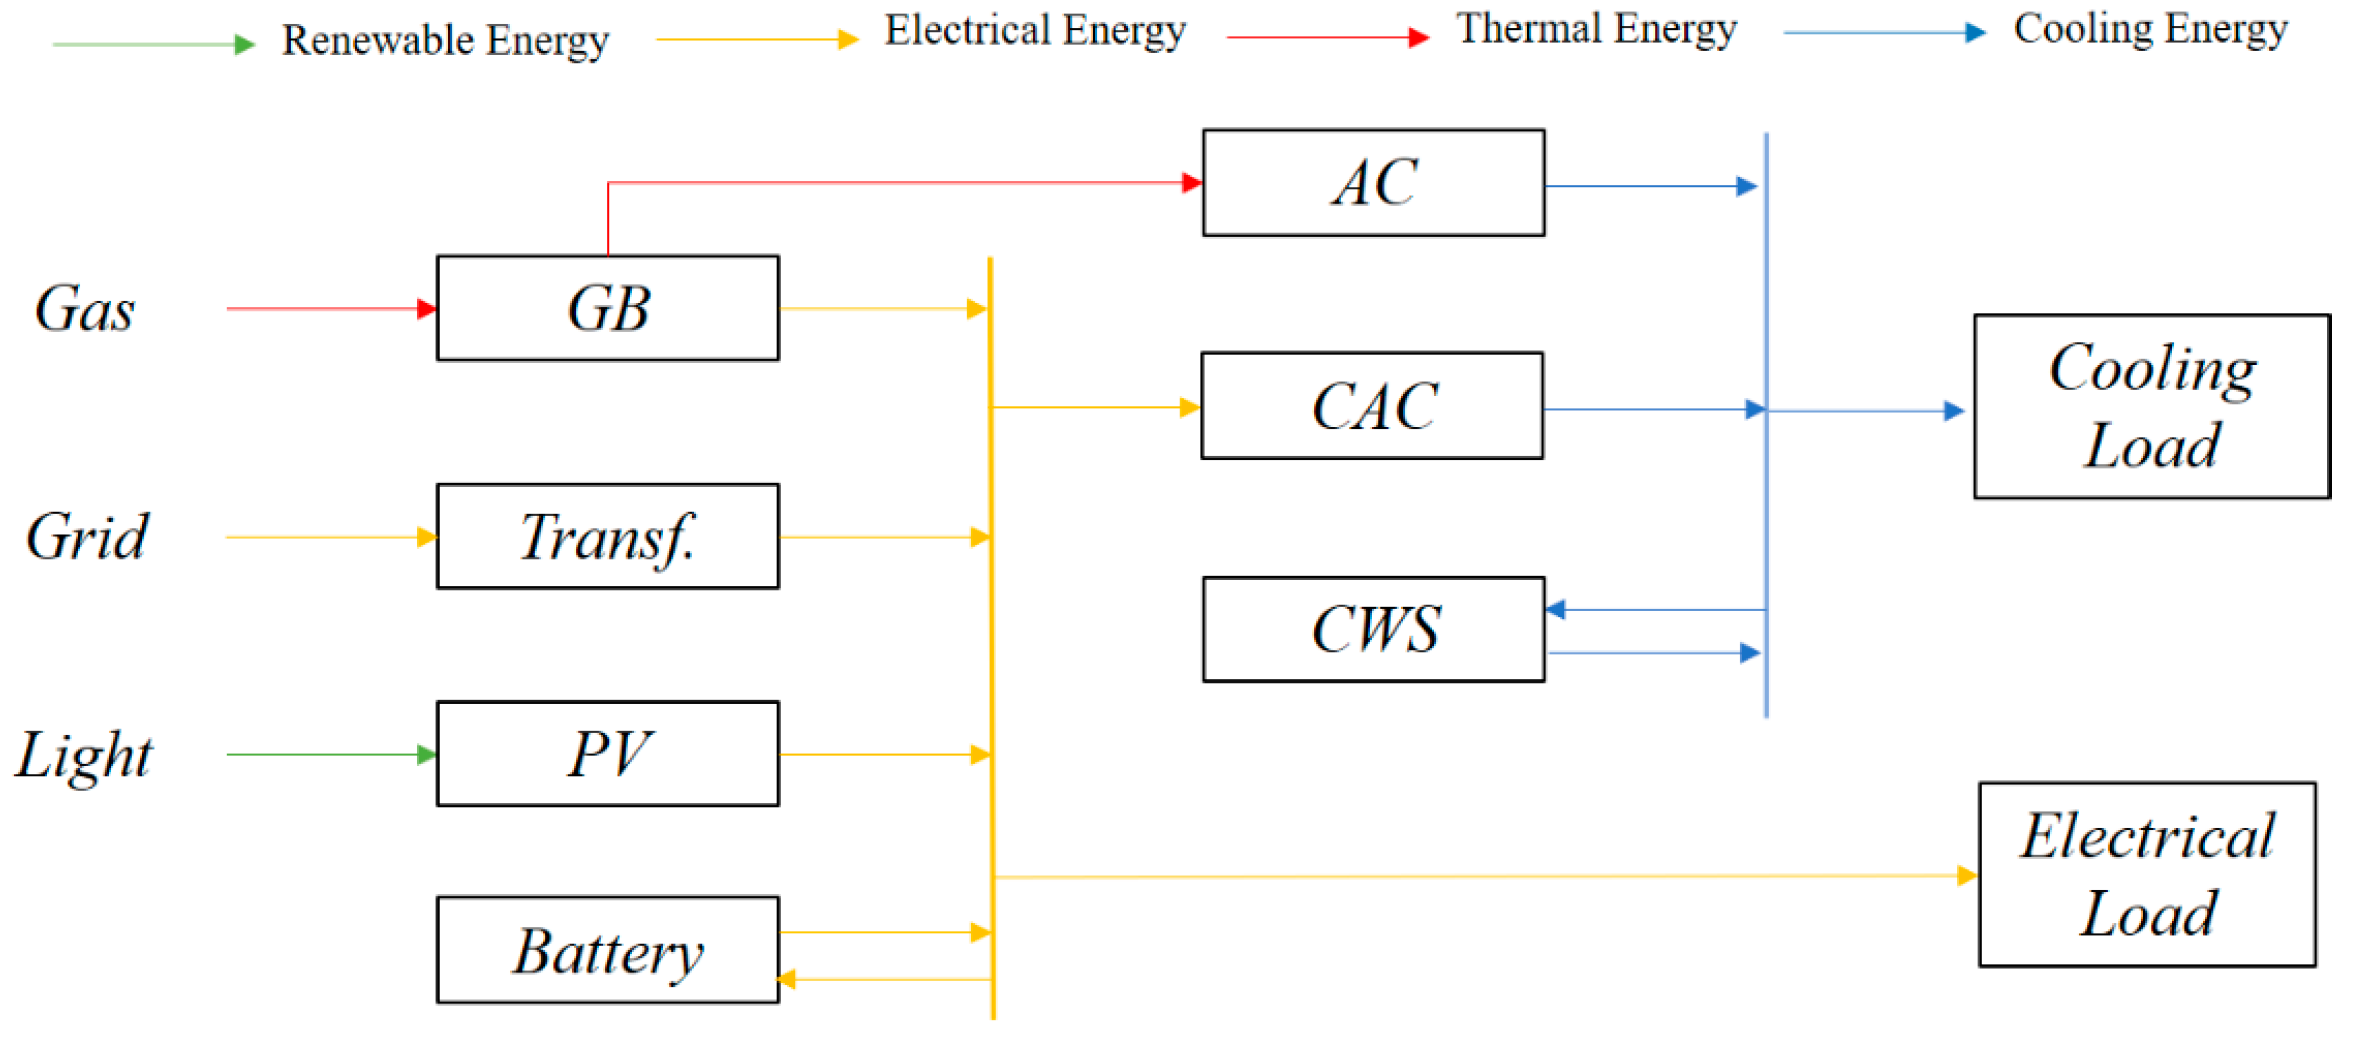
3. Description and Modeling of PIES

3.1. Equipment Models and Constraints

The study in this paper focuses on the park-level integrated energy system, as shown in Figure 2. The system consists of three energy supply devices: photovoltaic (PV) panels, gas turbines (GT), and transformers (T); two energy conversion devices: absorption chiller units (AC) and central air conditioning (CAC); and two energy storage devices: batteries (B) and chilled water storage (CWS).

3.1.1. Photovoltaic

PV panels absorb solar energy and convert it into electricity, providing clean power for the system. The power generated via PVs is related to the area of solar panels and solar radiation intensity [34].
P P V t = η P V S P V ϕ P V t
where P P V t represents the output power of PVs at time t, η P V is the efficiency of the PV panels, S P V is the area of the solar panels, and ϕ P V t is the solar irradiance per unit area at time t.
The input power of PVs should satisfy the following constraint:
0 P P V t P P V , m a x
where P P V , m a x is the installed capacity of PVs.

3.1.2. Gas Turbine

The gas turbine consumes natural gas to generate electricity and heat, ensuring the power–heat balance for the system [35].
P G T , G a s t = L H V × M G t 3600
P G T , E t = P G T , G t × η G T , E
P G T , H t = P G T , G t × η G T , H
where P G T , G t represents the thermal input power of the gas turbine at time t, LHV is the lower heating value of natural gas, M G t is the consumption of natural gas at time t, 3600 is the thermal equivalence of electricity, P G T , E t and P G T , G a s t represent the electrical power and heat power output of the gas turbine at time t, η G T , E and η G T , H represent the electric and heat efficiency of the gas turbine.
The input power of the gas turbine should satisfy the following constraint:
0 P G T , G a s t P G T , m a x
where P G T , m a x is the rated power of the gas turbine.

3.1.3. Transformer

The transformer transmits electric power from the main grid to ensure the power supply–demand balance for the system.
P T , i n t = P T , o u t t × η E T
where P T , i n t and P T , o u t t represent the input and output power of the transformer at time t, and η E T is the efficiency of the transformer.
The input power of the transformer should satisfy the following constraint:
0 P T , G a s t P T , m a x
where P T , m a x is the rated power of the transformer.

3.1.4. Absorption Chiller Units

The absorption chiller units absorb waste heat from the gas turbines and convert it into cooling energy.
P A C , C t = P A C , H t × η A C
where P A C , C t and P A C , H t represent the input heat power and cooling power of the absorption chiller units at time t, and η A C is the cooling efficiency.
The input power of the absorption chiller units should satisfy the following constraint:
0 P A C , H t P A C , m a x
where P A C , m a x is the rated power of the absorption chiller units.

3.1.5. Central Air Conditioning

The central air conditioning system converts electricity into cooling energy [36].
P C A C , C t = P C A C , E t × C O P C A C
where P C A C , E t and P C A C , C t represent the input electrical power and cooling power of the central air conditioning system at time t, and C O P C A C is the cooling efficiency of the central air conditioning.
The input power of the central air conditioning system should satisfy the following constraint:
0 P C A C , H t P C A C , m a x
where P C A C , m a x is the rated power of the central air conditioning.

3.1.6. Batteries

Batteries are used to store excess energy generated by renewable sources and low-cost electricity during off-peak hours and discharge it during peak hours. This helps reduce the waste of renewable energy and lower energy costs. The basic model of the battery is as follows [37]:
S O C B t = S O C B t 1 + B t P B , c t η B , c 1 B t P B , d t η B , d
S O C B , m i n S O C B t S O C B , m a x
where P B , c t and P B , d t represent the charging and discharging power of the battery in the time period t, respectively. η B , c and η B , d represent the charging and discharging efficiency of the battery, respectively. B(t) is a binary variable that indicates the state of charge of the battery in the time period t, with 1 representing charging and 0 representing discharging. S O C B , m i n and S O C B , m a x represent the lower and upper limits of the battery capacity, respectively.
It is commonly specified that the charging and discharging power of the battery within a unit time should not exceed 20% of the rated capacity.
0 P B , c t , P B , d t 20 % S O C B , m a x
In order to ensure the reuse of the battery, the charging and discharging power of the battery within one cycle must satisfy the following constraint:
t = 1 T P B , c t × η B , c = t = 1 T P B , d t / η B , d

3.1.7. Chilled Water Storage

Chilled water storage has the same function as electrical energy storage, but it has a lower unit cost and usually a larger equipment capacity. The model of CWS is as follows [37]:
S C W S t = S C W S t 1 1 σ C W S + B t P C W S , c t η B , c 1 B t P C W S , d t η C W S , d
t = 1 T P C W S , c t × η C W S , c = t = 1 T P C W S , d t / η C W S , d
0 P B , c t , P B , d t 20 % S O C C W S , m a x
S O C C S T , m i n S O C C S T t S O C C S T , m a x
where P C W S , c t and P C W S , d t represent the charging and discharging power of the CWS in the time period t, respectively. η C W S , c and η C W S , d represent the charging and discharging efficiency of the CWS, respectively. B(t) is a binary variable that indicates the state of charge of the CWS in the time period t, with 1 representing charging and 0 representing discharging. S O C C W S , m i n and S O C C W S , m a x represent the lower and upper limits of the battery capacity, respectively.

3.2. Co-Operative Game Optimization Model

Under the premise of determining the system model, environmental parameters, and load conditions, the energy input of the system determines the energy flow distribution and various evaluation indicators within the system. Therefore, this paper selects various types of energy supply devices in the system as the optimization subjects and determines renewable energy, energy storage, and energy supply as the three game players based on the characteristics of energy supply devices.

3.2.1. Renewable Energy Player

The renewable energy player consists of renewable energy generation devices such as photovoltaic and wind power in the system. From the perspective of system economics, the energy supply from the renewable energy player can reduce the energy cost expenditure and improve the system’s economic performance. From the perspective of system loss, the system loss generated by using renewable energy is only a part of the total loss compared to the loss caused by wind and solar power curtailment. Based on the above analysis, the optimization of the renewable energy player should maximize the output of renewable energy devices. In this paper, an optimization model for the renewable energy player is established from the perspective of reducing the system’s energy cost expenditure.
Optimization variables: P R E n t and the coupled system energy flow with P R E n t
Optimization objective:
m i n C R E = t = 1 T c E t n = 1 N P R E n t
Constraints: system equipment constraints, as described in Section 3.1.
Here, P R E n t represents the input power of renewable energy device n at time t, and c E t represents the time-of-use electricity price at time t.

3.2.2. Energy Storage Player

The energy storage player consists of energy storage devices such as batteries and water storage cooling in the system. From the perspective of system economics, energy storage can reduce the system’s energy procurement cost by storing energy during periods of low electricity prices and supplying it during periods of high electricity prices. From the perspective of system loss, storing surplus energy from renewable sources in energy storage can reduce curtailment and system losses. However, when storing energy from the energy supply side, there will be losses due to the charging and discharging processes. Based on the above analysis, the optimization of the energy storage player should encourage the storage of surplus energy from renewable sources and also consider the trade-off between system loss and economic performance. In this paper, the optimization of energy storage loss is achieved through game between the energy storage player and the energy supply player. Therefore, the optimization objective of the energy storage player only needs to consider its contribution to the system’s economic performance.
Optimization variables: P E S , C n t , P E S , D n t , and the coupled system energy flow with P E S , D n t .
Optimization objective:
m i n C R E = t = 1 T c n t λ n n = 1 N P E S , c n t P E S , c n t
Constraints: system equipment constraints, as described in Section 3.1.
Here, P E S , c n t and P E S , d n t represent the charging and discharging power of the energy storage device n at time t, λ n is the energy quality coefficient of energy flow in the energy storage system, and c n t is the unit economic cost of energy loss in the energy storage system. The unit economic cost c n t of energy storage charging and discharging in different time periods is calculated based on the grid as the energy supply source. In the calculation, the discharging cost is taken as the unit economic cost of the same type of load under grid supply. This approach utilizes time-of-use electricity prices to guide energy storage behavior.

3.2.3. Energy Supply Player

The energy supply player consists of energy supply devices connected to the main grid, such as gas turbines and transformers. Energy supply devices are necessary for balancing system supply and demand when other energy supply methods are insufficient. Therefore, the optimization for the energy supply player is not a matter of whether to use it or not, but how to use it. In this paper, the energy supply player optimizes towards the direction of economic performance and system loss optimization. Specifically, the optimization is aimed at achieving the optimal economic performance of the system while limiting system exergy losses.
Optimization variables: P E A , E n t , P E A , G n t , and the coupled system energy flow with P E A , E n t   and P E A , G n t .
Optimization objective:
m i n C E A = t = 1 T n = 1 N ( P E A , E n t c E t + P E A , G n t c G )
Constraints: system equipment constraints and system loss constraint, where the system loss constraint is as follows:
E x E A , l o s s + E x E S , l o s s E x l o s s , m a x
where, P E A , E n t and P E A , G n t represent the power consumption of energy supply equipment n in time period t for electricity and natural gas, respectively. c G is the price of natural gas. E x E A , l o s s is the system exergy loss obtained after optimization in the agency of energy supply, E x E S , l o s s is the exergy loss in the energy storage device, and E x l o s s , m a x is the defined limit for system exergy losses.

3.2.4. Penalty Functions

During the real-time scheduling phase, the power output strategies of each agency not only need to satisfy the device constraints but also the load constraints for system supply–demand balance. The load constraints can be expressed as follows:
E x U B , E t + E x U B , H t + E x U B , C t = 0 E x U B , E t = E x S p , E t E x l o a d , E t E x E S , E t E x U B , H t = E x S p , H t E x l o a d , H t E x E S , H t E x U B , C t = E x S p , C t E x l o a d , C t E x E S , C t
where E x U B , E t , E x U B , H t , and E x U B , C t represent the imbalance amount of electricity, heat, and cold in time period t, respectively. E x S p , E t , E x S p , H t , and E x S p , C t represent the supply amount of electricity, heat, and cold in time period t, respectively. E x l o a d , E t ,   E x l o a d , H t , and E x l o a d , H t are the electricity, heat, and cold load in time period t, respectively. E x E S , E t , E x E S , H t , and E x E S , C t represent the energy loss in electricity storage, heat storage, and cold storage, respectively.
A penalty function method is used to handle the global constraints.
f 1 = t = 1 T E x U B , E t + E x U B , H t + E x U B , C t 2
f 2 = t = 1 T E x U B , E t + E x U B , H t + E x U B , C t 2
where f1 reflects the sum of the imbalance amounts of the system for each time period, and f2 reflects the sum of the imbalance amounts of the system for a complete cycle. The penalty function f2 is used to adjust the output of the energy storage device when the system energy losses are fully utilized but the system energy imbalance still exists. In this case, when the energy storage agency needs to reduce the total amount of energy storage to decrease system energy losses, the energy imbalance in the related time periods in penalty function f1 increases, hindering the optimization behavior of energy storage. However, the penalty function f2 considers the total amount of system energy imbalance. When energy storage reduces its own charging and discharging, the energy originally intended for storage is considered to be directly supplied to the load in terms of the total amount. Since there is less energy storage loss, the energy supplied directly to the load exceeds the energy supplied by energy storage, thus reducing the total amount of system energy imbalance and the value of penalty function f2, thereby justifying the optimization behavior of energy storage. By adding the penalty functions to the optimization objectives of the agencies, the utility functions of the agencies can be obtained as Equations (37)–(39):
Renewable Energy Player:
U 1 = C R E + M 1 f 1
Energy Storage Player:
U 2 = C E S + M 1 f 1 + M 2 f 2
Energy Supply Player:
U 3 = C E A + M 1 f 1 + M 2 f 2

3.3. Potential Function

To ensure the feasibility of the constructed potential game model, a potential function is constructed:
F = U i
Based on the definition of a complete potential game, the existence of an equilibrium solution is proven.
F S = F S i , S i = U i + j , j i I U j
Δ F = F S i * , S i F S i , S i = U i * + j , j i I U j U i + j , j i I U j = U i * U i
Δ U = U i * S i * , S i U i S i , S i = U i * U i
Δ F = Δ U

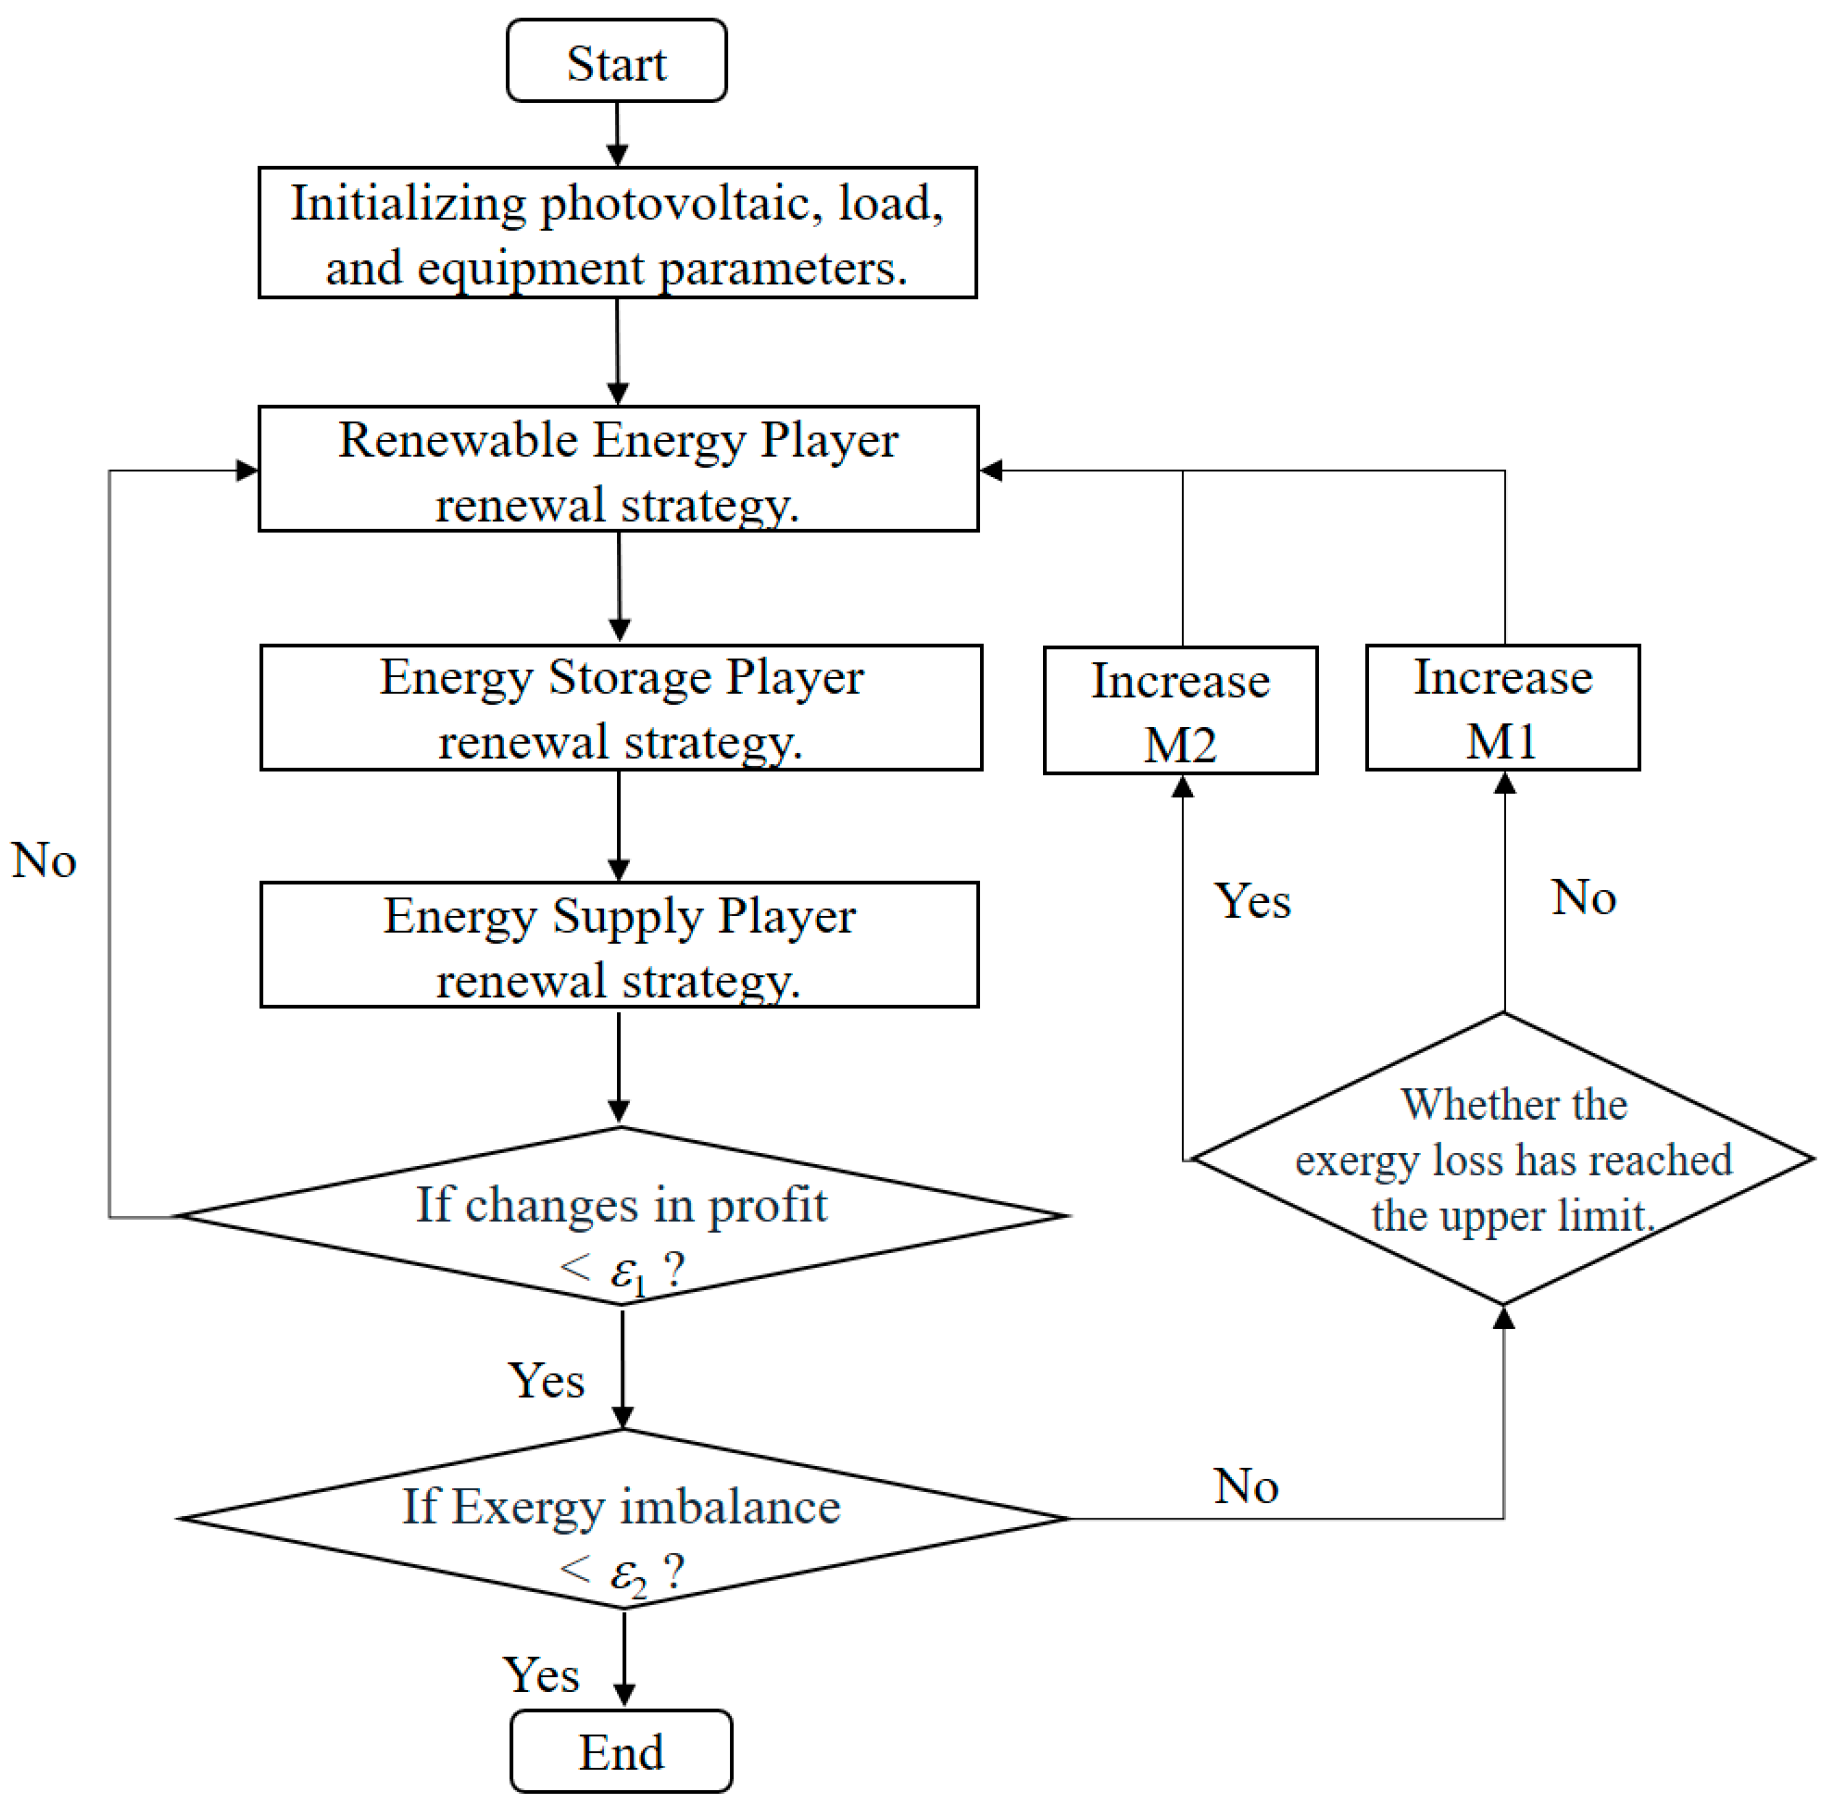
4. Co-Operative Game Optimization Algorithm

As a special type of imperfect information-dynamic game, the potential game allows each player to sequentially update their strategies during the game. This paper aims to improve the economic efficiency and energy efficiency of the system. The renewable energy agency gives priority to receiving strategies from other agencies and simultaneously searches for the optimal strategy within the strategy space and updates its strategy. Then, the energy storage agency receives the latest strategies from other agencies and updates its own output strategy to meet the load requirements. The energy supply agency serves as a backup power source to address insufficient renewable energy output, and thus it is updated last. This updating sequence is repeated until both Nash equilibrium and power balance conditions are satisfied, thereby ending the strategy updating process. The specific optimization process in this paper is as follows:
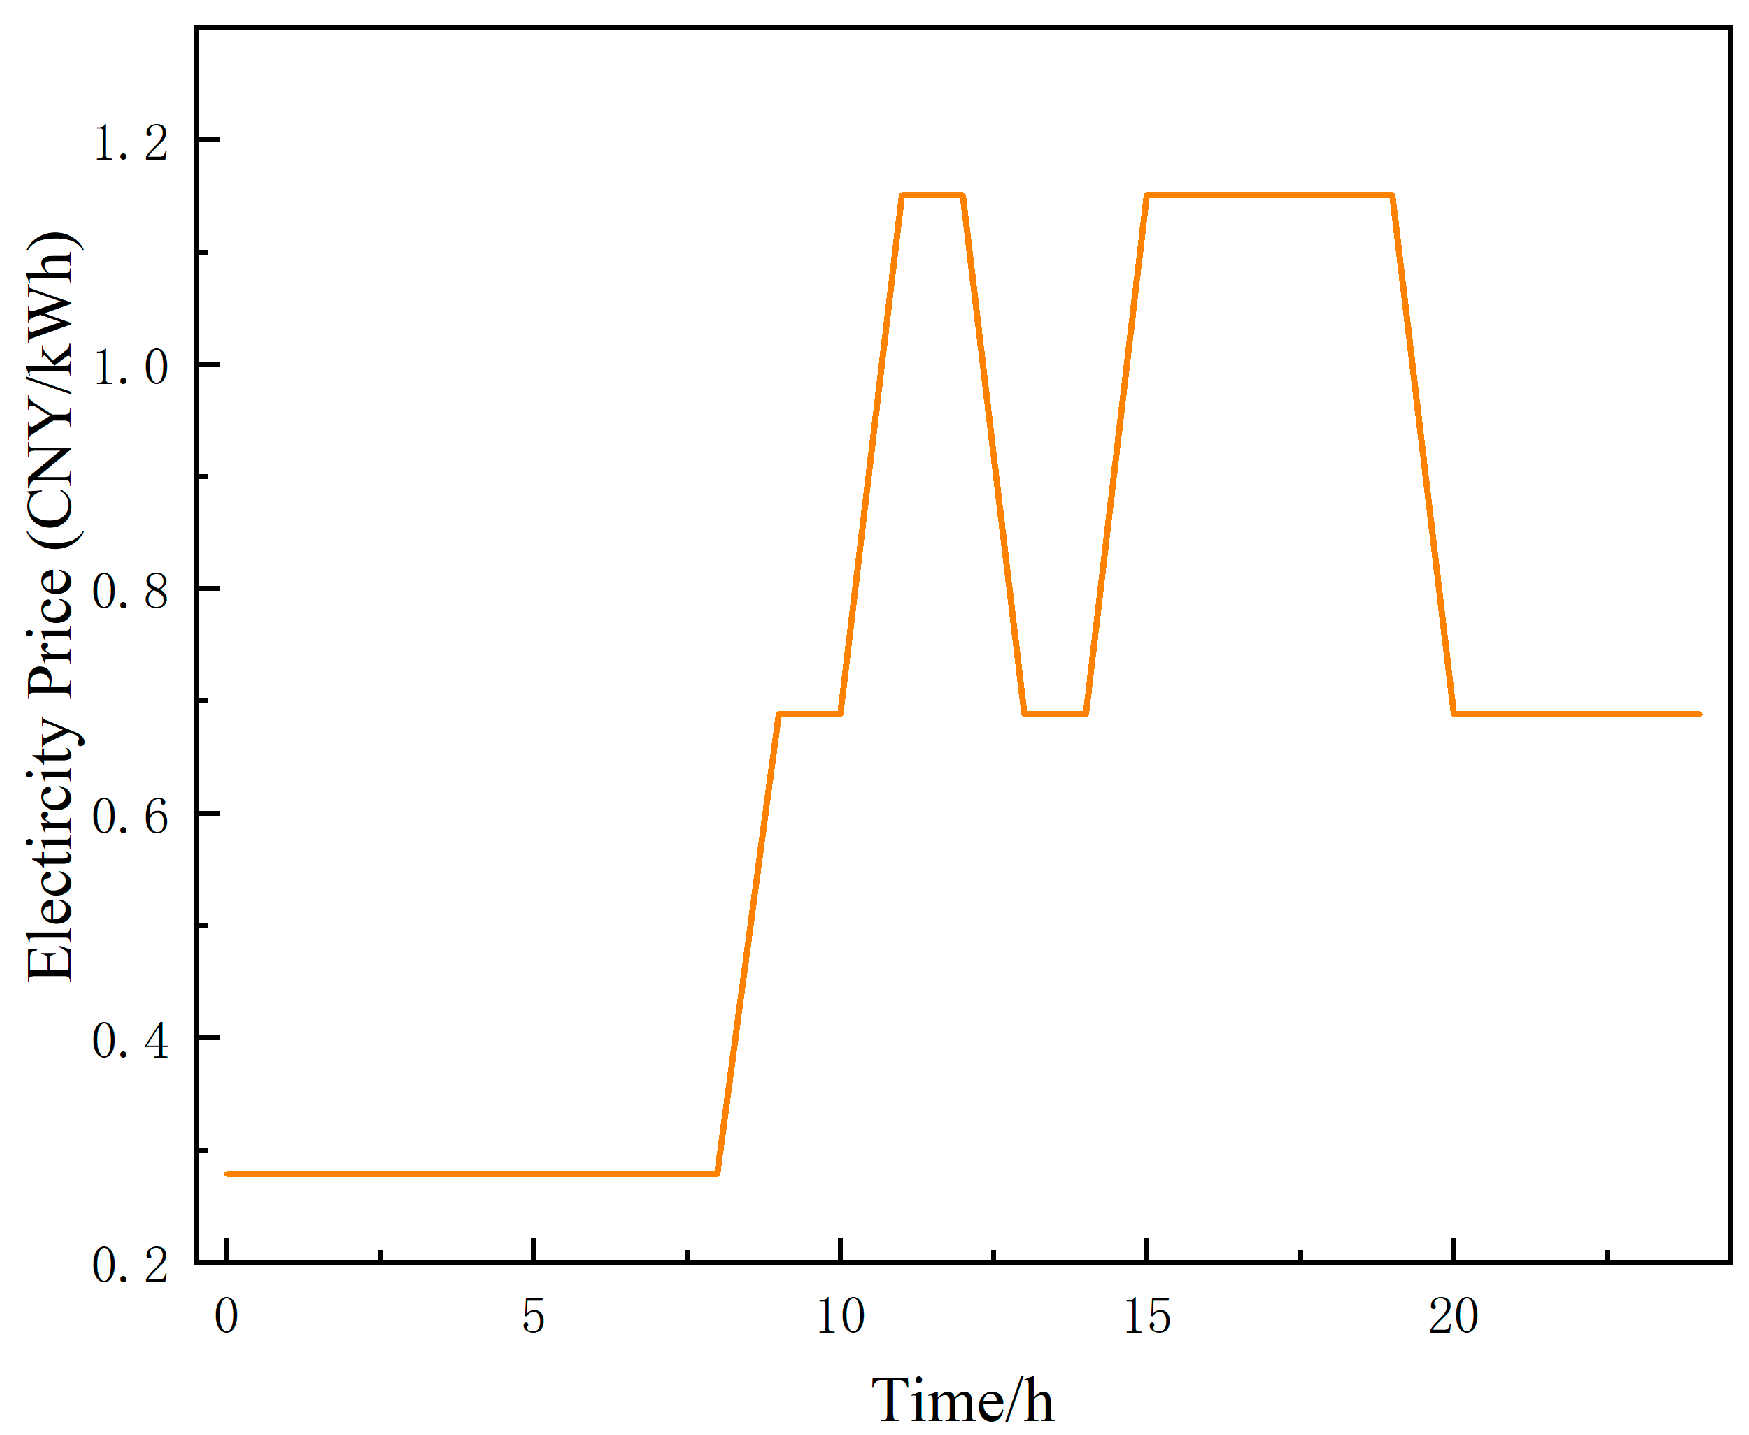
  • Input data. Input the operating parameters of the devices, the predicted renewable energy output data for the integrated energy system in the park for the next day, the cold and heat loads of the system, environmental temperature, time-of-use electricity price, line loss limits, and other parameters.
  • Renewable energy, energy storage, and energy supply players determine the strategy space based on the constraint set. The game process is initiated by the renewable energy agency.
  • The renewable energy player communicates with other agencies, receives their output strategies to determine the power shortfall, and updates its own strategy based on the argmax principle.
  • The energy storage player performs the same action as step 3.
  • The energy supply player performs the same action as step 3.
  • After all players have updated their strategies, the rate of change of each player’s payoff function is calculated to determine if it satisfies the accuracy condition. If it does, proceed to step 7; otherwise, return to step 3.
  • Check if the power shortfall satisfies the convergence condition. If it does, stop the strategy updating process and output the final strategies of each agency. Otherwise, proceed to step 8.
  • Check if the line loss has reached the limit. If it has not, increase M1 and return to step 3. If it has, increase M2 and return to step 3. The optimization process is illustrated in the accompanying Figure 3.
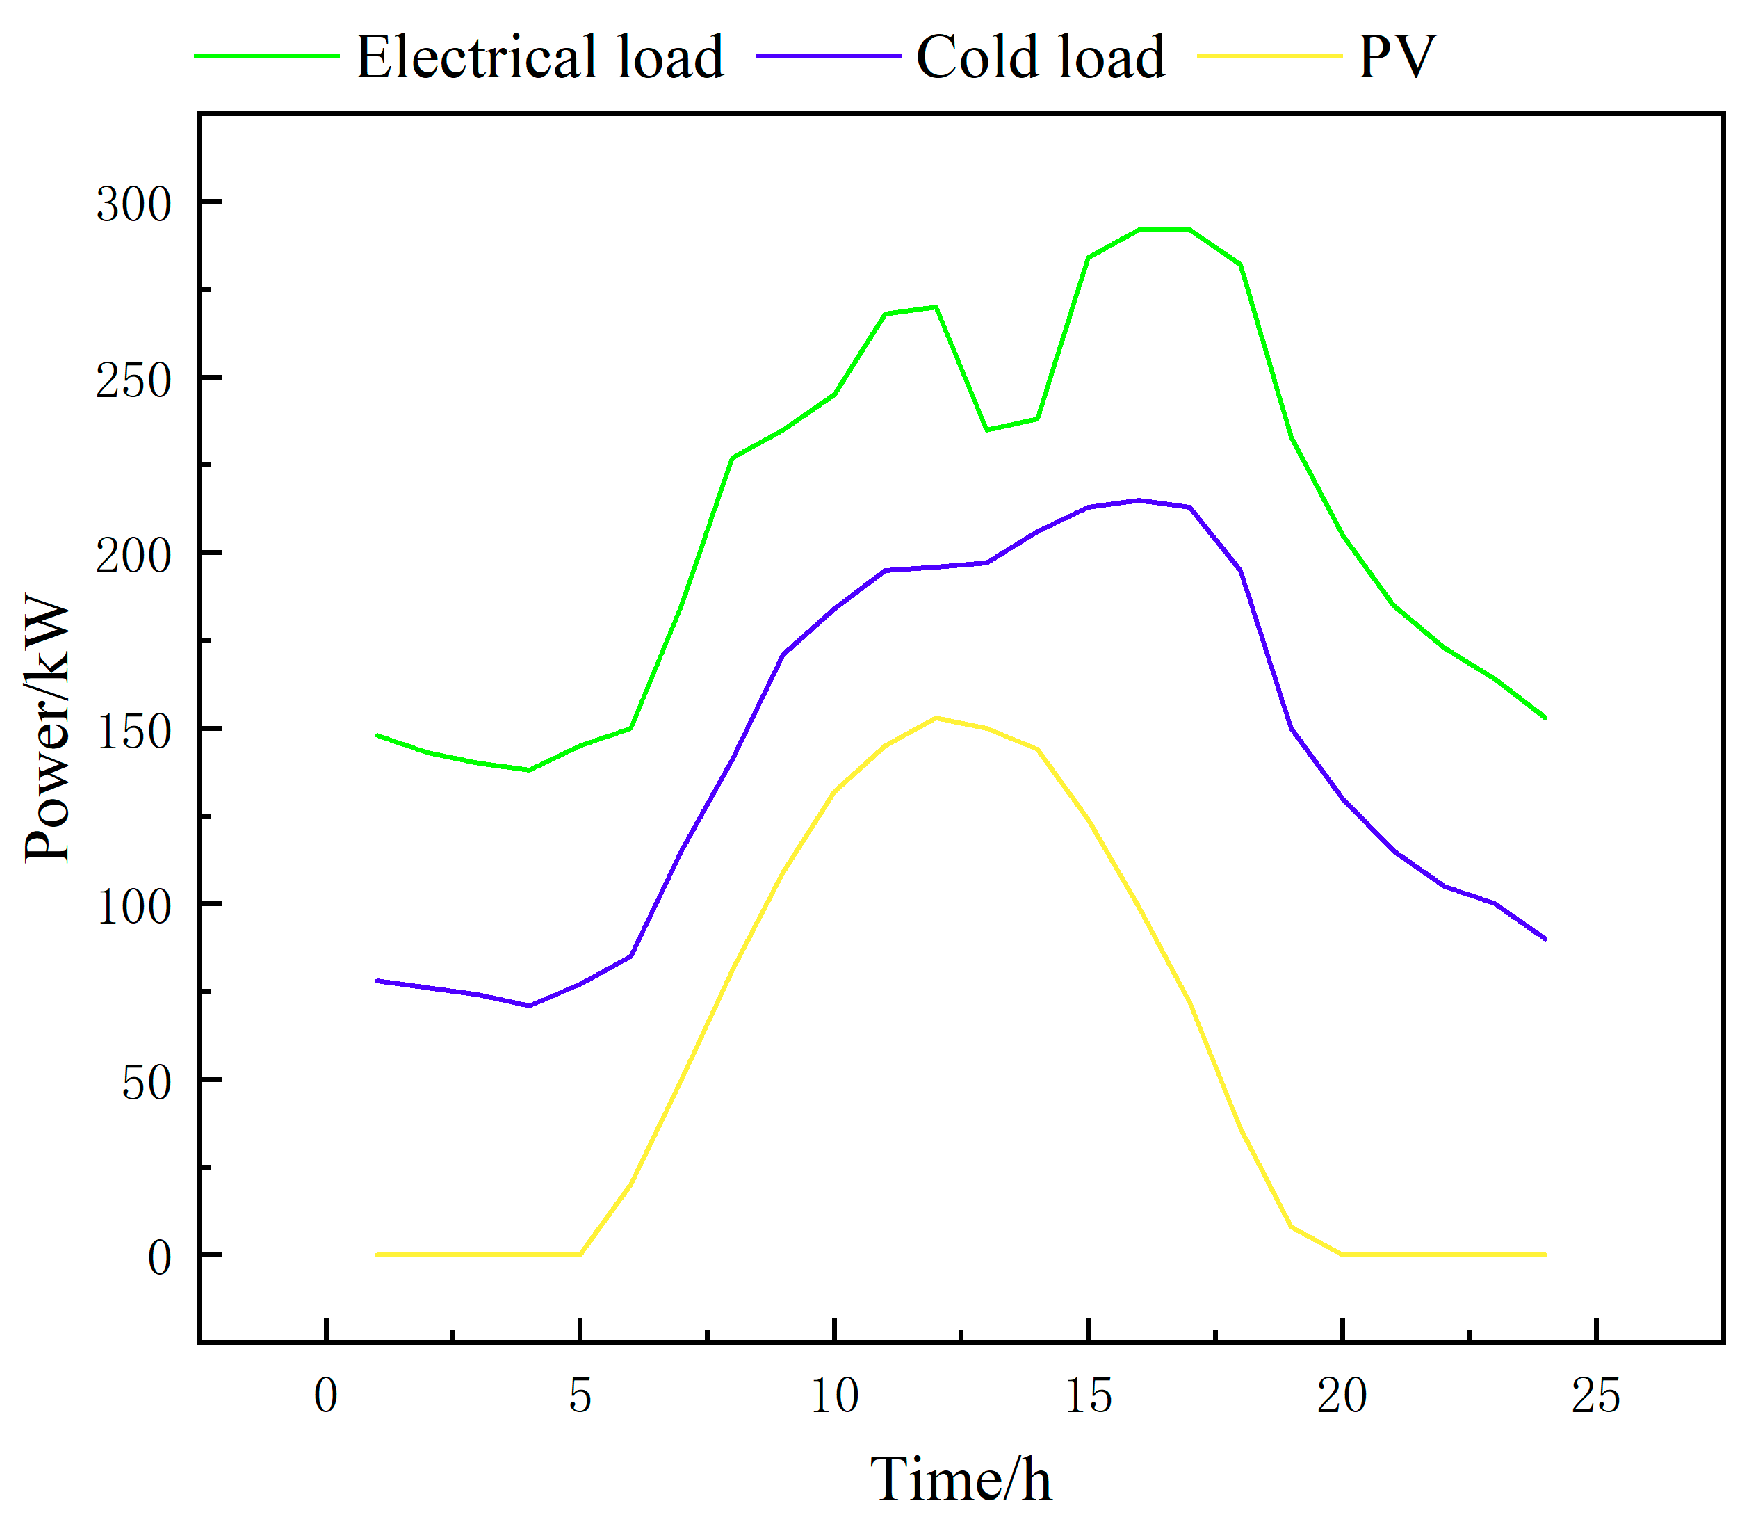
5. Case Study

5.1. Case Study Parameters

In this study, a commercial park in Guangdong province is taken as the research object. The schematic diagram of the park’s system is shown in Figure 2. The park’s equipment includes gas engines, transformers, photovoltaics, absorption chillers, central air conditioning, batteries, and water storage for cooling. The parameters of each piece of equipment are shown in Table 1. The park has both cooling and electricity load demands. The load curves of the typical summer day in the park, as well as the photovoltaic generation, cooling load, and electricity load demands, are shown in Figure 4. The scheduling of the system in advance is based on a 24 h dispatch cycle with one-hour scheduling intervals. The electricity price is based on the time-of-use electricity prices in Guangdong province; the peak/flat/valley electricity prices are 1.150/0.688/0.287 CNY/kWh. The time distribution is shown in Figure 5. The natural gas price is set at 3.46 CNY/cubic meter for commercial use, and the unit cost of thermal power output from natural gas combustion is calculated to be 0.33 CNY/kWh based on the low heating value of natural gas. Based on the electricity prices, the charging and discharging costs of the energy storage system can be calculated, as shown in Table 2.

5.2. Comparison of Solutions

In order to demonstrate the difference between the multi-objective optimization method based on potential games and general optimization methods for the integrated energy system of the park, this study sets up three comparative optimization schemes. Scheme 1 aims to optimize the system’s economy, Scheme 2 aims to optimize the system’s exergy efficiency, and Scheme 3 aims to achieve the overall optimization of exergy efficiency and economic performance. The specific optimization process for Scheme 3 is as follows: firstly, optimize the system’s economic efficiency to obtain the maximum reference value for exergy loss, then add constraints on system exergy efficiency based on the reference value, gradually decrease the exergy loss limit, and conduct multiple rounds of optimization. This process generates a Pareto curve consisting of multiple optimization solutions, as shown in Figure 6. The model was built using Matlab 2019b, and the Gurobi 9.0 solver was used for optimization.
Although all optimization solutions are feasible solutions to the problem, for the purpose of comparative analysis, the TOPSIS method is used in this study to select point P as the optimal result for Scheme 3. The equipment scheduling for each scheme is illustrated in Figure 7a–c, and the results of different optimization schemes are shown in Table 3.
Figure 7a shows the optimization results of the central unified dispatch model with the objective of optimal economics. By observing the blue and yellow portions in the graph representing energy storage, it can be seen that energy storage is charged during valley electricity price periods and discharged during periods of flat and peak electricity prices. This reduces the system’s energy costs and improves system economics. By observing the purple portion representing the power grid and the green portion representing the gas turbine units in the graph, it can be seen that during valley and flat electricity price periods, the primary source of energy supply in PIES is from the power grid. However, during peak electricity price periods, the system’s energy supply is mainly provided by the gas turbine units. This indicates that using gas turbine units for energy supply is more economical than relying solely on the power grid during periods of high electricity prices. By observing the orange portion representing PVs in the graph, it can be observed that the PV energy supply curve is similar in shape to the PV power generation curve in Figure 4. This indicates that the photovoltaic energy within the system is fully utilized.
Figure 7b shows the optimization results of the central unified dispatch model with the objective of optimal exergy efficiency. It can be observed that the energy supply within the system is solely provided by the grid and PVs, without the use of energy storage or gas turbine units. Comparing it with the energy supply results of Figure 7a under the objective of optimal economics, it is evident that in this case, the use of energy storage and gas turbine units can improve the economic efficiency of the system, but at the same time, it reduces the system’s overall efficiency.
Figure 7c shows the optimization results under the multi-agent game selected using the TOPSIS method with the objectives of exergy efficiency and exergy economy. By observing the blue and yellow portions in the graph representing energy storage, it can be seen that energy storage is charged during valley electricity price periods and flat electricity price periods and discharged during electricity price periods. Comparing with the results of Figure 7a, it can be observed that energy storage reduced the energy supply during flat price periods, retaining the energy supply only during the peak hours, when the returns are the highest. Additionally, in order to increase profits, energy storage increased the energy charging in the midday flat electricity price period and sold it in the peak electricity price period in the late afternoon.
Table 3 presents the optimized results of exergy efficiency and energy cost under three different schemes. It can be observed that although the energy cost of Scheme 1 is reduced by 26.1% and 18.2% compared to Scheme 2 and Scheme 3, respectively, the exergy efficiency of Scheme 1 is relatively lower at the same time. The exergy efficiency of Scheme 1 is decreased by 6.31% compared to Scheme 2 and by 5.94% compared to Scheme 3. This indicates that pursuing the lowest system cost excessively will result in poor exergy efficiency. In contrast, Scheme B has the highest exergy efficiency but also the highest energy cost, indicating that focusing solely on exergy efficiency leads to poor economic performance. Therefore, it is necessary to consider the system’s requirements in terms of both economy and exergy efficiency to determine the optimal scheduling scheme. Scheme 3 provides a compromise solution, where the exergy efficiency decreases by 1.37% compared to Scheme 2, but the economic performance improves by 9.71%. Compared to the economic benefit of 4.14% per unit exergy efficiency loss in Scheme 1, Scheme 3 achieves an economic benefit of 7.09% per unit efficiency loss. This indicates that Scheme 3 sacrifices a lower exergy loss efficiency in exchange for greater economic benefits, achieving a balance between the system economy and exergy efficiency.

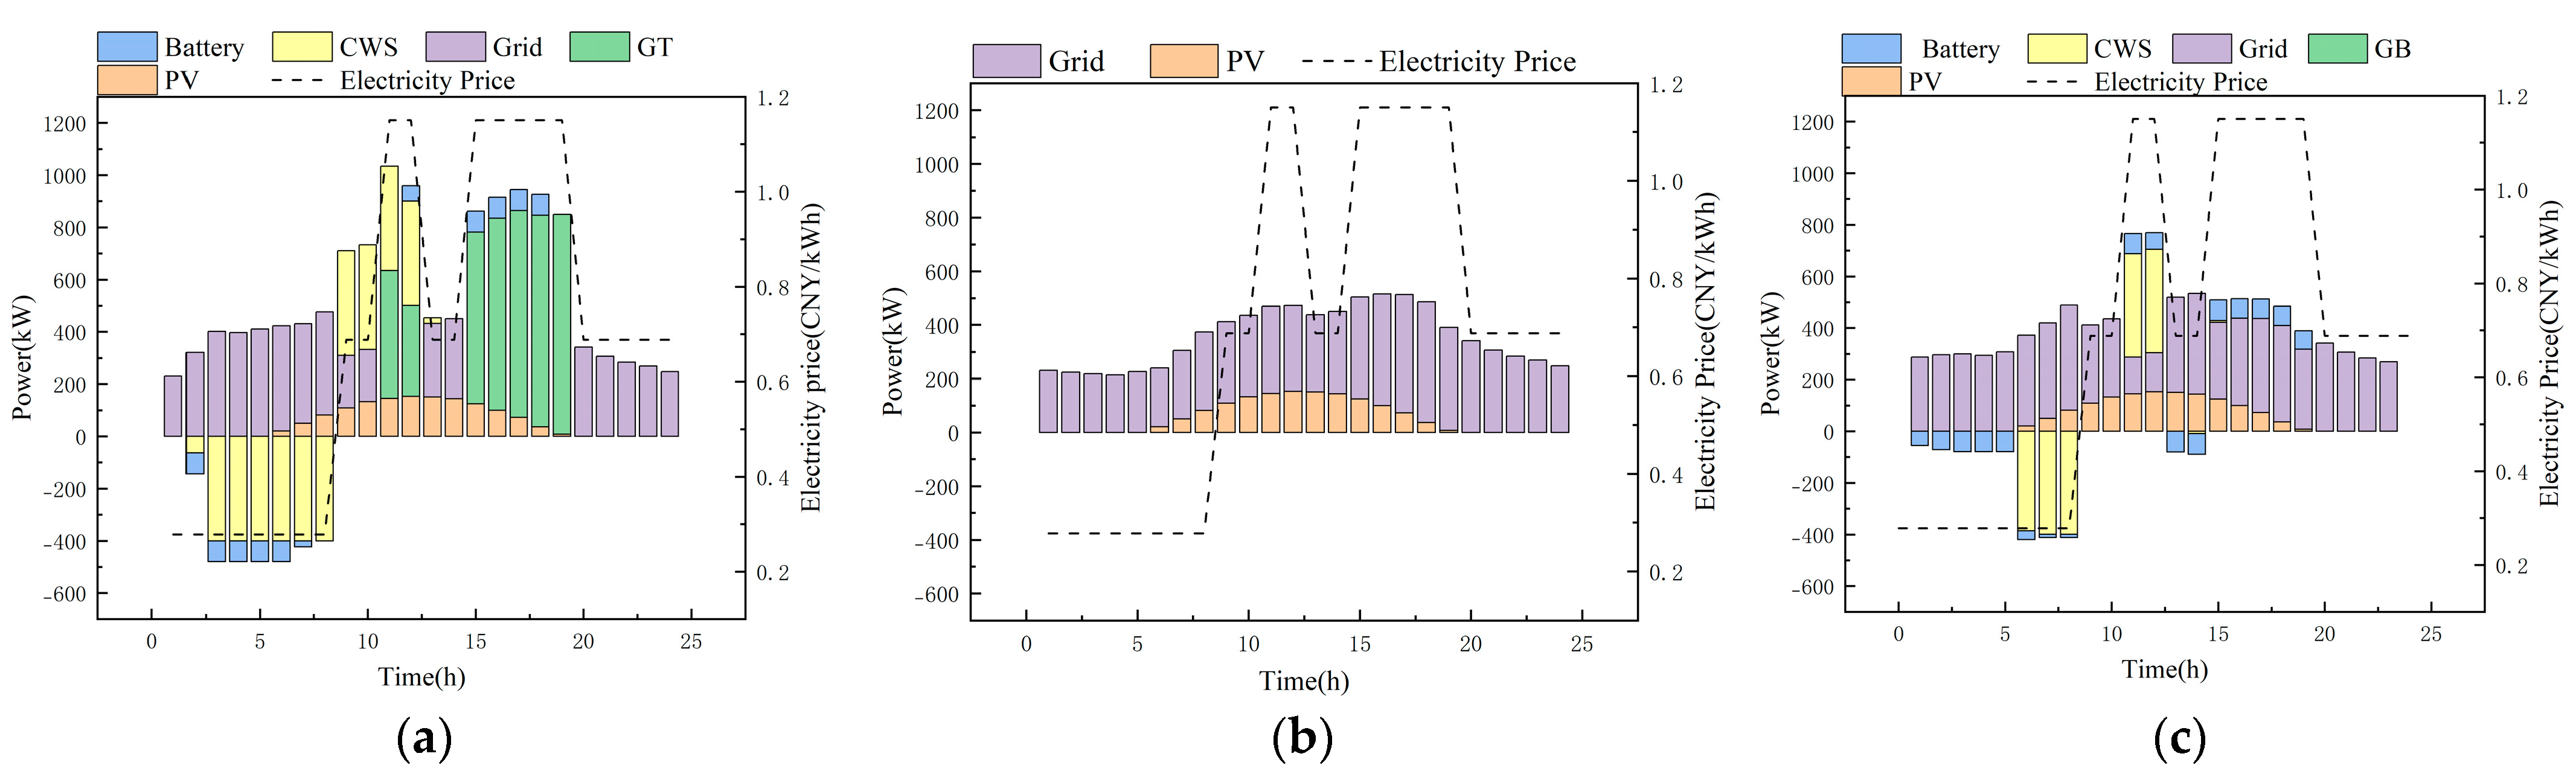
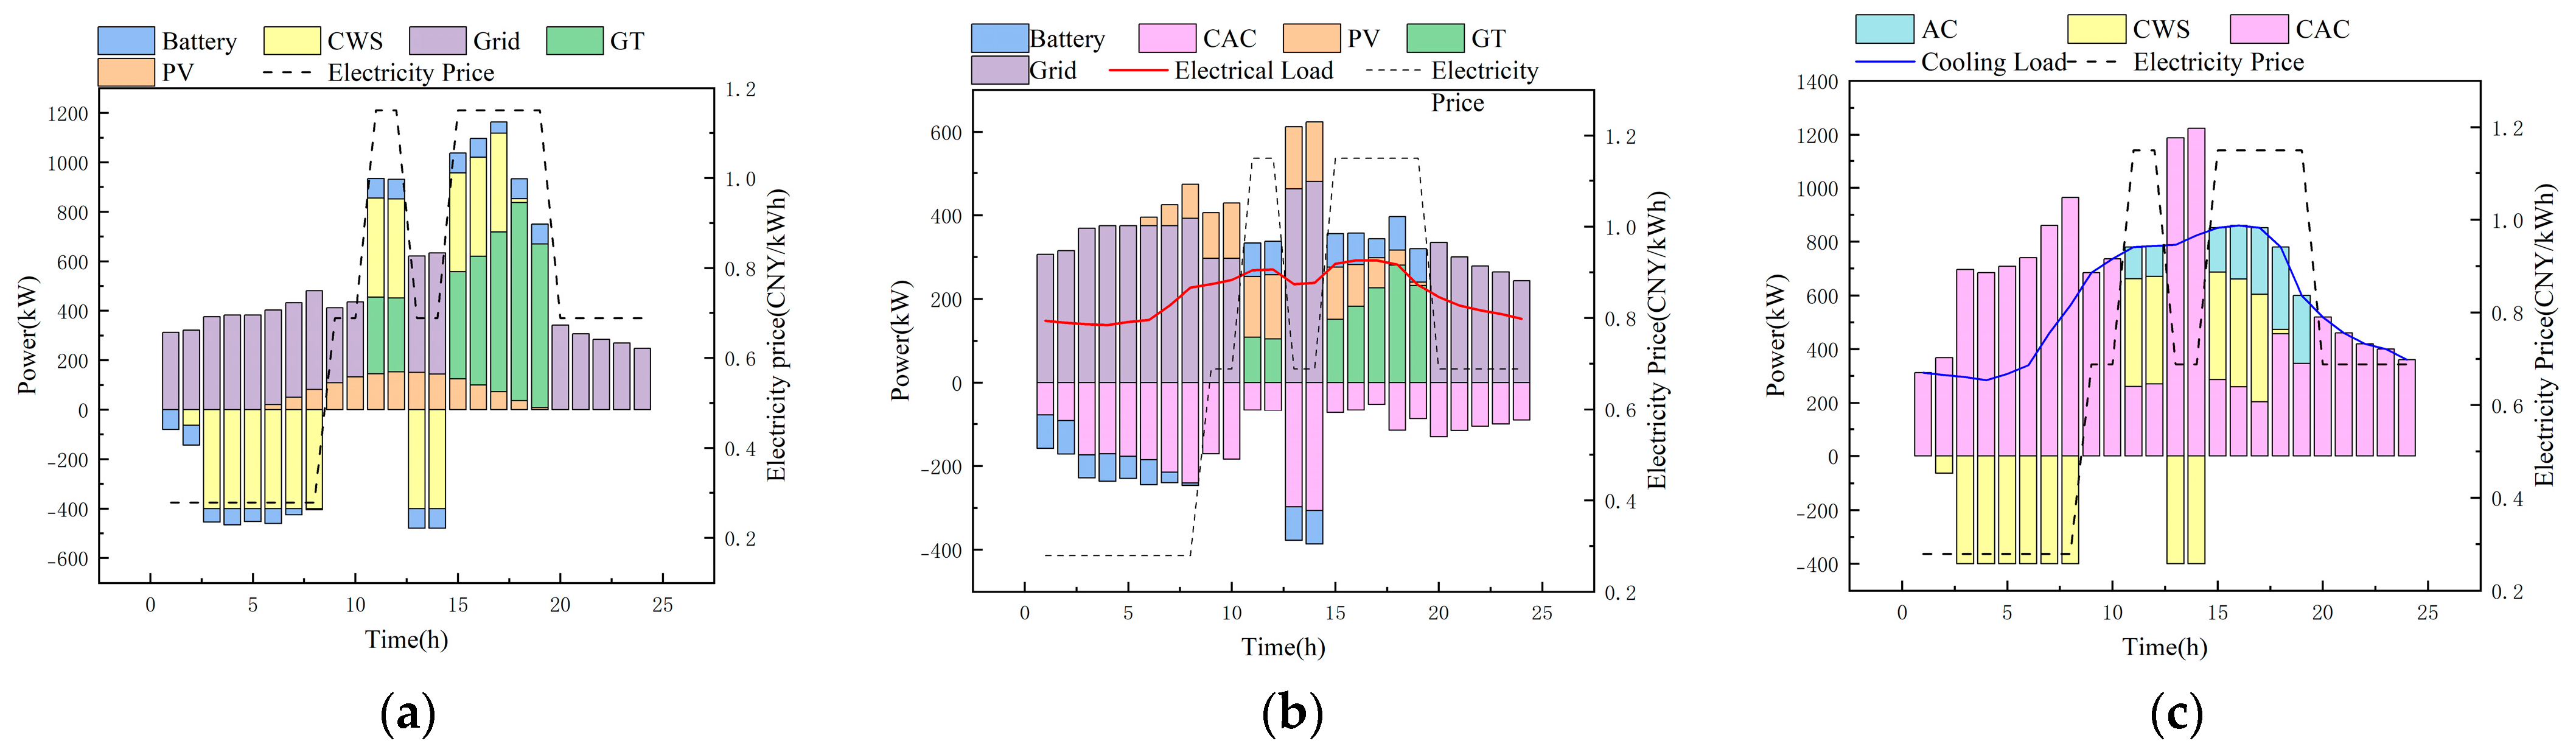
5.3. Analysis of Optimization Results for the Park-Level IES

Figure 8a–c show the optimized balanced solutions of the PIES with economy maximization as the objective within the potential game framework.
Figure 8a illustrates the output strategies of the equipment over different time periods. By observing the output of the energy storage agency (batteries and cooling water storage), it can be seen that the energy storage devices charge during the off-peak electricity price periods (00:00–08:00) and the flat electricity price period (12:00–14:00) and discharge during the high electricity price periods (10:00–12:00 and 14:00–19:00). By comparing the results in Figure 7a, it is observed that in multi-agent games, the behavior of the energy storage agents is similar to the energy scheduling results in the unified dispatch with the goal of economic optimality. The energy storage agents in the system store energy during periods of low electricity prices and release energy during periods of high electricity prices, aiming to reduce the system’s energy costs and improve its economic efficiency. However, unlike the results in Figure 7a, energy storage does not provide energy during the period of flat electricity prices from 8:00 a.m. to 10:00 a.m., but there is an addition of energy storage during the period of flat electricity prices from 12:00 p.m. to 2:00 p.m., and it is sold during the peak electricity price period in the afternoon. This series of actions reflects the efforts made by the energy storage agents in pursuit of higher profits, demonstrating their autonomy and self-interest.
Looking at the output of the energy supply agency (grid and gas engines) in Figure 8a, During the peak electricity price periods from 10:00 a.m. to 12:00 p.m. and 2:00 p.m. to 7:00 p.m., the system utilizes gas-fired units, which offer better economic benefits. This is consistent with the unified dispatch results shown in Figure 7a, where economic optimality is the objective. However, compared to Figure 7a, the supply of energy from the gas turbine units relatively decreases because of the increased energy supply from the energy storage during peak hours. However, at the same time, the increase in energy supply from the energy storage implies an increase in the corresponding energy storage load. Comparing the purple sections in Figure 7a and Figure 8a, which represent the portion of the power grid, it can be observed that the increase in energy storage load during midday hours leads to an increase in power grid supply. Between the increase and decrease in this game, the benefits on the main grid side ultimately increase, as reflected in Table 4.
Figure 8b,c illustrate the electricity balance and cooling balance within the system. By comparing the output of the main grid side with the original load curve, it can be observed that the optimized main grid side increases its output during off-peak and flat electricity price periods while decreasing its output during peak electricity price periods. This indicates that the optimization results have achieved load shaving and load filling, reducing the load pressure on the main grid side during peak electricity price periods.
Table 4 presents the benefits of players in the centralized optimization model and the distributed optimization model proposed in this paper when economic optimality is the objective. The benefits of the centralized model are calculated based on the energy prices in Table 2 and Figure 5, as well as the energy flow distribution shown in Figure 7a. It can be seen that, except for renewable energy players whose benefits remain unchanged due to reaching their maximum, the benefits of other players have improved under the proposed approach in this paper.
From the comprehensive analysis above, it can be concluded that the multi-objective co-operative game-based optimization based on exergy-economic analysis can accurately calculate the benefits of different types of participants, fully leverage their autonomy and self-interest, achieve a balance of interests among the entities involved, and provide reasonable system optimization and scheduling schemes. The optimization results demonstrate the rationality and effectiveness of the proposed approach in this paper.

6. Conclusions

This paper introduces exergy analysis and exergy economics into the modeling process of the PIES, obtaining the exergy cost of any link in the system. Based on this, a potential game model is established, realizing fully distributed optimization and scheduling among multiple different types of energy supply entities. Finally, the feasibility of the optimization scheme is verified using the integrated energy system of a park in Guangzhou as an example. The study demonstrates that:
The modeling of the PIES based on exergy economics allows for the calculation of the exergy cost of any exergy flow within the system and enables economic analysis of any component of the system. Moreover, the pricing scheme for energy based on the value of exergy use in exergy economics follows the general value law of commodities, ensuring the rationality of cost pricing and allocation schemes.
There is a contradiction between the exergy efficiency objective and the exergy economic objective of the PIES. Overemphasis on economic optimality could sacrifice exergy efficiency, and similarly, excessive pursuit of exergy efficiency could sacrifice system economic viability. By adopting the multi-objective optimization approach proposed in this paper, multiple sets of optimal solutions can be obtained to form a Pareto frontier. This allows for the selection of appropriate, optimal solutions based on system requirements.
The park optimization model based on potential games allows for the participation of multiple energy suppliers of different types. In the model, there is no central processor or leader, and the optimization is fully distributed, enabling the full expression of individuals’ autonomy and self-interest.
This paper only considers the day-ahead optimization and scheduling of the PIES. Further research will be conducted to develop an intra-day optimization and scheduling model for PIES. Additionally, this paper only focuses on the supply-side game. In the future, the demand side could be included in the game by using exergy prices as a bridge, thereby constructing a multi-agent collaborative game model for source-grid-load-storage integration.

Author Contributions

Conceptualization and methodology, H.C. and L.M.; formal analysis and investigation, Z.D.; writing—original draft preparation, Z.D.; writing—review and editing, L.M., Z.D. and J.L. All authors have read and agreed to the published version of the manuscript.

Funding

This work was supported by the Key Program of National Natural Science Foundation of China (51937005).

Data Availability Statement

Data available on request from the authors.

Conflicts of Interest

Author Lili Mo was employed by Architectural Design Research Institute of SCUT. The remaining authors declare that the research was conducted in the absence of any commercial or financial relationships that could be construed as a potential conflict of interest.

References

  1. Frangopoulos, C.A. Recent developments and trends in optimization of energy systems. Energy 2018, 164, 1011–1020. [Google Scholar] [CrossRef]
  2. Mancarella, P. MES (multi-energy systems): An overview of concepts and evaluation models. Energy 2014, 65, 1–17. [Google Scholar] [CrossRef]
  3. Jiang, T.; Zhang, R.; Li, X.; Chen, H.; Li, G. Integrated energy system security region: Concepts, methods, and implementations. Appl. Energy 2021, 283, 116124. [Google Scholar] [CrossRef]
  4. Tahir, M.F.; Haoyong, C.; Guangze, H. Evaluating individual heating alternatives in integrated energy system by employing energy and exergy analysis. Energy 2022, 249, 123753. [Google Scholar] [CrossRef]
  5. Chen, H.; Chen, S.; Li, M.; Chen, J. Optimal Operation of Integrated Energy System Based on Exergy Analysis and Adaptive Genetic Algorithm. IEEE Access 2020, 8, 158752–158764. [Google Scholar] [CrossRef]
  6. Ebrahimi, M.; Keshavarz, A.; Jamali, A. Energy and exergy analyses of a micro-steam CCHP cycle for a residential building. Energy Build. 2012, 45, 202–210. [Google Scholar] [CrossRef]
  7. Qin, N.; Hao, P.Z. The operation characteristics of sewage source heat pump system and the analysis of its thermal economic benefits. Appl. Therm. Eng. 2017, 124, 1083–1089. [Google Scholar] [CrossRef]
  8. Wang, J.; Lu, Z.; Li, M.; Lior, N.; Li, W. Energy, exergy, exergoeconomic and environmental (4E) analysis of a distributed generation solar-assisted CCHP (combined cooling, heating and power) gas turbine system. Energy 2019, 175, 1246–1258. [Google Scholar] [CrossRef]
  9. El-Sayed, Y.M.; Evans, R.B. Thermoeconomics and the Design of Heat Systems. J. Eng. Power 1970, 92, 27–35. [Google Scholar] [CrossRef]
  10. Tsatsaronis, G.; Winhold, M. Exergoeconomic analysis and evaluation of energy-conversion plants—I. A new general methodology. Energy 1985, 10, 69–80. [Google Scholar] [CrossRef]
  11. Valero, A.; Lozano, M.; Muñoz, M. A general theory of exergy saving. I. On the exergetic cost. Comput. Aided Eng. Energy Syst. Second Law Anal. Model. 1986, 3, 1–8. [Google Scholar]
  12. Sánchez Villafana, E.D.; Vargas Machuca Bueno, J.P. Thermoeconomic and environmental analysis and optimization of the supercritical CO2 cycle integration in a simple cycle power plant. Appl. Therm. Eng. 2019, 152, 1–12. [Google Scholar] [CrossRef]
  13. Wang, L.; Yang, Z.; Sharma, S.; Mian, A.; Lin, T.-E.; Tsatsaronis, G.; Maréchal, F.; Yang, Y. A Review of Evaluation, Optimization and Synthesis of Energy Systems: Methodology and Application to Thermal Power Plants. Energies 2019, 12, 73. [Google Scholar] [CrossRef]
  14. Kallio, S.; Siroux, M. Exergy and Exergy-Economic Approach to Evaluate Hybrid Renewable Energy Systems in Buildings. Energies 2023, 16, 1029. [Google Scholar] [CrossRef]
  15. Catrini, P.; Testasecca, T.; Buscemi, A.; Piacentino, A. Exergoeconomics as a Cost-Accounting Method in Thermal Grids with the Presence of Renewable Energy Producers. Sustainability 2022, 14, 4004. [Google Scholar] [CrossRef]
  16. Mo, L.; Liu, X.; Chen, H.; Zhao, Z.; Chen, J.; Deng, Z. Exergy-economic analysis and evaluation method of park-level integrated energy system. Front. Energy Res. 2022, 10, 968102. [Google Scholar] [CrossRef]
  17. Wang, S.; Wang, S.; Zhao, Q.; Dong, S.; Li, H. Optimal dispatch of integrated energy station considering carbon capture and hydrogen demand. Energy 2023, 269, 126981. [Google Scholar] [CrossRef]
  18. Hu, Z.; He, D.; Zhao, H. Multi-objective optimization of energy distribution in steel enterprises considering both exergy efficiency and energy cost. Energy 2023, 263, 125623. [Google Scholar] [CrossRef]
  19. Fan, W.; Tan, Z.; Li, F.; Zhang, A.; Ju, L.; Wang, Y.; De, G. A two-stage optimal scheduling model of integrated energy system based on CVaR theory implementing integrated demand response. Energy 2023, 263, 125783. [Google Scholar] [CrossRef]
  20. Naz, A.; Javaid, N.; Rasheed, M.B.; Haseeb, A.; Alhussein, M.; Aurangzeb, K. Game Theoretical Energy Management with Storage Capacity Optimization and Photo-Voltaic Cell Generated Power Forecasting in Micro Grid. Sustainability 2019, 11, 2763. [Google Scholar] [CrossRef]
  21. Wang, Y.; Liu, Z.; Cai, C.; Xue, L.; Ma, Y.; Shen, H.; Chen, X.; Liu, L. Research on the optimization method of integrated energy system operation with multi-subject game. Energy 2022, 245, 123305. [Google Scholar] [CrossRef]
  22. Duan, P.; Zhao, B.; Zhang, X.; Fen, M. A day-ahead optimal operation strategy for integrated energy systems in multi-public buildings based on cooperative game. Energy 2023, 275, 127395. [Google Scholar] [CrossRef]
  23. Han, L.; Morstyn, T.; McCulloch, M. Incentivizing Prosumer Coalitions With Energy Management Using Cooperative Game Theory. IEEE Trans. Power Syst. 2019, 34, 303–313. [Google Scholar] [CrossRef]
  24. Feng, C.; Wen, F.; You, S.; Li, Z.; Shahnia, F.; Shahidehpour, M. Coalitional Game-Based Transactive Energy Management in Local Energy Communities. IEEE Trans. Power Syst. 2020, 35, 1729–1740. [Google Scholar] [CrossRef]
  25. Li, P.; Wang, Z.; Yang, W.; Liu, H.; Yin, Y.; Wang, J.; Guo, T. Hierarchically partitioned coordinated operation of distributed integrated energy system based on a master-slave game. Energy 2021, 214, 119006. [Google Scholar] [CrossRef]
  26. Chen, F.; Liang, H.; Gao, Y.; Yang, Y.; Chen, Y. Research on Double-Layer Optimal Scheduling Model of Integrated Energy Park Based on Non-Cooperative Game. Energies 2019, 12, 3164. [Google Scholar] [CrossRef]
  27. Xiong, Y.; Fang, J. Co-Operative Optimization Framework for Energy Management Considering CVaR Assessment and Game Theory. Energies 2022, 15, 9483. [Google Scholar] [CrossRef]
  28. Hou, Y.; Zen, J.; Luo, Y.; Liu, J. Research on collaborative and optimization methods of active energy management in community microgrid. Power Syst. Technol. 2023, 47, 1548–1557. [Google Scholar]
  29. Zeng, J.; Wang, Q.; Liu, J.; Chen, J.; Chen, H. A Potential Game Approach to Distributed Operational Optimization for Microgrid Energy Management With Renewable Energy and Demand Response. IEEE Trans. Ind. Electron. 2019, 66, 4479–4489. [Google Scholar] [CrossRef]
  30. Atiz, A.; Karakilcik, H.; Erden, M.; Karakilcik, M. Investigation energy, exergy and electricity production performance of an integrated system based on a low-temperature geothermal resource and solar energy. Energy Convers. Manag. 2019, 195, 798–809. [Google Scholar] [CrossRef]
  31. Huang, Z.; Yu, H.; Chu, X.; Peng, Z. Energetic and exergetic analysis of integrated energy system based on parametric method. Energy Convers. Manag. 2017, 150, 588–598. [Google Scholar] [CrossRef]
  32. Hu, X.; Zhang, H.; Chen, D.; Li, Y.; Wang, L.; Zhang, F.; Cheng, H. Multi-objective planning for integrated energy systems considering both exergy efficiency and economy. Energy 2020, 197, 117155. [Google Scholar] [CrossRef]
  33. Monderer, D.; Shapley, L.S. Potential Games. Games Econ. Behav. 1996, 14, 124–143. [Google Scholar] [CrossRef]
  34. Ma, K.; Zhang, R.; Yang, J.; Song, D. Collaborative optimization scheduling of integrated energy system considering user dissatisfaction. Energy 2023, 274, 127311. [Google Scholar] [CrossRef]
  35. Turk, A.; Wu, Q.; Zhang, M. Model predictive control based real-time scheduling for balancing multiple uncertainties in integrated energy system with power-to-x. Int. J. Electr. Power Energy Syst. 2021, 130, 107015. [Google Scholar] [CrossRef]
  36. Qiu, G.; Wei, X.; Xu, Z.; Cai, W. A novel integrated heating system of solar energy and air source heat pumps and its optimal working condition range in cold regions. Energy Convers. Manag. 2018, 174, 922–931. [Google Scholar] [CrossRef]
  37. Yang, D.; Wang, M. Optimal operation of an integrated energy system by considering the multi energy coupling, AC-DC topology and demand responses. Int. J. Electr. Power Energy Syst. 2021, 129, 106826. [Google Scholar] [CrossRef]
Figure 1. Subsystem model based on exergy economics.
Energies 16 07945 g001
Figure 2. Park-level integrated energy system model.
Energies 16 07945 g002
Figure 3. Flowchart of the Persuasive Game Optimization Algorithm.
Energies 16 07945 g003
Figure 4. Typical summer daily loads and PV generation.
Energies 16 07945 g004
Figure 5. Electricity price analysis chart.
Energies 16 07945 g005
Figure 6. Pareto set of Scheme 3. Point P is the optimal result selected by the TOPSIS method.
Energies 16 07945 g006
Figure 7. Equipment scheduling under different optimization schemes: (a) economy optimization, (b) exergy efficiency optimization, and (c) economy and exergy efficiency optimization.
Energies 16 07945 g007
Figure 8. Solutions with economy objectives under the potential game framework: (a) optimization results of the equipment. (b) optimization results of the electrical energy balance. (c) optimization results of cooling energy balance.
Energies 16 07945 g008
Table 1. IES equipment model parameter.
EquipmentParametersPower (MW)Non-Energy Cost
(CNY/kWh)
GT η G T , E = 0.35
η G T , H = 0.45
0.90.0046
T η T = 0.98 0.30.0010
AC C O P A C = 0.85 0.50.0017
CAC C O P C A C = 4 0.50.0020
B η L i , c = 0.945
η L i , d = 0.945
0.40.0015
CWS η C S T , c = 0.9
η C S T , d = 0.9
σ C S T = 0.96
20.0005
Table 2. Unit cost of energy storage devices for charging and discharging.
Time PeriodBatteries (CNY/kWh)CWS (CNY/kWh)
Valley0.31701.0344
Flat0.77802.5617
Peak1.32004.2862
Table 3. Comparison of optimization results of different scenarios.
SchemeExergy Efficiency (%)Cost (CNY)
Economy60.254040.8
Exergy efficiency67.565471.4
Economy and exergy efficiency66.194940.0
Table 4. Comparison of optimization results of different models.
PlayersCentralized ModelDistributed Model
Renewable energy player1143.31143.3
Energy Storage Player594.9740.6
Energy Supply Player4040.84107.0
Disclaimer/Publisher’s Note: The statements, opinions and data contained in all publications are solely those of the individual author(s) and contributor(s) and not of MDPI and/or the editor(s). MDPI and/or the editor(s) disclaim responsibility for any injury to people or property resulting from any ideas, methods, instructions or products referred to in the content.

