

Implications of Growing Wind and Solar Penetration in Retail Electricity Markets with Gradual Demand Response

Abstract
:1. Introduction
2. Review of Relevant Literature
3. Methodology
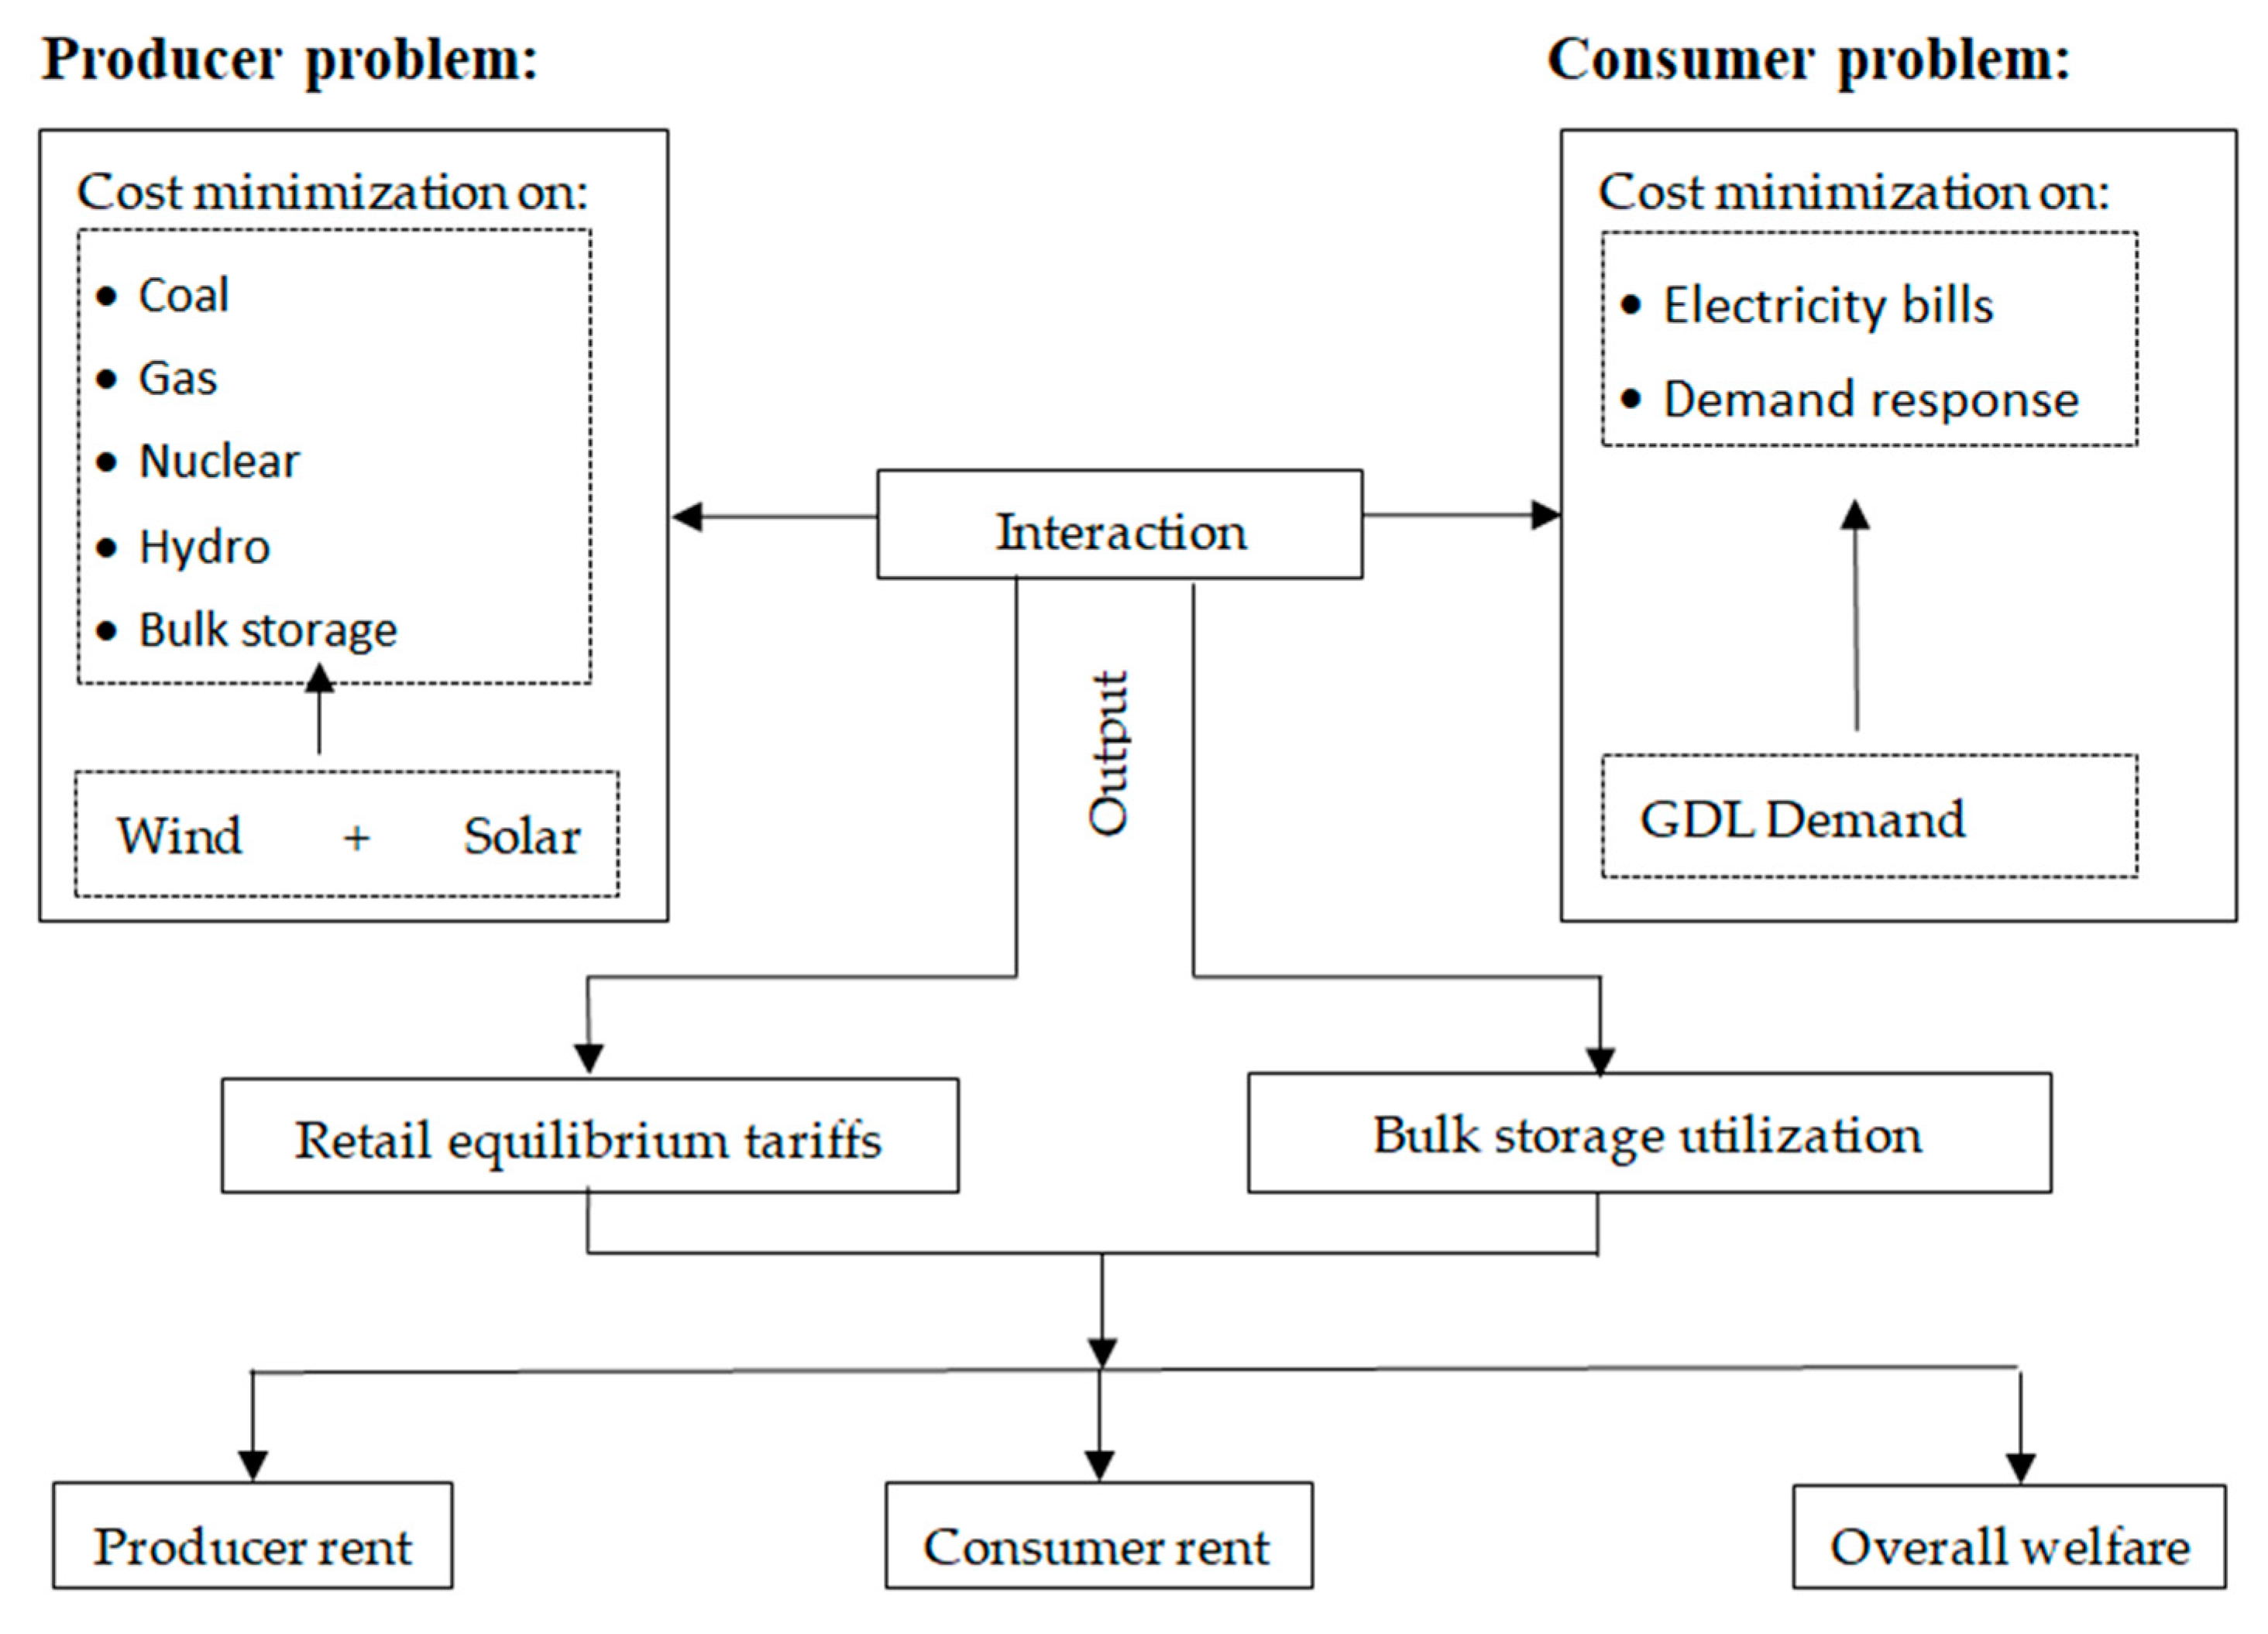
3.1. Model Overview
3.2. Producer Problem
3.3. Consumer Problem
4. Data and Application
5. Results and Discussion
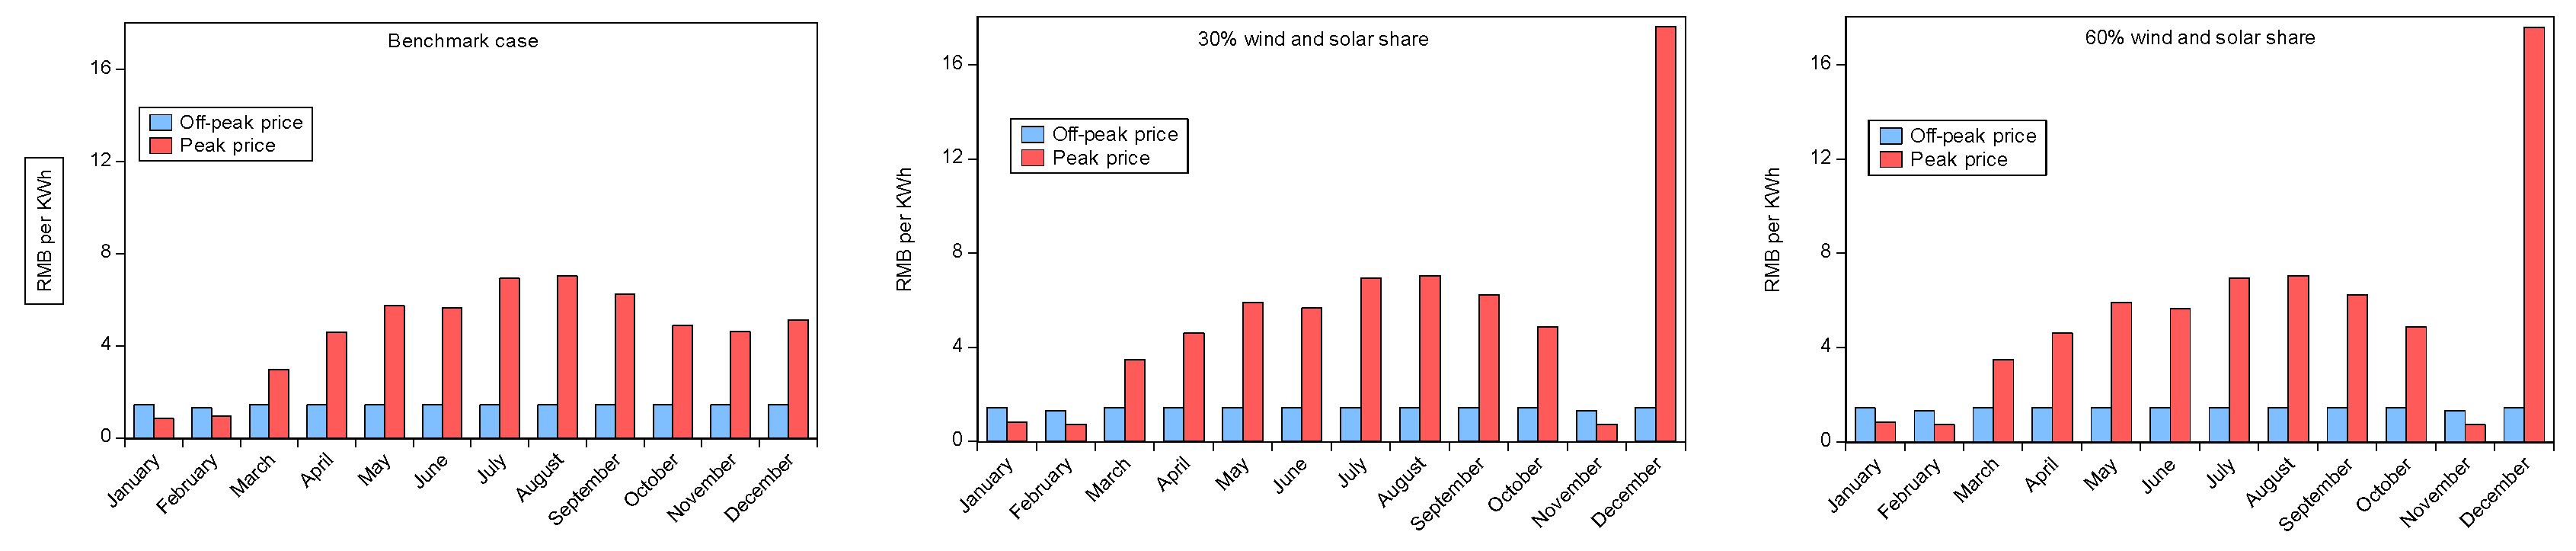
5.1. Impacts of Variable Renewable Energy Expansion on TOU Tariffs
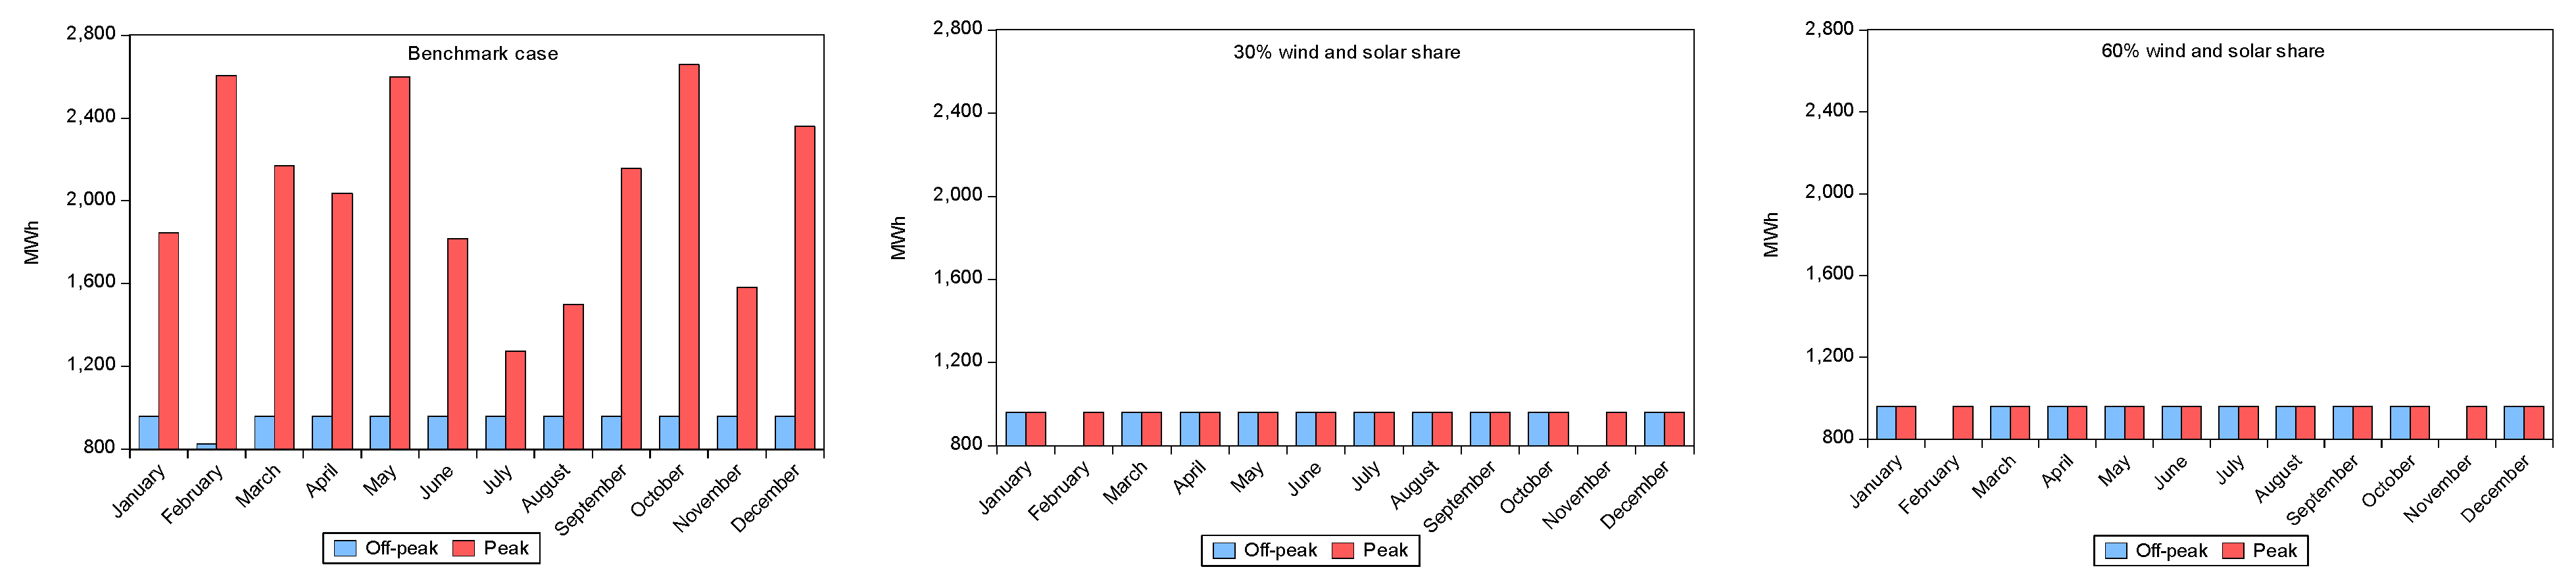
5.2. Variable Renewable Energy Expansion and Bulk Storage Utilization
5.3. Variable Renewable Energy Expansion and Welfare Changes in the Retail Electricity Market
6. Conclusions and Policy Implications
Author Contributions
Funding
Data Availability Statement
Conflicts of Interest
Appendix A. The Mixed Complementarity Problem (MCP)
References
- Wesseh, P.K.; Lin, B. Refined oil import subsidies removal in Ghana: A ‘triple’ win? J. Clean. Prod. 2016, 139, 113–121. [Google Scholar] [CrossRef]
- Wesseh, P.K.; Lin, B. Options for mitigating the adverse effects of fossil fuel subsidies removal in Ghana. J. Clean. Prod. 2017, 141, 1445–1453. [Google Scholar] [CrossRef]
- IPCC. IPCC Special Report: Global Warming of 1.5 °C; IPCC: Geneva, Switzerland, 2018. [Google Scholar]
- IRENA. Renewable Power Generation Costs in 2018; IRENA: Masdar City, United Arab Emirates, 2018. [Google Scholar]
- Abudu, A.; Wesseh, P.K.; Lin, B. Climate pledges versus commitment: Are policy actions of Middle-East and North African countries consistent with their emissions targets? Adv. Clim. Chang. Res. 2022, 13, 612–621. [Google Scholar] [CrossRef]
- Abudu, A.; Wesseh, P.K.; Lin, B. Are African countries on track to achieve their NDCs pledges? Evidence from difference-in-differences technique. Environ. Impact Assess. Rev. 2023, 98, 106917. [Google Scholar] [CrossRef]
- Joskow, P.L. Comparing the costs of intermittent and dispatchable electricity generating technologies. Am. Econ. Rev. 2011, 101, 238–241. [Google Scholar] [CrossRef]
- Xu, L.; Chen, N.; Chen, Z. Will China make a difference in its carbon intensity reduction targets by 2020 and 2030? Appl. Energy 2017, 203, 874–882. [Google Scholar] [CrossRef]
- Sheldon, T.L.; Dua, R. Effectiveness of China’s plug-in electric vehicle subsidy. Energy Econ. 2020, 88, 104773. [Google Scholar] [CrossRef]
- Lin, B.; Wesseh, P.K. On the economics of carbon pricing: Insights from econometric modeling with industry-level data. Energy Econ. 2020, 86, 104678. [Google Scholar] [CrossRef]
- Wesseh, P.K., Jr.; Zhong, Y.; Hao, C.H. Electricity Supply Unreliability and Technical Efficiency: Evidence from Listed Chinese Manufacturing Companies. Energies 2023, 16, 3283. [Google Scholar] [CrossRef]
- Lin, B.; Chen, J.; Wesseh, P.K. Peak-valley tariffs and solar prosumers: Why renewable energy policies should target local electricity markets. Energy Policy 2022, 165, 112984. [Google Scholar] [CrossRef]
- Çelebi, E.; Fuller, J.D. Time-of-use pricing in electricity markets under different market structures. IEEE Trans. Power Syst. 2012, 27, 1170–1181. [Google Scholar] [CrossRef]
- Lee, K.; Miguel, E.; Wolfram, C. Experimental evidence on the economics of rural electrification. J. Political Econ. 2020, 128, 1523–1565. [Google Scholar] [CrossRef]
- Bublitz, A.; Dogan, K.; Fichtner, W. An Analysis of the Decline of Electricity Spot Prices in Europe: Who Is to Blame? Energy Policy 2017, 107, 323–336. [Google Scholar] [CrossRef]
- Daraeepour, A.; Dalia, P.-E.; Conejo, A.J. Economic and Environmental Implications of Different Approaches to Hedge against Wind Production Uncertainty in Two-Settlement Electricity Markets: A PJM Case Study. Energy Econ. 2019, 80, 336–354. [Google Scholar] [CrossRef]
- Garces, L.P.; Conejo, A.J. Weekly Self-Scheduling, Forward Contracting, and Offering Strategy for a Producer. IEEE Trans. Power Syst. 2010, 25, 657–666. [Google Scholar] [CrossRef]
- Papavasiliou, A.; Yi, H.; Svoboda, A. Self-Commitment of Combined Cycle Units Under Electricity Price Uncertainty. IEEE Trans. Power Syst. 2015, 30, 1690–1701. [Google Scholar] [CrossRef]
- Daraeepour, A.; Larson, E.D.; Greig, C. Investigating price formation enhancements in non-convex electricity markets as renewable generation grows. Energy J. 2022, 43, 161–179. [Google Scholar] [CrossRef]
- Joskow, P.L.; Wolfram, C.D. Dynamic pricing of electricity. Am. Econ. Rev. 2012, 102, 381–385. [Google Scholar] [CrossRef]
- Hu, Z.; Kim, J.-H.; Wang, J.; Byrne, J. Review of dynamic pricing programs in the U.S. and Europe: Status quo and policy recommendations. Renew. Sustain. Energy Rev. 2015, 42, 743–751. [Google Scholar] [CrossRef]
- Eid, C.; Koliou, E.; Valles, M.; Reneses, J.; Hakvoort, R. Time-based pricing and electricity demand response: Existing barriers and next steps. Util. Policy 2016, 40, 15–25. [Google Scholar] [CrossRef]
- Matisoff, D.C.; Beppler, R.; Chan, G.; Carley, S. A review of barriers in implementing dynamic electricity pricing to achieve cost-causality. Environ. Res. Lett. 2020, 15, 093006. [Google Scholar] [CrossRef]
- Patnam, B.S.K.; Pindoriya, N.M. Demand response in consumer-Centric electricity market: Mathematical models and optimization problems. Electr. Power Syst. Res. 2021, 193, 106923. [Google Scholar] [CrossRef]
- Rahman, M.; Hettiwatte, S.; Shafiullah, G.; Arefi, A. An analysis of the time of use electricity price in the residential sector of Bangladesh. Energy Strategy Rev. 2017, 18, 183–198. [Google Scholar] [CrossRef]
- Asadinejad, A.; Tomsovic, K. Optimal use of incentive and price based demand response to reduce costs and price volatility. Electr. Power Syst. Res. 2017, 144, 215–223. [Google Scholar] [CrossRef]
- Venizelou, V.; Philippou, N.; Hadjipanayi, M.; Makrides, G.; Efthymiou, V.; Georghiou, G.E. Development of a novel time-of-use tariff algorithm for residential prosumer price-based demand side management. Energy 2018, 142, 633–646. [Google Scholar] [CrossRef]
- Yan, Q.; Qin, C.; Nie, M. Designing household retail electricity packages based on a quantile regression approach. Energy Strategy Rev. 2019, 25, 1–10. [Google Scholar] [CrossRef]
- Li, X.; Yang, H.; Yang, M.; Yang, G. Flexible time-of-use tariff with dynamic demand using artificial bee colony with transferred memory scheme. Swarm Evol. Comput. 2019, 46, 235–251. [Google Scholar] [CrossRef]
- Daruwala, F.; Denton, F.T.; Mountain, D.C. One size may not fit all: Welfare benefits and cost reductions with differentiated household electricity rates in a general equilibrium model. Resour. Energy Econ. 2020, 61, 101160. [Google Scholar] [CrossRef]
- Wesseh, P.K.; Lin, B. A time-of-use pricing model of the electricity market considering system flexibility. Energy Rep. 2022, 8, 1457–1470. [Google Scholar] [CrossRef]
- Wesseh, P.K.; Dogah, K.E. Dynamic Tariffs and climate policy interaction: An economic analysis of welfare implications in retail electricity markets. Energy Res. Soc. Sci. 2022, 90, 102679. [Google Scholar] [CrossRef]
- Siddiqi, S.N.; Baughman, M.L. Reliability differentiated real-time pricing of electricity. IEEE Trans. Power Syst. 1993, 8, 548–554. [Google Scholar] [CrossRef]
- Tanaka, M. Real-time pricing with ramping costs: A new approach to managing a steep change in electricity demand. Energy Policy 2006, 34, 3634–3643. [Google Scholar] [CrossRef]
- Conejo, A.J.; Morales, J.M.; Baringo, L. Real-Time Demand Response Model. IEEE Trans. Smart Grid 2010, 1, 236–242. [Google Scholar] [CrossRef]
- Salies, E. Real-time pricing when some consumers resist in saving electricity. Energy Policy 2013, 59, 843–849. [Google Scholar] [CrossRef]
- Yang, J.; Zhang, G.; Ma, K. Matching supply with demand: A power control and real time pricing approach. Int. J. Electr. Power Energy Syst. 2014, 61, 111–117. [Google Scholar] [CrossRef]
- Seok, H.; Kim, S.P. Incentive-based RTP model for balanced and cost-effective smart grid. IET Gener. Transm. Distrib. 2018, 12, 4327–4333. [Google Scholar] [CrossRef]
- Mamounakis, I.; Efthymiopoulos, N.; Vergados, D.J.; Tsaousoglou, G.; Makris, P.; Varvarigos, E.M. A pricing scheme for electric utility’s participation in day-ahead and real-time flexibility energy markets. J. Mod. Power Syst. Clean Energy 2019, 7, 1294–1306. [Google Scholar] [CrossRef]
- Tsaousoglou, G.; Efthymiopoulos, N.; Makris, P.; Varvarigos, E. Personalized real time pricing for efficient and fair demand response in energy cooperatives and highly competitive flexibility markets. J. Mod. Power Syst. Clean Energy 2019, 7, 151–162. [Google Scholar] [CrossRef]
- Herter, K. Residential implementation of critical-peak pricing of electricity. Energy Policy 2007, 35, 2121–2130. [Google Scholar] [CrossRef]
- Joo, J.-Y.; Ahn, S.-H.; Yoon, Y.T. Enhancing price responsiveness of end-use consumers’ loads: Dynamically administered critical peak pricing. Eur. Trans. Electr. Power 2009, 19, 113–126. [Google Scholar] [CrossRef]
- Zhang, X. Optimal scheduling of critical peak pricing considering wind commitment. IEEE Trans. Sustain. Energy 2014, 5, 637–645. [Google Scholar] [CrossRef]
- Cappers, P.; Spurlock, C.A.; Todd, A.; Jin, L. Are vulnerable customers any different than their peers when exposed to critical peak pricing: Evidence from the U.S. Energy Policy 2018, 123, 421–432. [Google Scholar] [CrossRef]
- Schwarz, P.M.; Taylor, T.N.; Birmingham, M.; Dardan, S.L. Industrial Response to Electricity Real-Time Prices: Short Run and Long Run. Econ. Inq. 2002, 40, 597–610. [Google Scholar] [CrossRef]
- Simshauser, P.; Downer, D. Dynamic Pricing and the Peak Electricity Load Problem. Aust. Econ. Rev. 2012, 45, 305–324. [Google Scholar] [CrossRef]
- Woo, C.-K.; Horowitz, I.; Sulyma, I.M. Relative kW Response to Residential Time-Varying Pricing in British Columbia. IEEE Trans. Smart Grid 2013, 4, 1852–1860. [Google Scholar] [CrossRef]
- Yalcintas, M.; Hagen, W.T.; Kaya, A. Time-based electricity pricing for large-volume customers: A comparison of two buildings under tariff alternatives. Util. Policy 2015, 37, 58–68. [Google Scholar] [CrossRef]
- Nguyen, T.T.K.; Shimada, K.; Ochi, Y.; Matsumoto, T.; Matsugi, H.; Awata, T. An Experimental Study of the Impact of Dynamic Electricity Pricing on Consumer Behavior: An Analysis for a Remote Island in Japan. Energies 2016, 9, 1093. [Google Scholar] [CrossRef]
- Dong, C.; Ng, C.T.; Cheng, T.C.E. Electricity Time-of-Use Tariff with Stochastic Demand. Prod. Oper. Manag. 2017, 26, 64–79. [Google Scholar] [CrossRef]
- Qiu, Y.; Kirkeide, L.; Wang, Y.D. Effects of voluntary time-of-use pricing on summer electricity usage of business customers. Environ. Resour. Econ. 2018, 69, 417–440. [Google Scholar] [CrossRef]
- Nakada, T.; Shin, K.; Managi, S. The effect of demand response on purchase intention of distributed generation: Evidence from Japan. Energy Policy 2016, 94, 307–316. [Google Scholar] [CrossRef]
- Krishnamurthy, C.K.B.; Vesterberg, M.; Book, H.; Lindfors, A.V.; Svento, R. Real-time pricing revisited: Demand flexibility in the presence of micro-generation. Energy Policy 2018, 123, 642–658. [Google Scholar] [CrossRef]
- Holland, S.P.; Mansur, E.T. Is Real-Time Pricing Green? The Environmental Impacts of Electricity Demand Variance. Rev. Econ. Stat. 2008, 90, 550–561. [Google Scholar] [CrossRef]
- Cochell, J.E.; Schwarz, P.M.; Taylor, T.N. Using real-time electricity data to estimate response to time-of-use and flat rates: An application to emissions. J. Regul. Econ. 2012, 42, 135–158. [Google Scholar] [CrossRef]
- Nilsson, A.; Stoll, P.; Brandt, N. Assessing the impact of real-time price visualization on residential electricity consumption, costs, and carbon emissions. Resour. Conserv. Recycl. 2017, 124, 152–161. [Google Scholar] [CrossRef]
- He, Y.; Zhang, J. Real-time electricity pricing mechanism in China based on system dynamics. Energy Convers. Manag. 2015, 94, 394–405. [Google Scholar] [CrossRef]
- Khanna, N.Z.; Guo, J.; Zheng, X. Effects of demand side management on Chinese household electricity consumption: Empirical findings from Chinese household survey. Energy Policy 2016, 95, 113–125. [Google Scholar] [CrossRef]
- Dehnavi, E.; Abdi, H. Optimal pricing in time of use demand response by integrating with dynamic economic dispatch problem. Energy 2016, 109, 1086–1094. [Google Scholar] [CrossRef]
- Zhao, G.; Zhan, T.; Xi, H. Time-of-use price optimizing model and its solving method. In Proceedings of the International Conference of Civil, Transportation and Environment (ICCTE, 2016), Guangzhou, China, 30–31 January 2016. [Google Scholar]
- Monfared, H.J.; Ghasemi, A. Retail electricity pricing based on the value of electricity for consumers. Sustain. Energy Grids Netw. 2019, 18, 100205. [Google Scholar] [CrossRef]
- Liu, Z.; Zhang, X.; Yang, D. Policy target achievement between pure time-of- use tariff and time-of-use block tariff. J. Quant. Tech. Econ 2015, 6, 120–134. [Google Scholar]
- Nayak, C.K.; Nayak, M.R. Technoeconomic analysis of a grid-connected PV and battery energy storage system considering time of use pricing. Turk. J. Electr. Eng. Comput. Sci. 2018, 26, 318–329. [Google Scholar] [CrossRef]
- Wang, B.; Xie, M.; Zhang, T.; Wu, M. Research on the sharing mode of distributed optical storage systems based on dynamic tariffs considering the fairness of income. Power Syst. Technol. 2021, 45, 2228–2237. [Google Scholar]
- Ventosa, M.; Bafllo, I.; Ramos, A.; Rivier, M. Electricity market modeling trends. Energy Policy 2005, 33, 897–913. [Google Scholar] [CrossRef]
- Schill, W.-P. Electric vehicles in imperfect electricity markets: The case of Germany. Energy Policy 2011, 39, 6178–6189. [Google Scholar] [CrossRef]
- Schill, W.-P.; Kemfert, C. Modeling strategic electricity storage: The case of pumped hydro storage in Germany. Energy J. 2011, 32, 59–87. [Google Scholar] [CrossRef]
- Wesseh, P.K.; Benjamin, N.I.; Lin, B. The coordination of pumped hydro storage, electric vehicles, and climate policy in imperfect electricity markets: Insights from China. Renew. Sustain. Energy Rev. 2022, 160, 112275. [Google Scholar] [CrossRef]
- Breeze, P. Power Generation Technologies; Elsevier Ltd.: Amsterdam, The Netherlands, 2019. [Google Scholar]
- Mongird, K.; Viswanathan, V.; Balducci, P.; Alam, J.; Fotedar, V.; Koritarov, V.; Hadjerioua, B. Energy Storage Technology and Cost Characterization Report; U.S. Department of Energy: Washington, DC, USA, 2019. [Google Scholar]
- Ekholm, T.; Virasjoki, V. Pricing and competition with 100% variable renewable energy and storage. Energy J. 2021, 42, 215–231. [Google Scholar]


| Generation | Capacity in 2018 (MW) | Cost (RMB/MWh) | Ramp Up ) | Ramp Down ) |
|---|---|---|---|---|
| Coal | 25,649.6 | 496.5 | 0.11 | 0.03 |
| Gas | 5630.4 | 556.1 | 0.23 | 0.18 |
| Nuclear | 8710 | 436.9 | 0.05 | 0.09 |
| Hydro | 13,220 | 463.4 | 0.35 | 0.28 |
| Pumped hydro storage capacity: | ||||
| Loading/discharging ) | ||||
| (in MW) | 1200 | 0.002 | ||
| Volume of storage reservoir | ||||
| (in MWh) | 1,900,000 | |||
| Emissions factor (Metric ton per MWh) | ||||
| Coal | 0.9426 | |||
| Gas | 0.4838 | |||
| Nuclear | 0 | |||
| Hydro | 0 | |||
| Item | Description | Unit |
|---|---|---|
| Sets | ||
| Hours | ||
| Month | ||
| Parameters | ||
| Variable generation costs | RMB/MWh | |
| Variable storage costs | RMB/MWh | |
| Generation capacity | MW | |
| Wind power feed-in | MWh | |
| Solar power feed-in | MWh | |
| CO2 emissions factor | Mt/MWh | |
| Ramping up parameter | ||
| Ramping down parameter | ||
| Loading capacity of storage | MW | |
| Discharging capacity of storage | MW | |
| Reservoir capacity of storage | MWh | |
| Efficiency of storage | ||
| Hourly weights | ||
| Lag demand | MWh | |
| Non-price effects | ||
| Own- and cross-price elasticities | ||
| Lag elasticities | ||
| Variables | ||
| Energy flows | MWh | |
| Generation from pumped hydro storage | MWh | |
| Loading of pumped hydro storage | MWh | |
| Marginal costs (monthly) | RMB/MWh | |
| Marginal costs (hourly) | RMB/MWh | |
| Monthly demand in each block | MWh | |
| Hourly demand in each block | MWh | |
| Shadow price of generation capacity constraint | RMB/MWh | |
| Shadow price of ramping-up constraint | RMB/MWh | |
| Shadow price of ramping-down constraint | RMB/MWh | |
| Shadow price of storage loading capacity constraint | RMB/MWh | |
| Shadow price of storage discharging capacity constraint | RMB/MWh | |
| Shadow price of lower storage capacity constraint | RMB/MWh | |
| Shadow price of upper storage capacity constraint | RMB/MWh | |
| Emissions | Mt | |
| Consumer rent | RMB | |
| Producer rent | RMB |
Disclaimer/Publisher’s Note: The statements, opinions and data contained in all publications are solely those of the individual author(s) and contributor(s) and not of MDPI and/or the editor(s). MDPI and/or the editor(s) disclaim responsibility for any injury to people or property resulting from any ideas, methods, instructions or products referred to in the content. |
© 2023 by the authors. Licensee MDPI, Basel, Switzerland. This article is an open access article distributed under the terms and conditions of the Creative Commons Attribution (CC BY) license (https://creativecommons.org/licenses/by/4.0/).
Share and Cite
Hao, C.H.; Wesseh, P.K., Jr.; Okorie, D.I.; Abudu, H. Implications of Growing Wind and Solar Penetration in Retail Electricity Markets with Gradual Demand Response. Energies 2023, 16, 7895. https://doi.org/10.3390/en16237895
Hao CH, Wesseh PK Jr., Okorie DI, Abudu H. Implications of Growing Wind and Solar Penetration in Retail Electricity Markets with Gradual Demand Response. Energies. 2023; 16(23):7895. https://doi.org/10.3390/en16237895
Chicago/Turabian StyleHao, Chin Hui, Presley K. Wesseh, Jr., David Iheke Okorie, and Hermas Abudu. 2023. "Implications of Growing Wind and Solar Penetration in Retail Electricity Markets with Gradual Demand Response" Energies 16, no. 23: 7895. https://doi.org/10.3390/en16237895