

Improved Methodology for Power Transformer Loss Evaluation: Algorithm Refinement and Resonance Risk Analysis
 ,
,
Abstract
:1. Introduction
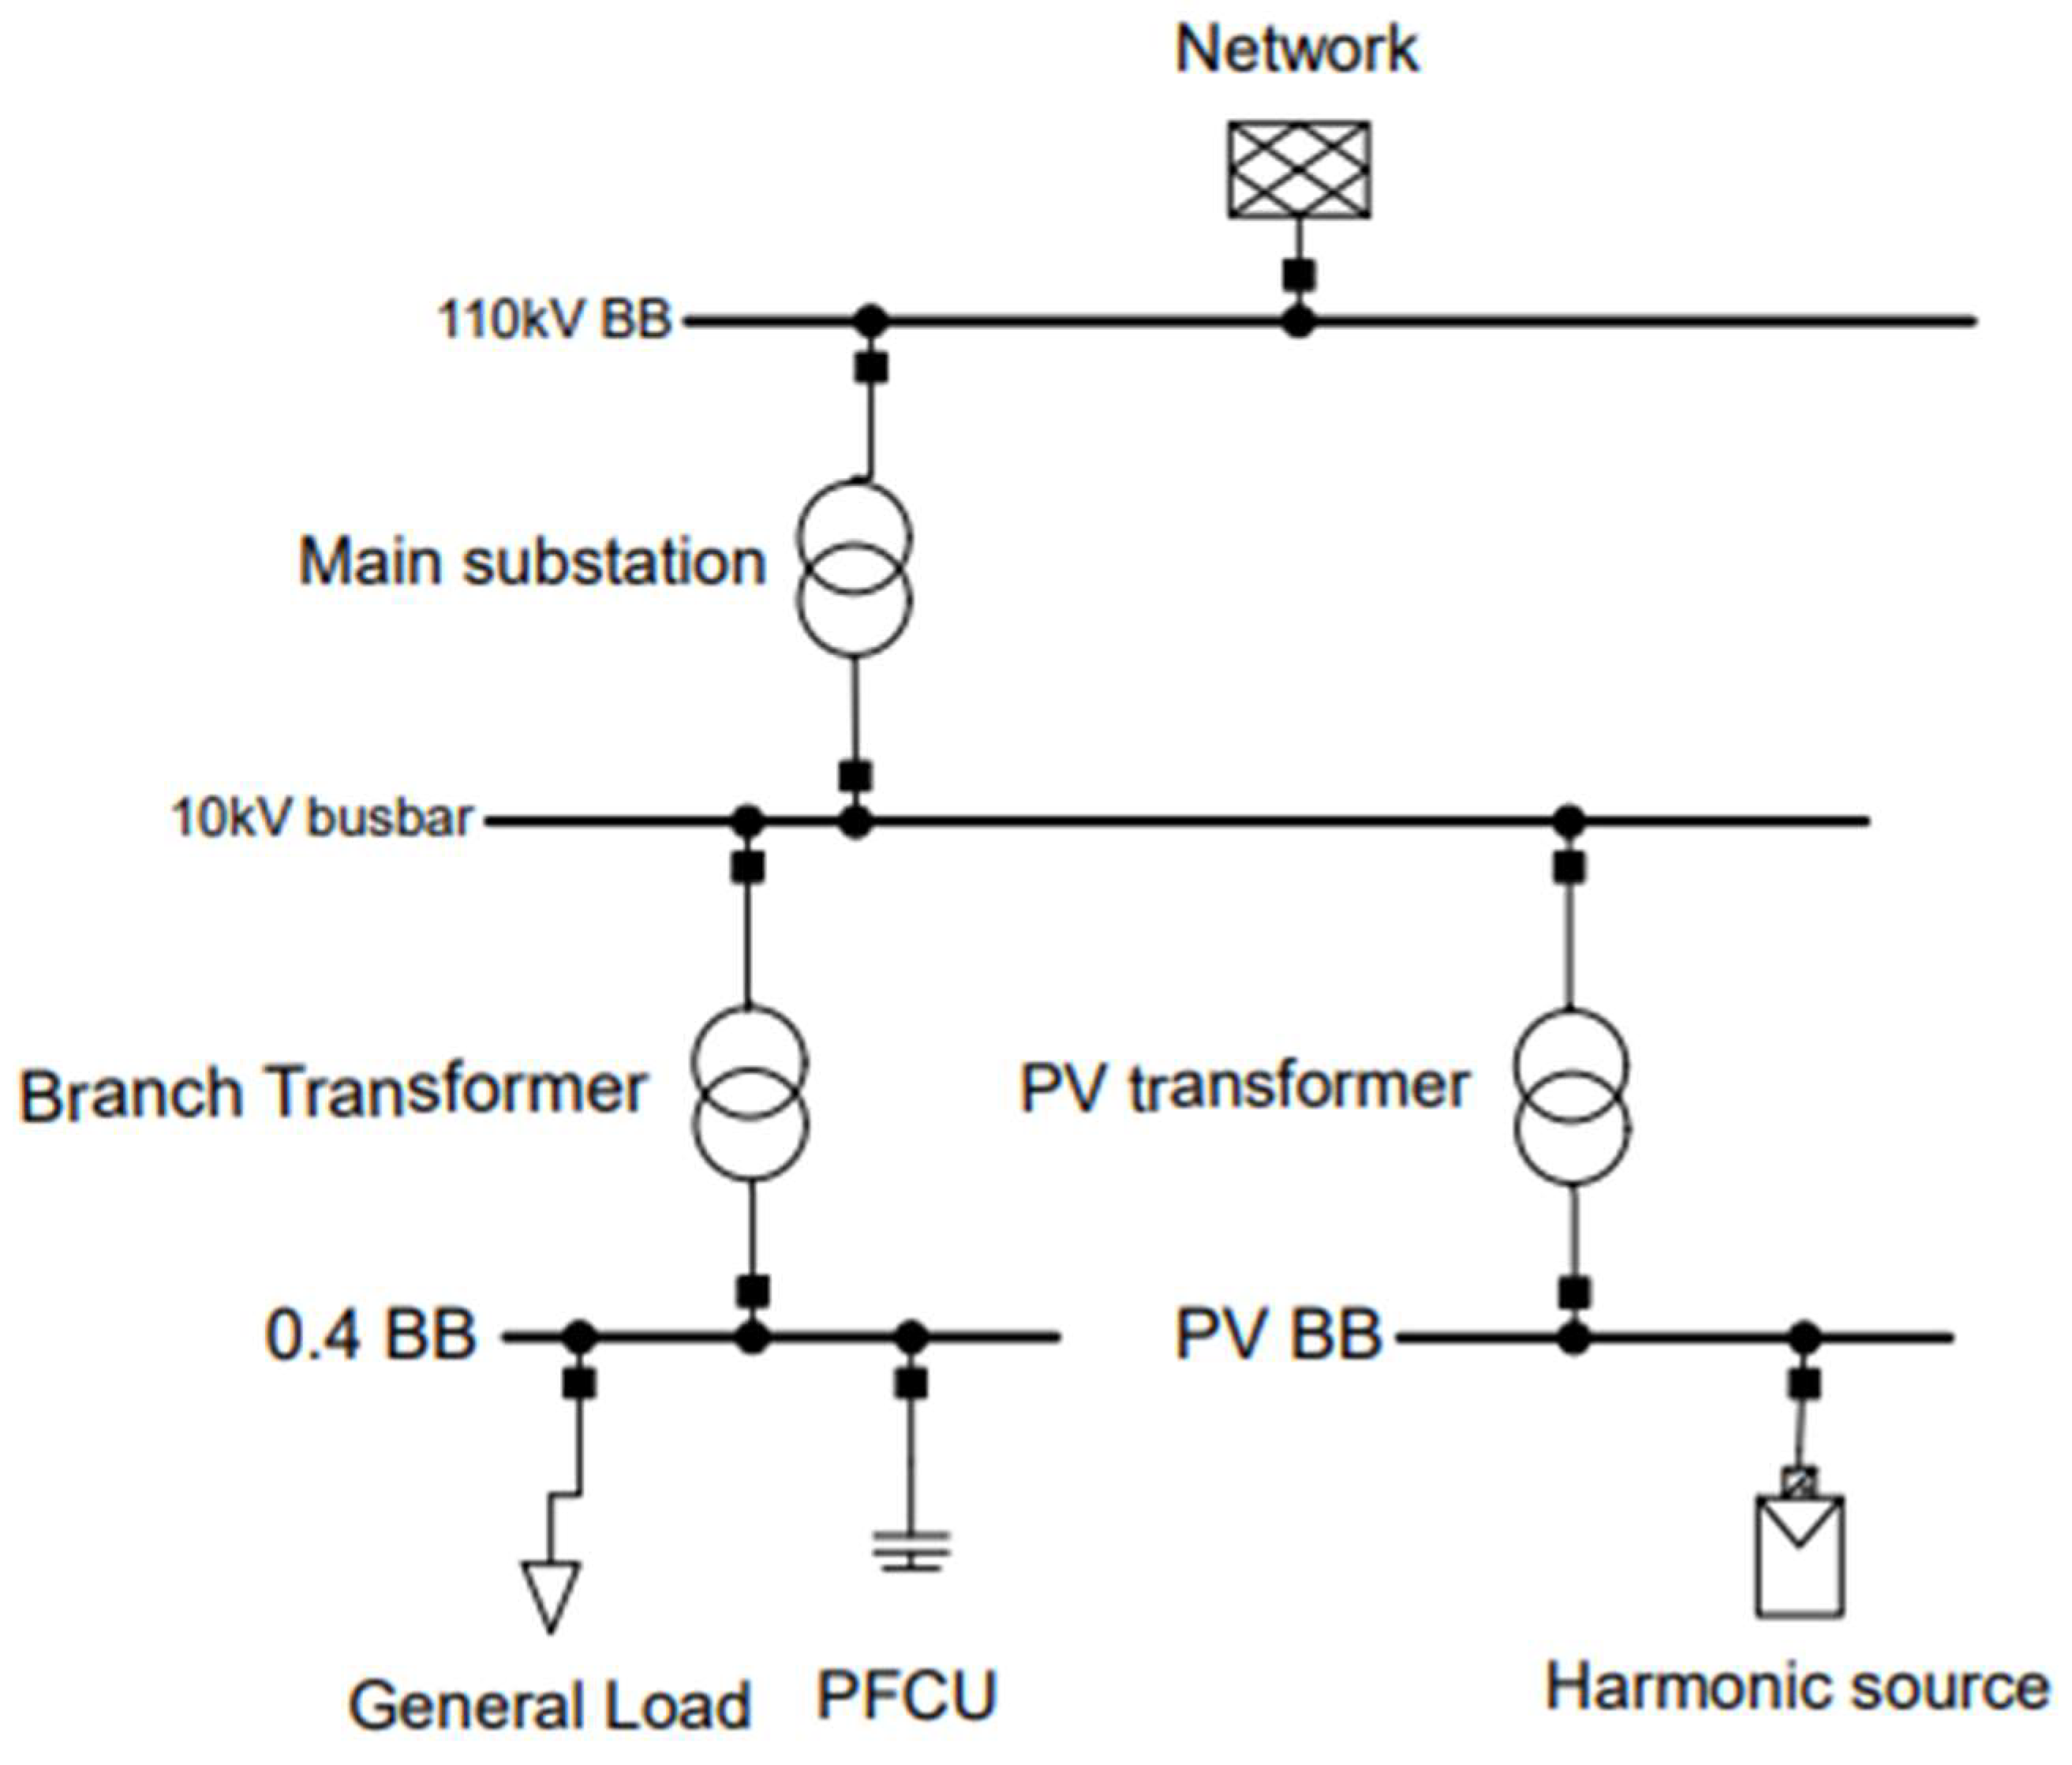
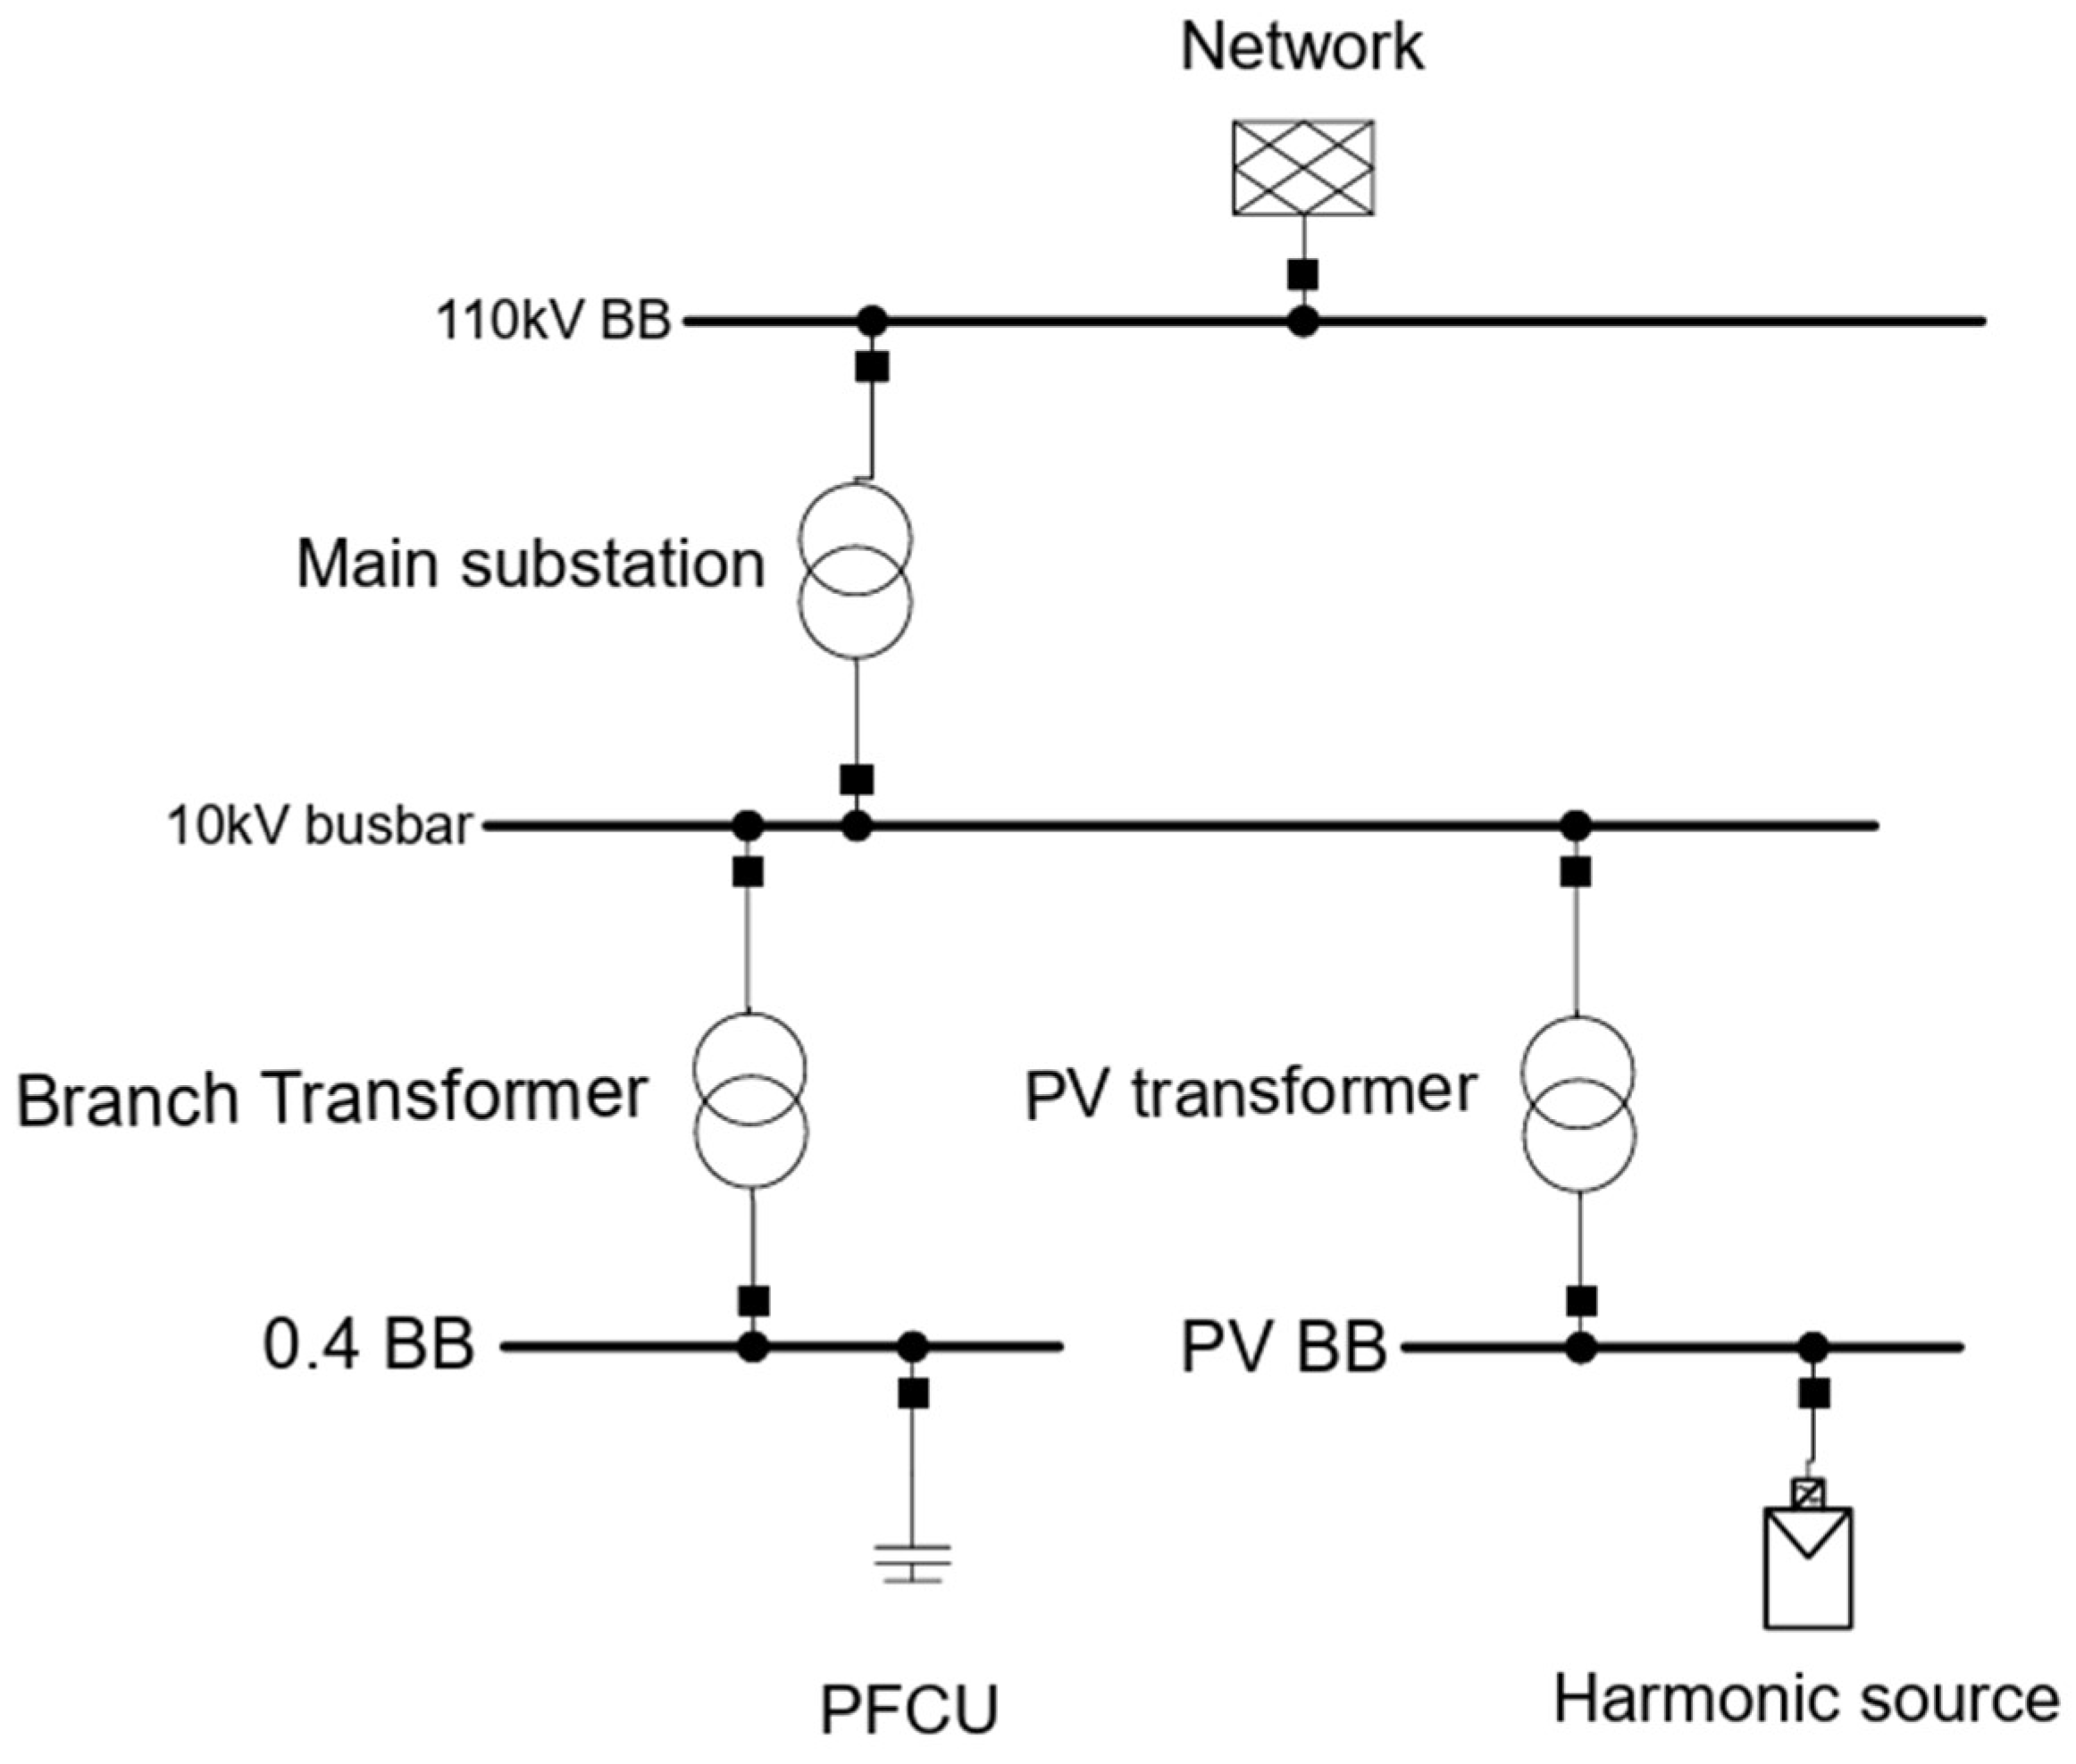
2. Materials and Methods
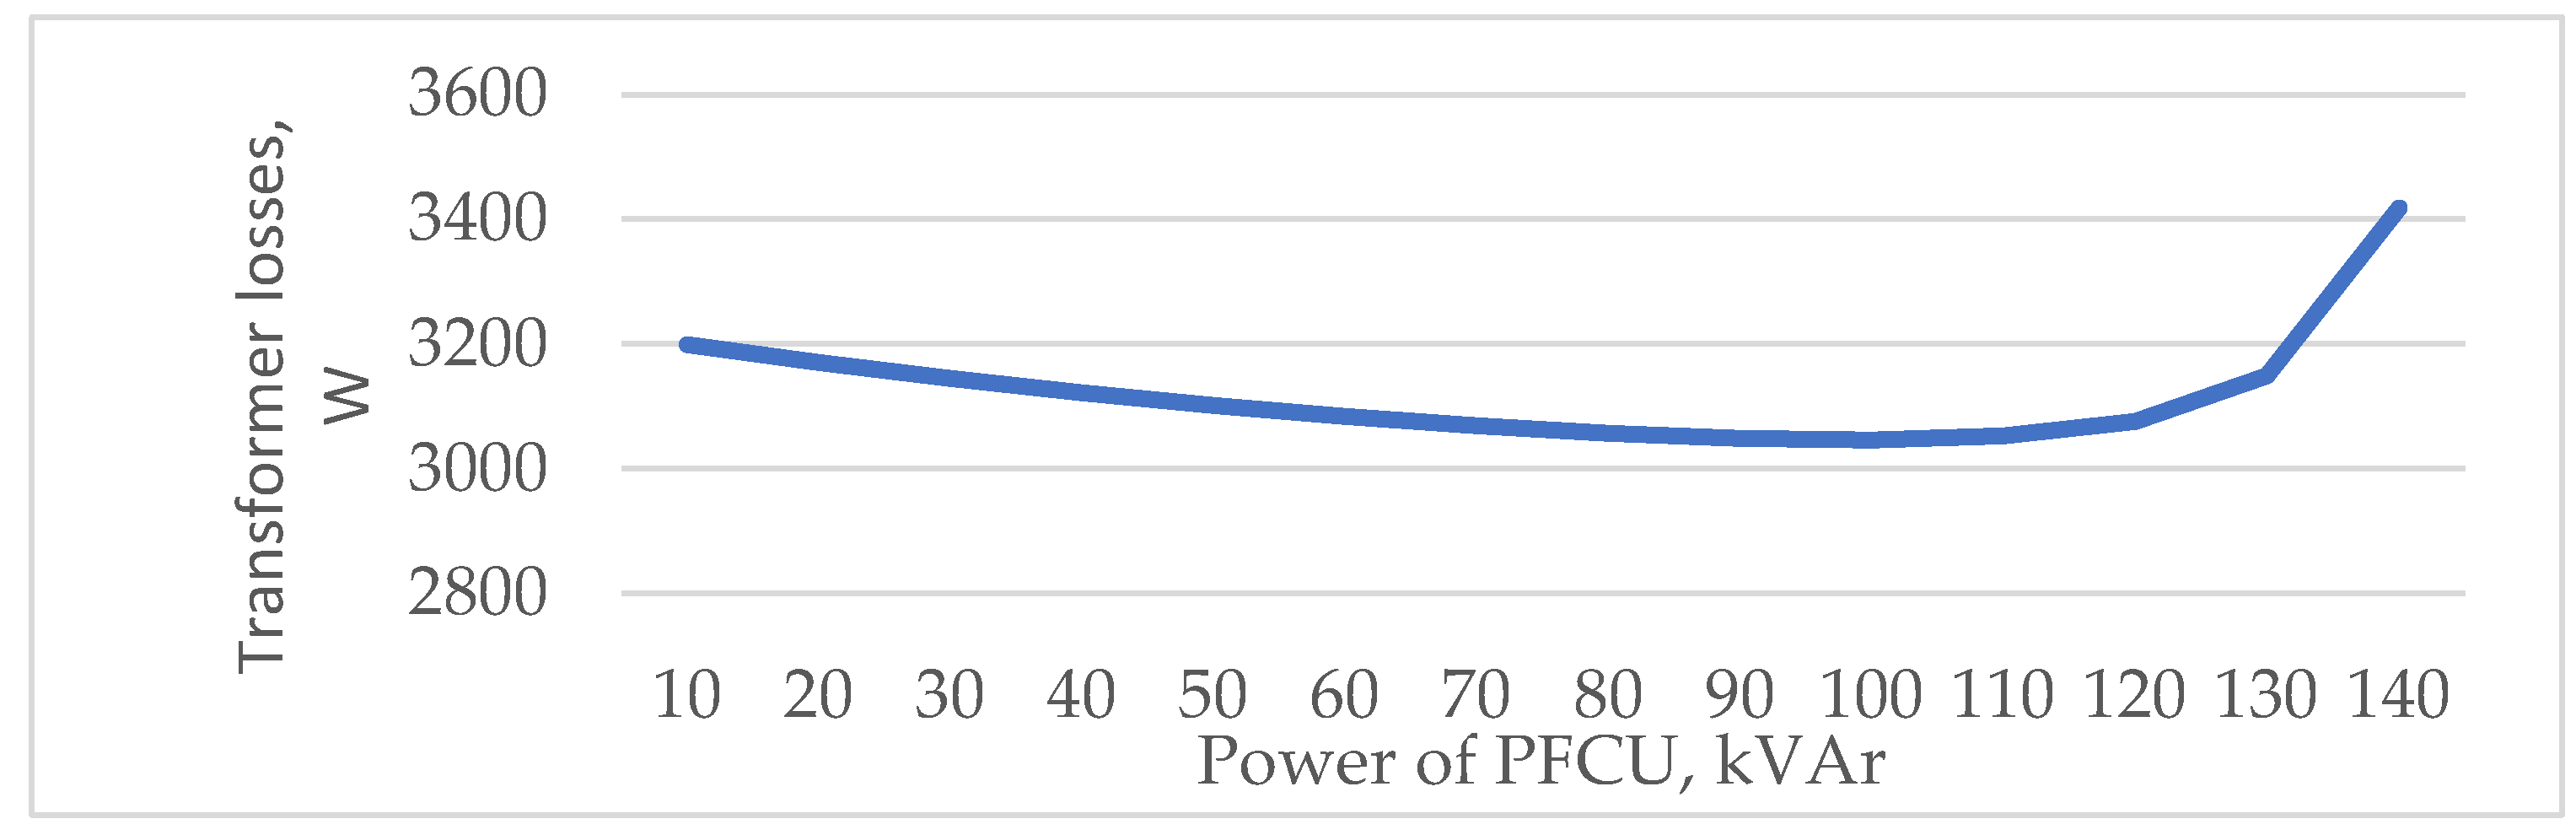
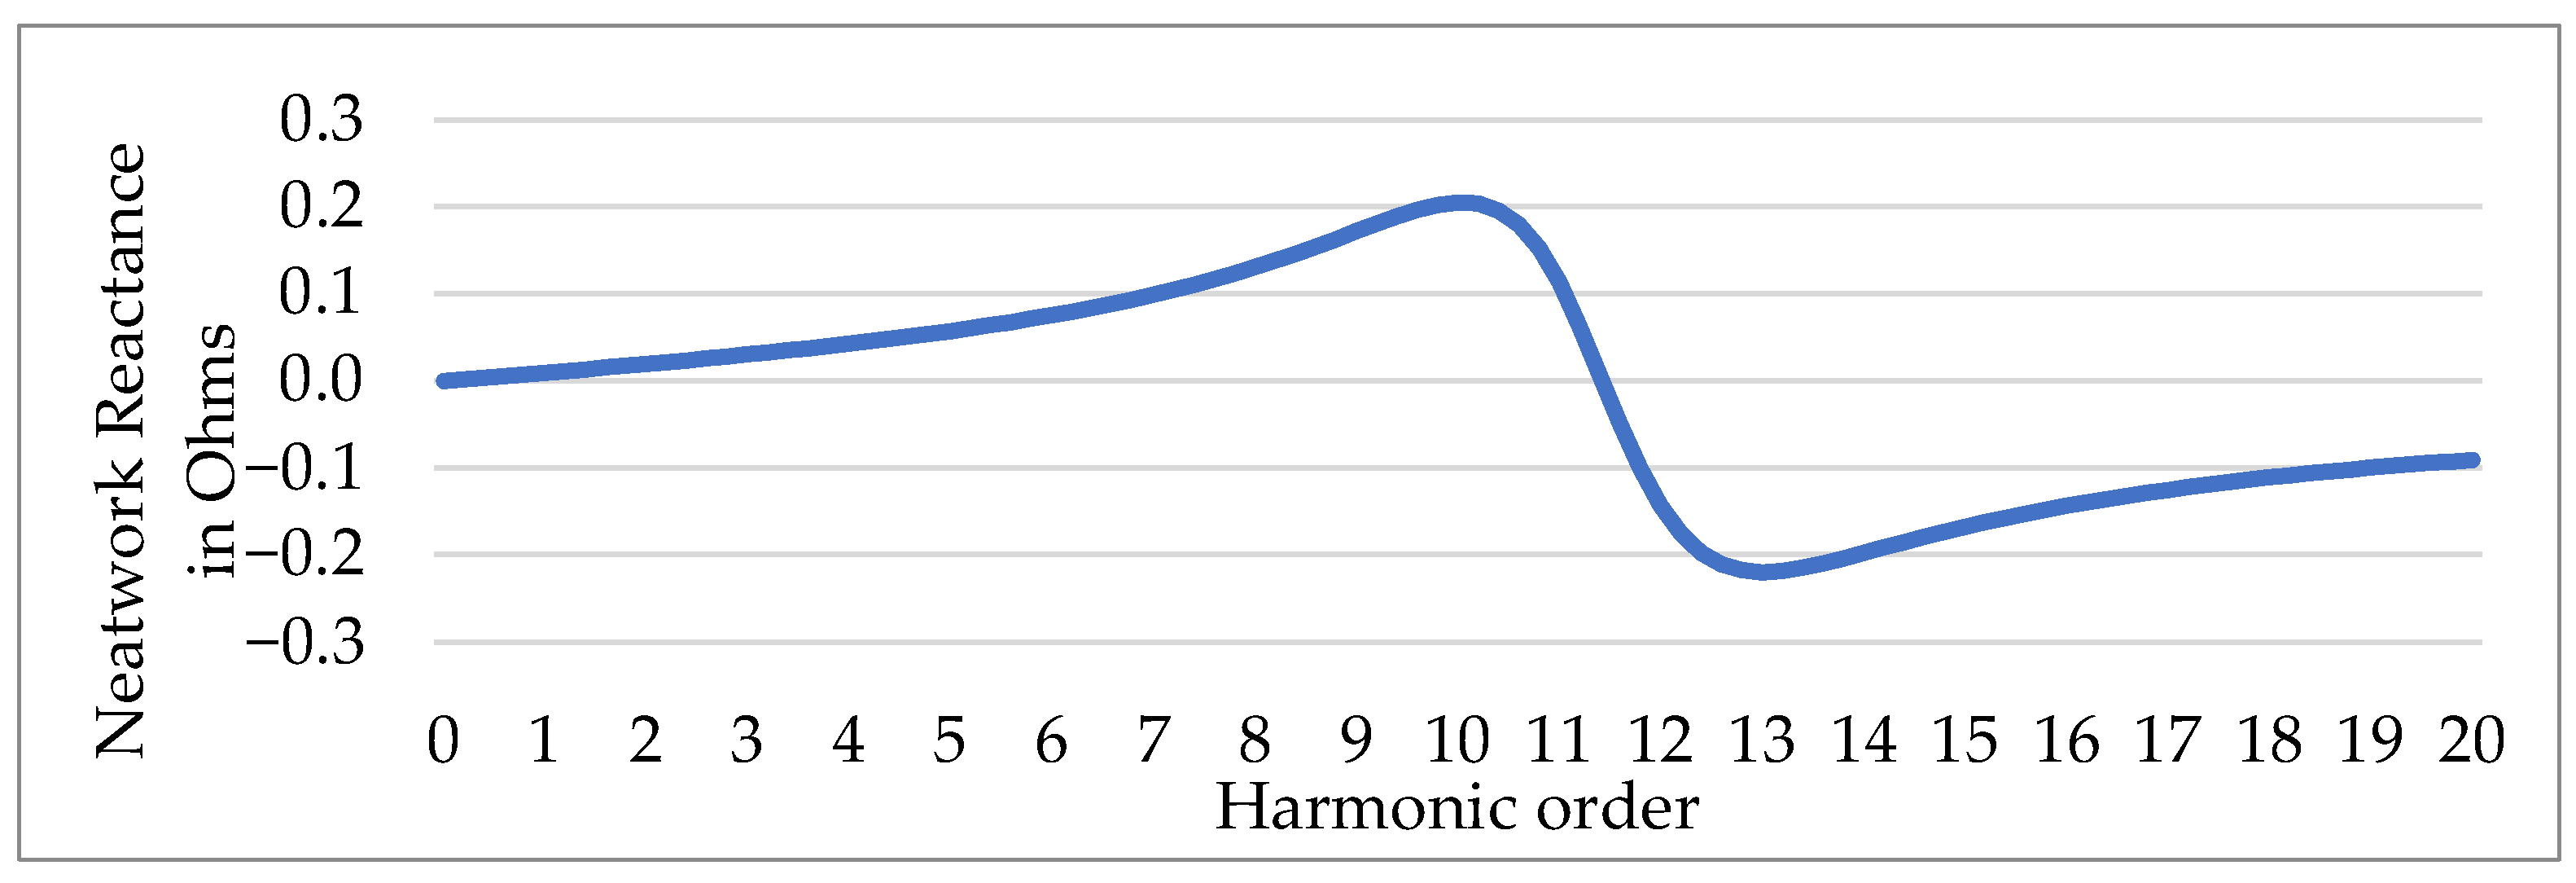
3. Results
4. Conclusions
Author Contributions
Funding
Institutional Review Board Statement
Informed Consent Statement
Data Availability Statement
Conflicts of Interest
References
- Doytch, N.; Narayan, S. Does transitioning towards renewable energy accelerate economic growth? An analysis of sectoral growth for a dynamic panel of countries. Energy 2021, 235, 121290. [Google Scholar] [CrossRef]
- Europe: Renewables in 2022 in Five Charts—And What to Expect in 2023. Available online: https://www.energymonitor.ai/renewables/europe-renewables-in-2022-in-five-charts-and-what-to-expect-in-2023/?cf-view (accessed on 24 November 2023).
- Skamyin, A.; Shklyarskiy, Y.; Dobush, V.; Dobush, I. Experimental Determination of Parameters of Nonlinear Electrical Load. Energies 2021, 14, 7762. [Google Scholar] [CrossRef]
- Europe Added 41.4 GW of New Solar in 2022. Available online: https://www.pv-magazine.com/2022/12/19/europe-added-41-4-gw-of-new-solar-in-2022 (accessed on 18 November 2023).
- Liang, X. Emerging Power Quality Challenges Due to Integration of Renewable Energy Sources. IEEE Trans. Ind. Appl. 2016, 53, 855–866. [Google Scholar] [CrossRef]
- Bhatt, P.K.; Patidar, N.P. Intelligent transformer tap controller for harmonic elimination in photovoltaic interfaced micro-grid network. Eng. Optim. 2022, 55, 1149–1167. [Google Scholar] [CrossRef]
- Barelli, L.; Desideri, U.; Ottaviano, A. Challenges in load balance due to renewable energy sources penetration: The possible role of energy storage technologies relative to the Italian case. Energy 2015, 93, 393–405. [Google Scholar] [CrossRef]
- Hamada, H.; Kusayanagi, Y.; Tatematsu, M.; Watanabe, M.; Kikusato, H. Challenges for a reduced inertia power system due to the large-scale integration of renewable energy. Glob. Energy Interconnect. 2022, 5, 266–273. [Google Scholar] [CrossRef]
- Laimon, M.; Mai, T.; Goh, S.; Yusaf, T. System dynamics modelling to assess the impact of renewable energy systems and energy efficiency on the performance of the energy sector. Renew. Energy 2022, 193, 1041–1048. [Google Scholar] [CrossRef]
- Owosuhi, A.; Hamam, Y.; Munda, J. Maximizing the Integration of a Battery Energy Storage System–Photovoltaic Distributed Generation for Power System Harmonic Reduction: An Overview. Energies 2023, 16, 2549. [Google Scholar] [CrossRef]
- Baggini, A.B. Handbook of Power Quality; Wiley Online Library: Hoboken, NJ, USA, 2008; ISBN 9780470065617. [Google Scholar] [CrossRef]
- Agha, A.H.; Luhach, A.K. Optimized Economic Loading of Distribution Transformers Using Minimum Energy Loss Computing. Math. Probl. Eng. 2021, 2021, 1–9. [Google Scholar] [CrossRef]
- Rodrigues, C.E.M.; Tostes, M.E.d.L.; Bezerra, U.H.; Soares, T.M.; de Matos, E.O.; Filho, L.S.S.; Silva, E.C.d.S.; Rendeiro, M.F.; Moura, C.J.d.S. Technical Loss Calculation in Distribution Grids Using Equivalent Minimum Order Networks and an Iterative Power Factor Correction Procedure. Energies 2021, 14, 646. [Google Scholar] [CrossRef]
- Tamboli, P.D.; Kulkarni, S.; Thosar, A.G. Energy Efficiency in Manufacturing Industry and Analysis of Industrial Motors. In Proceedings of the 2020 4th International Conference on Electronics, Communication and Aerospace Technology (ICECA), Coimbatore, India, 5–7 November 2020; pp. 170–175. [Google Scholar]
- Driving down energy costs: A new report says energy efficiency is the best way for industries to cut spending and reduce emissions right now. In Pit & Quarry; North Coast Media, LLC: Cleveland, OH, USA, 2023; Volume 115, p. 46.
- Zhang, Y.; Zhang, Y.; Chen, S.; Gong, S. How to reduce energy consumption by energy audits and energy management: The case of province Jilin in China. In Proceedings of the 2011 PICMET ‘11: Technology Management in the Energy Smart World (PICMET), Portland, OR, USA, 31 July–4 August 2011; pp. 1–5. [Google Scholar]
- Dat, M.N.; Trung, K.D.; Minh, P.V.; Van, C.D.; Tran, Q.T.; Ngoc, T.N. Assessment of Energy Efficiency Using an Energy Monitoring System: A Case Study of a Major Energy-Consuming Enterprise in Vietnam. Energies 2023, 16, 5214. [Google Scholar] [CrossRef]
- Akhtar, T.; Rehman, A.U.; Jamil, M.; Gilani, S.O. Impact of an Energy Monitoring System on the Energy Efficiency of an Automobile Factory: A Case Study. Energies 2020, 13, 2577. [Google Scholar] [CrossRef]
- Pereira, L.; Nunes, N. Understanding the practical issues of deploying energy monitoring and eco-feedback technology in the wild: Lesson learned from three long-term deployments. Energy Rep. 2019, 6, 94–106. [Google Scholar] [CrossRef]
- Sinvula, R.; Abo-Al-Ez, K.M.; Kahn, M.T. A Proposed Harmonic Monitoring System for Large Power Users Considering Harmonic Limits. Energies 2020, 13, 4507. [Google Scholar] [CrossRef]
- Rinas, I.W.; Suartika, I.M.; Pemayun, A.A.M. Analysis of the Increase of Transformer Power Losses due to the Operation of Unbalanced Nonlinier Loads. J. Electr. Electron. Inform. 2018, 2, 38. [Google Scholar] [CrossRef]
- Faiz, J.; Rezaeealam, B.; Mikhak-Beyranvand, M. Thermal analysis and derating of a power transformer with harmonic loads. IET Gener. Transm. Distrib. 2020, 14, 1233–1241. [Google Scholar] [CrossRef]
- Can, B.; Ayan, O.; Silsupur, M.; Turkay, B.E. Harmonic Effects of Electric Vehicles on Low Voltage Distribution Transformers and Power Grid. In Proceedings of the 2018 2nd International Symposium on Multidisciplinary Studies and Innovative Technologies (ISMSIT), Ankara, Turkey, 19–21 October 2018; pp. 1–6. [Google Scholar]
- Thango, B.A.; Jordaan, J.A.; Nnachi, A.F. Effects of Current Harmonics on Maximum Loading Capability for Solar Power Plant Transformers. In Proceedings of the 2020 International SAUPEC/RobMech/PRASA Conference, Cape Town, South Africa, 29–31 January 2020; pp. 1–5. [Google Scholar]
- Morin, C.; Khodabakhchian, B. 765kV power transformer losses upon energizations: A comparison between field test measurements and EMTP-RV simulations. Electr. Power Syst. Res. 2014, 115, 35–42. [Google Scholar] [CrossRef]
- Eslamian, M.; Vahidi, B. New Equivalent Circuit of Transformer Winding for the Calculation of Resonance Transients Considering Frequency-Dependent Losses. IEEE Trans. Power Deliv. 2014, 30, 1743–1751. [Google Scholar] [CrossRef]
- Jiang, L.-M.; Meng, J.-X.; Yin, Z.-D.; Dong, Y.-X.; Zhang, J. Research on additional loss of line and transformer in low voltage distribution network under the disturbance of power quality. In Proceedings of the 2018 International Conference on Advanced Mechatronic Systems (ICAMechS), Zhengzhou, China, 30 August–2 September 2018; pp. 364–369. [Google Scholar]
- Tan, Z.H.; Chua, K.H.; Lim, Y.S.; Morris, S.; Wang, L.; Tang, J.H. Optimal operations of transformers in railway systems with different transformer operation modes and different headway intervals. Int. J. Electr. Power Energy Syst. 2020, 127, 106631. [Google Scholar] [CrossRef]
- Yan, X.; Yu, X.; Shen, M.; Xie, D.; Bai, B. Research on Calculating Eddy-Current Losses in Power Transformer Tank Walls Using Finite-Element Method Combined with Analytical Method. IEEE Trans. Magn. 2015, 52, 1–4. [Google Scholar] [CrossRef]
- Özüpak, Y. Effect of Frequency on Eddy Losses of Transformers. Int. J. Eng. Appl. Sci. 2021, 13, 36–42. [Google Scholar] [CrossRef]
- Thango, B.A.; Bokoro, P.N. Stray Load Loss Valuation in Electrical Transformers: A Review. Energies 2022, 15, 2333. [Google Scholar] [CrossRef]
- Badri, J.A.; Riba, J.-R.; Garcia, A.; Trujillo, S.; Marzàbal, A. Transformer modelling considering power losses using an inverse Jiles-Atherton approach. Int. J. Electr. Power Energy Syst. 2023, 154, 109461. [Google Scholar] [CrossRef]
- Avdeev, B.; Vyngra, A.; Chernyi, S. Improving the Electricity Quality by Means of a Single-Phase Solid-State Transformer. Designs 2020, 4, 35. [Google Scholar] [CrossRef]
- Tavarov, S.S.; Zicmane, I.; Beryozkina, S.; Praveenkumar, S.; Safaraliev, M.; Shonazarova, S. Evaluation of the Operating Modes of the Urban Electric Networks in Dushanbe City, Tajikistan. Inventions 2022, 7, 107. [Google Scholar] [CrossRef]
- Saxena, N.K.; Kumar, A. Analytical Comparison of Static and Dynamic Reactive Power Compensation in Isolated Wind–Diesel System Using Dynamic Load Interaction Model. Electr. Power Compon. Syst. 2015, 43, 508–519. [Google Scholar] [CrossRef]
- Khatib, T.; Sabri, L. Grid Impact Assessment of Centralized and Decentralized Photovoltaic-Based Distribution Generation: A Case Study of Power Distribution Network with High Renewable Energy Penetration. Math. Probl. Eng. 2021, 2021, 5430089. [Google Scholar] [CrossRef]
- Solomentsev, M.; Okeke, O.; Hanson, A.J. A Resonant Approach to Transformer Loss Characterization. In Proceedings of the 2022 IEEE Applied Power Electronics Conference and Exposition (APEC), Houston, TX, USA, 20–24 March 2022; pp. 596–603. [Google Scholar]
- Frljić, S.; Trkulja, B.; Drandić, A. Eddy current losses in power voltage transformer open-type cores. COMPEL—Int. J. Comput. Math. Electr. Electron. Eng. 2023, 42, 1037–1049. [Google Scholar] [CrossRef]
- Sima, L.; Miteva, N.; Dagan, K.J. A novel approach to power loss calculation for power transformers supplying nonlinear loads. Electr. Power Syst. Res. 2023, 223, 109582. [Google Scholar] [CrossRef]
- Zi, C.; Guo, H.; Wang, S.; Sun, B. A study of on-line monitoring of electric energy balance of agricultural power grid under Internet of Things. In Proceedings of the Seventh International Conference on Mechatronics and Intelligent Robotics (ICMIR 2023), Kunming, China, 16–18 June 2023; Volume 12779, p. 127790Z. [Google Scholar]
- Jagtap, S.; Rahimifard, S.; Duong, L.N.K. Real-time data collection to improve energy efficiency: A case study of food manufacturer. J. Food Process. Preserv. 2022, 46, e14338. [Google Scholar] [CrossRef]
- Gan, L.; Huang, H.-H.; Li, L.; Xiong, W.; Liu, Z.-F. IoT-enabled energy efficiency monitoring and analysis method for energy saving in sheet metal forming workshop. J. Cent. South Univ. 2022, 29, 239–258. [Google Scholar] [CrossRef]
- Benedetti, M.; Cesarotti, V.; Introna, V.; Serranti, J. Energy consumption control automation using Artificial Neural Networks and adaptive algorithms: Proposal of a new methodology and case study. Appl. Energy 2016, 165, 60–71. [Google Scholar] [CrossRef]
- Ueno, T.; Sano, F.; Saeki, O.; Tsuji, K. Effectiveness of an energy-consumption information system on energy savings in residential houses based on monitored data. Appl. Energy 2006, 83, 166–183. [Google Scholar] [CrossRef]
- Introna, V.; Cesarotti, V.; Benedetti, M.; Biagiotti, S.; Rotunno, R. Energy Management Maturity Model: An organizational tool to foster the continuous reduction of energy consumption in companies. J. Clean. Prod. 2014, 83, 108–117. [Google Scholar] [CrossRef]
- Yin, S.; Yang, H.; Xu, K.; Zhu, C.; Zhang, S.; Liu, G. Dynamic real–time abnormal energy consumption detection and energy efficiency optimization analysis considering uncertainty. Appl. Energy 2022, 307, 118314. [Google Scholar] [CrossRef]
- Rezaeealam, B.; Askary, S. Real-time monitoring of transformer hot-spot temperature based on nameplate data. IET Gener. Transm. Distrib. 2023, 17, 3140–3151. [Google Scholar] [CrossRef]
- C57.110™-2018; IEEE Recommended Practice for Establishing Liquid-Immersed and Dry-Type Power and Distribution Transformer Capability When Supplying Nonsinusoidal Load Currents. IEEE: Piscataway, NJ, USA, 2018; pp. 1–68. [CrossRef]
- Lu, G.; Zheng, D.; Zhang, Q.; Zhang, P. Effects of Converter Harmonic Voltages on Transformer Insulation Ageing and an Online Monitoring Method for Interlayer Insulation. IEEE Trans. Power Electron. 2021, 37, 3504–3514. [Google Scholar] [CrossRef]
- Doolgindachbaporn, A.; Callender, G.; Lewin, P.; Simonson, E.; Wilson, G. Data Driven Transformer Thermal Model for Condition Monitoring. IEEE Trans. Power Deliv. 2021, 37, 3133–3141. [Google Scholar] [CrossRef]
- Gulakhmadov, A.; Asanova, S.; Asanova, D.; Safaraliev, M.; Tavlintsev, A.; Lyukhanov, E.; Semenenko, S.; Odinaev, I. Power Flows and Losses Calculation in Radial Networks by Representing the Network Topology in the Hierarchical Structure Form. Energies 2022, 15, 765. [Google Scholar] [CrossRef]
- Asanov, M.; Asanova, S.; Safaraliev, M.; Lyukhanov, E.; Tavlintsev, A.; Shelyug, S. Elementwise power losses calculation in complex distribution power networks represented by hierarchical-multilevel topology structure. Prz. Elektrotech. 2021, 97, 106–110. [Google Scholar] [CrossRef]
- Shadab, S.; Revati, G.; Wagh, S.; Singh, N. Finite-time parameter estimation for an online monitoring of transformer: A system identification perspective. Int. J. Electr. Power Energy Syst. 2023, 145, 108639. [Google Scholar] [CrossRef]
- Plienis, M.; Deveikis, T.; Jonaitis, A.; Gudžius, S. Design of IOT-Based Framework for Evaluation of Energy Efficiency in Power Transformers. Energies 2023, 16, 4358. [Google Scholar] [CrossRef]
- Faiz, J.; Ghazizadeh, M.; Oraee, H. Derating of transformers under non-linear load current and non-sinusoidal voltage—An overview. IET Electr. Power Appl. 2015, 9, 486–495. [Google Scholar] [CrossRef]
- Islam, M.; Sutanto, D.; Muttaqi, K.M. Protecting PFC Capacitors from Overvoltage Caused by Harmonics and System Resonance Using High Temperature Superconducting Reactors. IEEE Trans. Appl. Supercond. 2019, 29, 1–5. [Google Scholar] [CrossRef]
- Motlagh, S.Z.T.; Foroud, A.A. Multiple harmonic sources identification including inverter-based distributed generations using empirical Fourier decomposition. IET Gener. Transm. Distrib. 2023, 17, 1932–1954. [Google Scholar] [CrossRef]
- Khajeh, K.G.; Solatialkaran, D.; Zare, F.; Mithulananthan, N. An enhanced full-feedforward strategy to mitigate output current harmonics in grid-tied inverters. IET Gener. Transm. Distrib. 2020, 15, 827–835. [Google Scholar] [CrossRef]
- Zhou, C.; Zhao, J.; Wang, H.; Yan, S.; Yan, D. Harmonic Analysis and Cancellation of Inverter Systems with Linear Phase-Shifting Transformer. IEEJ Trans. Electr. Electron. Eng. 2023, 18, 1617–1625. [Google Scholar] [CrossRef]
- de Jesus, V.M.R.; Cupertino, A.F.; Xavier, L.S.; Pereira, H.A.; Mendes, V.F. Operation Limits of Grid-Tied Photovoltaic Inverters with Harmonic Current Compensation Based on Capability Curves. IEEE Trans. Energy Convers. 2021, 36, 2088–2098. [Google Scholar] [CrossRef]
- Sriyono; Khayam, U. Suwarno Evaluating the Inter-Resonance Characteristics of Various Power Transformer Winding Designs. IEEE Access 2021, 9, 54649–54656. [Google Scholar] [CrossRef]
- Geth, F.; Van Acker, T. Harmonic optimal power flow with transformer excitation. Electr. Power Syst. Res. 2022, 213, 108604. [Google Scholar] [CrossRef]
- Sumper, A.; Baggini, A. Electrical Energy Efficiency: Technologies and Applications; John Wiley & Sons, Incorporated: Hoboken, NJ, USA, 2012; Available online: https://ebookcentral.proquest.com/lib/ktu-ebooks/detail.action?docID=875759 (accessed on 20 November 2023).
- Lemieux, G. Power system harmonic resonance-a documented case. IEEE Trans. Ind. Appl. 1990, 26, 483–488. [Google Scholar] [CrossRef]
- Deshpande, R.P. Capacitors, 1st ed.; McGraw-Hill Education: New York, NY, USA, 2015; Available online: https://www.accessengineeringlibrary.com/content/book/9780071848565 (accessed on 1 November 2023).
- Nafisi, A.; Rezvani, M.; Arababadi, R.; Esmaeili, S. Harmonic Resonance Assessment Based on Field Measurements Data in an Industrial Plant. In Proceedings of the 2020 19th International Conference on Harmonics and Quality of Power (ICHQP), Dubai, United Arab Emirates, 6–7 July 2020; pp. 1–6. [Google Scholar]
- Boonseng, C.; Chompoo-Inwai, C.; Kinnares, V.; Nakawiwat, K.; Apiratikul, P. Failure analysis of dielectric of low voltage power capacitors due to related harmonic resonance effects. In Proceedings of the 2001 Winter Meeting of the IEEE Power Engineering Society, Columbus, OH, USA, 28 January–1 February 2001; Volume 3, pp. 1003–1008. [Google Scholar]
- Hofmann, W.; Schlabbach, J.; Just, W. Reactive Power Compensation; Wiley: Hoboken, NJ, USA, 2012; ISBN 9780470977187. [Google Scholar] [CrossRef]
- Bayliss, C. Transmission and Distribution Electrical Engineering, 4th ed.; Elsevier: Amsterdam, The Netherlands, 2011. [Google Scholar] [CrossRef]


| Load on LV Side | Order of the Harmonics and Value in % | |||||||||||
|---|---|---|---|---|---|---|---|---|---|---|---|---|
| Active Power PL, kW | Reactive Power Load, QL | Apparent Power SL, kVA | Power of PFC Qc, kVAr | 3 | 5 | 7 | 9 | 11 | 13 | 15 | 17 | 19 |
| 181.56 | 140 | 182.73 | 120 | 0 | 1.76 | 1.68 | 0 | 7.03 | 0 | 0 | 0 | 0 |
| Measured in MV | Calculations | Simulated with Power Factory | |
|---|---|---|---|
| Losses calculated, kW | 3.076 | 3.12 | |
| Load LV, kW | 181.56 | 181.56 | |
| Load measured MV, kW | 184.7 | ||
| Sum | 184.7 | 184.636 | 184.68 |
| Relative error to measurement, % | - | 0.0347 | 0.0108 |
| Relative error to simulation | −0.011 | 0.024 | - |
| Measured in MV | Calculations | Simulated with PF | Calculations with Additional Iteration | |
|---|---|---|---|---|
| Losses calculated, kW | 3.076 | 3.12 | 3.091 | |
| Load LV, kW | 181.56 | 181.56 | 181.56 | |
| Load measured MV, kW | 184.7 | |||
| Sum | 184.7 | 184.636 | 184.68 | 184.651 |
| Relative error to measurement, % | 0.0347 | 0.0108 | 0.0265 | |
| Relative error to simulation | −0.011 | 0.024 | 0.016 |
| IB, A | IT, A | |
|---|---|---|
| 5th harmonic current | 0.19 | 18.0 |
| 7th harmonic current | 0.18 | 7.2 |
| 11th harmonic current | 0.77 | 4.0 |
| 13th harmonic current | 0 | 0 |
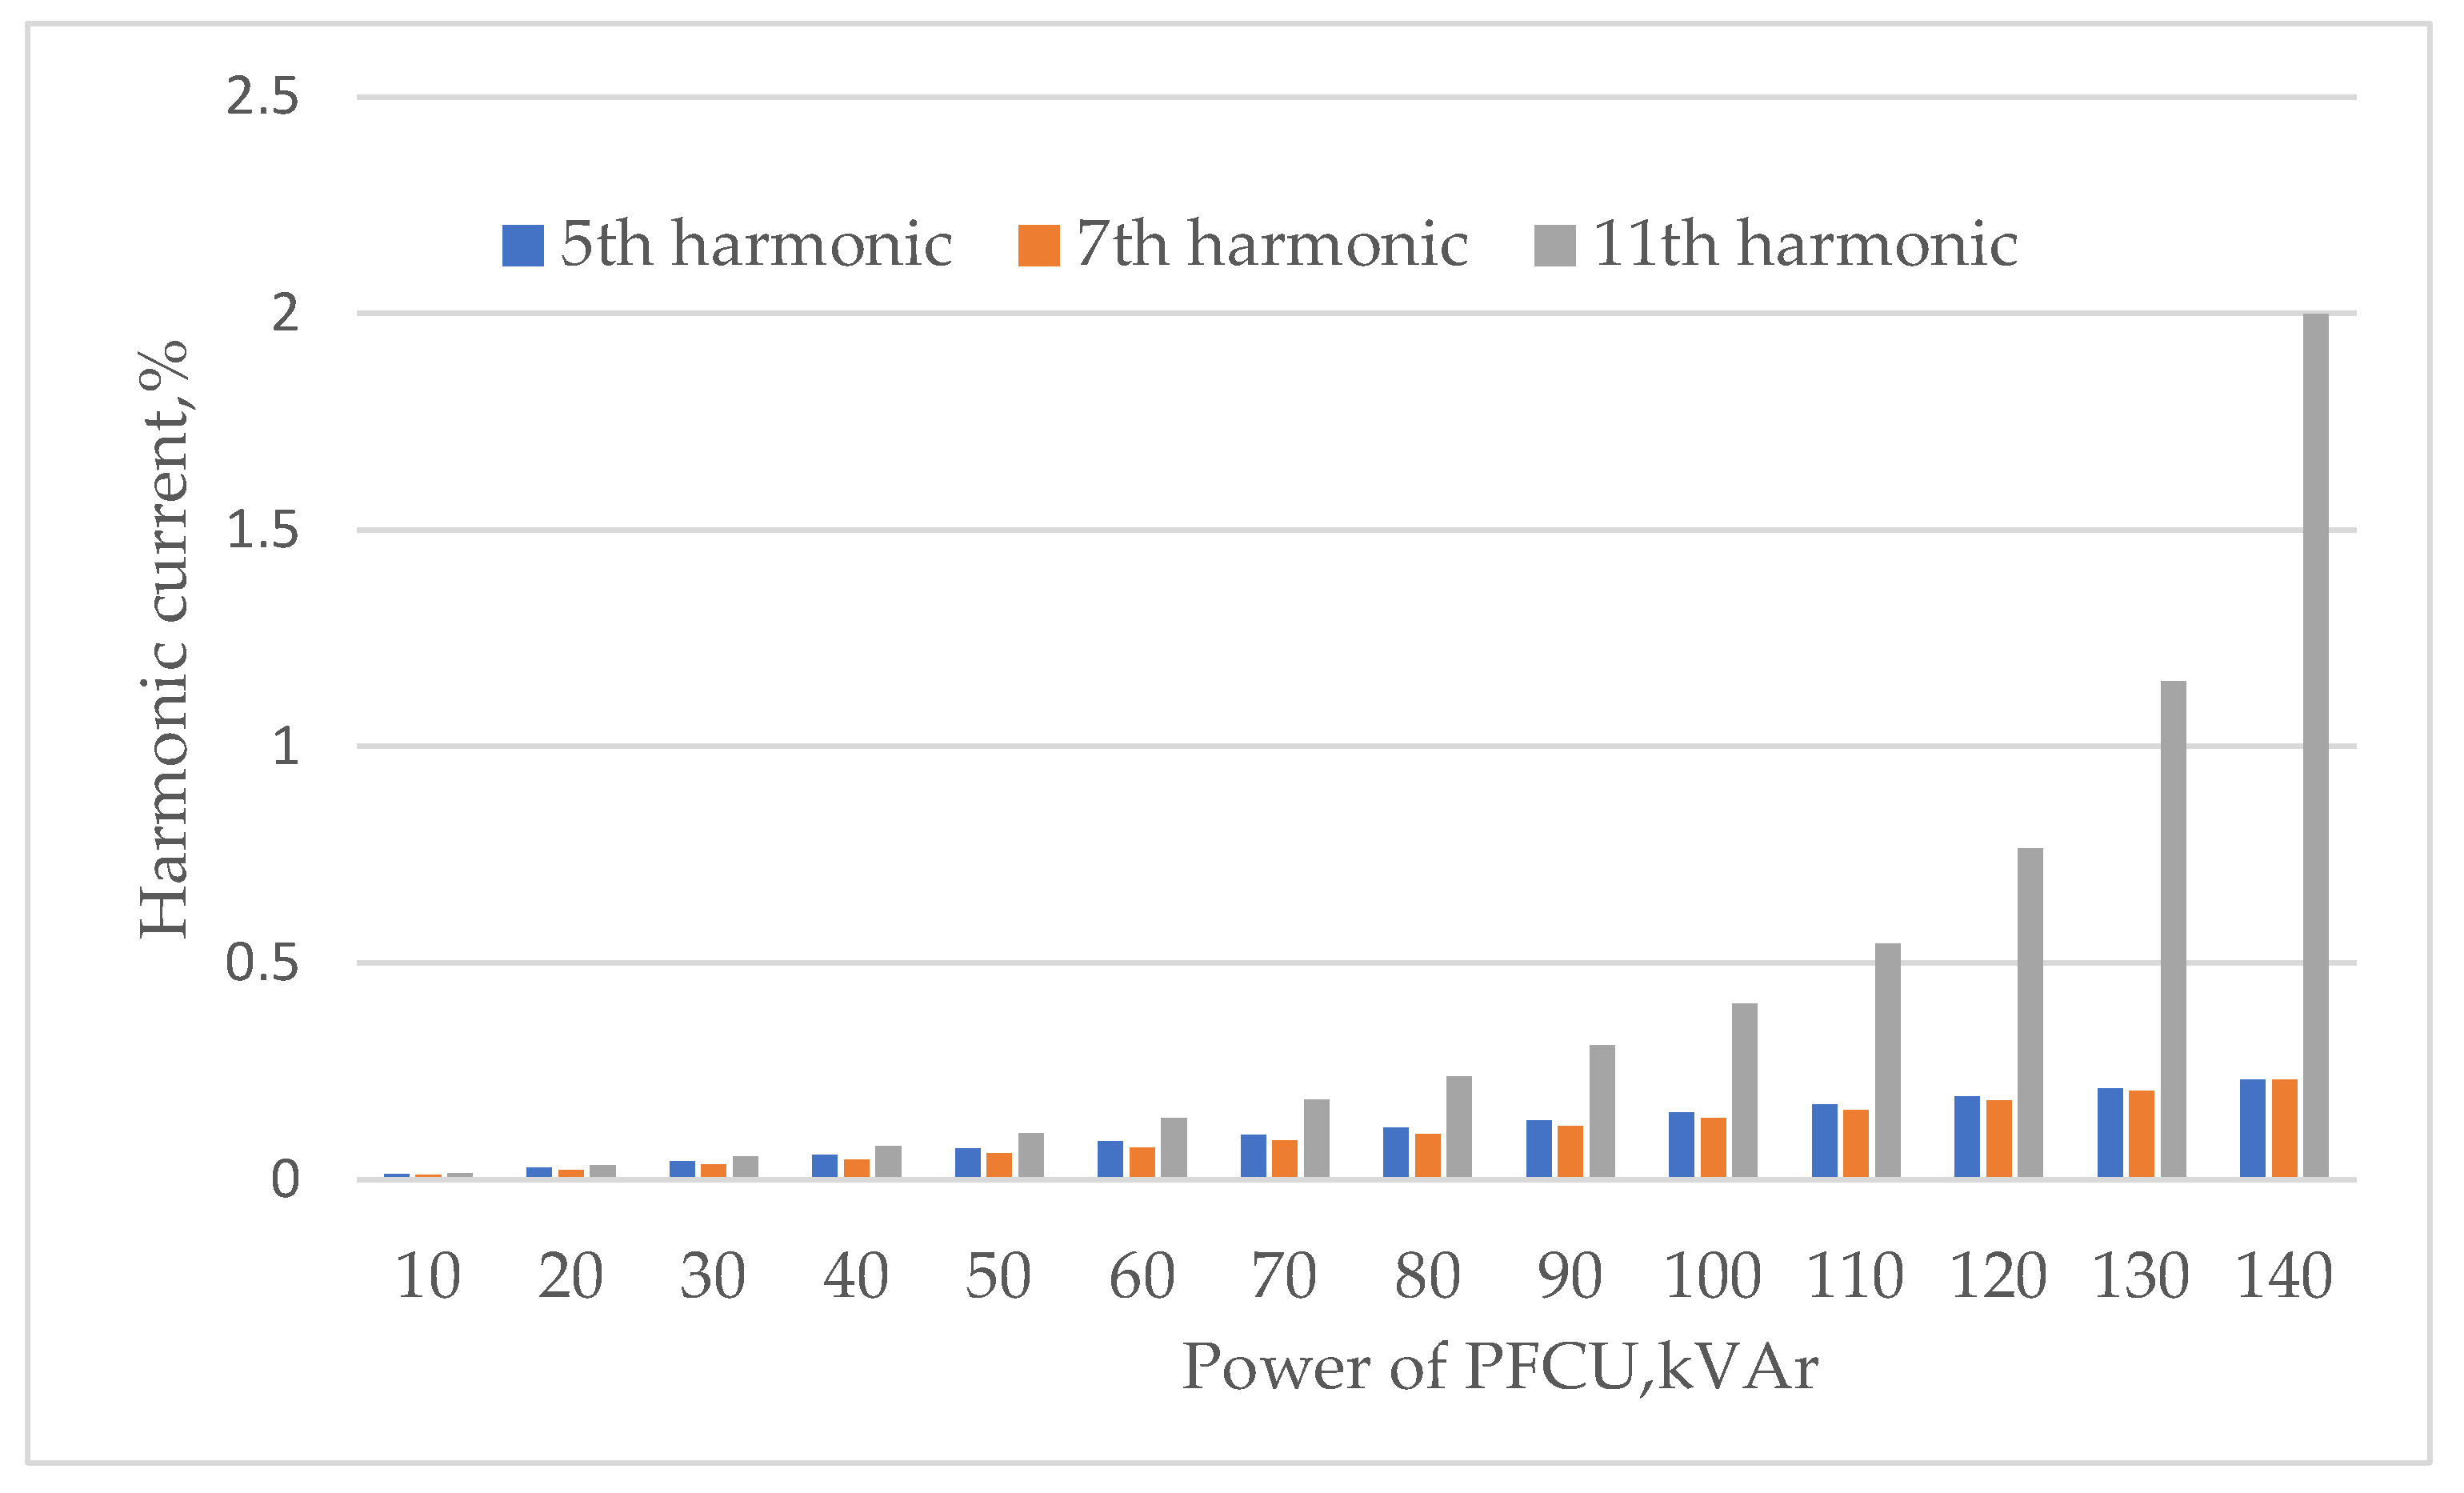
| Power of PFCU, kVAr | Calculated Current of IB’, A | |||
|---|---|---|---|---|
| 5th Harmonic | 7th Harmonic | 11th Harmonic | 13th Harmonic | |
| 10 | 0.01 | 0.01 | 0.02 | 0 |
| 20 | 0.03 | 0.02 | 0.03 | 0 |
| 30 | 0.04 | 0.03 | 0.05 | 0 |
| 40 | 0.06 | 0.05 | 0.08 | 0 |
| 50 | 0.07 | 0.06 | 0.11 | 0 |
| 60 | 0.09 | 0.07 | 0.14 | 0 |
| 70 | 0.10 | 0.09 | 0.18 | 0 |
| 80 | 0.12 | 0.11 | 0.24 | 0 |
| 90 | 0.14 | 0.12 | 0.31 | 0 |
| 100 | 0.15 | 0.14 | 0.41 | 0 |
| 110 | 0.17 | 0.16 | 0.55 | 0 |
| 120 | 0.19 | 0.18 | 0.77 | 0 |
| 130 | 0.21 | 0.21 | 1.15 | 0 |
| 140 | 0.23 | 0.23 | 2.00 | 0 |
Disclaimer/Publisher’s Note: The statements, opinions and data contained in all publications are solely those of the individual author(s) and contributor(s) and not of MDPI and/or the editor(s). MDPI and/or the editor(s) disclaim responsibility for any injury to people or property resulting from any ideas, methods, instructions or products referred to in the content. |
© 2023 by the authors. Licensee MDPI, Basel, Switzerland. This article is an open access article distributed under the terms and conditions of the Creative Commons Attribution (CC BY) license (https://creativecommons.org/licenses/by/4.0/).
Share and Cite
Plienis, M.; Deveikis, T.; Jonaitis, A.; Gudžius, S.; Konstantinavičiūtė, I.; Putnaitė, D. Improved Methodology for Power Transformer Loss Evaluation: Algorithm Refinement and Resonance Risk Analysis. Energies 2023, 16, 7837. https://doi.org/10.3390/en16237837
Plienis M, Deveikis T, Jonaitis A, Gudžius S, Konstantinavičiūtė I, Putnaitė D. Improved Methodology for Power Transformer Loss Evaluation: Algorithm Refinement and Resonance Risk Analysis. Energies. 2023; 16(23):7837. https://doi.org/10.3390/en16237837
Chicago/Turabian StylePlienis, Mantas, Tomas Deveikis, Audrius Jonaitis, Saulius Gudžius, Inga Konstantinavičiūtė, and Donata Putnaitė. 2023. "Improved Methodology for Power Transformer Loss Evaluation: Algorithm Refinement and Resonance Risk Analysis" Energies 16, no. 23: 7837. https://doi.org/10.3390/en16237837