1. Introduction
The energy crisis of 2022 was a shock of unprecedented breadth and complexity. Pressures on markets predated Russia’s invasion of Ukraine, which turned a rapid economic recovery from the pandemic—which strained all manner of global supply chains, including energy—into a full-blown energy turmoil. Russia has been by far the world’s largest exporter of fossil fuels, so its curtailments of natural gas supply to Europe and European sanctions on imports of oil and coal from Russia have severed one of the main arteries of global energy trade [
1]. The result of this extremely complex situation was a spike in inflation in almost every country in the world [
2,
3]. Neri et al. [
4] estimated the contribution of energy shock to headline inflation at around 60% in the fourth quarter of 2022, while its contribution to core inflation ranged from 20 to 50%, depending on the model.
The impact of energy costs on the price index (CPI) is direct and indirect. Of course, the price of electricity, heating and transport costs contribute to the CPI, but energy is a cost for the production of many other products included in the CPI. This applies to both agriculture goods and the industrial sector. Rising production costs push the prices of consumer products up. Economists name this phenomenon cost-push inflation. When the economy is hit by aggregate supply or energy price (cost-push) shocks, the central bank faces a trade-off, as countering the impact on inflation would amplify the negative effects on economic activity [
4,
5] Households do not directly consume crude oil. The first stage of pass-through is reflected in oil-related products and other energy goods and services that are part of the consumer basket, whose price developments are summarized by HICP energy. Indirect inflationary pressures may emerge as higher energy prices increase input costs and the production of non-energy goods and services, which, if passed on to consumers, will be reflected in core inflation (see, e.g., [
6,
7,
8]).
The energy shocks are widely described in the literature (see, e.g., [
9,
10,
11,
12,
13,
14,
15]). Over most of the last two decades, the main source of energy price shocks has been the price of crude oil (gas prices have been much more stable than oil prices), but the 2022 crisis differs because of the extraordinary increase in the price of natural gas, which has had a differential and very strong impact on European countries [
16,
17]. Natural gas, for the purpose of heating and electricity production, provides a significant contribution to the European energy mix.
The problem is that the EU countries are not abundant in fossil fuel energy sources and therefore depend largely on imports. These types of energy sources have seen a steady increase in price as fossil fuels become depleted and the cost of extracting them increases. This also has a negative impact on macroeconomic variables within the economy. The system of supplying energy or fossil fuels to Europe may also be destabilized by all kinds of conflicts or may be used as a tool of political influence [
18,
19]. This is effected, for example, by Russia, which seeks leverage, exposing consumers to higher energy bills and supply shortages [
1].
Aware of such threats, the European Commission took some steps several years ago to reduce this dependence through an ambitious plan to make Europe the first climate-neutral continent in the world [
20]. One of the elements of these changes is the increase in the share of renewables in energy production which is in line with the sustainable development goals implemented in 2016 [
21]. The current EU target for 2030 assumes the use of energy from renewable sources at a level of 32% [
22].
The existing literature describing renewable energy sources emphasizes environmental aspects, such as zero emission of air pollutants, emissions of greenhouse gases, global warming, environmental degradation and public health (see, e.g., [
23,
24,
25,
26,
27]). The economic aspect is usually analyzed from a microeconomic aspect (see, e.g., [
28,
29]). What is important from the point of view of this study is the relationship between renewables and macroeconomic variables, namely high inflation in 2022. Renewable energy sources produce energy domestically, and do not use imported fossil fuels, which makes the economy independent of their fluctuations on world markets and makes it more resistant to external shocks.
Generally, it should be noted that the impact of renewables on inflation is not clear, and research results often lead to different conclusions (compare, e.g., [
19,
30,
31,
32]). First, it should be pointed out that implementing investments in renewables is expensive and the initial costs of their use are high. This leads to cost inflation, especially since the technologies used to produce renewable energy sources have not yet reached the “maturity level” that would allow for cost reduction [
19,
33,
34]. So, in countries that are abundant in fossil fuels, using renewable energy sources can be expensive. However, in countries such as EU members that do not have sufficient oil, gas and coal resources, it may be more beneficial to use renewables and limit the import of fossil fuels. Moreover, the EU’s sustainable development policy means that the costs of renewables are decreasing in the long term. The investment cost decreases with the development of technology because advanced technological infrastructure is developed. Examples include a better way to produce photovoltaic panels, new concepts for installing PV systems on rivers or reservoirs, the development of the energy storage industry or the growth of off-grid installations. The efficiency of the systems results in the commercialization of renewable energy sources and their economic justification. This is due to energy savings, increased efficiency and less damage to the environment. In the long term, unlike the short term, renewables result in lower costs and then inflation [
19,
35]. Moreover, renewable energy is expected to become more preferred [
18,
19]. According to a Lazard analysis [
36], certain renewable energy generation technologies are already cost-competitive with conventional generation technologies. Key factors regarding the continued cost decline of renewable energy generation technologies are the ability of technological development, industry scale and increased competition. The Lazard study shows the significant historical cost declines for utility-scale renewable energy generation technologies driven by, among other factors, decreasing capital costs that should also translate into lower inflation. Timmons et al. [
18] points out that after some time, renewable energy becomes cheaper than fossil fuels, and therefore market forces will effect the transition to renewable energy sources. In countries where this has already happened, renewable energy sources dominate. Therefore, it follows that those countries with a higher share of wind, solar, hydro and other renewable energy sources in the energy mix should also be more resistant to shocks, i.e., the price shock effect should be lower there than in countries with a smaller share of renewables.
It is therefore worth making an attempt to empirically verify whether, within the EU, in countries where the share of renewables is relatively high (i.e., where we can already discuss a developed technological infrastructure in this area allowing for cost reduction), in the face of the shock of 2022, we can observe relatively lower inflation. In other words, it can be treated as the result of many years of accumulating investments in renewables in these countries in the form of resistance to external shocks. The aim of this paper is to assess the relationship between the share of renewables in energy production and the level of HICP and core inflation using a cross-sectional approach in the crisis year of 2022 in the European Union countries. It is important to verify whether this relationship is statistically significant, which would mean that it is not a coincidence. Achieving the aim is related to answering the following research questions:
Will the higher share of renewables in energy production be accompanied by lower inflation in 2022?
Is there an inverse relationship between the share of renewables in energy production and the level of inflation?
Do countries with a similar energy mix structure have similar levels of inflation?
Which energy mix variants promote resistance to energy shocks?
The issue of renewables is very important and topical. However, the literature on the relationship between these energy sources and macroeconomic variables is relatively less extensive. They mainly focus on time series analysis. This study contributes to the ongoing discussion through a static analysis, i.e., an assessment of whether the relatively high share of renewables is a factor that increases the resilience of economies to external energy shocks. This conducted study is also part of an extremely important debate on the effects of the energy crisis of 2022.
This paper has the following structure. After the above introduction,
Section 2 presents the materials, research methods and data sources.
Section 3 contains the research results.
Section 4 is devoted to a discussion presenting other research on the relationship between inflation and renewables and discussion of the specificity of 2022 in the context of the presented issue.
Section 5 contains conclusions and recommendations.
2. Materials and Methods
Data for research on the inflation level of European Union countries were downloaded from the Eurostat statistical database [
37]. Due to the availability of information for 2022, data on the energy mix structure were obtained from the “Our World in Data” website. This platform contains electronic publications on differences and changes in living conditions, global issues and problems (poverty, diseases, hunger, climate change, wars, existential threats and social inequalities). It also provides statistical data regarding, among others, energy aspects, including energy sources [
38].
According to “Our World in Data”, five categories of energy sources are specified in the energy mix: nuclear, coal, gas, oil and renewables. This structure was adopted in this study. Renewable energy, the importance of which is the main consideration in the context of inflation levels in EU countries, is a collective term used to describe many different energy sources. In this study, in accordance with the structure presented in “Our World in Data”, the individual renewable components include biofuel, hydro, solar, wind (both onshore and offshore) and other renewables.
The year under study is 2022, which had a particular impact with regards to the energy crisis. The spatial scope of the research is the countries of the European Union. Malta and Cyprus were excluded from the analysis due to lack of data on energy sources. The analysis is therefore cross-sectional.
In order to assess the importance of the level of the share of renewable energy sources for the level of HICP and core inflation, a simple regression method was used. It should be emphasized here that the aim of this study is not to build a model that would explain inflation in 2022 to the greatest extent possible. Striving to obtain the maximum would be slightly different from the issues discussed in this paper. Because the intention is to verify in 2022, in spatial terms, we can discuss the relationship between two variables: renewables and inflation. In this study, it was crucial to check whether the relationship was positive and statistically significant, which means that it was not a result of chance. In other words, the aim is to answer the question whether, in addition to the climate protection function, higher renewables can also limit the inflationary effects of an energy shock.
In order to determine the hierarchy of the impact of individual types of renewable energy sources, multiple regression was used, carried out on variables normalized via the standard standardization rule.
The next stage of this study was to assess the similarity of EU countries in terms of their energy mix. It was crucial to answer the question of whether countries with a similar energy mix structure were characterized as having a similar level of inflation and to identify which energy mix variant could be most conducive to resistance to energy shocks. For this purpose, EU countries were divided into subgroups using classic cluster analysis. In the first stage of this study, variables were normalized (standardization rule). Its aim was to bring the variables to comparability by depriving the titre of the measurement results and unifying their orders of magnitude [
39,
40]. In the next step, the Euclidean distances between individual units were estimated. Cluster analysis started by selecting the smallest value in the matrix that represented the most similar objects in a given metric (
Figure 1).
The Ward method was used to determine new distances for the reduced set of units [
41]. The measure of the variation is the Error of Sum Square (ESS):
where:
—value of the feature constituting the segmentation criterion that characterizes the i-th unit.
—number of objects in the group.
The precise division of countries into groups was based on the method of maximum difference in agglomeration distance [
42]. Inflation data from individual clusters were compared with data for the entire EU. The degree of differentiation was measured using classical measures of dispersion (standard deviation and coefficient of variation).
3. Results
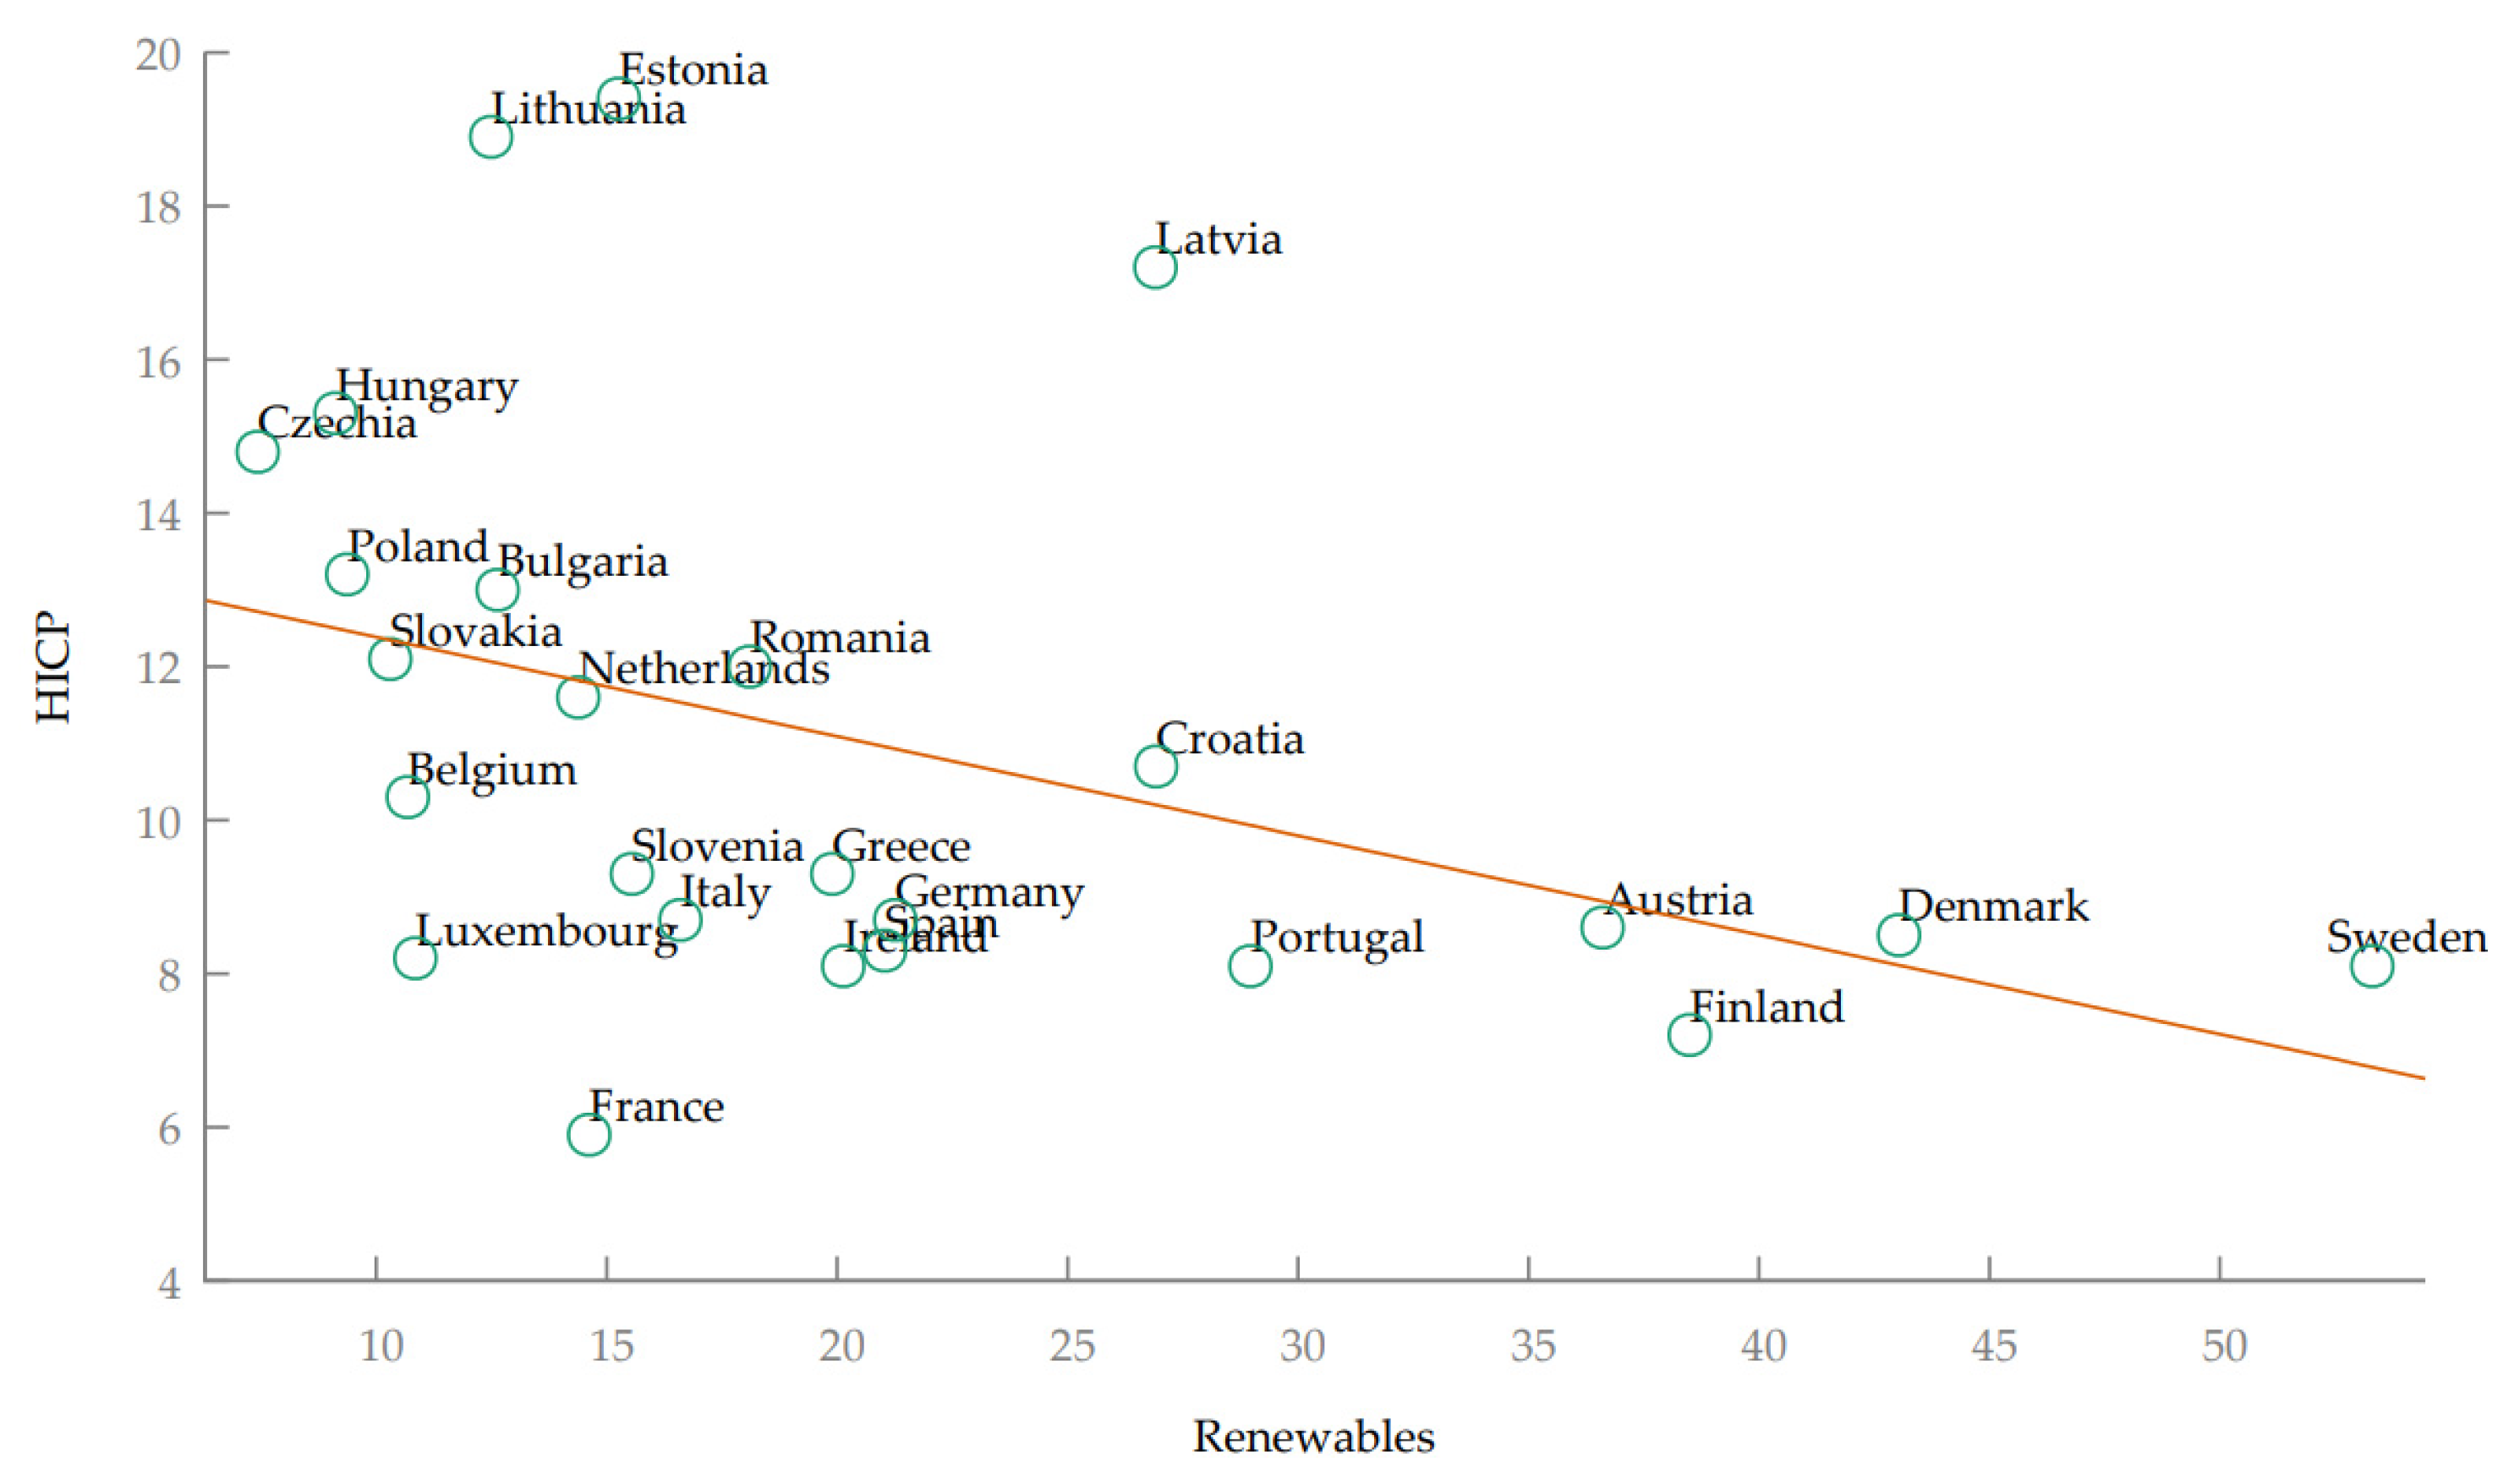
The starting point in the adopted research procedure was to assess whether there was any relationship at all between inflation and the share of renewables in energy production in 2022. For this purpose, these variables are presented in the form of a scatterplot (
Figure 2).
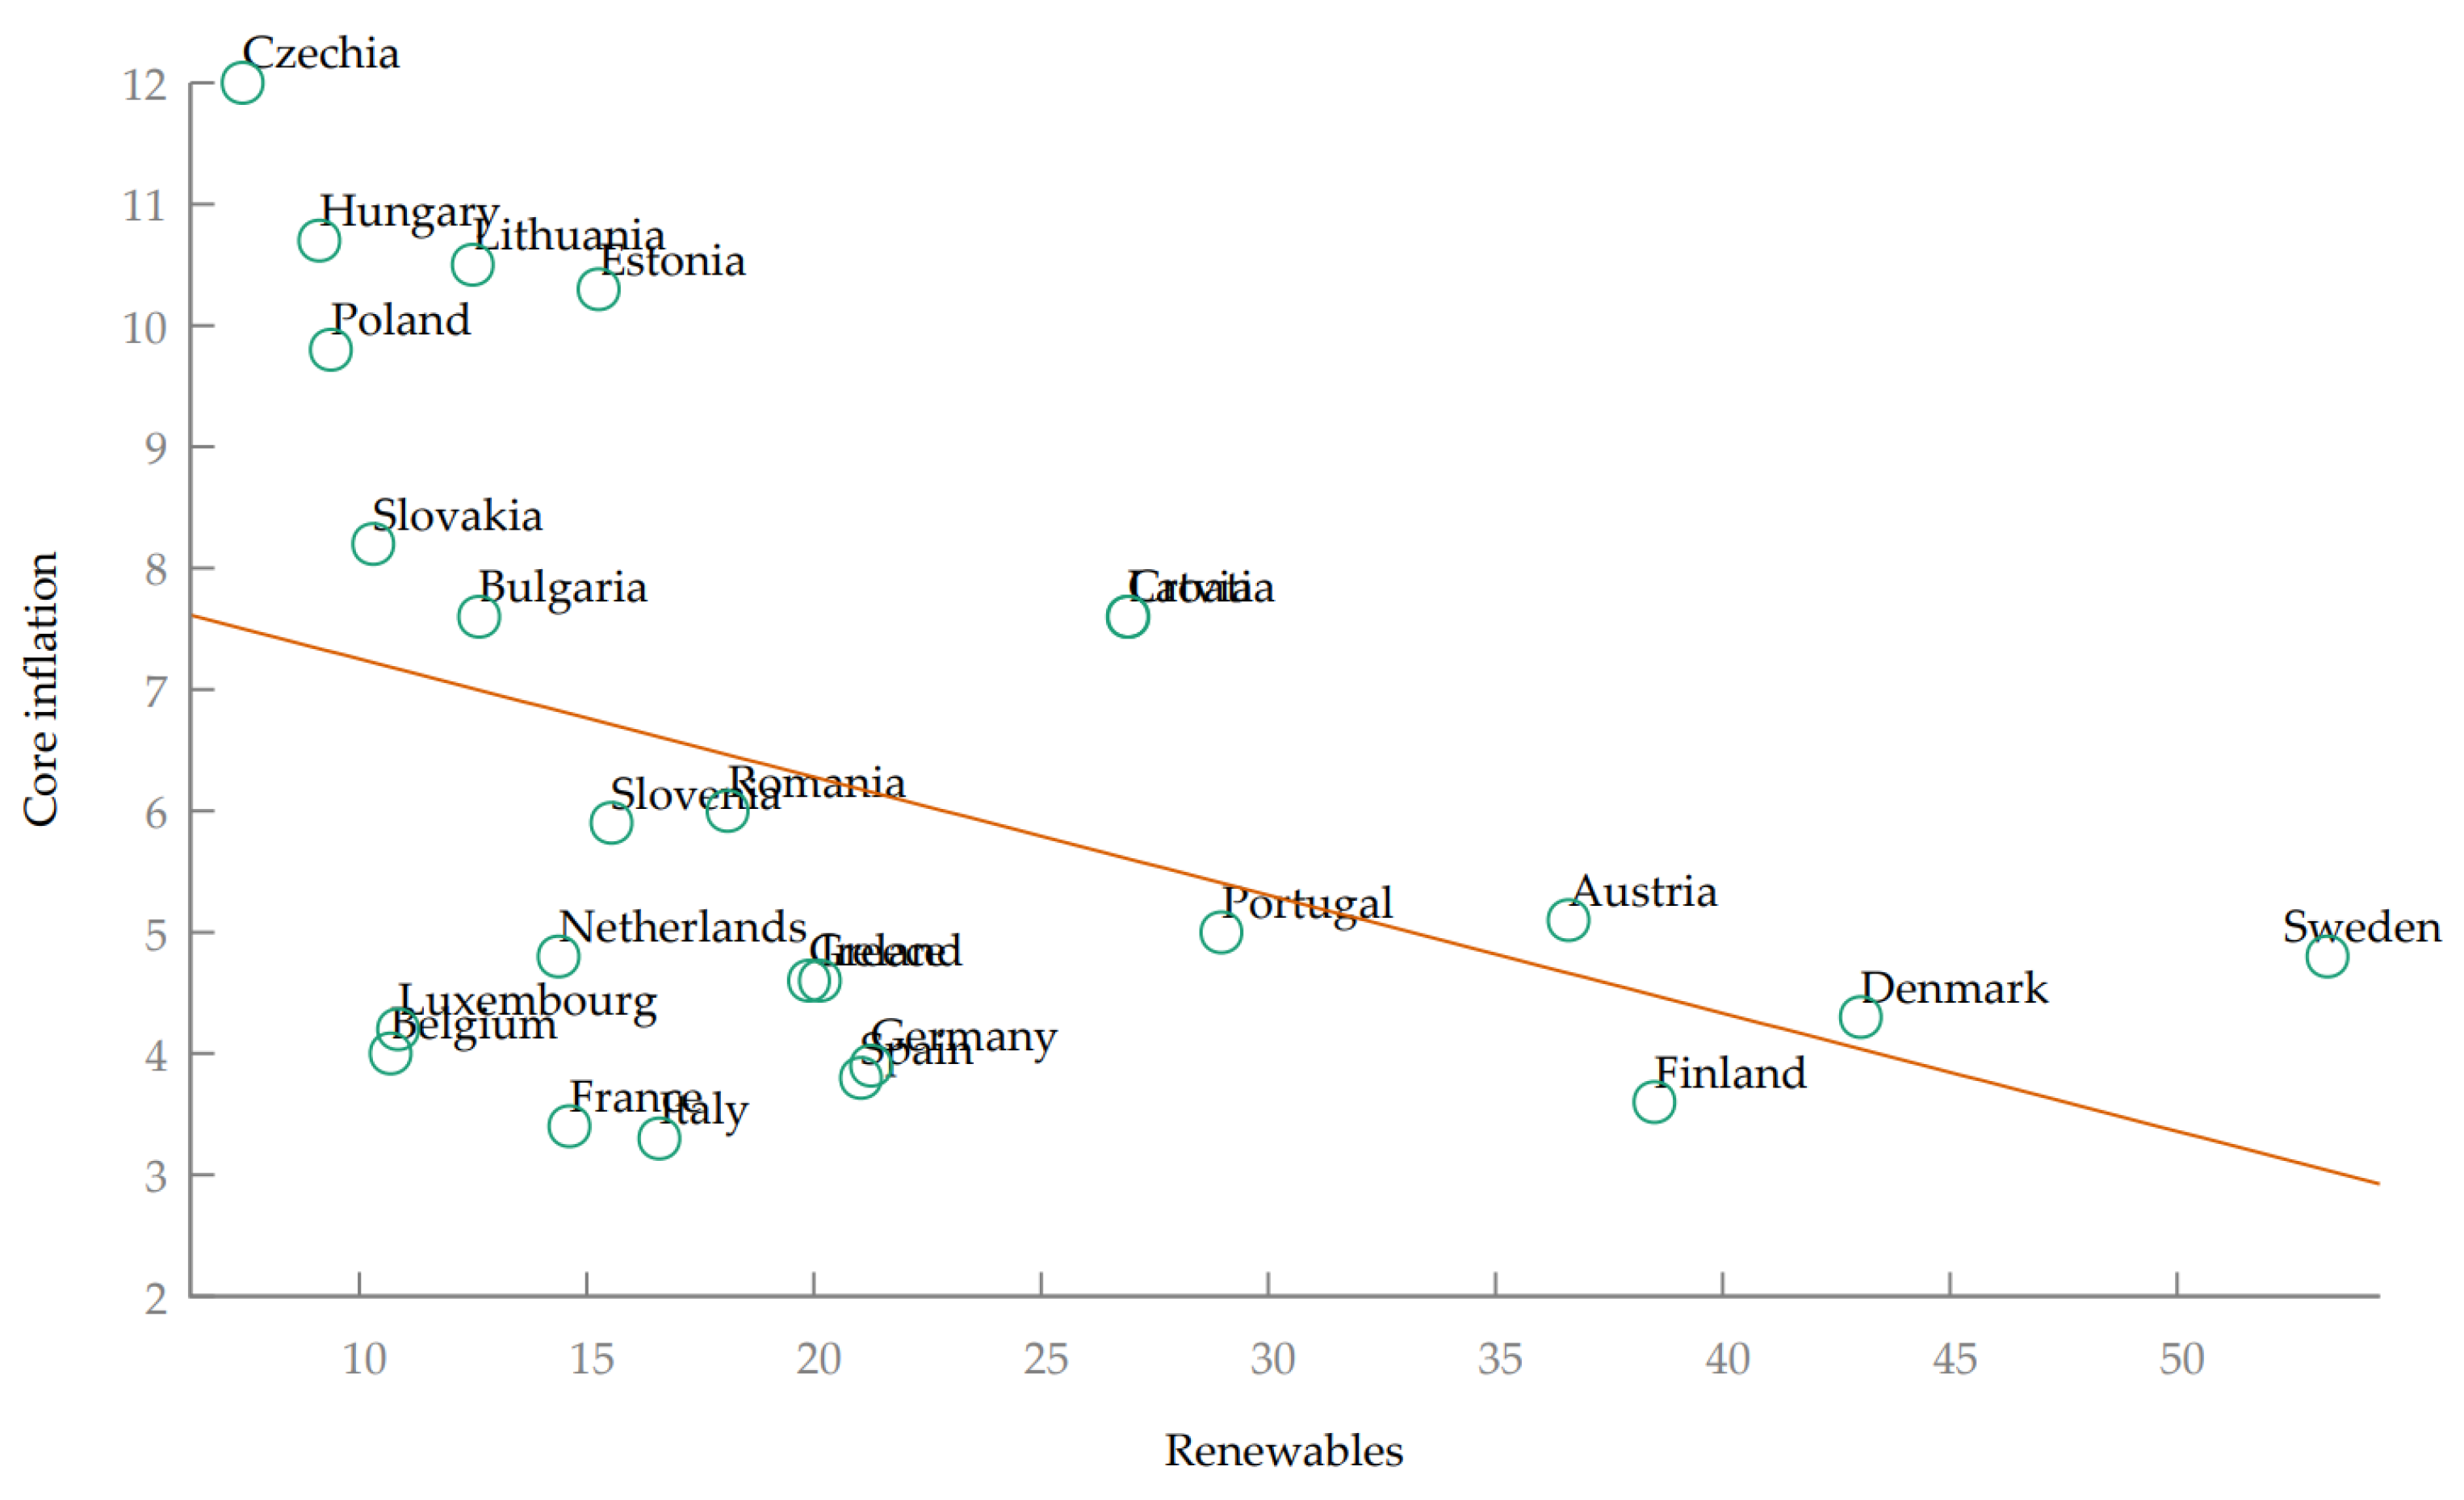
Based on the above chart, a certain negative relationship can be observed. Countries with a high share of renewables were characterized as having relatively lower inflation (e.g., Sweden, Denmark, Finland) and vice versa (e.g., Estonia, Lithuania, Hungary). The situation is similar in the case of core inflation (
Figure 3).
The next element of this study was to verify whether the observed relationships were statistically significant.
Table 1 presents the results of a simple regression that examined the relationship between the share of renewables in energy production (the share of individual types of this energy) and the inflation rate (HICP and core inflation) in EU countries in 2022. Due to the observed dispersion of variables in
Figure 1 and
Figure 2, linear and exponential regression were estimated. For this kind of model, linearization was performed and the so-called linear model with respect to the parameters was obtained:
where:
Table 1.
Simple regression—renewable energy sources and inflation.
Table 1.
Simple regression—renewable energy sources and inflation.
| Variables | | Exponential Model
|
|---|
| HICP | Core Inflation | HICP | Core Inflation |
|---|
| total renewable energy sources | α = 13.68
β = −0.13
= 0.17
SER = 3.43
SE (α) = 1.40
SE (β) = 0.06
p-value (β) = 0.04 | α = 8.22
β = −0.10
= 0.18
SER = 2.46
SE (α) = 1.01
SE (β) = 0.04
p-value (β) = 0.03 | = 13.31
= 0.9885
= 0.19
SER ( model) = 0.29
SE () = 0.12
SE () = 0.005
p-value () = 0.03 | = 7.56
= 0.9867
= 0.15
SER ( model) = 0.38
SE () = 0.16
SE () = 0.007
p-value () = 0.054 |
| biofuel | α = 12.95
β = −1.28
= 0.10
SER = 3.57
SE (α) = 1.39
SE (β) = 0.79
p-value (β) = 0.12 | α = 7.44
β = −0.81
= 0.08
SER = 2.61
SE (α) = 1.02
SE (β) = 0.58
p-value (β) = 0.18 | = 12.69
= 0.8814
= 0.14
SER ( model) = 0.3
SE () = 0.12
SE () = 0.07
p-value () = 0.07 | = 6.96
= 0.8789
= 0.09
SER ( model) = 0.39
SE () = 0.15
SE () = 0.09
p-value () = 0.16 |
| hydro | α = 11.56
β = −0.09
= 0.03
SER = 3.7
SE (α) = 0.95
SE (β) = 0.1
p-value (β) = 0.38 | α = 6.55
β = −0.05
= 0.02
SER = 2.69
SE (α) = 0.69
SE (β) = 0.07
p-value (β) = 0.46 | = 10.99
= 0.9927
= 0.03
SER ( model) = 0.31
SE () = 0.08
SE () = 0.008
p-value () = 0.37 | = 5.9
= 0.9956
= 0.01
SER ( model) = 0.41
SE () = 0.11
SE () = 0.01
p-value () = 0.68 |
| solar | α = 11.92
β = −0.38
= 0.03
SER = 3.70
SE (α) = 1.27
SE (β) = 0.44
p-value (β) = 0.4 | α = 7.19
β = −0.41
= 0.07
SER = 2.62
SE (α) = 0.90
SE (β) = 0.31
p-value (β) = 0.19 | = 11.20
= 0.9726
= 0.02
SER ( model) = 0.32
SE () = 0.11
SE () = 0.04
p-value () = 0.47 | = 6.77
= 0.9313
= 0.09
SER ( model) = 0.39
SE () = 0.14
SE () = 0.05
p-value () = 0.14 |
| wind | α = 12.78
β = −0.27
= 0.20
SER = 3.36
SE (α) = 0.99
SE (β) = 0.11
p-value (β) = 0.02 | α = 7.52
β = −0.20
= 0.21
SER = 2.41
SE (α) = 0.71
SE (β) = 0.08
p-value (β) = 0.02 | = 12.24
= 0.9762
= 0.22
SER ( model) = 0.28
SE () = 0.08
SE () = 0.01
p-value () = 0.02 | = 6.96
= 0.9703
= 0.20
SER ( model) = 0.37
SE () = 0.11
SE () = 0.01
p-value () = 0.02 |
| other renewables | α = 11.14
β = −0.03
= 0.001
SER = 3.76
SE (α) = 1.18
SE (β) = 0.22
p-value (β) = 0.9 | α = 6.52
β = −0.07
= 0.01
SER = 2.71
SE (α) = 0.85
SE (β) = 0.16
p-value (β) = 0.65 | = 10.77
= 0.9936
= 0.005
SER ( model) = 0.32
SE () = 0.1
SE () = 0.02
p-value () = 0.74 | = 6.06
= 0.9865
= 0.01
SER ( model) = 0.41
SE () = 0.13
SE () = 0.02
p-value () = 0.58 |
This model is verified as strictly linear models, and the values of all coefficients calculated for the auxiliary model apply to the original model [
43].
The research results allow for an affirmative answer to the first research question. In the case of “total renewable energy sources”, the results are statistically significant. In 2022 (in cross-sectional terms), a higher share of renewable energy meant a lower level of HICP inflation by 0.13 p.p. and core inflation by 0.1 p.p.ong the individual components of renewable energy sources, the results are statistically significant only in the case of “wind”. It is worth emphasizing, however, that in all cases, the direction of the relationship was consistent with expectations. The exponential model leads to similar conclusions. The parameter less than 1 indicates a negative relationship. If the share of renewables increases by 1 p.p. (in cross-sectional terms), the value of HICP inflation will decrease by approximately 1.15% and the base inflation by 1.33% ((. The important role of “wind” has been confirmed.
What may be of particular interest is the interpretation of the effect sizes of individual variables and the determination of the hierarchy of their influence. However, the above values of unstandardized coefficients are not a good indicator of the strength of the effect. Even in the case of multiple regression, they show the absolute importance of the variable in the function. To know the real strength of the effects of individual variables and to indicate which of them contributes the most to the function, standardized coefficients are necessary [
44]. For this purpose, the variables were normalized (using the standardization rule) and the parameters of multiple regression were estimated. The renewable energy sources are marked as follows:
—biofuel,
—hydro,
—solar,
—wind,
—other. The equation for which HICP is the dependent variable is as follows:
The equation for core inflation is as follows:
Based on the above equations, it can be concluded that wind () had the greatest importance for the HICP level. The variables , and turned out to be statistically insignificant (at the significance level of 0.05). The coefficient was 0.45.
Solar () had the greatest importance for the level of core inflation. The variables (although the p-value was 0.06), and turned out to be statistically insignificant. The coefficient was also 0.45. It is worth noting that the last variable () indicated the direction of the relationship in the two equations, which is inconsistent with the theory.
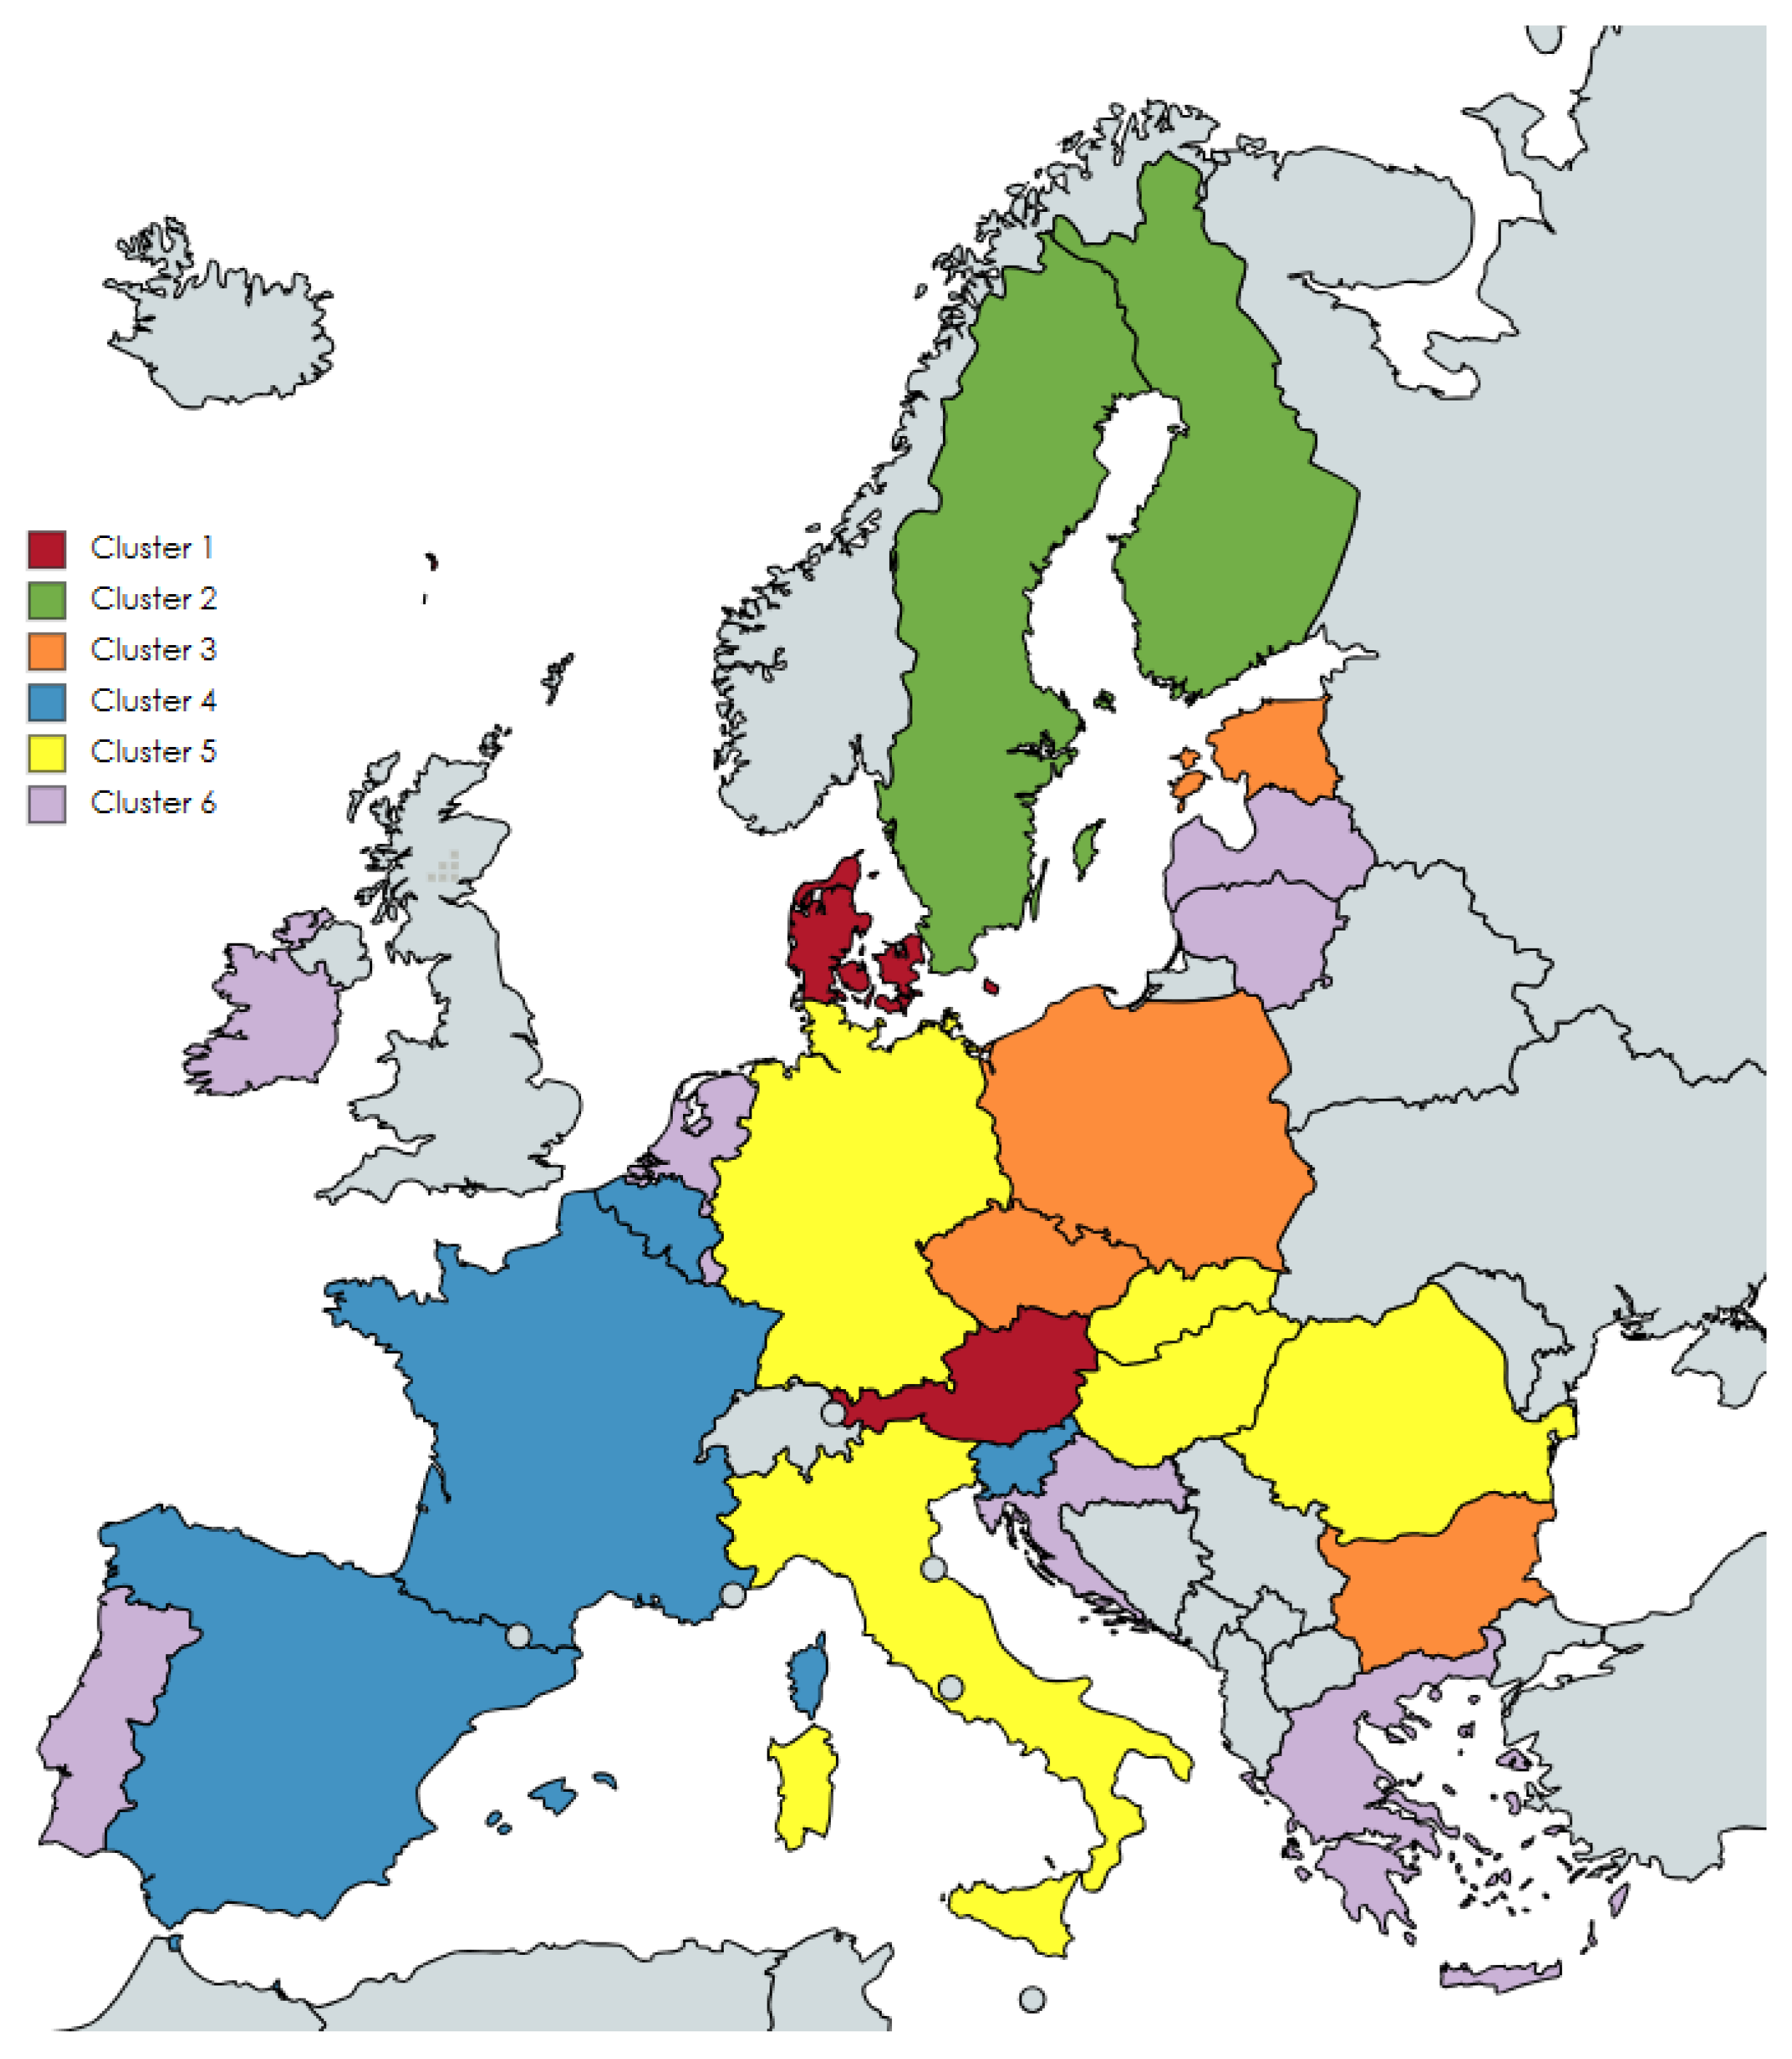
The next stage of this study was to verify whether countries with a similar energy mix structure were characterized by a similar rate of price growth in 2022. For this purpose, the 25 EU countries surveyed were divided into clusters using hierarchical segmentation (classic cluster analysis). The results are shown in
Figure 4.
Table 2 contains the names of the countries in each cluster and the corresponding HICP and core inflation rates.
Based on such a preliminary analysis, it is possible to substantiate the assumption that countries with a similar energy mix structure were characterized by similar price growth dynamics in 2022. In order to deepen the analysis, the results regarding individual clusters should be compared to the data of the entire European Union (
Table 3).
The first cluster (Austria, Denmark) consists of only two countries. It is characterized by a relatively high share of renewables in energy production (average 39.8%). Oil has a slightly lower share (38.4%). These countries were very similar in terms of inflation levels and were characterized by the lowest differentiation among all the identified clusters.
The next cluster includes two Scandinavian countries (Finland and Sweden) with a very large share of renewables (average 45.9%) and nuclear (average 19.86%). In this separate group, the average HICP and core inflation was the lowest. In this case, we can also discuss the similarity of the price growth rate compared to other clusters.
The third cluster consists of four Central and Eastern European countries (Bulgaria, Czech Republic, Estonia, Poland), where the energy source is dominated by coal (average 40.9%) and oil (average 27.2%). The average share of renewables is 11.2%. This is a relative high emission energy mix. An important element of the EU environmental policy is the European Union Emissions Trading System (EU ETS) to reduce carbon emissions in a cost-effective manner, and to spur the development of new low-carbon technologies [
46]. For example, Moessner [
47] investigated the impact of carbon prices on inflation. They found that an increase in prices of ETS by USD 10 per ton of CO
2 equivalents increases energy CPI inflation by 0.8 p.p. and headline inflation by 0.08 p.p. The entire cluster is characterized by higher inflation on average than the average within the entire EU, but at the same time less diversification. In this case, it can also be concluded that a similar energy mix favors similar inflation. It is worth noting that in this cluster, there is a subgroup consisting of Bulgaria and the Czech Republic, in which nuclear has a significant share (17.8 and 16.7%, respectively).
Cluster No.4 includes Belgium, Spain, Slovenia and France, where the main source of energy is oil (average 42.74%). It is also worth noting the significant share of nuclear in each of these countries (average 19%). The average share of renewables is 15.5%. The average inflation in this group was lower than in all the surveyed EU countries. The differences in the level of inflation within the cluster were also smaller.
In group 5 (Germany, Romania, Italy, Hungary, Slovakia), the countries are characterized by a relatively even energy mix structure. In each country, oil dominates (average 34%), but gas (average 29.8%), nuclear (in Slovakia and Hungary) and renewables (Romania, Germany, Italy) are also of considerable importance. The average share of renewables for all countries is 15.1%. The average inflation in this cluster was higher than in the EU. In the case of HICP inflation, the diversification was lower, and in the case of core inflation—higher.
The last largest cluster (consisting of Croatia, Ireland, The Netherlands, Greece, Lithuania, Latvia, Portugal and Luxembourg) is definitely characterized by the highest share of oil in the entire EU (average 53.2%). In second place is gas (average 22.9%), then renewables (average 20.1%). The nuclear share is almost zero. In this group of countries, HICP inflation was higher than in the entire EU (there was also higher differentiation within the cluster), and the core inflation was slightly lower (with lower differentiation within the cluster). However, this cluster includes countries that significantly lag behind the rest (Lithuania and Latvia). Without them, the cluster is much more coherent due to the level of inflation, and the dispersion measures are much lower than for the entire EU.
To sum up, it can be said that the countries within a given cluster are characterized by a similar level of inflation, although there are a few outliers. Mostly in clusters with a relatively large share of renewables, the average inflation level was lower than in the entire EU. The lowest inflation rates were recorded in countries with a high share of renewable energy complemented by a high share of nuclear energy. This result may suggest that this energy mix provides the best resilience against external energy shocks.
4. Discussion
The connections between inflation and renewables have already been discussed in the literature on the subject, especially in recent years. A valuable review of the literature in this respect was conducted by Arslan and Yildiz [
19]. The results are inconclusive. The lack of a relationship between these two variables in the long term in Brazil was observed by, among others, Deka et al. [
30]. However, the authors proved that the use of renewable energy negatively affects the exchange rate (appreciation), so in addition to reducing carbon dioxide emissions, it is a positive phenomenon, which justifies the use of this type of energy. Deka and Dube [
48], reach similar conclusions for Mexico. The lack of causality of renewables on inflation was also observed by Malik et al. [
49] for Pakistan.
There are also studies indicating that there is a positive relationship between renewables and inflation. Filippidis et al. [
31] conducted research on over 200 countries (2000–2019) and pointed to a positive relationship between these variables. The authors mainly argue that the relationship between economic growth and renewable energy is U-shaped, and that the increase in renewable energy consumption reduces income inequality. A positive impact in the short term was also observed in the previously mentioned study by Deka and Dube [
48] and Nga [
50] for Vietnam.
However, most research indicates a negative relationship between renewables and inflation. Arslan and Yildiz [
19] found that there is a cointegration relationship between renewable energy and inflation. It is true that renewable energy sources had no impact on inflation in the short term, but in the long term the impact was negative. The decrease in prices is influenced by the decrease in expenditure resulting from technological development. The authors observed a reduction in inflation in some European countries in the long term, however, they have emphasized the diversity of renewables among EU member states, which means that in some countries, it may take longer to observe a reduction in inflation. A negative relationship between renewables and inflation in the long term among OECD countries was also observed by Yıldırım and Kaya [
33]. Research results by Khan et al. [
32] show that alternative energy sources and inflation are negatively related in Germany. Economic growth, however, is positively related to environmental quality. The authors formulated recommendations for decision-makers to eliminate subsidies for domestic coal mining and promote profitable environmental policy projects. A negative relationship between prices and renewable energy in Iran was observed by Ghaed et al. [
51].
The research results in this study also lead to the conclusion that a higher share of renewables in energy production is accompanied by lower inflation. However, before formulating final conclusions, some annotations should be added to the obtained research results. The purpose of this study was not to describe the entire inflation phenomena in 2022, but one should be aware of the multi-faceted nature of the price shock. It is worth noting that inflation has already been rising compared to previous years. The post-pandemic rebound in demand was of great importance [
2,
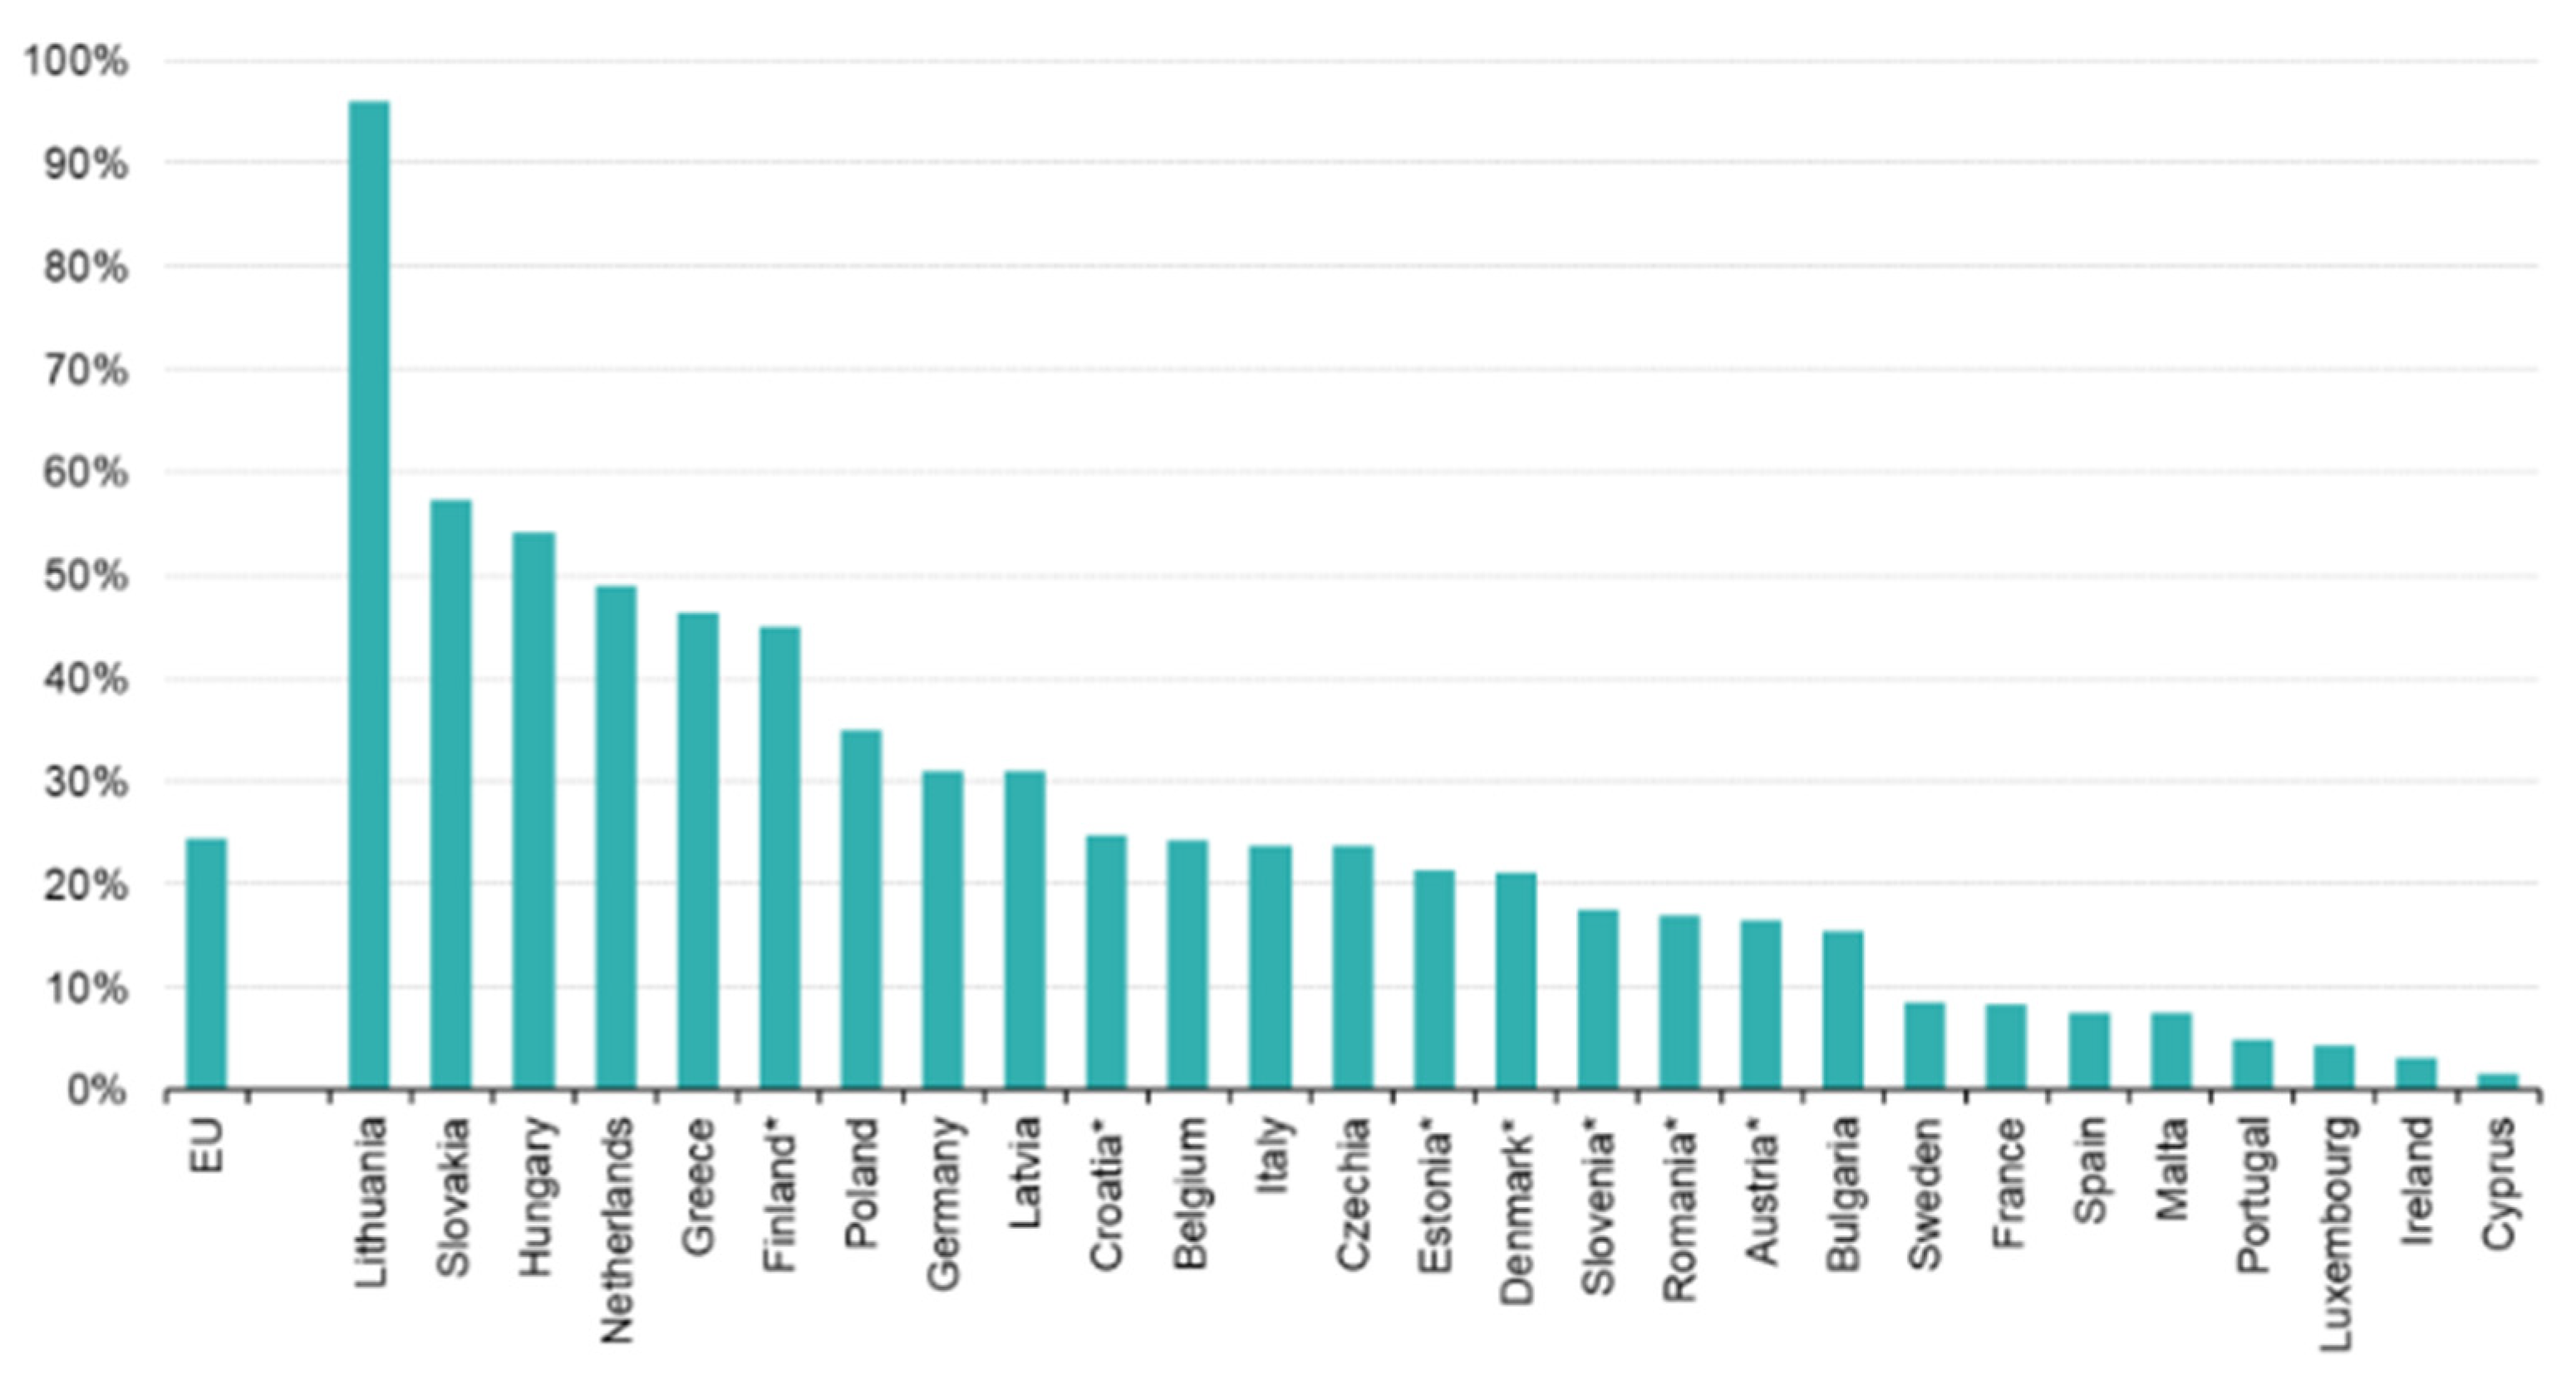
52]. Particular attention should be paid to 2021, when global climatic conditions affected the supply of many products, mainly agricultural ones. Moreover, inflation in 2022 was influenced not only by the degree of dependence on imports of energy products, but above all by the specific countries from which these products were imported. In 2020, Russia was the leading supplier to the EU of all major primary energy raw materials: natural gas, crude oil and hard coal. The different energy mix of individual EU countries causes different energy dependence of individual EU members on Russia [
53]. In 2020, the countries with the largest share of energy needs met by Russian imports into the EU were Lithuania, Slovakia and Hungary. The least dependent were Cyprus, Ireland and Luxembourg (
Figure 5).
Despite the above issues, the obtained research results justify the conclusion that a higher share of renewables contributes to increasing the resistance of EU economies to external shocks. Even though European countries rank high in terms of the share of renewables [
38], this share in the energy mix is still too small to protect all of the European Union against the inflationary effects of an energy crisis. Therefore, it is advisable to intensify efforts to develop renewable energy sources. Despite the ambitious plan, the difficulty of increasing the resilience of European economies against energy shocks is a complex issue. This is, for example, due to the specificity of the market in Europe. The investigated countries cooperate in the energy sector as members of the European Union. National energy markets are not separated from their neighbours but are interdependent with them. Jankiewicz and Grądzik [
54] point out the problem with the rapid development of renewable energy sources concentrated in some regions as well as the difference in infrastructure conditions in respective countries. The unplanned power flows are especially prevalent during windy days. For example, in periods when German electricity is cheap, and especially at times of high wind power production in the northern part of the country, Austria imports this electricity either for consumption or storage purposes. Unplanned power flows cause negative consequences for the transit country because interconnectors are permanently overloaded [
54]. Despite technical problems related to insufficient transmission capacity, international electricity trading is developing throughout Europe. European policy is intended to develop territorial cooperation by increasing the diversity of energy sources and transmission routes [
55].
It is also important to remember that renewable energy sources are not completely free of fuel costs. Variations in fuel prices can materially affect the total costs of conventional generation technologies, but direct comparisons to “competing” renewable energy generation technologies must take into account issues such as dispatch characteristics (e.g., baseload and/or dispatchable intermediate capacity vs. peaking or intermittent technologies). In addition to fuel costs, capital and Operation and Maintenance (O&M) costs also influence the prices of energy produced [
36]. In the short term, this may suppress involvement in investments in renewable energy sources, especially in countries where the technological infrastructure in this area is not yet developed. In recent years, this issue has been of significant importance.
Table 4 contains a comparison of the levelized cost of energy in 2021–2023 conducted by Lazard [
36].
According to the Lazard analysis [
36], in the years 2021–2023, the cost of energy from both renewable and non-renewable sources increased. This may be due to the fact that fossil fuels are also needed to run renewable energy sources. The increases themselves may also be the result of the pandemic. However, certain renewable energy generation technologies are already cost-competitive with conventional generation technologies. This is a good forecast for the future, which allows us to assume that along with the growing competitiveness of renewable energy sources, their share in the energy mix will increase. This will undoubtedly contribute to the solution of the so-called energy trilemma: ensuring energy security, environmental sustainability and energy affordability and availability [
56,
57]. This is particularly important for EU countries that are poor in fossil fuels and can therefore improve their trade balance with the use of renewables.
5. Conclusions
Based on the obtained research results, it can be concluded that in the face of the energy shock in 2022, a higher share of renewables in energy production was conducive to lower inflation. It follows that increasing renewables should not only be good for the planet, but also good for the economy and good for consumers. It is true that this study only concerns the specific year 2022, but one can also argue that such effects are the result of the accumulation of renewables in the long term, because in clusters which contain countries with a large share of this type of energy (meaning they had been implemented over a long time), average inflation was relatively low. Moreover, the research indicates a potential variant of the energy mix that is most resistant to energy and inflation shocks. A larger share of renewable energy complemented by nuclear energy could increase the country’s resistance to external supply shocks.
Therefore, it is justified to formulate recommendations for further efforts to increase the share of renewables in energy production. Any facilitation of investing in renewable energy sources accelerates the reduction in costs related to the operation of these technologies. It is also important to remember the limitations of renewables in the sense that improving renewable energy technologies can reduce energy costs to some extent but cannot change the basic characteristics of energy sources. For example, improving the production of solar panels reduces production costs, but the problem of seasonal intermittency still exists. New technology makes it possible to produce ethanol from switchgrass instead of corn. However, land availability limits switchgrass production. It is indicated that offshore wind energy and solar photovoltaics may be the only renewable sources important enough to replace fossil fuels [
18]. It is worth emphasizing that this corresponds to the research results obtained in this study. “Wind” and “solar” had the greatest importance in the multiple regression equation.
Future work will investigate other relationships between the energy mix and macroeconomic indicators, such as economic growth, employment and the economic cycle. The analysis of time series and the study of long-term dependencies, e.g., Granger causality or cointegration, are also extremely important. Such research will allow us to answer the question to what extent an increase in the share of renewables in energy production will change the dynamics of inflation in more economically stable conditions, not only in the face of an energy shock.


