1. Introduction
As the global consumption of electricity increases, electricity storage, not merely generation, has become increasingly important because of fluctuations in levels of electricity generation from renewable sources [
1,
2,
3]. Recently, all-solid-state lithium batteries have been widely studied owing to their potential to offer higher energy density, extended cycle life, and enhanced safety compared to conventional lithium-ion batteries [
2,
3,
4,
5]. Among the solid-state electrolytes, oxide-based solid-state electrolytes have attracted attention owing to their high ionic conductivity and thermal and mechanical stability, along with sulfide electrolytes [
6,
7,
8,
9,
10]. Oxide-based solid electrolytes are primarily employed in the form of pellets or sheets, which results in various limitations, such as excessive electrolyte thickness or susceptibility to external impacts [
11]. To overcome these limitations, composite solid electrolytes (CSEs) based on oxide-based and polymer electrolytes have been actively studied [
12,
13,
14,
15,
16,
17].
CSEs containing Li
7La
3Zr
2O
12 (LLZO), an oxide-based electrolyte, along with succinonitrile (SCN) serving as a plasticizer in a polymer electrolyte, have been proposed. Vanita et al. prepared a ceramic-rich (50 wt.%) composite electrolyte with Li
6.
4La
3Zr
1.
4Ta
0.
6O
12 (LLZTO), polyethylene oxide (PEO), lithium bis(trifluoromethanesulfonyl)imide (LiTFSI), and SCN using solvent-free cryomilling. The mixture of SCN and LiTFSI (20:1), called plastic-crystal electrolyte (PCE), exhibits high room-temperature conductivity (5.26 × 10
−3 S/cm at 298 K). When it was mixed with LLZTO, it was observed that the mixture promoted lithium-ion transport at the grain boundary. Moreover, the addition of PEO at 5 wt.% reduces the brittleness/hardness of the CSE, thus overcoming the electrode–electrolyte interfacial resistance [
18]. Kumlachew et al. fabricated a tri-layer composite polymer electrolyte (Tri-CPE) by uniformly dispersing Ga/F-doped LLZO into a poly(vinyl fluoride) (PVDF)/polyacrylonitrile (PAN)/LiTFSI/SCN matrix using a simple solution-casting method. The top and bottom membranes did not contain LLZO, and the Tri-CPE exhibited an ionic conductivity at room temperature of 4.5 × 10
−4 S/cm, with a high Li
+ ion transfer number (0.84). The cell with the LMO@T-LNCM811-based composite cathode showed a Coulombic efficiency of 99.4% and capacity retention of 89.8% at 1 C over 300 cycles [
19]. Despite the good performance shown in the above studies, problems such as the coordination or dehydrogenation of SCN with transition metals in ceramic electrolytes have been reported [
20]. The primary issue lies in the gelation of the electrolytes during the mixing of SCN and Li
6.25Ga
0.25 La
3Zr
2O
12 (LGLZO), rendering the fabrication of CSEs challenging.
Various methods have been developed to address above issues. Cheng et al. fabricated a flexible Al-LLZO sheet with a thickness of approximately 75 μm through a tape-casting method and impregnated the sheet with an ionic liquid, Li(G4)FSI, which consists of a lithium bis(fluorosulfonyl)-imide (LiFSI) and tetraglyme (G4) in an equimolar complex. [
21]. The impregnated ionic liquid yielded positive results by bridging the gap between the LLZO particles, thereby creating an effective Li-ion pathway. Consequently, the impregnated electrolyte film exhibited a high ionic conductivity (approximately 0.1 mS/cm) and good cycling performance, owing to the excellent interfacial stability with the electrode. Because the electrolyte is fabricated through a tape-casting method, mass production is possible, which considerably improves processability. Shen et al. fabricated LLZO scaffolds with a porosity of 75% using an aqueous freeze tape-casting method [
22]. Using this method, LLZO scaffolds with constant pore size and shape can be fabricated. A porous LLZO scaffold impregnated with PEO/LiTFSI exhibited excellent ionic conductivity. However, these studies did not consider the side reactions of the impregnated SCN.
Recently, a sharp increase in resistance during the charge and discharge of cells with these composite electrolytes was reported, which was attributed to the polymerization of SCN during the side reaction of SCN with La in LGLZO [
23,
24]. Yang et al. confirmed the coordination between the nitrile groups of SCN and the La atoms of LLZTO [
23]. More specifically, Fourier-transform infrared spectroscopy (FTIR) and x-ray photoelectron spectroscopy (XPS) analyses indicated that the -C≡N groups of SCN transform into C=N groups, which suggests that SCN is polymerized. This phenomenon increases CSE resistance and decreases cell performance. To address this issue, they dissolved 20 wt.% of PAN in the PCE and applied the solution as a coating on the prepared LLZTO substrate (~800 μm). The cell with the PAN-modified electrolyte exhibited a conductivity of approximately 10
−4 S/cm as well as excellent Coulombic efficiency (95.6%) and capacity retention (99% at 0.1 C, 25 °C) after 250 cycles [
23]. In addition, Zhang et al. reported the reaction of the nitrile group of SCN with LLZTO to decrease the ionic conductivity of SCN. They applied a PAN coating on LLZTO and subsequently dissolved it in SCN to obtain an electrolyte with a thickness of approximately 13 μm using the tape-casting method. The SCN/PAN-coated LLZTO exhibited a conductivity of ~10
−4 S/cm at room temperature. In cell applications, it demonstrated a capacity of 163 mAh/g and an 87% capacity retention after 500 cycles at 0.2 C [
24]. However, these studies primarily focus on the interface between the LLZTO substrate and the SCN layer, while investigations into the interfacial behavior of SCN and LLZO particles during the impregnation process remain insufficient.
To overcome these problems, we designed a process, electrolyte materials, and a structure that can solve the gelation problem during the mixing process as well as the difficulties incurred by the polymerization of SCN during charging and discharging. By using a simple tape-casting and impregnation process, three-layer g-PCE consisting of a PVDF-HFP-based SPE-LGLZO was successfully fabricated without gelation during the process. As mentioned above, however, the SCN-LLZO interface poses a risk of unstable electrochemical performance due to the polymerization of SCN during the charge/discharge process. Also, the interface area between SCN and LGLZO in this study is much higher than that reported previously [
25]. SCN’s polymerization is much more severe and critical to electrochemical performance. Therefore, the effect of added PAN on SCN’s polymerization and the electrochemical performance of a solid-state Li-metal battery was carefully investigated. At first, polymerization of SCN with LGLZO and the role of PAN were described with diagrams. To visualize the polymerization, polymerization behaviors of SCN in a composite of LGLZO and SCN were studied by a thermal aging experiment. Additionally, the optimization of the amount of added PAN was conducted by measuring basic ionic-conducting properties. Finally, electrochemical performance levels with LFP||Li-metal and NCM||Li-metal batteries were evaluated to confirm the role of PAN by comparing those with and without PAN in CSE.
3. Results
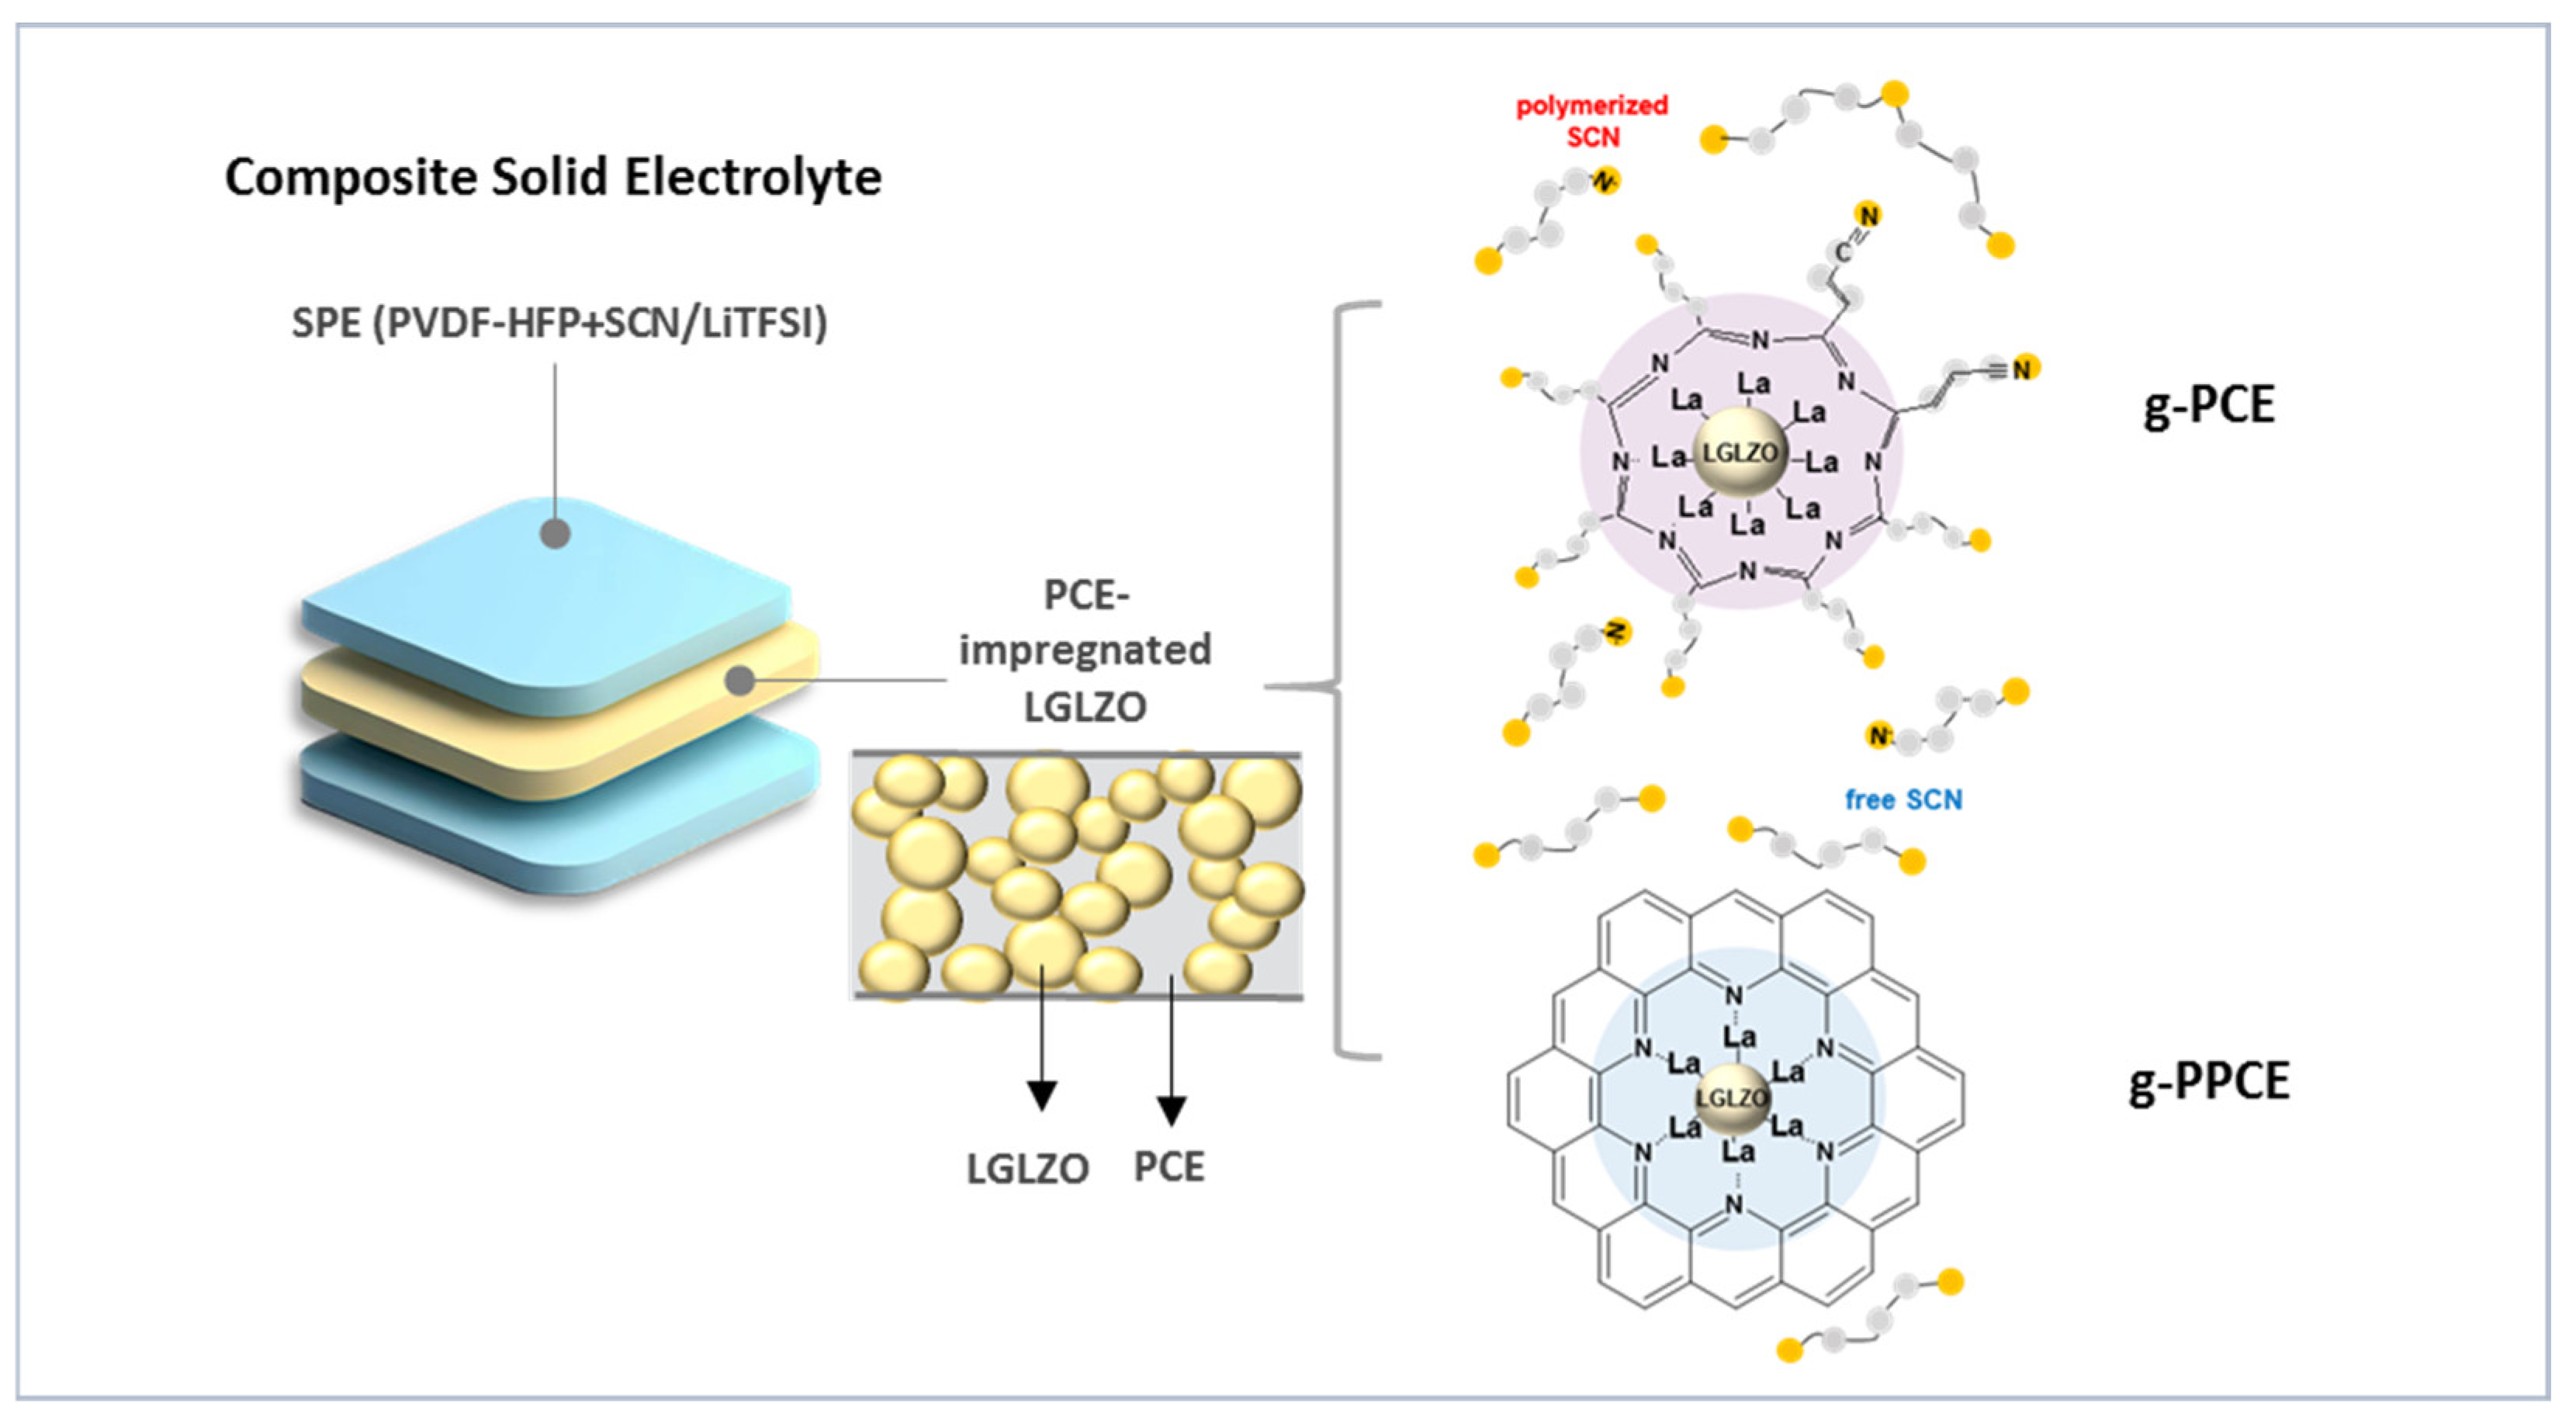
Figure 1 shows a schematic of the SPE-LGLZO CSE and the chemical reaction between SCN and PAN on the LGLZO surface with and without PAN. Specifically, the structure on the left shows a three-layer CSE using a ceramic middle layer and two polymer top/bottom layers. The ceramic layer is brittle and has a rough surface due to its high ceramic content (~80 wt.%). There are two main weaknesses of this application as a solid electrolyte. First, it is difficult to handle during cell preparation. Secondly, large interface resistance levels with the electrodes are unavoidable. Therefore, we have designed a three-layered ceramic–polymer composite electrolyte. The ceramic layer was an LGLZO sheet impregnated with PCE. Two solid polymer electrolyte (SPE) layers consisted of poly(vinylidene fluoride-co-hexafluoropropylene) (PVDF-HFP) and PCE positioned on the top and bottom, and a PCE-impregnated LGLZO sheet was positioned in the middle. SPEs on the top and bottom were sufficiently flexible and strong to form a good interface with the electrode and exhibited a high ionic conductivity (~1 mS/cm) owing to the inclusion of PCE [
29]. In
Figure S1, the Nyquist impedance plots of PCEs with various ratios of LiTFSI and SCN are shown. The PCE with a specific ratio of LiTFSI:SCN = 1:19 mol% was selected due to its solid-state nature at that particular ratio and its excellent conductivity. The LGLZO sheet in the middle had an LGLZO content of approximately 80%, which provided the main ionic conduction paths through the ceramics. In addition, the impregnation of the LGLZO sheet with PCE increased the mobility of Li-ions and reduced the interfaces between the LGLZO powders.
During the preparation of SPE-LGLZO CSEs, the La of LGLZO and the nitrile groups of SCN reacted chemically, resulting in the polymerization of SCN. The structure at the top right of
Figure 1 shows the chemical structures of the species involved in SCN polymerization, which entailed the reaction between SCN and LGLZO in g-PCE. The coordination between La on the surface of LGLZO and the nitrile group of SCN leads to the conversion of the triple bond in -C≡N into a double bond, forming a -C=N- group. This was observed in the chemical structure of the resulting polymer. Additionally, the polymerization of the surrounding SCN was observed. This reaction occurred due to the π-back donation effect, in which the nitrile group donated an electron to the unoccupied d-orbital of the La ion, while the inner orbital electrons of the La ion transferred to the nitrile group. Eventually, an overall charge transfer occurred from LGLZO to the nitrile group. As a result, electrons accumulated on the nitrile groups of SCN, increasing the charge density and creating a Lewis alkaline environment, thereby causing the polymerization of the nitrile group. The polymerized nitrile groups manifested as a continuous decrease in ionic conductivity due to loss of its original gauche-trans conformations [
24]. A more serious problem is that the Lewis alkaline environment causes polymerization of not only the SCN on the LGLZO surface, but also the surrounding SCN away from the surface, which keeps reducing the electrochemical functionality of the SCN during the charge/discharge process [
23]. The bottom-right structure in
Figure 1 represents the reaction between La and PAN on the surface of LGLZOs in the g-PPCE, which is a CSE containing PAN. The introduction of PAN, which has a strong polarity, caused La on the surface of LGLZO to react with PAN more readily than with SCN. During the coordination of the La in LGLZO and PAN, the conversion of the -C≡N in PAN into -C=N- induced PAN cyclization. [
30,
31] Owing to the strong polarity of cyclized PAN, free SCN in the vicinity remained unpolymerized. Therefore, PAN prevented the polymerization of SCN, both on the LGLZO surface and in the surroundings, which retained its electrochemical function during cell cycles. It is certain that, because the cyclized PAN cannot cover LGLZO particle perfectly, there were still Li-ion conducting paths from the plastic crystal electrolyte (LiTFSI-added SCN) into the bulk LGLZO, as the simply drawn images in
Figure S2 depict.
As to the gelation during the mixing of LGLZO and SPE, photo images of the SPE/LGLZO and SPE/PAN/LGLZO slurry before and after mixing were obtained, as shown in
Figure S3a,b. Without PAN, the slurry gelled, along with a severe color change. On the other hand, slurry with PAN exhibited no gelation, but still evinced a color change. The photo images of fabricated sheets are also given. With slurry without PAN, it was impossible to gain a film due to the gelation, while with the slurry with PAN, it was possible to fabricate a sheet. Even though there was no gelation, the color change still indicated a part-polymerization of SCN. Therefore, we have developed a different fabrication, one with tape-casting of a ceramic sheet and impregnation of PCE, as in the following description.
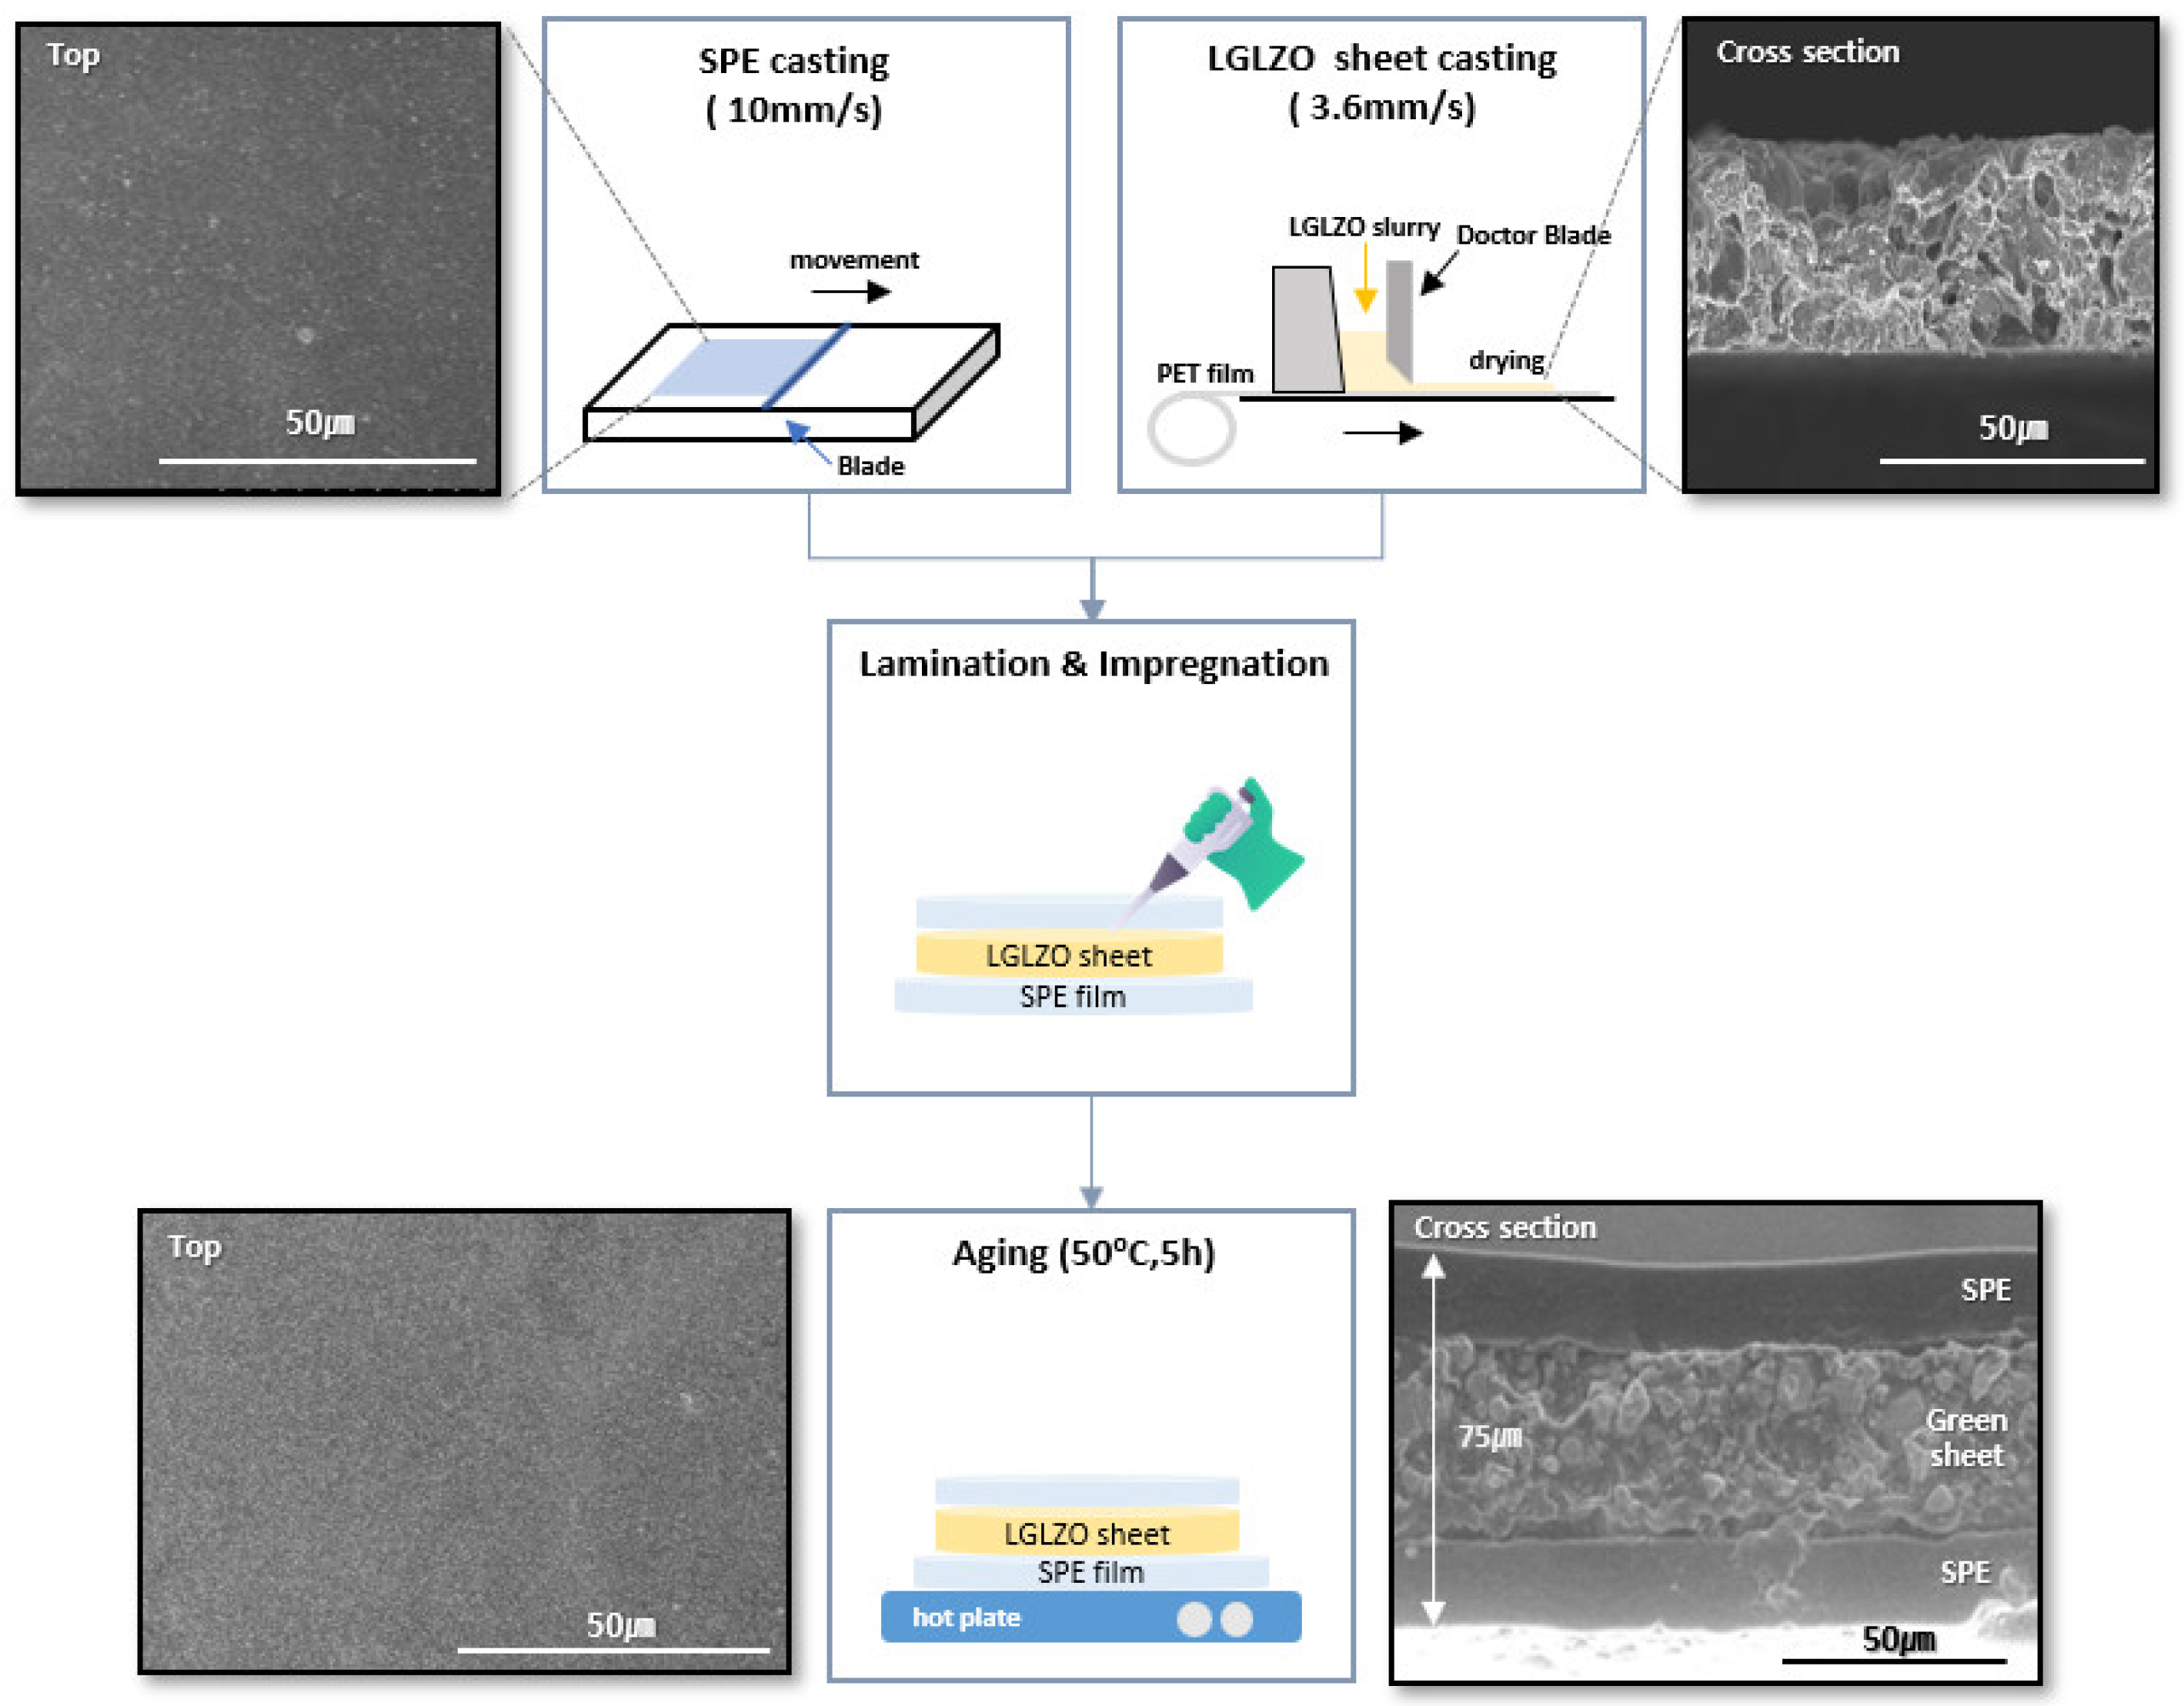
Figure 2 shows a schematic of the fabrication of SPE, LGLZO sheets and CSE, along with SEM images of each electrolyte. The SEM image of the SPE fabricated through blade coating reveals small pores distributed on the surface. The cross-sectional SEM image of the LGLZO sheet prepared using the tape-casting method reveals a constant thickness, suggesting that a constant interface can be achieved by placing the SPEs at the top and bottom of the LGLZO sheet. Also,
Figure S4 shows a cross-sectional SEM image of g-PPCE along with the corresponding EDS mapping results. Notably, the nitrogen (N) content originating from SCN exhibits an even distribution within both the SPE and the LGLZO sheets. Similarly, the fluorine (F) content from PVDF-HFP and LiTFSI is uniformly distributed, with a higher concentration found in the SPE. Finally, lanthanum (La), a constituent of LGLZO, is primarily concentrated within, and uniformly distributed across, the LGLZO sheet. The SEM image and the XRD pattern of the LGLZO particles are shown in
Figure S5. The SEM image reveals the constant particle size of the LGLZO, whereas XRD demonstrates its absolute cubic phase. The average particle size of the LGLZO is 5–7 μm. Numerous research studies focusing on polymer–ceramic composite solid electrolytes employ nano-scale ceramic particles to increase specific surface area, thereby preventing polymer crystallization and consequently improving ionic conductivities [
32,
33,
34]. These studies suppose an increase in the particle volumetric distribution. However, as the ceramic content in the composite solid electrolyte increases, aggregation of ceramic particles occurs [
35]. In our research, we employ micro-sized ceramic materials to mitigate particle aggregation, a common issue when using nano-sized particles. This approach allows us to substantially enhance the ceramic content, creating a predominant pathway for lithium ions within the ceramic structure. [
36,
37]. Cubic-phase LGLZO has an ionic conductivity that is approximately 10 times higher than that of the tetragonal phase [
7]. The XRD patterns of the LGLZO green sheet, SPE, and CSE are shown in
Figure S6. The XRD pattern of the CSE also showed the same cubic phase of LGLZO. In addition, the existence of pores in the cross-sectional image demonstrates an effective PCE impregnation. The surface of the three-layer CSE closely resembles that of the SPE. Furthermore, the cross-sectional image evidenced an electrolyte thickness of approximately 75 μm in total. Additionally, a smooth and constant connection between the SPE and LGLZO was demonstrated. It should be mentioned that there were no differences in the microstructures between samples with and without PAN, because only a small amount of PAN, lower than 10 wt.%, was substituted for SCN. Moreover, to prove the role of PAN, electrochemical performance levels as well as the chemical change of g-PCE was precisely observed, as described in the following.
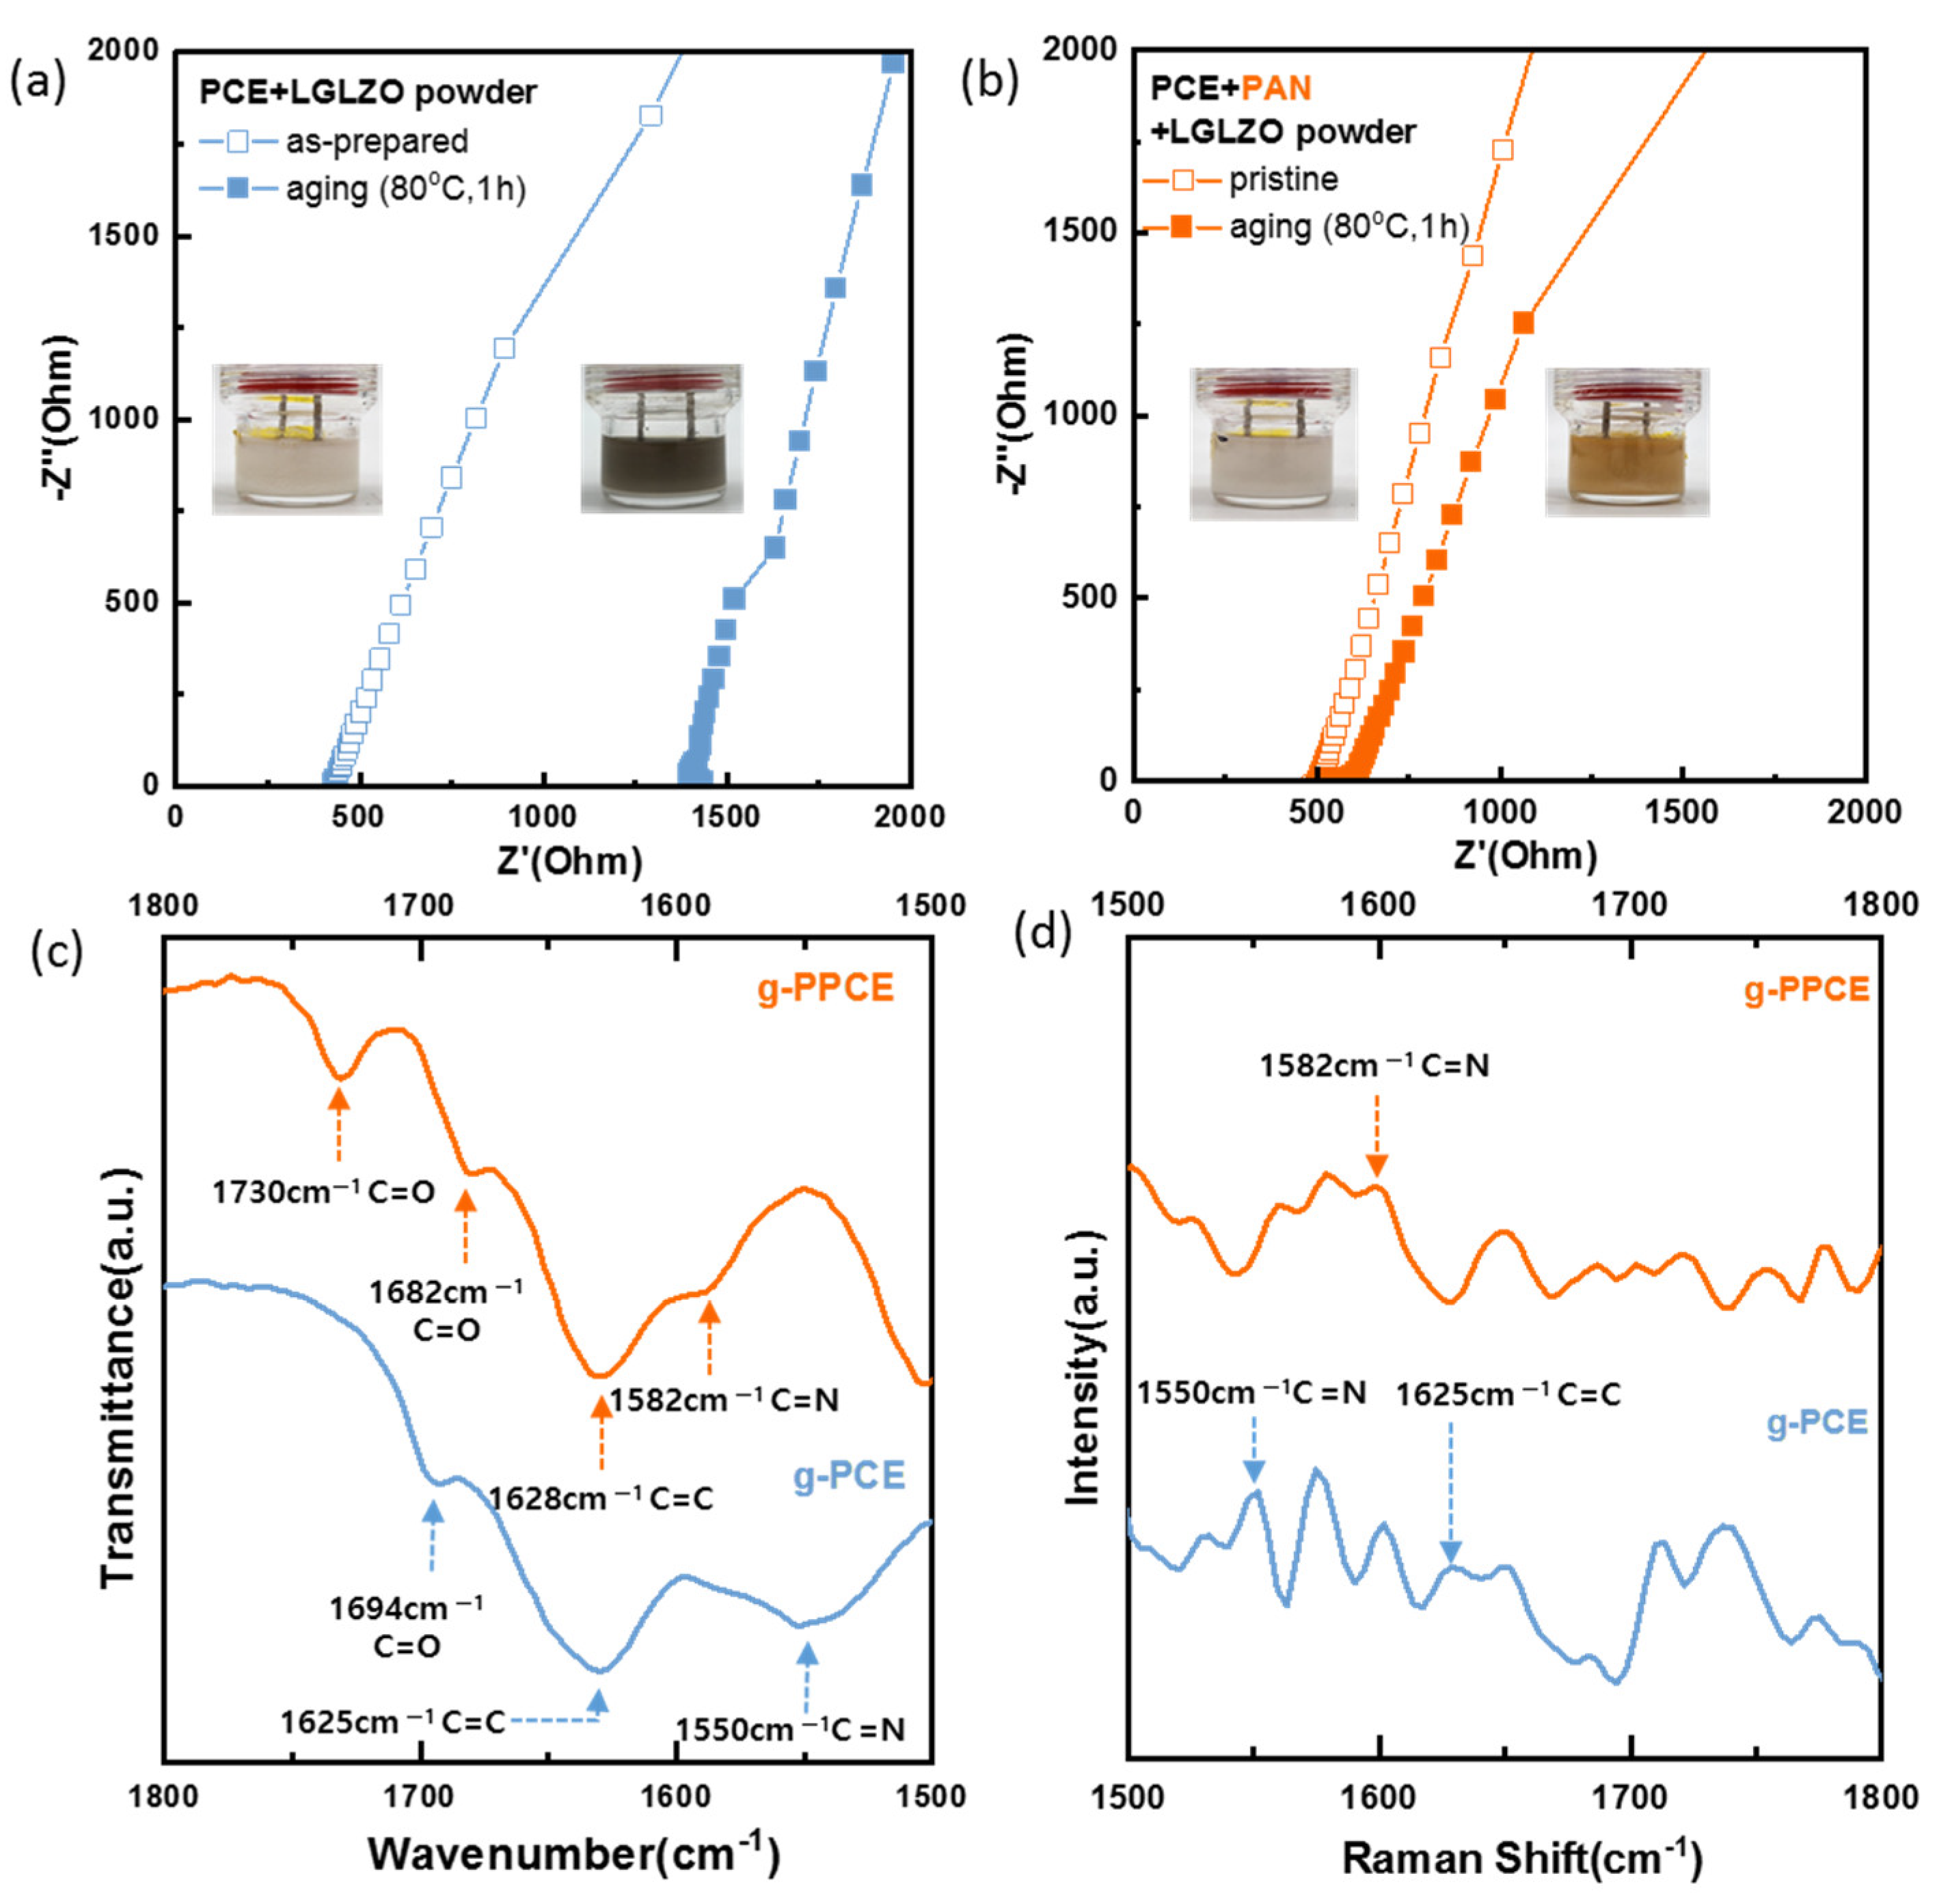
It is well-known that the color of PCE continuously changes from ivory to brown, and finally to dark brown, with the proceeding of polymerization of SCN [
38,
39,
40]. To effectively illustrate the browning phenomenon, wherein the slurry turns brown, a simple thermal aging experiment was conducted with beaker cells. To quantify the alterations in ionic conductivity resulting from the reaction between SCN and LGLZO and the influence of PAN, EIS measurements were conducted on the PCE/LGLZO and PPCE/LGLZO slurries. The left inset image of
Figure 3a shows the beaker cell. After aging at 80 °C for 1 h, the color of the slurry changed from ivory to dark brown, as shown in the right inset image, which clearly indicates polymerization of SCN. As shown in EIS results of the PCE/LGLZO slurry before and after aging, its resistance increased from 425 Ω to 1395 Ω. This can be attributed to the reaction between SCN with LGLZO, which led to the polymerization of SCN, resulting in the browning and gelling of the slurry.
Figure 3b shows the images and EIS measurements of the PPCE/LGLZO slurry before and after aging. After aging at 80 °C for 1 h, the resistance value increased from 503 Ω to 601 Ω. The pristine PPCE/LGLZO slurry shows a higher series resistance than that of PCE/LGLZO slurry due to the effect of PAN, which does not aid the dissociation of Li-salts compared to SCN. The browning progressed less, compared to the case without PAN. In addition, no additional color change was detected after the initial change into bright brown. This color change is surely attributed to cyclization of PAN on the LGLZO surface [
41]. Nevertheless, the inclusion of PAN prevented the severe reaction between SCN and LGLZO. The chemical instability of SCN toward LGLZO was corroborated by FTIR analysis to validate the alteration in the chemical structure of SCN with adding PAN.
In
Figure 3c, FTIR spectra of the g-PCE and g-PPCE samples aged at 80 °C for 1 h are shown. FTIR analysis was performed to confirm the reaction with SCN on the surface of LGLZO. Peaks at 1694, 1625, and 1550 cm
−1 were observed in the FTIR spectrum of g-PCE. The peak at 1694 cm
−1 represents the vibration mode of the carbonyl group (C=O) [
42], the peak at 1625 cm
−1 represents C=N bonds, and the peak at 1550 cm
−1 represents C=C bonds [
23,
24]. In the case of g-PCE, as it contains SCN, C=N and C=C bonds should not be observed. However, peaks corresponding to these bonds were observed in the FTIR spectrum of g-PCE, indicating that -C≡N changed to C=N and C=C. This phenomenon is attributed to the nitrile group of SCN reacting with LGLZO and the resulting polymerization. As shown in bottom graph of
Figure 3c, however, the FTIR spectrum of g-PPCE did not show polymerization peaks at 1550 and 1625 cm
−1. The peaks at 1730 cm
−1 and 1682 cm
−1 represent the stretching vibration absorption of the free and hydrogen-bonded C=O [
43,
44]. These peaks originated from the end of the chemical structure of PAN. The peak at 1628 cm
−1 represents the vibration mode of the C=C bond of the cyclized PAN, and the peak at 1582 cm
−1 represents the cyclic C=N group [
30,
45]. As PAN also contains a C≡N bond, the FTIR results of g-PPCE should not present a C=N or C=C bond. This suggests that the triple bond of PAN breaks and transforms into double bonds, including C=C and C=N. Consequently, PAN reacts with LGLZO more readily than SCN in the g-PPCE, effectively preventing its polymerization. The full range of FTIR data is presented in
Figure S7. To compare the thermal properties, TGA graphs of the LGLZO green sheet, SPE, PPCE-impregnated green sheet, and g-PPCE are shown in
Figure S8. After heat treatment at 800 °C, the LGLZO remains about 26 wt.% of g-PPCE.
To further verify the results of FTIR analysis, Raman analyses of g-PCE and g-PPCE were performed (
Figure 3d). The Raman measurements exhibit peaks at 1550 and 1625 cm
−1 in g-PCE, representing the C=N and C=C bonds, respectively. This indicates that the triple bonds of C and N in the nitrile groups of SCN changed to double bonds as the SCN polymerization progressed. However, in the case of g-PPCE, no peaks at 1550 and 1625 cm
−1, which would have indicated polymerization, appear. Conversely, a peak at 1582 cm
−1 appears, demonstrating the presence of a cyclic C=N bond. This confirms the cyclization phenomenon of PAN and demonstrates that SCN polymerization is prevented because PAN readily reacts with LGLZO.
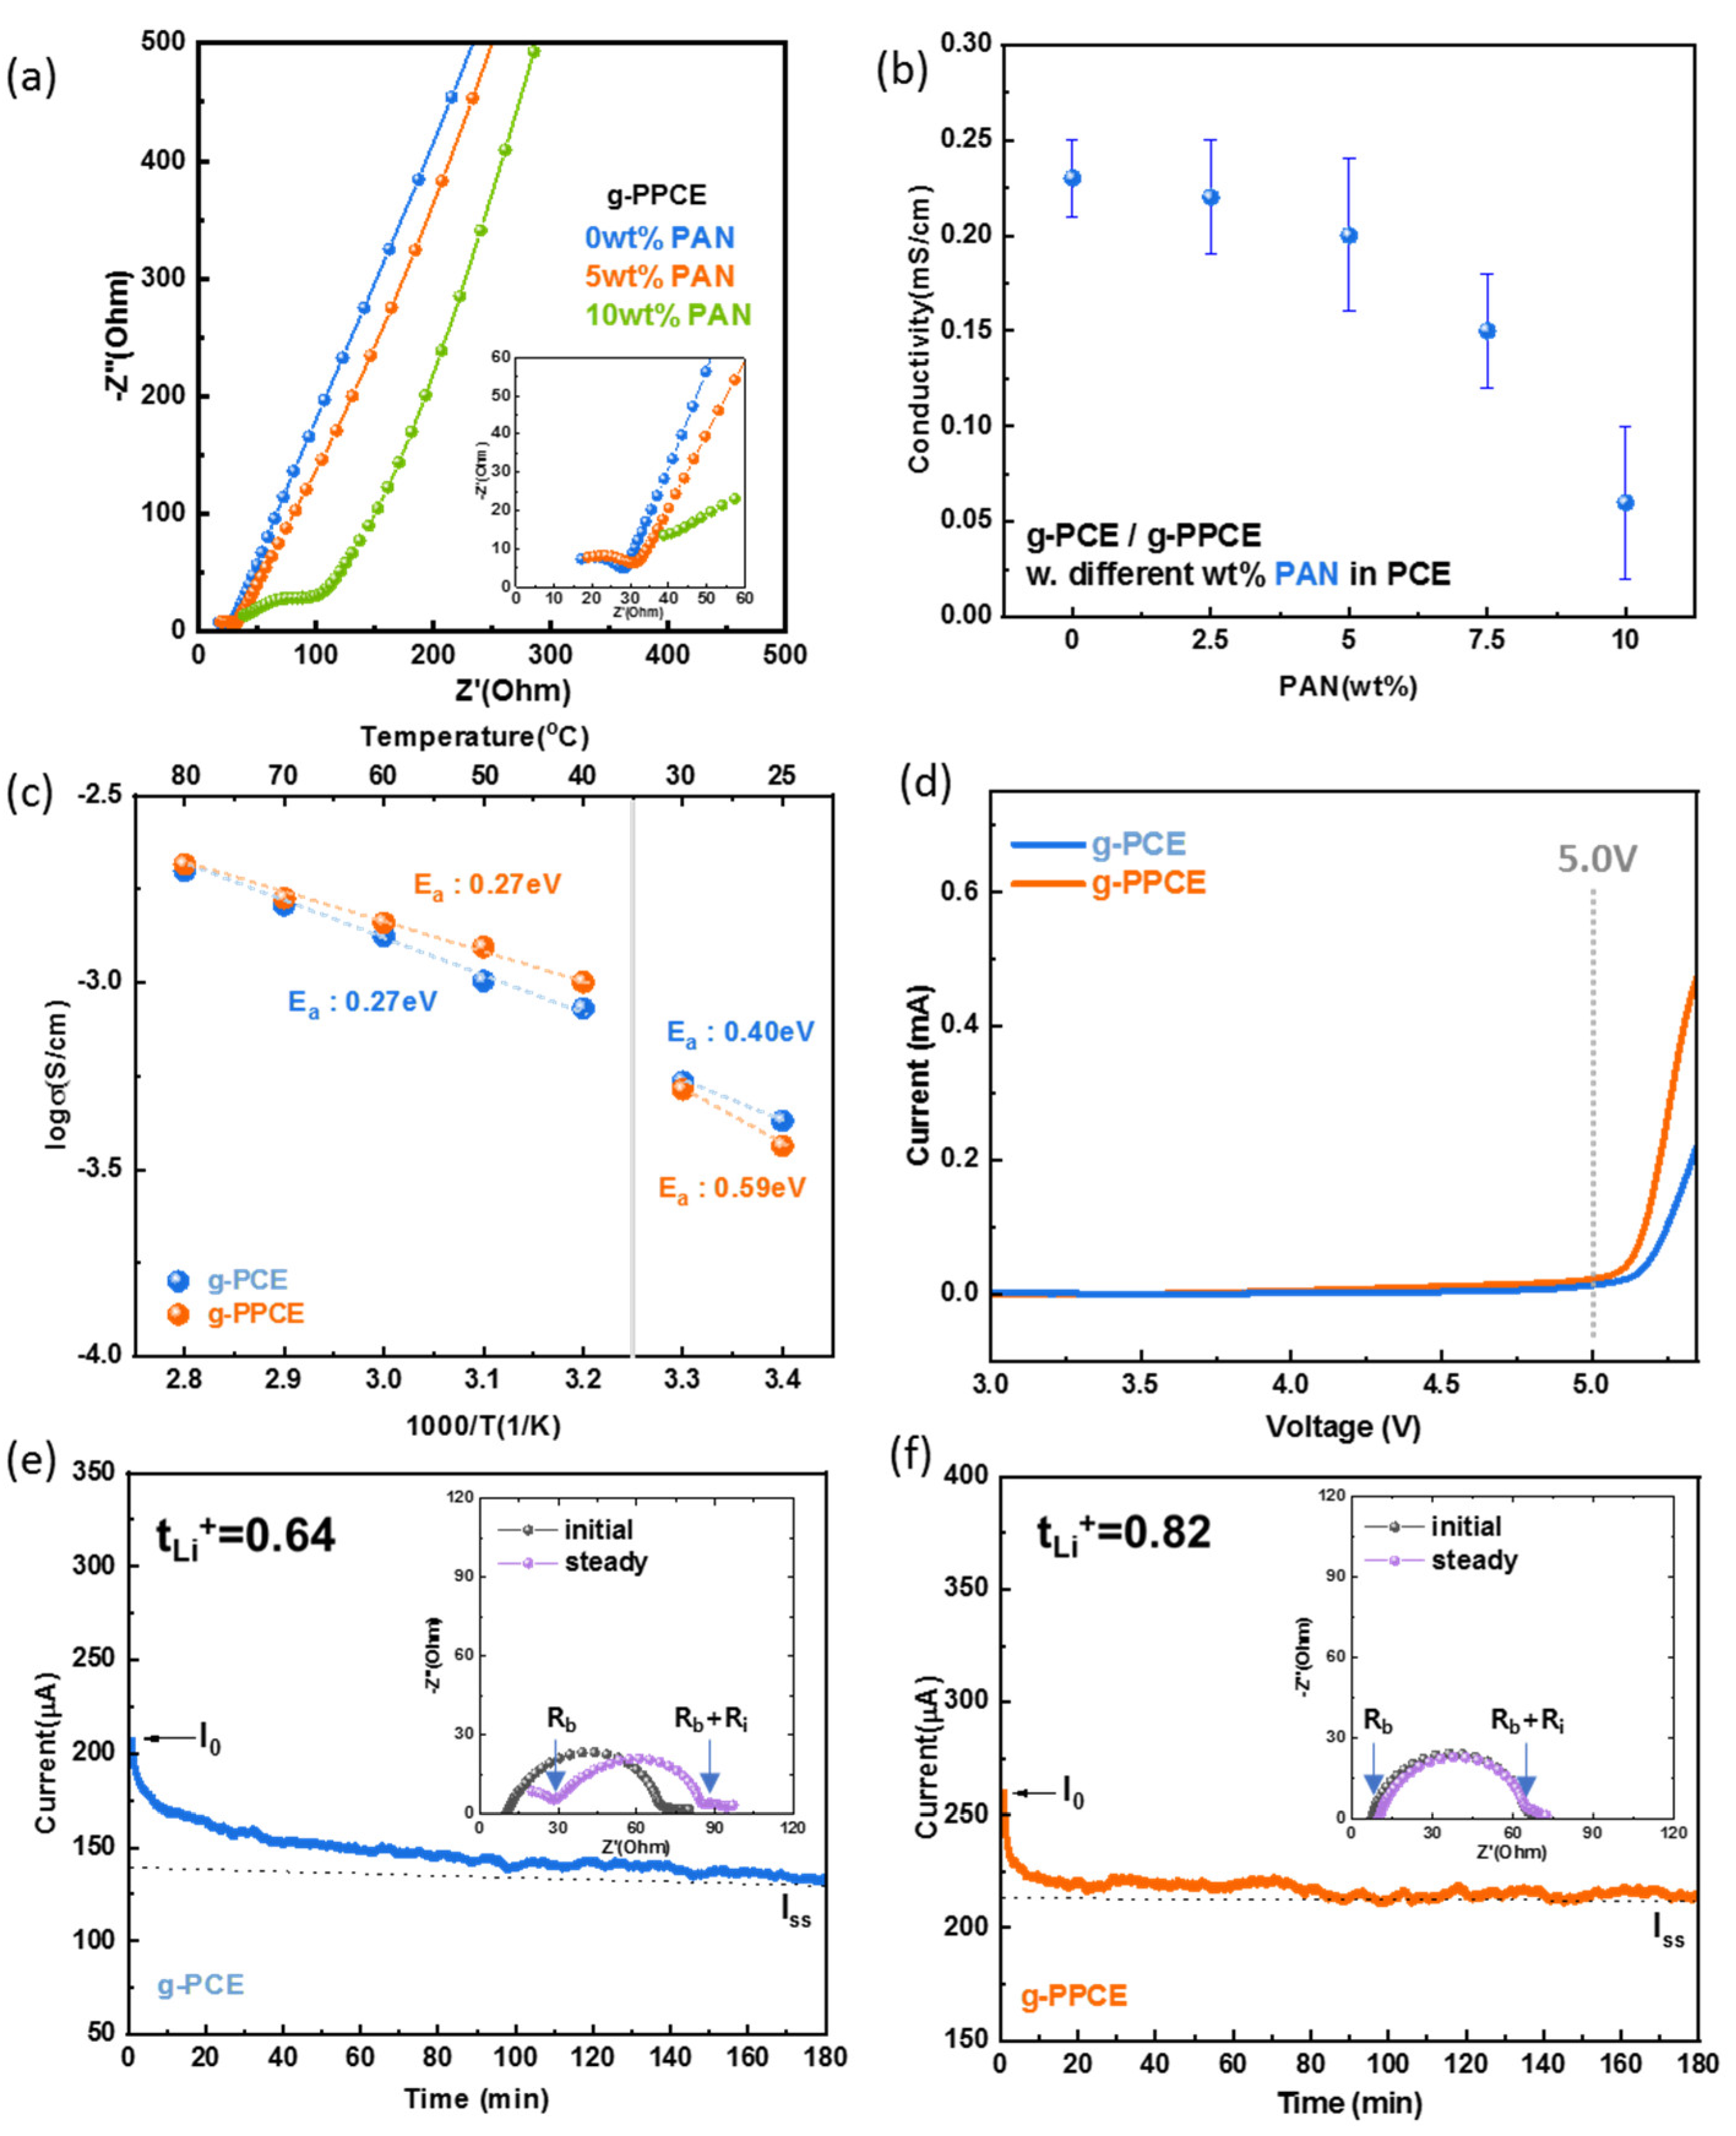
In order to optimize the amount of added PAN and evaluate its effects, we measured basic ionic conducting properties.
Figure 4a displays the Nyquist plots of the measured EIS spectra for the three-layer CSE samples with different ratios of wt.% of PAN. The inset shows a magnified view of the high-frequency region. The Nyquist plot of each electrolyte consisted of a semicircle representing the interface resistance and a Warburg plot representing Li-ion diffusion. The series resistance among the electrolytes is similar, approximately 10 Ω, indicating that the addition of PAN does not change the resistance of the electrolyte itself. The interface resistance of g-PPCE with 0, 5, and 10 wt.% PAN is 27, 31, and 104 Ω, respectively.
Figure S9 shows that the interface resistance levels of g-PPCE with 2.5 and 7.5 wt.% PAN are 28 Ω and 41 Ω, respectively. Except for the electrolyte containing 10 wt.% PAN, the resistance was 15–20 times higher than that of the liquid electrolyte [
46,
47]. The diameter of the semicircle increased as the wt.% of PAN increased. Even if there is no PAN addition, there is still a semicircle observed in this Nyquist plot. In addition, no semicircles were observed in beaker cell experiment, both with and without PAN, as described in
Figure 3. From the above results, this presence of a semicircle in the Nyquist plot is attributed to the interface between LGLZO and PCE (or PPCE). Specifically, applying a ceramic sheet for impregnation of PCE resulted in insufficient contact between ceramic powders and PCE (or PPCE). Another clue is that there is no semicircle detected in three-layer CSE fabricated by blade coating of mixture of LGLZO and PCE solution, even though the result is not shown in this research. Adding PAN might make for more difficulty in formation of contacts between LGLZO and PCE by increasing the viscosity of PCE. Consequently, PAN is not critical to ionic conductivity of PCE itself, but the impregnation condition should be carefully applied to ensure sufficient contact between LGLZO and PCE.
Figure 4b illustrates the ionic conductivities of the g-PPCEs with different ratings of wt.% of PAN, including error bars. In addition to the CSE,
Figure S10 shows a Nyquist plot of an LGLZO pellet. The inset of the graph shows a photo image of an LGLZO pellet. The conductivity of the LGLZO pellet was 1.4 mS/cm. A Nyquist plot of the SPE is shown in
Figure S11. The SPE exhibited a conductivity of 0.7 mS/cm. With PAN contents of 0, 2.5, and 5 wt.%, the g-PPCE exhibited similar conductivities (0.23 mS/cm, 0.22 mS/cm, and 0.20 mS/cm, respectively). However, the resistance of the g-PPCE with a 7.5 wt.% PAN content increased to 41 Ω and exhibited an ionic conductivity of 0.15 mS/cm. The resistance of the g-PPCE with 10 wt.% PAN increased significantly to 104 Ω and exhibited an ionic conductivity of 0.06 mS/cm. In addition, the error rate increased by more than 10 wt.% of PAN content. This suggests that PAN, as a minor conductor, did not significantly affect the resistance of the CSE up to 5 wt.% and reacted first with LGLZO to prevent the polymerization of the nitrile group of SCN. However, when g-PPCE contained more than 5 wt.% of PAN, the resistance significantly increased because of the reduced proportion of SCN, resulting in a reduction in Li
+ conductivity [
24]. As a result, g-PPCE containing 5 wt.% PAN demonstrates that PAN blocks the polymerization of SCN while having no significant effect on conductivity. Thus, all the g-PPCE have 5 wt.% of PAN content for the following evaluations of electrochemical properties.
Figure 4c depicts the Arrhenius curves of the temperature-dependent conductivities of g-PCE and g-PPCE, both exhibiting two zones with distinct slopes. The turning point indicating a change in slope in the Arrhenius curves corresponds to the melting point of PCE. The melting point of SCN is 58 °C; With the addition of LiTFSI, however, its melting point was reduced, enabling it to partially exist as a liquid at 40 °C [
48]. This leads to a change in the slope at 40 °C. Consequently, the E
a values for g-PCE and g-PPCE were 0.40 and 0.59 eV, respectively, below 40 °C. However, the E
a decreased to 0.27 eV for both electrolytes above 40 °C, indicating an enhancement of the ion transport capacity of the CSE during the solid-to-liquid transition. This is attributed to SCN reducing the crystallinity of the polymer, serving as a Li-ion carrier and promoting Li-ion transfer. The activation energy of an LGLZO pellet is 0.30 eV [
49,
50], and that of PCE is 0.23 eV below 40 °C and 0.16 eV above 40 °C [
51]. From above results, the activation energy levels of g-PCE and g-PPCE approximated those of LGLZO pellets (0.30 eV) rather than that of PCE. This suggests that LGLZO serves as the primary pathway for Li-ion conduction in the g-PCE and g-PPCE.
A wide potential window for the electrolyte is essential to drive batteries at high voltages. The graph in
Figure 4d shows the LSV (linear sweep voltammetry) curves of g-PCE and g-PPCE. As the voltage changed, both g-PCE and g-PPCE exhibited virtually no increase in current, up to 5.0 V. However, g-PPCE exhibited a slightly faster current increase above 5.0 V, reaching 0.2 mA for g-PCE and 0.46 mA for g-PPCE at 5.3 V. Consequently, there was no obvious oxidative degradation of either g-PCE or g-PPCE over Li
+/Li, at least within operating voltages of up to 5.0 V.
For a deeper understanding of the Li-ion conduction, the polarization curves and steady-state impedance diagrams (insets) of g-PCE and g-PPCE are shown in
Figure 4e and 4f, respectively. First, the polarization curve of g-PCE shows that the initial current (I
0) was 207 μA and reached a stable region after approximately 180 min, with a steady-state current (I
ss) of 133 μA. The inset shows the steady-state impedance diagram of g-PCE, where R
b represents the bulk resistance, R
i is the interfacial resistance, and R
b+R
i shows the charge-transfer resistance. In the steady state, g-PCE exhibited a R
b of 28 Ω; R
b+R
i was 84 Ω. The charge-transfer resistance increased after the polarization test. The calculated Li
+ transfer number of g-PCE was 0.64, which is higher than the 0.5 of conventional polymer electrolytes [
52,
53]. With the same polarization procedure, the calculated Li
+ transfer number of g-PPCE was 0.82, which is higher than that of g-PCE. Better Li-ion transport ability in g-PPCE containing PAN is obtained because PAN reacts with LGLZO first and prevents the severe polymerization of SCN. Moreover, the higher t
Li+ values of g-PCE and g-PPCE, both higher than 0.5, demonstrate that g-PCE and g-PPCE are single-ion conducting materials and that LGLZO in the electrolyte dominates the Li-ion conduction process [
54,
55]. Consequently, g-PPCE is a promising CSE, in spite of its relatively low ionic conductivity due to its higher Li
+ transference number.
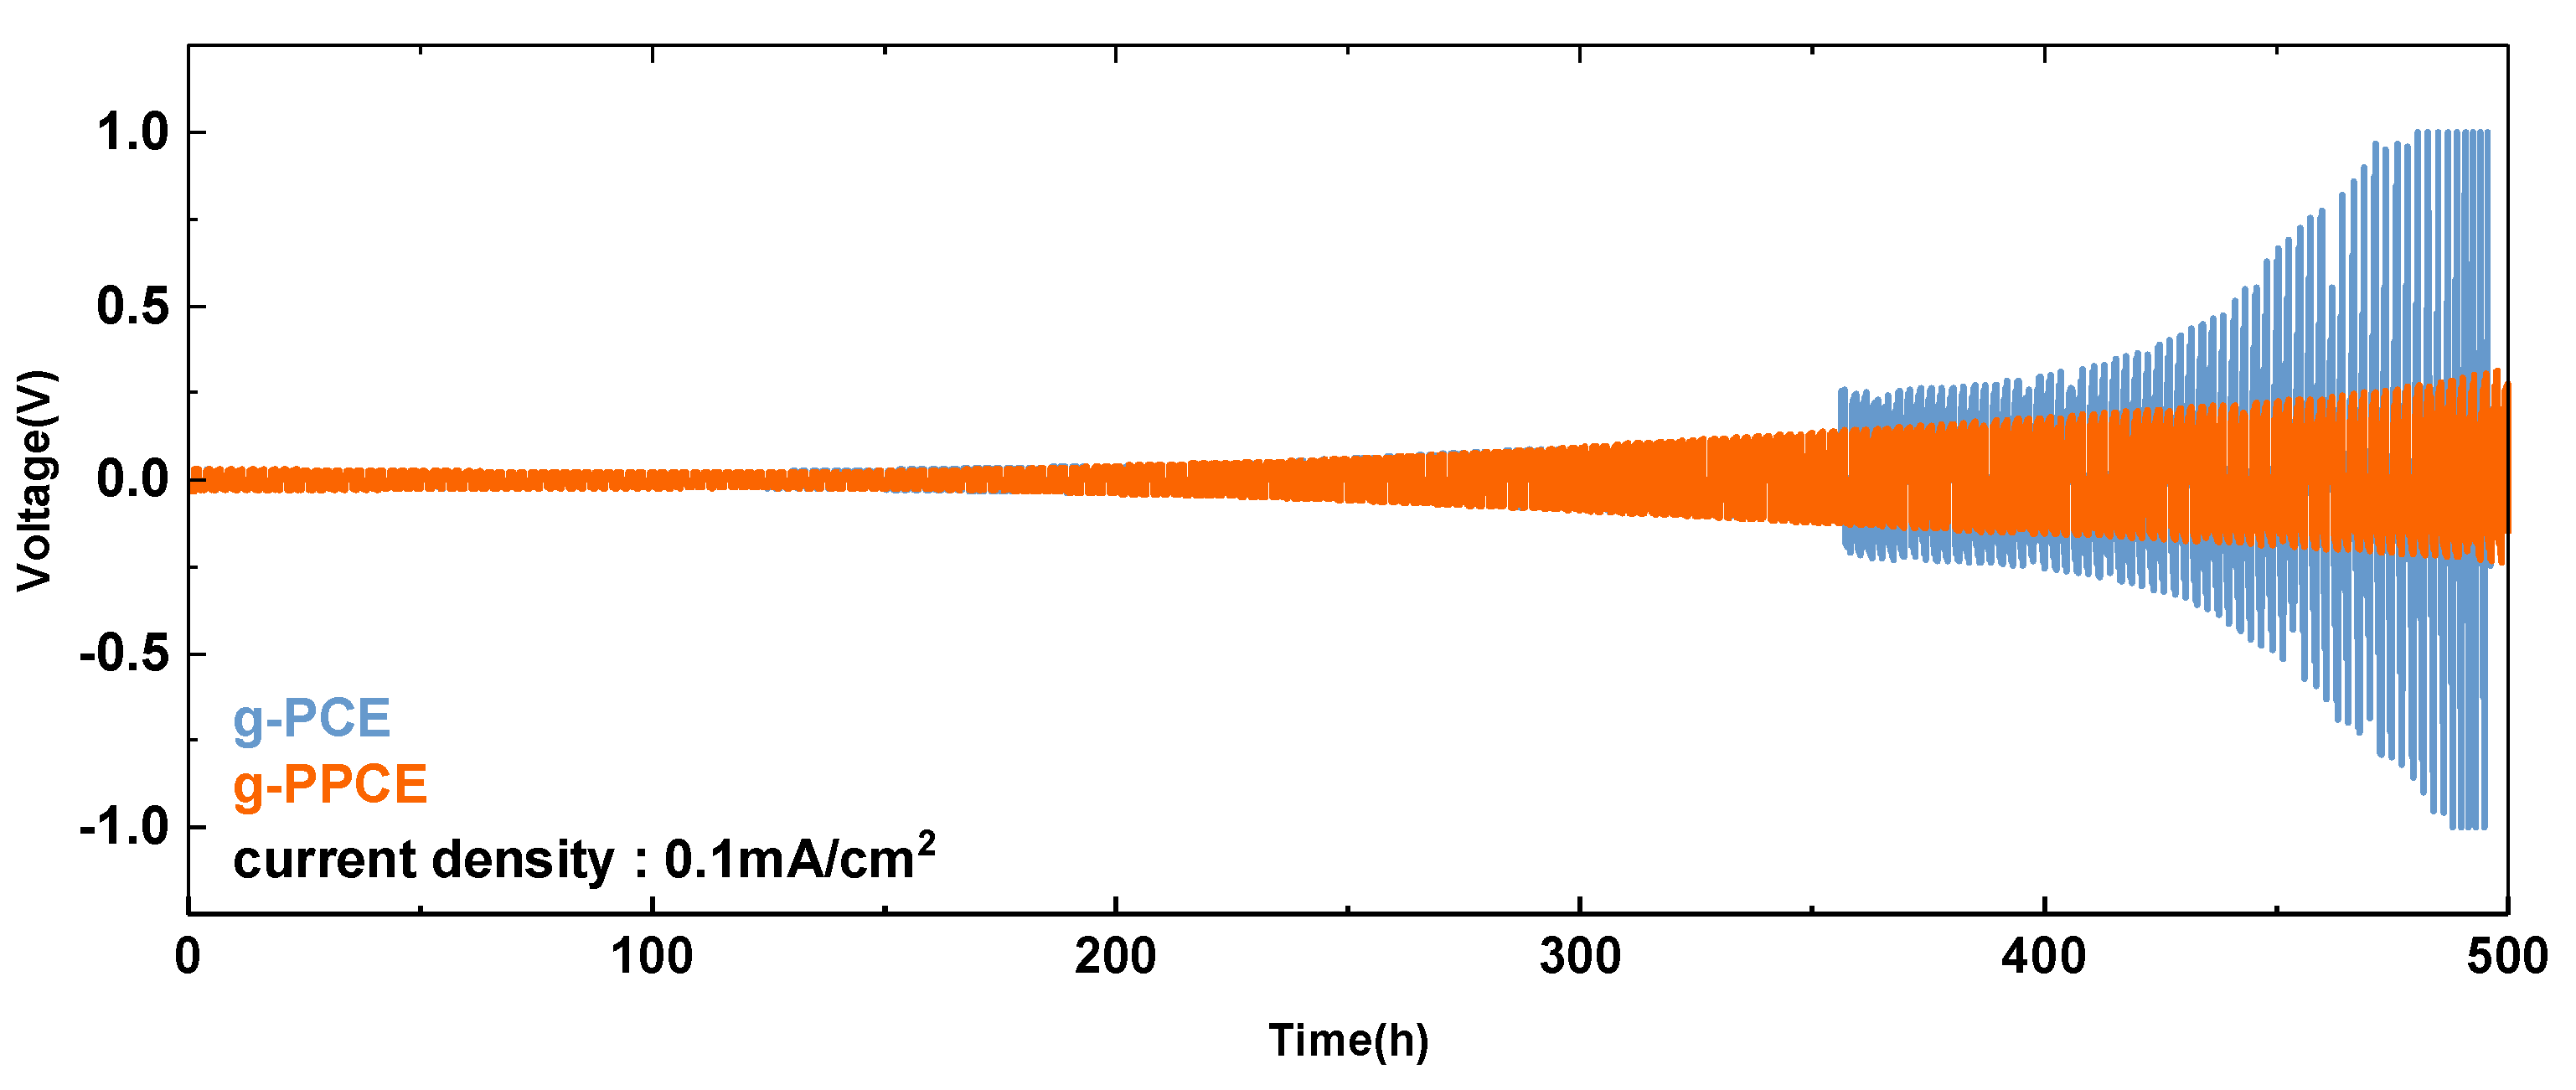
The electrochemical compatibility of g-PCE and g-PPCE with the metallic Li anode was assessed through the use of Li/g-PCE/Li and Li/g-PPCE/Li symmetric cells. As shown in
Figure 5, galvanostatic cycling curves of the symmetric cells of g-PCE and g-PPCE are gained with current density and capacity of 0.1 mA/cm
2 and 0.1 mAh/cm
2, respectively. The voltage of the g-PCE cell gradually increased after 350 h due to the formation of dead Li. Furthermore, the sudden short circuit was detected after 500 h, which was obviously due to Li-dendrite. However, no indication of a short circuit event was detected in the cycle of g-PPCE within 500 h cycling; nevertheless, the voltage was gradually increased. Cyclic voltammetry of g-PPCE (as shown in
Figure S12) also shows no noticeable peaks up to 5 V, which also indicates voltage stability of the solid electrolyte. All of the results confirm that the g-PPCE has stable interface properties which are superior to those of the g-PCE with Li-metal. Consequently, the stable electrochemical performance of solid electrolyte due to PAN addition also guarantees a stable interface with the Li-metal anode, which is critical to the electrochemical performance levels of the battery.
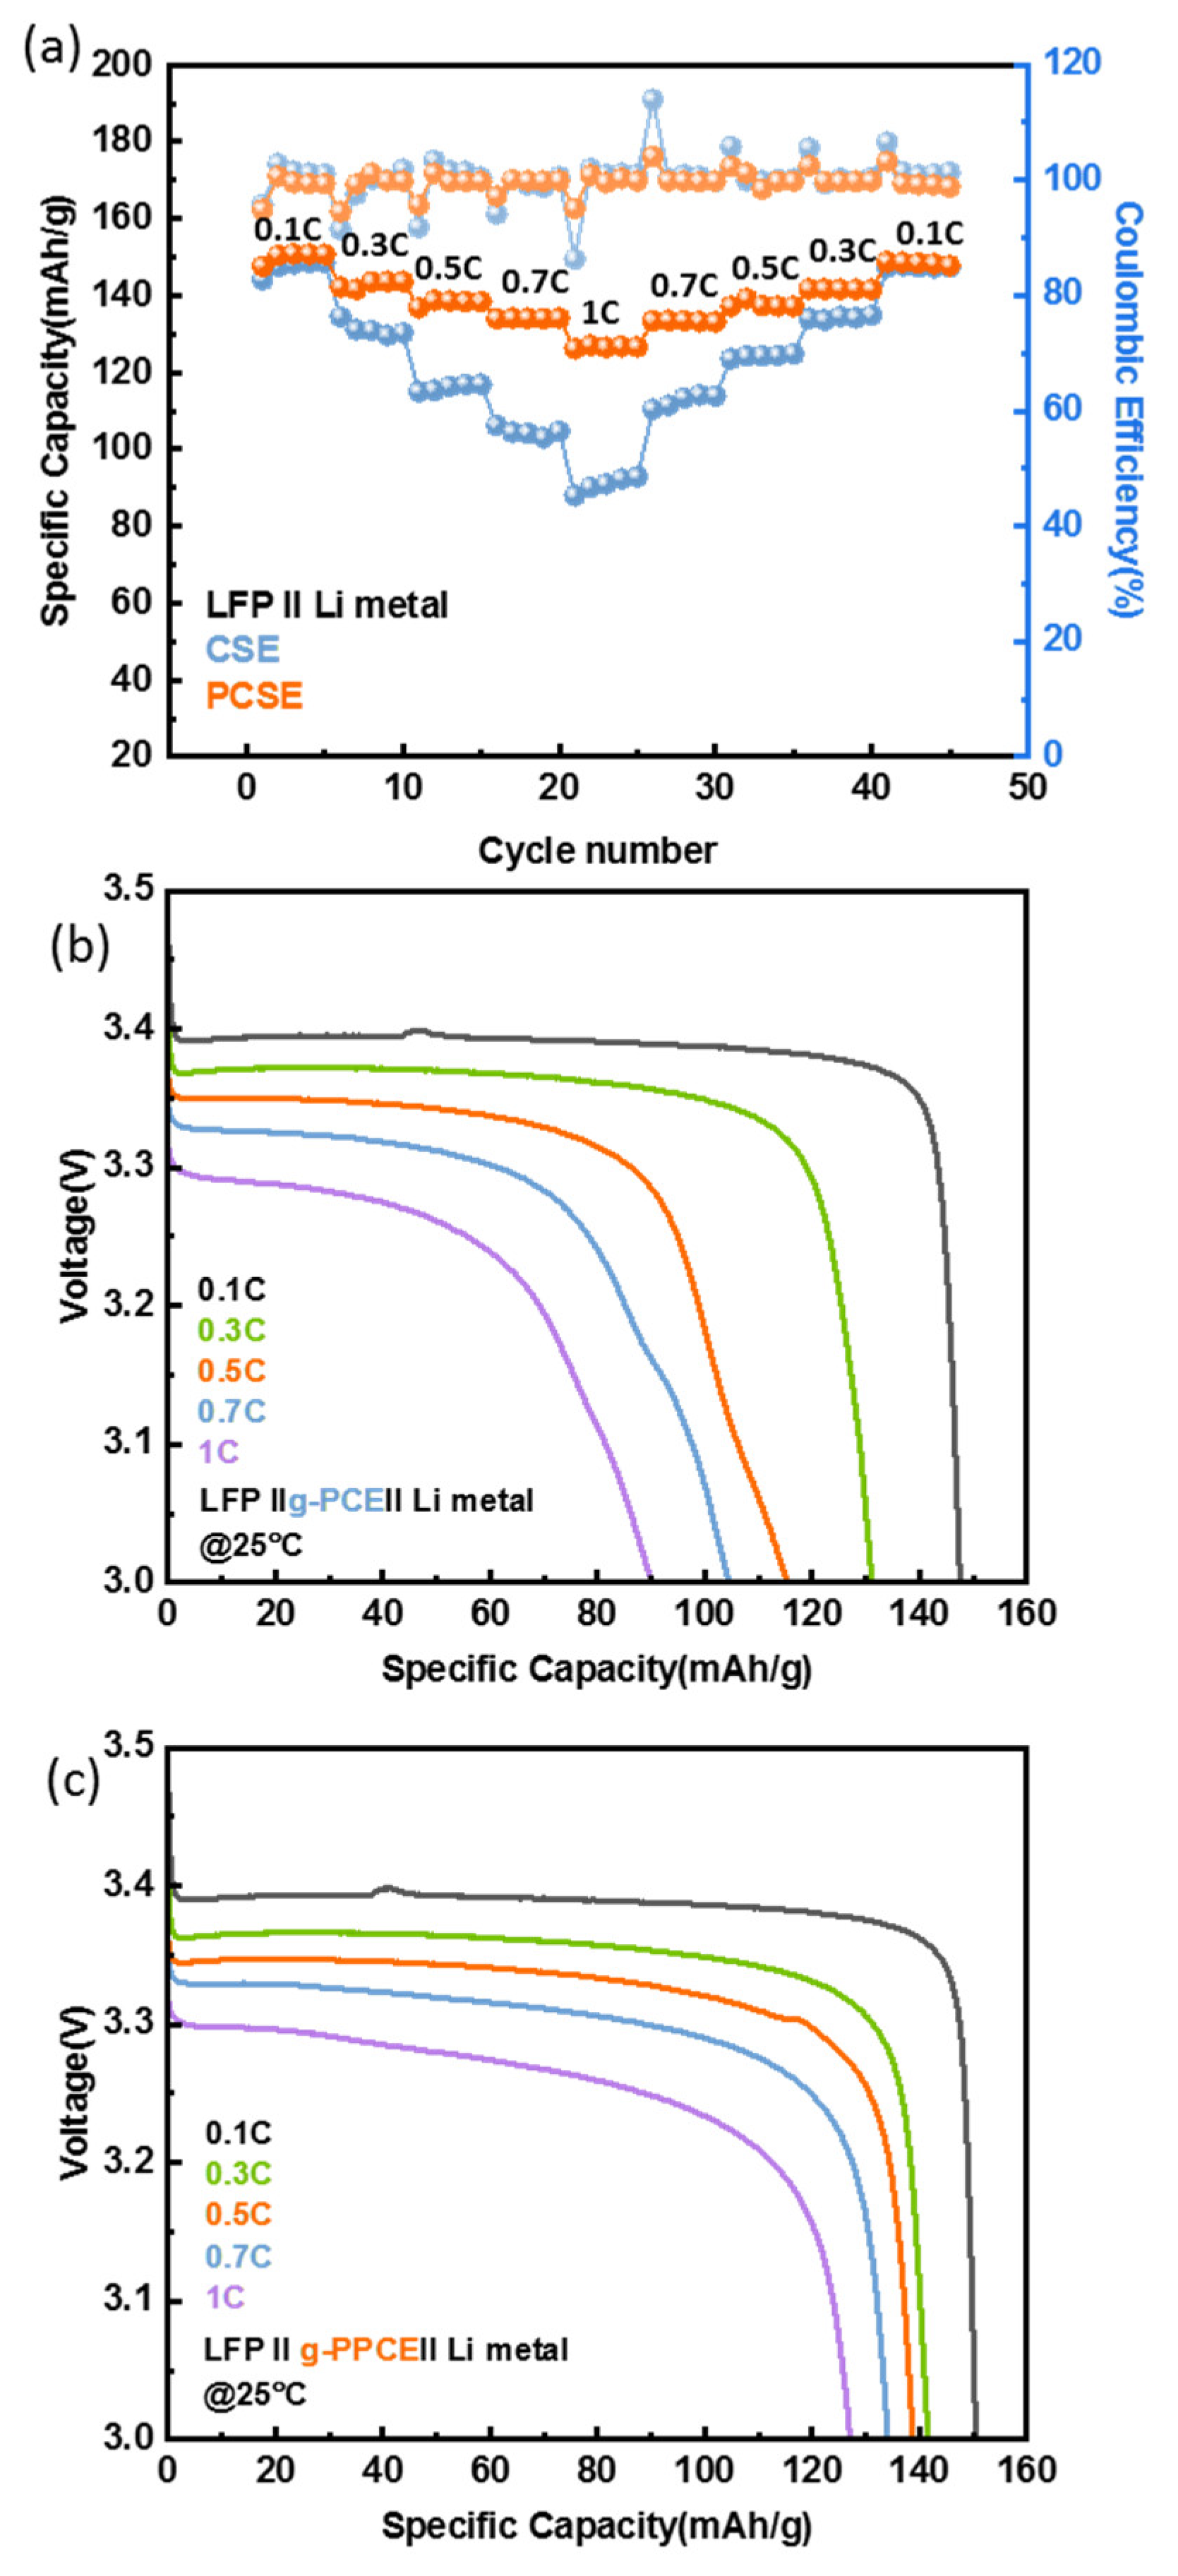
To compare the electrochemical performance levels of g-PCE and g-PPCE in Li-metal batteries, confirming the effect of PAN, LFP||g-PCE||Li and LFP||g-PPCE||Li cells were fabricated. First of all, excellent rate capability is an essential feature of all-solid-state batteries. The rate-performances of g-PCE and g-PPCE are shown in
Figure 6a. The specific capacities of g-PCE were 147, 130, 115, 104, and 90 mAh/g at 0.1, 0.3, 0.5, 0.7, and 1 C, respectively. However, the specific capacities of g-PPCE were 150, 141, 138, 134, and 127 mAh/g under the same conditions, higher than those of g-PCE. At a current density of 0.1 C, no significant difference existed between the capacities with and without PAN. However, as the C-rate increased, g-PPCE maintained a good discharge capacity 1.5 times higher than that exhibited by g-PCE at 1 C. This suggests that the SCN in g-PCE reacted with LGLZO and was polymerized, leading to the gelation of the electrolyte and an increase in resistance. Conversely, in the g-PPCE, PAN prevented the polymerization of the nitrile groups of SCN, preventing battery degradation and maintaining stability at a high current density. The graph also illustrates a gradual decrease in current density. Upon restoring the current density to 0.1 C, the reversible capacities of both g-PCE and g-PPCE remained stable. The Coulombic efficiencies of g-PCE and g-PPCE were high (~99%). However, changes in C-rate caused instability at some points. This was considered an instrument operating error in the measurement process, as the CE values were stable after the changes in current density.
The discharge curves of the LFP||g-PCE||Li and LFP||g-PPCE||Li cells at different C rates are shown in
Figure 6b,c. The g-PPCE curves showed clear potential plateaus, indicating a reversible cycling process [
56,
57]. Contrastingly, the discharge curve exhibited by g-PCE was non-linear, with a leftward slant at current densities exceeding 0.5 C. This variation in voltage plateau is generally related to battery degradation, indicating changes in the structure and composition of the electrode materials [
58]. The curves with unstable potential plateaus also suggest that the polymerization of the nitrile groups of SCN in the g-PCE may have caused some degradation reactions at high cycle rates, leading to stability issues between the electrolyte and electrode.
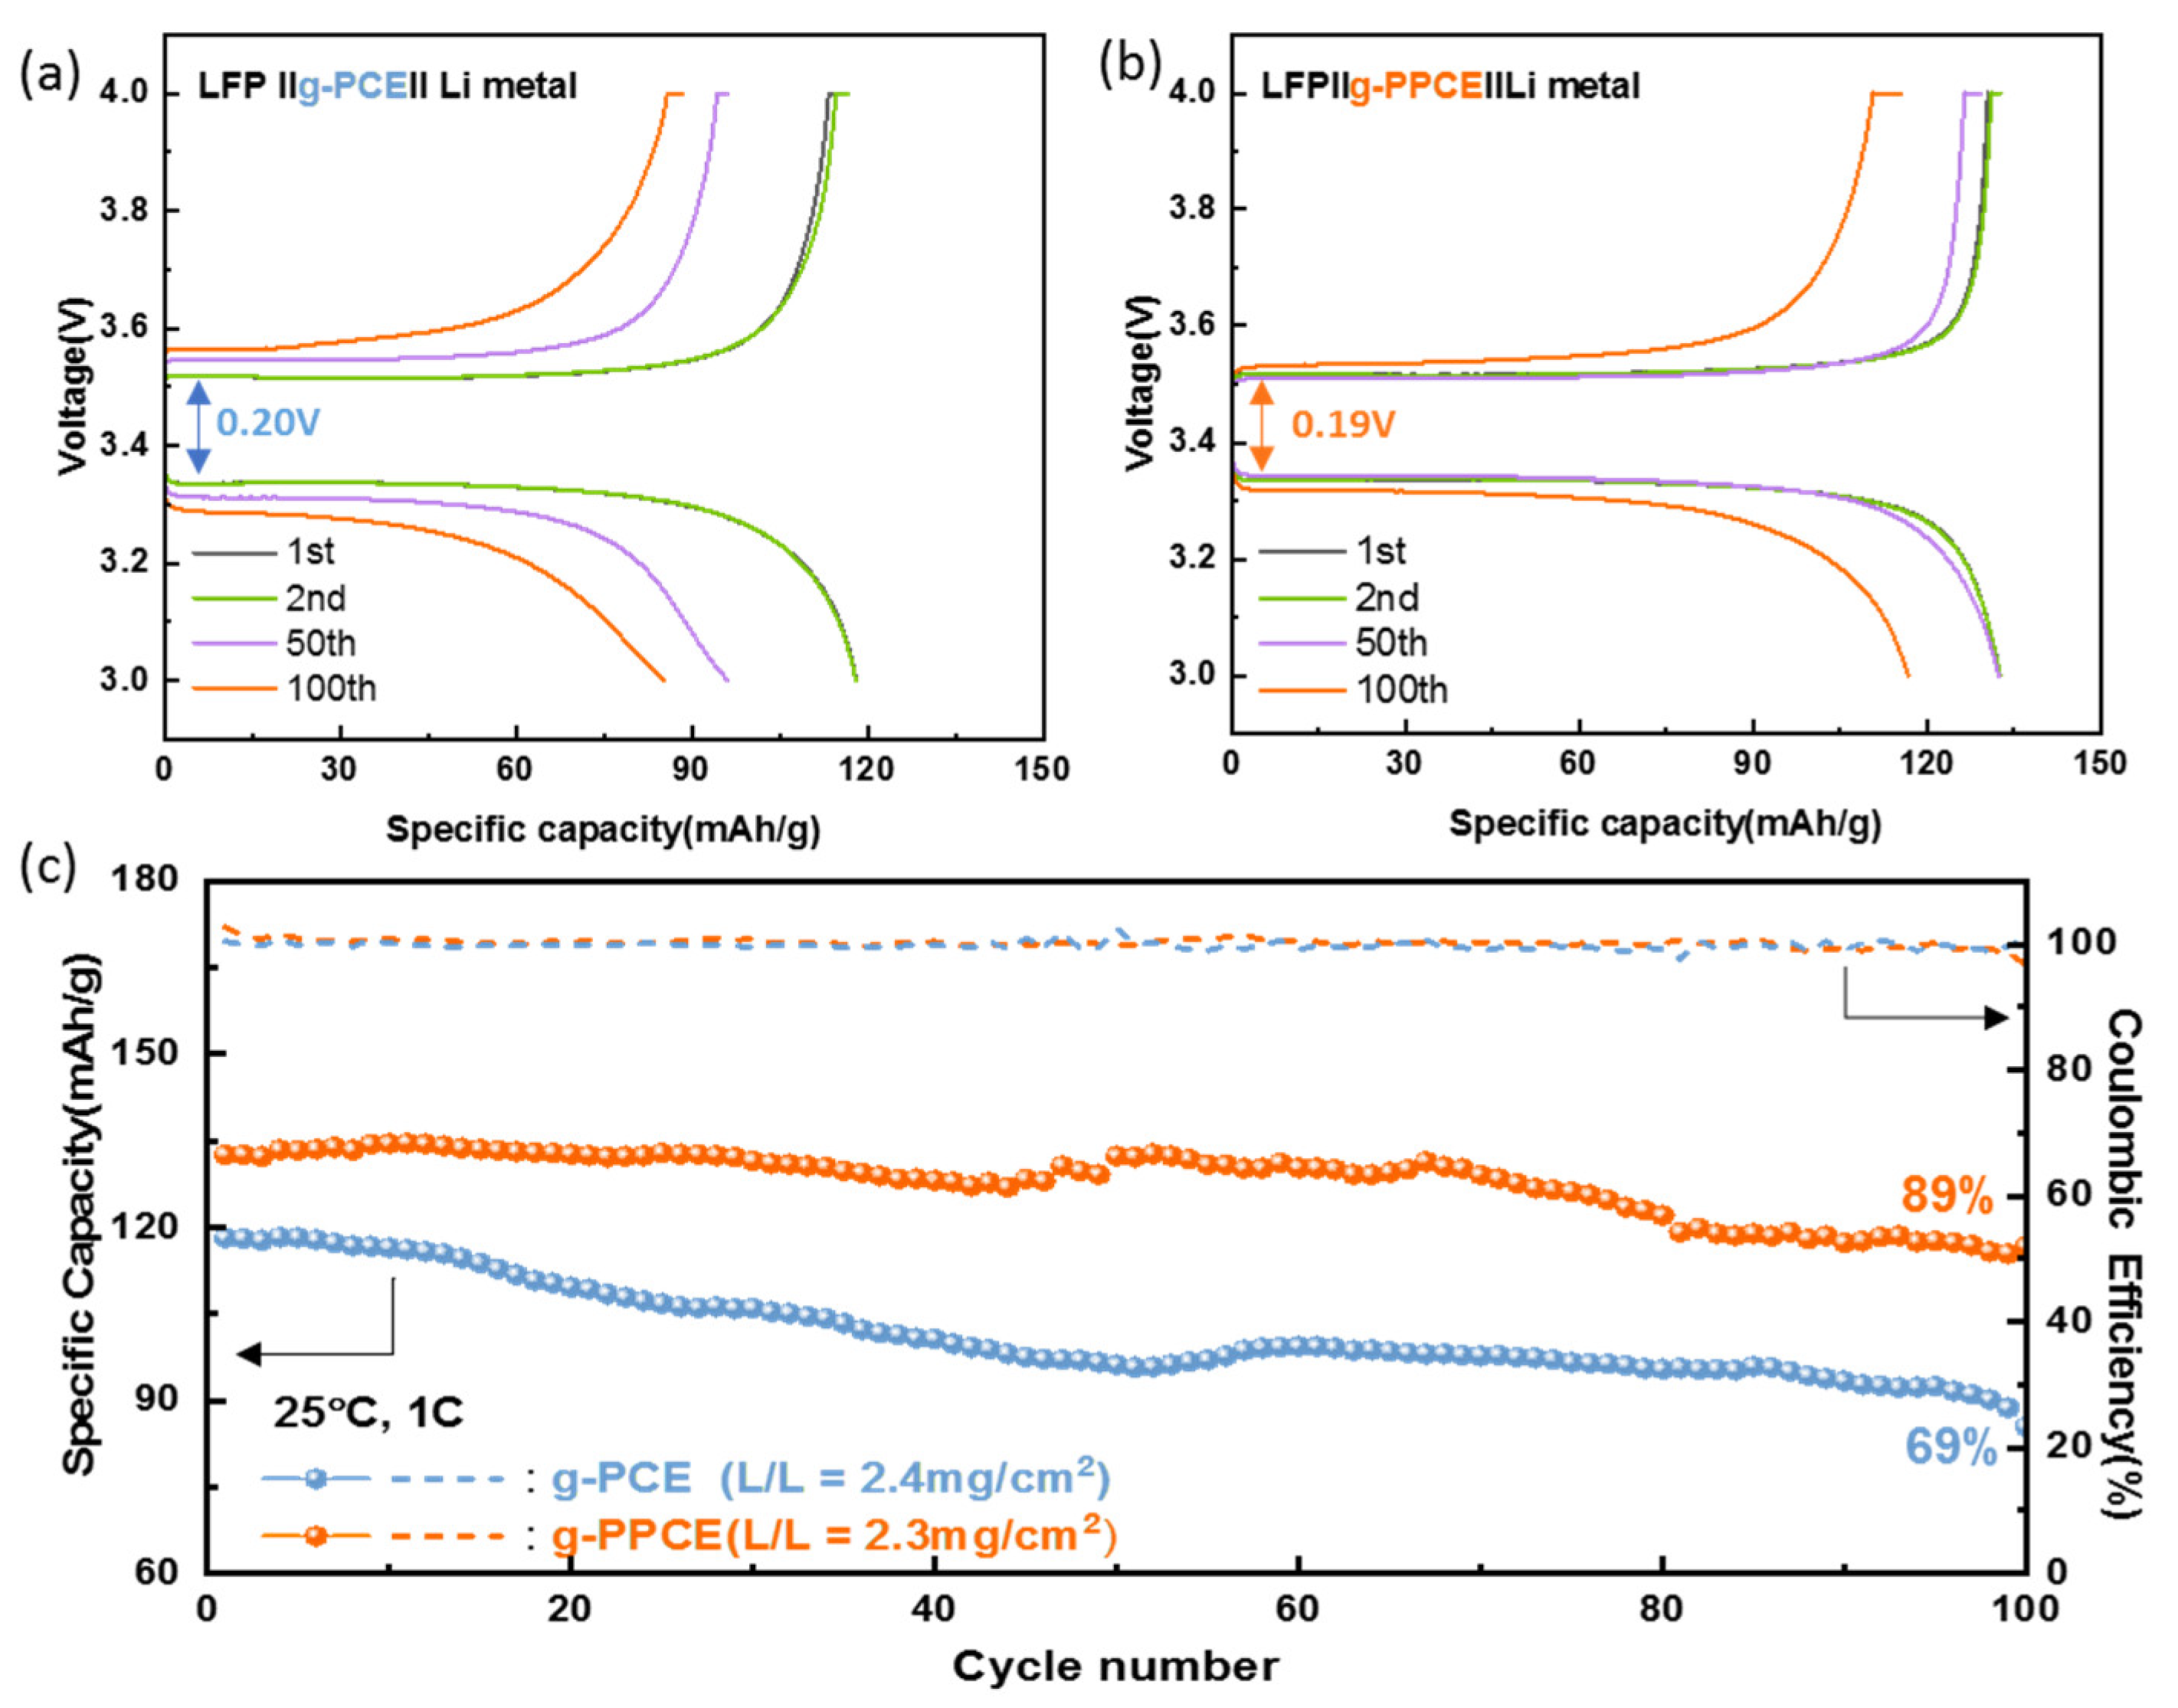
Secondarily, cyclic performance levels of g-PCE and g-PPCE were compared.
Figure 7a displays the charge and discharge curves of the LFP||g-PCE||Li cell at a rate of 1 C and 25 °C. The initial polarization voltage of the g-PCE cell was 0.2 V and the capacities at cycles number 1, 2, 50 and 100 were 118, 118, 95, and 85 mAh/g, respectively. The discharge graph sloped slightly after 50 cycles, indicating a significant decrease in capacity.
Figure 7b illustrates the charge and discharge curves of the LFP||g-PPCE||Li cell at a rate of 1 C and 25 °C. The initial polarization voltage of the g-PPCE cell was 0.19 V, and the capacities at cycles number 1, 2, 50 and 100 were 132, 132, 131 and 116 mAh/g, respectively. The discharge capacity was 130 mAh/g up to the 50th cycle and reduced subsequently. The charge/discharge curves of the g-PPCE show flat and reversible plateaus, indicating minimal polarization. Moreover, the Nyquist plots of LFP||g-PPCE||Li cell before and after galvanostatic cycling at 1 C and 25 °C are shown in
Figure S9. These Nyquist plots were subsequently analyzed by fitting them to the equivalent circuits presented in
Figure S10. Following 100 cycles, a stable formation of the solid electrolyte interface (SEI) with the increased charge transfer resistance is observed, showing the appearance of two semicircles.
Figure 7c shows the cycle performance levels of LFP||g-PCE||Li and LFP||g-PPCE||Li cells (1 C, 25 °C). The capacity of g-PCE decreases continuously, resulting in a Coulombic efficiency of 98% and specific capacity of 92 mAh/g at 100 cycles, corresponding to 69% of the initial capacity. Conversely, the capacity of g-PPCE remained constant; the CE was 99% and the specific capacity was 117 mAh/g at 100 cycles, 89% of the initial capacity. In terms of performance over 100 cycles, g-PPCE exhibited a higher capacity retention rate than g-PCE. This indicates that the unstable cycling performance of g-PCE at high current densities is due to the coordination of SCN and LGLZO in g-PCE, leading to gelation of the electrolyte and increased resistance. In contrast, the stable cycling performance of g-PPCE can be attributed to PAN reacting with LGLZO more readily than SCN, preventing SCN polymerization and, consequently, performance degradation.
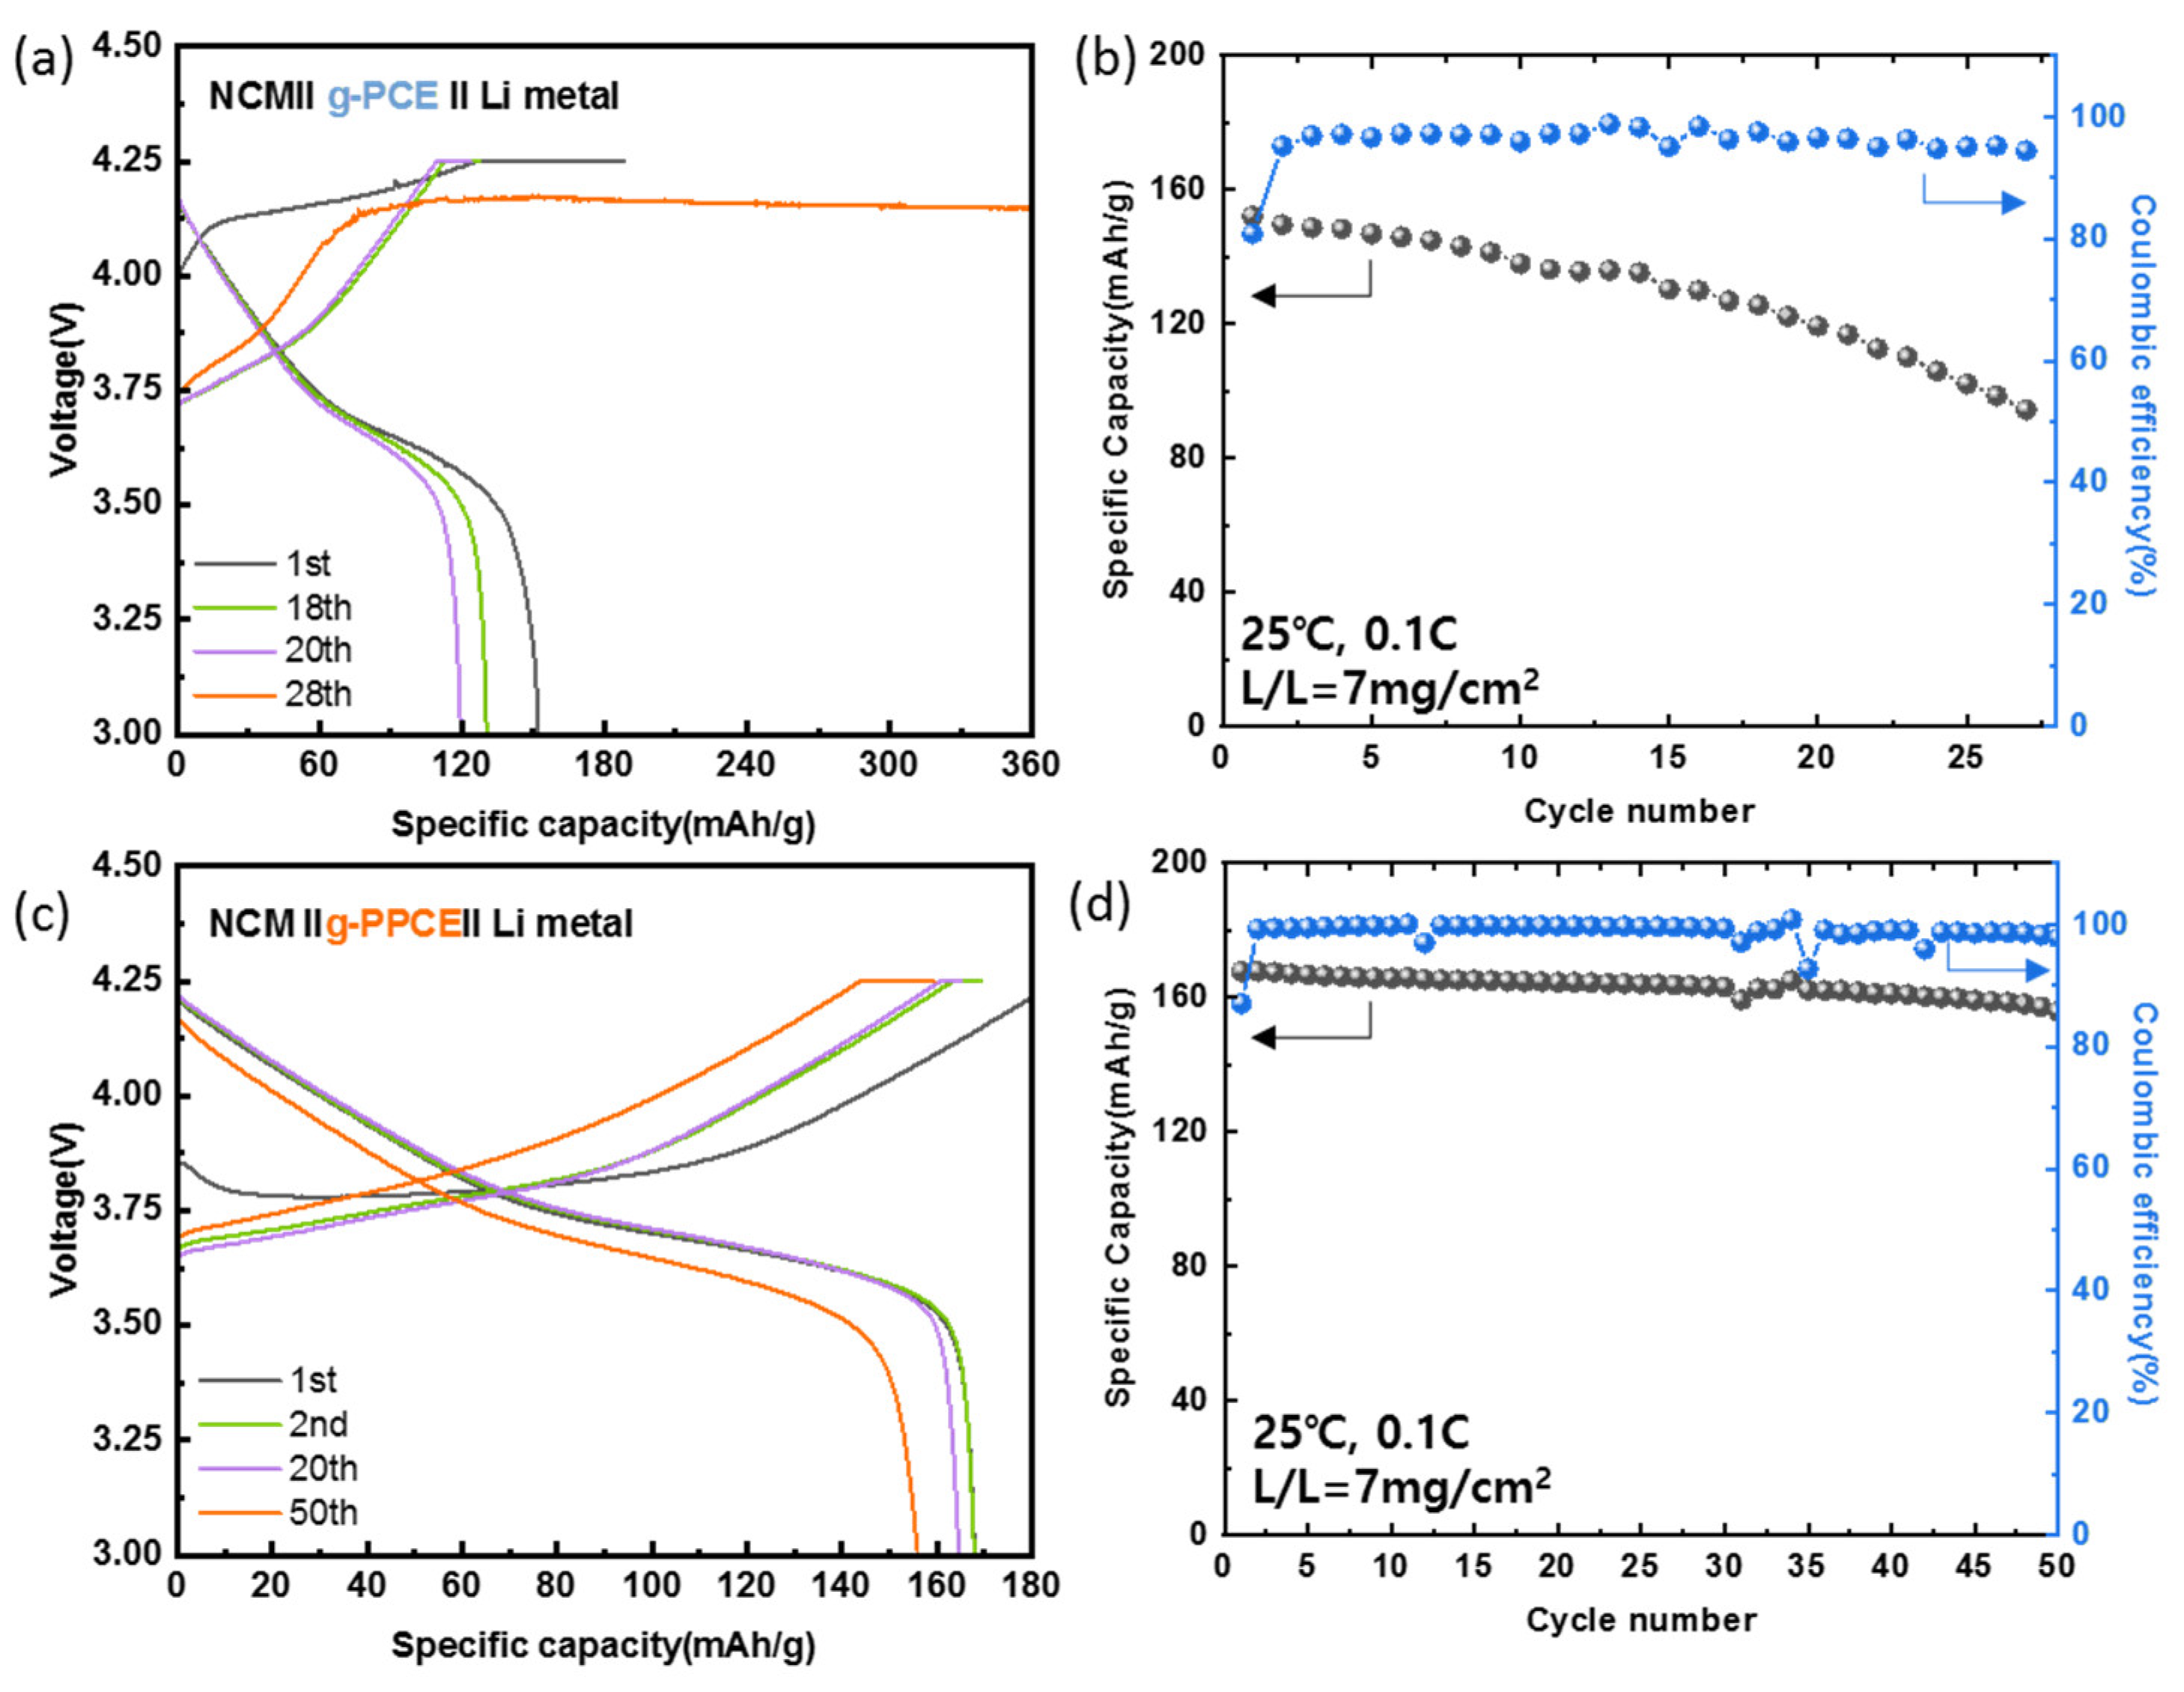
For a higher voltage operation of solid-state Li-metal battery, NCM was applied as a cathode active material.
Figure 8a displays the charge and discharge curves of the NCM||g-PCE||Li cell at 0.1 C and 25 °C. The capacities at cycles number 1, 2, and 20 were 151, 149, and 119 mAh/g, respectively, with overcharging occurring at the 28th cycle. This suggests that cells with g-PCE undergo micro-short-circuits as the Li dendrites grow. SCN polymerization appears to induce gelation of the electrolyte and locally change its resistance distribution, leading to the growth of Li dendrites.
Figure 8b depicts the cycling performance of the NCM||g-PCE||Li cell. The Coulombic efficiency at the 27th cycle (before overcharging) was 94%, and the discharge capacity was 94 mAh/g, indicating a 62% capacity retention. The unstable data at the 15th cycle is considered to be due to instrument errors. In addition, the charge and discharge curves of the NCM||g-PPCE||Li cell at 0.1 C and 25 °C are displayed in
Figure 8c. The capacities at cycles number 1, 2, 20, and 50 were 167, 167, 164, and 155 mAh/g, respectively.
Figure 8d shows the cycle performance of the same cell. The Coulombic efficiency at the 50th cycle was 97%, and the discharge capacity was 92% of the initial one. The Coulombic efficiencies around the 12th, 35th, and 42nd cycles exhibited fluctuations. This was attributed to operational errors in the device and recovery in later cycles. The g-PPCE exhibited stable cycle performance with no side reactions at high voltages.
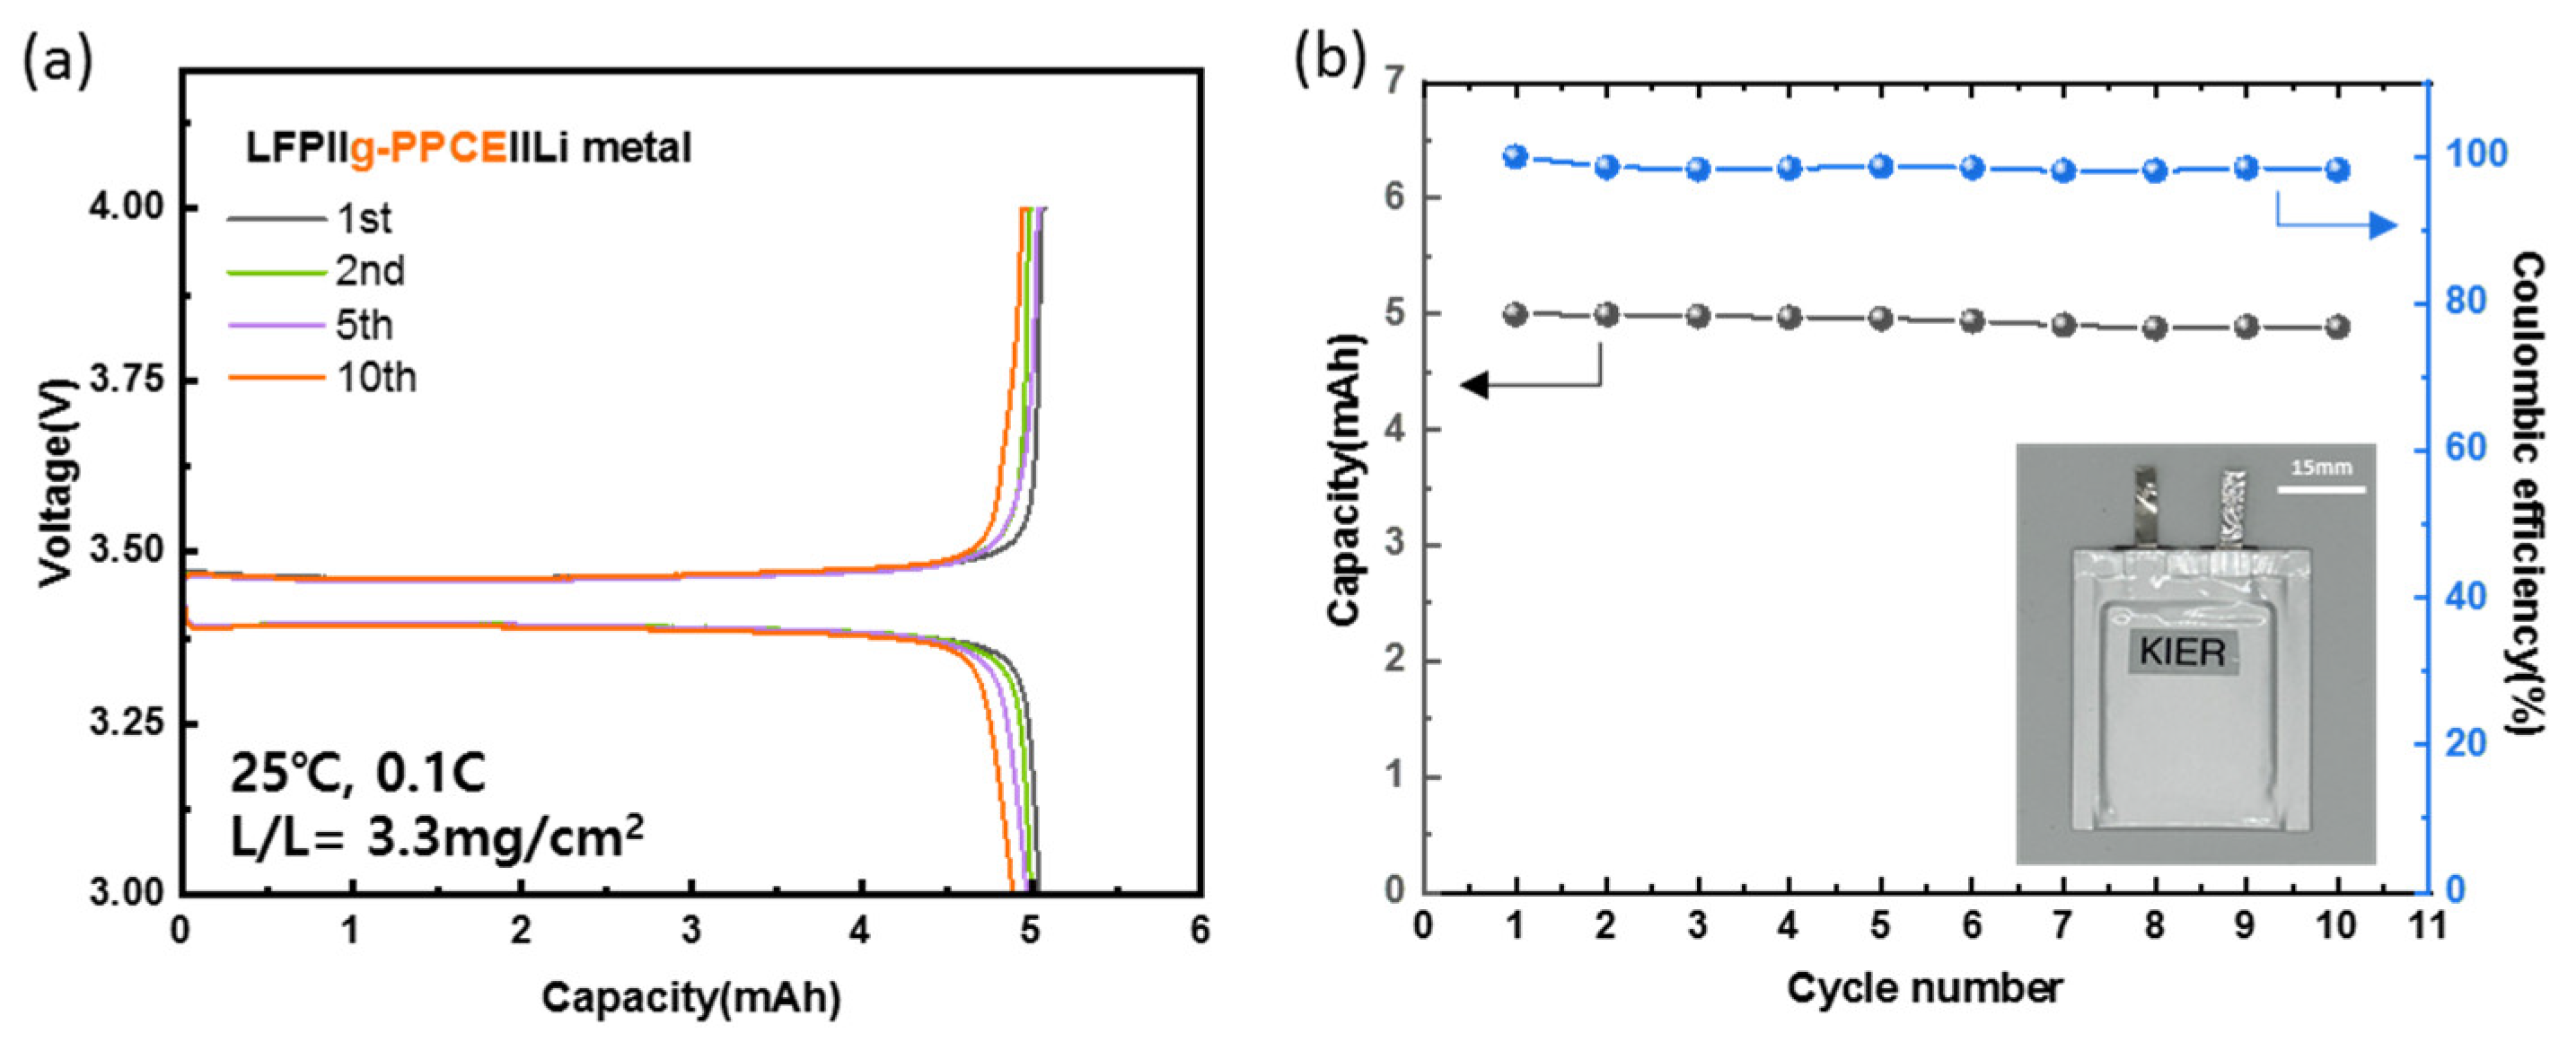
Finally, a pouch cell was fabricated with a g-PPCE and cell tests were conducted to verify the feasibility of large-area battery processing.
Figure 9a illustrates the charge/discharge curves of a 3450 size-pouch cell assembled with an LFP||g-PPCE||Li structure. The cell exhibited an initial capacity of 5 mAh at 0.1 C and 25 °C, and the capacities at the 2nd, 5th, and 10th cycles were 5.0, 4.9, and 4.8 mAh/g, respectively.
Figure 9b depicts the cycling performance of the pouch cell. After 10 cycles, the Coulombic efficiency was 98% and the capacity was 4.9 mAh, with a 98% capacity retention. This indicated that the electrolyte/electrode interface was stable even in the pouch cell configuration.


 ,
, 


