Article

Carbon Emission Prediction and the Reduction Pathway in Industrial Parks: A Scenario Analysis Based on the Integration of the LEAP Model with LMDI Decomposition

1
China Energy Engineering Group Jiangsu Power Design Institute Co., Ltd., Nanjing 210012, China
2
Institute of the Building Environment & Sustainability Technology, School of Human Settlements and Civil Engineering, Xi’an Jiaotong University, Xi’an 710049, China
3
School of Business Society and Engineering, Mälardalen University, 721 23 Västerås, Sweden
*
Authors to whom correspondence should be addressed.
Energies 2023, 16(21), 7356; https://doi.org/10.3390/en16217356
Submission received: 1 August 2023 / Revised: 19 September 2023 / Accepted: 20 September 2023 / Published: 31 October 2023
(This article belongs to the Special Issue Advances in Carbon Capture, Utilization and Storage (CCUS))

Abstract

:
Global climate change imposes significant challenges on the ecological environment and human sustainability. Industrial parks, in line with the national climate change mitigation strategy, are key targets for low-carbon revolution within the industrial sector. To predict the carbon emission of industrial parks and formulate the strategic path of emission reduction, this paper amalgamates the benefits of the “top-down” and “bottom-up” prediction methodologies, incorporating the logarithmic mean divisia index (LMDI) decomposition method and long-range energy alternatives planning (LEAP) model, and integrates the Tapio decoupling theory to predict the carbon emissions of an industrial park cluster of an economic development zone in Yancheng from 2020 to 2035 under baseline (BAS) and low-carbon scenarios (LC1, LC2, and LC3). The findings suggest that, in comparison to the BAS scenario, the carbon emissions in the LC1, LC2, and LC3 scenarios decreased by 30.4%, 38.4%, and 46.2%, respectively, with LC3 being the most suitable pathway for the park’s development. Finally, the paper explores carbon emission sources, and analyzes emission reduction potential and optimization measures of the energy structure, thus providing a reference for the formulation of emission reduction strategies for industrial parks.

1. Introduction

Since the Industrial Revolution, the high-carbon industrial modus operandi, characterized by significant natural resource consumption and vast greenhouse gas emissions, has escalated numerous environmental issues [1,2,3,4]. Climate change, environmental pollution, and energy security have emerged as global challenges, posing severe threats to human survival and development [5,6]. In such a milieu, the globe has reached the consensus to develop a low-carbon economy; it is also one of China’s critical measures to address climate change issues [7,8]. Presently, China is amidst rapid urbanization and industrialization, making the industry the chief consumer of energy and producer of carbon emissions. Among them, energy consumption in the industrial sector accounts for 65% of the country’s energy consumption, and carbon emissions are as high as 70%, which means the country has an enormous potential for energy conservation and emission reduction [9,10].
Industrial parks are both carriers of industrialization and crucial units for implementing low-carbon emission reduction goals [11]. Corresponding to the national climate change mitigation strategy, industrial parks are being earmarked as key targets for green transformation in the industrial sector. Therefore, macro strategy adjustment and micro technology optimization are getting more and more attention in industrial park emission reduction. Various scholars have evaluated emission reduction strategies for industrial parks, exploring avenues such as improvements in industrial development [12,13,14,15] and emission reduction technologies [16,17,18]. Chen et al. [19] proposed a composite evaluation method to understand the impact of emissions on energy consumption. Wei et al. [20] deliberated the feasibility and implementation of an electric-thermal carbon-neutral industrial park and pursued economic, energy, and environmental analyses across different scenarios.
Undeniably, predicting carbon emissions provides the foundational basis for formulating emission reduction strategies within a set timeline, chiefly within the economy–energy–environment system of a park [21]. Existing prediction models primarily utilize either the “top-down” or “bottom-up” models, typically applicable at country, province, city, or industry scales [22,23,24,25]. Implementing these models at a park level is a future challenge and necessity. The “top-down” macro forecasting approach analyzes the impact of changes in population, economy, and other social aspects on regional carbon emissions, though offering limited detail on individual energy consumption sectors and energy varieties. Representative models include the computable general equilibrium (CGE) [26,27], stochastic impacts by regression on population affluence and technology (STIRPAT) [28,29], and the logarithmic mean divisia index (LMDI) models [30,31,32]. Usman et al. [33] applied the STIRPAT model to explore the correlation between nuclear energy and the ecological footprint. In 1989, Kaya introduced the Kaya identity, which segmented carbon emissions into four macro-influencing factors. Subsequently, numerous scholars have analyzed the influence of these factors on carbon emissions within countries [34], cities [35], heating systems [36], and more using LMDI decomposition.
On the contrary, the “bottom-up” method emulates carbon emissions from different processes such as energy transportation and consumption, yet struggles to encapsulate the impact of macro conditions on carbon emissions. Noteworthy models include the long-range energy alternatives planning system (LEAP) [37] and MARKAL [38]. Countries [39], provinces, cities [40], buildings [41], and energy generation sectors [42] often use the LEAP model to calculate carbon emissions. Zou et al. [43] and Duan et al. [44] employed the LEAP model to investigate carbon emission pathways and formulate climate change mitigation strategies, respectively. Given the preceding research and model characteristics, LMDI decomposition can accommodate multi-scale carbon emissions, while the LEAP model’s long-term energy system planning capability makes it suited for formulating emission reduction strategies. Consequently, this study adopts the LEAP and LMDI models to devise a hybrid framework for predicting and calculating park carbon emissions. The LEAP model and LMDI decomposition hybrid analysis framework combines the advantages of the two models, which can reflect the contribution of various types of commercial developments and the application of energy technology to carbon emissions at the micro level, reflect the impact of policy variation on carbon emissions at the macro level, and expand the calculation of carbon emissions to the industrial park scale, consequently providing a reference for the development of emission reduction strategies in parks.
In conclusion, research on carbon emission prediction and calculation at an industrial park level is sparse, and existing forecasting models fall short in providing both macro- and micro-perspective analyses. Bridging this gap, this study combines the strengths of “top-down” and “bottom-up” prediction methods to establish a LEAP–LMDI hybrid analysis framework, incorporating multiple data analysis approaches including the Tapio decoupling theory. It also takes into account diverse low-carbon scenarios such as macro-control and micro-technology, to simulate carbon emissions and emission structures in various scenarios within an industrial park cluster of an economic development zone in Yancheng from 2020 to 2035. This provides a reference point for the industry in their evaluation of park emission reduction strategies.
The paper is organized as follows: Section 1 summarizes the research on and literature review of carbon emission prediction and calculation. The methodology used in this research is introduced in Section 2. Section 3 describes the scenario setting and the analyses of LMDI decomposition and decoupling theory. Section 4 presents the results and detailed discussion of the carbon emissions forecast and pathways for low-carbon industrial park development. Conclusions are shown in Section 4.

2. Methodology

2.1. Analysis Framework

Taking an industrial park cluster of an economic development zone in Yancheng as the subject of study, this research assesses and forecasts carbon dioxide emissions associated with macroeconomic strategies and micro-energy activities from 2020 to 2035. We construct a hybrid analysis framework to investigate the park’s path towards reducing emissions, as represented in Figure 1. This framework is principally integrated with logarithmic mean divisia index (LMDI) decomposition and the long-range energy alternatives planning (LEAP) system, leveraging various data processing methods and Tapio decoupling theory. This integration enables the functionality of predicting regional carbon emission trends, assessing energy-saving capabilities, and forming emission reduction strategies. The framework comprises four primary modules: (1) the Parameter Acquisition Module, (2) the Driving Factor Analysis Module, (3) the Carbon Emission Simulation Module, and (4) the Assessment Module.
First, the industrial park’s accounting boundaries are determined, and an emission calculation framework is created. Subsequently, we obtain input parameters from historical records and planning documents, improve the Kaya identity equation, and utilize the LMDI model to analyze the driving factors contributing to the park’s carbon emissions. Furthermore, we quantify the contribution rate of various factors, feeding these statistics into the subsequent LEAP model’s scenario settings. The Carbon Emission Simulation Module, integral to our hybrid optimization framework, combines data from the two previous modules to set macro, energy, and environmental parameters within the LEAP model. Scenarios considering activity level, energy demand, transformation and losses are designed, and resultant carbon emission trends are simulated. In conclusion, using evaluation indicators such as the carbon emission output of the LEAP model and the decoupling theory, we ascertain whether the scenario aligns with development needs and low-carbon construction. This process aids in determining future development pathways for the park.

2.2. LEAP Model

The extensively used LEAP model facilitates the assessment of energy policies and climate change mitigation. Using scenario analysis, a critical method within the LEAP model, we measure regional carbon emissions and explore the effects of macro policies and technical tools on carbon dioxide mitigation actions. The LEAP model simulates energy demand, transformation, and corresponding carbon emissions using the given setting scenario, taking the form of [45]:
C t o t a l = C D + C T = i j A j , i × E j , i × E F j + n j T E n , j r × E F j
where Ctotal presents total carbon emissions; CD and CT denote the carbon emissions of energy demand and transformation, respectively; A stands for the activity level; E denotes the energy consumption per unit activity level; EF represents the emission factor, which is displayed in Table 1; TE indicates the secondary energy production from the transformation output; r accounts for the conversion efficiency; i is different energy consumption sectors, j denotes different fuel types; and m means the type of energy produced.

2.3. Decomposition Model

The decomposition model used in this research is based on the Kaya identity equation [46]. It aims to identify the driving factors of carbon emissions in industrial parks and decompose these emissions using the logarithmic mean divisia index (LMDI) method. The Kaya identity equation is commonly used in large-scale studies of countries and cities, and it considers various factors such as the industrial structure of energy consumption, the gross product of parks, and the employed population. In this study, we replace the gross domestic product (GDP) with the gross product of parks (EI), the population with the employed population (P), and introduce the industrial added value (EG) to describe the industrial structure. Equation (2) shows the decomposition of carbon emissions from park energy activities into five driving factors: energy intensity (∆CE), energy structure (∆EG), industrial structure (∆EI), industrial economic development (∆IP), and employment scale (∆P).
C = i C i = i ( C i E i × E i E G i × E G i I G × I G P × P ) = i ( C E i × E G i × E I i × I P × P )
where C represents the carbon emissions of energy consumption in the park, E stands for the consumption of various energy sources, EG is the added value of industries, IG accounts for the gross product of the park, P denotes the employed population of the park, and i represents different industries.
According to the additive decomposition principle of the LMDI model, the carbon emission influence of each driving factor from the base year (year 0) to the target year (year t) is displayed in Equations (3)–(8). The carbon emission contribution rate represents the ratio of the carbon emission influence of each driving factor to the carbon emission increment (∆C).
C = i ( C i t C i 0 ) = i ( C E i + E G i + E I i + I P + P )
C E = i ( C i t C i 0 ln C i t ln C i 0 × ln C E i t C E i 0 )
E G = i ( C i t C i 0 ln C i t ln C i 0 × ln E G i t E G i 0 )
E I = i ( C i t C i 0 ln C i t ln C i 0 × ln E I i t E I i 0 )
I P = i ( C i t C i 0 ln C i t ln C i 0 × ln I P i t I P i 0 )
P = i ( C i t C i 0 ln C i t ln C i 0 × ln P i t P i 0 )

2.4. Tapio Decoupling Theory

To verify the rationality of the scenario setting and the stability of peak results, the Tapio decoupling index is employed to explore the short-term changes in carbon emissions and economic development in industrial parks [47]. In simple terms, the decoupling index is a relative rate of change that reflects the ratio between the relative change degree of carbon emissions and the relative change degree of economic indicators in a certain period. The specific expression of the decoupling model is shown in Equation (9), and the decoupling types are summarized in Table 2.
ε ( C , G D P ) = C / C I G / I G

2.5. Data Sources

The researched industrial park cluster established a planning system in 2016, which mainly consists of five industries: the chemical industry (CH), steel industry (ST), high-tech equipment manufacturing industry (HI), pharmaceutical industry (PH), and paper industry (PA). The historical data of the park include the gross product, industrial proportion, and energy-use information from 2020 to 2022. The infrastructure construction scale and settlement of enterprises in the park from 2023 to 2025 are complete and detailed. Based on this, a scenario setting and carbon emission prediction for the park from 2023 to 2035 are carried out. The research data mainly include the gross production value, industrial added value, employed population, and different types of energy consumption in the historical, base, and forecast years. These data are obtained from park planning documents, statistical yearbooks, and industry development reports.

3. Model Analysis and Scenario Setting

3.1. Analysis of Driving Factors

The contribution rates of carbon emissions from different driving factors and the industrial effect are presented in Figure 2, which is determined through the decomposition of carbon emissions from 2020 to 2022 using the LMDI model. It can be seen that only energy intensity and energy structure have a negative contribution to CO2 emissions, and other factors have a significant promoting effect on CO2 emissions. This is because the construction of the industrial park cluster is in its initial stage, the carbon emissions of the industrial park and economic benefits have not been decoupled, and the contribution rate of the employment population and per capita GDP is positive and occupies a large proportion. Furthermore, with the construction of high energy consumption industries, the contribution of industry ratio is also positive. However, because the chemical industry, steel and other industries should strive for an energy intensity and energy consumption structure at the industry benchmark level, some process optimization has been carried out, so the contribution rate of these two items is negative. The contribution rates of the employment population and industrial economic development are significantly higher than those of other factors, indicating that the development of the park is closely linked to the economy. Additionally, the positive contribution rate of the industrial structure can be attributed to the growth of the steel industry and chemical industry. On the other hand, the contribution rates of energy consumption intensity and energy consumption structure are negative, aligning with the park’s plan to improve energy utilization efficiency and optimize energy structure. Although the contribution rate is small, there is potential to further increase technology investment to achieve energy conservation and emission reduction targets. Furthermore, when considering the contribution rates of carbon emissions from different industries, the steel industry has the largest effect at 63%, followed by the chemical industry at approximately 22%. In contrast, the contribution rates of other high-tech industries in the park are relatively small. Consequently, the park should focus on adjusting the steel industry, utilizing technical methods to improve the quality of enterprises with high energy consumptions, optimizing process flows, and promoting industrial chain circulation.

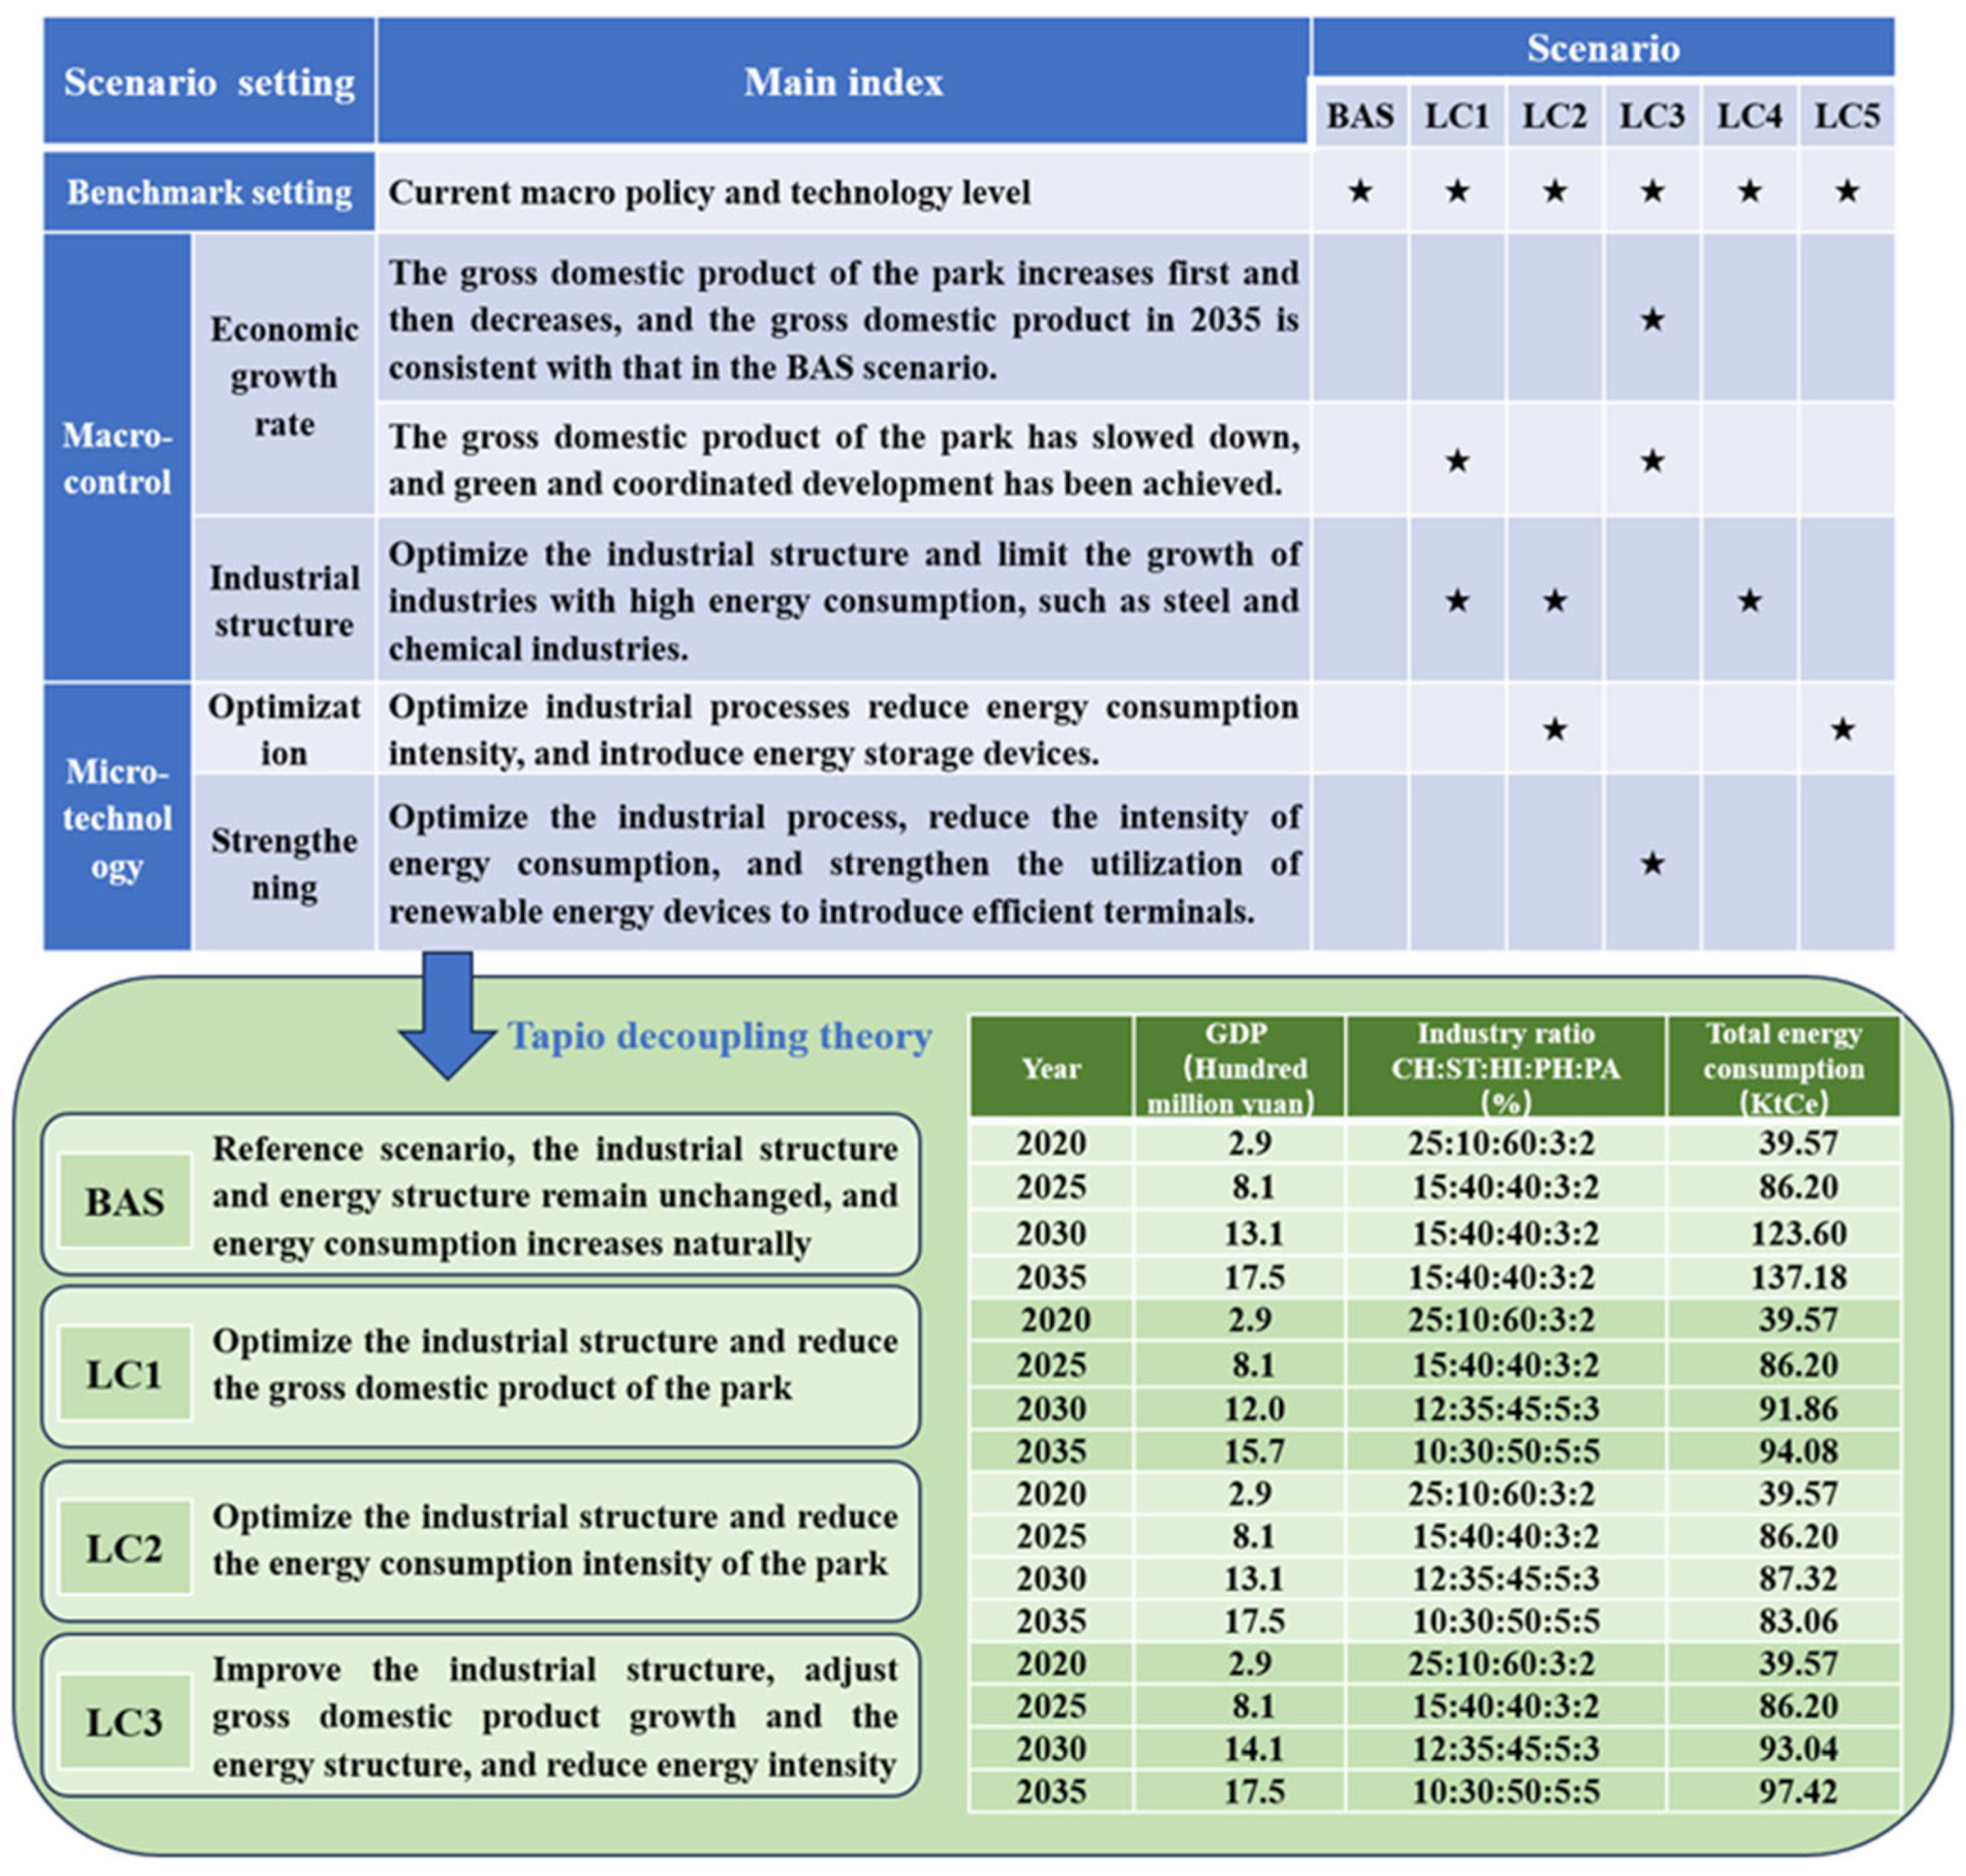
3.2. Scenario Setting

By quantifying the influencing factors of the park’s gross product, energy structure, energy intensity, and industrial structure based on the driving factor analysis results and the development plan of the industrial park, six scenarios are devised and illustrated in the upper part of Figure 3. These scenarios involve optimizing the industrial chain, adjusting the energy structure, and incorporating energy technology, and the stars are used to mark development measures adopted. The scenarios are as follows: the baseline scenario (BAS) serves as a reference scenario based on short-term planning without any macro-control or energy-saving technical means, while the low-carbon pathway scenarios 1, 2, 3, 4, and 5 (LP1, LP2, LP3, LP4, and LP5) explore various strategies. LP1 involves macro-control on the BAS scenario, reducing the economic growth rate of the park, enhancing high-quality green development, limiting the growth rate of the steel and chemical industries, focusing on adjusting the industrial chain of the steel industry, and optimizing the industrial ratio of the park planning. LP4 is similar to LP1, but with the economic growth rate of the park aligning with the BAS scenario. LP2 adjusts the industrial structure of the park, improves the technology used in high-energy consumption industries, and gradually introduces energy storage technology in 2025 to decrease energy intensity. Likewise, LP5 is similar to LP2, but maintains the industrial structure of the BAS scenario and does not introduce energy storage technology. In the LP3 scenario, the gross product growth rate increases in the preliminary stage, and the renewable energy structure is adjusted. However, the gross product growth rate decreases in the later stage to account for economic development. Moreover, the LP3 scenario introduces renewable energy utilization devices such as solar and geothermal energy, as well as carbon capture devices in 2030, which is a necessary technological means to achieve carbon neutrality [48,49,50,51,52].

3.3. Decoupling Analysis

The decoupling index, displayed in Figure 4 for the decoupling categories of the six scenarios, depicts the relationship between annual carbon emissions and economic growth, which is determined by the Tapio decoupling theory in Section 2.4. During the initial stage of industrial park development from 2020 to 2025, the main trend is growth linkage. Both the BAS scenario and LP5 scenario continue to exhibit growth linkage throughout the planning period, which clearly contradicts the requirements of low-carbon development. The LP4 scenario is expected to transition to weak decoupling in 2032, while the LP1, LP2, and LP3 scenarios are projected to stabilize in a relatively ideal state of weak decoupling and strong decoupling after 2025. Therefore, these three scenarios are selected for further output calculations and comparison with the BAS scenario, as indicated on the right side of Figure 3.

4. Discussion

4.1. Total Carbon Emissions under Different Scenarios

The comparison between carbon emissions under the low-carbon scenarios of the park and the BAS scenario can be obtained from the simulation results of the LEAP model, as demonstrated in Figure 5. In the BAS scenario, carbon emissions steadily increase each year, reaching 351.4 KtCO2e by 2035. The other three emission reduction scenarios, LC1, LC2, and LC3, exhibit significantly lower carbon emissions than the baseline scenario, emitting 244.6 KtCO2e, 216.2 KtCO2e, and 189.0 KtCO2e, respectively, in 2035. This translates to emission reduction rates of 30.4%, 38.5%, and 46.2% in 2035, respectively. Although emissions in the LC1 scenario are slightly lower than those in the LC3 scenario by 2030 due to slower gross product growth, the advantages of optimized energy technology under the LC2 and LC3 scenarios become more evident as the park economy continues to develop. Specifically, LC2 will reach its peak in 2028 due to the gradual introduction of energy storage technology in 2025. Furthermore, the LC3 scenario demonstrates a downward trend after an inflection point in 2030, thanks to the introduction of carbon capture technology for power generation units in the chemical industry, resulting in significantly higher emission reduction compared to other scenarios.
Figure 6 illustrates the carbon intensity of different scenarios in 2020, 2025, 2030, and 2035. In the initial stage of the BAS scenario, high-energy industries such as the steel and chemical industries in the park continue to develop, leading to a high carbon emission intensity. From 2020 to 2025, the park is required to vigorously realize industrial planning in the initial stage of construction, and the introduction of emission reduction technologies and macro policy adjustments are not considered in four scenarios. As a result, the carbon intensities in 2020 and 2025 are the same. From 2025 to 2035, the carbon emission intensity slowly decreases due to the establishment of high-energy consumption industries and the continuous development of high-tech industries, reaching 2.2 tCO2/ten thousand yuan by 2035. Meanwhile, the LC1, LC2, and LC3 scenarios exhibit carbon emission intensities of 1.6 tCO2/ten thousand yuan, 1.2 tCO2/ten thousand yuan, and 1.1 tCO2/ten thousand yuan, respectively. It can be concluded that adjusting the industrial ratio effectively reduces carbon emission intensity, but the effect gradually weakens as the industrial park is established and economic development occurs. At this stage, introducing energy storage technology, efficient terminals, and carbon capture devices becomes necessary to achieve further emissions reduction.

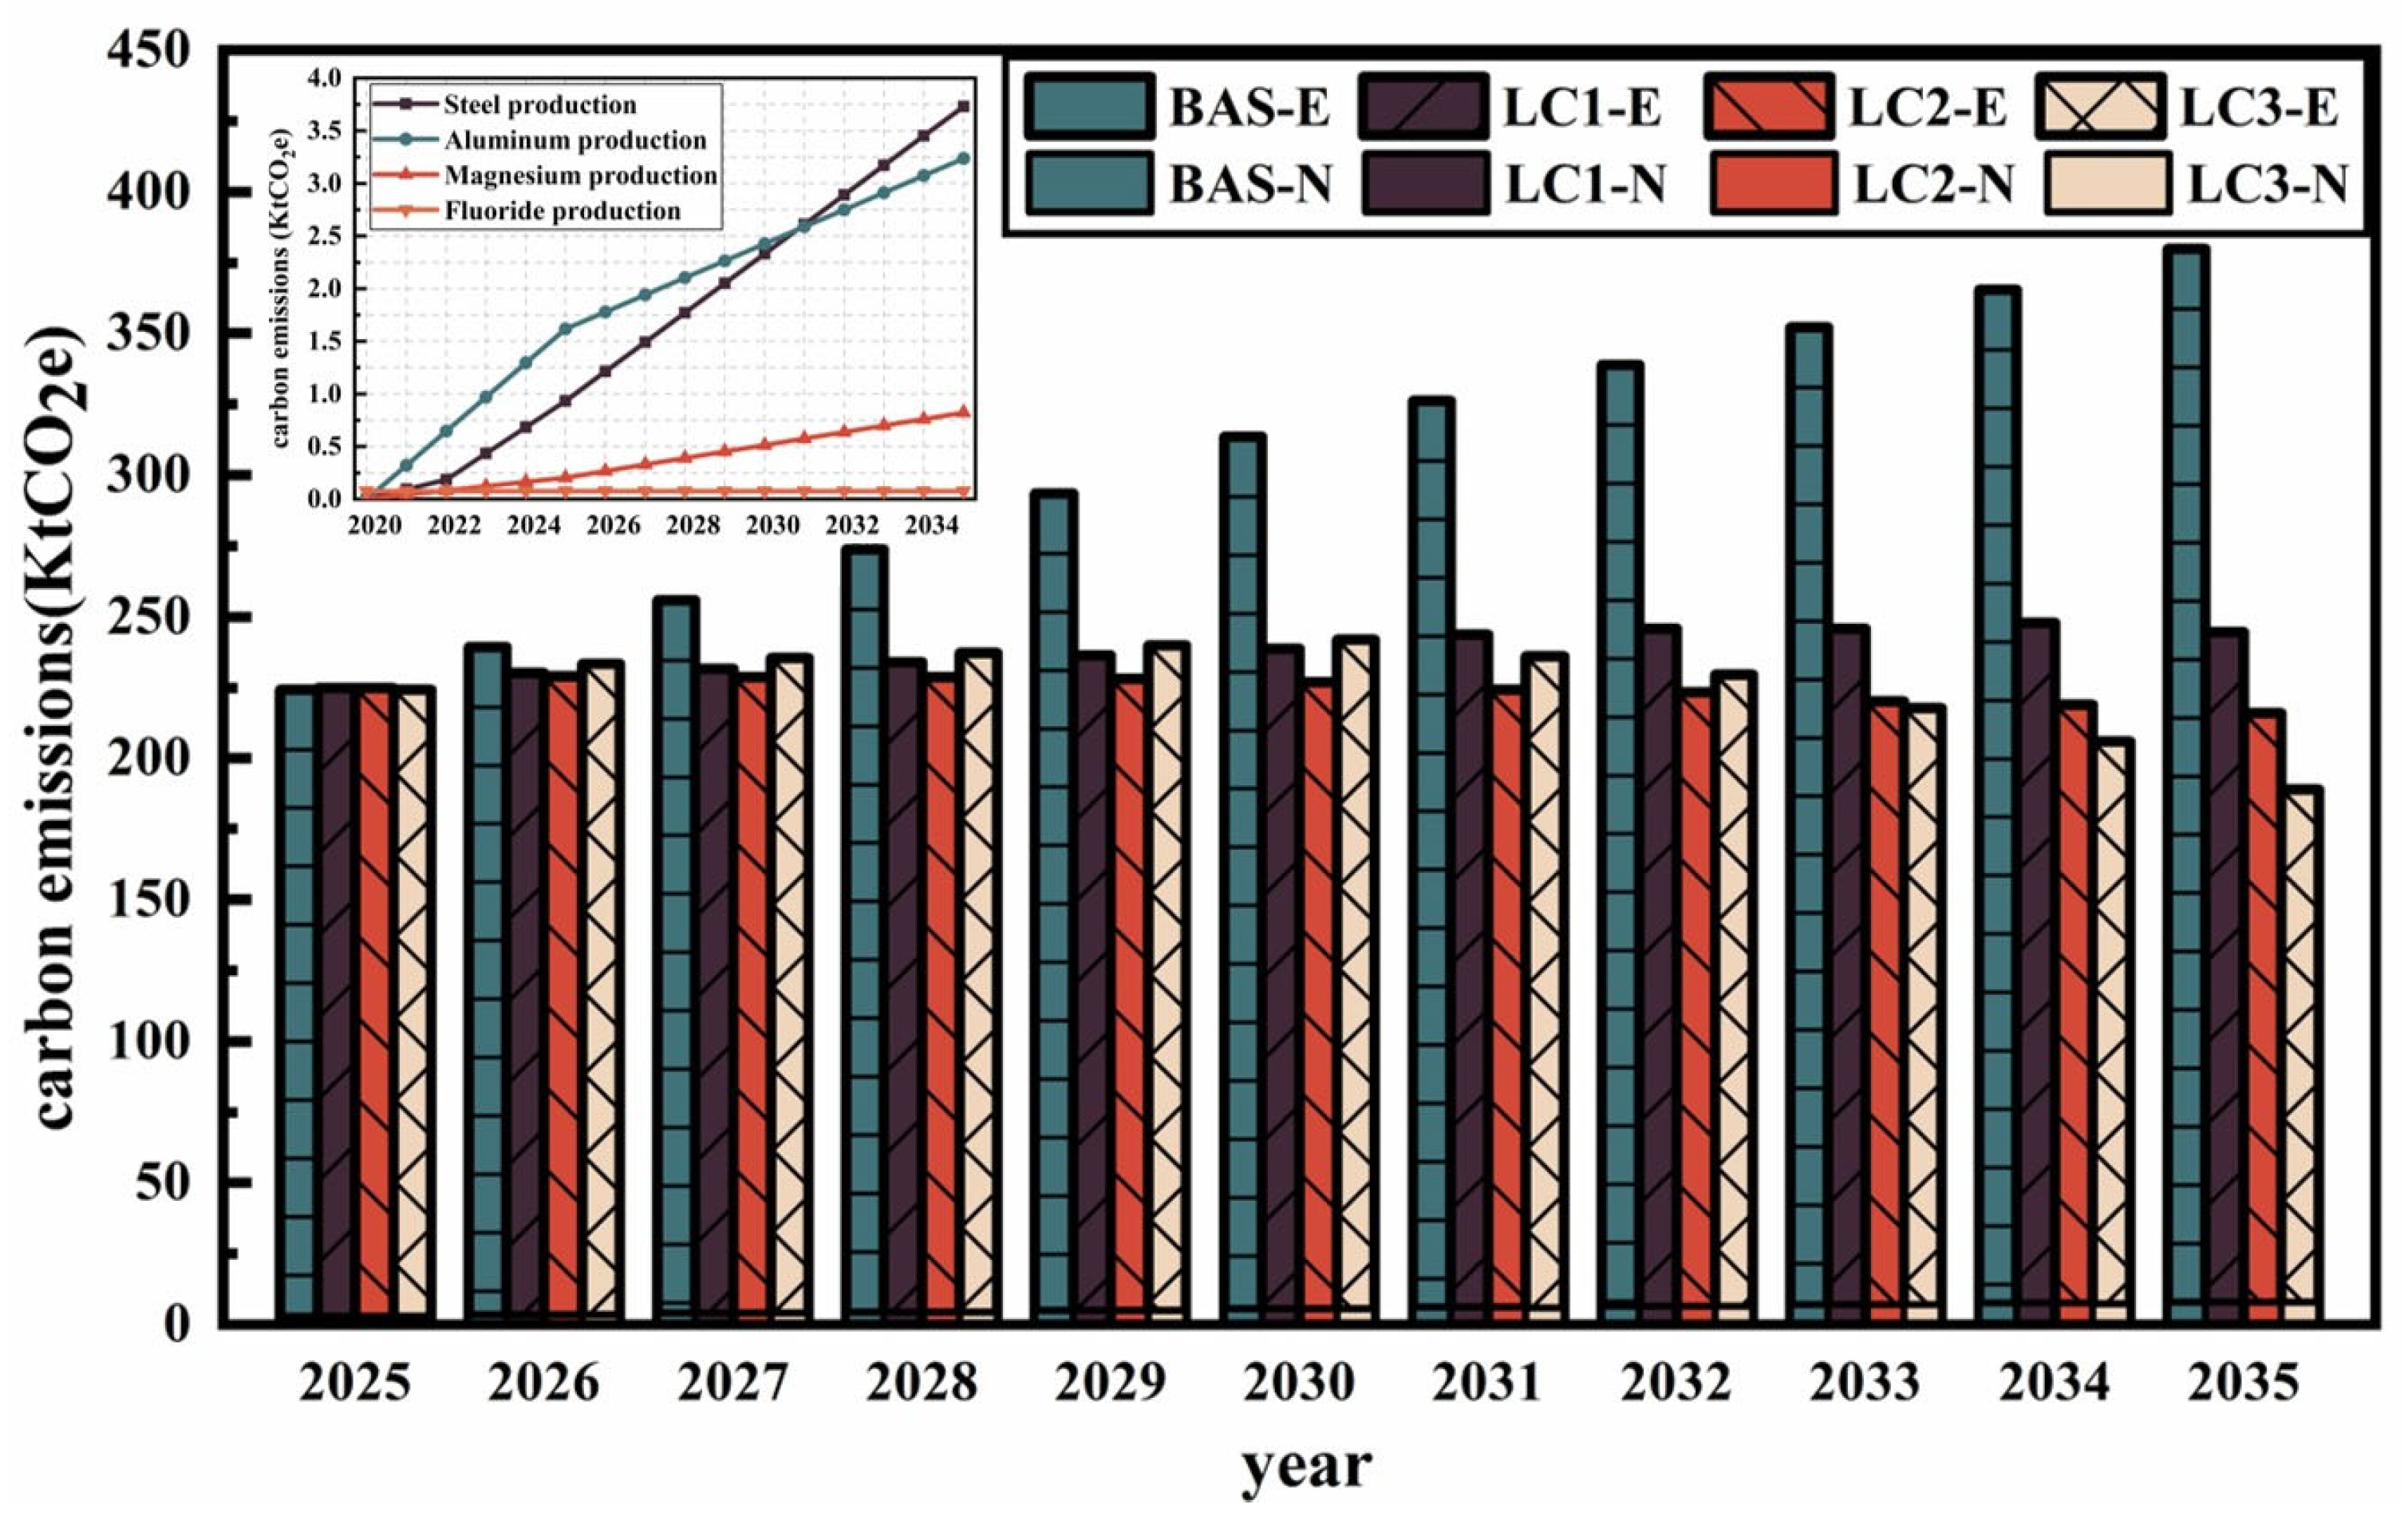
4.2. Carbon Emission Source Analysis

To further analyze the emission reduction potential of different scenarios, the sources of carbon dioxide emissions in the park are explored in detail. As shown in Figure 7, energy consumption emissions (E) greatly surpass non-energy consumption emissions (N) in all four scenarios, accounting for over 95% of the total emissions. Non-energy consumption emissions, depicted in the top-right thumbnail, primarily originate from steel production, aluminum production, magnesium production, and fluoride production. With the rapid development of industries such as iron and steel smelting, non-ferrous metals, and ferrous metals, non-energy consumption emissions show an upward trend, emphasizing the need to optimize the process flow of the steel industry as a key strategy for reducing emissions. From the perspective of energy consumption emissions, the BAS scenario exhibits significantly higher energy consumption than other scenarios, strongly indicating that the optimization of the industrial structure has a prominent effect on reducing carbon emissions. A more detailed analysis of carbon emissions from different industries is provided below.
As illustrated in Figure 8, carbon emissions from energy consumption originate from the chemical industry, steel industry, high-tech equipment manufacturing industry, pharmaceutical industry, and paper industry, with the largest proportion coming from the CH, ST, and HJ industries. In the BAS scenario, the steel industry accounts for the highest emissions, reaching 236.98 KtCO2e by 2035, representing 67.54% of the total energy emissions. Therefore, optimizing the steel industry becomes the focal point of the energy-saving pathway for the industrial park. In the other three scenarios, carbon emissions are significantly reduced compared to the BAS scenario due to a reduction in the steel industry’s growth rate, improvements in the industrial chain, and the introduction of emission reduction technology. Specifically, emissions from the steel industry are reduced by 51%, 52%, and 61% in the LC1, LC2, and LC3 scenarios, respectively.
Figure 9 displays the proportion of carbon emissions from coal, coke, natural gas, oil, LPG, diesel, gasoline, and purchased electricity consumption under different scenarios. Overall, coal emissions account for the largest proportion, reaching 88% in 2020. As the industrial park develops, the proportion of coal emissions gradually decreases, while the proportion of natural gas and purchased power emissions increases. Comparing the four scenarios, LC1 adjusts the economic growth rate and industrial structure of the park compared to the BAS scenario, resulting in reduced carbon emissions from coal. However, the proportion of emissions varies little compared to the BAS scenario, accounting for 57% of total energy emissions by 2035. In the LC2 and LC3 scenarios, due to improved terminal energy utilization efficiency and the adjustment of the industrial energy consumption structure, the proportion of coal emissions continues to decline to 51% and 44% by 2035, respectively. In summary, reducing carbon emissions from coal is crucial in formulating energy conservation and emission reduction strategies for the park, and the introduction of energy-saving technologies in the LC2 and LC3 scenarios is the key to achieving this objective.

4.3. Pathways for Low-Carbon Industrial Park Development

In accordance with the output results of the model, the carbon emission intensity steadily increases in the BAS scenario, contradicting the low-carbon development strategy of the park. The other three emission reduction scenarios demonstrate significant effects due to the optimization of the industrial chain and adjustment of the industrial structure. However, the LC1 scenario meets the development demand from 2025 to 2035 without adopting energy-saving technologies. As a consequence, carbon emissions progressively increase in the LC1 and LC2 scenarios with economic development, contradicting the concept of promoting regional economic development of the industrial park and proving unsuitable for the park. In contrast, the introduction of technology in the LC2 and LC3 scenarios results in a substantial reduction in coal emissions, enabling low-carbon development by incorporating technological means while safeguarding the park’s economy and realizing high-quality development of the green economy. Theoretically, the LC3 scenario represents the most suitable development pathway for the park thanks to the carbon capture devices. However, it requires the introduction of numerous emission reduction processes and low-carbon technologies. These two emission reduction scenarios should be selected and adjusted based on the actual economic development in the initial stage.

5. Conclusions

This paper constructed a hybrid analysis framework that integrates LMDI decomposition with the LEAP model. The framework is used to decompose the driving factors and calculate and predict the carbon emissions of the industrial park cluster under various low-carbon scenarios from 2020 to 2035. The study yields the following conclusions and suggestions for reduction pathways:
  • In accordance with the characteristics of the industrial park, the driving factors can be categorized as follows: energy intensity, energy structure, industrial structure, industrial economic development, and employment scale. Among these factors, industrial economic development accounts for 52%, indicating that the park has not achieved decoupling in the initial stage of development and remains highly dependent on the economy.
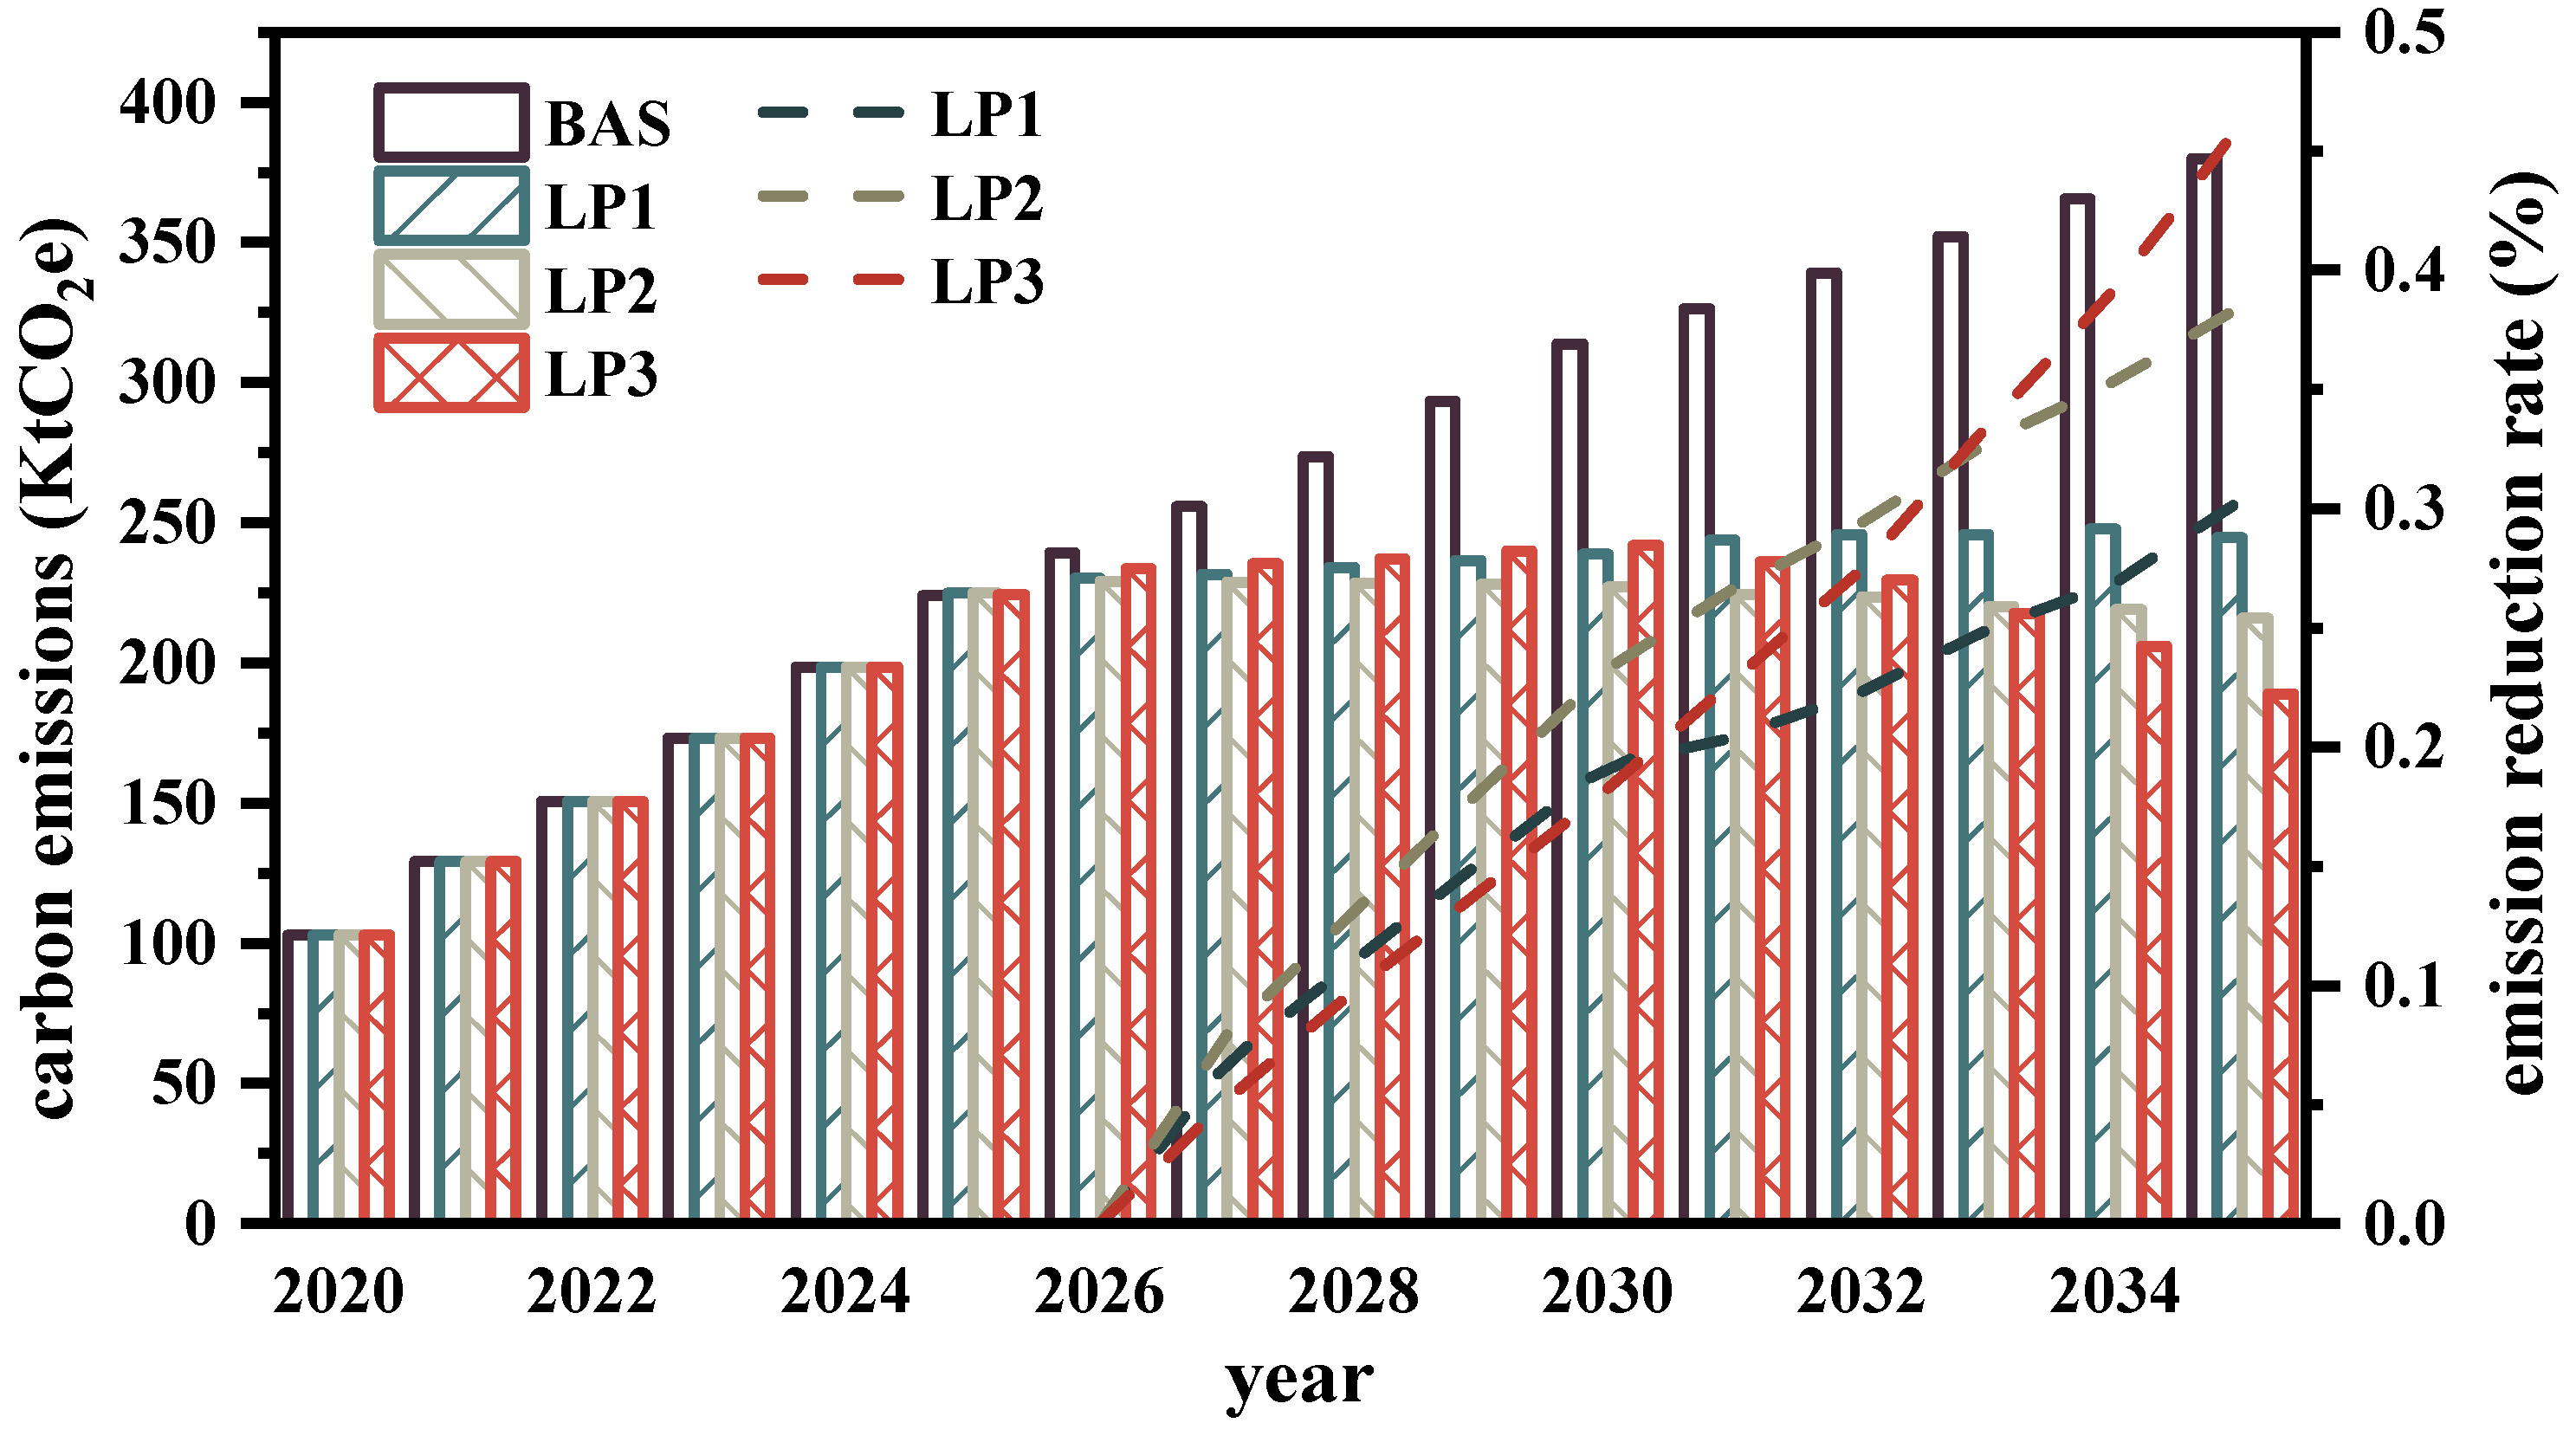
  • Under the BAS scenario, carbon emissions will reach 351.4 KtCO2e by 2035. However, the carbon emissions of the LC1, LC2, and LC3 scenarios decrease by 30.4%, 38.4%, and 46.2%, respectively, compared to the BAS scenario. Among these scenarios, the LC3 scenario emerges as the most suitable pathway for reducing emissions in the park.
  • Additionally, investment in emission reduction technology; an increased proportion of clean energy; measures aimed at reducing carbon emissions from coal, such as improving the efficiency of terminal energy devices; optimizing process flows; and introducing carbon capture devices, are crucial for controlling total emissions and achieving sustainable emission reduction in the park.
To sum up: the development of an emission reduction pathway for industrial park clusters is based on a comprehensive study of economic development and energy supply. In order to achieve low-carbon development of the park, on the one hand, the economic development and industrial development potential of the park should be taken into account to develop a green economy and optimize the industrial chain. On the other hand, we should consider the technical conditions and application costs, develop renewable energies, improve energy efficiency, and reduce coal emissions. Meanwhile, the efficient utilization of carbon capture technology and renewable energy is the key to achieving green and low-carbon development of industrial parks, as they greatly reduce energy consumption and carbon emissions, which is crucial in terms of both economic and environmental benefits.
This paper only puts forward the mixed analysis model of industrial park cluster carbon emission measurement and low-carbon pathway formulation. With the continuous development of the carbon trading market, the model needs to be further improved in the future. At the same time, the impact of carbon capture technology on the total cost is required to be explored in future studies. The model framework can also be employed for large-scale regional energy planning and carbon emission measurement. In addition, social development and technological input can be incorporated into the model to provide data support for the expansion and application of the model.

Author Contributions

Conceptualization, X.Y. and H.L.; Methodology, D.F., W.X., X.G., S.F. and H.L.; Software, W.X., X.G. and S.F.; Validation, D.F. and W.X.; Formal analysis, D.F. and W.X.; Investigation, D.F.; Resources, X.Y.; Data curation, W.X., Y.Y., S.F. and X.Y.; Writing—original draft, D.F. and W.X.; Writing—review & editing, D.F. and X.Y.; Visualization, Y.Y.; Supervision, X.Y. and H.L. All authors have read and agreed to the published version of the manuscript.

Funding

This work was supported by Research on hybrid optimization modeling and application of regional carbon emission estimation (China Energy Engineering Group Jiangsu Power Design Institute Co., Ltd., 32-JK-2022-009).

Data Availability Statement

No data were used in this study.

Conflicts of Interest

The authors declare no conflict of interest.

References

  1. Giama, E.; Kyriaki, E.; Papaevaggelou, A.; Papadopoulos, A. Energy and Environmental Analysis of Renewable Energy Systems Focused on Biomass Technologies for Residential Applications: The Life Cycle Energy Analysis Approach. Energies 2023, 16, 4433. [Google Scholar] [CrossRef]
  2. Gao, X.; Wei, P.; Yu, J.; Huang, X.; Yang, X.; Sundén, B. Design and assessments on graded metal foam in heat storage tank: An experimental and numerical study. Int. Commun. Heat Mass Transf. 2023, 146, 106902. [Google Scholar] [CrossRef]
  3. Li, Y.; Huang, X.; Huang, X.; Gao, X.; Hu, R.; Yang, X.; He, Y.L. Machine learning and multilayer perceptron enhanced CFD approach for improving design on latent heat storage tank. Appl. Energy 2023, 347, 121458. [Google Scholar] [CrossRef]
  4. Li, Y.; Niu, Z.; Gao, X.; Guo, J.; Yang, X.; He, Y.-L. Effect of filling height of metal foam on improving energy storage for a thermal storage tank. Appl. Therm. Energy 2023, 229, 120584. [Google Scholar] [CrossRef]
  5. Du, Z.; Liu, G.; Huang, X.; Xiao, T.; Yang, X.; He, Y.-L. Numerical studies on a fin-foam composite structure towards improving melting phase change. Int. J. Heat Mass Transf. 2023, 208, 124076. [Google Scholar] [CrossRef]
  6. Pedersen, J.T.S.; van Vuuren, D.; Gupta, J.; Santos, F.D.; Edmonds, J.; Swart, R. IPCC emission scenarios: How did critiques affect their quality and relevance 1990–2022? Glob. Environ. Change 2022, 75, 102538. [Google Scholar] [CrossRef]
  7. Gao, X.; Niu, Z.; Huang, X.; Yang, X.; Yan, J. Thermo-economic assessments on building heating by a thermal energy storage system with metal foam. Case Stud. Therm. Eng. 2023, 49, 103307. [Google Scholar] [CrossRef]
  8. Ekonomou, G.; Halkos, G. Exploring the Impact of Economic Growth on the Environment: An Overview of Trends and Developments. Energies 2023, 16, 4497. [Google Scholar] [CrossRef]
  9. Misrol, M.A.; Wan Alwi, S.R.; Lim, J.S.; Manan, Z.A. Optimising renewable energy at the eco-industrial park: A mathematical modelling approach. Energy 2022, 261, 125345. [Google Scholar] [CrossRef]
  10. Feng, J.-C.; Yan, J.; Yu, Z.; Zeng, X.; Xu, W. Case study of an industrial park toward zero carbon emission. Appl. Energy 2018, 209, 65–78. [Google Scholar] [CrossRef]
  11. Yu, X.; Zheng, H.; Sun, L.; Shan, Y. An emissions accounting framework for industrial parks in China. J. Clean. Prod. 2020, 244, 118712. [Google Scholar] [CrossRef]
  12. Geng, Y.; Zhao, H. Industrial park management in the Chinese environment. J. Clean. Prod. 2009, 17, 1289–1294. [Google Scholar] [CrossRef]
  13. Wang, N.; Guo, J.; Zhang, X.; Zhang, J.; Li, Z.; Meng, F.; Zhao, B.; Ren, X. The circular economy transformation in industrial parks: Theoretical reframing of the resource and environment matrix. Resour. Conserv. Recycl. 2021, 167, 105251. [Google Scholar] [CrossRef]
  14. Wang, S.; Lu, C.; Gao, Y.; Wang, K.; Zhang, R. Life cycle assessment of reduction of environmental impacts via industrial symbiosis in an energy-intensive industrial park in China. J. Clean. Prod. 2019, 241, 118358. [Google Scholar] [CrossRef]
  15. Zhu, D.; Yang, B.; Liu, Y.; Wang, Z.; Ma, K.; Guan, X. Energy management based on multi-agent deep reinforcement learning for a multi-energy industrial park. Appl. Energy 2022, 311, 118636. [Google Scholar] [CrossRef]
  16. Li, F.; Huang, X.; Li, Y.; Lu, L.; Meng, X.; Yang, X.; Sundén, B. Application and analysis of flip mechanism in the melting process of a triplex-tube latent heat energy storage unit. Energy Rep. 2023, 9, 3989–4004. [Google Scholar] [CrossRef]
  17. Liu, G.; Xiao, T.; Wei, P.; Meng, X.; Yang, X.; Yan, J.; He, Y. Experimental and numerical studies on melting/solidification of PCM in a horizontal tank filled with graded metal foam. Sol. Energy Mater. Sol. Cells 2023, 250, 112092. [Google Scholar] [CrossRef]
  18. Shu, G.; Xiao, T.; Guo, J.; Wei, P.; Yang, X.; He, Y.-L. Effect of charging/discharging temperatures upon melting and solidification of PCM-metal foam composite in a heat storage tube. Int. J. Heat Mass Transf. 2023, 201, 123555. [Google Scholar] [CrossRef]
  19. Chen, X.; Dong, M.; Zhang, L.; Luan, X.; Cui, X.; Cui, Z. Comprehensive evaluation of environmental and economic benefits of industrial symbiosis in industrial parks. J. Clean. Prod. 2022, 354, 131635. [Google Scholar] [CrossRef]
  20. Wei, X.; Qiu, R.; Liang, Y.; Liao, Q.; Klemeš, J.J.; Xue, J.; Zhang, H. Roadmap to carbon emissions neutral industrial parks: Energy, economic and environmental analysis. Energy 2022, 238, 121732. [Google Scholar] [CrossRef]
  21. Cai, L.; Luo, J.; Wang, M.; Guo, J.; Duan, J.; Li, J.; Li, S.; Liu, L.; Ren, D. Pathways for municipalities to achieve carbon emission peak and carbon neutrality: A study based on the LEAP model. Energy 2023, 262, 125435. [Google Scholar] [CrossRef]
  22. Fan, W.; Zhang, J.; Zhou, J.; Li, C.; Hu, J.; Hu, F.; Nie, Z. LCA and Scenario Analysis of Building Carbon Emission Reduction: The Influencing Factors of the Carbon Emission of a Photovoltaic Curtain Wall. Energies 2023, 16, 4501. [Google Scholar] [CrossRef]
  23. Kolahchian Tabrizi, M.; Famiglietti, J.; Bonalumi, D.; Campanari, S. The Carbon Footprint of Hydrogen Produced with State-of-the-Art Photovoltaic Electricity Using Life-Cycle Assessment Methodology. Energies 2023, 16, 5190. [Google Scholar] [CrossRef]
  24. Liao, X.; Qian, B.; Jiang, Z.; Fu, B.; He, H. Integrated Energy Station Optimal Dispatching Using a Novel Many-Objective Optimization Algorithm Based on Multiple Update Strategies. Energies 2023, 16, 5216. [Google Scholar] [CrossRef]
  25. Xu, C.; Zhang, Y.; Yang, Y.; Gao, H. Carbon Peak Scenario Simulation of Manufacturing Carbon Emissions in Northeast China: Perspective of Structure Optimization. Energies 2023, 16, 5527. [Google Scholar] [CrossRef]
  26. Cai, Y.; Woollacott, J.; Beach, R.H.; Rafelski, L.E.; Ramig, C.; Shelby, M. Insights from adding transportation sector detail into an economy-wide model: The case of the ADAGE CGE model. Energy Econ. 2023, 123, 106710. [Google Scholar] [CrossRef] [PubMed]
  27. O’Ryan, R.; Nasirov, S.; Osorio, H. Assessment of the potential impacts of a carbon tax in Chile using dynamic CGE model. J. Clean. Prod. 2023, 403, 136694. [Google Scholar] [CrossRef]
  28. Wei, L.; Feng, X.; Liu, P.; Wang, N. Impact of intelligence on the carbon emissions of energy consumption in the mining industry based on the expanded STIRPAT model. Ore Geol. Rev. 2023, 159, 105504. [Google Scholar] [CrossRef]
  29. Xing, L.; Khan, Y.A.; Arshed, N.; Iqbal, M. Investigating the impact of economic growth on environment degradation in developing economies through STIRPAT model approach. Renew. Sustain. Energy Rev. 2023, 182, 113365. [Google Scholar] [CrossRef]
  30. Wang, J.; Dong, K.; Hochman, G.; Timilsina, G.R. Factors driving aggregate service sector energy intensities in Asia and Eastern Europe: A LMDI analysis. Energy Policy 2023, 172, 113315. [Google Scholar] [CrossRef]
  31. Xin, M.; Guo, H.; Li, S.; Chen, L. Can China achieve ecological sustainability? An LMDI analysis of ecological footprint and economic development decoupling. Ecol. Indic. 2023, 151, 110313. [Google Scholar] [CrossRef]
  32. Ratomski, P.; Hawrot-Paw, M.; Koniuszy, A.; Golimowski, W.; Kwaśnica, A.; Marcinkowski, D. Indicators of Engine Performance Powered by a Biofuel Blend Produced from Microalgal Biomass: A Step towards the Decarbonization of Transport. Energies 2023, 16, 5376. [Google Scholar] [CrossRef]
  33. Usman, A.; Ozturk, I.; Naqvi, S.M.M.A.; Ullah, S.; Javed, M.I. Revealing the nexus between nuclear energy and ecological footprint in STIRPAT model of advanced economies: Fresh evidence from novel CS-ARDL model. Prog. Nucl. Energy 2022, 148, 104220. [Google Scholar] [CrossRef]
  34. Huang, Y.; Wang, Y.; Peng, J.; Li, F.; Zhu, L.; Zhao, H.; Shi, R. Can China achieve its 2030 and 2060 CO2 commitments? Scenario analysis based on the integration of LEAP model with LMDI decomposition. Sci. Total Environ. 2023, 888, 164151. [Google Scholar] [CrossRef] [PubMed]
  35. Luo, X.; Liu, C.; Zhao, H. Driving factors and emission reduction scenarios analysis of CO2 emissions in Guangdong-Hong Kong-Macao Greater Bay Area and surrounding cities based on LMDI and system dynamics. Sci. Total Environ. 2023, 870, 161966. [Google Scholar] [CrossRef] [PubMed]
  36. You, K.; Yu, Y.; Li, Y.; Cai, W.; Shi, Q. Spatiotemporal decomposition analysis of carbon emissions on Chinese residential central heating. Energy Build. 2021, 253, 111485. [Google Scholar] [CrossRef]
  37. Yang, D.; Liu, D.; Huang, A.; Lin, J.; Xu, L. Critical transformation pathways and socio-environmental benefits of energy substitution using a LEAP scenario modeling. Renew. Sustain. Energy Rev. 2021, 135, 110116. [Google Scholar] [CrossRef]
  38. Tsai, M.-S.; Chang, S.-L. Taiwan’s 2050 low carbon development roadmap: An evaluation with the MARKAL model. Renew. Sustain. Energy Rev. 2015, 49, 178–191. [Google Scholar] [CrossRef]
  39. Emodi, N.V.; Emodi, C.C.; Murthy, G.P.; Emodi, A.S.A. Energy policy for low carbon development in Nigeria: A LEAP model application. Renew. Sustain. Energy Rev. 2017, 68, 247–261. [Google Scholar] [CrossRef]
  40. Amo-Aidoo, A.; Kumi, E.N.; Hensel, O.; Korese, J.K.; Sturm, B. Solar energy policy implementation in Ghana: A LEAP model analysis. Sci. Afr. 2022, 16, e01162. [Google Scholar] [CrossRef]
  41. Zhang, C.; Luo, H. Research on carbon emission peak prediction and path of China’s public buildings: Scenario analysis based on LEAP model. Energy Build. 2023, 289, 113053. [Google Scholar] [CrossRef]
  42. Shin, H.-C.; Park, J.-W.; Kim, H.-S.; Shin, E.-S. Environmental and economic assessment of landfill gas electricity generation in Korea using LEAP model. Energy Policy 2005, 33, 1261–1270. [Google Scholar] [CrossRef]
  43. Zou, X.; Wang, R.; Hu, G.; Rong, Z.; Li, J. CO2 Emissions Forecast and Emissions Peak Analysis in Shanxi Province, China: An Application of the LEAP Model. Sustainability 2022, 14, 637. [Google Scholar] [CrossRef]
  44. Duan, H.; Hou, C.; Yang, W.; Song, J. Towards lower CO2 emissions in iron and steel production: Life cycle energy demand-LEAP based multi-stage and multi-technique simulation. Sustain. Prod. Consum. 2022, 32, 270–281. [Google Scholar] [CrossRef]
  45. Feng, Y.; Zhang, L. Scenario analysis of urban energy saving and carbon abatement policies: A case study of Beijing city, China. Procedia Environ. Sci. 2012, 13, 632–644. [Google Scholar] [CrossRef]
  46. Kaya, Y. Impact of Carbon Dioxide Emission Control on GNP Growth: Interpretation of Proposed Scenarios; Intergovernmental Panel on Climate Change/Response Strategies Working Group: Geneva, Switzerland, 1989. [Google Scholar]
  47. Tapio, P. Towards a theory of decoupling: Degrees of decoupling in the EU and the case of road traffic in Finland between 1970 and 2001. Transp. Policy 2005, 12, 137–151. [Google Scholar] [CrossRef]
  48. Hou, Z.; Luo, J.; Xie, Y.; Wu, L.; Huang, L.; Xiong, Y. Carbon Circular Utilization and Partially Geological Sequestration: Potentialities, Challenges, and Trends. Energies 2023, 16, 324. [Google Scholar] [CrossRef]
  49. Huang, L.; Hou, Z.; Fang, Y.; Liu, J.; Shi, T. Evolution of CCUS Technologies Using LDA Topic Model and Derwent Patent Data. Energies 2023, 16, 2556. [Google Scholar] [CrossRef]
  50. Sitinjak, C.; Ebennezer, S.; Ober, J. Exploring Public Attitudes and Acceptance of CCUS Technologies in JABODETABEK: A Cross-Sectional Study. Energies 2023, 16, 4026. [Google Scholar] [CrossRef]
  51. Wetzel, M.; Otto, C.; Chen, M.; Masum, S.; Thomas, H.; Urych, T.; Kempka, T. Hydromechanical Impacts of CO2 Storage in Coal Seams of the Upper Silesian Coal Basin (Poland). Energies 2023, 16, 3279. [Google Scholar] [CrossRef]
  52. Xie, Y.; Qi, J.; Zhang, R.; Jiao, X.; Shirkey, G.; Ren, S. Toward a Carbon-Neutral State: A Carbon–Energy–Water Nexus Perspective of China’s Coal Power Industry. Energies 2022, 15, 4466. [Google Scholar] [CrossRef]
Figure 1. Analysis framework of the research.
Energies 16 07356 g001
Figure 2. Carbon emissions during the period of 2020–2022: (a) Driving factor (b) Industry effect.
Energies 16 07356 g002
Figure 3. Scenario setting, selection, and details.
Energies 16 07356 g003
Figure 4. Decoupling categories for different scenarios.
Energies 16 07356 g004
Figure 5. Total carbon emissions of the industrial park under different scenarios.
Energies 16 07356 g005
Figure 6. Carbon emissions per unit gross product under different scenarios.
Energies 16 07356 g006
Figure 7. Carbon emissions of energy and non-energy sections under different scenarios.
Energies 16 07356 g007
Figure 8. Carbon emissions from various industries under different scenarios.
Energies 16 07356 g008
Figure 9. Carbon emissions from different fuel types under different scenarios.
Energies 16 07356 g009
Table 1. CO2 emission factors of different fuel types.
FuelCO2 Emission Factor
Coal bituminous2.78 kgCO2/kg
Coal sub bituminous3.09 kgCO2/kg
Petroleum coke3.45 kgCO2/kg
Crude oil3.32 kgCO2/L
Gasoline3.04 kgCO2/L
Diesel3.41 kgCO2/L
LPG3.41 kgCO2/L
Natural gas2.38 kgCO2/m3
Table 2. Tapio decoupling index summary of decoupling types.
CategoryCIGDecoupling Index
Expansion negative decoupling (EN)>0>0 ε   >   1.2
Strong negative decoupling (SN)>0<0 ε   <   0
Weak negative decoupling (WN)<0<0 0   <   ε   <   0.8
Recessionary decoupling (R)<0<0 ε   >   1.2
Strong decoupling (S)<0>0 ε   <   0
Weak decoupling (W)>0>0 0   <   ε   <   0.8
Growth linkage (GL)>0>0 0.8   <   ε   <   1.2
Disclaimer/Publisher’s Note: The statements, opinions and data contained in all publications are solely those of the individual author(s) and contributor(s) and not of MDPI and/or the editor(s). MDPI and/or the editor(s) disclaim responsibility for any injury to people or property resulting from any ideas, methods, instructions or products referred to in the content.

