Article

Optical Interactions in Bio-Electricity Generation from Photosynthesis in Microfluidic Micro-Photosynthetic Power Cells

by
Kirankumar Kuruvinashetti
1,
Hemanth Kumar Tanneru
2,
Shanmugasundaram Pakkiriswami
3 and
Muthukumaran Packirisamy
1,*
1
Optical-Bio Microsystems Laboratory, Department of Mechanical, Industrial and Aerospace Engineering, Concordia University, Montreal, QC H3G 1M8, Canada
2
Department of Chemical Engineering, Indian Institute of Petroleum and Energy-Visakhapatnam, #316 B, 2nd Floor AUCE Main Building, Vizag 530003, Andhra Pradesh, India
3
Department of Biochemistry and Molecular Biology, Dalhousie Medicine New Brunswick (DMNB), Dalhousie University, Saint John, NB E2L4L5, Canada
*
Author to whom correspondence should be addressed.
Energies 2023, 16(21), 7353; https://doi.org/10.3390/en16217353
Submission received: 30 September 2023 / Revised: 24 October 2023 / Accepted: 27 October 2023 / Published: 31 October 2023
(This article belongs to the Collection Renewable and Sustainable Energy)

Abstract

:
Within the realm of renewable energy sources, biological-based power systems have emerged as pivotal players particularly suited for low- and ultra-low-power applications. Unlike microbial fuel cells (MFCs), which invariably rely on external carbon feedstock, micro-photosynthetic cells (µPSCs) exhibit a unique feature by operating independently of organic fuel. They harness the principles of photosynthesis and respiration to generate electricity in both illuminated and dark settings through water-splitting reactions. Here, we present a viable, easy, and cost-effective method to fabricate µPSCs. We meticulously examined the performance of a fabricated µPSC under varying illuminations and even in the absence of light. With an electrode surface area spanning 4.84 cm2, the µPSC achieved its peak power output of 200.6 µW when exposed to an illumination of 2 µmolm−2s−1 (equivalent to 147 lux). Of the three light intensities studied, 2 µmolm−2s−1, 8 µmolm−2s−1 (595 lux), and 20 µmolm−2s−1 (1500 lux), the µPSC exhibited its optimal performance at a light intensity of 2 µmolm−2s−1, establishing this as the ideal operational illumination. Furthermore, intermittent toggling of the illumination had no discernible impact on the µPSC’s performance. However, subjecting it to a dark environment for 30 min resulted in a reduction in the maximum power to 81 µW, marking a significant 119% decrease when compared to the peak power output achieved under 2 µmolm−2s−1 illumination.

1. Introduction

Plants utilize about 0.25% of the energy of the sunlight that falls on their surface [1]. Most of the sunlight is either wasted as heat energy or reflected into the environment [2]. Regardless of having only a 0.25% utilization factor, photosynthetic cells and organisms likely convert more than 10 times as much energy per year as the current world energy consumption [1]. Thus, to exploit the advantages of biological and synthetic approaches, technology could be realized that makes use of the high energy conversion efficiency of artificial systems while keeping the merits of biological systems [1].
In this regard, µPSCs, also known as bio-photovoltaics, help to generate electricity to power the low- and ultra-low-power applications by exploiting living photosynthetic cells and microorganisms [1,3,4,5,6,7]. The main advantage of the µPSCs is that they consist of living photosynthetic cells and microorganisms that have the ability to continuously self-repair, unlike other electrochemical systems [8]. Moreover, unlike photovoltaics, which functions only in light condition, µPSCs functions both in light by oxygenic photosynthesis and in the dark conditions by the respiration principle [9].
In this context, several studies have investigated the electricity generation from algal cells and cyanobacteria [1,4,9,10,11,12]. T. Yagishita et al. performed tests with various microorganisms in various µPSCs where 2-hydroxy-1,4-naphthoquinone (HNQ) was used as the electron mediator [13]. An open-circuit voltage (Voc) of 800 mV and a current density of 320 μA/cm2 have been reported. Here, the energy conversion efficiencies were reported to vary from 0.2% to 3.3% when µPSCs were tested in dark and light cycles, respectively [13]. Yagishita et al. studied the influence of the concentration of the microorganism, light intensity, and glucose addition on the performance of µPSCs [13,14]. In one of the recent works, M. Chiao et al. used bulk silicon micromachining technology for fabricating the components of the µPSCs [15]. Shahparnia et al., in the presence of light illumination of lux- 652, with a microfabricated active surface area of 4.84 cm2, reported an open-circuit voltage (Voc) of 0.85 V and a short-circuit current (Isc) of 0.8 mA [11].
Even though several studies exist on single-µPSC performance [4,8,10,11,16,17,18,19], the fabrication methods are still tedious and involve complex photolithography processes. Moreover, the operating parameters for the optimal performance of µPSCs are still under investigation. Considering all these gaps, the goal of this study was to design a simple, economically inexpensive, and high-power-density µPSC such that it could be easily scaled up by arraying configurations for all kinds of low- and ultra-low-power applications. Furthermore, the fabricated µPSC was investigated under various light and dark conditions for electrical performance such as Voc, Isc, real-time different electrical loading conditions, current–voltage (I-V), and current–power (I-P) characteristics.
The µPSC comprises anode and cathode chambers. The membrane electrode assembly (MEA) consists of Nafion sandwiched between the anode and cathode chambers. The anode chamber comprises photosynthetic microorganisms that expel electrons under both photosynthesis and respiration processes through water-splitting reactions. The electrons are released by the photosynthetic microorganisms through oxidation and reduction reactions in the anode chamber. The released electrons traverse an external resistance that drives the generation of electricity. The proton-exchange membrane, which is sandwiched between the anode and cathode chambers, blocks the electrons. The PEM only allows the protons to pass through it to the cathode chamber. The electrons traverse the electrode terminals and reach the cathode chamber. The protons travel through the proton-exchange membrane from the anode to the cathode chamber and react with oxygen and electrons to form the byproduct water. Figure 1 illustrates the schematics of the operation of the µPSC. The chemical reaction of photosynthesis and respiration are provided below.
Photosynthesis
6 C O 2 + 6 H 2 O ( L i g h t ) C 6 H 12 O 6 + 6 O 2
Respiration
C 6 H 12 O 6 + 6 O 2 6 C O 2 + 6 H 2 O

2. Materials and Methods

2.1. Fabrication of the µPSC

The µPSC (micro-photosynthetic cell) device is an intricate assembly composed of two identical half-cells, each of which serves as the anode and cathode. These half-cells are separated by a proton-exchange membrane (PEM), for which we employed commercially available Nafion 117, obtained from Fuel Cell Store Inc., Bryan, Texas, USA. To ensure optimal performance, we adhered to a well-established protocol for pretreating the Nafion 117 membrane. The anode and cathode components of our µPSC were constructed using aluminum honeycomb-structured foils, which had a thickness of 0.027 mm and were procured from Dexmet Corporation. The dimensions of these foils, measuring 2.4 × 2.4 cm2, were tailored to the specific requirements of our µPSC design. To enhance electrical conductivity, both surfaces of the aluminum foil were coated with a 40 nm layer of gold using a sputter coater manufactured by Quoram Inc. The adhesive strength of the gold coating on the aluminum sheets was meticulously tested through a simple scrap test.
Following the pretreatment of the Nafion 117 membrane, it was incubated at room temperature for a period of 12–14 h to eliminate any residual moisture content. Subsequently, the gold-sputtered aluminum foil electrodes were affixed to the Nafion membrane using a water-resistant adhesive. To ensure a robust bond between the metal electrodes and the Nafion membrane, an approximate force of 10 kN was applied for approximately one hour.
To complete the assembly, terminal electrodes of dimensions 0.5 × 3 cm were affixed to both sides of the membrane electrode assembly, facilitating external connections to a resistor within the circuit. The anode and cathode chambers were fabricated using polymer polydimethylsiloxane (PDMS). A mixture of PDMS and a curing agent in a ratio of 10:1 was thoroughly mixed and degassed for 10 min to eliminate any bubbles within the PDMS solution. A custom-made brass mold was employed to cast the anode and cathode chambers, and the PDMS solution was poured into the mold. Subsequently, the mold was incubated at 60 °C for a duration of four hours. For the final integration of the membrane electrode assembly with the anode and cathode chambers, the 10:1 PDMS mixture was utilized. The PDMS solution was gently applied to the sides of the membrane electrode assembly, and it was then sandwiched between the anode and cathode chambers by applying a force of 1.3 kN. The entire assembly was placed in an oven at 60 °C for a further four hours.
Lastly, the cathode chamber was sealed with a microscopic cover glass using hot glue, which served to contain the catholyte. A comprehensive illustration of the components, assembly, dimensions, and testing procedures of the µPSC is provided in Figure 2 for reference. Figure 2a illustrates the assembly and different layers of the µPSC. Figure 2b illustrates the membrane electrode assembly, where the proton-exchange membrane is sandwiched between two electrodes, namely the anode and cathode electrodes, for collecting the electrons that were generated during the photosynthesis and respiration of photosynthetic microorganisms. Figure 2c shows the photographic view and also the dimensional view of the assembled µPSC. Figure 2d shows the photographic view of the assembled µPSC with a clear picture of the electrode structure. Figure 2e demonstrates the schematics of the test setup showcasing how the electricity was measued from the µPSC setup. Figure 2f shows the photographic view of the test setup.
The majority of µPSCs, also known as bio-photovoltaics, as documented in the existing literature, have been manufactured using lithography-based techniques, employing gold for the anode electrode. Notably, these conventional fabrication methods necessitate the use of a clean room environment to create such devices. In contrast, the approach outlined in this manuscript deploys thin sheets with an ultra-thin layer of sputtered gold. Notably, this fabrication process eliminates the necessity for a clean room facility and is accessible even to individuals without extensive expertise in the field. This inherent simplicity and flexibility in the fabrication process render it a cost-effective and feasible method for producing µPSCs. For a more detailed analysis of the cost comparison, authors are encouraged to refer to reference [6] to gain a deeper understanding of the intricacies involved.

2.2. Test Conditions

The µPSC components were assembled (Figure 2), and the necessary reactants/solutions were prepared. A 25% (w/v) potassium ferricyanide (K3[Fe (CN)6]) solution was prepared and used as the catholyte. The particular concentration was chosen based on our previous tests in which the µPSC generated maximum power [11]. A volume of 2 mL of the prepared catholyte was pumped into the cathode chamber with a syringe. The anode chamber was then filled with 2 mL of the anolyte solution (algal solution) containing the green algae (Chlamydomonas reinhardtii), the growth medium, and other reactants. Once the setup was ready, different experiments were performed to observe µPSC performance. All the test conditions were performed at room temperature of 23 °C.

2.3. Terminal Connections and Alligator Clips

Brass electrodes purchased from Dexmet Inc. (Dexmet Corporations, Wellingford, CT, USA) and alligator clips purchased from Digikey Inc. served for the connections of the circuits.

2.4. Illumination

Artificial light was provided by a white fluorescent bulb of 40 watts (Philips) with the wavelength range of 400–700 nm maintained at constant illumination in the µPSC location. Light levels were manually controlled, such that different light intensities fell on the surface of the µPSC. The light intensities were measured with a lux meter and further converted to µmolm−2s−1 [20].

2.5. Dark Condition

All the light sources in the rooms were switched off. A thick cardboard box was placed on the top of the µPSC to create complete darkness.

2.6. µPSC Measurement, Illumination, DAQ, and Current Measuring Unit Multimeters

The terminal voltage of the µPSC was measured using the DAQ [21]. The custom-designed DAQ had a current-sensing circuit specifically designed to measure the micro-level current of the µPSC [21]. The circuit was calibrated with a commercially available DC power supply and low-power-rating solar panels for lower currents and voltages [21]. For the details of the design of the current-sensing unit, the authors recommend reference [21]. An external variable resistor was connected to the terminals for the loading conditions.

2.7. µPSC Power

The power of the µPSC was obtained by multiplying the µPSC output current and voltage at the terminals of the µPSC.
Power = V × I

2.8. Polarization Characteristics

Polarization characteristics were obtained by recording the terminal voltage under pseudo-state conditions [8] while adjusting the variable resistor. The variable resistor was tuned to change the load current from maximum to minimum, and the corresponding terminal voltages were recorded. Load resistance was varied from 0 to 50 kΩ. Each load current and terminal voltage recording was performed after stabilization, which took less than 30 s. The terminal voltage of the µPSC was plotted as a function of the µPSC current. (Here, density measurement was not carried out; it was 4.84 cm2 for all the data.) For all the measurements, alligator clamps and single-strand connecting wires served as connections to the anode and cathode terminals.

3. Results and Discussion

3.1. Performance of µPSC under Light Illumination

3.1.1. Open-Circuit Voltage (Voc)

Voc is the voltage of the µPSC at zero current. It defines the potential of the electrochemical cell. It is the theoretical maximum voltage that could be generated by any typical power-generating device. In the repetitive experiments, it was found that µPSCs Voc varied between 0.6 and 1 V, which highly depended on the quality of the fabrication [10]. µPSCs that are assembled poorly, or with poorly fabricated components, generate low or nearly zero voltage [10]. The Voc was observed for 18 to 20 h, and it was found that the µPSC generated stable Voc until the anode chamber had enough anolyte (in the current study, 2 mL). The Voc decreased as the anolyte decreased gradually by evaporation. Figure 3 shows the Voc of the µPSC. The µPSC under the said operating conditions demonstrated a Voc of 810 mV. The Voc was measured for 30 min, and not much variation in the Voc was observed during the investigation.
It has been observed that the concentration of potassium ferricyanide directly contributes to the output voltage of the µPSC [11]. The Voc increases with an increase in the concentration of potassium ferricyanide. However, above 25% potassium ferricyanide concentration, the Voc becomes saturated [11]. Therefore, the same concentration was maintained throughout the tests.

3.1.2. Short-Circuit Current (Isc)

Isc is the current generated due to the flow of electrons through the external resistor traversing the anode and cathode electrodes. It is the maximum current that could be drawn from any typical power-generating device. In order to record the Isc of the µPSC, the current-sensing unit was set to zero resistance. Figure 3 shows the Isc of the µPSC. In our repetitive experiments, it was found that the Isc varied, which entirely depended on several factors such as fabrication of the chip, bonding of the anode and cathode chambers, quantum yield (quality) of the algal cells, etc. In our observation, with the aforementioned dimensions and current operating conditions, an Isc of 800 µA or above was found to yield the optimal performance of the µPSC.
The µPSC generated Isc continuously until it had sufficient anolyte and catholyte. It was obligatory to have 2 mL anolyte and 2 mL potassium ferricyanide catholyte (maximum capacity of the anode and cathode chambers) to obtain higher performance from the µPSC. In our previous study, the optimal performance of the µPSC was observed with 25% potassium ferricyanide, and above that concentration, the performance was saturated [22]. Thus, 25% of potassium ferricyanide was utilized in the experiment based on our previous understanding.

3.2. Electrical Loading

In order to observe the performance of the µPSC under real-time electrical loading conditions, several electrical loading values such as 0.1, 0.5, 1, 2, 5, 10, 20, and 50 kΩ were tested with the µPSC. The respective electrical loads were connected to the terminals of the µPSC, and their corresponding load voltage (VL) and load currents (IL) were recorded. A current-sensing unit specifically designed to record low currents and voltages was utilized for recording the results.

Load Voltage and Load Current

Figure 4a shows the schematics of VL and IL measurements from the µPSC. Figure 4b demonstrates the VL of the µPSC under the electrical loadings. The µPSC generated a VL of 103 mV at a load of 0.1 kΩ, and at 50 kΩ, it produced a VL of 795 mV. At 1 kΩ, the µPSC generated a load voltage of 465 mV. It was observed that at a load voltage from 5 kΩ to 50 kΩ, the voltage variation was insignificant. However, the variation was noticeable.
Figure 4c demonstrates the IL variation with the electrical loadings. Under the lower load of 0.1 kΩ, the µPSC generated a current of 848 µA, and under a load of 50 kΩ, the µPSC generated a current of 17 µA. This seemed to be almost a high-resistance load. At 1 kΩ, the µPSC generated a current of 450 µA.
From the real-time electrical loading condition, it was observed that both VL and IL were significantly varied until 5 kΩ. After that, from 5 kΩ to 50 kΩ, there was not much variation.

3.3. Voltage–Current (V–I) Characteristics at 147 Lux

The voltage–current (V–I) characteristics are essential for understanding the behavior of a power-generating device. This data could serve for designing suitable and efficient power converters for power-generating devices.
To characterize the I–V (current–voltage) relationship of the µPSC, we employed a rheostat resistive load, which could be adjusted in the range of 0–50 kΩ. Initially, the resistive load was set to a low value to approach the short-circuit current (Isc). Subsequently, we gradually reduced the current by adjusting the resistance of the rheostat until a stable current was achieved. At this point, we recorded both the stabilized current and the corresponding terminal voltages. We collected a comprehensive dataset, typically comprising 15–20 data points, covering the entire range from 0 to the maximum load resistance of 50 kΩ. In Figure 4b, a noticeable variation in the load voltage (VL) is observed. Subsequently, it became evident that the voltage nearly approached the open-circuit voltage, suggesting that the maximum load capacity of a single microphotovoltaic solar cell (µPSC) is limited to 5 kΩ. Similar observations were made with the load current. Beyond a load resistance of 5 kΩ, the load current exhibited relative stability, reinforcing the notion that the single µPSC’s maximum capacity was indeed around 5 kΩ.
Figure 5a graphically illustrates the I–V characteristics of the µPSC under a light intensity of 2 µmolm−2s−1. As the load current deviates from the short-circuit current, a nearly linear drop in the load voltage is observed, indicating that a change in load current leads to a proportional change in load voltage. From this I–V polarization curve, it can be inferred that the µPSC does not strictly function as either a voltage source or a current source; instead, it exhibits characteristics of both. In traditional photovoltaic cells, as the load voltage varies, the load current remains relatively constant until the load voltage reaches approximately 60% of its rated Voc (open-circuit voltage). However, in the case of the µPSC, variations in the current led to almost linear changes in load voltage, thus distinguishing it as neither a pure current source nor a voltage source.

Power–Current (P–I) Characteristics

I–P characteristics are essential for understanding the behavior of any power-generating device. They provide the maximum power that could be generated by a power source. Figure 5b demonstrates the I–P characteristics of the µPSC under light illumination 2 µmolm−2s−1. The maximum power (Pmp) of 200.76 µW was produced by the µPSC, which is almost the same performance or slightly higher performance than our previous finding of 186 µW, which required a relatively complicated method of fabrication that was expensive compared to the current fabrication method [10]. Here, the maximum power of 200.76 µW was produced with a Vmp rating of 478 mV and an Imp rating of 420 µA, which were the operating points for voltage at maximum power and current at maximum power, respectively. These operating points, Vmp and Imp, provide insights for designing real-time power converters.

3.4. Effect of Light Illumination on the Performance of µPSC

In order to observe the electrical performance of the µPSC under different light illuminations and under the dark conditions, the µPSC was investigated for electrical performance parameters such as Voc, Isc, loading at 1 kΩ, and I–V and I–P characteristics. The objective was to understand the optimal light conditions required for optimal performance of the µPSC. The different light illuminations were generated using the fluorescent 20 W bulb. The light illumination was tuned to three different light conditions. The light illumination was measured with the lux meters and further converted to µmolm−2s−1 [20].
Three different light conditions such as 2 µmolm−2s−1, 8 µmolm−2s−1, and 20 µmolm−2s−1 were illuminated uniformly in the µPSC test location. The µPSC was exposed to these light illuminations for 30 min, and then the electrical performances were recorded. After exposure to the three light conditions, the µPSC was investigated with a short period of dark conditions (less than 5 min). No significant difference in performance compared with that under light conditions was observed. In order to mimic the natural system of day and night (light and dark cycles), the µPSC was then exposed to dark conditions for 30 min and light conditions for 30 min to observe the electrical performance.

3.4.1. Effect of Light Illumination on the Voc, Isc, VL, and IL

The Voc values of the µPSC under different light conditions and under dark conditions are presented in Figure 6a. Among the three light illuminations chosen in this study, the light illumination of 2 µmolm−2s−1 demonstrated the highest Voc of 818 mV compared to other light illuminations, which showed Voc values of 750 and 760 mV. Though the Voc values at 8 and 20 µmolm−2s−1 were slightly lower than that under 2 µmolm−2s−1, the variation was insignificant. The results indicated that the effect of light illumination on Voc is negligible. When the µPSC was exposed to dark conditions for 30 min, the Voc was reduced to 724 mV, which was slightly less than that observed under light conditions, indicating the Voc is almost independent of light conditions. It was observed that Voc was practically unaffected by different light conditions.
Figure 6b shows the Isc of the µPSC under different light and dark conditions. For the light illumination of 2 µmolm−2s−1, µPSC demonstrated a maximum Isc of 1000 µA compared with other light illuminations. For the light illumination of 8 µmolm−2s−1, the Isc was observed to be 713 µA, and for the 20 µmolm−2s−1 it was found to be 630 µA, indicating the impact of light illumination on the Isc. This could be attributed to a reduction in the rate of the photosynthesis [23]. It was found that light illumination of 2 µmolm−2s−1 generated a higher Isc than the illumination at 8 and 20 µmolm−2s−1, indicating a higher rate of photosynthesis at the lower light intensity [2,23]. As the light illumination increases, there is a chance of damage to the chlorophyll molecules, which reduces the photosynthetic activity of the algal cells. Furthermore, as light illumination increases, either fluorescence absorption increases or light energy is emitted as heat; therefore, the photosynthetic performance decreases [2]. Therefore, it is essential to have the optimal light illumination for the high performance of the µPSC and also for the viability of the photosynthetic cells/microorganisms.
Under dark conditions, the Isc was observed to be 430 µA, which was 55% less than the value seen under the light illumination of 2 µmolm−2s−1. During the respiration process, electron transport takes place. However, the performance is lower than that under light conditions. Therefore under the dark conditions, the µPSC demonstrated a lower Isc than under the light conditions. Furthermore, to observe the performance of the µPSC with real-time electrical loading at different light illuminations and dark conditions, the µPSC was tested at 1 kΩ.
For the light illumination of 2 µmolm−2s−1, a maximum VL of 470 mV was observed. In contrast, for the light illumination of 8 µmolm−2s−1 and 20 µmolm−2s−1, VL values of 400 and 356 mV were observed, respectively. For the dark condition, the VL dropped to 280 mV, which was an almost 40% decrease in comparison to the light illumination of 2 µmolm−2s−1. Among the three light conditions, light illumination of 2 µmolm−2s−1 was found to generate the best performance, indicating the best optimal light conditions for µPSC operation. Figure 6a shows the VL of the µPSC under all light and dark conditions.
Similar observations were made with a load current of 1 kΩ. Figure 6b shows the IL at 1 kΩ. A higher IL of 460 µA was observed for the light illumination of 2 µmolm−2s−1. For the light illumination of 20 µmolm−2s−1, an IL of 356 µA was observed. For the dark condition, the IL was reduced, and it was found to be 280 µA, which was 40.4% lower than that observed with the light illumination of 2 µmolm−2s−1.

3.4.2. Effect of Light and Dark Conditions on I–V and I–P Characteristics of the µPSC

In order to observe the I–V and I–P characteristics of the µPSC under different light conditions, the V–I and P–I data were recorded. The light illumination of 2 µmolm−2s−1 yielded a higher area under the curve than the other light conditions. The dark condition had almost half the area under the curve of the light illumination of 2 µmolm−2s−1. Figure 7a demonstrates the I–V characteristics of all the light illumination and dark conditions.
Figure 7b shows the I–P characteristics of the µPSC under different light and dark conditions. The light illumination of 2 µmolm−2s−1 yielded a maximum power of 200.76 µW, whereas the dark conditions yielded a maximum power of 81.27 µW.

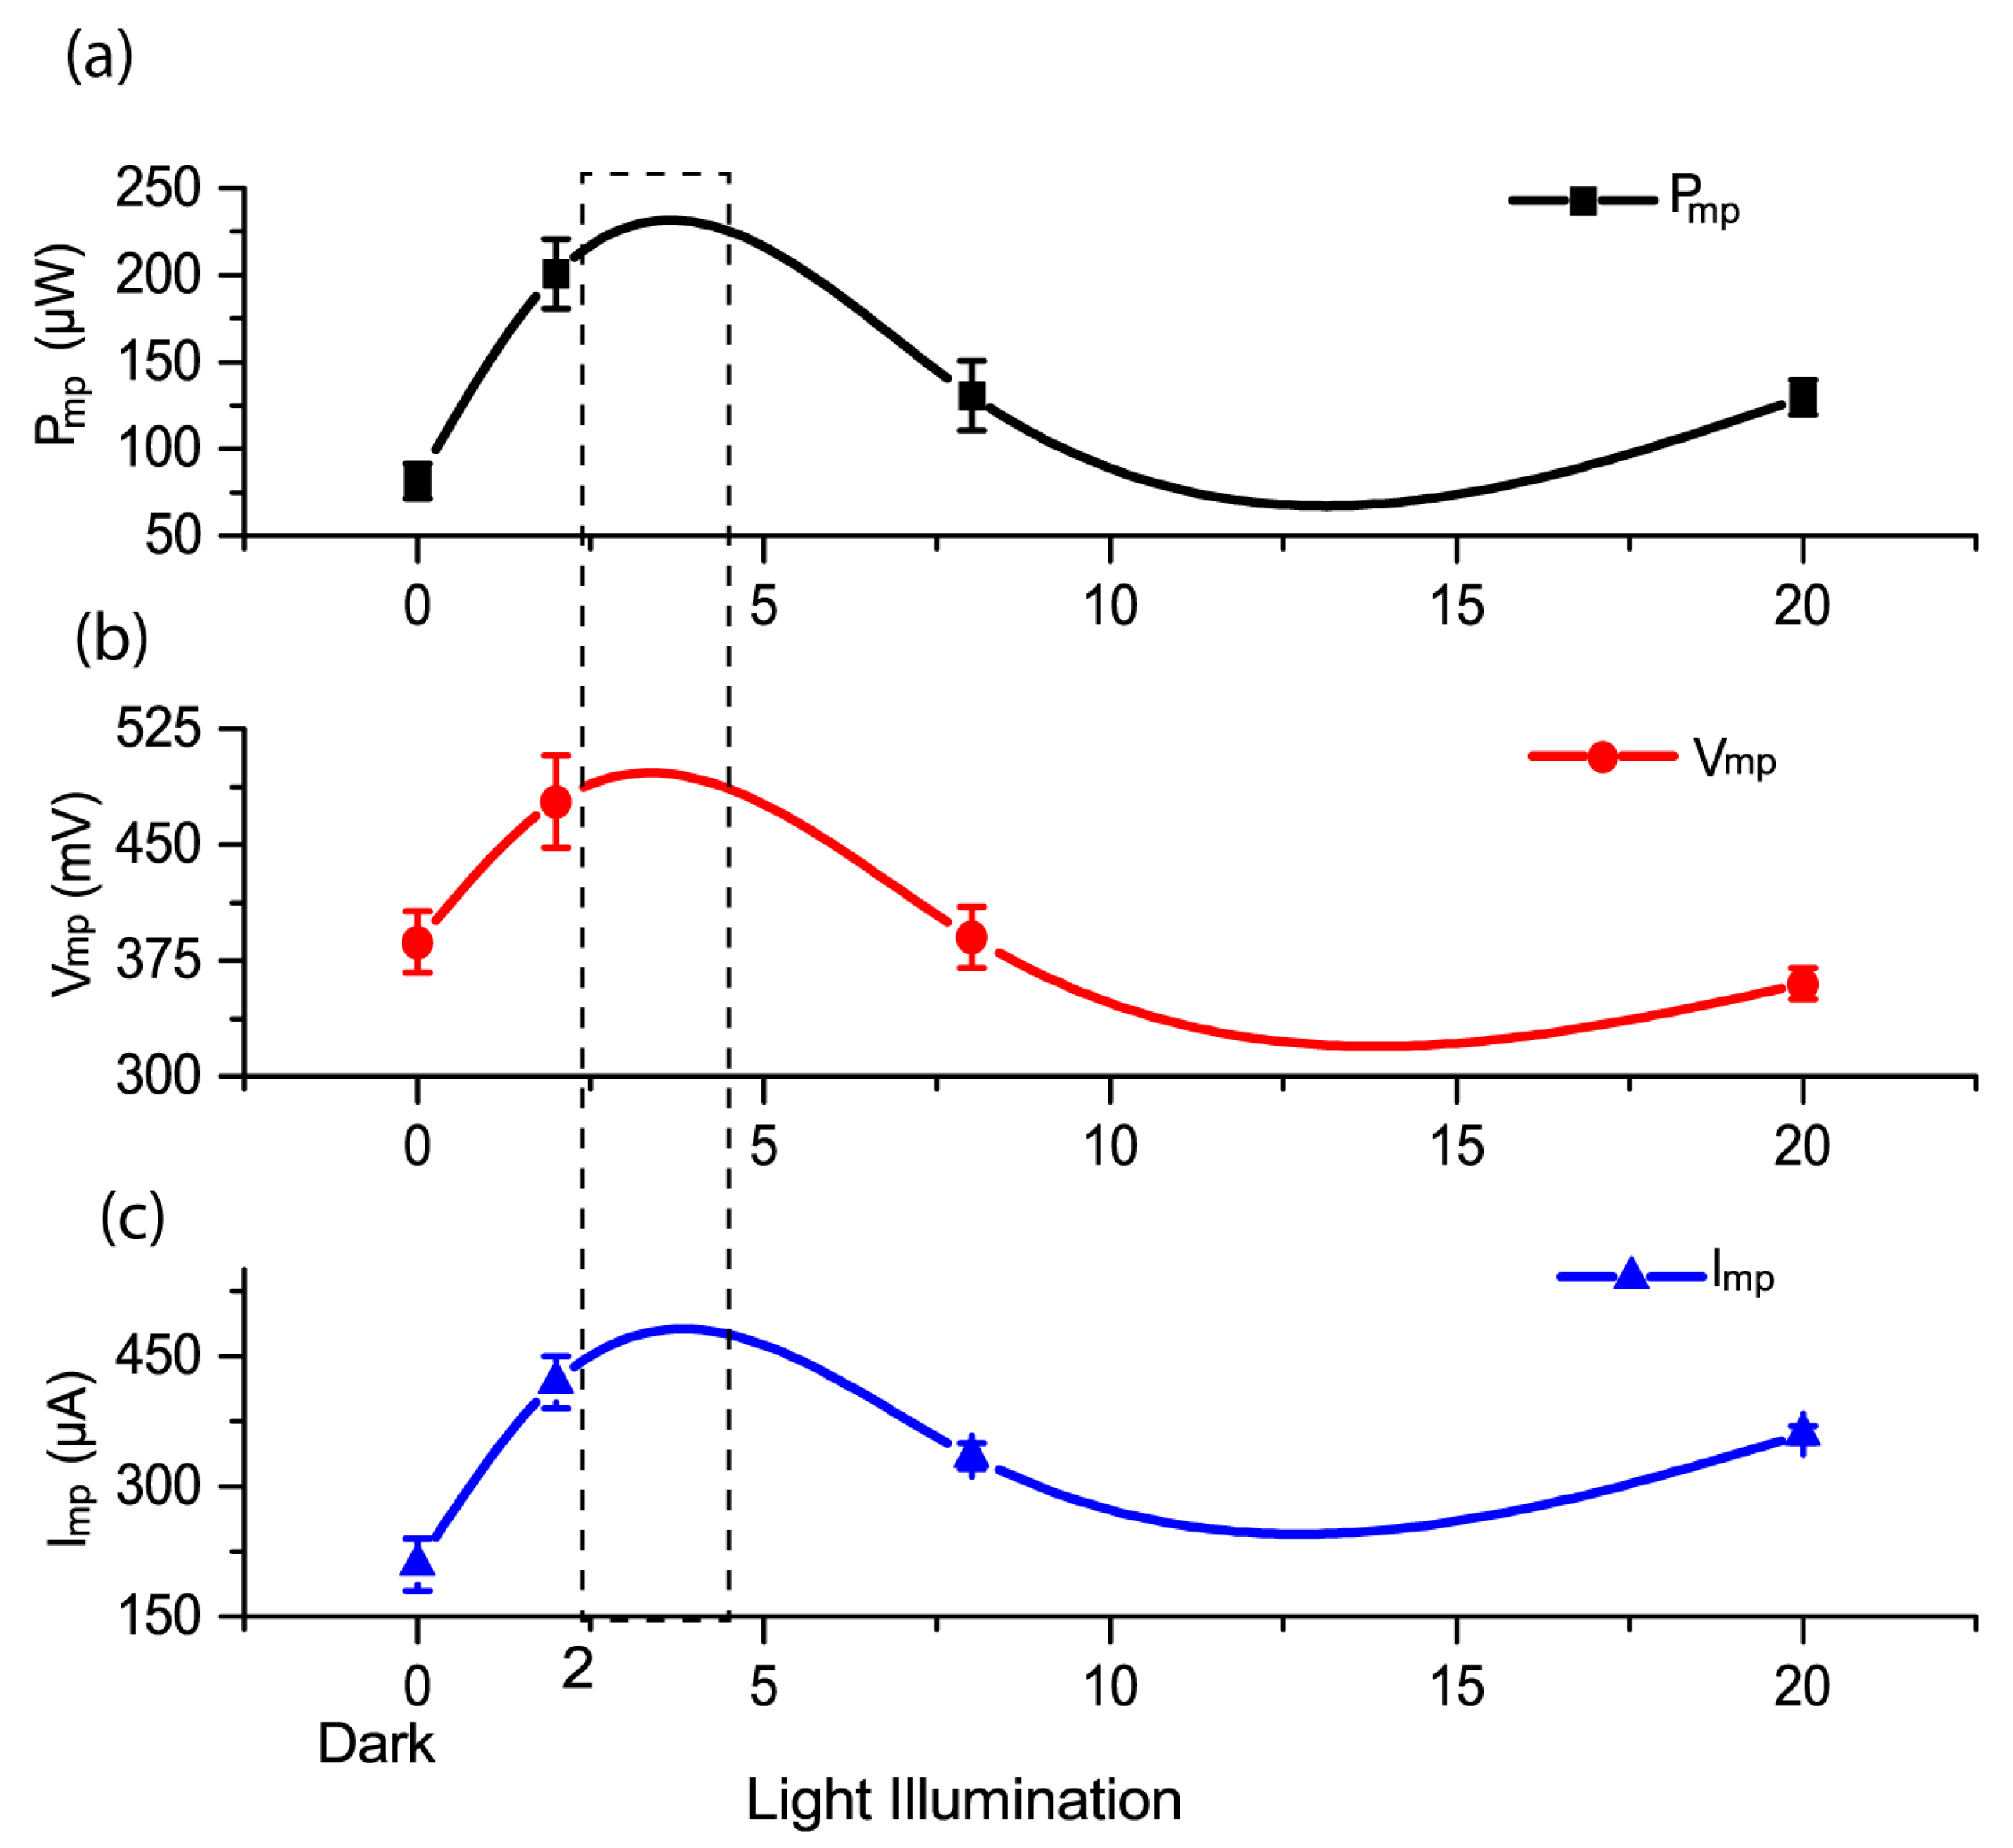
3.4.3. Effect of Light and Dark Conditions on the Maximum Power (Pmp) and Operating Points of the µPSC

Maximum power is the highest power that is generated by a µPSC. Pmp is the operating point for I-V characteristics, where the product of current and voltage is maximum. The maximum power point of the µPSC is crucial since it shows the maximum power output of the µPSC and indicates actual performance. Figure 8a shows the maximum power (Pmp) of the µPSC under different light and dark conditions.
At the light illumination of 2 µmolm−2s−1, the µPSC generated a Pmp of 200.76 µW, which was highest among the all the light illuminations in this study. The µPSC demonstrated a Pmp of 133.76 µW at the light illumination of 8 µmolm−2s−1, and at the light illumination of 20 µmolm−2s−1, it generated a Pmp of 121.03 µW. It was observed that under the dark conditions, the µPSC generated a Pmp of 81.27 µW. These results indicated that the optimal light illumination for the best performance of the µPSC was around 2 µmolm−2s−1. The results showed that the performance of the µPSC decreases with higher light illumination, and it also decreases if the light illumination is less than 2 µmolm−2s−1.
The maximum power’s corresponding terminal voltage and current are the operating points of the µPSCs. The operating points are also defined as the ratings of any typical power-generating device. The operating points are essential to design efficient power electronic devices and harness maximum power from a power-generating device. The higher the voltage and current of the power-generating device, the better the operating point. With a higher operating point, designing power electronics is relatively cost- and design-effective. Figure 8b shows the operating voltage (Vmp) at which the power is maximum for different light conditions. It was found that the light illumination of 2 µmolm−2s−1 yielded a higher voltage and currents. Figure 8c demonstrates the operating current (Imp) at which the µPSC showed maximum power at different light illumination levels.

3.4.4. Long-Term Performance of µPSC

The long-term performance of the µPSC was tested for 24 h in our previous work [11], which demonstrated an increasing Voc trend. To a large extent, Voc was dependent on the quality of the photosynthetic cells (algal cells) and the volume of anolyte and catholyte (potassium ferricyanide). It was found that after 24 h, after the replacement of the potassium ferricyanide, the performance increased.
In order to observe the reliability of the µPSC, the anolyte and catholyte were removed and cleaned with deionized water. Further, the µPSC was carefully cleaned with clean absorbents on both the anode and cathode sides. The exponential cultured algal cells were prepared and used for testing. Similar performances were observed, indicating the reliability of the µPSC.

3.4.5. Light-to-Electricity Conversion Efficiency

Artificial fluorescent bulbs were employed as the illumination source for all the experiments carried out in this work. The light intensity on the surface of the anode of the µPSC was measured with a lux meter. The measured lux values were further converted into µmolm−2s−1 [20] and W/m2 [24]. Based on the source of illumination (fluorescent bulbs), the input power on the anode surface was calculated using the Equation (4).
P = 0.09290304 × E v ( l x ) × A η l m
where,  P P o w e r   i n   w a t t s ,
E v ( l x ) i l l u m i n a n c e   i n   l u x ,
A A c t i v e   s u r f a c e   a r e a a n o d e   s u r f a c e   a r e a  in m2
η l m l u m i n o u s   e f f i c a c y   i n l u m e n s w a t t ; 60 l u m e n s / w a t t  (total 2400 lumens for a 40 watt bulb).
The input power on the anode surface of the micro-photosynthetic power cell calculated from the Equation (4) is shown Table 1.
In photosynthetic cells, a small percentage of photosynthetically active radiation (PAR) with wavelengths of 400–700 nm is harvested by the PSI and PSII photosynthetic pigments. In photosynthesis, the light-energy-to-chemical-energy conversion itself is as low as 4.6 to 6% [25]. The µPSC harvests electrons that are expelled by the cell membranes of the photosynthetic cells. Therefore, the electricity-harvesting efficiency will be lower than 4.6%. At an illumination intensity of 2 µmolm−2s−1, the light-energy-to-electricity-conversion efficiency was low as 0.18%. With an increase in the illumination intensity, the light-to-electricity conversion efficiency decreased. At 8 µmolm−2s−1, the efficiency was noted as 0.02%. Similarly, at an illumination of 20 µmolm−2s−1, the efficiency decreased to 0.01%. All these calculations were performed with a fluorescent bulb as the illumination source. It should be noted that in the presence of sunlight, the input power will change drastically, and the performance of the µPSC may change slightly. However, the light-to-electricity conversion efficiency will have similar trend as that of the fluorescent bulb. The rate of photosynthesis could be measured by the change in the oxygen concentration in the photosynthetic cells. During photosynthesis in the presence of sunlight, the rate of photosynthesis reaches its peak at a specific wavelength. After that specific wavelength, the photosynthetic rate (oxygen concentration) either saturates or decreases [23]. Overly high or low intensity of the photosynthetic active radiation poorly affects the photosynthetic machinery [26].

4. Discussion

The fabrication method proposed in this study is simple and economically viable compared with other fabrication methods that require the photolithography fabrication process, which is tedious and expensive [11,15,16]. In this study, Chlamadomonaous reinhardtii [27,28] was utilized considering its exoelectrogenicity [9]. With the whole liquid culture of green algae, due to the longevity of the cell viability, the performance remains higher in the long term compared to that of other photo-bio-electrochemical cells. In contrast, in the photo-bio-electrochemical cells consisting of photosynthetic pigments such as thylakoids, chlorophyll suffer low performance in the long term [16,29,30,31,32,33,34,35,36,37,38,39].
In an ideal case, the µPSC under investigation could generate a maximum power of 413 mWm−2. With optimal array configurations, the currently proposed method of fabrication could generate the desired voltage and current required for real-time low- and ultra-low-power applications. The ultra-low-power sensors such as humidity sensors, ultrasonic sensors, and global positioning systems, the power requirement of which is 0.15 mW to 60 mW [40,41,42,43], could be easily powered from this type of µPSC. Such prospects for the array configurations for low- and ultra-low-power applications are provided in our other works [44,45]. Furthermore, most IoT sensors require power for a brief period, with a long period of inactivity. IoT ultra-low-power sensors with continuous operation of the µPSC both in light and dark conditions with suitable power converters will be useful to charge low-power batteries [46,47,48,49].
Furthermore, it is important to highlight that the electrodes were sputtered with gold, a material known to be biocompatible with the photosynthetic cells employed in this study. Consequently, no adverse effects or toxicity towards the cells were observed in the experimental conditions. Additionally, the sustainability of this approach is underscored by the fact that the materials used in the fabrication, including the electrolytes, consist solely of water and biodegradable components, contributing to its eco-friendly and environmentally sustainable nature.

5. Conclusions

With advances towards sustainable energy generation, µPSCs (bio-photovoltaics) could play a pivotal role specifically for low- and ultra-low-power applications. The simple and cost-effective method of fabrication of micro-photosynthetic cells (µPSCs) presented in this work has advantages over other fabrication methods in terms of feasibility and economic aspects. Among three light illumination values of 2 (147 lux), 8 (595 lux), and 20 (1500 lux) µmolm−2s−1, the µPSC generated a maximum power of 200.16 µW at 2 µmolm−2s−1. Exposure to dark conditions for 30 min decreased the maximum power to 81 µW, which is a 119% decrease in the maximum power compared to that under the light illumination of 2 µmolm−2s−1, indicating that the µPSC could generate power under dark conditions, too. However, the amount of power generated is lower compared to that under light conditions. Therefore, although the power density is low at this moment, with an array strategy, µPSC technology can be realized as a renewable power source mainly for low- and ultra-low-power applications.

Author Contributions

Conceptualization, K.K., H.K.T. and M.P.; Methodology, K.K., H.K.T. and S.P.; Formal analysis, M.P.; Investigation, K.K.; Resources, H.K.T.; Writing—original draft, K.K.; Supervision, M.P.; Funding acquisition, M.P. All authors have read and agreed to the published version of the manuscript.

Funding

Financial support of M. Packirisamy from the Natural Sciences and Engineering Research Council of Canada (NSERC) and Concordia Research Chair and Fonds de Recherche du Québec—Nature et technologies (FRQNT).

Data Availability Statement

All the data are provided in the manuscript. No additional data is present for this work.

Acknowledgments

The authors acknowledge the financial support of M. Packirisamy from the Natural Sciences and Engineering Research Council of Canada (NSERC) and Concordia Research Chair and Fonds de Recherche du Québec—Nature et technologies (FRQNT).

Conflicts of Interest

The authors declare no conflict of interest.

References

  1. Alex Driver, P.B. Biophotovoltaics Energy from algae. Catal. April 2011, 2011, 13–15. [Google Scholar]
  2. Maxwell, K.; Johnson, G.N. Chlorophyll fluorescence—A practical guide. J. Exp. Bot. 2000, 51, 659–668. [Google Scholar] [CrossRef]
  3. McCormick, A.J.; Bombelli, P.; Bradley, R.W.; Thorne, R.; Wenzel, T.; Howe, C.J. Biophotovoltaics: Oxygenic photosynthetic organisms in the world of bioelectrochemical systems. Energy Environ. Sci. 2015, 8, 1092–1109. [Google Scholar] [CrossRef]
  4. Saar, K.L.; Bombelli, P.; Lea-Smith, D.J.; Call, T.; Aro, E.M.; Müller, T.; Howe, C.J.; Knowles, T.P.J. Enhancing power density of biophotovoltaics by decoupling storage and power delivery. Nat. Energy 2018, 3, 75–81. [Google Scholar] [CrossRef]
  5. Tanneru, H.K.; Kuruvinashetti, K.; Pillay, P.; Rengaswamy, R.; Packirisamy, M. Perspective—Micro Photosynthetic Power Cells. J. Electrochem. Soc. 2019, 166, B3012–B3016. [Google Scholar] [CrossRef]
  6. Kuruvinashetti, K.; Tanneru, H.K.; Pillay, P.; Packirisamy, M. Review on Microphotosynthetic Power Cells—A Low-Power Energy-Harvesting Bioelectrochemical Cell: From Fundamentals to Applications. Energy Technol. 2021, 9, 2001002. [Google Scholar] [CrossRef]
  7. Kuruvinashetti, K.; Pakkiriswami, S.; Packirisamy, M. Gold Nanoparticle Interaction in Algae Enhancing Quantum Ef fi ciency and Power Generation in Microphotosynthetic Power Cells. Adv. Energy Sustain. Res. 2021, 3, 2100135. [Google Scholar] [CrossRef]
  8. Bombelli, P.; Müller, T.; Herling, T.W.; Howe, C.J.; Knowles, T.P.J. A high power-density, mediator-free, microfluidic biophotovoltaic device for cyanobacterial cells. Adv. Energy Mater. 2015, 5, 1401299. [Google Scholar] [CrossRef] [PubMed]
  9. Sawa, M.; Fantuzzi, A.; Bombelli, P.; Howe, C.J.; Hellgardt, K.; Nixon, P.J. Electricity generation from digitally printed cyanobacteria. Nat. Commun. 2017, 8, 1327. [Google Scholar] [CrossRef] [PubMed]
  10. Ramanan, A.V.; Member, S.; Pakirisamy, M. Advanced Fabrication, Modeling, and Testing of a Microphotosynthetic Electrochemical Cell for Energy Harvesting Applications. IEEE Trans. Power Electron. 2015, 30, 1275–1285. [Google Scholar] [CrossRef]
  11. Shahparnia, M.; Packirisamy, M.; Juneau, P.; Zazubovich, V. Micro photosynthetic power cell for power generation from photosynthesis of algae. Technology 2015, 3, 119–126. [Google Scholar] [CrossRef]
  12. Lam, K.B.; Johnson, E.A.; Chiao, M.; Lin, L. A MEMS photosynthetic electrochemical cell powered by subcellular plant photosystems. J. Micromech. Syst. 2006, 15, 1243–1250. [Google Scholar] [CrossRef]
  13. Yagishita, T.; Horigome, T.; Tanaka, K. Effects of light, CO2 and inhibitors on the current output of biofuel cells containing the photosynthetic organism Synechococcus sp. J. Chem. Technol. Biotechnol. 1993, 56, 393–399. [Google Scholar] [CrossRef]
  14. Yagishita, T.; Sawayama, S.; Tsukahara, K.I.; Ogi, T. Effects of intensity of incident light and concentrations of Synechococcus sp. and 2-hydroxy-1,4-naphthoquinone on the current output of photosynthetic electrochemical cell. Sol. Energy 1997, 61, 347–353. [Google Scholar] [CrossRef]
  15. Chiao, M.; Lam, K.B.; Lin, L. Micromachined microbial and photosynthetic fuel cells. J. Micromech. Microeng. 2006, 16, 2547–2553. [Google Scholar] [CrossRef]
  16. Lam, K.B.; Irwin, E.F.; Healy, K.E.; Lin, L. Bioelectrocatalytic self-assembled thylakoids for micro-power and sensing applications. Sens. Actuators B Chem. 2006, 117, 480–487. [Google Scholar] [CrossRef]
  17. Friebe, V.M.; Frese, R.N. Photosynthetic reaction center-based biophotovoltaics. Curr. Opin. Electrochem. 2017, 5, 126–134. [Google Scholar] [CrossRef]
  18. Mershin, A.; Matsumoto, K.; Kaiser, L.; Yu, D.; Vaughn, M.; Nazeeruddin, M.K.; Bruce, B.D.; Graetzel, M.; Zhang, S. Self-assembled photosystem-I biophotovoltaics on nanostructured TiO2 and ZnO. Sci. Rep. 2012, 2, 234. [Google Scholar] [CrossRef]
  19. Masadeh, M.A.; Kuruvinashetti, K.; Shahparnia, M.; Pillay, P.; Packirisamy, M. Electrochemical Modeling and Equivalent Circuit Representation of a Microphotosynthetic Power Cell. IEEE Trans. Ind. Electron. 2017, 64, 1561–1571. [Google Scholar] [CrossRef]
  20. Convert PPFD to Lux–Online Calculator|Waveform Lighting. Available online: https://www.waveformlighting.com/horticulture/convert-ppfd-to-lux-online-calculator (accessed on 11 April 2019).
  21. Payarou, T.; Kuruvinashetti, K.; Sudharshan Kaarthik, R.; Pillay, P.; Packirisamy, M. Sensing Circuitry for Real-Time Power Studies of Micro-Photosynthetic Power Cells. In Proceedings of the 2018 IEEE Canadian Conference on Electrical & Computer Engineering (CCECE), Quebec, QC, Canada, 13–16 May 2018; pp. 4–7. [Google Scholar]
  22. Shahparnia, M.; Thesis, A. Polymer Micro Photosynthetic Power Cell: Design, Fabrication, Parametric Study and Testing. Master’s Thesis, Concordia University, Montreal, QC, Canada, 2011. [Google Scholar]
  23. Shin, D.; Song, M.; Thompson, C. Turn That Light up: Examining the Effect of Light Intensity on Photosynthesis as Measured by Oxygen Production in Elodea canadensis. Univ. Br. Columbia 2012, 2, 1–22. [Google Scholar]
  24. Lux to Watts (W) Conversion Calculator. Available online: https://www.rapidtables.com/calc/light/lux-to-watt-calculator.html (accessed on 12 November 2021).
  25. Zhu, X.G.; Long, S.P.; Ort, D.R. What is the maximum efficiency with which photosynthesis can convert solar energy into biomass? Curr. Opin. Biotechnol. 2008, 19, 153–159. [Google Scholar] [CrossRef] [PubMed]
  26. Wimalasekera, R. Effect of Light Intensity on Photosynthesis. In Photosynthesis, Productivity, and Environmental Stress, 1st ed.; Ahmad, P., Ahanger, M.A., Alyemeni, M.N., Alam, P., Eds.; John Wiley & Sons Ltd.: New York, NY, USA, 2019. [Google Scholar]
  27. Pakkiriswami, S.; Beall, B.F.N.; Maxwell, D.P. On the role of photosynthesis in the nitrate-dependent induction of the alternative oxidase in Chlamydomonas reinhardtii. Botany 2009, 87, 363–374. [Google Scholar] [CrossRef]
  28. Juneau, P.; Qiu, B.; Deblois, C.P. Use of chlorophyll fluorescence as a tool for determination of herbicide toxic effect: Review. Toxicol. Environ. Chem. 2007, 89, 609–625. [Google Scholar] [CrossRef]
  29. Caterino, R.; Csiki, R.; Lyuleeva, A.; Pfisterer, J.; Wiesinger, M.; Janssens, S.D.; Haenen, K.; Cattani-Scholz, A.; Stutzmann, M.; Garrido, J.A. Photocurrent generation in diamond electrodes modified with reaction centers. ACS Appl. Mater. Interfaces 2015, 7, 8099–8107. [Google Scholar] [CrossRef]
  30. Boghossian, A.A.; Sen, F.; Gibbons, B.M.; Sen, S.; Faltermeier, S.M.; Giraldo, J.P.; Zhang, C.T.; Zhang, J.; Heller, D.A.; Strano, M.S. Application of nanoparticle antioxidants to enable hyperstable chloroplasts for solar energy harvesting. Adv. Energy Mater. 2013, 3, 881–893. [Google Scholar] [CrossRef]
  31. Heller, A. Electrical connection of enzyme redox centers to electrodes. J. Phys. Chem. 1992, 96, 3579–3587. [Google Scholar] [CrossRef]
  32. Kamran, M.; Delgado, J.D.; Friebe, V.; Aartsma, T.J.; Frese, R.N. Photosynthetic protein complexes as bio-photovoltaic building blocks retaining A high internal quantum efficiency. Biomacromolecules 2014, 15, 2833–2838. [Google Scholar] [CrossRef]
  33. Ortiz-Torres, M.I.; Fernández-Niño, M.; Cruz, J.C.; Capasso, A.; Matteocci, F.; Patiño, E.J.; Hernández, Y.; González Barrios, A.F. Rational Design of Photo-Electrochemical Hybrid Devices Based on Graphene and Chlamydomonas reinhardtii Light-Harvesting Proteins. Sci. Rep. 2020, 10, 3376. [Google Scholar] [CrossRef]
  34. Kondo, M.; Iida, K.; Dewa, T.; Tanaka, H.; Ogawa, T.; Nagashima, S.; Nagashima, K.V.P.; Shimada, K.; Hashimoto, H.; Gardiner, A.T.; et al. Photocurrent and electronic activities of oriented-his-tagged photosynthetic light-harvesting/reaction center core complexes assembled onto a gold electrode. Biomacromolecules 2012, 13, 432–438. [Google Scholar] [CrossRef]
  35. Badura, A.; Kothe, T.; Schuhmann, W.; Rögner, M. Wiring photosynthetic enzymes to electrodes. Energy Environ. Sci. 2011, 4, 3263–3274. [Google Scholar] [CrossRef]
  36. Yu, D.; Wang, M.; Zhu, G.; Ge, B.; Liu, S.; Huang, F. Enhanced photocurrent production by bio-dyes of photosynthetic macromolecules on designed TiO2 film. Sci. Rep. 2015, 5, srep09375. [Google Scholar] [CrossRef]
  37. Utschig, L.M.; Dimitrijevic, N.M.; Poluektov, O.G.; Chemerisov, S.D.; Mulfort, K.L.; Tiede, D.M. Photocatalytic hydrogen production from noncovalent biohybrid Photosystem I/Pt nanoparticle complexes. J. Phys. Chem. Lett. 2011, 2, 236–241. [Google Scholar] [CrossRef]
  38. Noji, T.; Suzuki, H.; Gotoh, T.; Iwai, M.; Ikeuchi, M.; Tomo, T.; Noguchi, T. Photosystem II–Gold Nanoparticle Conjugate as a Nanodevice for the Development of Artificial Light-Driven Water-Splitting Systems. J. Phys. Chem. Lett. 2011, 2, 2448–2452. [Google Scholar] [CrossRef]
  39. Yehezkeli, O.; Tel-vered, R.; Wasserman, J.; Trifonov, A.; Michaeli, D.; Nechushtai, R.; Willner, I. Integrated photosystem II-based photo-bioelectrochemical cells. Nat. Commun. 2012, 3, 742–747. [Google Scholar] [CrossRef] [PubMed]
  40. Schweber, B. The Autonomous Car: A Diverse Array of Sensors Drives Navigation, Driving, and Performance. Available online: https://www.mouser.ca/applications/autonomous-car-sensors-drive-performance/ (accessed on 20 October 2022).
  41. BOSCH Ultrasonic Sensor. Available online: https://www.bosch-mobility-solutions.com/en/products-and-services/passenger-cars-and-light-commercial-vehicles/driver-assistance-systems/construction-zone-assist/ultrasonic-sensor/ (accessed on 29 August 2019).
  42. Dfrobot URM07-UART Low-Power Consumption Ultrasonic Sensor (20~750 cm)–DFRobot. Available online: https://www.dfrobot.com/product-1057.html (accessed on 29 August 2019).
  43. SHTW2 (RH/T)–Digital Humidity Sensor|Sensirion. Available online: https://www.sensirion.com/en/environmental-sensors/humidity-sensors/digital-humidity-sensor-for-iot-applications/ (accessed on 22 March 2019).
  44. Kuruvinashetti, K.; Guoqing, G.; Haobin, J.; Packirisamy, M. Perspective—Application of Micro Photosynthetic Power Cells for IoT in Automotive Industry. J. Electrochem. Soc. 2020, 167, 037545. [Google Scholar] [CrossRef]
  45. Tanneru, H.K.; Kuruvinashetti, K.; Pillay, P.; Rengaswamy, R.; Packirisamy, M. Feasibility Studies of Micro Photosynthetic Power Cells as a Competitor of Photovoltaic Cells for Low and Ultra-Low Power IoT Applications. Energies 2019, 12, 1595. [Google Scholar] [CrossRef]
  46. Sundareswaran, K.; Kuruvinashetti, K.; Gangadhar, I.; Sankar, P.; Nayak, P.S.; Vigneshkumar, V. Output Voltage Control and Power Management of a Dual Input Buck–Boost Converter Employing P&O Algorithm. IFAC Proc. Vol. 2014, 47, 1039–1043. [Google Scholar]
  47. Sundareswaran, K.; Kuruvinashetti, K.; Nayak, P.S. Application of Particle Swarm Optimization for output voltage regulation of dual input buck-boost converter. In Proceedings of the 2014 International Conference on Green Computing Communication and Electrical Engineering (ICGCCEE), Coimbatore, India, 6–8 March 2014; pp. 1–6. [Google Scholar]
  48. Dallago, E.; Barnabei, A.L.; Liberale, A.; Torelli, G.; Venchi, G. A 300-mV low-power management system for energy harvesting applications. IEEE Trans. Power Electron. 2016, 31, 2273–2281. [Google Scholar] [CrossRef]
  49. Wang, H.; Ren, Z.; Park, J. Do Power electronic converters for microbial fuel cell energy extraction: Effects of inductance, duty ratio, and switching frequency. J. Power Sources 2012, 220, 89–94. [Google Scholar] [CrossRef]
Figure 1. Operating principle of the µPSC.
Energies 16 07353 g001
Figure 2. (a) Components and assembly of the µPSC. (b) Electrodes and electrode terminals fabricated on the proton-exchange membrane. (c) The dimensions of the µPSC. (d) Photo of the assembled µPSC chip and structure of the electrode (space for proton transfer). (e) Schematics of the electrical loading of the µPSC. (f) Experimental test setup of µPSC.
Energies 16 07353 g002
Figure 3. Test results for Voc and Isc of the µPSC. Error bars indicate the transient variation of the test results (n = 3, indicating three individual tests).
Energies 16 07353 g003
Figure 4. (a) The schematics of the VL and IL data logging from the µPSC. (b) Test results for the VL of the µPSC under different load conditions. (c) Test results for the IL of the µPSC under various load conditions.
Energies 16 07353 g004
Figure 5. (a) I–V characteristics of the µPSC under the light illumination of 2 µmolm−2s−1. (b) I-P characteristics of the µPSC under the light illumination of 2 µmolm−2s−1. (n = 3, the error bars represent the variation in the current and voltage for three different individual tests).
Energies 16 07353 g005
Figure 6. (a) The Voc of the µPSC under different light and dark conditions (mV) (represented with black squares). The VL of the µPSC under different light and dark conditions (mV) (represented with red circles). (b) The Isc of the µPSC under different light and dark conditions (represented with black squares). The IL of the µPSC under different light and dark conditions (µA) (represented with red circles).
Energies 16 07353 g006
Figure 7. (a) I–V characteristics of the µPSC under different light and dark conditions. (b) I–P characteristics of the µPSC under different light and dark conditions. (n = 3, three individual tests.) Error bars represent the variation of the current and power of three individual test results (standard errors). (c) Typical I–V and I–P characteristics: showing the Pmp, Imp, Vmp, Voc, Isc, (d) Voc, and Isc of the µPSC under different light and dark conditions. (e) Imp and Pmp values at different light illuminations.
Energies 16 07353 g007
Figure 8. (a) Pmp of the µPSC under different light and dark conditions (µW). (b) Operating voltage (Vmp) at maximum power (mV). (c) Operating current (Imp) at maximum current (µA).
Energies 16 07353 g008
Table 1. Light-to-electricity conversion efficiency of the µPSC.
S.Illumination (lux)µmolm−2s−1Pinput (mW)Poutput (mW)Efficiency (%)
114721.10.20.18
259584.70.1330.02
3150020120.1210.01
Disclaimer/Publisher’s Note: The statements, opinions and data contained in all publications are solely those of the individual author(s) and contributor(s) and not of MDPI and/or the editor(s). MDPI and/or the editor(s) disclaim responsibility for any injury to people or property resulting from any ideas, methods, instructions or products referred to in the content.

