Article

Waterborne LiNi0.5Mn1.5O4 Cathode Formulation Optimization through Design of Experiments and Upscaling to 1 Ah Li-Ion Pouch Cells

by
Lander Lizaso
1,
Idoia Urdampilleta
1,2,
Miguel Bengoechea
1,
Iker Boyano
1,
Hans-Jürgen Grande
1,3,
Imanol Landa-Medrano
1,*,
Aitor Eguia-Barrio
1 and
Iratxe de Meatza
1,4
1
CIDETEC, Basque Research and Technology Alliance (BRTA), 20014 Donostia-San Sebastian, Spain
2
Department of Applied Chemistry, University of Basque Country (UPV/EHU), 20018 Donostia-San Sebastian, Spain
3
Advanced Polymers and Materials: Physics, Chemistry and Technology Department, University of the Basque Country (UPV/EHU), Avda. Tolosa 72, 20018 Donostia-San Sebastian, Spain
4
Department of Organic and Inorganic Chemistry, Universidad del País Vasco (UPV/EHU), 48080 Bilbao, Spain
*
Author to whom correspondence should be addressed.
Energies 2023, 16(21), 7327; https://doi.org/10.3390/en16217327
Submission received: 15 September 2023 / Revised: 18 October 2023 / Accepted: 25 October 2023 / Published: 29 October 2023
(This article belongs to the Topic Electrochemical Energy Storage Materials)

Abstract

:
High-voltage spinel LiNi0.5Mn1.5O4 (LNMO) is a promising candidate as a lithium-ion battery cathode material to fulfill the high-energy density demands of the electric vehicle industry. In this work, the design of the experiment’s methodology has been used to analyze the influence of the ratio of the different components in the electrode preparation feasibility of laboratory-scale coatings and their electrochemical response. Different outputs were defined to evaluate the formulations studied, and Derringer–Suich’s methodology was applied to obtain an equation that is usable to predict the desirability of the electrodes depending on the selected formulation. Afterward, Solver’s method was used to figure out the formulation that provides the highest desirability. This formulation was validated at a laboratory scale and upscaled to a semi-industrial coating line. High-voltage 1 Ah lithium-ion pouch cells were assembled with LNMO cathodes and graphite-based anodes and subjected to rate-capability tests and galvanostatic cycling. 1 C was determined as the highest C-rate usable with these cells, and 321 and 181 cycles above 80% SOH were obtained in galvanostatic cycling tests performed at 0.5 C and 1 C, respectively. Furthermore, it was observed that the LNMO cathode required an activation period to become fully electrochemically active, which was shorter when cycled at a lower C-rate.

1. Introduction

Lithium-ion batteries (LIBs) are, nowadays, the dominating battery technology [1]. They were initially implemented in small electronic devices [2]. Still, in past years, they have enabled the substitution of classic combustion engines and promoted the electrification of new models of vehicles [2,3]. The automotive industry is pushing to produce even better batteries, which leads to a continuous evolution of the chemistries implemented in electric vehicles [4,5]. A few years ago, nickel-cobalt-manganese/aluminum oxides (LiNixMnyCozO2/LiNi0.8Co0.15Al0.05O2, NMC/NCA) were the cathode materials designed for the transition from an oil-consuming to an electric engine-based fleet due to their high energy density [6,7]. Nevertheless, in recent years, lithium iron phosphate (LiFePO4, LFP) has gained interest, as its robustness, safety, and cycling stability are higher and the absence of Co and Ni makes it cheaper [8,9]. The benefits of LFP are significant, but the energy density of this material is limited by its lower working voltage (3.2 V) [10,11].
Other materials have attracted the attention of the research community or have even been implemented in commercial cells. The first commercial LIBs consisted of lithium cobalt oxide (LiCoO2, LCO) as the cathode material [12]. It can provide high-rate and cycling performances, but its high content of Co makes it more expensive than other chemistries. Furthermore, its low thermal stability is another disadvantage for its implementation in electric vehicles [3]. LiNiO2 (LNO) is an interesting candidate for high-energy applications as it could be analogous to NMC and NCA (consisting of Ni as the sole transition metal). Thus, it has a high specific capacity (the highest among those discussed) due to its high Ni content at a higher working voltage than that of LFP. However, the negative aspects of NMC and NCA are more noticeable in this material. Its thermal and electrochemical stability are low [13], and the costs of Ni, together with some geopolitical disagreements with one of its leading exporters (Indonesia) [14,15], make it recommendable to limit the content of Ni in the cathode material. On the other hand, spinel LiMn2O4 (LMO) is a much cheaper material, based on an abundance of manganese, and it works at high voltage, which is positive for high-energy applications [16]. However, the main disadvantage of LMO is its low structural stability, which has its origin in the Jahn–Teller distortion [17] and manganese dissolution due to the 2Mn3+ → Mn4+ + Mn2+ disproportionation reaction [16]. A usual strategy to avoid the former is doping the material with other metals [17].
In this context, LiNi0.5Mn1.5O4 (LNMO) can be considered an interesting alternative to LMOI Its working potential is ca. 4.7 V vs. Li, higher than that of LMO, and the presence of nickel provides a higher capacity (theoretically 147 mAh·g−1 [18], even if the practical capacity is usually lower). In addition, the mitigation of the Jahn–Teller effect makes this material a good alternative for high-energy applications [19]. Furthermore, the absence of cobalt in its composition is another significant advantage from a commercial perspective. Nevertheless, one of the main advantages of this material, i.e., its high working potential, becomes its main disadvantage when facing this cathode with graphite anode to obtain a high working voltage. This voltage is excessive for the state-of-the-art electrolytes and undergoes oxidative decomposition [20]. In addition, the surface of LNMO is transformed into the highly insulating rock salt, NiO [21]. A recent work by Jusys et al. studied gas evolution by means of DEMS of LIBs based on a LNMO cathode, graphite anode, and LP30 electrolyte, evidencing that Ni4+ catalyzed the dehydrogenation of the organic carbonates even after the decay of current to zero, indicating that the degradation processes can occur in the absence of Faradaic currents [22]. The main strategies to avoid this reaction consist of modifying the surface of LNMO [23,24,25,26,27], doping this material with other elements [28,29,30,31,32,33,34], using electrolyte additives [35,36,37,38,39] or alternative electrolytes [40] and separators [41,42], and following electrochemical methods [43] to avoid degradation reactions. Furthermore, it has been evidenced that it is possible to boost the energy density of the cells based on a LNMO cathode by combining it with high-capacity Si-based anodes if the electrolyte is carefully chosen [44].
Another disadvantage of LNMO is its limited electronic conductivity, which hinders its use in commercially attractive high-loading electrodes [45]. Conductive additives are therefore needed to work with this material. In addition, high-loading electrodes can also suffer from lower adhesion strength to the current collector compared with low-loading electrodes, which is mitigated with the increase in binder content. Both conductive and binder additives are electrochemically inactive; the higher their concentration in the formulation, the lower the energy density of the electrodes. Thus, it is necessary to minimize their presence without affecting the electrochemical performance and manufacturability of the electrodes. In fact, as Frith et al. [46] mentioned in a recent work, “When carrying out research focusing on industrial product development, researchers should develop products that solve a problem rather than develop a solution that needs to find a problem to solve”. This means not limiting the research to the evaluation of the materials at the laboratory scale but proposing formulations and/or techniques that can be realistically upscaled to industrial-scale coating lines. Ue et al. also suggested a similar idea [47]: “the knowledge generated at academia must be brought to our society assessed by the technological criteria used in industry”. This was the driving force motivating this work, where a cathode formulation based on LNMO active material was optimized and upscaled to a semi-industrial coating line. The second motivation was to propose a formulation using water as solvent instead of the current state-of-the-art organic solvent-based systems to decrease the carbon footprint of LIBs. There are interesting works that report alternative LNMO electrode manufacturing methods; dry-coating [48] and chemical vapor deposition [25] are examples of them. Nevertheless, we believe that it might be too early to produce electrodes via these techniques and expect that the current electrode manufacturing industry can be more easily adapted to water-based processing. Di Giorgio et al. compared the LNMO electrodes produced in aqueous (with carboxymethyl cellulose, CMC, as binder) and organic media (with polyvinylidene fluoride, PVDF, as binder) [43]. Waterborne electrodes outperformed those subjected to organic processing in terms of cycling performance. This improvement was attributed to the more stable electrode surface for the CMC-based electrodes.
However, there are even more ambitious strategies to boost the energy density of the lithium-based cells. On the one hand, lithium-sulfur batteries (LSBs) are a cheap, sustainable, and promising alternative for some applications to the state-of-the-art LIBs [49]. Their gravimetric energy density is significantly high (theoretically 2600 Wh·kg−1 [50]) and may find a business niche in applications where this feature is a determining factor. The cell chemistry of LSBs is based on the reduction of S8 to Li2S upon discharge and its subsequent oxidation to S8 upon charge, while lithium metal is usually used in the anode [51]. However, the intermediate products of these reactions, i.e., lithium polysulfides, are soluble in electrolytes and undergo shuttling, decreasing the coulombic efficiency of the cells [52]. Thus, the most significant efforts in past years have been focused on mitigating this inconvenience [53,54,55]. Even if the defunction of Oxis Energy Ltd. (Abingdon, UK) was a hard blow for the adepts of this technology, there are optimistic results published at prototype level [56]. Apart from LSBs, there are other types of lithium metal batteries (LMBs). In fact, lithium metal was the first anode material used in lithium batteries, which was later replaced by carbonaceous materials [57]. Among these carbonaceous materials, it is possible to find state-of-the-art graphite, which, in some cases, can be found blended with silicon-based materials in commercial cells [6]. Nevertheless, the high gravimetric and volumetric energy densities, achievable with metallic lithium, keep that old goal alive [58]. Even if the use of metallic lithium can lead to safety problems due to its reactivity and dendrite formation, they are being commercialized combined with solid electrolytes and special casings [59].
In any case, LSBs and LMBs are examples of mid-future technologies, and this work aims to analyze the short-term alternatives to current LIBs. As already mentioned, LNMO is an interesting solution to maximize the energy density of this type of batteries, which can become more sustainable by processing the electrodes using water instead of organic solvents. Thus, we propose a formulation optimization to maximize the electrochemical performance and the feasibility of LNMO electrodes. This electrode optimization was performed following the design of experiments (DoE) approach. This decision aimed to delimit the area of analysis and explore this area in an orderly manner, maximizing the information that could be obtained with the minimum number of samples by identifying the influential parameters affecting different factors and pointing out an optimum combination for the system studied [60,61]. A work by Rynne et al. [62] provides an excellent flowchart of the steps that should be followed to conduct an efficient DoE. The objectives of the study must initially be defined, followed by the definition of the responses, the parameters, and the plan. Afterward, the experimental part of the study is conducted to obtain the experimental results. Finally, it is time to refine the data to obtain a model that accurately describes the system and draw conclusions. This mathematical model can also be used to predict combinations that might even improve the response of those studied [62].
In this work, we report the use of a DoE matrix to obtain a mathematical model that predicts the best formulation of cathodes with LNMO as the active material. After obtaining and validating this formulation, its upscaling to a semi-industrial coating line is described. The electrodes obtained from this coating were used to assemble 1 Ah pouch cells as demonstrators which were tested under different rate capabilities.

2. Materials and Methods

2.1. Electrode Manufacturing

The positive electrodes consisted of LiNi0.5Mn1.5O4 (LNMO, NANOMYTE SP-10 from NEI corporation, Somerset, NJ, USA) as the active material, carbon black (C-NERGY Super C45 from IMERYS Carbon & Graphite, Paris, France) as the conductive additive, carboxymethyl cellulose (CMC, Walocel 2000 from DOW Chemical Company, Midland, MI, USA) as the disperser and the thickener, and non-fluorinated acrylate polymer (from ZEON Chemicals, Louisville, KY, USA) as the binder. The percentage for each component in the formulation varied to prepare the samples subjected to the current study. They were mixed using water as the solvent by means of a mechanical stirrer. The solid-to-liquid (S/L) ratio in these formulations was between 1/1 and 1/1.15. Using a doctor blade table-top coater, the resulting slurries were coated onto a 20 μm-thick aluminum current collector (Hydro). The loading of such coatings was 1.6 mAh·cm−2 using 130 mAh·g−1 as the reference specific capacity of LNMO. The water of the as-coated electrodes was evaporated in a convection oven at 60 °C and the coatings were later calendered at a 2 g·cm−3 density using a laboratory-scale calendering machine (DPM solutions). The thickness of the coatings was measured using a Mitutoyo 389–271 C micrometer.
The electrodes used to assemble the pouch cells were manufactured at CIDETEC, using a semi-industrial coating line. On one hand, the cathodes consisted of the formulation which provided the highest desirability among those studied at the laboratory scale (see Section 3 for further detail). Three 250 g solid slurries were prepared and coated on the same aluminum current collector used in the laboratory coatings. The loading of the coating was controlled using a knife system with a variable gap, and the coating was passed through three convection ovens at 60, 70, and 80 °C to dry it. In addition, 9 m of double-side coating with a load of 1.5 mAh·cm−2 (per side) were obtained and calendered at a 2.0 g·cm−3 density. A picture of the cathode coating is displayed in Figure S1a.
The anodes used to assemble the pouch cells were also manufactured at CIDETEC, using an electrode coating line. They consisted of 94% graphite (MEG-2C, SGL Carbon, Wiesbaden, Germany) as the active material, 2% carbon black (C-NERGY Super C45 from IMERYS Carbon & Graphite) as the conductive additive, CMC (Walocel 2000 from DOW) as the disperser and the thickener, and SBR (TRD102A from JSR Micro NV, Leuven, Belgium) as the binder. The slurry was coated onto a 15 mm-thick copper current collector (Showa Denko Carbon, Tokio, Japan) and dried at 60, 70, and 80 °C. The loading and density of the doble-side anode were 1.7 mAh·cm−2 (per side, based on a specific capacity of 355 mAh/g) and 1.4 g·cm−3, respectively.

2.2. Physicochemical Characterization

The LNMO powder and the as-prepared and calendered electrodes were analyzed by X-ray diffraction (XRD) to confirm the absence of degradation reactions for LNMO upon electrode processing, using a Bruker D8 Discover diffractometer (Cu Kα radiation, λ = 0.154 nm) equipped with a LynxEye PSD detector. The diffractograms were recorded between 2θ = 10° and 85° at 0.003° s−1. The obtained data were fitted using the FULLPROF program [63]. Furthermore, the correct dispersion of the different components in the electrodes was confirmed means of field emission scanning electron microscopy (FE-SEM, ULTRA plus ZEISS). The rheological behavior of the slurries was characterized using a DHR2 rheometer from TA instruments. Finally, the adhesion strength of the coated electrodes on the current collector was measured using a 90° peel test (LS1 model, Lloyd Instrument, Bognor Regis, UK) on three stripes of 2 cm width.

2.3. Cell Assembly

The analysis of the optimum cathode LNMO-based formulation was performed in the half coin cell (HCC) configuration. The coatings prepared with the different formulations were cut with a diameter of 16.6 mm and dried for 16 h at 120 °C under vacuum conditions to eliminate traces of water. The cell cases were cleaned with ethanol in an ultrasonic bath for 15 min and dried at 60 °C for 1 h. A disc of lithium (50 μm-thick, from Albemarle Corporation, Charlotte, NC, USA) with a diameter of 18.2 mm was used both as a counter and reference electrode in each cell. CR2025-type Hohsen HCCs were assembled in a dry room with a dew point of −50 °C. The separator (Celgard ECT-2015), dried at 60 °C under vacuum conditions, was impregnated with 50 μL of 1 mol·L−1 lithium hexafluorophosphate in (3:7 vol%) ethylene carbonate:ethyl methyl carbonate + 1 wt% vinylene carbonate (1 M LiPF6 in EC:EMC (3:7 wt.) + 1 wt.% VC) electrolyte, provided by Solvionic.
Electrodes for the soft-packaged pouch cells were directly cut from the obtained coatings and calendered on the semi-industrial coating line in a semiautomatic die-cutting unit (MTI Corp., Richmond, CA, USA). The dimensions of the cathodes and the anodes were 9.8 cm × 5.9 cm and 10.0 cm × 6.1 cm, respectively. A picture of a cathode is shown in Figure S1b. The drying protocols and separator used were the same as those in HCCs, and the cells were assembled in the dry room under the same conditions. The cells consisted of six cathodes and seven anodes per cell, which were stacked manually using a guiding tool to guarantee stack alignment. The separator was laminated to the cathodes before stacking with the anodes.
After stacking, the flanges (tabs) of the electrodes were ultrasonically welded to terminal tabs (100 μm-thick Al (+) and Ni-plated Cu (−)), and then placed between two half-shells of an aluminum laminated foil (ALF) pouch material and heat sealed on three sides. Afterward, the cells were filled with 7 mL of 1 M LiPF6 in EC:EMC (3:7 wt) + 1 wt.% of succinic anhydride (SA) electrolyte, which was provided by Solvionic. Then, the remaining side was thermally sealed under −850 mbar using a vacuum chamber sealer. The cells were subjected to a routine analysis of voltage and AC resistance at 1 kHz using a Hioki BT3554 multimeter. The average resistance and voltage of the cells were 7.6 mOhm ± 0.2 mOhm and 0.10 V ± 0.03 V, respectively. Then, the cells underwent the formation protocol (described in Section 2.4) and were brought back to the dry room for the degassing step. In this step, one side of the cells was opened and thermally sealed again under vacuum conditions. Finally, the routine voltage (4.23 V ± 0.11 V) and resistance (9.4 mOhm ± 0.64 mOhm) check-up was repeated. A picture of the assembled pouch cells is displayed in Figure S1c.

2.4. Electrochemical Testing

All the experiments were performed in a Basytec Cell Test System potentiostat at a room temperature of 25 °C ± 1 °C controlled by air conditioning. The HCCs were left for 16 h at open circuit potential to guarantee the adequate wetting of the electrodes and the separator. Afterward, they were subjected to three galvanostatic cycles at 0.2 C, one at 0.5 C, three at 1 C, and one at 0.5 C, all of them between 5 V and 3.5 V. The protocol continued with a fast discharge C-rate analysis, three at 2 C, three at 5 C, three at 8 C, and three at 10 C. The charges of all these cycles were performed at 1 C, and a check-up cycle at 0.5 C was intercalated between each discharge C-rate three-cycle block. Finally, the recovery capacity of the cells was analyzed by performing three cycles at 1 C. All the cycles in the protocol described included a constant voltage (CV) step to 0.05 C at 5 V. The testing protocol is summarized in Table S1.
The pouch cells were subjected to a formation cycle at 0.05 C, and two at 0.1 C, all of them between 4.8 and 3.6 V. A CV step to 0.025 C (for the 0.05 C cycle) and to 0.05 C (in the 0.1 C cycles) was set at 4.7 V to finalize the charge step. After completing the three cycles in a full-discharged state, the cells were disconnected from the testing channels, moved to the dry room, and degassed. After sealing under vacuum, the cells were connected back to the potentiostat and divided into two groups of three cells each. The first group was subjected to galvanostatic cycling at 0.5 C charge and discharge C-rate to analyze the capacity retention of the cells. On the other hand, the other three cells were subjected to more exigent rate-capability and cycling experiments: the first five cycles consisted of discharges at rates of 1 C, 2 C, 3 C, 4 C, and 5 C with charges at 0.5 C, followed by four cycles with charges at 0.1 C., 0.2 C, 0.5 C, and 1 C and discharges at a constant C-rate (1 C). Afterward, the cells were cycled at parallel 1 C discharge and charge C-rates. All these tests were conducted between 4.8 and 3.6 V.

2.5. Definition of the Formulations and the Parameters for Their Evaluation

The positive electrode formulation to be optimized was composed of four different components: LNMO, carbon black, CMC, and binder. The mathematical calculations to obtain these formulations were conducted using Equation (1).
y = i = 1 q β i x i + i < j q β i j x i x j
The experimental approach used was that of a mixture design of extreme vertices plus centroid, with each point in the experimental space being carried out in triplicate. To determine the composition of the test points, a parallelepiped was defined (within a tetrahedron), composed of 8 vertices plus a centroid. The proposed mathematical model was a mixed model (linear plus quadratic) using Equation (1). Afterward, the upper and lower limits in the formulation were defined for each of the components. This information has been compiled in Table S2. These upper and lower limits were selected based on the literature [36,37,48], previous experience, and recommendations by the component providers. The selected upper and lower limits defined the experimental area in the current study. To determine the composition of the samples to be prepared and analyzed, a matrix (Table 1) consisting of eight corners and a centroid was defined.
After determining the formulations (inputs) to be used in the experimental part of this study, it was necessary to define the parameters (outputs) to evaluate these formulations. As these formulations were designed to be implemented in the cathodes of LIBs, their electrochemical performance must be an essential output to decide which is more suitable for this application. Furthermore, as electrodes for high energy applications with high working voltages, the specific capacities achievable with the different formulations at different C-rates (0.2, 1, and 2 C) were thought to be adequate outputs for evaluating electrochemical performance. The higher the capacity, the higher the energy, and, therefore, the more desirable the response is. On the other hand, electrode preparation feasibility should not be left out of the evaluation, as a formulation with excellent electrochemical performance but that is hardly processable is not attractive for electrode manufacturers. For this aim, the outputs selected for this feasibility group were the slope of the viscosity vs. the shear rate curve in the rheological analysis, the viscosity at 10 s−1 shear rate, and the adhesion strength after coating and calendering. Higher viscosities, slopes, and adhesion strengths are desired for electrode manufacturing [64,65,66,67]. The list of parameters used to evaluate the formulations is summarized in Table 2. In addition, the schematic representation of the analysis flow followed in the current work is represented in Figure 1.

3. Results and Discussion

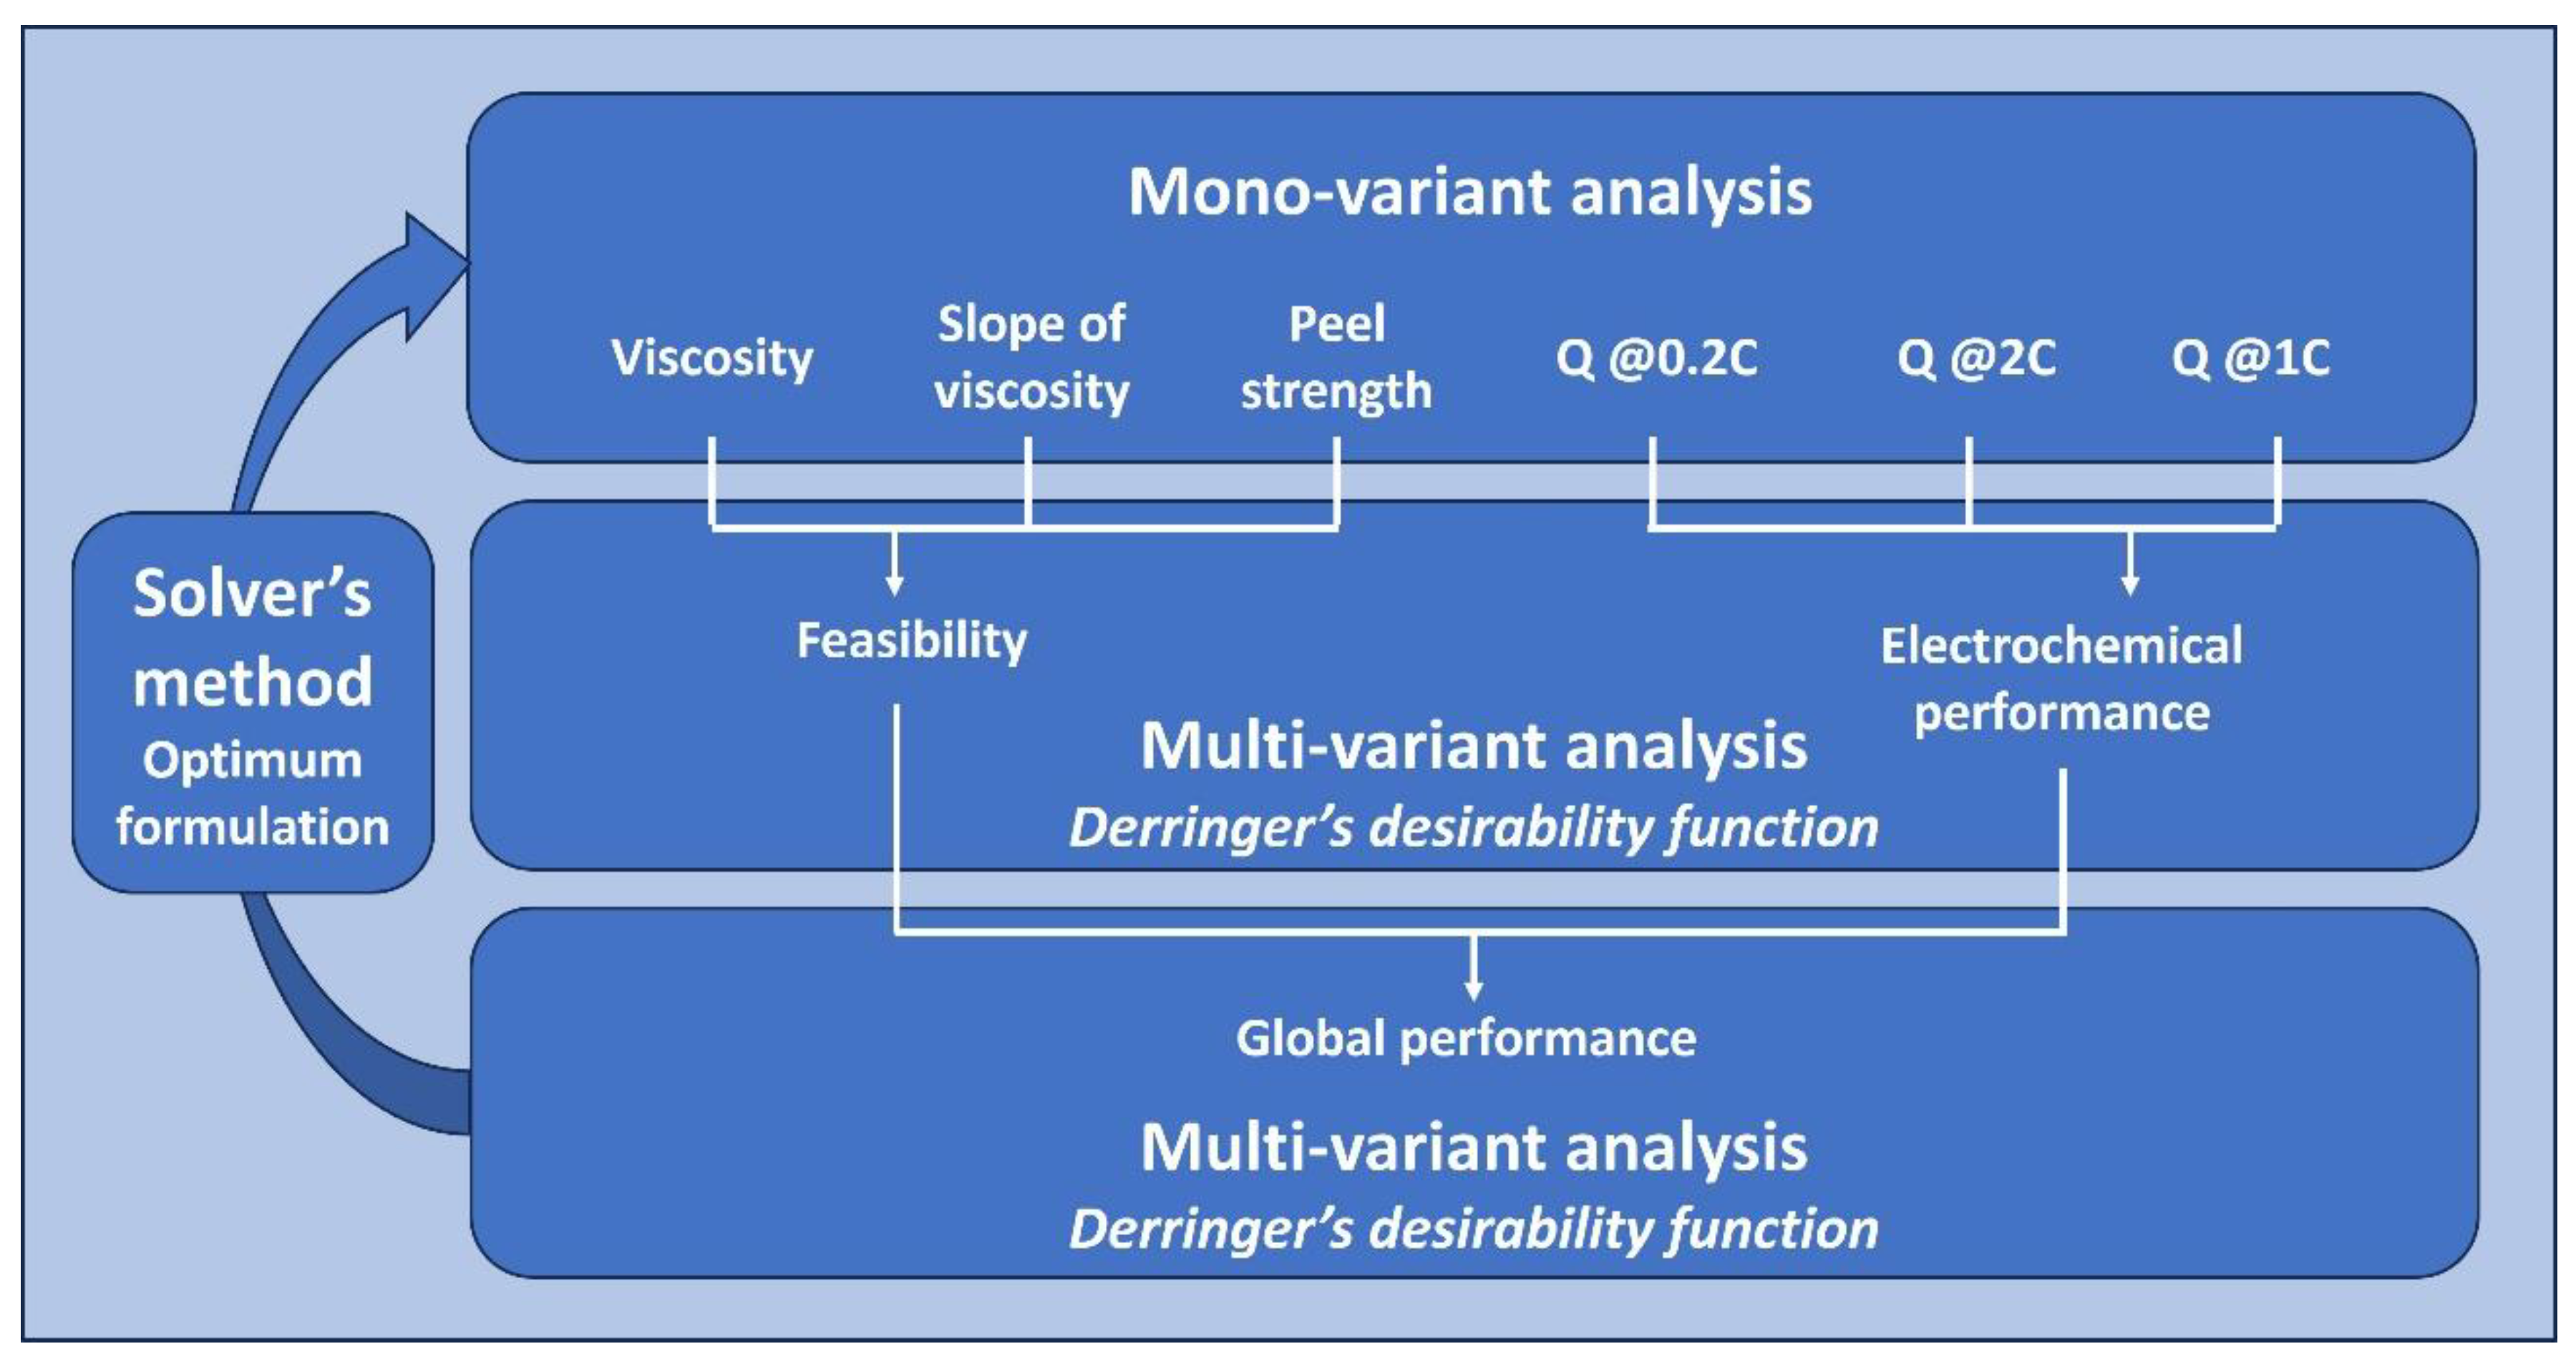
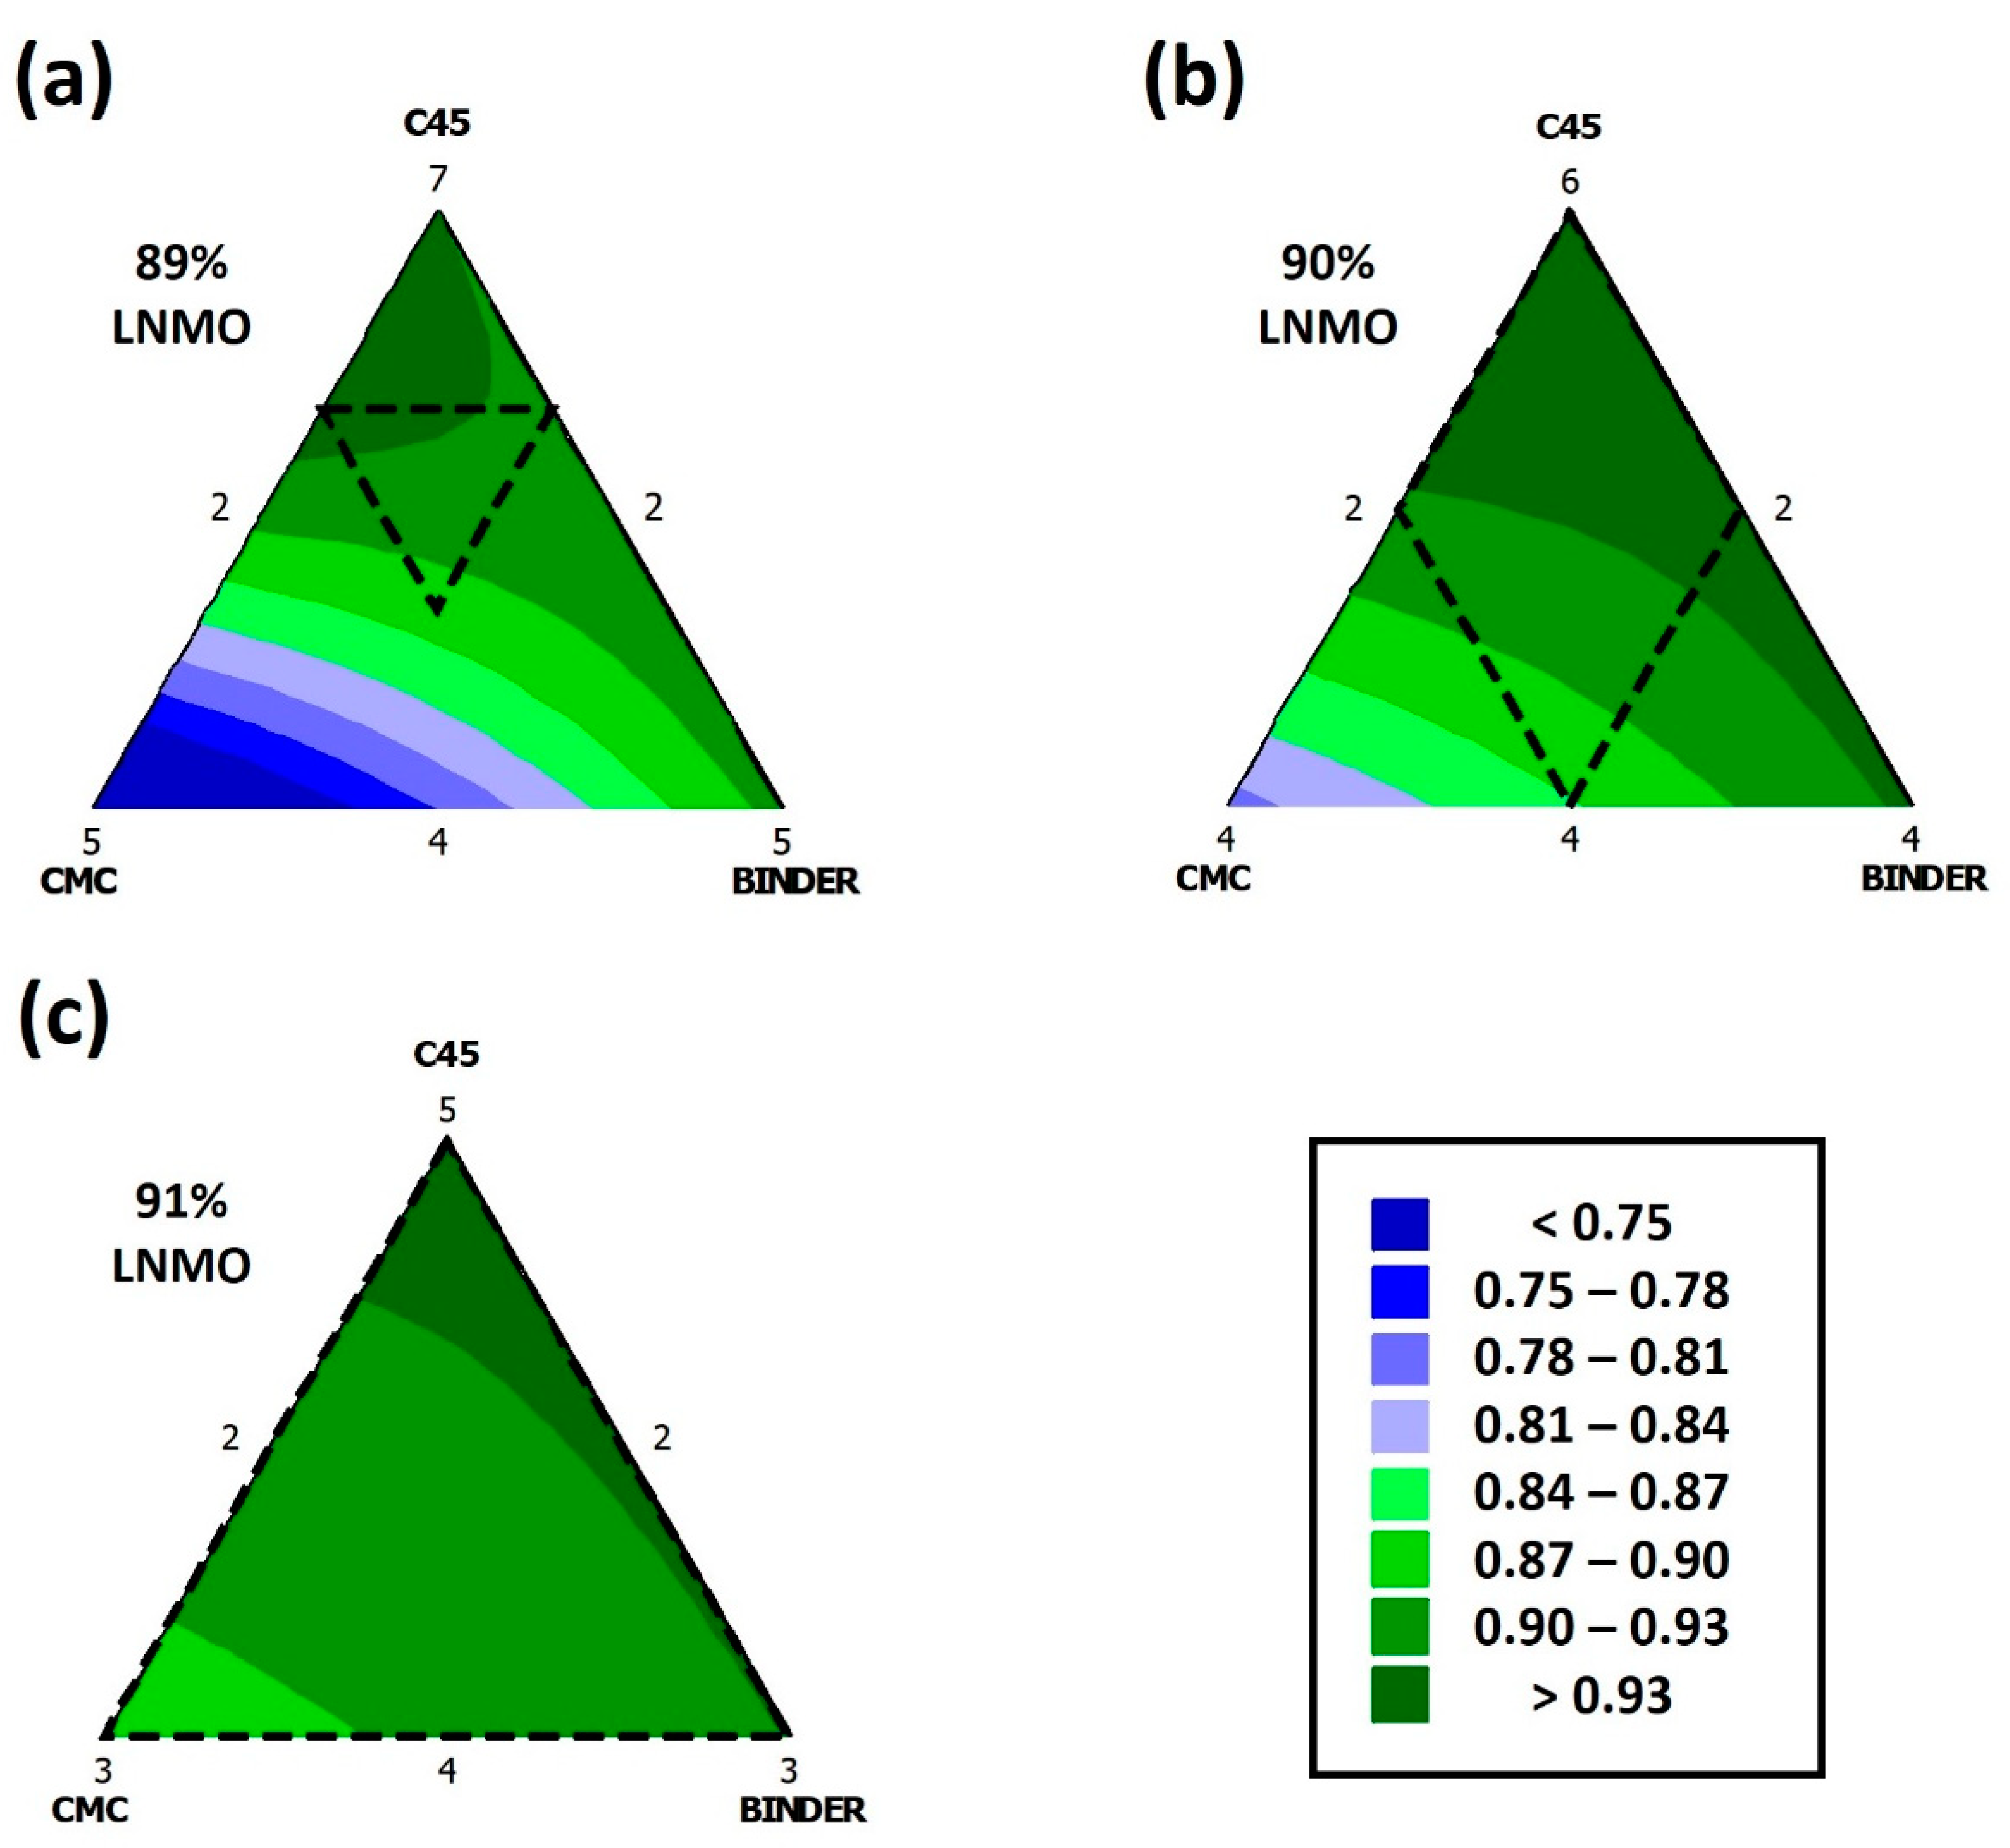
3.1. Mono-Variant Analysis

After defining the parameters for evaluating the formulations, the experimental part of the study was initiated. The slurries were prepared and subjected to a rheological analysis. The viscosity vs. shear rate curves obtained in this analysis can be observed in Figure S2. All the curves showed a shear thinning behavior, i.e., the viscosity was decreased with the shear rate [68], making them suitable to be coated on a coating line with a knife system [69]. The viscosity values at 10 s−1 and the slope for each viscosity vs. shear rate curve can be observed in Table 3. The highest viscosities were obtained with formulations #2 and #9, while the highest slopes were calculated from the rheological analysis of formulations #6 and #7. A quick revision of these results suggests that the increase in the carbon black concentration entails an increase in the slope of the curve, resulting in more stable slurries.
Afterward, the slurries were coated onto the current collector and calendered to the target density. The electrodes were subjected to XRD and FE-SEM characterization to discard degradation reactions or morphology modifications in the LNMO upon processing (see Figures S3 and S4 for further detail). Then, the peel strength of the coatings with the different formulations was measured; the results obtained are compiled in Table 3. The highest peel strength was obtained with formulation #7, consisting of 89% LNMO, 6% carbon black, 2% CMC, and 3% binder. On the other hand, the lowest value was provided by formulation #3, with 90% LNMO, 4% carbon black, 3% CMC, and 3% binder. The latter result is surprising as this formulation consists of the highest CMC and binder concentrations among those studied (together with formulation #5). This evidences that, to boost a specific parameter, it is not enough to increase the concentration of the components intuitively promoting this parameter; the interaction of these components with the rest is also determining.
Finally, the electrodes obtained from these coatings were subjected to electrochemical testing in HCCs. The capacities at 0.2 C, 2 C, and 1 C for each formulation are included in Table 3. The capacity at 0.2 C is very similar for all the samples (slightly lower for formulation #6), but more differences arise when subjecting the cells to higher C-rates. The highest capacity at 2 C was obtained with formulation #4, followed by formulation #9. On the other hand, formulations #6 and #4 (in this order) provided the highest capacity at 1 C. Thus, it is likely that the multivariant analysis will reveal a high electrochemical desirability for formulation #4.
The mono-variant analysis aims to determine the influence of the electrode formulations on the individual response to each of the parameters analyzed. Thus, Minitab software (version 16.2.3) was used to obtain a formal functional relation between the experimental outputs and the corresponding formulations (Equation (2)).
O u t p u t   v a l u e = k L N M O · C L N M O + k C B · C C B   + k C M C · C C M C + k B i n d e r · C B i n d e r + k L N M O C B · C L N M O · C C B   + k L N M O C B · C L N M O · C C M C + k L N M O B i n d e r · C L N M O · C B i n d e r + k C B B i n d e r · C C B · C B i n d e r  
Here, ki is the correlation coefficient and Ci the concentration of each component. The results obtained with this method are depicted in Table S3. The statistical correlation of the functions and the output can be evaluated based on the linear regression of these functions. The electrode components most significantly influencing the output of each parameter and the regression coefficient are shown in Table 4.
The results in Table 4 evidence that the hypothesis formulated when analyzing the output of the slope of the rheological curve, i.e., the increase in the slope with the concentration of carbon black, was correct. Interestingly, the component most significantly affecting the peel strength of the coatings was the carbon black, which was penalized with the increase in its concentration. Furthermore, the increase in the CMC benefited the rheological response of the slurry. On the other hand, the electrochemical response was clearly improved with the increase in the LNMO and carbon black concentrations. Nevertheless, the regression coefficient was 39.11 for the discharge capacity at 0.2 C as an output. This was attributed to the absence of remarkable differences in the specific capacity when the cells were discharged at this low C-rate, as previously discussed.

3.2. Multi-Variant Analysis

The mono-variant analysis allows the identification of the components more significantly affecting the defined outputs. Still, it is necessary to conduct a multi-variant analysis to evaluate the inputs and outputs jointly and adjust the formulation to obtain electrodes with optimized feasibility and electrochemical performance. In that regard, desirability, a concept introduced by E. C. Harrington [70] and later developed by Derringer and Suich [71], allows the compiling of individual outputs in a single quantitative value. The first step in this analysis consists of the conversion of the individual evaluation criteria of the parameters in elemental desirability functions (di) with values between 0 (non-desirable) and 1 (most desirable). The functions for each of the parameters are shown in Figure S5.
The shape of the functions is similar for the slope of the rheology curve, peel strength, and specific capacities at 0.2 C, 2 C, and 1 C. There is a minimum value at which di is 0 below which the response is not desirable, a value above which the response is evaluated as optimum (desirable, di = 1), and a linear regression between these two values. On the other hand, the viscosity of the slurry cannot be evaluated following the same rule; too high (>30 Pa·s) or too low (<5 Pa·s) viscosities make it difficult to successfully coat the slurry in a coating line and, thus, were defined as di = 0. Nevertheless, viscosity values between 10 and 25 Pa·s are excellent for coating and were defined as di = 1. Finally, values between di = 0 and di = 1 were fitted following linear regression.
The next step consisted of weighting each parameter group (i.e., feasibility and electrochemical performance) and each of the parameters included in these groups. Electrochemical performance was preferred over feasibility, weighting these factors with 75 and 25% of the overall desirability, respectively. Among the three parameters considered in the feasibility group, it was decided that the peel strength is the most important one (50% of the feasibility), as it is crucial for the electrode cutting and manipulation during cell assembly, as well as contributing to the electrochemical performance (avoiding the delamination of the electrodes). The viscosity slope and the viscosity at 10 s−1 shear rate were weighted with 30% and 15% of the feasibility, respectively. On the other hand, the weighting of the electrochemical performance group decreased with the increasing C-rate. These were 50%, 30%, and 20% for the specific capacity at 0.2 C, 1 C, and 2 C, respectively. The desirability of each parameter, group of parameters, and global desirability are shown in Table S4. The highest global desirability value was obtained with formulation #9. Nevertheless, this only indicates that this sample is the most desirable among those studied, not necessarily the most desirable in the defined experimentation area. To determine this most desirable formulation, Solver’s method will be used in the sext section.
The obtained values were used to obtain a mathematical model to predict global desirability (D), which is referred to here as Equation (3). In addition, the desirability heat map that can be observed in Figure 2 was obtained.
D = −0.0017 [LNMO] − 1.08 [C45] − 3.13 [CMC] − 1.13 [Binder] +
0.01 [LNMO] [C45] + 0.03 [LNMO] [CMC] + 0.01 [LNMO] [Binder] +
0.05 [C45] [Binder]
The regression coefficient for Equation (3) is 97.83%. The differences between the experimental and the mathematical values are shown and discussed in Table S5.

3.3. SOLVER’s Method to Obtain the Cathode with the Best Formulation

Based on Equation (3), a 10th formulation was designed with the maximum global desirability value in the working region consisting of 89.5% LNMO, 6% C45, 2.5% CMC, and 2% binder. Furthermore, another formulation (#11) was predicted to provide even higher global desirability but was placed out of the working region. It consisted of 89.5% LNMO, 6% C45, 3% CMC, and 1.5% binder. The mathematical desirability for these samples was 0.952 and 0.967, respectively. Both coatings were prepared and subjected to the same physicochemical characterization as those used to obtain the desirability prediction function. The results have been included in Table 5.
The feasibility, electrochemical, and global desirability values for formulation #10 were 0.861, 0.914, and 0.949, respectively. The latter value is close to the desirability calculated from the mathematical model (0.952), evidencing the benefits of this method. As expected, the experimental global desirability value for formulation #10 is higher than those obtained for the samples used to build the prediction model. On the other hand, the viscosity value obtained with formulation #11 (34.53 Pa·s) was above the highest acceptable value defined in the multi-variant analysis (30 Pa·s). Thus, its feasibility desirability is 0 and was discarded. This shows the importance of conducting corroboration experiments. It might occur that the outputs for certain parameters of the formulations calculated by Solver’s method are close to the lower desirability limits and can be affected by the difference between the calculated and experimental values.

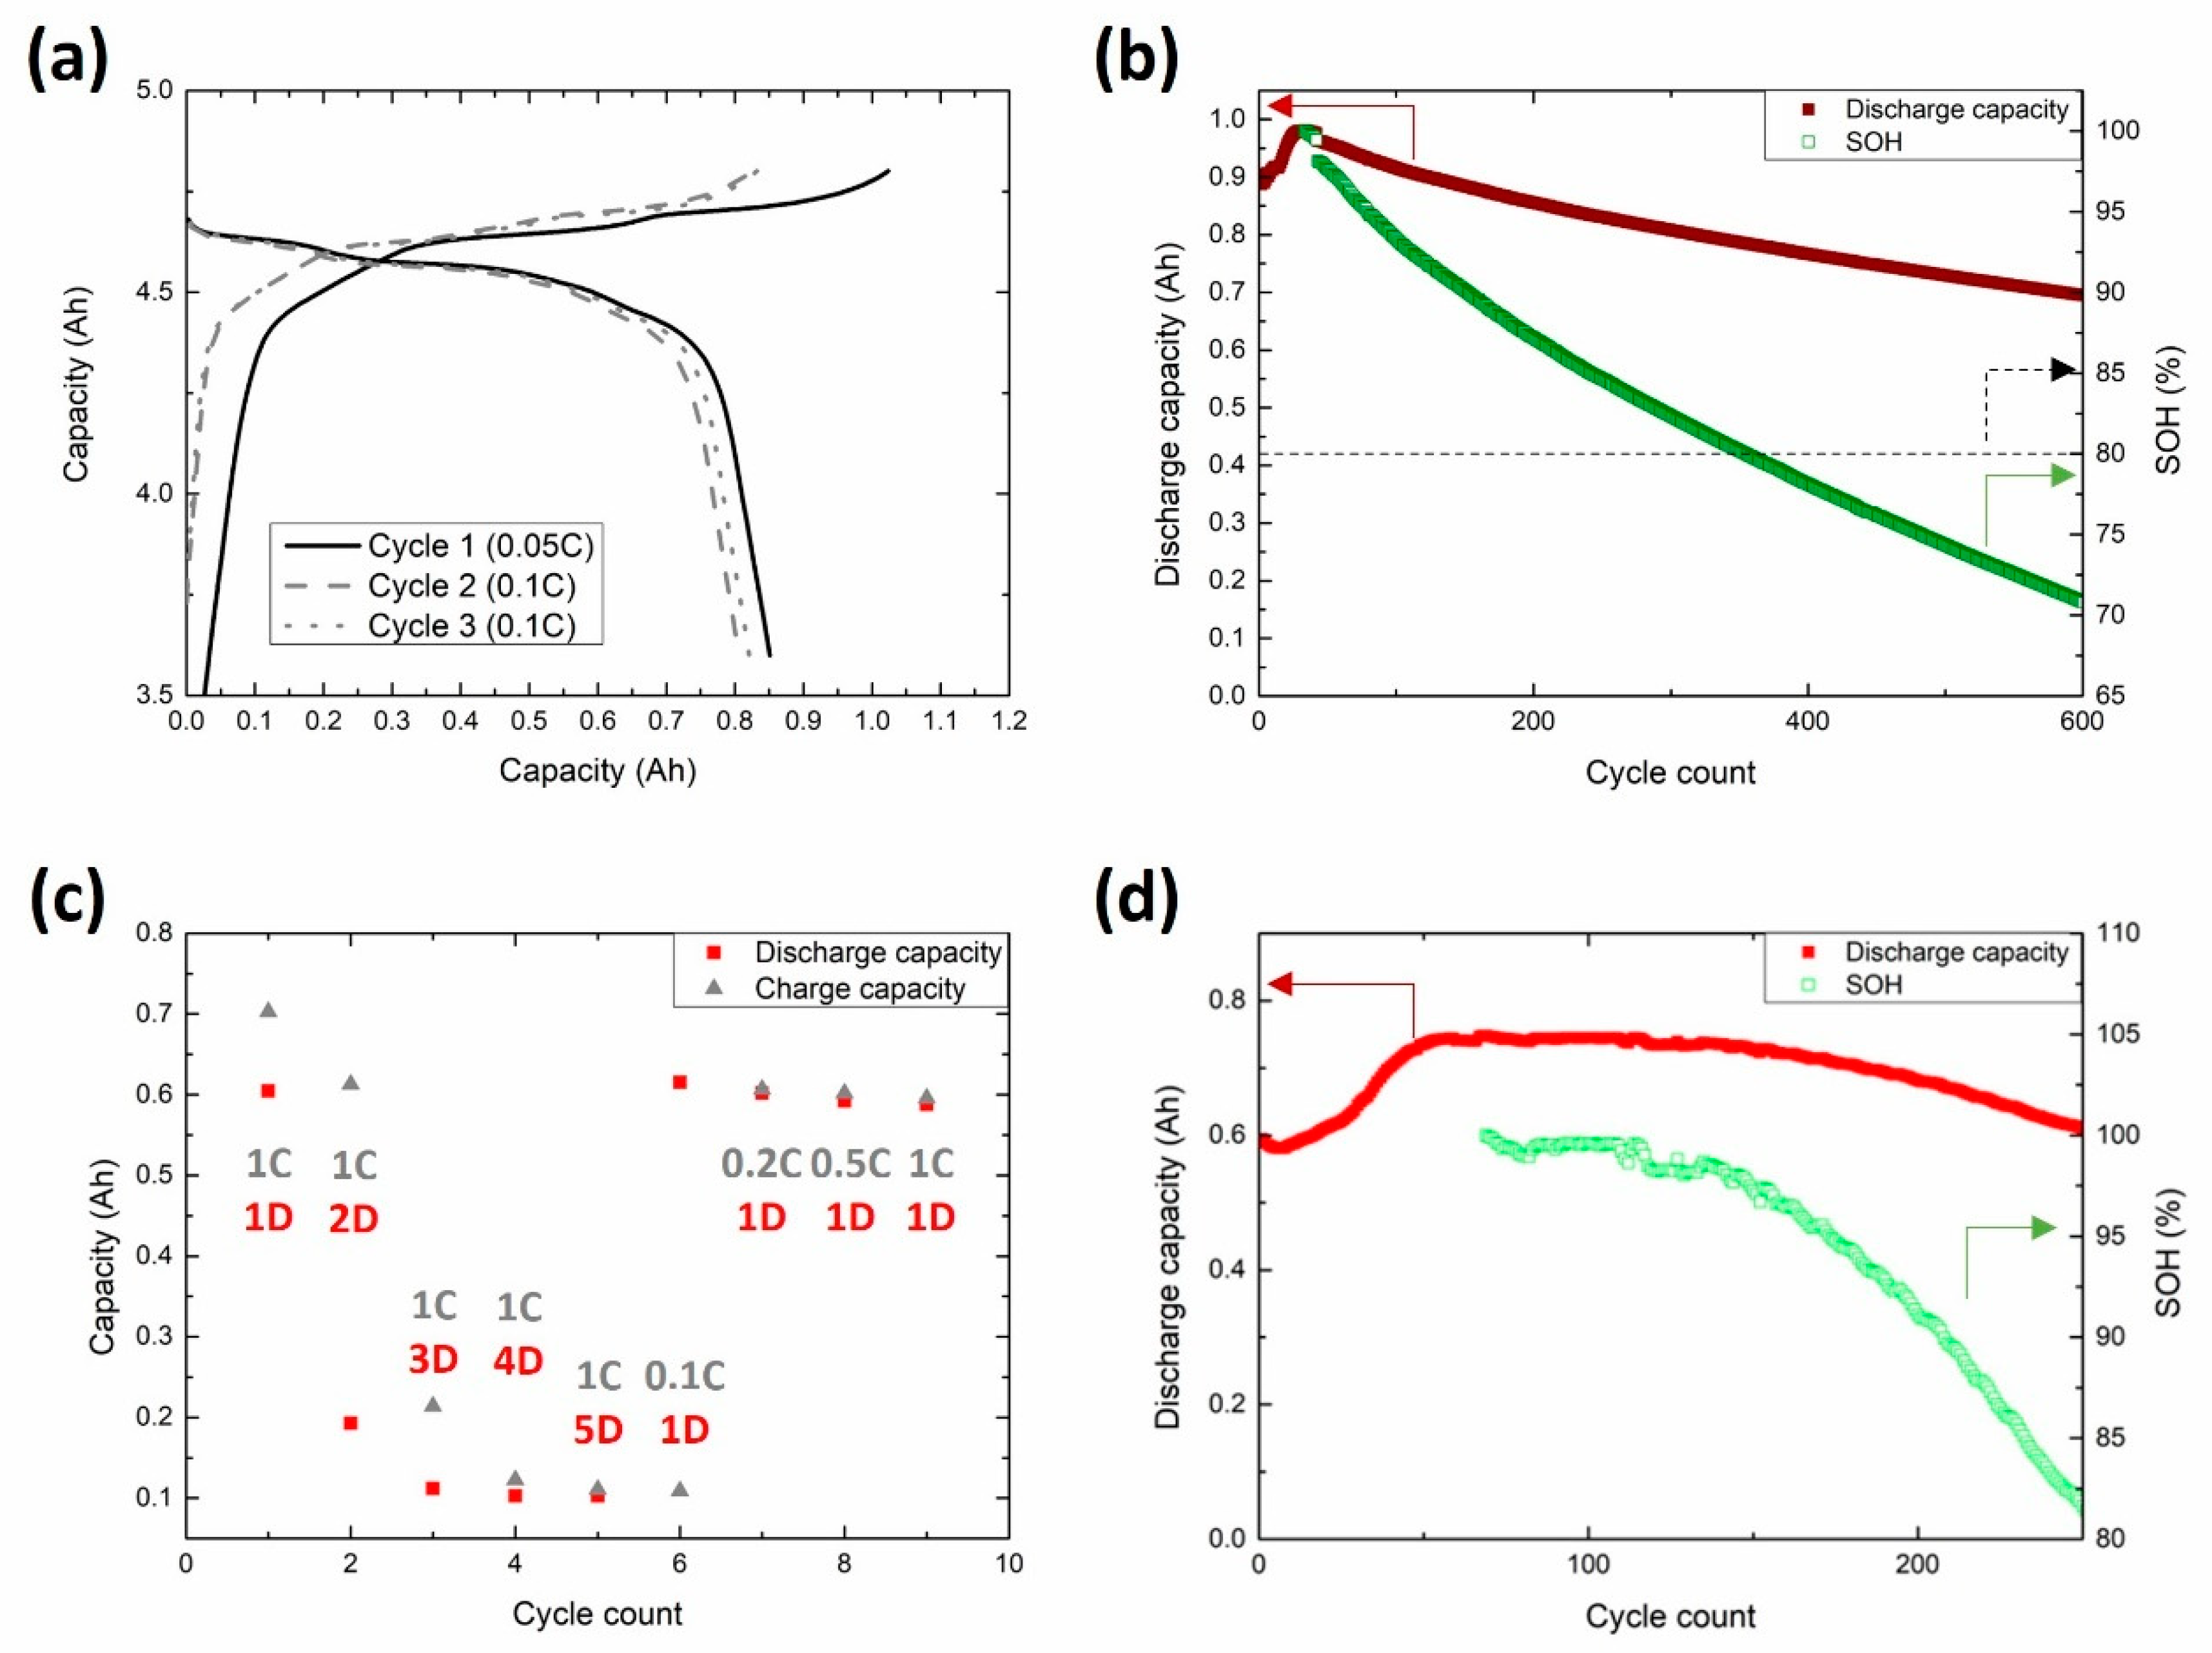
3.4. Upscaling and Pouch Cell Testing

Formulation #10 was upscaled to the coating line, as described in Section 2.1. The slurry consisted of 250 g of solids, which is much higher than the 30 g solids slurries prepared at laboratory scale. Therefore, the mixing conditions, such as the stirring force to which the slurry components were subjected, were slightly different. This required an adjustment of the solid-to-liquid (S/L) ratio (1/0.73 at laboratory scale, 1/1.09 at pilot plant scale). As expected, the rheological analysis (Figure S2) evidenced that the viscosity was lower for the pilot plant slurry, which had a higher fraction of liquid phase per solvent amount than the laboratory scale slurry. However, the difference in the viscosity was minimal for the shear rate of the region analyzed, which could be attributed to a better dispersion of the components. Therefore, the better the dispersion, the more water the solid particles take, and the higher the viscosity of the slurry. After calendaring, the coating was subjected to the adhesion strength measurement. The 90° peel strength test result was slightly lower with the pilot plant coating at 26.3 N·m−1 versus the 29.6 N·m−1 obtained at laboratory scale. In any case, the difference between the two values was minimal. Furthermore, to conduct the peel test, it is necessary to manually clean one of the sides of the double-side coated electrode with water and a wipe, which can affect the adhesion strength measured on the other side.
The coatings on the electrodes were cut to later assemble the pouch cells used for the electrochemical validation of the upscaling process. The cells comprised six 9.8 cm × 5.9 cm double-side cathodes and seven 10 cm × 6.1 cm double-side anodes. After being filled with electrolyte, the cells were subjected to a formation protocol consisting of one 0.05 C cycle, followed by two 0.1 C cycles. The galvanostatic profiles of these three cycles are depicted in Figure 3a. In the first charge, ~0.1 Ah was consumed to form the solid-electrolyte interphase (SEI) below 4.4 Ah. Afterward, a pseudo-plateau at 4.4 V and two defined plateaus at 4.6 and 4.7 V were registered. In the subsequent discharge, complementary plateaus were obtained at 4.35, 4.55, and 4.6 V, respectively. References in the literature [25,32,72,73] report the presence of two main redox peaks between 4.6 and 4.8 V; two features of charge and two (associated with each of the former) of discharge. These signals are attributed to the redox activity of nickel (Ni2+/Ni4+). On the other hand, they also evidence that the contribution of manganese (Mn3+/Mn4+) to the cell capacity can be observed to plateau at ~4 V. The absence of a feature with this potential suggests that the redox activity observed at 4.35 (discharge) and 4.4 V (charge) can be attributed to the electrochemical activity of Mn. The capacities obtained in the first charge and discharge of the cells were 1.03 and 0.85 Ah, respectively, for a Coulombic efficiency of 82.6%. The charge–discharge capacities in the second and third cycles were 0.83–0.82 Ah and 0.83–0.81 Ah, respectively. The increasing, but relatively low, coulombic efficiencies in these two cycles (97–98%) suggest that part of the lithium is still being consumed in the formation of the SEI. These two cycles presented the same plateaus, confirming that the same electrochemical reactions are occurring.
After finishing the formation, three of the cells were degassed and subjected to 0.5 C cycling; the discharge capacity values and capacity retention with the cycle count are displayed in Figure 3b. Interestingly, the capacity was increased until the maximum value was reached in the 33rd cycle. This phenomenon was not observed in the half cells tested in the formulation optimization study, in which the upper voltage limit was higher (5 V in coin cells, 4.8 V in pouch cells). Nevertheless, it is possible to find the same behavior in other works [24,74,75]. In pouch configuration, the upper voltage limit was decreased to avoid excessive gassing due to electrolyte degradation. In Figure S7a, the galvanostatic profiles of the 2nd and the 38th cycles are compared; it can be observed that the upper voltage limit was reached earlier in the 2nd cycle, and that the CV step was longer than in the 38th cycle. In addition, at first sight, the discharges almost overlap up to 0.55 Ah, with an earlier voltage decay in the 2nd cycle. Our first thought was to attribute this unexpected behavior to a partial consumption of the charge in SEI formation; but, if this were the case, we would obtain low Coulombic efficiencies in these first cycles, which was not the case (Figure S7b). In fact, Coulombic efficiency was above 100% in many of the cycles before the previously mentioned 33rd cycle. A Coulombic efficiency above 100% means that more Li+ is being transferred from the graphite electrode to the LNMO electrode than in the opposite way. Nevertheless, the dQ·dV−1 vs. voltage representation of the curves in Figure S7a, displayed in Figure S7c, provides a different point of view. In this type of graph, each plateau in the galvanostatic profile is represented as a peak. The flatter and longer the plateau, the sharper and larger the peak in the dQ·dV−1 vs. voltage representation. Negative dQ·dV−1 values are used to represent the discharge, while charge curves are plotted in the positive part of the y-axis. The first 0.1 C cycle in the formation protocol is included as a reference. One significant difference that can be observed when comparing the 2nd and the 38th cycles is the appearance of an addition peak at 4.67 V during charge. This does not necessarily involve the occurrence of a new reaction and could be attributed to the decoupling of two signals that occurred together in the 2nd cycle. In fact, this signal is also observed in the formation cycle, which is conducted at a lower C-rate. In these conditions, it is easier to decouple different electrochemical processes into different plateaus. On the other hand, based on the galvanostatic curve in Figure S7a, it was assumed that there was not any overpotential in the discharge reaction. Nevertheless, this overpotential is evidenced in Figure S7c, as all the signals in the negative y-axis occur at lower voltage in the 2nd cycle. The overpotential is even lower in the formation step and conducted at a lower C-rate. However, the most significant difference is registered at 4.4–4.5 V in this region; the activity has been attributed to the redox reactions of manganese. The previously discussed pseudo-plateaus result in a wide range of features, both upon discharge and charge, for the formation and the 2nd 0.5 C cycles. Contrarily, two evident peaks are observed in the 38th cycle. Thus, it can be concluded that the increase in the capacity that can be observed during the first 33 cycles is attributed to the activation of the redox activity of Mn. The cells cycled at 0.5 C completed 321 cycles (plus the first 32 cycles before reaching the maximum capacity) before reaching the referential 80% SOH commonly used as a reference to determine the end of life in Li-ion technology. In addition, they completed 592 cycles (+32) before reaching 70% SOH.
On the other hand, the other three cells were subjected to rate-capability experiments (Figure 3c). The first cycle was performed at 0.5 C charge and 1 C discharge C-rates. The capacities obtained were 0.70 and 0.60 Ah, respectively. Compared with the last 0.1 C cycle in the formation cycle (0.81 Ah), the capacity was 26% lower at 1 C. The limitations of the discharge rate capabilities were further evidenced by the increasing the discharge C-rate in the following cycles: 0.19, 0.11, 0.10, and 0.10 Ah, which were obtained at 2 C, 3 C, 4 C, and 5 C, respectively. Thus, it was determined that 1 C was the most usable discharge current with an acceptable performance, as the drop in the capacity was excessive when the cells were subjected to higher C-rates. The charge rate capability analysis was performed by analyzing lower C-rates (0.1 C, 0.2 C, 0.5 C, and 1 C) with discharges at 1 C. In these discharges, the cells provided 0.62, 0.60, 0.59, and 0.59 Ah. Therefore, the discharge current obtained was almost the same after charging the cells at the different C-rates. Afterward, the cells were cycled using a parallel 1 C rate: the evolution of the capacity and the capacity retention with the number of cycles is shown in Figure 3d. Again, there was an increase in the discharge capacity with the increasing cycle count, as observed in the 0.5 C cycling. Nevertheless, it seems that the incomplete charge was even more significant at higher charge C-rates. Thus, the capacity was continuously increased until the 50th cycle, and the maximum capacity was obtained in the 69th cycle. Thus, the activation of Mn is dependent on the C-rate at which the cells are tested, with extended delay with increasing the C-rate. The cells completed another 181 cycles at 1 C without reaching the reference 80% SOH capacity (+68 cycles at the beginning of life before reaching the maximum capacity). This lower cycling performance compared with the cells cycled at 0.5 C is expected, as a higher degradation of the materials usually occurs at higher C-rates. Lower capacity retention with an increasing C-rate has also been reported in other works [29,38]. The capacity fade at both C-rates can be more accelerated than in LIBs with other cell chemistries, such as NMC and, principally, LFP [76]. However, as mentioned by Yao et al. [48], this is something common in the literature related with LNMO, as the technology is not mature enough yet. The higher cycling stability is not a matter of just the cathode material itself, as the stability of the other components in the cell can also condition the capacity retention. This becomes particularly important when working with high-voltage materials; it is important that the rest of the cell components are stable at such a working voltage [35,40]. Furthermore, the formation of a stable cathode-electrolyte interphase (CEI) is mandatory for enhancing the cycle life of the LNMO cells [48,77]. The main objective of this work was to implement DoE as a methodology for defining a robust formulation and upscaling it to a semi-industrial coating line, with the pouch cells being assembled-and-tested demonstrators of the latter process. Future works could be directed toward analyzing the main failure mechanism in these cells and focusing on mitigating it.

4. Conclusions

The water-based formulation of the emerging Li-ion cathode chemistry, LNMO, was optimized by means of DoE methodology. It was evidenced that the fraction of the different components directly impacts the performance of the feasibility and electrochemical outputs defined. In addition, the desirability of the different formulations studied was compared following Derringer–Suich’s methodology, which showed that the formulation with the highest desirability in the study consisted of 90% LNMO, 5% C45, 2.5% CMC, and 2.5% binder. The results were used to build up a regression line to predict desirability in the region of study, and, interestingly, the formulation with the highest mathematical desirability was not the same as that with the highest experimental desirability. This was attributed to small experimental deviations. Furthermore, Solver’s method was used to predict a formulation with the maximum desirability in the region of study and outside this region. The higher desirability of the formulation in the region of study (89.5% LNMO, 6% C45, 2.5% CMC, and 2% binder) was confirmed experimentally and the recipe was upscaled to a semi-industrial coating line. The double-side electrodes obtained were used to assemble 1 Ah pouch cells and then tested. It was revealed that the activation of manganese redox activity needs an activation period, after which the maximum capacity of the cells is obtained. Furthermore, more activation cycles are necessary for this activation with increasing C-rate, based on our results with cells cycled at 0.5 C and 1 C. The cells cycled at the 0.5 C rate completed over 300 cycles before reaching 80% SOH, while the cycling performance was lower with those subjected to 1 C. Indeed, rate capability results evidenced a significant decay in the electrochemical performance when subjecting the cells to C-rates higher than 1 C. Overall, the optimization and upscaling of the LNMO electrode recipe resulted in the obtaining of high-energy pouch cells of 1 Ah that could be used to gain knowledge in the chemistry of this lithium-ion cathode material.

Supplementary Materials

The following are available online at https://www.mdpi.com/article/10.3390/en16217327/s1, Figure S1: Pictures of (a) the cathode coating after passing through the knife, (b) a cathode, and (c) assembled pouch cells; Figure S2: Rheological studies with the different formulations: viscosity vs. shear rate curves; Figure S3: X-ray diffraction patterns of the (a) LNMO powder and (b) a LNMO electrode. Patterns were fitted to LNMO phase using FULLPROF software and its theoretical reflections and the difference between the experimental and the fitting curves are included; Figure S4: FE-SEM images of the LNMO powder and a LNMO electrode: LNMO powder with magnification (a) X1000 and (b) X10000 and LNMO electrode with magnification (c) X1000 and (d) X10000; Figure S5: Derringer–Suich desirability functions for the different experimental outputs under evaluation: (a) viscosity, (b) viscosity slope, (c) peel strength, (d) 0.2 C capacity, (e) 2 C capacity, and (f) 1 C capacity; Figure S6: Rheological analyses (viscosity vs. shear rate curves) of the laboratory-scale slurry with formulation #10 and slurry prepared for upscaling to the coating line with the same formulation; Figure S7: (a) Voltage vs. capacity representation of the 2nd and the 38th cycles with the pouch cells cycled at 0.5 C. (b) Coulombic efficiency of the cells subjected to 0.5 C C-rate. (c) dQ/dV vs. voltage representation of the 2nd and the 38th cycles with the pouch cells cycled at 0.5 C; Table S1: Testing protocol applied to the LNMO HCCs; Table S2: Components of the positive electrodes and upper and lower limits defined for the optimization of the slurry; Table S3: Functional relations between the concentration of the electrode components and the experimental outputs; Table S4: Desirability of the different samples for each parameter, group of parameters and the global desirability; Table S5: Experimental mathematical desirability values obtained for the 9 formulations in this study.

Author Contributions

Conceptualization: L.L, I.U. and I.d.M.; methodology, L.L, I.U., H.-J.G. and I.d.M.; software, L.L.; validation, L.L., I.U. and A.E.-B.; formal analysis, L.L. and M.B.; investigation, L.L., I.U., I.B., A.E.-B. and I.d.M.; resources, I.d.M.; data curation, L.L, I.U. and I.L.-M.; writing—original draft preparation, I.U. and I.L.-M.; writing—review and editing, L.L., I.U., I.L.-M. and I.d.M.; supervision, M.B., A.E.-B. and I.d.M.; project administration, I.B. and I.d.M.; funding acquisition, I.d.M. All authors have read and agreed to the published version of the manuscript.

Funding

This research was funded by the European Union Seventh Framework Program (FP7/2007–2013), grant number 609201 (MARS-EV project).

Data Availability Statement

The data presented in this study are available on request from the corresponding author. The raw data are not publicly available due to the related patent.

Acknowledgments

The authors acknowledge SGL Carbon (Christian Schreiner) for the graphite supply, Lithops srl (Michaela Aneta Dumitrescu) for the anode electrode and Solvionic (Rongying Lin, Sebastien Fantini) for the electrolytes. We would like to thank the electrode manufacturing and pouch cell assembly teams at the CIDETEC pilot plant.

Conflicts of Interest

The authors declare no conflict of interest.

References

  1. Winter, M.; Barnett, B.; Xu, K. Before Li Ion Batteries. Chem. Rev. 2018, 118, 11433–11456. [Google Scholar] [CrossRef]
  2. International Energy Agency. Global EV Outlook 2021 Accelerating Ambitions despite the Pandemic. 2021. Available online: https://www.iea.org/reports/global-ev-outlook-2021 (accessed on 24 October 2023).
  3. Li, M.; Lu, J.; Chen, Z.; Amine, K. 30 Years of Lithium-Ion Batteries. Adv. Mater. 2018, 30, 1800561. [Google Scholar] [CrossRef]
  4. Volta Foundation The Battery Report. 2022. Available online: https://intercalationstation.substack.com/p/the-battery-report-2022 (accessed on 24 October 2023).
  5. Marinaro, M.; Bresser, D.; Beyer, E.; Faguy, P.; Hosoi, K.; Li, H.; Sakovica, J.; Amine, K.; Wohlfahrt-Mehrens, M.; Passerini, S. Bringing Forward the Development of Battery Cells for Automotive Applications: Perspective of R&D Activities in China, Japan, the EU and the USA. J. Power Sources 2020, 459, 228073. [Google Scholar] [CrossRef]
  6. Tidblad, A.A.; Edström, K.; Hernández, G.; de Meatza, I.; Landa-Medrano, I.; Jacas Biendicho, J.; Trilla, L.; Buysse, M.; Ierides, M.; Horno, B.P.; et al. Future Material Developments for Electric Vehicle Battery Cells Answering Growing Demands from an End-User Perspective. Energies 2021, 14, 4223. [Google Scholar] [CrossRef]
  7. Qin, Z.; Zhang, Y.; Luo, W.; Zhang, T.; Wang, T.; Ni, L.; Wang, H.; Zhang, N.; Liu, X.; Zhou, J.; et al. A Universal Molten Salt Method for Direct Upcycling of Spent Ni-Rich Cathode towards Single-Crystalline Li-Rich Cathode. Angew. Chem. Int. Ed. 2023, 62, e202218672. [Google Scholar] [CrossRef]
  8. Fichtner, M. Recent Research and Progress in Batteries for Electric Vehicles. Batter. Supercaps 2022, 5, e202100224. [Google Scholar] [CrossRef]
  9. Ruffo, G.H. Tesla Slide Reveals $25,000 Electric Car Will Have LFP Batteries. Available online: https://insideevs.com/news/446245/tesla-slide-25000-car-lfp-batteries/ (accessed on 15 September 2023).
  10. Moretti, A.; Sharova, V.; Carvalho, D.V.; Boulineau, A.; Porcher, W.; de Meatza, I.; Passerini, S. A Comparison of Formation Methods for Graphite//LiFePO4 Cells. Batter. Supercaps 2019, 2, 240–247. [Google Scholar] [CrossRef]
  11. Aiken, C.P.; Logan, E.R.; Eldesoky, A.; Hebecker, H.; Oxner, J.M.; Harlow, J.E.; Metzger, M.; Dahn, J.R. Li[Ni0.5Mn0.3Co0.2]O2 as a Superior Alternative to LiFePO4 for Long-Lived Low Voltage Li-Ion Cells. J. Electrochem. Soc. 2022, 169, 050512. [Google Scholar] [CrossRef]
  12. Editorial: The Journey of an Electrifying (r)Evolution. Nat. Commun. 2021, 12, 4153. [CrossRef]
  13. Su, L.; Jarvis, K.; Charalambous, H.; Dolocan, A.; Manthiram, A. Stabilizing High-Nickel Cathodes with High-Voltage Electrolytes. Adv. Funct. Mater. 2023, 33, 2213675. [Google Scholar] [CrossRef]
  14. WTO. Panel Rules against Indonesia’s Export Limitations on Raw Material. Available online: https://ec.europa.eu/commission/presscorner/detail/en/ip_22_7314 (accessed on 15 September 2023).
  15. Indonesia’s Uncertain Climb up the Nickel Value Chain. Available online: https://www.lowyinstitute.org/the-interpreter/indonesia-s-uncertain-climb-nickel-value-chain (accessed on 15 September 2023).
  16. Xu, W.; Li, Q.; Sui, F.; Guo, S.; Qi, R.; Yan, C.; Chen, L.; Xia, S.; Guo, J.; Li, Z.; et al. Unveiling the Role of Ni Doping in the Electrochemical Performance Improvement of the LiMn2O4 Cathodes. Appl. Surf. Sci. 2023, 624, 157142. [Google Scholar] [CrossRef]
  17. Capsoni, D.; Bini, M.; Chiodelli, G.; Massarotti, V.; Mustarelli, P.; Linati, L.; Mozzati, M.C.; Azzoni, C.B. Jahn-Teller Transition in Al3+ Doped LiMn2O4 Spinel. Solid. State Commun. 2003, 126, 169–174. [Google Scholar] [CrossRef]
  18. Fey, G.T.K.; Lu, C.Z.; Prem Kumar, T. Preparation and Electrochemical Properties of High-Voltage Cathode Materials, LiMyNi0.5-YMn1.5O4 (M = Fe, Cu, Al, Mg; y = 0.0–0.4). J. Power Sources 2003, 115, 332–345. [Google Scholar] [CrossRef]
  19. Liu, G.; Zhang, J.; Zhang, X.; Du, Y.; Zhang, K.; Li, G.; Yu, H.; Li, C.; Li, Z.; Sun, Q.; et al. Study on Oxygen Deficiency in Spinel LiNi0.5Mn1.5O4 and Its Fe and Cr-Doped Compounds. J. Alloys Compd. 2017, 725, 580–586. [Google Scholar] [CrossRef]
  20. Hu, L.; Amine, K.; Zhang, Z. Fluorinated Electrolytes for 5-V Li-Ion Chemistry: Dramatic Enhancement of LiNi0.5Mn1.5O4/Graphite Cell Performance by a Lithium Reservoir. Electrochem. Commun. 2014, 44, 34–37. [Google Scholar] [CrossRef]
  21. Lim, G.; Shin, D.; Chae, K.H.; Cho, M.K.; Kim, C.; Sohn, S.S.; Lee, M.; Hong, J. Regulating Dynamic Electrochemical Interface of LiNi0.5Mn1.5O4 Spinel Cathode for Realizing Simultaneous Mn and Ni Redox in Rechargeable Lithium Batteries. Adv. Energy Mater. 2022, 12, 2202049. [Google Scholar] [CrossRef]
  22. Jusys, Z.; Binder, M.; Schnaidt, J.; Behm, R.J. A Novel DEMS Approach for Studying Gas Evolution at Battery-Type Electrode|electrolyte Interfaces: High-Voltage LiNi0.5Mn1.5O4 Cathode in Ethylene and Dimethyl Carbonate Electrolytes. Electrochim. Acta 2019, 314, 188–201. [Google Scholar] [CrossRef]
  23. Kim, J.H.; Pieczonka, N.P.W.; Lu, P.; Liu, Z.; Qiao, R.; Yang, W.; Tessema, M.M.; Sun, Y.K.; Powell, B.R. In Situ Formation of a Cathode-Electrolyte Interface with Enhanced Stability by Titanium Substitution for High Voltage Spinel Lithium-Ion Batteries. Adv. Mater. Interfaces 2015, 2, 1500109. [Google Scholar] [CrossRef]
  24. Huang, X.; Chen, K.; Liu, Y. Enhancement of LiNi0.5Mn1.5O4 Cathode Materials through Interfacial Modification of Amorphous Al2O3 in Lithium Ion Batteries. J. Electrochem. Soc. 2019, 166, A5081–A5089. [Google Scholar] [CrossRef]
  25. Sun, P.; Ma, Y.; Zhai, T.; Li, H. High Performance LiNi0.5Mn1.5O4 Cathode by Al-Coating and Al3+-Doping through a Physical Vapor Deposition Method. Electrochim. Acta 2016, 191, 237–246. [Google Scholar] [CrossRef]
  26. Deng, H.; Nie, P.; Luo, H.; Zhang, Y.; Wang, J.; Zhang, X. Highly Enhanced Lithium Storage Capability of LiNi0.5Mn1.5O4 by Coating with Li2TiO3 for Li-Ion Batteries. J. Mater. Chem. A Mater. 2014, 2, 18256–18262. [Google Scholar] [CrossRef]
  27. Yang, X.; Yang, T.; Liang, S.; Wu, X.; Zhang, H. Modification of LiNi0.5Mn1.5O4 High Potential Cathode from the Inner Lattice to the Outer Surface with Cr3+-Doping and Li+-Conductor Coating. J. Mater. Chem. A Mater. 2014, 2, 10359–10364. [Google Scholar] [CrossRef]
  28. Hagh, N.M.; Amatucci, G.G. Effect of Cation and Anion Doping on Microstructure and Electrochemical Properties of the LiMn1.5Ni0.5O4-δ Spinel. J. Power Sources 2014, 256, 457–469. [Google Scholar] [CrossRef]
  29. Höweling, A.; Glatthaar, S.; Nötzel, D.; Binder, J.R. Evidence of Loss of Active Lithium in Titanium-Doped LiNi0.5Mn1.5O4/Graphite Cells. J. Power Sources 2015, 274, 1267–1275. [Google Scholar] [CrossRef]
  30. Lim, J.M.; Oh, R.G.; Kim, D.; Cho, W.; Cho, K.; Cho, M.; Park, M.S. Design of Surface Doping for Mitigating Transition Metal Dissolution in LiNi0.5Mn1.5O4 Nanoparticles. ChemSusChem 2016, 9, 2967–2973. [Google Scholar] [CrossRef]
  31. Liu, M.H.; Huang, H.T.; Lin, C.M.; Chen, J.M.; Liao, S.C. Mg Gradient-Doped LiNi0.5Mn1.5O4 as the Cathode Material for Li-Ion Batteries. Electrochim. Acta 2014, 120, 133–139. [Google Scholar] [CrossRef]
  32. Kim, J.-H.; Myung, S.-T.; Yoon, C.S.; Oh, I.-H.; Sun, Y.-K. Effect of Ti Substitution for Mn on the Structure of LiNi0.5Mn1.5−xTixO4 and Their Electrochemical Properties as Lithium Insertion Material. J. Electrochem. Soc. 2004, 151, A1911. [Google Scholar] [CrossRef]
  33. Höweling, A.; Stenzel, D.; Gesswein, H.; Kaus, M.; Indris, S.; Bergfeldt, T.; Binder, J.R. Variations in Structure and Electrochemistry of Iron- and Titanium-Doped Lithium Nickel Manganese Oxyfluoride Spinels. J. Power Sources 2016, 315, 269–276. [Google Scholar] [CrossRef]
  34. Sun, H.; Kong, X.; Wang, B.; Luo, T.; Liu, G. LiNi0.5Mn1.45Zn0.05O4 with Excellent Electrochemical Performance for Lithium Ion Batteries. Int. J. Electrochem. Sci. 2017, 12, 8609–8621. [Google Scholar] [CrossRef]
  35. Hofmann, A.; Höweling, A.; Bohn, N.; Müller, M.; Binder, J.R.; Hanemann, T. Additives for Cycle Life Improvement of High-Voltage LNMO-Based Li-Ion Cells. ChemElectroChem 2019, 6, 5255–5263. [Google Scholar] [CrossRef]
  36. Milien, M.S.; Beyer, H.; Beichel, W.; Klose, P.; Gasteiger, H.A.; Lucht, B.L.; Krossing, I. Lithium Bis(2,2,2-Trifluoroethyl)Phosphate Li[O2P(OCH2CF3)2]: A High Voltage Additive for LNMO/Graphite Cells. J. Electrochem. Soc. 2018, 165, A2569–A2576. [Google Scholar] [CrossRef]
  37. Solchenbach, S.; Wetjen, M.; Pritzl, D.; Schwenke, K.U.; Gasteiger, H.A. Lithium Oxalate as Capacity and Cycle-Life Enhancer in LNMO/Graphite and LNMO/SiG Full Cells. J. Electrochem. Soc. 2018, 165, A512–A524. [Google Scholar] [CrossRef]
  38. Li, Y.; Veith, G.M.; Browning, K.L.; Chen, J.; Hensley, D.K.; Paranthaman, M.P.; Dai, S.; Sun, X.G. Lithium Malonatoborate Additives Enabled Stable Cycling of 5 V Lithium Metal and Lithium Ion Batteries. Nano Energy 2017, 40, 9–19. [Google Scholar] [CrossRef]
  39. Lee, T.J.; Lee, J.B.; Yoon, T.; Kim, D.; Chae, O.B.; Jung, J.; Soon, J.; Ryu, J.H.; Kim, J.J.; Oh, S.M. Tris(Pentafluorophenyl)Silane as an Electrolyte Additive for 5 V LiNi0.5Mn1.5O4 Positive Electrode. J. Electrochem. Soc. 2016, 163, A898–A903. [Google Scholar] [CrossRef]
  40. Feng, T.; Yang, G.; Zhang, S.; Xu, Z.; Zhou, H.; Wu, M. Low-Temperature and High-Voltage Lithium-Ion Battery Enabled by Localized High-Concentration Carboxylate Electrolytes. Chem. Eng. J. 2022, 433, 134138. [Google Scholar] [CrossRef]
  41. Arbizzani, C.; De Giorgio, F.; Mastragostino, M. Characterization Tests for Plug-in Hybrid Electric Vehicle Application of Graphite/LiNi0.4Mn1.6O4 Cells with Two Different Separators and Electrolytes. J. Power Sources 2014, 266, 170–174. [Google Scholar] [CrossRef]
  42. Banerjee, A.; Ziv, B.; Shilina, Y.; Ziegelbauer, J.M.; Liu, H.; Harris, K.J.; Botton, G.; Goward, G.R.; Luski, S.; Aurbach, D.; et al. Review—Multifunctional Separators: A Promising Approach for Improving the Durability and Performance of Li-Ion Batteries. J. Electrochem. Soc. 2019, 166, A5369–A5377. [Google Scholar] [CrossRef]
  43. De Giorgio, F.; Laszczynski, N.; von Zamory, J.; Mastragostino, M.; Arbizzani, C.; Passerini, S. Graphite//LiNi0.5Mn1.5O4 Cells Based on Environmentally Friendly Made-in-Water Electrodes. ChemSusChem 2017, 10, 379–386. [Google Scholar] [CrossRef]
  44. Zhang, K.; Tian, Y.; Wei, C.; An, Y.; Feng, J. Building Stable Solid Electrolyte Interphases (SEI) for Microsized Silicon Anode and 5V-Class Cathode with Salt Engineered Nonflammable Phosphate-Based Lithium-Ion Battery Electrolyte. Appl. Surf. Sci. 2021, 553, 149566. [Google Scholar] [CrossRef]
  45. Li, W.; Cho, Y.G.; Yao, W.; Li, Y.; Cronk, A.; Shimizu, R.; Schroeder, M.A.; Fu, Y.; Zou, F.; Battaglia, V.; et al. Enabling High Areal Capacity for Co-Free High Voltage Spinel Materials in next-Generation Li-Ion Batteries. J. Power Sources 2020, 473, 228579. [Google Scholar] [CrossRef]
  46. Frith, J.T.; Lacey, M.J.; Ulissi, U. A Non-Academic Perspective on the Future of Lithium-Based Batteries. Nat. Commun. 2023, 14, 420. [Google Scholar] [CrossRef]
  47. Ue, M.; Sakaushi, K.; Uosaki, K. Basic Knowledge in Battery Research Bridging the Gap between Academia and Industry. Mater. Horiz. 2020, 7, 1937–1954. [Google Scholar] [CrossRef]
  48. Yao, W.; Chouchane, M.; Li, W.; Bai, S.; Liu, Z.; Li, L.; Chen, A.X.; Sayahpour, B.; Shimizu, R.; Raghavendran, G.; et al. A 5 V-Class Cobalt-Free Battery Cathode with High Loading Enabled by Dry Coating. Energy Environ. Sci. 2023, 16, 1620–1630. [Google Scholar] [CrossRef]
  49. Colombo, R.; Garino, N.; Versaci, D.; Amici, J.; Para, M.L.; Quartarone, E.; Francia, C.; Bella, F.; Bodoardo, S. Designing a Double-Coated Cathode with High Entropy Oxides by Microwave-Assisted Hydrothermal Synthesis for Highly Stable Li–S Batteries. J. Mater. Sci. 2022, 57, 15690–15704. [Google Scholar] [CrossRef]
  50. Wang, T.; Zhang, Q.; Zhong, J.; Chen, M.; Deng, H.; Cao, J.; Wang, L.; Peng, L.; Zhu, J.; Lu, B. 3D Holey Graphene/Polyacrylonitrile Sulfur Composite Architecture for High Loading Lithium Sulfur Batteries. Adv. Energy Mater. 2021, 11, 2100448. [Google Scholar] [CrossRef]
  51. Medenbach, L.; Adelhelm, P. Cell Concepts of Metal–Sulfur Batteries (Metal = Li, Na, K, Mg): Strategies for Using Sulfur in Energy Storage Applications. Top. Curr. Chem. 2017, 375, 81. [Google Scholar] [CrossRef] [PubMed]
  52. Deng, Y.; Li, J.; Li, T.; Gao, X.; Yuan, C. Life Cycle Assessment of Lithium Sulfur Battery for Electric Vehicles. J. Power Sources 2017, 343, 284–295. [Google Scholar] [CrossRef]
  53. Wang, T.; He, J.; Zhu, Z.; Cheng, X.; Zhu, J.; Lu, B.; Wu, Y. Heterostructures Regulating Lithium Polysulfides for Advanced Lithium-Sulfur Batteries. Adv. Mater. 2023, 2303520. [Google Scholar] [CrossRef]
  54. Wang, T.; He, J.; Cheng, X.B.; Zhu, J.; Lu, B.; Wu, Y. Strategies toward High-Loading Lithium-Sulfur Batteries. ACS Energy Lett. 2023, 8, 116–150. [Google Scholar] [CrossRef]
  55. Colombo, R.; Versaci, D.; Amici, J.; Bella, F.; Para, M.L.; Garino, N.; Laurenti, M.; Bodoardo, S.; Francia, C. Reduced Graphene Oxide Embedded with ZnS Nanoparticles as Catalytic Cathodic Material for Li-S Batteries. Nanomaterials 2023, 13, 2149. [Google Scholar] [CrossRef]
  56. Leonet, O.; Landa-Medrano, I.; Shafique, A.; Yari, S.; Rangasamy, V.; Vanhulsel, A.; Safari, M.; Van Bael, M.K.; Hardy, A.; Urdampilleta, I.; et al. Electrochemical Investigation of the Ageing of a 400 Wh/kg Li-S Pouch-Cell. Electrochim. Acta 2023, 464, 142889. [Google Scholar] [CrossRef]
  57. Muchuweni, E.; Mombeshora, E.T.; Muiva, C.M.; Sathiaraj, T.S. Lithium-Ion Batteries: Recent Progress in Improving the Cycling and Rate Performances of Transition Metal Oxide Anodes by Incorporating Graphene-Based Materials. J. Energy Storage 2023, 73, 109013. [Google Scholar] [CrossRef]
  58. Chen, S.; Dai, F.; Cai, M. Opportunities and Challenges of High-Energy Lithium Metal Batteries for Electric Vehicle Applications. ACS Energy Lett. 2020, 5, 3140–3151. [Google Scholar] [CrossRef]
  59. Jetybayeva, A.; Aaron, D.S.; Belharouak, I.; Mench, M.M. Critical Review on Recently Developed Lithium and Non-Lithium Anode-Based Solid-State Lithium-Ion Batteries. J. Power Sources 2023, 566, 232914. [Google Scholar] [CrossRef]
  60. Niri, M.F.; Apachitei, G.; Lain, M.; Copley, M.; Marco, J. Machine Learning for Investigating the Relative Importance of Electrodes’ N:P Areal Capacity Ratio in the Manufacturing of Lithium-Ion Battery Cells. J. Power Sources 2022, 549, 232124. [Google Scholar] [CrossRef]
  61. Teo, J.H.; Strauss, F.; Tripković, Đ.; Schweidler, S.; Ma, Y.; Bianchini, M.; Janek, J.; Brezesinski, T. Design-of-Experiments-Guided Optimization of Slurry-Cast Cathodes for Solid-State Batteries. Cell Rep. Phys. Sci. 2021, 2, 100465. [Google Scholar] [CrossRef]
  62. Rynne, O.; Dubarry, M.; Molson, C.; Lepage, D.; Prébé, A.; Aymé-Perrot, D.; Rochefort, D.; Dollé, M. Designs of Experiments for Beginners—A Quick Start Guide for Application to Electrode Formulation. Batteries 2019, 5, 72. [Google Scholar] [CrossRef]
  63. Rodríguez-Carvajal, J. Recent Advances in Magnetic Structure Determination by Neutron Powder Diffraction. Phys. B Phys. Condens. Matter 1993, 192, 55–69. [Google Scholar] [CrossRef]
  64. Kusano, T.; Ishii, M.; Tani, M.; Hiruta, O.; Matsunaga, T.; Nakamura, H. Rheological Behavior of Concentrated Slurry and Wet Granules for Lithium Ion Battery Electrodes. Adv. Powder Technol. 2020, 31, 4491–4499. [Google Scholar] [CrossRef]
  65. Wood, D.L.; Quass, J.D.; Li, J.; Ahmed, S.; Ventola, D.; Daniel, C. Technical and Economic Analysis of Solvent-Based Lithium-Ion Electrode Drying with Water and NMP. Dry. Technol. 2018, 36, 234–244. [Google Scholar] [CrossRef]
  66. Sahore, R.; Wood, D.L.; Kukay, A.; Grady, K.M.; Li, J.; Belharouak, I. Towards Understanding of Cracking during Drying of Thick Aqueous-Processed LiNi0.8Mn0.1Co0.1O2 Cathodes. ACS Sustain. Chem. Eng. 2020, 8, 3162–3169. [Google Scholar] [CrossRef]
  67. Guo, S.; Li, H.; Li, Y.; Han, Y.; Chen, K.; Xu, G.; Zhu, Y.; Hu, X. SiO2-Enhanced Structural Stability and Strong Adhesion with a New Binder of Konjac Glucomannan Enables Stable Cycling of Silicon Anodes for Lithium-Ion Batteries. Adv. Energy Mater. 2018, 8, 1800434. [Google Scholar] [CrossRef]
  68. Escudier, M.P.; Gouldson, I.W.; Pereira, A.S.; Pinho, F.T.; Poole, R.J. On the Reproducibility of the Rheology of Shear-Thinning Liquids. J. Non-Newton. Fluid. Mech. 2001, 97, 99–124. [Google Scholar] [CrossRef]
  69. De Meatza, I.; Urdampilleta, I.; Boyano, I.; Castrillo, I.; Landa-Medrano, I.; Sananes-Israel, S.; Eguia-Barrio, A.; Palomares, V. From Lab to Manufacturing Line: Guidelines for the Development and Upscaling of Aqueous Processed NMC622 Electrodes. J. Electrochem. Soc. 2023, 170, 010527. [Google Scholar] [CrossRef]
  70. Harrington, D.A. Electrochemical Impedance Spectroscopy; 2004; ISBN 9781118684030. Available online: https://www.ntnu.edu/documents/140124/0/EIS+Literature/cd116109-3fbf-4db5-9f99-ff5ab68cf950 (accessed on 24 October 2023).
  71. Derringer, G.; Suich, R. Simultaneous Optimization of Several Response Variables. J. Qual. Technol. 1980, 12, 214–219. [Google Scholar] [CrossRef]
  72. Zheng, J.; Xiao, J.; Nie, Z.; Zhang, J.-G. Lattice Mn 3+ Behaviors in Li4Ti5O12/LiNi0.5Mn1.5O4 Full Cells. J. Electrochem. Soc. 2013, 160, A1264–A1268. [Google Scholar] [CrossRef]
  73. Jehnichen, P.; Wedlich, K.; Korte, C. Degradation of High-Voltage Cathodes for Advanced Lithium-Ion Batteries–Differential Capacity Study on Differently Balanced Cells. Sci. Technol. Adv. Mater. 2019, 20, 1–9. [Google Scholar] [CrossRef]
  74. Mereacre, V.; Stüble, P.; Ghamlouche, A.; Binder, J.R. Enhancing the Stability of LiNi0.5Mn1.5O4 by Coating with LiNbO3 Solid-State Electrolyte: Novel Chemically Activated Coating Process versus Sol-Gel Method. Nanomaterials 2021, 11, 548. [Google Scholar] [CrossRef]
  75. Stüble, P.; Mereacre, V.; Geßwein, H.; Binder, J.R. On the Composition of LiNi0.5Mn1.5O4 Cathode Active Materials. Adv. Energy Mater. 2023, 13, 2203778. [Google Scholar] [CrossRef]
  76. Houache, M.S.E.; Yim, C.H.; Karkar, Z.; Abu-Lebdeh, Y. On the Current and Future Outlook of Battery Chemistries for Electric Vehicles—Mini Review. Batteries 2022, 8, 70. [Google Scholar] [CrossRef]
  77. Li, L.; Zhao, R.; Xu, T.; Wang, D.; Pan, D.; Zhang, K.; Yu, C.; Lu, X.; He, G.; Bai, Y. Stabilizing a High-Voltage LiNi0.5Mn1.5O4 Cathode towards All Solid State Batteries: A Li-Al-Ti-P-O Solid Electrolyte Nano-Shell with a Host Material. Nanoscale 2019, 11, 8967–8977. [Google Scholar] [CrossRef] [PubMed]
Figure 1. Schematic representation of the analysis flow followed in the current work.
Energies 16 07327 g001
Figure 2. Heat map of the global desirability for the experimental area defined in the current study for (a) 89%, (b) 90%, and (c) 91% LNMO. A legend is displayed for the interpretation of the heat maps.
Energies 16 07327 g002
Figure 3. Electrochemical results obtained with the LNMO/graphite pouch cells. (a) Galvanostatic curves obtained in the formation step, (b) capacity evolution and capacity retention curves at 0.5 C cycling, (c) results of the rate-capability test, and (d) capacity evolution and capacity retention curves at 1 C. Discharge (D) and charge (C) C-rates are specified for each cycle in (c).
Energies 16 07327 g003
Table 1. Design matrix for positive electrode formulations.
Point TypeFormulation NumberLNMO wt.%Carbon Black wt.%CMC wt.%Binder wt.%
Corners191423
291432
390433
491522
589533
690622
789623
889632
Centroid99052.52.5
Table 2. List of experimental outputs.
Parameter GroupParameterUnitSampleOptimization Criteria
FeasibilityViscosity at shear rate = 10 s−1Pa·sSlurryNominal-better
Slope of the viscosity with the shear ratePa·s2SlurryHigher-better
Peel resistanceN·m−1ElectrodeHigher-better
Electrochemical performanceDischarge capacity at 0.2 CmAh·g−1Half coin cellHigher-better
Discharge capacity at 2 CmAh·g−1Half coin cellHigher-better
Discharge capacity after fast cycles (at 1 C)mAh·g−1Half coin cellHigher-better
Table 3. Results obtained for each parameter selected for the evaluation with different formulations. The reported results are an average of three replicates.
FormulationFeasibilityElectrochemical Performance
Viscosity
(Pa·s)
Slope
Viscosity (Pa·s2)
Peel
(N·m−1)
0.2 C
(mAh·g−1)
2 C
(mAh·g−1)
1 C
(mAh·g−1)
19.600.3636.8128.28116.47114.64
227.140.3620.9127.22108.36108.39
320.940.3317.4128.02110.32107.72
413.010.4524.9128.99120.93117.04
520.090.4032.4126.58112.0797.36
615.930.5729.5125.93116.76117.89
713.540.5444.6128.25117.10101.81
819.610.4431.9128.62118.96110.05
924.100.4930.9129.29120.10114.31
Table 4. Mono-variant analysis summary: the component most significantly affecting each parameter based on the functions obtained and the corresponding regression coefficient (R2). ↑ and ↓ are used to express increase and decrease, respectively.
ParameterInputOutputR2
Viscosity at shear rate = 10 s−1CMC ↑99.79
Slope of the viscosity with the shear rateCB ↑99.57
Peel resistanceCB ↓95.64
Discharge capacity at 0.2 CLNMO + CB ↑39.11
Discharge capacity at 2 CLNMO + CB ↑90.57
Discharge capacity after fast cycles (at 1 C)LNMO + CB ↑98.10
Table 5. Experimental outputs and desirability values of the formulations obtained by Solver’s method, based on the previous multi-variant analysis. The reported results are an average of three replicates.
Formulation#10: 89.5% LNMO, 6% C45, 2.5% CMC and 2% Binder#11: 89.5% LNMO, 6% C45, 3% CMC, and 1.5% Binder
OutputDesirabilityOutputDesirability
Viscosity (Pa·s)16.82134.530.000
Viscosity slope (Pa·s2)0.5300.7670.5820.940
Peel strength (N·m−1)29.60.49028.90.473
Specific capacity at 0.2 C (mAh·g−1)128.310.610124.730.490
Specific capacity at 2 C (mAh·g−1)120.841.000115.580.780
Specific capacity at 1 C (mAh·g−1)117.830.930118.060.940
Disclaimer/Publisher’s Note: The statements, opinions and data contained in all publications are solely those of the individual author(s) and contributor(s) and not of MDPI and/or the editor(s). MDPI and/or the editor(s) disclaim responsibility for any injury to people or property resulting from any ideas, methods, instructions or products referred to in the content.

